Testing the Double Jeopardy Loyalty Effect Using Discrete Choice Models * by Jose Maria Labeaga ** Nora Lado *** Mercedes Martos **** DOCUMENTO DE TRABAJO 2007-21 SERIE Nuevos Consumidores CÁTEDRA Fedea – BBVA * Acknowledgments: We thank ACNielsen Spain for providing the scanner panel data used in this paper. This research was supported by Ministerio de Educación y Ciencia Dir. Gral de Investigación, Grant SEJ2004-00672. ** FEDEA and Universidad Nacional de Educación a Distancia (UNED) *** Universidad Carlos III de Madrid **** Universidad de Salamanca. Dpto. Administración y Economía de la Empresa, Campus Miguel de Unamuno, 37007 Salamanca, Spain. Corresponding author. Fax: +34 923 294 715. E-mail address: [email protected] . (M: Martos). Authors are listed in alphabetic order. Los Documentos de Trabajo se distribuyen gratuitamente a las Universidades e Instituciones de Investigación que lo solicitan. No obstante están disponibles en texto completo a través de Internet: http://www.fedea.es. These Working Paper are distributed free of charge to University Department and other Research Centres. They are also available through Internet: http://www.fedea.es.

Welcome message from author
This document is posted to help you gain knowledge. Please leave a comment to let me know what you think about it! Share it to your friends and learn new things together.
Transcript
Testing the Double Jeopardy Loyalty Effect Using Discrete Choice Models*
by Jose Maria Labeaga**
Nora Lado***
Mercedes Martos****
DOCUMENTO DE TRABAJO 2007-21
SERIE Nuevos Consumidores CÁTEDRA Fedea – BBVA
* Acknowledgments: We thank ACNielsen Spain for providing the scanner panel data used
in this paper. This research was supported by Ministerio de Educación y Ciencia Dir. Gral de Investigación, Grant SEJ2004-00672.
** FEDEA and Universidad Nacional de Educación a Distancia (UNED) *** Universidad Carlos III de Madrid **** Universidad de Salamanca. Dpto. Administración y Economía de la Empresa, Campus
Miguel de Unamuno, 37007 Salamanca, Spain. Corresponding author. Fax: +34 923 294 715. E-mail address: [email protected]. (M: Martos). Authors are listed in alphabetic order.
Los Documentos de Trabajo se distribuyen gratuitamente a las Universidades e Instituciones de Investigación que lo solicitan. No obstante están disponibles en texto completo a través de Internet: http://www.fedea.es. These Working Paper are distributed free of charge to University Department and other Research Centres. They are also available through Internet: http://www.fedea.es.

Depósito Legal: M-31762-2007
FEDEA – DT 2007-21 by José M. Labebeaga et al.
1
Abstract This paper attempts to validate the double jeopardy loyalty effect in a utility framework using a discrete choice approach instead of the Dirichlet model. We specify brand choice and allow for differences in brand loyalty measures across brands in two different product categories. The discrete choice model formulations include a multinomial and a latent class multinomial logit model. Using ACNielsen household scanner panel data to estimate the models, we find that market share leaders enjoy higher purchasing loyalty than do lower market share brands. The results have relevant implications in terms of marketing mix decisions for brand managers. Keywords: brand loyalty, double jeopardy effect, discrete brand choice, unobserved heterogeneity
FEDEA – DT 2007-21 by José M. Labebeaga et al.
2
Recent decades have encountered considerable changes in the competitive environment of brands, especially for non-durable consumer goods. In particular, retailers’ brands continue to increase their share of the global market at the expense of other brands’ market share (ACNielsen 2005).
In this situation, the popular press has noted an erosion of brand loyalty
levels (Consumer Reports 1993), but empirical evidence in academic literature remains contradictory, though recent studies show loyalty still exists in markets. For example, East and Hammond (1996) find that the percentage of buyers who repeat purchase in a given time period steadily falls over time, whereas Johnson (1984) calls the overall decline in brand loyalty a myth. Stern and Hammond (2004) suggest that the decline in loyalty as the number of purchases rises is largely a statistical artifact that depends on the number of purchases used to calculate loyalty, and Dekimpe et al. (1997) find little support for the often-voiced contention that brand loyalty continues to decline. Regardless of these findings, because a loyal customer base represents a competitive advantage for a brand (Aaker 1991), many firms implement customer loyalty activities, such as loyalty cards or frequent user programs, to encourage customer loyalty.
According to one of the few “law-like” generalizations in marketing, the
double jeopardy theory, brands with greater market share should enjoy greater purchasing loyalty. High market share brands have two specific advantages compared with small-share brands: They tend to have more buyers who tend to buy more often (Ehrenberg, Goodhardt, and Barwise 1990); therefore, they experience greater purchasing loyalty. Furthermore, when a decrease in loyalty occurs, it does not necessarily harm all brands to the same extent; according to Dekimpe et al. (1997), brand loyalty remains more stable for market leaders than for others brands.
The Dirichlet model, a stochastic model proposed as a framework to help
understand behavior patterns, provides one of the best empirical generalizations in marketing (Uncles, Ehrenberg, and Hammond 1995). Among its useful features is the ability to capture the phenomenon of double jeopardy. In the context of brand loyalty, the Dirichlet model uses a share of category requirements (SCR) measure, defined as each brand’s market share among buyers (Fader and Schmittlein, 1993). The Dirichlet model provides accurate predictions of brand SCR, especially for packaged goods (Bhattacharya 1997; Fader and Schmittlein 1993; Goodhardt, Ehrenberg, and Chatfield 1984; Stern and Hammond 2004; Uncles, Ehrenberg and Hammond 1995), yet several authors (Bhattacharya 1997; Fader and Schmittlein 1993; Stern and Hammond 2004) note that it cannot adequately model the “excess brand loyalty” enjoyed by high share brands, nor high loyalty levels for niche brands. However, a new generalization of the model that incorporates latent segments into the brand
FEDEA – DT 2007-21 by José M. Labebeaga et al.
3
choice component partially captures this excess brand loyalty (Danaher, Wilson, and Davis 2003).
Nevertheless, recent brand studies devote special attention to modeling
brand choice behavior at the individual level using random utility models (also called discrete choice models) instead of at the aggregate level using probability models (also called stochastic choice approach), as the Dirichlet model does. The random utility approach has acquired prominence with the increasing influence of economic models and the utility-based view of consumer decision making in marketing (Seetharaman 2003). Researchers thus adopt logit and probit models derived from the theory of utility (McFadden 1973). Given the predominance of these models and their advantages, it becomes of special interest to investigate whether it is possible to test for double jeopardy effects (hereafter, DJ) using such models.
Random utility models enable researchers to incorporate the effects of a
household’s current choice on its future choices as a means to measure the effects of brand loyalty on brand choices. The first model that includes a loyalty variable to explain brand choice in this setting appears in Guadagni and Little (1983; hereafter, G&L); since then, various loyalty measures have been proposed.
Despite its widespread use, the Dirichlet model also has been subject to
numerous critiques. The main critique centers on its assumption of a zero-order choice process, because advances in discrete brand choice models indicate no zero order in the brand choice process, even after controlling for a rich heterogeneity structure (e.g., Abramson et al. 2000; Ailawadi, Gedenk, and Neslin 1999; Keane 1997; Varki and Chintagunta 2004).
The DJ effect has not been tested using discrete brand choice models,
G&L hypothesize that brand loyalty is the same attribute across all brands in a category. Since then, most studies include a single loyalty variable in brand choice models that captures overall loyalty. We argue that this measure represents a category loyalty effect and does not take into account the specific brand loyalty effect, which represents a restrictive assumption that contradicts the DJ effect.
We find some exceptions that incorporate loyalty asymmetric effects
among brands into discrete brand choice models. For example, Papatla (1993) criticizes the underlying assumption of the G&L loyalty variable by arguing that all brands do not gain the same increases in loyalty with a purchase. His article proposes an alternative operationalization of the G&L loyalty variable that can capture brand inequalities in loyalty effects. That is, he incorporates brand-
FEDEA – DT 2007-21 by José M. Labebeaga et al.
4
specific loyalty increments, rather than a common increment, in the loyalty variable. His results suggest that the loyalty effects of purchases are likely lower for brands purchased on price promotions and higher for expensive brands. However, he also notes that his measure does not provide an insight into which brands suffer more when a competitor gains higher levels of loyalty. Moreover, his conceptualization models the increment only at the brand level and estimates only a coefficient of category loyalty. In contrast, Bronnenberg and Wathieu (1996) define brand loyalty similarly to G&L but introduce brand-specific loyalty coefficients and smoothing variables. Their results reveal significant differences in loyalty toward different brands.
Although both papers assume that brands could enjoy different brand
loyalty purchasing behavior, they do not formally test the DJ effect. Moreover, none of these papers attempts to control unobserved heterogeneity. If heterogeneity is present in the true brand choice model but gets ignored because the model fit relies only on loyalty, then the loyalty parameter will be overestimated (Heckman 1981). Furthermore, the competitive environment has changed considerably since the 1990s, when store brands enjoyed a lower market share.
Therefore, the specific research questions we propose are as follows: 1. Which loyalty variable should be used as a framework in discrete
choice models? 2. How can we test the DJ effect using discrete choice models? 3. Does the DJ effect exist? That is, do higher share brands enjoy higher
purchasing loyalty, and are there differences in loyalty across customer segments?
4. Loyalty to which brands harm their competitive brands the most? Are there differences across customer segments?
We attempt to validate the DJ effect across customer segments in a utility
framework using a discrete brand choice setting. Our analysis allows for asymmetries in brand loyalty effects across brands, and we control for unobserved heterogeneity using a latent class brand choice model. We also provide an empirical answer to the question of whether market leaders maintain an advantage in brand purchase loyalty; specifically, we show that market share leaders enjoy higher purchasing loyalty in the two markets under analysis.
The rest of this article is organized as follows: In the next section, we
describe the proposed discrete choice model. We then describe our data sources and variables, followed by the estimation of the model and a discussion of the findings. Finally, we present conclusions, implications, and limitations.
FEDEA – DT 2007-21 by José M. Labebeaga et al.
5
1. Proposed Model
Despite many advances in the discrete choice literature, the model developed by G&L still serves as a benchmark though, for example, Anderson (2002) finds that the inclusion of the G&L loyalty variable in the logit model may result in a likelihood function with multiple maxima. The key variable that enables the model to fit the data accurately is the loyalty variable, which represents an exponential smoothing of past purchases. Different versions of the G&L loyalty variable also have emerged. Krishnamurthi and Raj’s (1988; hereafter, K&R) model of brand choice and purchase quantity approaches the choice decision similar to the way G&L do and defines a single common variable: brand purchase share history. However, the G&L and K&R loyalty variables confound state dependence and household heterogeneity effects. Heterogeneity refers to differences across households in brand preferences or market responses, and state dependence refers to the impact of past purchases on current preferences. Many studies show that the G&L loyalty variable does not capture consumer heterogeneity sufficiently (Fader and Lattin 1993; Ortmeyer, Lattin, and Montgomery 1991) To avoid this problem, other proposed measures split the effects, including Lattin and Bucklin’s (1989; hereafter, L&B) study of the reference effects of price and promotion. Specifically, L&B propose a discrete choice model that uses two measures of past purchase behavior that distinguish heterogeneity from state dependence.
However, even when the model includes observed heterogeneity, we can
find unobserved heterogeneity, which might control in the model specification in several different forms. Approaches to estimating the parameters for unobserved heterogeneity in models of consumer brand choice behavior can be grouped into two broad classes: (1) those that estimate parameters for each household, such as a fixed effects model (e.g., Jones and Landwehr 1988) and the hierarchical Bayesian approach (e.g., Rossi and Allenby 1993), and (2) those that assume household parameters are distributed according to a probability distribution and estimate the parameters of that distribution (random effects models). For example, the finite mixture or latent class model approach captures heterogeneity across households in the form of discrete support points (e.g., Bucklin and Gupta 1992; Chintagunta, Jain, and Vilcassim 1991; Kamakura and Russell 1989). Alternatively, continuous mixture models approach heterogeneity in the form of continuous mixture distributions (e.g., Erdem 1996; Gönül and Srinivasan 1993; Keane 1997). Literature debates which of these approaches is better, but research by Andrews, Ainslie, and Currim (2002, p. 487) suggests that both approaches are equally good in terms of parameter recovery and predictive validity and that “whether an analyst prefers to use models with continuous or discrete representations of consumer heterogeneity is a matter of opinion and personal preference.”
FEDEA – DT 2007-21 by José M. Labebeaga et al.
6
In this study, to accommodate loyalty, we analyze the results obtained by different loyalty variables proposed in the literature with a multinomial brand choice specification in which we do not control for unobserved heterogeneity. We use two loyalty variables that confound state dependence and observable preference heterogeneity (i.e., G&L and K&R loyalty variables) and one loyalty variable that distinguishes state dependence and observable preference heterogeneity (i.e., L&B loyalty variable). These three loyalty variables appear in three different choice models (model G&L, model K&R, and model L&B), which have the same model specification; we also consider a loyalty coefficient common to the brands in the category, as G&L assume. Therefore, the only difference among the models is the loyalty variable included. We choose the model that performs best in terms of fit measures and predictive results.
Subsequently, we apply a latent class multinomial brand choice model to
control for unobserved heterogeneity in preferences and response to prices in the model that achieves the best performance, and we consider loyalty at the brand level using brand-specific loyalty coefficients to test whether higher market share brands enjoy greater purchasing loyalty.
2. Data
We estimate the models using scanner panel data, supplied by ACNielsen Spain, about household purchases of brands in two product categories: fine and nonfine laundry detergent. The Spanish data set includes a representative sample of households across the country rather than households in specific cities and records their purchase activities from January 1999 to December 2000.
The data pertain to 1,107 households, which account for 5,347 purchases
of 42 brands of fine laundry detergent. The four largest brands account for an 83 percent share of the market. In addition, 1,557 households account for 33,246 purchases of 78 brands of nonfine detergent, in which category the seven largest brands have a 70 percent share.
We work with the entire data set and apply two aggregation tactics to
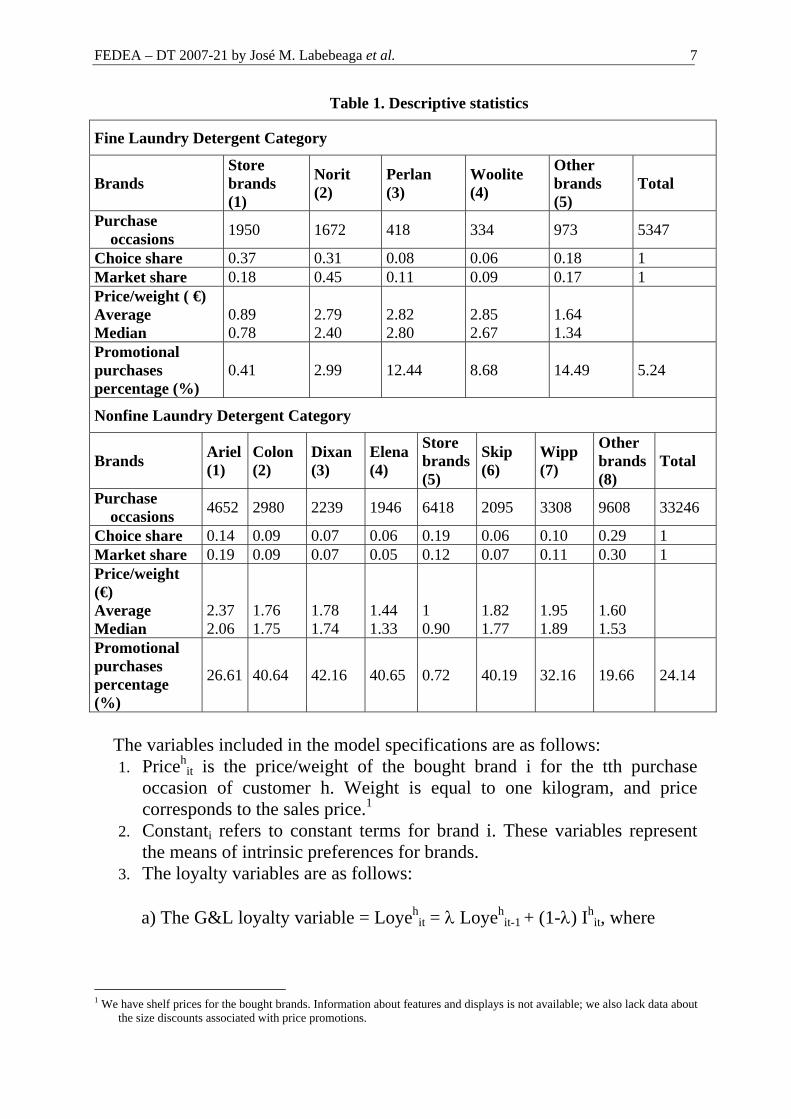
simplify the model alternatives. As our first tactic, we select a representative brand subset and aggregate brands with smaller market shares into a residual category called “other brands” (Erdem and Keane 1996). Our second tactic, because marketing mix policies for store brands are very similar, considers all these brands as a single alternative called “store brands” (Kamakura and Russell 1989). In Table 1, we provide the descriptive statistics for both data sets.
FEDEA – DT 2007-21 by José M. Labebeaga et al.
7
Table 1. Descriptive statistics
Fine Laundry Detergent Category
Brands Store brands (1)
Norit (2)
Perlan (3)
Woolite (4)
Other brands (5)
Total
Purchase occasions 1950 1672 418 334 973 5347
Choice share 0.37 0.31 0.08 0.06 0.18 1 Market share 0.18 0.45 0.11 0.09 0.17 1 Price/weight ( €) Average Median
0.89 0.78
2.79 2.40
2.82 2.80
2.85 2.67
1.64 1.34
Promotional purchases percentage (%)
0.41 2.99 12.44 8.68 14.49 5.24
Nonfine Laundry Detergent Category
Brands Ariel(1)
Colon (2)
Dixan (3)
Elena(4)
Store brands(5)
Skip (6)
Wipp (7)
Other brands(8)
Total
Purchase occasions 4652 2980 2239 1946 6418 2095 3308 9608 33246
Choice share 0.14 0.09 0.07 0.06 0.19 0.06 0.10 0.29 1 Market share 0.19 0.09 0.07 0.05 0.12 0.07 0.11 0.30 1 Price/weight (€) Average Median
2.37 2.06
1.76 1.75
1.78 1.74
1.44 1.33
1 0.90
1.82 1.77
1.95 1.89
1.60 1.53
Promotional purchases percentage (%)
26.61 40.64 42.16 40.65 0.72 40.19 32.16 19.66 24.14
The variables included in the model specifications are as follows: 1. Priceh
it is the price/weight of the bought brand i for the tth purchase occasion of customer h. Weight is equal to one kilogram, and price corresponds to the sales price.1
2. Constanti refers to constant terms for brand i. These variables represent the means of intrinsic preferences for brands.
3. The loyalty variables are as follows: a) The G&L loyalty variable = Loyeh
it = λ Loyehit-1 + (1-λ) Ih
it, where
1 We have shelf prices for the bought brands. Information about features and displays is not available; we also lack data about
the size discounts associated with price promotions.
FEDEA – DT 2007-21 by José M. Labebeaga et al.
8
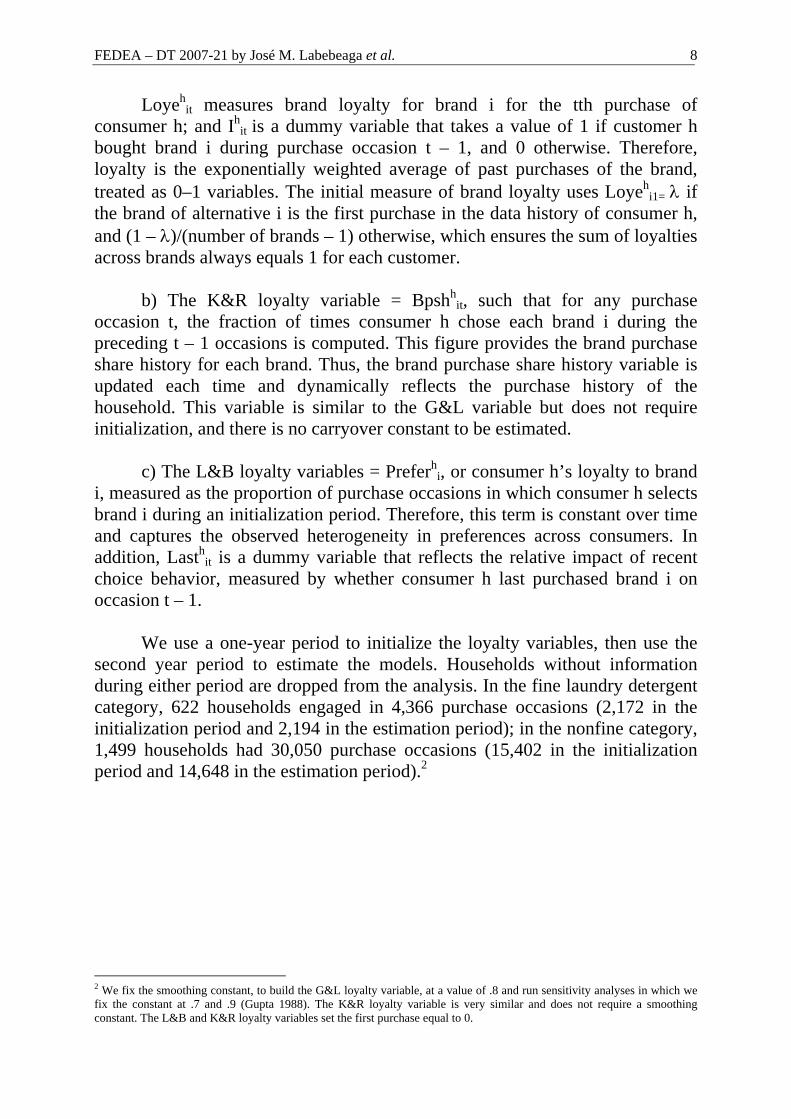
Loyehit measures brand loyalty for brand i for the tth purchase of
consumer h; and Ihit is a dummy variable that takes a value of 1 if customer h
bought brand i during purchase occasion t – 1, and 0 otherwise. Therefore, loyalty is the exponentially weighted average of past purchases of the brand, treated as 0–1 variables. The initial measure of brand loyalty uses Loyeh
i1= λ if the brand of alternative i is the first purchase in the data history of consumer h, and (1 – λ)/(number of brands – 1) otherwise, which ensures the sum of loyalties across brands always equals 1 for each customer.
b) The K&R loyalty variable = Bpshh
it, such that for any purchase occasion t, the fraction of times consumer h chose each brand i during the preceding t – 1 occasions is computed. This figure provides the brand purchase share history for each brand. Thus, the brand purchase share history variable is updated each time and dynamically reflects the purchase history of the household. This variable is similar to the G&L variable but does not require initialization, and there is no carryover constant to be estimated.
c) The L&B loyalty variables = Preferh
i, or consumer h’s loyalty to brand i, measured as the proportion of purchase occasions in which consumer h selects brand i during an initialization period. Therefore, this term is constant over time and captures the observed heterogeneity in preferences across consumers. In addition, Lasth
it is a dummy variable that reflects the relative impact of recent choice behavior, measured by whether consumer h last purchased brand i on occasion t – 1.
We use a one-year period to initialize the loyalty variables, then use the
second year period to estimate the models. Households without information during either period are dropped from the analysis. In the fine laundry detergent category, 622 households engaged in 4,366 purchase occasions (2,172 in the initialization period and 2,194 in the estimation period); in the nonfine category, 1,499 households had 30,050 purchase occasions (15,402 in the initialization period and 14,648 in the estimation period).2
2 We fix the smoothing constant, to build the G&L loyalty variable, at a value of .8 and run sensitivity analyses in which we fix the constant at .7 and .9 (Gupta 1988). The K&R loyalty variable is very similar and does not require a smoothing constant. The L&B and K&R loyalty variables set the first purchase equal to 0.
FEDEA – DT 2007-21 by José M. Labebeaga et al.
9
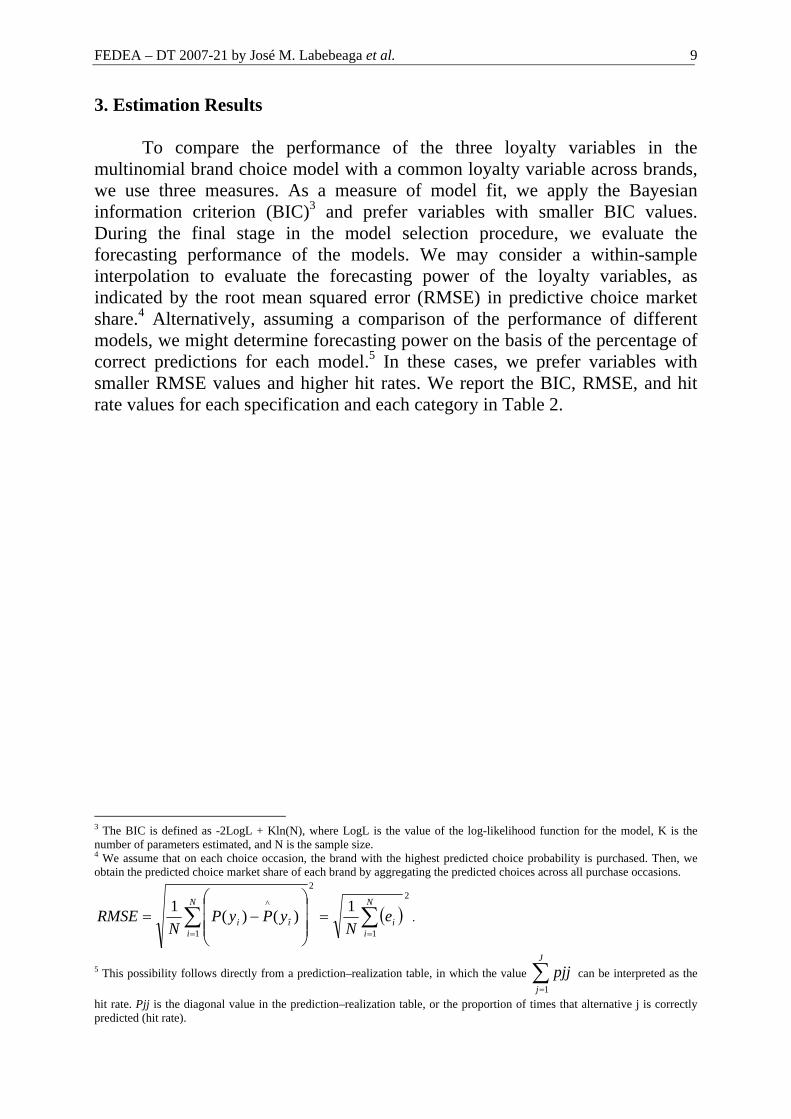
3. Estimation Results To compare the performance of the three loyalty variables in the multinomial brand choice model with a common loyalty variable across brands, we use three measures. As a measure of model fit, we apply the Bayesian information criterion (BIC)3 and prefer variables with smaller BIC values. During the final stage in the model selection procedure, we evaluate the forecasting performance of the models. We may consider a within-sample interpolation to evaluate the forecasting power of the loyalty variables, as indicated by the root mean squared error (RMSE) in predictive choice market share.4 Alternatively, assuming a comparison of the performance of different models, we might determine forecasting power on the basis of the percentage of correct predictions for each model.5 In these cases, we prefer variables with smaller RMSE values and higher hit rates. We report the BIC, RMSE, and hit rate values for each specification and each category in Table 2.
3 The BIC is defined as -2LogL + Kln(N), where LogL is the value of the log-likelihood function for the model, K is the number of parameters estimated, and N is the sample size. 4 We assume that on each choice occasion, the brand with the highest predicted choice probability is purchased. Then, we obtain the predicted choice market share of each brand by aggregating the predicted choices across all purchase occasions.
( )2
1
2
1
^ 1)()(1 ∑∑==
=⎟⎟⎟
⎠
⎞
⎜⎜⎜
⎝
⎛−=
N
ii
N
iîi e
NyPyP
NRMSE .
5 This possibility follows directly from a prediction–realization table, in which the value can be interpreted as the
hit rate. Pjj is the diagonal value in the prediction–realization table, or the proportion of times that alternative j is correctly predicted (hit rate).
∑=
J
jpjj
1
FEDEA – DT 2007-21 by José M. Labebeaga et al.
10
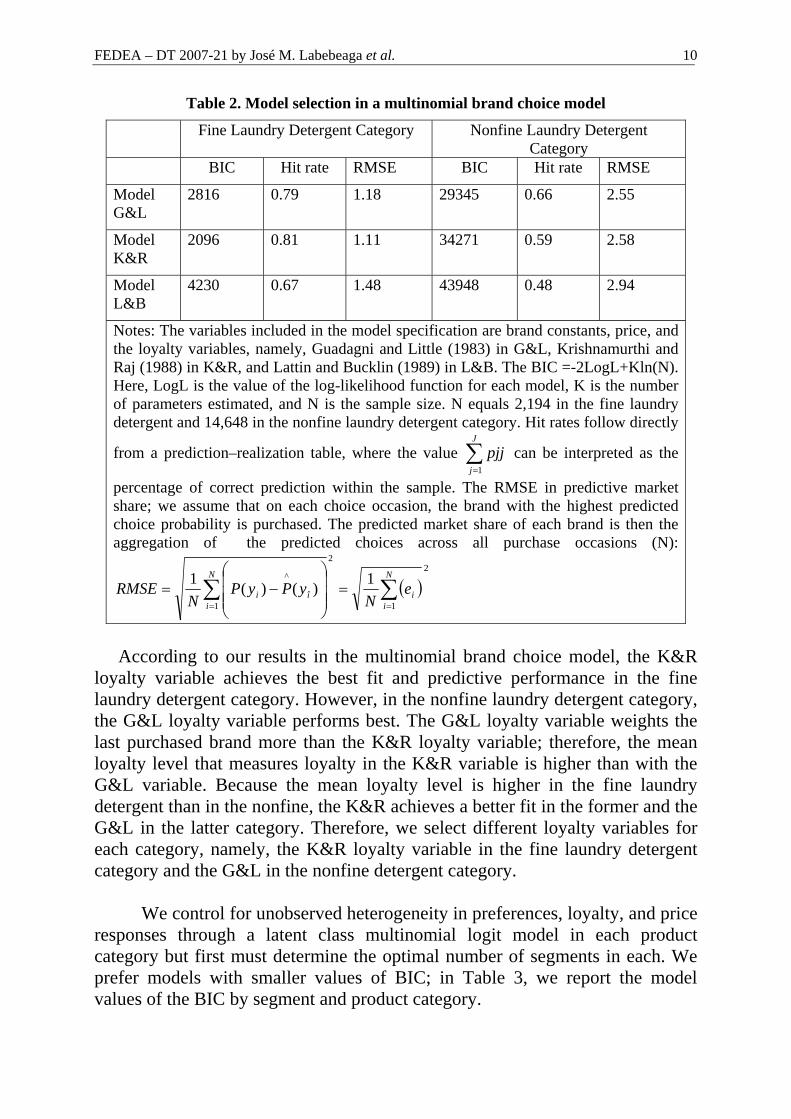
Table 2. Model selection in a multinomial brand choice model
Fine Laundry Detergent Category Nonfine Laundry Detergent Category
BIC Hit rate RMSE BIC Hit rate RMSE
Model G&L
2816 0.79 1.18 29345 0.66 2.55
Model K&R
2096 0.81 1.11 34271 0.59 2.58
Model L&B
4230 0.67 1.48 43948 0.48 2.94
Notes: The variables included in the model specification are brand constants, price, and the loyalty variables, namely, Guadagni and Little (1983) in G&L, Krishnamurthi and Raj (1988) in K&R, and Lattin and Bucklin (1989) in L&B. The BIC =-2LogL+Kln(N). Here, LogL is the value of the log-likelihood function for each model, K is the number of parameters estimated, and N is the sample size. N equals 2,194 in the fine laundry detergent and 14,648 in the nonfine laundry detergent category. Hit rates follow directly
from a prediction–realization table, where the value can be interpreted as the
percentage of correct prediction within the sample. The RMSE in predictive market share; we assume that on each choice occasion, the brand with the highest predicted choice probability is purchased. The predicted market share of each brand is then the aggregation of the predicted choices across all purchase occasions (N):
∑=
J
j
pjj1
( )2
1
2
1
^ 1)()(1 ∑∑==
=⎟⎟⎟
⎠
⎞
⎜⎜⎜
⎝
⎛−=
N
ii
N
iîi e
NyPyP
NRMSE
According to our results in the multinomial brand choice model, the K&R
loyalty variable achieves the best fit and predictive performance in the fine laundry detergent category. However, in the nonfine laundry detergent category, the G&L loyalty variable performs best. The G&L loyalty variable weights the last purchased brand more than the K&R loyalty variable; therefore, the mean loyalty level that measures loyalty in the K&R variable is higher than with the G&L variable. Because the mean loyalty level is higher in the fine laundry detergent than in the nonfine, the K&R achieves a better fit in the former and the G&L in the latter category. Therefore, we select different loyalty variables for each category, namely, the K&R loyalty variable in the fine laundry detergent category and the G&L in the nonfine detergent category.
We control for unobserved heterogeneity in preferences, loyalty, and price
responses through a latent class multinomial logit model in each product category but first must determine the optimal number of segments in each. We prefer models with smaller values of BIC; in Table 3, we report the model values of the BIC by segment and product category.
FEDEA – DT 2007-21 by José M. Labebeaga et al.
11
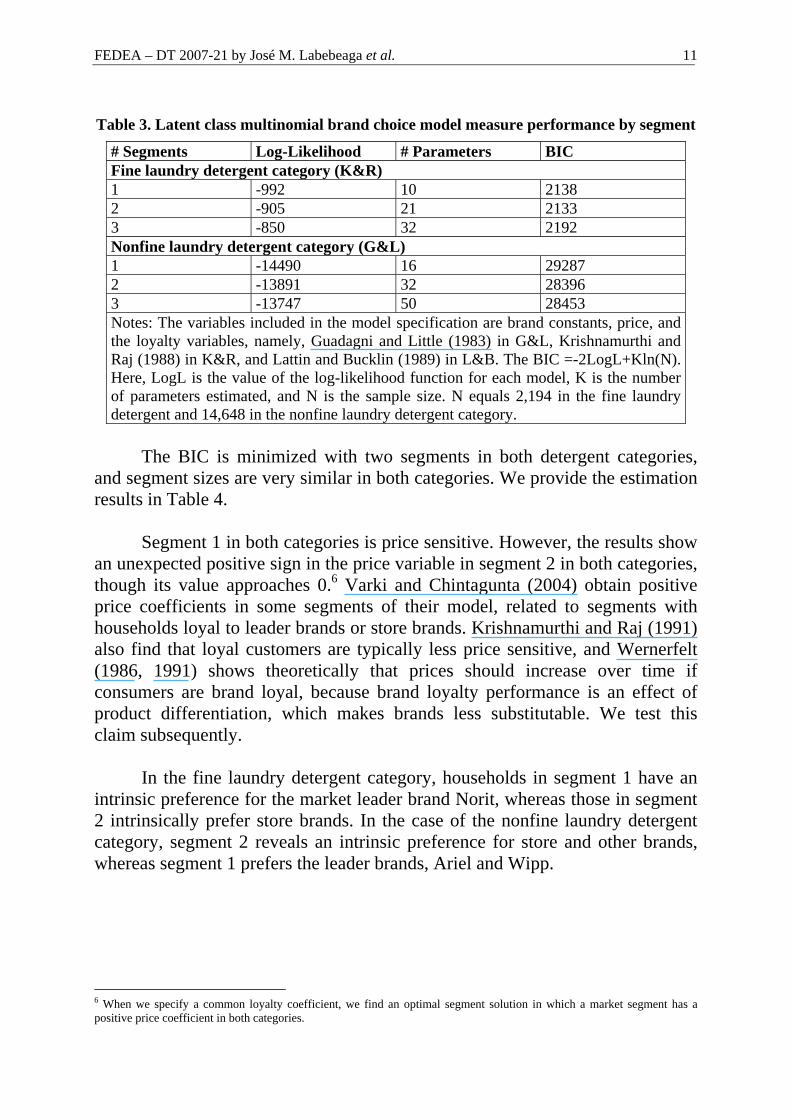
Table 3. Latent class multinomial brand choice model measure performance by segment
# Segments Log-Likelihood # Parameters BIC Fine laundry detergent category (K&R) 1 -992 10 2138 2 -905 21 2133 3 -850 32 2192 Nonfine laundry detergent category (G&L) 1 -14490 16 29287 2 -13891 32 28396 3 -13747 50 28453 Notes: The variables included in the model specification are brand constants, price, and the loyalty variables, namely, Guadagni and Little (1983) in G&L, Krishnamurthi and Raj (1988) in K&R, and Lattin and Bucklin (1989) in L&B. The BIC =-2LogL+Kln(N). Here, LogL is the value of the log-likelihood function for each model, K is the number of parameters estimated, and N is the sample size. N equals 2,194 in the fine laundry detergent and 14,648 in the nonfine laundry detergent category.
The BIC is minimized with two segments in both detergent categories,
and segment sizes are very similar in both categories. We provide the estimation results in Table 4.
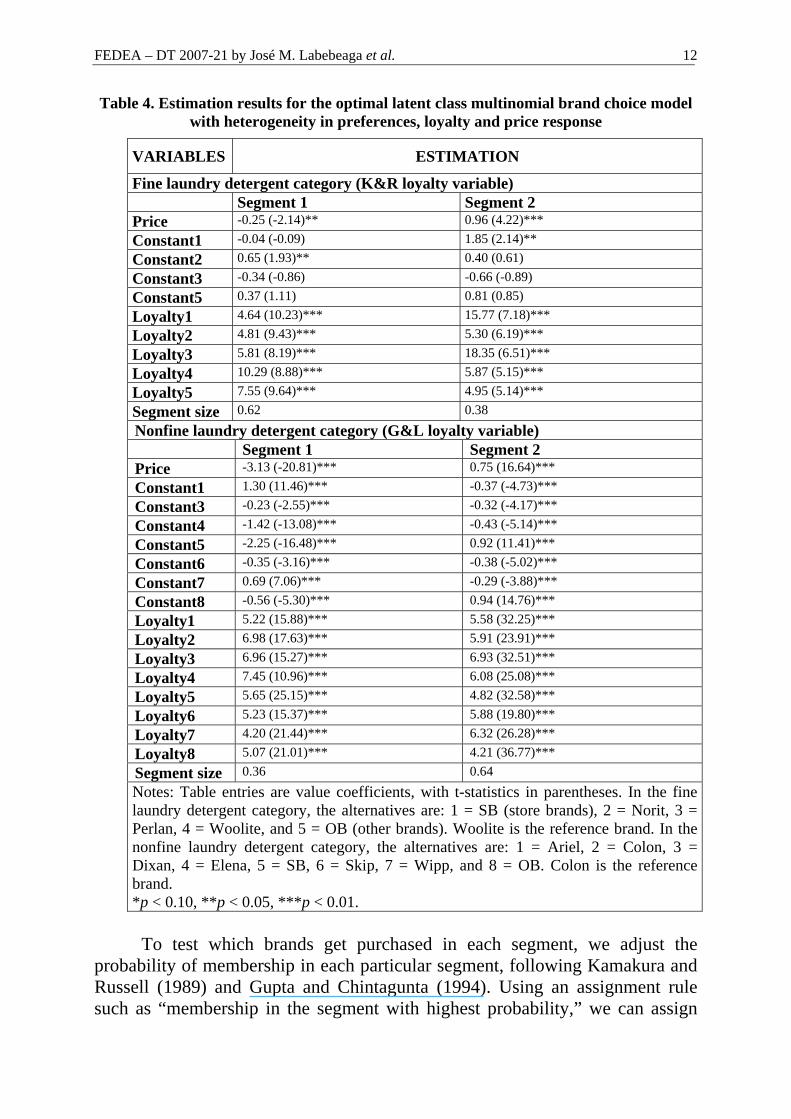
Segment 1 in both categories is price sensitive. However, the results show
an unexpected positive sign in the price variable in segment 2 in both categories, though its value approaches 0.6 Varki and Chintagunta (2004) obtain positive price coefficients in some segments of their model, related to segments with households loyal to leader brands or store brands. Krishnamurthi and Raj (1991) also find that loyal customers are typically less price sensitive, and Wernerfelt (1986, 1991) shows theoretically that prices should increase over time if consumers are brand loyal, because brand loyalty performance is an effect of product differentiation, which makes brands less substitutable. We test this claim subsequently.
In the fine laundry detergent category, households in segment 1 have an
intrinsic preference for the market leader brand Norit, whereas those in segment 2 intrinsically prefer store brands. In the case of the nonfine laundry detergent category, segment 2 reveals an intrinsic preference for store and other brands, whereas segment 1 prefers the leader brands, Ariel and Wipp.
6 When we specify a common loyalty coefficient, we find an optimal segment solution in which a market segment has a positive price coefficient in both categories.
FEDEA – DT 2007-21 by José M. Labebeaga et al.
12
Table 4. Estimation results for the optimal latent class multinomial brand choice model with heterogeneity in preferences, loyalty and price response
VARIABLES ESTIMATION
Fine laundry detergent category (K&R loyalty variable) Segment 1 Segment 2 Price -0.25 (-2.14)** 0.96 (4.22)*** Constant1 -0.04 (-0.09) 1.85 (2.14)** Constant2 0.65 (1.93)** 0.40 (0.61) Constant3 -0.34 (-0.86) -0.66 (-0.89) Constant5 0.37 (1.11) 0.81 (0.85) Loyalty1 4.64 (10.23)*** 15.77 (7.18)*** Loyalty2 4.81 (9.43)*** 5.30 (6.19)*** Loyalty3 5.81 (8.19)*** 18.35 (6.51)*** Loyalty4 10.29 (8.88)*** 5.87 (5.15)*** Loyalty5 7.55 (9.64)*** 4.95 (5.14)*** Segment size 0.62 0.38 Nonfine laundry detergent category (G&L loyalty variable) Segment 1 Segment 2 Price -3.13 (-20.81)*** 0.75 (16.64)*** Constant1 1.30 (11.46)*** -0.37 (-4.73)*** Constant3 -0.23 (-2.55)*** -0.32 (-4.17)*** Constant4 -1.42 (-13.08)*** -0.43 (-5.14)*** Constant5 -2.25 (-16.48)*** 0.92 (11.41)*** Constant6 -0.35 (-3.16)*** -0.38 (-5.02)*** Constant7 0.69 (7.06)*** -0.29 (-3.88)*** Constant8 -0.56 (-5.30)*** 0.94 (14.76)*** Loyalty1 5.22 (15.88)*** 5.58 (32.25)*** Loyalty2 6.98 (17.63)*** 5.91 (23.91)*** Loyalty3 6.96 (15.27)*** 6.93 (32.51)*** Loyalty4 7.45 (10.96)*** 6.08 (25.08)*** Loyalty5 5.65 (25.15)*** 4.82 (32.58)*** Loyalty6 5.23 (15.37)*** 5.88 (19.80)*** Loyalty7 4.20 (21.44)*** 6.32 (26.28)*** Loyalty8 5.07 (21.01)*** 4.21 (36.77)*** Segment size 0.36 0.64 Notes: Table entries are value coefficients, with t-statistics in parentheses. In the fine laundry detergent category, the alternatives are: 1 = SB (store brands), 2 = Norit, 3 = Perlan, 4 = Woolite, and 5 = OB (other brands). Woolite is the reference brand. In the nonfine laundry detergent category, the alternatives are: 1 = Ariel, 2 = Colon, 3 = Dixan, 4 = Elena, 5 = SB, 6 = Skip, 7 = Wipp, and 8 = OB. Colon is the reference brand. *p < 0.10, **p < 0.05, ***p < 0.01. To test which brands get purchased in each segment, we adjust the
probability of membership in each particular segment, following Kamakura and Russell (1989) and Gupta and Chintagunta (1994). Using an assignment rule such as “membership in the segment with highest probability,” we can assign
FEDEA – DT 2007-21 by José M. Labebeaga et al.
13
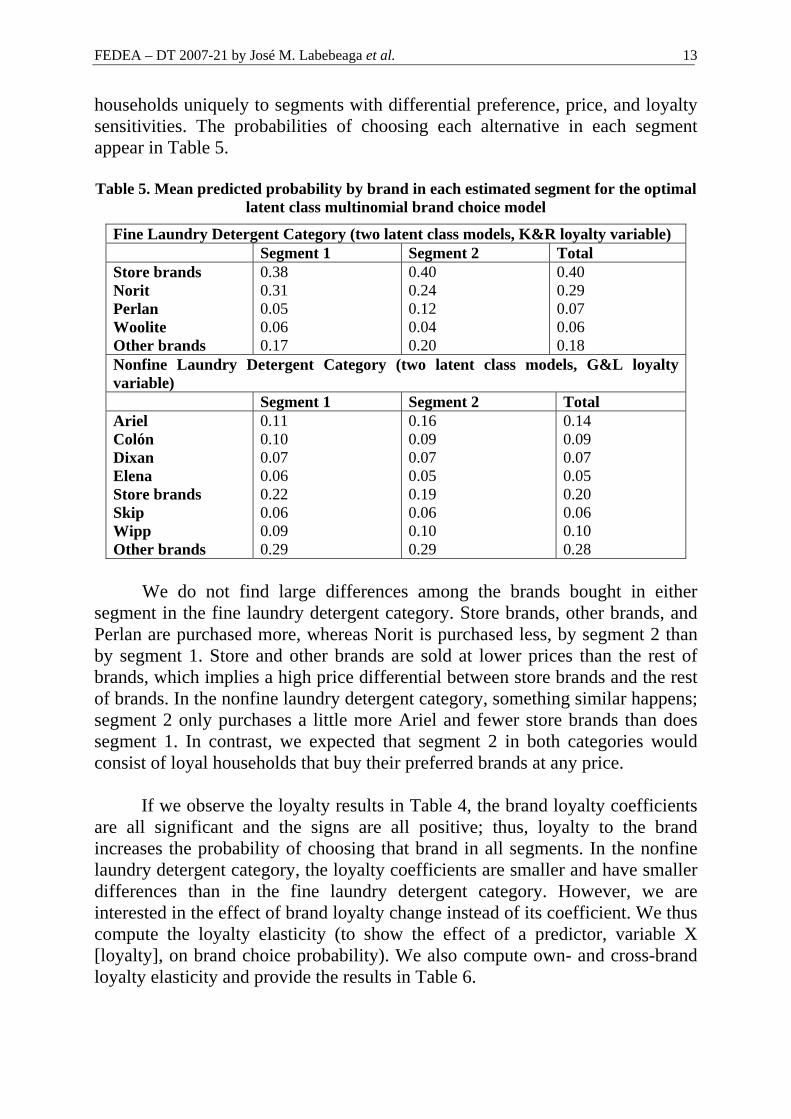
households uniquely to segments with differential preference, price, and loyalty sensitivities. The probabilities of choosing each alternative in each segment appear in Table 5.
Table 5. Mean predicted probability by brand in each estimated segment for the optimal
latent class multinomial brand choice model
Fine Laundry Detergent Category (two latent class models, K&R loyalty variable) Segment 1 Segment 2 Total Store brands Norit Perlan Woolite Other brands
0.38 0.31 0.05 0.06 0.17
0.40 0.24 0.12 0.04 0.20
0.40 0.29 0.07 0.06 0.18
Nonfine Laundry Detergent Category (two latent class models, G&L loyalty variable) Segment 1 Segment 2 Total Ariel Colón Dixan Elena Store brands Skip Wipp Other brands
0.11 0.10 0.07 0.06 0.22 0.06 0.09 0.29
0.16 0.09 0.07 0.05 0.19 0.06 0.10 0.29
0.14 0.09 0.07 0.05 0.20 0.06 0.10 0.28
We do not find large differences among the brands bought in either
segment in the fine laundry detergent category. Store brands, other brands, and Perlan are purchased more, whereas Norit is purchased less, by segment 2 than by segment 1. Store and other brands are sold at lower prices than the rest of brands, which implies a high price differential between store brands and the rest of brands. In the nonfine laundry detergent category, something similar happens; segment 2 only purchases a little more Ariel and fewer store brands than does segment 1. In contrast, we expected that segment 2 in both categories would consist of loyal households that buy their preferred brands at any price.
If we observe the loyalty results in Table 4, the brand loyalty coefficients
are all significant and the signs are all positive; thus, loyalty to the brand increases the probability of choosing that brand in all segments. In the nonfine laundry detergent category, the loyalty coefficients are smaller and have smaller differences than in the fine laundry detergent category. However, we are interested in the effect of brand loyalty change instead of its coefficient. We thus compute the loyalty elasticity (to show the effect of a predictor, variable X [loyalty], on brand choice probability). We also compute own- and cross-brand loyalty elasticity and provide the results in Table 6.
FEDEA – DT 2007-21 by José M. Labebeaga et al.
14
Table 6. Mean own-brand and cross-brand loyalty elasticity for the optimal latent class multinomial brand choice model
Fine Laundry Detergent Category (two latent class models, K&R loyalty variable) Store brands
(SB) Norit Perlan Woolite Others
brands (0B) Segment 1
SB 0.33 -1.61 -1.61 -1.61 -1.61 Norit -1.27 0.25 -1.27 -1.27 -1.27 Perlan -0.24 -0.24 0.15 -0.24 -0.24 Woolite -0.40 -0.40 -0.40 0.17 -0.40 OB -0.87 -0.87 -0.87 -0.87 0.17
Segment 2 SB 0.34 -3.90 -3.90 -3.90 -3.90 Norit -1.01 0.54 -1.01 -1.01 -1.01 Perlan -1.09 -1.09 0.46 -1.09 -1.09 Woolite -0.11 -0.11 -0.11 0.23 -0.11 OB -0.98 -0.98 -0.98 -0.98 0.67 Nonfine Laundry Detergent Category (two latent class models, G&L loyalty variable) Ariel Colón Dixan Elena SB Skip Wipp OB
Segment 1 Ariel 0.04 -0.26 -0.26 -0.26 -0.26 -0.26 -0.26 -0.26 Colón -0.24 0.02 -0.24 -0.24 -0.24 -0.24 -0.24 -0.24 Dixan -0.17 -0.17 0.01 -0.17 -0.17 -0.17 -0.17 -0.17 Elena -0.17 -0.17 -0.17 0.01 -0.17 -0.17 -0.17 -0.17 SB -0.72 -0.72 -0.72 -0.72 0.10 -0.72 -0.72 -0.72 Skip -0.10 -0.10 -0.10 -0.10 -0.10 0.03 -0.10 -0.10 Wipp -0.13 -0.13 -0.13 -0.13 -0.13 -0.13 0.04 -0.13 OB -0.82 -0.82 -0.82 -0.82 -0.82 -0.82 -0.82 0.11
Segment 2 Ariel 0.06 -0.52 -0.52 -0.52 -0.52 -0.52 -0.52 -0.52 Colón -0.22 0.03 -0.22 -0.22 -0.22 -0.22 -0.22 -0.22 Dixan -0.22 -0.22 0.02 -0.22 -0.22 -0.22 -0.22 -0.22 Elena -0.11 -0.11 -0.11 0.03 -0.11 -0.11 -0.11 -0.11 SB -0.59 -0.59 -0.59 -0.59 0.07 -0.59 -0.59 -0.59 Skip -0.13 -0.13 -0.13 -0.13 -0.13 0.02 -0.13 -0.13 Wipp -0.33 -0.33 -0.33 -0.33 -0.33 -0.33 0.03 -0.33 OB -0.69 -0.69 -0.69 -0.69 -0.69 -0.69 -0.69 0.09
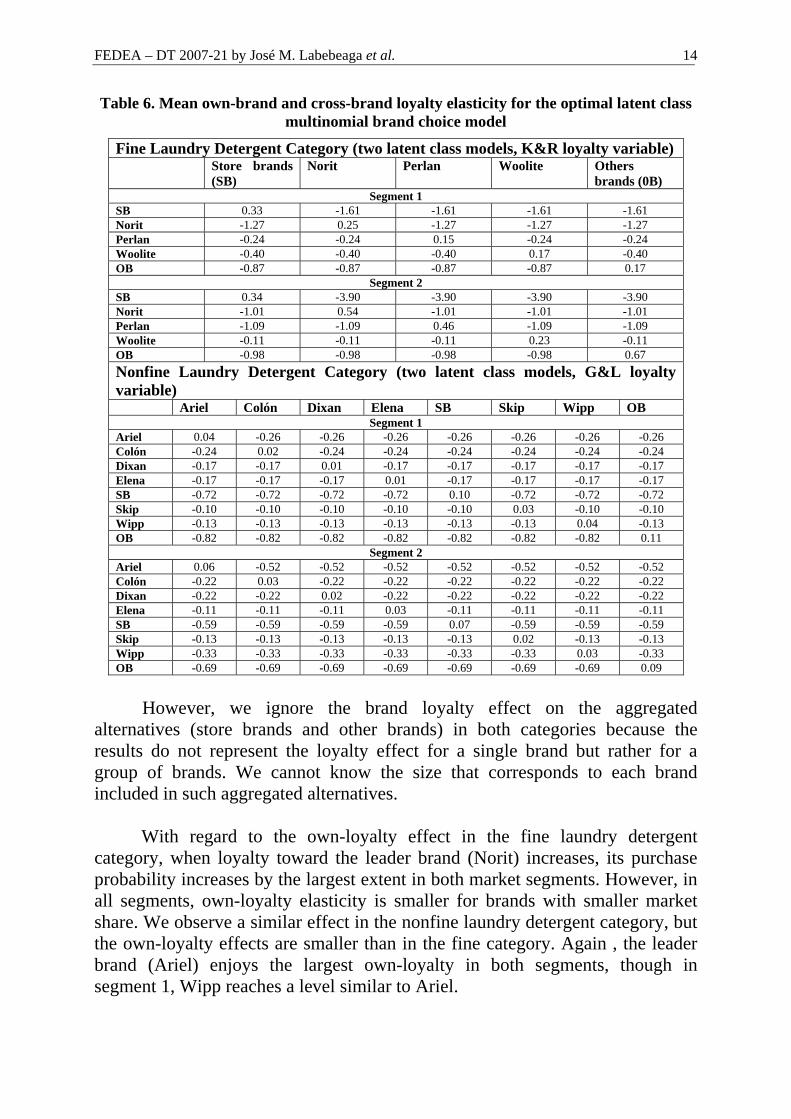
However, we ignore the brand loyalty effect on the aggregated
alternatives (store brands and other brands) in both categories because the results do not represent the loyalty effect for a single brand but rather for a group of brands. We cannot know the size that corresponds to each brand included in such aggregated alternatives.
With regard to the own-loyalty effect in the fine laundry detergent
category, when loyalty toward the leader brand (Norit) increases, its purchase probability increases by the largest extent in both market segments. However, in all segments, own-loyalty elasticity is smaller for brands with smaller market share. We observe a similar effect in the nonfine laundry detergent category, but the own-loyalty effects are smaller than in the fine category. Again , the leader brand (Ariel) enjoys the largest own-loyalty in both segments, though in segment 1, Wipp reaches a level similar to Ariel.
FEDEA – DT 2007-21 by José M. Labebeaga et al.
15
Our results thus show that brands with greater market share exhibit greater purchasing loyalty, which seems consistent with the DJ effect. The results occur across segments, but the size of the effect differs across them and across product categories.
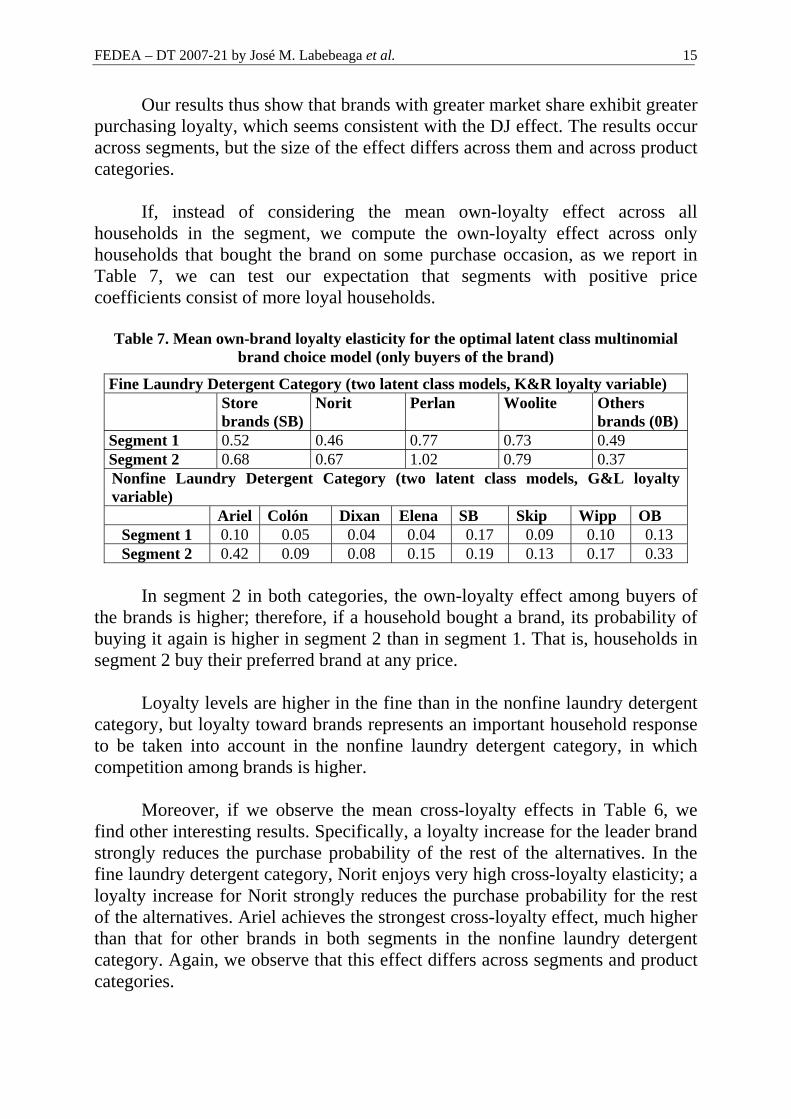
If, instead of considering the mean own-loyalty effect across all
households in the segment, we compute the own-loyalty effect across only households that bought the brand on some purchase occasion, as we report in Table 7, we can test our expectation that segments with positive price coefficients consist of more loyal households.
Table 7. Mean own-brand loyalty elasticity for the optimal latent class multinomial
brand choice model (only buyers of the brand)
Fine Laundry Detergent Category (two latent class models, K&R loyalty variable) Store
brands (SB) Norit Perlan Woolite Others
brands (0B) Segment 1 0.52 0.46 0.77 0.73 0.49 Segment 2 0.68 0.67 1.02 0.79 0.37 Nonfine Laundry Detergent Category (two latent class models, G&L loyalty variable) Ariel Colón Dixan Elena SB Skip Wipp OB
Segment 1 0.10 0.05 0.04 0.04 0.17 0.09 0.10 0.13 Segment 2 0.42 0.09 0.08 0.15 0.19 0.13 0.17 0.33
In segment 2 in both categories, the own-loyalty effect among buyers of
the brands is higher; therefore, if a household bought a brand, its probability of buying it again is higher in segment 2 than in segment 1. That is, households in segment 2 buy their preferred brand at any price.
Loyalty levels are higher in the fine than in the nonfine laundry detergent
category, but loyalty toward brands represents an important household response to be taken into account in the nonfine laundry detergent category, in which competition among brands is higher.
Moreover, if we observe the mean cross-loyalty effects in Table 6, we
find other interesting results. Specifically, a loyalty increase for the leader brand strongly reduces the purchase probability of the rest of the alternatives. In the fine laundry detergent category, Norit enjoys very high cross-loyalty elasticity; a loyalty increase for Norit strongly reduces the purchase probability for the rest of the alternatives. Ariel achieves the strongest cross-loyalty effect, much higher than that for other brands in both segments in the nonfine laundry detergent category. Again, we observe that this effect differs across segments and product categories.
FEDEA – DT 2007-21 by José M. Labebeaga et al.
16
4. Conclusions and Managerial Implications
In response to our first research question regarding which loyalty variable could be used as a framework in discrete choice models, the results indicate the preferability of measuring the performance of different loyalty variables in different product categories and then selecting the variable with the best results instead of using, for example, solely the G&L loyalty variable as a framework without knowing its performance in the specific product category.
We test for the DJ loyalty effect using a discrete brand choice model instead of the Dirichlet model, which has the drawback of assuming that the choice process is zero order when recent research has proved this is not the case. We allow asymmetries in the brand loyalty effects across brands to test the DJ effect and control for unobserved heterogeneity in preferences, loyalty, and price responses using a latent class multinomial brand choice model.
Brands with greater market share exhibit greater purchasing loyalty in a
European context in which store brands have obtained important market shares. Therefore, allowing differences across brands and segments provides for a better understanding of the brand loyalty process. Furthermore, own-brand loyalty elasticity is higher for the market share leader—Norit in the fine and Ariel in the nonfine laundry detergent category. Thus we show that market share leaders enjoy higher purchasing loyalty in the two markets we analyze. Therefore, we can use a discrete brand choice model to describe behavior patterns in which the DJ effect is captured.
The empirical results also show that the degree of brand loyalty differs
across brands, segments, and product categories. Therefore, unobserved heterogeneity exists not only in price and preferences but also in loyalty across segments and product categories. In product categories with a dominant market share leader, where market concentration is higher and competition on price promotions is lower, households reveal higher brand loyalty levels.
In addition, brands’ loyalty levels are hurt more when loyalty toward the
leader brand (Norit, Ariel) increases. This result is consistent across market segments, though the degree of damage differs.
For brand managers, our estimation of a brand-specific loyalty coefficient
provides a useful tool that enables comparisons of brand loyalty levels compared with those of competitor brands. Managers can determine their brand loyalty levels and discover which brands represent their strongest competitors, and thus which brands are harming their brand loyalty level most.
FEDEA – DT 2007-21 by José M. Labebeaga et al.
17
Furthermore, a consistent result in both categories pertains to the high purchasing loyalty obtained by store brands. If a household is loyal to some store brands, independent of the retailer commercializing the brand, higher own-loyalty elasticity effects emerge toward store brands in general, and their loyalty increase harms loyalty toward other brands on the market. Therefore, brand managers should be aware of the damage that store brands do to loyalty toward their brands. A longer data period, such as five or ten years, would offer a clearer sense of this competition in brand loyalty over time.
As with any research, this investigation contains certain limitations that
should be considered. First, the proposed model is a discrete brand choice model instead of a demand model, and therefore, it does not model frequency of purchase and quantity decisions. Second, if brand choice and store decisions were modeled together, we might recognize disaggregate loyalty toward each store brand offered by each retailer. Third, we estimate the proposed model using two frequently purchased categories, in which the store brands’ market shares are very different and market conditions and consumer behavior differ considerably. To verify our findings and provide more robust results, it would be interesting to apply the model to other categories and time periods to determine if the results hold.
FEDEA – DT 2007-21 by José M. Labebeaga et al.
18
References Aaker, D. A. (1991). Managing Brand Equity: Capitalizing on the Value of a
Brand Name. New York: The Free Press. Abramson, C., Andrews, R. L., Currim, M. S., and Jones, M. (2000). “Parameter
Bias from Unobserved Effects in the Multinomial Logit Model of Consumer Choice”, Journal of Marketing Research 37 (November), 410-426.
ACNielsen. (2005). The Power of Private Label. http://www2.acnielsen.com/reports/documents/2005_privatelabel.pdf.
Ailawadi, K. L., Gedenk, M., and Neslin, S. A. (1999). “Heterogeneity and Purchase Event Feedback in Choice Models: An Empirical Analysis with Implications for Model Building”, International Journal of Research in Marketing 16, 177-198.
Anderson, E. T. (2002). “A Guadagni-Little Likelihood Can Have Multiple Maxima”, Marketing Letters 13 (4), 373-388.
Andrews, R. L., Ainslie A. and Currim. I. S. (2002). “An Empirical Comparison of Logit Choice Models with Discrete Versus Continuous Representations of Heterogeneity”, Journal of Marketing Research 39 (November), 479-488.
Bhattacharya. C.B. (1997) “Is your Brand’s Loyalty too Much, too Little, or just Right?: Explaining Deviations in Loyalty from the Dirichlet Norm”, International Journal of Research in Marketing 14, 421-435.
Bronnenberg, B. J. and Wathiu L. (1996). “Asymmetric Promotion Effects and Brand Positioning”, Marketing Science 15 (4), 379-394.
Bucklin, R. E. and Gupta, S. (1992). “Brand Choice, Purchase Incidence, and Segmentation: An Integrated Modeling Approach”, Journal of Marketing Research 29 (May), 201-215.
Chintagunta, P., Jain. D.C. and Vilcassim, N. J. (1991). “Investigating Heterogeneity in Brand Preferences in Logit Models for Panel Data”, Journal of Marketing Research 28 (November), 417-428.
Consumer Reports. (1993). Battle of the Brands. 58 (9), 565. Danaher. P.J, Wilson, I.W., and Davis, R.A. (2003). “A Comparison of Online
and Offline Consumer Brand Loyalty”, Marketing Science 22 (4), 461-476.
Dekimpe M.G., Steenkamp, J-B. E.M, Mellens, M., and Abeele, P.V. (1997). “Decline and Variability in Brand Loyalty”, International Journal of Research in Marketing, 14, 405-420.
East, R. and Hammond, K. (1996). “The Erosion of Repeat-Purchase Loyalty”, Marketing Letters, 7 (2), 163-71.
Ehrenberg, A.S.C, Goodhardt, G.J., and Barwise, T.B. (1990). “Double Jeopardy Revisited”, Journal of Marketing 45 (July), 82-91.
FEDEA – DT 2007-21 by José M. Labebeaga et al.
19
Erdem, T. (1996). “A Dynamic Analysis of Market Structure Using Panel Data”, Marketing Science 15 (4), 359-378.
Erdem, T. and Keane, M.P. (1996). “Decision-Making Under Uncertainty: Capturing Dynamic Brand Choice Processes in Turbulent Consumer Goods Markets”, Marketing Science 15 (1), 1-20.
Fader, P.S. and Lattin, J.M. (1993) “Accounting for Heterogeneity and Nonstationarity in a Cross-Sectional Model of Consumer Purchase Behavior”, Marketing Science 12 (3), 304-317.
Fader, P.S., and Schmittlein D.C. (1993) “Excess Behavioral Loyalty for High-Share Brands: Deviations from the Dirichlet Model for Repeat Purchasing”, Journal of Marketing Research 30 (November), 478-493.
Gönül, F. and Srinivasan, K. (1993). “Modeling Multiple Sources of Heterogeneity in Multinomial Logit Models: Methodological and Managerial Issues”, Marketing Science 12 (3), 213-229.
Goodhardt, G.J, Ehrenberg A. S. C. and Chatfield C. (1984) “The Dirichlet: A Comprehensive Model of Buying Behaviour”, Journal of Royal Society 147 (5), 621-655.
Guadagni, P. M. and Little, J. D. (1983). “A Logit Model of Brand Choice Calibrated on Scanner Data”, Marketing Science 2 (3), 203-238.
Gupta, S. (1988). "Impact of Sales Promotions on When, What and How Much to Buy." Journal of Marketing Research 25 (November), 342-55.
Gupta, S. and Chintagunta, P.K. (1994). “On Using Demographic Variables to Determine Segment Membership in Logit Mixture Models”, Journal of Marketing Research 31, 128-136.
Heckman, J.J. (1981). Heterogeneity and State Dependence. In Studies in Labor Markets (91-139), S. Rosen, ed. Chicago: University of Chicago Press.
Johnson, T. (1984). “The Myth of Declining Brand Loyalty”. Journal of Advertising Research, 24 (1), 9-17.
Jones, M. J. and Landwehr, J. T. (1988). “Removing Heterogeneity Bias from Logit Model Estimation”. Marketing Science 7 (Winter), 41-59.
Kamakura, W. A. and Russell. G. J. (1989). “A Probabilistic Choice Model for Market Segmentation and Elasticity Structure”, Journal of Marketing Research 26 (November), 379-390.
Keane, M. P. (1997). “Modeling Heterogeneity and State Dependence in Consumer Choice Behavior”, Journal of Business and Economic Statistics 15 (3), 310-327.
Krishnamurthi, L. and Raj, S. P. (1991). “An Empirical Analysis of the Relationship Between Brand Loyalty and Consumer Price Elasticity”, Marketing Science 10 (Spring), 172-183.
Lattin, J.M. and Randolph E. Bucklin, R.E. (1989). “Reference Effects of Price and Promotion on Brand Choice Behavior”, Journal of Marketing Research 26 (August): 299-310.
FEDEA – DT 2007-21 by José M. Labebeaga et al.
20
McFadden, D. (1973). Conditional Logit Analysis of Qualitative Choice Behavior. Chapter Four. In Frontiers in Econometrics (105-142), P. Zarembka, ed. New York: Academic Press.
Ortemeyer, G., Lattin, J.M, and Montgomery, D.B. (1991). “Individual Differences in Response to Consumer Promotions”, International Journal of Research in Marketing 8, 169-186.
Papatla, P. (1993). “Brand Inequalities in the Loyalty Effects of Purchases”, Marketing Letters 4 (4), 361-368.
Rossi, P. E. and Allenby, G.M. (1993). “A Bayesian Approach to Estimating Household Parameters”, Journal of Marketing Research 30 (2), 171-82.
Seetharaman, P.B. (2003). “Probabilistic versus Random-Utility Models State Dependence: An Empirical Comparison”, International Journal of Research in Marketing 20 (1), 87-96.
Stern, P. and Hammond, K. (2004). “The Relationship Between Customer Loyalty and Purchase Incidence”, Marketing Letters 15 (1), 5-19.
Uncles M., Ehrenberg A., and Hammond K. (1995). “Patterns of Buyer Behavior: Regularities, Models and Extensions”, Marketing Science 13, 2, Part 2 of 2. G71-G79.
Varki, S. and Chintagunta, P. K. (2004). “The Augmented Latent Class Model: Incorporating Additional Heterogeneity in the Latent Class Model for Panel Data”, Journal of Marketing Research 41 (May), 226-233.
Wernerfelt, B. (1986). “A Special Case of Dynamic Pricing Policy.” Management Science 32, 1564-1566.
Wernerfelt, B. (1991). “Brand Loyalty and Market Equilibrium”, Marketing Science 10 (3), 229-245.
Related Documents