Testing the Barro-Gordon Model in Breaking and Dependent Panels: Evidence from the OECD Countries * Joakim Westerlund † , Syed A. Basher ‡ , David Edgerton § October 12, 2005 Abstract The Barro-Gordon model of monetary policy implies that inflation will inherit the persistency of the natural rate of unemployment when the central bank cannot commit to a monetary policy rule. The present paper tests the validity of this model in the OECD area by inferring whether unemployment and inflation rates are cointegrated. Evidence from this and other studies suggests that the baseline version of the Barro-Gordon model does not hold, and that this might be due to structural instability induced by changing economic conditions. To be able to test whether this is in fact the case, new panel data cointegration tests are proposed that allow for an arbitrary number of structural breaks in the cointegration relation. Cross-section dependence is also permitted to account for the fact that both unemployment and inflation appear to be affected by shocks that are common across countries. The results based on these new tests suggest that the Barro-Gordon model cannot be rejected. JEL Classification: C12; C32; C33; E30; E52. Keywords: Monetary Policy; Inflation; Unemployment; Panel Cointegra- tion; Structural Break; Cross-Section Dependence. * Westerlund and Edgerton gratefully acknowledge financial support from the Jan Wallan- der and Tom Hedelius Foundation, research grant number P2005-0117:1. The authors would also like to thank Matthew Doyle and Barry Falk for making their data available to us. The usual disclaimer applies. † Corresponding author: Department of Economics, Lund University, P. O. Box 7082, S- 220 07 Lund, Sweden. Telephone: +46 46 222 4970; Fax: +46 46 222 4118; E-mail address: [email protected]. ‡ Department of Economics, York University, Canada. E-mail: [email protected]. § Department of Economics, Lund University, Sweden. E-mail: [email protected]. 1

Welcome message from author
This document is posted to help you gain knowledge. Please leave a comment to let me know what you think about it! Share it to your friends and learn new things together.
Transcript

Testing the Barro-Gordon Model in Breaking and
Dependent Panels: Evidence from the OECD
Countries∗
Joakim Westerlund†, Syed A. Basher‡, David Edgerton§
October 12, 2005
Abstract
The Barro-Gordon model of monetary policy implies that inflation
will inherit the persistency of the natural rate of unemployment when the
central bank cannot commit to a monetary policy rule. The present paper
tests the validity of this model in the OECD area by inferring whether
unemployment and inflation rates are cointegrated. Evidence from this
and other studies suggests that the baseline version of the Barro-Gordon
model does not hold, and that this might be due to structural instability
induced by changing economic conditions. To be able to test whether this
is in fact the case, new panel data cointegration tests are proposed that
allow for an arbitrary number of structural breaks in the cointegration
relation. Cross-section dependence is also permitted to account for the
fact that both unemployment and inflation appear to be affected by shocks
that are common across countries. The results based on these new tests
suggest that the Barro-Gordon model cannot be rejected.
JEL Classification: C12; C32; C33; E30; E52.Keywords: Monetary Policy; Inflation; Unemployment; Panel Cointegra-
tion; Structural Break; Cross-Section Dependence.∗Westerlund and Edgerton gratefully acknowledge financial support from the Jan Wallan-
der and Tom Hedelius Foundation, research grant number P2005-0117:1. The authors wouldalso like to thank Matthew Doyle and Barry Falk for making their data available to us. Theusual disclaimer applies.
†Corresponding author: Department of Economics, Lund University, P. O. Box 7082, S-220 07 Lund, Sweden. Telephone: +46 46 222 4970; Fax: +46 46 222 4118; E-mail address:[email protected].
‡Department of Economics, York University, Canada. E-mail: [email protected].§Department of Economics, Lund University, Sweden. E-mail: [email protected].
1

1 Introduction
The time consistency monetary policy model of Barro and Gordon (1983) de-scribes a situation where the inability of the policymaker to commit in advanceto a certain monetary policy rule can create long-run upward trends in both un-employment and inflation rates. Intuitively, the policymaker, who aims to bringthe unemployment rate closer to its natural rate, is tempted to do so by repeat-edly creating surprise inflation in an effort to exploit the expectational Phillipscurve. Households, being rational agents, perfectly anticipate this temptationto inflate and adjust their decisions accordingly. As a result, the equilibriumoutcome is a situation with no reduction in unemployment and higher inflationthan before (this is the famous ‘inflation bias’ result). Thus, according to thismodel, any long-run trend in the natural rate of unemployment will tend togenerate similar trends in inflation.
Can this model help us explain the rising and falling episodes of unemploy-ment and inflation in the United States between 1960 and 1997? To answerthis question, Ireland (1999) examined the empirical implications of the Barro-Gordon model using quarterly data on inflation and unemployment from 1960through 1997. Specifically, if the natural rate of unemployment possesses a unitroot, then the Barro-Gordon model implies that inflation and unemploymentmust exhibit the same unit root and be cointegrated. The empirical resultsrevealed that both inflation and unemployment are nonstationary and cointe-grated, thus corroborating this story.
Although the Barro-Gordon model seems to be able to explain the long-runtrends of inflation and unemployment in the United States, this do not seem tobe so for the OECD countries, see Doyle and Falk (2004). They argue that thisfailure can be attributed in part to changing institutional and macroeconomicconditions, such as increased central bank independence and openness to trade,which may cause both the preferences of the policy maker and the slope of thePhillips curve to shift. Recognizing this deficiency, Doyle and Falk (2004) extendthe baseline Barro-Gordon model to allow the key parameters to change overtime. However, the authors find little evidence in favor of cointegration amongthe 13 OECD countries in their sample, even after controlling for structuralchange in the cointegration relationship.
One shortcoming of the Doyle and Falk (2004) study, which may explain theseemingly poor performance of the Barro-Gordon model, is that conventionaltime series tests for cointegration with structural shifts can have very low powerin samples of realistic size. One way to increase the power of such tests is to usenot just one but a panel comprised of many time series. If these series can beexpected to behave in a relatively similar fashion, as is the case with the OECDcountries, their information content can be pooled thus creating a much morepowerful panel test. Another shortcoming is that Doyle and Falk (2004) onlyallowed for a single break, which is likely to be inadequate as the parameters ofthe model may well have changed more than once.
2

Although there are several tests that can be applied to test for cointegrationin the panel data context, there are at present no test that is able to test the nullhypothesis of no cointegration while simultaneously entertaining the possibilityof multiple shifts under the alternative hypothesis of cointegration.1 One studythat almost satisfies this requirement is that of Westerlund and Edgerton (2005),who propose Lagrange multiplier (LM) based tests for the null hypothesis of nocointegration in panel data, which permit each cointegration relation to shiftunder the alternative. However, these tests can only accommodate a single shift,which, as argued above, is unlikely to suffice in our case. In addition, the testsare based on the assumption that the members of the panel are uncorrelated,which is unlikely to be satisfied in our case with strong comovements betweencountries through common price shocks and unemployment cycles.
The first contribution of this paper is to extend the Westerlund and Edger-ton (2005) test to the more general case with cross-sectional dependence andmultiple shifts under the alternative hypothesis. We do this is by first showingthat the asymptotic distributions of the tests in the case of cross-sectional in-dependence remain unaltered by the introduction of multiple shifts. We thenproceed by showing that this property carries over to the case when the cross-sectional units are correlated through a small number of common factors. TheMonte Carlo simulations suggest that these asymptotic results hold quite wellin small samples.
The second contribution of the paper is to empirically examine the Barro-Gordon model for the OECD data using the new panel data tests. To the bestof our knowledge, this is the first paper that uses panel data to test the time-varying parameter version of the model. The results suggest that, although themodel does not hold on an individual country basis, it does holds when usingthe new panel based tests.
The rest of the paper is organized as follows. Section 2 outlines the modelthat we use in this paper and how it can be tested empirically. Sections 3 to 5then develop the new panel cointegration tests, while Section 6 presents a smallMonte Carlo study. Section 7 holds the empirical analysis. Finally, Section 8concludes. All proofs are collected in the Appendix.
2 The Barro-Gordon model
Doyle and Falk (2004) find that the baseline version of the Barro-Gordon modelused by Ireland (1999) cannot explain the variation in the OECD data. Theauthors argue that this might be due to structural economic changes and con-sequently derive an extended version of the model that allows for the presenceof time varying parameters. In this section, we briefly outline this extendedmodel, focusing our attention on the relationship used in the empirical analysis.For a more thorough derivation, we refer to Doyle and Falk (2004).
1See Breitung and Pesaran (2005) for a recent survey of the literature.
3

The model begins by assuming that the structural relationship between in-flation and unemployment can be modelled using the following expectationsaugmented short-run Phillips curve
Uit = Uit − αit(πit −Et−1πit), (1)
where t = 1, ..., T and i = 1, ..., N indexes the time series and cross-sectionalunits, respectively. The variables Uit, Uit and πit represent the rate of unem-ployment, the natural unemployment rate and the rate of inflation, respectively,where it is assumed that Uit evolves according to ∆Uit = δi∆Uit−1 + eit, whereeit is a white noise disturbance. Moreover, we use Et−1 to denote the expec-tation conditional on the information set available at the beginning of periodt and αit to denote the slope of the Phillips curve, which is allowed to changeover time.
Next, it is assumed that the policymaker in country i chooses a target rateof inflation, πp
it say, to minimize the loss function
L(Uit, πit) =12
((Uit − φitUit)2 + λitπ
2it
), (2)
where φit and λit are the time varying reference parameters of the policymaker.Since the policymaker cannot control the rate of inflation perfectly, the rela-tionship between πit and πp
it is modelled as πit = πpit + vit, where vit is a white
noise disturbance.The equilibrium outcome is obtained by minimizing (2) subject to (1). To
this end, it is assumed that expectations are formed rationally so that πpit =
Et−1πit, in which case the first order condition reduces to
πpit =
Et−1αit(1− φit)Uit
Et−1λit, (3)
For convenience, it is assumed that the values of αit, φit and λit are knownat time t − 1 before the policymaker chooses πp
it are and therefore free of theexpectation operator. By using the same steps as in Doyle and Falk (2004), themodel can now be solved, which yields the following key relationship
πit − αit
(1− φit
λit
)Uit = −αit
(1− φit
λit
)eit +
(1 + α2
it
(1− φit
λit
))vit. (4)
Now, both empirical and theoretical work suggest that the inflation and unem-ployment rates are nonstationary variables. Therefore, since the right hand sideof (4) is stationary by construction, the Barro-Gordon model necessitates thatπit is cointegrated with Uit forming cointegrating vector (1, −βit)′, where thecointegration parameter βit is given by αit(1− φit)/λit.
3 Tests based on independent panels
Due to the fact that the cointegration vector in equation (4) is time varying,the Doyle and Falk (2004) version of the Barro-Gordon model cannot be tested
4

directly by conventional cointegration test procedures. In this section, we there-fore develop two new panel cointegration tests, which are derived from the LMbased tests recently proposed by Westerlund and Edgerton (2005).
The data generating process for inflation is assumed to be given by
πit = αi + δ′iDit + ηit + βiUit + γ′iDitUit + zit, (5)
where Dit is an Mi dimensional vector of dummy variables Djit with j = 1, ..., Mi.
The rate of unemployment is assumed to evolve according to Uit = Uit−1 +wit, and we make the assumption that zit obeys the following autoregressiverepresentation
zit = ρizit−1 + eit. (6)
As in Westerlund and Edgerton (2005), we assume that the cross-sectional unitsare independent. In particular, it is assumed that the errors wit and eit havezero cross-sectional correlation both among themselves and between each other.This assumption is made here to simplify the derivation of the tests, and will berelaxed later on. We also impose a weak restriction on the temporal dependencyof wit and eit by assuming that they satisfy the multivariate invariance principle.Moreover, we assume that Uit is weakly exogenous.
The key feature of equation (5) is that it explicitly permits for the possibilityof a time varying cointegration vector by assuming that both the intercept andslope of the cointegration relation is subject to at most Mi < T structuralbreaks, or Mi + 1 regimes. The locations of these breaks are determined by thedummy variables Dj
it, taking the value one if t > Tij and zero otherwise. Thus,there are Mi +1 regimes for each country i with regime j running form Tij−1 toTij time series observations. Also, since Uit and πit may be trending, equation(5) is fitted with an individual specific time trend.2
To guarantee that the breaks are asymptotically distinct, it is assumed thatthe indices Tij are set as a fixed fraction, bij say, of T such that Tij = bijT ,bij ∈ [0, 1] and bij > bij−1 for all j. The limit is taken as T −→∞ in a sequencethat ensures an integer value of Tij . For now, bij will be treated as knownsuggesting an exogenous break structure.
As shown by Westerlund and Edgerton (2005), the panel LM based teststatistics for the null hypothesis of no cointegration can be obtained by runningthe following auxiliary regression
∆Sit = µi + φiSit−1 +p∑
j=1
γij∆Sit−j + uit. (7)
2As pointed out by Westerlund and Edgerton (2005), if it is known that ηi = 0 for all i, thetrend in (5) could be suppressed. Unfortunately, this information is rarely available, which iswhy we choose to augment (5) with a linear time trend. In addition, our Monte Carlo resultsindicate that the trend specification generally leads to much better test properties.
5

where φi = ρi − 1 and the lag length parameter p should be sufficiently largeto whiten the remaining error uit. The variable Sit is given by Sit = πit − αi −δ′iDit − ηit − βiUit − γ′iDitUit, where αi = yi1 − δ′iDi1 − ηi − βiUi1 − γ′iDi1Ui1
is the restricted maximum likelihood estimate of αi + zi0. The correspondingmaximum likelihood estimators δi, ηi, βi and γi of δi, ηi, βi and γi can beobtained by running least squares on the following regression, which is (5) in itsfirst differentiated form
∆πit = ηi + δ′i∆Dit + βi∆Uit + γ′i∆(DitUit) + ∆zit. (8)
Looking at (6), it is obvious that testing the null hypothesis of no cointegrationversus the alternative of cointegration is equivalent to testing H0 : ρi = 1 forall i versus H1 : ρi < 1 for at least some i. This is the same as testing whetherφi = 0 for all i in (7), which is the basis for our approach. If we let φi denote theleast squares estimate of φi and τi its t-ratio, then the standardized LM basedtest statistics of the hypothesis of H0 versus H1 can be written as follows
Zφ =1√
Nσφ
N∑
i=1
(T φi − µφ) and Zτ =1√Nστ
N∑
i=1
(τi − µτ ).
The mean and standard deviation adjustment terms needed to construct thesestatistics are the same as in Westerlund and Edgerton (2005). The numeri-cal values of µτ and στ , obtained through stochastic simulation, are given by−1.9675 and 0.3301 with the corresponding values of µφ and σφ being −8.4376and 25.8964. These apply in general for any number of breaks as long as (5)includes a linear time trend, and for any number of regressors.
The asymptotic distributions of the new LM based test statistics are givenin the next theorem, which uses the symbol ⇒ to denote weak convergence.
Theorem 1. (Asymptotic distribution.) Under the conditions laid out in theabove and the null hypothesis of no cointegration, then Zτ , Zφ ⇒ N(0, 1) asT −→∞ prior to N −→∞.
The proof of Theorem 1 is given in the appendix. The theorem states thatthe LM based statistics in the multiple break case are normally distributed andinvariant with respect to both the number of breaks and their locations. Thisproperty is very convenient, and follows from the results derived by Westerlundand Edgerton (2005) for their one-break test. Fortunately, the same propertycarries over to the more general case of multiple breaks considered here.
In the case with a single break in the intercept of each regression, Westerlundand Edgerton (2005) show that the LM based tests are robust to misspecificationof the break under the null hypothesis. Unfortunately, this invariance propertydoes not hold in our model with breaks in both the intercept and slope, as thelimit of Zτ and Zφ in the case with misspecified breaks will depend not onlyon the number and locations of the breaks, but also on the presence of the
6

stochastic regressor Uit. One important implication of this result is that, unlessthe break structure is completely known, the performance of the tests will ingeneral depend on the accuracy of the estimated breakpoints.
Furthermore, it is well known that incorrect omission or placement of exist-ing breaks makes tests based on the null hypothesis of no cointegration biasedtowards accepting the null. Thus, employing a poor estimator of the breakpointsis expected to result in a loss of power.
4 Estimating the breaks
In this section, we relax the assumption of a known break structure. In so doing,we propose a simple grid search procedure that can be employed to estimatethe breaks based on the observed data.
As pointed out by Westerlund and Edgerton (2005), the single most popularunit root testing procedure with unknown breaks is that of Zivot and Andrews(1992), in which a single breakpoint can be estimated via a grid search to findthe minimum of the individual unit root test statistics. This approach hasrecently been used by Banerjee and Carrion-i-Silvestre (2005), who suggest usingthe Gregory and Hansen (1996) versions of Zφ and Zτ when the cointegrationrelation suffers from a single break. Unfortunately, generalizing this one-breakgrid search to Mi breaks is clearly computationally extremely demanding, andin practice infeasible for Mi > 3. Another drawback of this approach is that Mi
must be known.A more feasible approach, that does not require knowledge of Mi, is to follow
the recommendation of Bai (1997) and Bai and Perron (1998), and estimate thebreaks using least squares. This procedure allows for consistent estimation ofthe break fractions and therefore consistent estimation of the whole model underthe alternative hypothesis, with only O(T ) least squares operations for any givennumber of breaks. Hence, we can construct consistent and less computationallyintensive tests using the statistics obtained from these least squares operations.
For the implementation of this estimation procedure, we propose using thefollowing grid search scheme discussed in Kapetanios (2005). Similar to mostmodel selection procedures, we assume that the maximum number of breaks,denoted here as J , is known.
Step 1. We start by searching for a single break and store the statistic of in-terest, Zτ or Zφ, for all permissable partitions of the sample. Denotethis set of permissable one-break statistics by S1
i , and let R1i denote
the associated set of sum of squared residuals.
Step 2. Choose the break date that minimizes the set R1i .
Step 3. Impose the estimated break date on the sample and start looking for thenext break over all permissable partitions in the resulting subsamples.
7

Denote the set of all permissable two-break statistics and their sum ofsquared residuals by S2
i and R2i , respectively. Then, append S2
i to S1i
and R2i to R1
i to obtain R1i ∪R2
i and S1i ∪ S2
i .
Step 4. Choose the date that minimizes R2i as the next break.
Step 5. Repeat steps 3 and 4 until J breaks have been estimated. Denote theset of statistics as S3
i , ...,SJi and the resulting set of sum of squared
residuals as R3i , ...,RJ
i .
Step 6. Adopt as test statistic the element in S1i ∪S2
i ∪ ...∪SJi associated with
the minimum over the set R1i ∪R2
i ∪ ... ∪RJi .
Some remarks are in order. First, the selection of the number of breaks instep 6 merits further discussion. A standard problem is that allowing for morebreaks will always lead to a reduction in the sum of squared residuals. Thisnaturally leads to the consideration of a penalty factor for the increased dimen-sion of the test regression, suggesting that the above search scheme could beimplemented using an information criterion. The particular criteria consideredin this paper are determined by their small-sample performance. The objectivefunction that we use can be written as
L(Mi) = log(σ2i ) + CT T−1, (9)
where σ2i = T−1
∑Tt=p+1 u2
it, T is the effective number of time series observa-tions and uit is the least squares estimate of uit based on Mi breaks and a lagaugmentation of p.
The criteria are defined by specifying CT , which is a nonnegative penaltyfor an additional break. The Schwarz Bayesian criterion is defined by CT ≡(p + 2 + K(Mi)) log(T ), while the modified Akaike and Schwarz criteria of Ngand Perron (2001) are defined by CT ≡ 2(Wi + p + K(Mi)) and CT ≡ (Wi +p+K(Mi)) log(T ), respectively, where Wi = σ−2
i φ2i
∑Tt=p+1 S2
it−1 and K(Mi) =1 + 3Mi is the number of parameters in the cointegrated regression plus Mi toaccount for the break dates. All criteria are computed using the effective numberof observations, which seem to produce the best results in small samples.
Secondly, the estimation of the break dates in step 3 can be performed in twoways. The first approach, developed by Bai (1997), involves first including thebreak dates one by one using dummy variables and then estimating each of themusing the entire time series dimension of the panel. The second approach in-volves splitting the sample after each estimated breakpoint and then estimatingsubsequent breakpoints based on the resulting subsamples. In both cases, eachestimated breakpoint is assumed to lie between two subsamples whose size tendsto infinity as T increases. For this reason, we impose a trimming parameter, r
say, such that bij−1−bij > r and r > 0, on each break search. As in many otherstudies, r is set equal to 0.1. Although asymptotically indistinguishable, oursimulations suggest that the second approach is superior, and it will thereforebe employed in this paper.
8

5 Tests based on dependent panels
Up to now, we have assumed that the cross-sectional units are independentof each other. However, because of common price shocks and unemploymentcycles across countries, this assumption unlikely to be satisfied when testing theBarro-Gordon model. Therefore, to be able to accommodate such dependencies,this section extends the testing framework of Section 3 to the common factorsetup considered by Bai and Ng (2004).
The way we do this is by replacing the pure autoregressive model in (6) bythe following common factor representation
zit = λ′iFt + vit, (10)
where Ft is a K dimensional vector of unobservable common factors, λi is thevector of loading parameters and vit is an idiosyncratic error term. We assumethat Ft = ϕ′Ft−1 + εt and vit = ρivit−1 + eit are autoregressive processes withthe errors εt and eit being independently and identically distributed. For con-venience, we also require εt and eit to be independent of wit, the first differenceof Uit. Note that, in this setup, the relationship in equation (5) is cointegratedif ρi < 1 and it is spurious if ρi = 1. Nonstationary factors are also allowed bysetting ϕj = 1 for some j.
The estimation of the common factors is done as in Bai and Ng (2004). Webegin by taking first differences, in which case (5) becomes
∆πit = ηi + δ′i∆Dit + βi∆Uit + γ′i∆(DitUit) + λ′i∆Ft + ∆vit. (11)
The next step is to concentrate out everything but the factors, which can beaccomplished by first subtracting the time series mean of each variable to elim-inate ηi, and then taking orthogonal projections. Thus, if we let ∆πit, ∆Ft and∆vit denote the errors from projecting the mean deviations of ∆πit, ∆Ft and∆vit onto the mean deviation of the remaining variables in (11), then the firstdifferentiated model reduces to
∆πit = λ′i∆Ft + ∆vit. (12)
Note that, because ∆vit is stationary, we can apply the method of principalcomponents to estimate λi and ∆Ft. To this end, let λ, ∆F and ∆v be K ×N ,(T − 1)×K and (T − 1)×N matrices of stacked observations on λi, ∆Ft and∆vit, respectively. The principal components estimator of ∆F , ∆F say, can beobtained by computing
√T − 1 times the eigenvectors corresponding to the K
largest eigenvalues of the (T − 1)× (T − 1) matrix ∆v∆v′. The correspondingmatrix of estimated factor loadings is given by λ = 1
T−1∆F ′∆v. Given ∆Ft,the estimated common factor can be recovered as
Ft =t∑
k=2
∆Fk.
9

The panel LM based test statistics can now be computed as before with Sit =πit − αi − δ′iDit − ηit − βiUit − γ′iDitUit − λ′iFt in place of Sit. The modifiedversions of Zφ and Zt will henceforth be denoted by Zφ and Zt, respectively. Theasymptotic distributions for these statistics are given in the following theorem.
Theorem 2. (Asymptotic distribution with common factors.) Under the assump-tions given above and the null hypothesis of no cointegration, then Zτ , Zφ ⇒N(0, 1) as T −→∞ prior to N −→∞.
A few remarks are in order. First, Theorem 2 shows that the asymptoticdistributions of the LM based tests in the case with correlated units coincidewith those given in Theorem 1 for the case with independent units. As shownin the appendix, this result is based on the fact that Ft converges to Ft at rateT 1/2 so that the estimated factors can basically be treated as known. Thus,by using Sit instead of Sit, we can essentially subtract the common componentλ′i∆Ft from the data so that the asymptotic distribution of T−1/2Sit does notcontain any terms that are common across i, and are in fact equal to the limitof T−1/2Sit in the independent case.
Second, note that the projection of ∆Ft on the right-hand side variables of(11) makes the projection error ∆Ft dependent on i. This is problematic inthe sense that the factors are common by definition and thus cannot dependon i. Fortunately, the appendix shows that the effect of projecting ∆Ft on theother variables vanishes asymptotically. This makes the dependence of Ft on i
negligible thus preserving the common factor structure asymptotically.Third, the LM based statistics are derived under the implicit assumption
that K, the number of common factors, is known. When it is unknown, anatural approach is to treat the estimation problem as a model selection issueand estimate K by minimizing an information criterion. In so doing, we followthe recommendation of Bai and Ng (2004) and use the criterion
IC1(K) = log(σ2) + K log(
NT
N + T
)N + T
NT,
where σ2 = 1NT
∑Ni=1
∑Tt=2 ∆v2
it and ∆vit is the estimated residual from theprincipal components estimation of the model in first differences.
Fourth, the presence of the common factors make the implementation of Zφ
and Zτ more complicated than the pure break tests since the estimation of thenumber of breaks and factors to be used in computing these statistics will ingeneral depend on each other. In particular, the problem is that the estimationof K requires knowledge of Mi and Tij , whose estimation in turn depends onthe covariance matrix of the regression error in (7) being block-diagonal so thatthe variance in (9) can be correctly estimated. However, this is only true if K
is known.One way to avoid this circular problem is to first estimate K based on J ,
the assumed maximum number of breaks. Given this estimate, the procedure
10

described in Section 4 can then be employed to estimate Mi and Tij . If themaximum number of breaks and common factors are chosen sufficiently large,this procedure will lead to consistent estimates of both breaks and factors, thusensuring consistency of the whole test.
In small samples, however, our simulations suggest that there is a simplethree step procedure available that performs well. The procedure proceeds asfollows. In the first step, the number of breaks and their locations are estimatedas described in Section 4 while disregarding the cross-correlation. The resultingbreak estimates are then used in the second step to estimate the number ofcommon factors. In the third step, the estimated breaks and factors are usedto compute the test statistics. This is the procedure that we shall consider inthe sequel.
Fifth, the Zφ and Zτ statistics are constructed as averages of N individualtime series statistics, and are therefore well-suited for unbalanced panels. TheZφ and Zτ statistics are also based on averaging but involves estimating thefactors and their loadings by the method of principal components, which is notpossible in the unbalanced panel setting. Stock and Watson (1998) discuss somepossibilities for estimating the factors based on unbalanced data. However, theseare computationally burdensome and not very straightforward to implement.To alleviate this, we suggest first truncating the sample at the smallest of theindividual time series and then to run Zφ and Zτ on the resulting balancedpanel.
6 Monte Carlo simulations
To examine the small-sample properties of the panel unit root test, we conducta Monte Carlo experiment similar to the design in Westerlund and Edgerton(2005). The data generating process can be summarized using the followingthree equations
πit = δ′Dit + Uit + γ′DitUit + zit
zit = λ′iFt + vit,
vit = ρvit−1 + eit,
where Uit = Uit−1 + wit, wit ∼ N(0, 1), eit ∼ N(0, 1) and each element in Ft
is distributed as N(0, 1). All initial conditions are set to zero. For simplicity,we assume that the number of breaks and common factors are equal across thepanel so Mi = M and Ki = K for all i. The maximum M and K consideredis two. The locations of the breaks are given by T1 = 0.3T and T2 = 0.7T , andwe use δ = γ = (3, 5)′ to control the break sizes.
The parameter ρ determines whether the null hypothesis is true or not. Aswith δ and γ, we make the simplifying assumption that this parameter takes on acommon value for all units. Therefore, under the null hypothesis, we have ρ = 1,
11

while ρ < 1 under the alternative hypothesis. The data is generated for 1, 000replications with N cross-sectional and T +50 time series observations. The first50 observations for each cross-section is then disregarded in order to reduce theeffect of the initial conditions. Although we only present the results for quite asmall set of configurations, many additional combinations were considered andare available upon request.
In constructing the panel LM statistics, we follow the recommendation ofZivot and Andrews (1992) and let the order of the lag augmentation increasewith T . In particular, we set p equal to the largest integer less than 4(T/100)2/9.For brevity, we only report the size and size-adjusted power of a nominal 5%level test. The average of the estimated number of breaks and common factorsas well as the correct selection frequencies over the 1, 000 replications are alsoreported. The maximum number of breaks and common factors are both setequal to five, which is a quite common choice in the literature (see, e.g. Bai andNg, 2004). All computational work is performed in GAUSS.
The simulation results are organized according to whether there are anycommon factors present or not. In the first experiment, we keep K = 0 fixedand allow M to vary, while, in the second experiment, we fix M = 1 andinstead consider varying K. The results from the first experiment are reportedin Table 1 for M = 1 and in Table 2 for M = 2. In this case, there is nocross-section dependence and we only consider Zτ and Zφ. Turning first to theresults on the size, we see that the tests generally perform well with empiricalrejection frequencies that lie very close to the nominal 5% level in most cases.Consistent with the results of Westerlund and Edgerton (2005), the overall bestsize accuracy is obtained by using Zτ . As expected, the tests based on theassumption of no break are distorted with sizes that can be up to eight timesthe nominal level.
The results on the power of the tests generally coincide with what might beexpected from the asymptotic theory. First, the power increases faster whileincreasing T rather than N , which is presumably a reflection of the sequentiallimit method used in deriving the tests. Second, the power increases as ρ de-parts form its hypothesized value of one. Third, consistent with the result thatmisplacement of the structural breaks should affect the tests by lowering theirpower, we find that the power is generally increasing in the precision of theestimated breakpoints. Fourth, Zφ is generally more powerful than Zτ . Fifth,the power falls as M increases from one to two, which is to be expected as thisincreases the effective number of parameters that must be estimated from thedata by a factor of N .
As regards the estimation of the number of breaks and their locations, wemake the following observations. First, the best precision, both in terms ofcorrect selection frequency and average of the estimated number of breaks, isgenerally obtained by using the Schwarz criterion. At the other end of the scale,we have the modified Akaike criterion, which seem to have a tendency to overfit
12
the true model and therefore suffers from poor precision. The tests based onthe modified version of the Schwarz criterion lie somewhere in between. Second,increasing M from one to two generally leads to an improvement in the accuracyof the estimated number of breaks. By contrast, the accuracy of the estimatedbreakpoints generally falls as M increases.
Consider next the results obtained from the second experiment, designed toevaluate the properties of Zτ and Zφ. These are presented in Table 3 for thecase when K = 1 and in Table 4 for the case when K = 2. In both cases, sinceN > 5 seem to be required to obtain a decent accuracy of the estimated numberof common factors, the results are reported for N = 10 and N = 15. To inducecorrelation among the cross-sectional units, each element of λi is considered asa draw from N(1, 1).
The size and power results reported in Tables 3 and 4 for the case withcorrelated units are very similar to those reported in Tables 1 and 2 for the casewith independent units. First, the size of the tests are usually quite close tothe nominal 5% level, with Zτ being slightly more accurate than Zφ. Second,the power is typically quite decent and increasing in both N and T . The bestpower is typically obtained by using the Zφ test. Third, although increasing K
from one to two usually increases the dispersion, the number of common factorsis generally estimated with very high precision.
Overall, the simulations lead us to the conclusion that the tests perform wellin general with reasonable power and small size distortions in most cases. Thesimulations also suggest that the breaks and common factors can be estimatedwith good precision.
7 Empirical results
In this section we empirically test the Barro-Gordon model using the same dataset used by Doyle and Falk (2004). It consists of quarterly observations forthe unemployment rate and the rate of inflation as measured by the percentagechange in the consumer price index. Both variables are taken from the OECDdatabase. The panel is unbalanced and covers 13 OECD countries over theperiod 1964 to 2003. The individual sample ranges are reported in Table 7. Formore details on the data, we make reference to Doyle and Falk (2004).
The Barry-Gordon model postulates that if unemployment and inflation arenonstationary processes, then these variables should be cointegrated. Thus, anatural first step in testing the validity of this model is to test whether unem-ployment and inflation are indeed nonstationary. For this purpose, since theunbalanced nature of our data makes panel tests difficult to implement, we em-ploy two time series tests that are both based on taking a unit root as the nullhypothesis. The first is the conventional augmented Dickey-Fuller test while thesecond is the Elliott et al. (1996) test based on GLS demeaning.
The results are reported in Table 5. Different choices of lag augmentation
13

did not change the test results much so we set all lags equal to the largestinteger less than 4(T/100)2/9. The results suggest that the null of a unit rootcan only be rejected on one occasion at the 5% level of significance, for inflationin Sweden. This corroborates the results of Doyle and Falk (2004) suggestingthat unemployment and inflation are nonstationary.
We also performed the Im et al. (2003) panel version of these unit root testswith similar results. In particular, the calculated values of the Ztbar statistic are−1.766 for inflation and −0.669 for unemployment. The corresponding valuesfor the Ztbar statistic are −1.647 and −0.590, respectively. Based on the 1%critical value from the normal distribution, we are unable to reject the unit rootnull. Although easy to implement in our unbalanced panel data environment,these statistics are overly restrictive as they do not permit for correlation amongthe cross-sectional units.
One convenient way to circumvent this problem is to use the bootstrap ap-proach. The particular bootstrap opted for in this paper uses the sieve techniquestudied in Chang and Park (2003), and proceeds as follows. First, if the unitroot test for πit is to be bootstrapped, then compute uit = ∆πit and fit thefollowing p ordered autoregression
uit = δi1uit−1 + ... + δipuit−p + eit.
Second, generate the bootstrap innovations e∗it by resampling with replacementthe centered residual et = et − T−1
∑Tt=1 et, where et = (e1t, ..., eNt)′. Third,
generate the bootstrap innovations u∗it recursively as follows
u∗it = δi1u∗it−1 + ... + δipu
∗it−p + e∗it.
Finally, obtain the bootstrap sample π∗it by recumulating u∗it as π∗it =∑t
k=1 u∗ik.The bootstrapped 1% critical values for Ztbar based on 1,000 replications andthe same lag order used before are −1.878 for inflation and −2.775 for unemploy-ment. The corresponding values for Ztbar are −1.682 and −2.572, respectively.Thus, the conclusions are not altered by taking the cross-sectional correlationinto account.
Therefore, since the variables appear to be nonstationary, we proceed bytesting whether they are cointegrated. As in the unit root analysis, we begin byconsidering the evidence on the individual country level. To this end, we employthe well-known Zt and Zα tests developed by Phillips and Ouliaris (1990), whichtake no cointegration as the null hypothesis. Both tests are based on a constantas the deterministic component. The results are presented in Table 5.
In agreement with the results obtained by Doyle and Falk (2004), we seethat the null hypothesis can only be rejected on two occasions at the 1% levelwhen using the Zt test and on five occasions when using the Zφ test. Thus, theresults suggest that the Barro-Gordon model does not hold.
However, as pointed out in the introduction, there are many reasons tobelieve that this type of time series tests suffer from deficient power. First,
14

the errors from the estimated cointegration regression may be highly persistent,which makes it difficult to separate the null from the alternative hypothesis.Second, the individual time series dimensions are quite small and may not beinformative enough to reject the null. Third, the parameters of the cointegrationrelation may not be constant over time, which, as explained in the introduction,makes the tests biased towards the null.
For these reasons, we now provide some evidence based on panel data. Webegin by considering the results obtained by using the Zτ and Zφ tests developedin Section 3, which, as pointed out in Section 5, are well-suited for unbalancedpanels. The results, based on a maximum of five breaks, are presented in Table6. It is seen that the null of no cointegration can be rejected on all conventionallevels of significance, which indicate that the Barro-Gordon model holds.
Table 7 reports the estimated breakpoints for each country based on ourthree criteria. Results reveal that in most cases all three criteria produce al-most similar results with all breaks occurring within the period 1971 to 1999.From an historical point of view, this seems very reasonable with events such asoil price shocks in the 1970s and the formation of European Monetary Systemin the 1990s. Moreover, it is worth mentioning that although no break is foundfor Canada and Germany when using the Schwarz criterion, at least one break isdocumented when applying the more powerful modified Akaike and Schwarz cri-teria. As pointed out by Ng and Perron (2001), compared to most conventionalselection rules, the modified criteria are evidently more robust when the regres-sion errors are highly persistent and therefore also more powerful in detectingpotential breakpoints.
The results presented for Zτ and Zφ suggest that the Barro-Gordon modelholds. However, as we expect there to be at least some correlation between theindividual countries, inference based on these tests may be unreliable. To get afeeling of the size of the cross-sectional dependence problem in the OECD data,we computed the cross-sectional correlation matrix of the least squares residualsobtained from the estimated cointegration regression. The results presented inTable 8 suggest that the independence assumption may not hold and that thereis a need to allow for correlation among the cross-sectional units. Therefore, wenow employ the Zτ and Zφ tests developed in Section 5.
As in Section 4, the maximum number of breaks used in computing thestatistics is set equal to five. The estimation of the number of common factorsalways resulted in the maximum value. Therefore, in interest of parsimony,we restrict the maximum number of factors to three, which should be enoughto capture most of the cross-sectional dependence in the errors. The resultsreported in Table 6 suggest that we are able to reject the null hypothesis at the5% level of significance in all but two cases, which is seen to corroborate ourresults based on Zτ and Zφ. Note also that these tests are based on truncatingthe sample to obtain a balanced panel. Thus, since we are essentially throwingaway information here, the smaller values of the observed test statistics are not
15

unexpected.In addition, it is tempting, particularly given the results from the more
straightforward setting considered in Section 3, to conclude that the effects ofcross-sectional dependency on Zτ and Zφ are small, and that inference basedon these tests are not misleading. To check whether this is in fact the case, weperformed a small set of Monte Carlo simulations based on the data generatingprocess used in Section 6 to perform the second experiment. For convenience,the data is generated with a single factor, in which case the correlation betweenzit and zkt for i 6= k is given by λ2(1 + λ2)−1 if we assume that λi = λ forall i. Now, the largest correlation between zit and zkt based on Table 8 is0.53, which suggests that the calibration with λ = 1 should be relevant in ourcase. The results presented in Table 9 indicate that the effects of cross-sectionaldependence on the tests should be small, especially for those tests that arebased on the modified Schwarz criterion, and that inference based on Zτ andZφ therefore should be quite accurate.
Consequently, since the variables appear to be nonstationary and cointe-grated, we conclude that the time-varying parameter version of the Barro-Gordon model holds.
8 Conclusions
As argued by Doyle and Falk (2004), since inflation in many OECD countrieshave followed similar paths over the past 40 years, it seem reasonable to lookfor a common explanation of this common long-run trend. The Barro-Gordonmodel of monetary policy provides a natural starting point. The basic idea isthat the central bank, being unable to commit to its policy rule, will try to bringunemployment closer to its natural rate by creating surprise inflation. However,rational agents will anticipate this and adjust their decisions accordingly. Theimplication is that any long-run trend in unemployment will induce similartrends in inflation, which can be tested using cointegration analysis.
Although earlier studies suggest that the model can successfully explain thebehavior of inflation in United States, it has not been able to provide an ade-quate explanation for the same phenomenon in the OECD area. Doyle and Falk(2004) argue that this might be due to changing economic conditions causingthe parameters of the model to become time-varying.
In this paper, we test whether this is in fact the case. We do this is byproposing two new panel cointegration tests that allow for an unknown numbershifts under the alternative hypothesis. The asymptotic distributions of thetests are derived in the case when the members of the panel are independentand when they are not. Monte Carlo results are also provided to suggest that thetests generally perform well with small distortions and good power in samplesof realistic size.
In the empirical part of the paper, we demonstrate that a failure to reject the
16

null hypothesis of no cointegration for an individual country need not be takenas evidence against the Barro-Gordon model, and that the new panel basedtests can deliver more accurate results. In particular, the results suggest thatthe model holds once the structural breaks have been appropriately accountedfor.
17
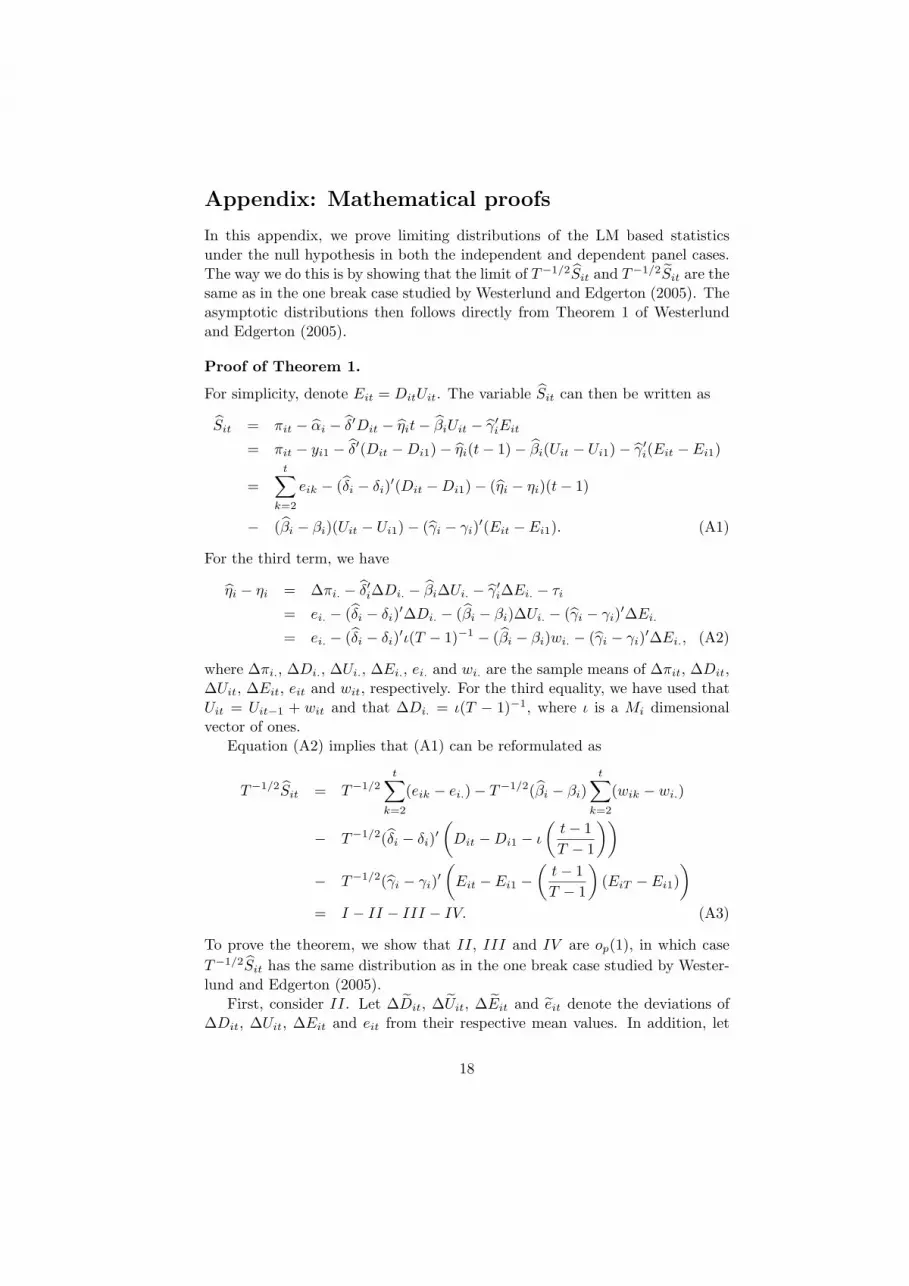
Appendix: Mathematical proofs
In this appendix, we prove limiting distributions of the LM based statisticsunder the null hypothesis in both the independent and dependent panel cases.The way we do this is by showing that the limit of T−1/2Sit and T−1/2Sit are thesame as in the one break case studied by Westerlund and Edgerton (2005). Theasymptotic distributions then follows directly from Theorem 1 of Westerlundand Edgerton (2005).
Proof of Theorem 1.
For simplicity, denote Eit = DitUit. The variable Sit can then be written as
Sit = πit − αi − δ′Dit − ηit− βiUit − γ′iEit
= πit − yi1 − δ′(Dit −Di1)− ηi(t− 1)− βi(Uit − Ui1)− γ′i(Eit − Ei1)
=t∑
k=2
eik − (δi − δi)′(Dit −Di1)− (ηi − ηi)(t− 1)
− (βi − βi)(Uit − Ui1)− (γi − γi)′(Eit − Ei1). (A1)
For the third term, we have
ηi − ηi = ∆πi. − δ′i∆Di. − βi∆Ui. − γ′i∆Ei. − τi
= ei. − (δi − δi)′∆Di. − (βi − βi)∆Ui. − (γi − γi)′∆Ei.
= ei. − (δi − δi)′ι(T − 1)−1 − (βi − βi)wi. − (γi − γi)′∆Ei., (A2)
where ∆πi., ∆Di., ∆Ui., ∆Ei., ei. and wi. are the sample means of ∆πit, ∆Dit,∆Uit, ∆Eit, eit and wit, respectively. For the third equality, we have used thatUit = Uit−1 + wit and that ∆Di. = ι(T − 1)−1, where ι is a Mi dimensionalvector of ones.
Equation (A2) implies that (A1) can be reformulated as
T−1/2Sit = T−1/2t∑
k=2
(eik − ei.)− T−1/2(βi − βi)t∑
k=2
(wik − wi.)
− T−1/2(δi − δi)′(
Dit −Di1 − ι
(t− 1T − 1
))
− T−1/2(γi − γi)′(
Eit − Ei1 −(
t− 1T − 1
)(EiT − Ei1)
)
= I − II − III − IV. (A3)
To prove the theorem, we show that II, III and IV are op(1), in which caseT−1/2Sit has the same distribution as in the one break case studied by Wester-lund and Edgerton (2005).
First, consider II. Let ∆Dit, ∆Uit, ∆Eit and eit denote the deviations of∆Dit, ∆Uit, ∆Eit and eit from their respective mean values. In addition, let
18

∆UXit = ∆Uit −X ′
itbi and eXit = eit −X ′
itai be the errors from projecting ∆Uit
and eit, respectively, onto Xit = (∆D′it, ∆E′
it)′, which is a generic vector of
projection variables. In this notation, T 1/2(βi − βi) can be written as
T 1/2(βi − βi) =
(T−1
T∑t=2
∆UX2it
)−1
T−1/2T∑
t=2
∆UXit eX
it . (A4)
The denominator of this expression can be expanded as
T−1T∑
t=2
∆UX2it = T−1
T∑t=2
∆U2it − T−1
T∑t=2
∆UitX′it
·(
T−1T∑
t=2
XitX′it
)−1
T−1T∑
t=2
Xit∆Uit. (A5)
For the second term in (A5), we have
T−1T∑
t=2
Xit∆Uit = T−1T∑
t=2
(∆Dit∆Uit
∆Eit∆Uit
).
Now, since ∆Dit equals one only at one point, it is obvious that all sums in-volving ∆Dit must be op(1) when normalized by T−1/2 or T−1. Hence, we candeduce that T−1
∑Tt=2 ∆Dit∆Uit must be op(1). Next, consider the second term
of T−1∑T
t=2 Xit∆Uit. Element j of the vector ∆Eit equals ∆Uit if t > Tij andzero otherwise. Thus, element j of T−1
∑Tt=2 ∆Eit∆Uit converges in probabil-
ity to the variance of ∆Uit, Ωi say, as T −→ ∞ if t > Tij and zero otherwise.Hence, we have that T−1
∑Tt=2 Xit∆Uit = Op(1).
Next, consider T−1∑T
t=2 XitX′it. This term can be written as
T−1T∑
t=2
XitX′it = T−1
T∑t=2
(∆Dit∆D′
it ∆Dit∆E′it
∆Eit∆D′it ∆Eit∆E′
it
).
By using the above results, all elements except T−1∑T
t=2 ∆Eit∆E′it are op(1).
As for T−1∑T
t=2 ∆Eit∆E′it, similarly to T−1
∑Tt=2 ∆Eit∆Uit, the probability
limit of the element appearing in row k and column j of this matrix is equal to Ωi
if t > max(Tik, Tij) and zero otherwise. Thus, it follows that T−1∑T
t=2 XitX′it
must be Op(1).For the denominator of (A4), we have
T−1/2T∑
t=2
∆UXit eX
it = T−1/2T∑
t=2
∆Uiteit − T−1T∑
t=2
∆UitX′it
·(
T−1T∑
t=2
XitX′it
)−1
T−1/2T∑
t=2
Xiteit. (A6)
19

Since eit and wit are independent by assumption, T−1∑T
t=2 Xiteit converges tozero in probability while T−1/2
∑Tt=2 ∆Uiteit = Op(1) by standard central limit
arguments. Hence, T−1/2∑T
t=2 ∆UXit eX
it = Op(1) implying that T 1/2(βi − βi)must be Op(1) too.
By using the fact that T 1/2(βi − βi) = Op(1), and since T−1/2∑t
k=2(wik −wi.) = Op(1) by the multivariate invariance principle, we can show that
II = T 1/2(βi − βi)T−1t∑
k=2
(wik − wi.)
= Op(1) · op(1).
Next, consider III. To this end, denote ∆DXit = ∆Dit − X ′
itbi and eXit =
eit −X ′itai, where Xit = (∆Uit, ∆E′
it)′. In this case T 1/2(δi − δi) becomes
T 1/2(δi − δi) =
(T−1
T∑t=2
∆DXit ∆DX′
it
)−1
T−1/2T∑
t=2
∆DXit eX
it . (A7)
The denominator in (A7) is given by
T−1T∑
t=2
∆DXit ∆DX′
it = T−1T∑
t=2
∆Dit∆D′it − T−1
T∑t=2
∆DitX′it
·(
T−1T∑
t=2
XitX′it
)−1
T−1T∑
t=2
Xit∆D′it.
It is clear that both T−1∑T
t=2 ∆Dit∆D′it and T−1
∑Tt=2 Xit∆D′
it are op(1). Asfor T−1
∑Tt=2 XitX
′it, we have
T−1T∑
t=2
XitX′it = T−1
T∑t=2
(∆U2
it ∆Uit∆E′it
∆Eit∆Uit ∆Eit∆E′it
).
By using the same arguments used before, it is obvious that the limit of eachelement in this matrix involves the term Ωi, which implies that T−1
∑Tt=2 XitX
′it
must be Op(1). Hence, we can show that T−1∑T
t=2 ∆DXit ∆DX′
it = op(1)For the numerator of (A7), we have
T−1/2T∑
t=2
∆DXit eX
it = T−1/2T∑
t=2
∆Diteit − T−1/2T∑
t=2
∆DitX′it
·(
T−1T∑
t=2
XitX′it
)−1
T−1T∑
t=2
Xiteit.
20

This expression is clearly op(1), which implies that T 1/2(δi − δi) is op(1) too.From this result, we deduce that
III = T 1/2(δi − δi)′(
T−1(Dit −Di1)− ι
(t− 1
T (T − 1)
))
= Op(1) · op(1).
Finally, consider IV . We have
T 1/2(γi − γi) =
(T−1
T∑t=2
∆EXit ∆EX′
it
)−1
T−1/2T∑
t=2
∆EXit eX
it , (A8)
where Xit = (∆Uit, ∆D′it)′, ∆EX
it = ∆Eit −X ′itbi and eX
it = eit −X ′itai. As in
(A5), the denominator can be expanded as
T−1T∑
t=2
∆EXit ∆EX′
it = T−1T∑
t=2
∆Eit∆E′it − T−1
T∑t=2
EitX′it
·(
T−1T∑
t=2
XitX′it
)−1
T−1T∑
t=2
XitE′it.
By using the results derived earlier, it should be obvious that both terms onthe right hand side of this expression are Op(1) so that T−1
∑Tt=2 ∆EX
it ∆E′it is
Op(1) too.The denominator of (A8) is qual to
T−1/2T∑
t=2
∆EXit eX
it = T−1/2T∑
t=2
∆Eiteit − T−1/2T∑
t=2
∆EitX′it
·(
T−1T∑
t=2
XitX′it
)−1
T−1T∑
t=2
Xiteit.
In this expression, the terms with normalizing order T−1/2 are Op(1) by stan-dard arguments for stationary processes. Therefore, since T−1
∑Tt=2 ∆Xiteit =
op(1) and T−1∑T
t=2 XitX′it = Op(1), we can deduce that T−1/2
∑Tt=2 ∆EX
it eXit =
Op(1), from which it follows that T 1/2(γi − γi) = Op(1).This shows that IV must be op(1) as seen by writing
IV = T 1/2(γi − γi)′(
T−1(Eit − Ei1)−(
t− 1T (T − 1)
)(EiT − Ei1)
)
= Op(1) · op(1).
We thus shown that II, III and IV are op(1), which completes the proof. ¥
Proof of Theorem 2.
21

Define F1 = 0. Analogous to (A1), we have
Sit = πit − yi1 − δ′(Dit −Di1)− ηi(t− 1)− βi(Uit − Ui1)
− γ′i(Eit − Ei1)− λ′iFt
=t∑
k=2
eik − (δi − δi)′(Dit −Di1)− (ηi − ηi)(t− 1)− (βi − βi)(Uit − Ui1)
− (γi − γi)′(Eit − Ei1)− λ′iFt + λ′i(Ft − F1). (A9)
The third term in this expression can be written as
ηi − ηi = ei. − (δi − δi)′ι(T − 1)−1 − (βi − βi)wi. − (γi − γi)′∆Ei.
− λ′i∆F. + λ′i∆F., (A10)
where ∆F. and ∆F. denote the sample means of ∆Ft and ∆Ft, respectively. Byusing (A10), the expression in (A9) can be written as
T−1/2Sit = T−1/2t∑
k=2
(eik − ei.)− T−1/2(βi − βi)t∑
k=2
(wik − wi.)
− T−1/2(δi − δi)′(
Dit −Di1 − ι
(t− 1T − 1
))
− T−1/2(γi − γi)′(
Eit − Ei1 −(
t− 1T − 1
)(EiT − Ei1)
)
− T−1/2(λi − λi)′(
Ft −(
t− 1T − 1
)FT
)
+ T−1/2λ′i
((Ft − Ft)− F1 −
(t− 1T − 1
)((FT − FT )− F1)
)
= I − II − III − IV − V + V I. (A11)
As with Theorem 1, proving Theorem 2 requires showing that II, III, IV , V
and V I are op(1). Parts II, III and IV are immediate consequences of theproof of Theorem 1 and are thus omitted.
Consider parts V and V I. As explained in the text, although in a different setof notations, the model in first differences can be written as ∆πX
it = λ′i∆FXt +
∆vXit , where ∆πX
it , ∆FXt and ∆vX
it are the errors obtained by projecting themean deviations ∆πit, ∆Ft and ∆vit on Xit = (∆D′
it,∆E′it, ∆Uit)′. Now, to
prove that V and V I are op(1), we begin by showing that T−1/2 times theestimated common factor is equal to T−1/2Ft plus a term that is asymptoticallynegligible.
22

The estimated common factor can be written as
T−1/2Ft = T−1/2t∑
k=2
∆FXk
= T−1/2t∑
k=2
∆Fk
− T−1T∑
t=2
∆FtX′it
(T−1
T∑t=2
XitX′it
)−1
T−1/2t∑
k=2
Xit. (A12)
It is easily seen that T−1/2∑t
k=2 Xit = Op(1), while T−1∑T
t=2 XitX′it can be
written as
T−1T∑
t=2
XitX′it = T−1
T∑t=2
∆Dit∆D′it ∆Dit∆E′
it ∆Dit∆Uit
∆Eit∆D′it ∆Eit∆E′
it ∆Eit∆Uit
∆Uit∆D′it ∆Uit∆E′
it ∆U2it
.
By using the same arguments used in the proof of Theorem 1, we deduce thatall elements involving ∆Dit must be op(1), while the remaining terms are Op(1).
For the last term in (A12), we have
T−1T∑
t=2
∆FtX′it = T−1
T∑t=2
(∆Ft∆D′
it, ∆Ft∆E′it, ∆Ft∆Uit
).
Since ∆Uit and ∆Ft are orthogonal by assumption, we have T−1∑T
t=2 ∆FtX′it =
op(1).The common factor Ft can only be identified up to a scale matrix H, say.
Therefore, what is being considered here is the rotation HFt of Ft. To this end,let ∆Ft = H∆Ft + vt. Equation (A12) can now be written as
T−1/2Ft = T−1/2t∑
k=2
∆FXk
= T−1/2t∑
k=2
∆Fk −Op(1) ·Op(1) · op(1)
= T−1/2t∑
k=2
H∆Fk + T−1/2t∑
k=2
vk + op(1). (A13)
The second term in (A13) is op(1) by Lemma B.2 of Bai and Ng (2004). Forthe first term, we have
T−1/2t∑
k=2
∆Fk = Ft − F1
= Ft −∆F. − (F1 −∆F.)
= Ft − F1.
23

Therefore, (A13) reduces to
T−1/2Ft = T−1/2H(Ft − F1) + op(1)
= T−1/2HFt + op(1), (A14)
where F1 = Op(1) as in Lemma B.2 of Bai and Ng (2004).Now, consider V . By using (A14), this term can be written as
V = T−1/2(λi − λi)′(
Ft −(
t− 1T − 1
)FT
)
= T 1/2(λi − λi)′T−1H
(Ft −
(t− 1T − 1
)FT
)+ op(1)
= Op(1) · op(1) + op(1), (A15)
where T 1/2(λi − λi) = Op(1) follows from Lemma 1 of Bai and Ng (2004) andT−1H(Ft − t−1
T−1FT ) = op(1) regardless of whether Ft is stationary of not.Similarly, (A14) implies that V I can be written as
V I = T−1/2λ′i
((Ft − Ft)− F1 −
(t− 1T − 1
)((FT − FT )− F1)
)
= T−1/2λ′i
(t− T
T − 1
)F1 + op(1)
= op(1) ·Op(1) + op(1). (A16)
Equations (A15) and (A16) imply that V and V I are op(1). Hence, since II,III and IV are also op(1), we can show that T−1/2Sit has the same asymptoticas T−1/2Sit in Theorem 1. ¥
24

Tab
le1:
Sim
ulat
ion
resu
lts
for
the
first
expe
rim
ent
whe
nM
=1
5%
Rej
ecti
on
freq
uen
cyP
(M=
M)
Aver
age
MP
(T1
=T
1)
ρN
TSB
CM
BC
MA
CT
RU
NO
BSB
CM
BC
MA
CSB
CM
BC
MA
CSB
CM
BC
MA
C
Tes
tst
ati
stic
:Z
τ
1.0
05
100
7.4
3.2
4.0
6.0
21.0
78.1
64.8
46.1
1.3
1.4
1.6
74.3
59.6
43.8
1.0
010
100
7.2
2.4
3.4
6.4
33.6
80.0
65.7
46.6
1.2
1.4
1.6
76.2
59.1
43.4
1.0
05
200
5.4
2.2
3.6
4.6
23.2
85.1
72.4
44.4
1.2
1.3
1.7
82.6
69.2
42.8
1.0
010
200
6.8
2.2
3.8
5.6
33.0
86.3
70.1
44.4
1.1
1.3
1.7
83.5
66.2
42.7
0.9
55
100
21.0
17.8
19.2
22.8
6.0
80.0
62.3
44.2
1.2
1.4
1.7
76.1
55.5
40.8
0.9
510
100
34.4
27.8
27.4
36.6
6.2
81.9
62.4
46.1
1.2
1.4
1.6
77.5
55.5
42.8
0.9
55
200
79.4
77.0
80.4
82.6
9.4
87.2
61.7
40.5
1.1
1.4
1.7
84.0
56.3
38.8
0.9
510
200
92.2
91.2
91.6
93.6
6.2
87.7
61.9
41.8
1.1
1.4
1.7
84.6
55.8
39.5
0.9
05
100
57.2
43.0
43.8
57.8
8.2
81.4
56.8
41.2
1.2
1.5
1.7
77.2
48.6
37.4
0.9
010
100
84.2
72.4
73.2
86.8
10.6
82.2
55.2
40.9
1.2
1.5
1.7
77.9
46.4
37.2
0.9
05
200
99.8
99.2
99.0
99.8
12.0
87.7
48.4
35.4
1.1
1.6
1.8
84.3
40.0
32.3
0.9
010
200
100.0
100.0
100.0
100.0
10.0
87.3
48.3
34.7
1.1
1.6
1.8
84.1
41.2
32.2
Tes
tst
ati
stic
:Z
φ
1.0
05
100
6.2
2.4
3.0
4.0
25.8
79.9
66.6
47.0
1.2
1.4
1.6
75.8
60.1
43.9
1.0
010
100
13.4
3.8
5.6
12.8
39.0
78.6
65.9
46.3
1.3
1.4
1.6
74.8
59.8
43.4
1.0
05
200
8.0
4.0
5.6
7.6
23.0
84.6
71.8
46.1
1.2
1.3
1.7
81.6
67.9
44.7
1.0
010
200
9.2
3.6
5.2
8.0
35.6
84.7
69.8
45.2
1.2
1.3
1.7
81.4
65.6
43.1
0.9
55
100
37.4
28.4
28.0
36.2
4.8
80.1
61.0
44.2
1.2
1.4
1.7
75.4
53.4
40.6
0.9
510
100
28.0
31.4
31.8
31.6
8.0
81.1
62.2
44.8
1.2
1.4
1.7
76.9
54.8
41.3
0.9
55
200
77.4
74.6
75.6
77.2
9.2
87.7
62.7
42.5
1.1
1.4
1.7
84.6
56.1
39.8
0.9
510
200
96.0
96.2
95.6
95.8
8.8
88.7
61.5
42.2
1.1
1.4
1.7
85.5
56.2
40.0
0.9
05
100
79.4
75.4
73.2
84.0
5.6
82.7
56.3
42.6
1.2
1.5
1.7
78.5
47.6
38.9
0.9
010
100
89.4
88.4
89.2
91.6
10.2
81.0
55.1
41.1
1.2
1.5
1.7
76.5
46.8
37.4
0.9
05
200
100.0
100.0
99.6
100.0
14.6
86.8
47.4
33.8
1.1
1.6
1.8
83.2
38.6
30.7
0.9
010
200
100.0
100.0
100.0
100.0
16.0
87.6
48.4
34.7
1.1
1.6
1.8
84.5
40.9
32.5
Note
s:T
he
valu
esT
1and
T2
refe
rsto
the
esti
mate
dbre
akpoin
ts,ρ
refe
rsto
the
auto
regre
ssiv
epara
met
erand
Mre
fers
toth
ees
tim
ate
dnum
ber
ofbre
aks.
The
abbre
via
tions
SB
C,M
BC
and
MA
Cre
fer
toth
ete
stbase
don
the
Sch
warz
,m
odifi
edSch
warz
and
modifi
ed
Aka
ike
crit
eria
,re
spec
tivel
y.A
lso,N
OB
refe
rsto
the
test
base
don
no
bre
ak
and
TR
Ure
fers
toth
ete
stbase
don
the
true
bre
akpoin
t.
25

Tab
le2:
Sim
ulat
ion
resu
lts
for
the
first
expe
rim
ent
whe
nM
=2
5%
Rej
ecti
on
freq
uen
cyP
(M=
M)
Aver
age
MP
(T1
=T
1,T
2=
T2)
ρN
TSB
CM
BC
MA
CT
RU
NO
BSB
CM
BC
MA
CSB
CM
BC
MA
CSB
CM
BC
MA
C
Tes
tst
ati
stic
:Z
τ
1.0
05
100
6.4
3.6
5.2
7.4
10.0
87.6
80.7
83.3
2.1
2.0
2.1
50.0
43.6
44.8
1.0
010
100
6.8
3.8
4.6
7.6
16.8
88.6
82.9
84.0
2.1
2.0
2.1
51.6
45.2
45.9
1.0
05
200
8.0
6.6
7.4
8.4
11.8
95.9
91.6
83.5
2.0
2.1
2.2
61.2
54.0
49.0
1.0
010
200
6.0
3.4
4.8
6.6
14.8
95.8
91.6
83.2
2.0
2.1
2.2
61.8
55.2
49.6
0.9
55
100
12.6
12.4
12.0
20.6
7.2
88.5
82.2
82.4
2.1
2.0
2.1
52.0
44.1
45.2
0.9
510
100
22.6
19.4
24.8
31.4
3.8
89.6
82.7
84.0
2.1
2.0
2.1
53.1
44.8
46.8
0.9
55
200
44.8
40.4
43.6
62.4
8.2
96.9
91.0
81.8
2.0
2.1
2.2
63.6
52.6
48.3
0.9
510
200
75.2
73.2
76.0
92.2
8.8
96.8
89.6
81.4
2.0
2.1
2.2
62.1
50.6
46.9
0.9
05
100
32.6
28.4
29.8
49.4
7.8
90.6
83.2
84.3
2.1
2.0
2.1
53.6
41.6
44.7
0.9
010
100
55.0
41.2
54.6
81.4
4.6
89.7
80.6
82.0
2.1
2.0
2.1
53.6
41.9
44.3
0.9
05
200
84.4
75.4
80.8
99.8
9.6
95.8
86.6
78.3
2.0
2.1
2.2
61.5
45.1
43.7
0.9
010
200
97.6
96.6
97.6
100.0
8.4
97.0
86.3
79.4
2.0
2.1
2.2
63.1
45.2
44.7
Tes
tst
ati
stic
:Z
φ
1.0
05
100
8.6
5.8
6.8
8.4
17.6
87.8
82.3
82.8
2.1
2.0
2.1
50.7
44.8
45.2
1.0
010
100
9.2
4.4
6.8
9.0
21.4
88.4
84.0
84.5
2.1
2.0
2.1
50.9
45.3
45.8
1.0
05
200
5.2
4.0
5.2
5.6
11.8
96.3
91.9
82.2
2.0
2.1
2.2
62.7
55.1
49.1
1.0
010
200
6.4
5.2
5.4
7.8
19.6
96.1
91.7
82.9
2.0
2.1
2.2
62.5
54.8
49.9
0.9
55
100
19.6
13.2
15.0
22.2
4.2
89.9
82.0
83.9
2.1
2.0
2.1
53.0
44.0
45.8
0.9
510
100
26.4
23.8
23.2
40.2
8.2
89.2
82.8
83.6
2.1
2.0
2.1
52.1
44.2
45.5
0.9
55
200
56.4
52.0
55.0
78.2
8.6
96.2
89.5
80.9
2.0
2.1
2.2
61.2
50.5
46.4
0.9
510
200
75.2
72.6
76.6
94.8
7.4
97.0
89.9
81.9
2.0
2.1
2.2
63.4
51.4
47.9
0.9
05
100
49.4
37.2
43.6
66.6
5.4
88.8
82.8
83.1
2.1
2.0
2.1
51.8
41.7
44.2
0.9
010
100
73.0
60.2
65.4
93.2
9.4
89.4
80.1
81.8
2.1
2.0
2.1
51.4
38.8
42.5
0.9
05
200
94.4
89.8
92.0
100.0
9.0
96.8
86.6
78.6
2.0
2.1
2.2
63.5
46.1
44.0
0.9
010
200
98.4
96.6
98.0
100.0
8.8
96.9
86.5
79.2
2.0
2.1
2.2
62.1
44.2
43.4
Note
s:See
Table
1fo
ran
expla
nati
on
ofth
eva
rious
featu
res
ofth
eta
ble
.
26

Tab
le3:
Sim
ulat
ion
resu
lts
for
the
seco
ndex
peri
men
tw
hen
K=
1
5%
Rej
ecti
on
freq
uen
cyP
(K=
K)
Aver
age
K
ρN
TSB
CM
BC
MA
CE
ST
TR
USB
CM
BC
MA
CE
ST
SB
CM
BC
MA
CE
ST
Tes
tst
ati
stic
:Z
τ
1.0
010
100
10.0
3.2
3.4
8.8
9.0
98.2
88.8
95.8
99.2
1.0
1.1
1.0
1.0
1.0
015
100
7.8
1.6
1.6
3.8
3.8
99.6
90.4
98.6
100.0
1.0
1.1
1.0
1.0
1.0
010
200
9.2
3.0
3.8
8.6
8.6
100.0
97.8
99.8
100.0
1.0
1.0
1.0
1.0
1.0
015
200
9.4
1.6
4.2
7.4
7.4
100.0
98.6
100.0
100.0
1.0
1.0
1.0
1.0
0.9
510
100
26.8
23.2
23.2
26.0
25.6
98.8
85.4
96.6
99.6
1.0
1.2
1.0
1.0
0.9
515
100
45.4
33.2
36.6
49.0
49.0
99.6
89.0
98.6
100.0
1.0
1.1
1.0
1.0
0.9
510
200
85.8
79.6
80.0
91.6
91.6
100.0
97.2
99.6
100.0
1.0
1.0
1.0
1.0
0.9
515
200
97.8
93.6
91.8
98.2
98.2
100.0
98.6
100.0
100.0
1.0
1.0
1.0
1.0
0.9
010
100
69.4
51.0
52.6
72.6
71.8
98.4
84.0
96.4
99.4
1.0
1.2
1.0
1.0
0.9
015
100
88.8
75.0
77.0
93.4
93.4
98.8
87.2
98.4
100.0
1.0
1.1
1.0
1.0
0.9
010
200
100.0
99.8
99.8
100.0
100.0
100.0
93.6
99.6
100.0
1.0
1.1
1.0
1.0
0.9
015
200
100.0
100.0
99.8
100.0
100.0
100.0
97.0
99.8
100.0
1.0
1.0
1.0
1.0
Tes
tst
ati
stic
:Z
φ
1.0
010
100
15.2
3.0
6.6
10.8
10.8
98.6
90.2
97.6
99.6
1.0
1.1
1.0
1.0
1.0
015
100
13.4
1.0
4.0
8.4
8.4
100.0
91.4
98.8
100.0
1.0
1.1
1.0
1.0
1.0
010
200
10.8
3.2
7.0
8.8
8.8
100.0
97.6
99.8
100.0
1.0
1.0
1.0
1.0
1.0
015
200
8.8
2.6
4.0
7.4
7.4
99.8
98.0
99.8
100.0
1.0
1.0
1.0
1.0
0.9
510
100
27.4
23.8
20.0
31.4
31.4
98.6
88.6
95.6
99.6
1.0
1.1
1.1
1.0
0.9
515
100
41.6
36.6
39.0
47.8
47.8
99.4
87.2
97.6
100.0
1.0
1.1
1.0
1.0
0.9
510
200
89.0
81.6
77.2
92.8
92.8
100.0
96.6
100.0
100.0
1.0
1.0
1.0
1.0
0.9
515
200
99.2
96.8
97.4
98.4
98.4
99.8
98.2
100.0
100.0
1.0
1.0
1.0
1.0
0.9
010
100
85.4
74.0
72.6
90.6
90.4
98.6
85.2
96.4
99.2
1.0
1.2
1.0
1.0
0.9
015
100
96.2
89.6
90.0
98.0
98.0
99.8
89.4
98.2
100.0
1.0
1.1
1.0
1.0
0.9
010
200
100.0
100.0
100.0
100.0
100.0
100.0
95.2
99.8
100.0
1.0
1.1
1.0
1.0
0.9
015
200
100.0
100.0
100.0
100.0
100.0
100.0
95.8
100.0
100.0
1.0
1.0
1.0
1.0
Note
s:T
he
valu
eK
refe
rsto
the
esti
mate
dnum
ber
ofco
mm
on
fact
ors
.A
sin
Table
1,th
eabbre
via
tions
SB
C,M
BC
and
MA
Cre
fer
toth
ein
form
ati
on
crit
erio
nuse
dto
esti
mate
the
bre
aks.
Thes
eare
all
base
don
esti
mati
ng
the
com
mon
fact
ors
.A
lso,E
ST
refe
rsto
the
test
sbase
don
the
true
bra
kpoin
tsbut
the
esti
mate
dnum
ber
offa
ctors
,w
hile
TR
Ure
fers
toth
ete
sts
base
don
the
true
bre
aks
and
num
ber
offa
ctors
.
27

Tab
le4:
Sim
ulat
ion
resu
lts
for
the
seco
ndex
peri
men
tw
hen
K=
2
5%
Rej
ecti
on
freq
uen
cyP
(K=
K)
Aver
age
K
ρN
TSB
CM
BC
MA
CE
ST
TR
USB
CM
BC
MA
CE
ST
SB
CM
BC
MA
CE
ST
Tes
tst
ati
stic
:Z
τ
1.0
010
100
9.8
2.6
3.0
7.6
6.6
82.0
50.2
66.0
93.0
2.2
2.5
2.3
2.1
1.0
015
100
12.2
1.4
1.6
7.6
9.2
91.4
61.8
85.4
99.6
2.1
2.4
2.1
2.0
1.0
010
200
6.6
3.6
4.0
5.2
6.8
98.2
80.6
95.2
100.0
2.0
2.2
2.0
2.0
1.0
015
200
10.6
1.8
2.2
7.6
10.2
99.8
88.8
99.6
100.0
2.0
2.1
2.0
2.0
0.9
510
100
21.8
20.0
20.6
25.6
31.2
82.4
44.4
67.0
93.8
2.2
2.6
2.3
2.1
0.9
515
100
22.4
17.0
23.4
28.6
30.6
93.8
57.0
86.4
99.6
2.1
2.4
2.1
2.0
0.9
510
200
84.2
57.4
65.0
86.8
89.6
99.0
76.6
93.2
100.0
2.0
2.2
2.1
2.0
0.9
515
200
94.2
79.8
86.2
96.0
94.4
99.6
82.0
97.8
100.0
2.0
2.2
2.0
2.0
0.9
010
100
60.6
36.6
38.6
66.2
74.4
86.4
38.8
64.2
94.6
2.1
2.6
2.4
2.1
0.9
015
100
70.4
42.0
53.2
80.2
82.4
93.8
48.0
85.8
99.6
2.1
2.5
2.1
2.0
0.9
010
200
99.8
86.6
93.4
99.8
100.0
98.8
68.8
95.0
100.0
2.0
2.3
2.1
2.0
0.9
015
200
100.0
97.0
99.0
100.0
100.0
99.4
75.2
98.2
100.0
2.0
2.2
2.0
2.0
Tes
tst
ati
stic
:Z
φ
1.0
010
100
16.0
4.2
5.4
8.6
57.4
81.6
49.0
67.2
94.0
2.2
2.5
2.3
2.1
1.0
015
100
20.6
2.4
4.4
10.8
73.8
92.8
60.4
87.0
99.0
2.1
2.4
2.1
2.0
1.0
010
200
13.6
3.2
5.2
10.0
63.4
98.4
82.8
94.8
99.6
2.0
2.2
2.0
2.0
1.0
015
200
11.4
1.0
3.2
8.4
76.8
99.2
87.0
98.6
100.0
2.0
2.1
2.0
2.0
0.9
510
100
26.8
18.2
17.6
32.6
26.8
80.2
48.0
66.2
92.0
2.2
2.5
2.3
2.1
0.9
515
100
32.4
29.4
20.2
40.6
29.0
92.8
56.4
84.0
100.0
2.1
2.4
2.2
2.0
0.9
510
200
79.0
61.6
68.6
84.0
77.6
98.2
76.8
94.8
99.8
2.0
2.2
2.1
2.0
0.9
515
200
96.2
83.2
87.6
96.6
91.8
99.6
83.4
98.4
100.0
2.0
2.2
2.0
2.0
0.9
010
100
72.4
45.2
51.2
81.6
70.6
84.8
41.8
68.8
95.0
2.2
2.6
2.3
2.1
0.9
015
100
89.2
65.6
62.4
93.2
81.6
95.0
51.8
88.6
99.8
2.1
2.5
2.1
2.0
0.9
010
200
100.0
94.8
98.4
100.0
99.6
98.4
69.2
93.6
100.0
2.0
2.3
2.1
2.0
0.9
015
200
100.0
98.0
100.0
100.0
100.0
99.4
74.0
98.6
100.0
2.0
2.3
2.0
2.0
Note
s:See
Table
s1
and
3fo
ran
expla
nati
on
ofth
eva
rious
featu
res
ofth
eta
ble
.
28

Tab
le5:
Cou
ntry
spec
ific
unit
root
and
coin
tegr
atio
nte
sts
Unit
root
inπ
itU
nit
root
inU
itC
oin
tegra
tion
Countr
yτ µ
GL
Sτ µ
τ µG
LS
τ µZ
tZ
α
Aust
ralia
−1.9
56
−1.9
46
−2.1
75
−0.9
66
−2.0
10
−21.0
41
Aust
ria
−2.1
65
−1.2
86
−0.3
20
0.2
98
−3.6
80
−79.9
07
Canada
−1.9
43
−1.5
80
−2.3
01
−1.2
35
−1.9
78
−17.6
51
Den
mark
−1.8
29
−1.8
15
−2.1
08
−0.7
45
−1.9
92
−22.4
29
Fin
land
−1.5
90
−1.2
47
−2.6
83
−1.8
06
−2.2
43
−23.2
76
Fra
nce
−1.2
20
−1.2
35
−1.7
42
−0.1
51
−1.8
65
−13.2
43
Ger
many
−1.7
97
−1.2
48
−1.5
93
−0.2
53
−2.4
41
−33.6
78
Italy
−1.8
02
−1.7
53
−1.7
31
−0.4
33
−1.9
44
−13.9
72
Japan
−2.0
73
−1.6
85
−0.1
59
0.7
53
−2.5
30
−35.6
80
Norw
ay−1
.458
−1.3
58
−1.6
87
−0.8
42
−2.5
84
−39.7
78
Sw
eden
−3.9
70
−3.5
98
−1.7
88
−1.1
91
−4.6
06
−90.3
64
Unit
edkin
gdom
−1.9
04
−1.8
95
−2.0
02
−1.2
85
−1.9
10
−20.0
61
Unit
edst
ate
s−2
.456
−1.4
26
−2.6
83
−2.4
65
−2.6
54
−23.0
05
Cri
tica
lva
lues
a
10%
−2.5
74
−3.0
66
−17.0
39
5%
−2.8
74
−3.3
65
−20.4
94
1%
−3.4
60
−3.9
62
−28.3
22
Note
s:T
he
stati
stic
τ µG
LS
refe
rsto
the
GLS
base
dunit
root
test
ofE
llio
ttet
al.
(1996)
and
τ µre
fers
toth
eaugm
ente
dD
ickey
-Fuller
test
.T
he
stati
stic
sZ
tand
Zα
refe
rto
the
Phillips
and
Ouliari
s(1
990)
test
s.A
llte
sts
are
base
don
aco
nst
ant
term
and
ala
gord
er
of4(T
/100)2
/9.
aT
he
crit
icalva
lues
are
taken
from
MacK
innon
(1996)
and
Phillips
and
Ouliari
s(1
990).
29

Table 6: Panel cointegration tests
Criterion Zτ Zφ Zτ Zφ
SBC −3.811 −18.143 −2.506 −12.477
MBC −1.823 −11.720 0.918 −3.771
MAC −2.267 −12.822 −0.635 −7.037
Notes: See Table 1 for an explanation of the various criteria.
The tests are computed with the lag length chosen according
to 4(T/100)2/9. The critical values are given by the normal
distribution. The maximum number of breaks and common
factors are set equal to five and three, respectively.
30

Tab
le7:
Sam
ple
rang
ean
des
tim
ated
brea
kpoi
nts
Countr
ySam
ple
range
SB
CM
BC
MA
C
Aust
ralia
1966:3−2
003:3
1992:3
,84:3
,73:1
1992:3
,84:3
,73:1
1992:3
,84:3
,73:1
Aust
ria
1964:1−2
003:3
1998:2
,83:2
1995:4
,83:2
1999:3
,83:2
Canada
1964:1−2
003:3
1999:3
1991:1
,82:4
Den
mark
1970:1−2
003:3
1997:3
,91:3
,75:4
1995:3
,91:3
,75:4
1995:3
,91:3
,75:4
Fin
land
1964:1−2
003:3
1980:4
,73:2
1979:4
,73:2
1985:1
,80:4
,73:2
Fra
nce
1967:4−2
003:3
1998:4
,82:2
,73:4
1976:4
1986:4
,82:2
,73:4
Ger
many
1964:1−2
002:4
1991:2
1991:2
Italy
1964:1−2
003:3
1999:1
,94:3
,80:1
,74:4
1997:3
,80:1
,73:4
1997:3
,80:1
,73:4
Japan
1964:1−2
003:3
1995:3
,73:1
1999:1
,73:1
1999:1
,73:1
Norw
ay1972:1−2
003:3
1984:1
,79:4
1987:1
,79:4
1987:1
,79:4
Sw
eden
1964:1−2
003:3
1999:3
,92:1
,78:1
,73:4
1991:1
,73:4
1991:1
,73:4
Unit
edK
ingdom
1964:1−2
003:3
1995:3
,91:3
,79:2
1992:2
,79:2
1998:2
,91:3
,79:2
Unit
edSta
tes
1964:1−2
003:3
1986:4
,81:3
1990:4
,86:4
,81:3
1990:4
,86:4
,81:3
Note
s:See
Table
1fo
ran
expla
nati
on
ofth
eva
rious
crit
eria
.T
he
bre
akpoin
tsare
esti
mate
dby
min
imiz
ing
the
sum
ofsq
uare
dre
siduals
as
des
crib
edin
the
text.
The
maxim
um
num
ber
ofbre
aks
isfive.
31

Tab
le8:
Est
imat
edcr
oss-
sect
iona
lco
rrel
atio
ns
Countr
y1
23
45
67
89
10
11
12
13
Aust
ralia
1.0
0
Aust
ria
0.1
71.0
0
Canada
0.0
90.0
81.0
0
Den
mark
0.0
10.0
40.2
61.0
0
Fin
land
0.0
40.0
10.3
00.0
81.0
0
Fra
nce
0.2
80.1
10.2
30.2
90.3
41.0
0
Ger
many
0.0
30.4
20.4
80.2
10.1
80.1
61.0
0
Italy
0.2
70.0
40.2
20.4
00.1
00.3
50.1
31.0
0
Japan
0.1
50.0
60.5
30.3
00.1
80.3
40.5
20.2
41.0
0
Norw
ay0.1
70.3
50.2
50.1
70.3
40.1
60.3
70.1
40.1
91.0
0
Sw
eden
0.1
60.2
50.2
20.2
50.2
00.1
00.4
00.2
70.2
00.3
81.0
0
Unit
edK
ingdom
0.1
80.0
30.1
50.2
70.3
40.3
50.1
70.2
30.2
60.2
20.0
11.0
0
Unit
edSta
tes
0.0
20.1
20.4
50.3
30.4
50.3
90.3
80.3
10.2
80.3
20.3
50.2
61.0
0
Note
s:T
he
cross
-sec
tionalco
rrel
ati
ons
was
com
pute
dbase
dth
ere
siduals
obta
ined
from
the
esti
mate
dco
inte
gra
tion
rela
tion
wit
hth
ebre
aks
esti
mate
dusi
ng
the
Sch
warz
crit
erio
n.
32

Table 9: Size of Zτ and Zφ in the presence of a common factor
N T SBC MBC MAC TRU NOB
Test statistic: Zτ
5 100 11.8 4.8 7.2 10.4 15.4
10 100 17.0 8.4 11.8 15.8 25.8
5 200 12.6 8.6 9.8 12.2 18.0
10 200 18.0 10.6 12.8 16.6 29.4
Test statistic: Zφ
5 100 13.4 6.2 9.0 12.6 24.2
10 100 21.8 7.4 12.0 19.4 36.2
5 200 12.2 7.2 10.4 11.4 19.4
10 200 16.2 8.2 12.0 15.8 29.2
Notes: See Table 1 for an explanation of the various features
of the table. The tests are computed as in Section 6 and the
data is generated as explained in Section 7.
33

References
Bai, J. (1997). Estimating multiple breaks one at a time. Econometric Theory13, 315-52.
Bai, J., and Perron, P. (1998). Estimating and testing linear models withmultiple structural changes. Econometrica 66, 47-78.
Bai, J., and Ng, S. (2004). A panic attack on unit roots and cointegration.Econometrica 72, 1127-1177.
Banerjee, A., and Carrion-i-Silvestre, J. L. (2005). Breaking panel data coin-tegration. Mimeo, Universitat de Barcelona.
Barro, R., and Gordon, D. (1983). Rules, discretion and reputation in a modelof monetary policy. Journal of Monetary Economics 12, 101-121.
Breitung, J., and Pesaran, M. H. (2005). Unit roots and cointegration inpanels. Mimeo, University of Cambridge.
Chang, Y., and Park, J. Y. (2003). A Sieve bootstrap for the test of a unitroot, Journal of Time Series Analysis 24, pp. 379-400.
Doyle, M., and Falk, B. L. (2004). Testing commitment models of monetarypolicy: evidence from OECD economies. Working Paper No. 04015, IowaState University.
Elliott, G., Rothenberg, T. J., and Stock, J. H. (1996). Efficient tests for anautoregressive unit root. Econometrica 64, 813-836.
Gregory, A. M., and Hansen, B. E. (1996). Residual-based tests for cointe-gration in models with regime shifts. Journal of Econometrics 70, pp.99-126.
Im, K. S., Peseran, M. H., and Shin, Y. (2003). Testing for unit roots inheterogeneous panels. Journal of Econometrics 115, 53-74.
Ireland, P. (1999). Does the time-inconsistency problem explain the behaviorof inflation in the United States? Journal of Monetary Economics 44,279-291.
Kapetanios, G. (2005). Unit-root testing against the alternative hypothesis ofup to m structural breaks. Journal of Time Series Analysis 26, 123-133.
MacKinnon, J. G. (1996). Numerical distribution functions for unit root andcointegration tests. Journal of Applied Econometrics 11, 601-618.
Ng., S., and Perron, P. (2001). Lag length selection and the construction ofunit root tests with good size and power. Econometrica 69, 1519-1554.
34
Phillips, P. C. B., and Ouliaris, S. (1990). Asymptotic properties of residualbased tests for cointegration. Econometrica 58, pp. 165-193.
Stock, J. H., and Watson, M. W. (1998). Diffusion indexes. NBER WorkingPaper No. W6702.
Westerlund, J., and Edgerton, D. (2005). Panel cointegration tests with de-terministic trends and structural breaks. Working Paper 2005:42, Depart-ment of Economics, Lund University.
Zivot, E., and Andrews, D. W. K. (1992). Further evidence on the great crash,the oil-price shock and the unit-root hypothesis. Journal of Business andEconomics Statistics 10, 251-270.
35
Related Documents


