DISSERTATION As completion of the degree in Industrial Engineering, specialisation in Mechanics Universitat Politècnica de Catalunya (UPC) Escola Tècnica Superior d’Enginyeria Industrial de Barcelona (ETSEIB) Dissertation plan: Erasmus - Lifelong Learning Programme Hosting institution: L'Ecole d'Ingénieurs en Génie des Systémes Industriels (EIGSI), La Rochelle Field of search: Marine Energies Presented by: Oliver BRAVO GORRIZ ____________________________________ Testing Platform for Tidal Turbines ____________________________________ Project director: Yoann BARRANGER Date of delivery: April 20, 2014

Welcome message from author
This document is posted to help you gain knowledge. Please leave a comment to let me know what you think about it! Share it to your friends and learn new things together.
Transcript

DISSERTATION As completion of the degree in
Industrial Engineering, specialisation in Mechanics
Universitat Politècnica de Catalunya (UPC)
Escola Tècnica Superior d’Enginyeria Industrial de Barcelona (ETSEIB)
Dissertation plan: Erasmus - Lifelong Learning Programme
Hosting institution: L'Ecole d'Ingénieurs en Génie des Systémes Industriels (EIGSI), La Rochelle
Field of search: Marine Energies
Presented by:
Oliver BRAVO GORRIZ
____________________________________
Testing Platform for Tidal Turbines
____________________________________
Project director: Yoann BARRANGER
Date of delivery: April 20, 2014


“If you’re not prepared to be wrong,
you’ll never come up with anything original.”
Ken Robinson


Testing platform for tidal turbines
- 5 -
Table of contents
Introduction………...……………………………………………………..……..7
Objectives ...................................................................................................................... 8 1
Scope .............................................................................................................................. 8 2
Background ................................................................................................................... 9 3
3.1 Test conditions ................................................................................................................ 9
3.1.1 The test site .................................................................................................................. 9
3.1.2 Local site considerations in resource assessment at the pre-deployment stage ........... 9
3.1.3 Data measurement of speed and direction at the resource assessment stage ............. 10
3.1.4 Data analysis at the resource assessment stage ......................................................... 10
3.1.5 Transposing between sites and sea areas ................................................................... 10
3.2 Test equipment ............................................................................................................. 10
3.2.1 Electric power ............................................................................................................ 10
3.2.2 Tidal stream and current measurements .................................................................... 11
3.2.3 Seawater density ........................................................................................................ 11
3.2.4 Tidal energy conversion system operational status ................................................... 11
3.3 Measurements procedures for TECS device performance ........................................... 12
3.3.1 Data collection ........................................................................................................... 12
3.3.2 Data issues ................................................................................................................. 12
3.4 Derived results .............................................................................................................. 13
3.4.1 General ...................................................................................................................... 13
3.4.2 Prediction from the power curve from measurements ............................................... 13
3.4.3 Power coefficient ....................................................................................................... 15
Assessment of the offshore location for the platform installation .......................... 17 4
Data gathering ............................................................................................................ 19 5
Tidal technology .......................................................................................................... 23 6
Design of the platform ................................................................................................ 25 7
Simulation 1 ................................................................................................................ 31 8
Simulation 2 ................................................................................................................ 33 9
Structural assessment ................................................................................................. 40 10
Bibliography………...…………………………………...……………….……44

Testing platform for tidal turbines
- 6 -

Testing platform for tidal turbines
- 7 -
Introduction
The project Testing Platform for Tidal Turbines is an ambitious and thorough work which was
undertaken in September 2013 under the intended purpose of following up and complementing a
project arisen in the context of a subject which focuses on the procedure of developing a project from
start to end. Additionally, this provides the engineering students a holistic approach to cope with a
technological need or demand.
The work gathered herein tries to give response to a matter of growing importance all around the
globe, but more precisely in the French region of Poitou-Charente. Such matter is the necessity of
clean energies that gradually replace part of the energy production, which is currently led by nuclear
energy in France.
As regards the previous fact, several coastal regions of France are nowadays fostering their tidal
industry, among others, in order to share the leadership of this energy transformation.
Be that as it may, what are the elements that can contribute to foster the tidal turbine industry in a
certain zone? In all likelihood, such a technological business needs to test their new design and
components to have a feedback that helps to somewhat link the Finite Element Method assessments
with the actual behaviour in a real environment. One of the main troubles when tackling a testing
procedure in fields concerning large machinery such as aeroplanes, hydroelectric turbines, vehicles,
and so forth, consists in the aforementioned size of the elements to be tested. Generally, the costs of
due infrastructure for testing purposes exceed by far the limits which would allow the investment to
have final benefit.
Therefore, the need for a shared testing infrastructure stems from an economic reason, and so happens
in the field that concerns this project, the tidal turbine business. Nowadays, specific projects to build
up new testing sites for tidal turbines are carried out in response to the increasing number of new
companies that need to test their innovative designs, as the tidal technology is still in its first stage,
chronologically speaking.
Additionally, according to the awareness of slow tidal currents around the zone in question which are
not bound to be sufficient, the need of a platform to accelerate the stream velocity is set as initial
hypothesis, even though this is to be verified.
In a nutshell, the Testing Platform for Tidal Turbines project is a feasibility study from a technical
perspective to build a testing site in the Poitou-Charente to foster the tidal energy industry throughout
said zone.

Testing platform for tidal turbines
- 8 -
Objectives 1
The global aim pursued is to develop a platform to perform tests of hydraulic turbines whose purpose
is to convert the kinetic energy of water in movement into electricity. Moreover, the specific
objectives which this project set out to achieve in its origin, as well as the date in which each one was
completed, are stated as follows:
- [10/04/2013] Test procedure. Survey of the main systems and methodologies for data
acquisition and data post-process, taking account of the desired outputs.
- [07/10/2013] Tidal developers and technologies. Evaluation of the current tidal technology
in the market in order to be acquainted with the elements to test and for which the testing
platform has to be designed.
- [07/10/2013] Stream conditions on site. Assessment of the offshore conditions at the coast so
as to find the most adequate location to install the testing platform.
- [12/12/2013] Design, model creation and simulation. Shape the platform and perform a
theoretical and numerical calculation of its hydrodynamic behaviour.
- [22/01/2014] Design and simulation improvement. Once obtained the first results, utilise
them as feedback to ameliorate and enhance the design and simulate closer to real conditions.
- [18/02/2014] Technological feasibility. According to the boundary conditions that have been
set and extreme condition streams, evaluate the hydrodynamic pressure effect in terms of
stress and deformation in the platform.
Scope 2
Taking account of the necessity of restraint in order to focus on definite objectives, the following
points were stated as boundaries of the project:
- The coastal zone to be assessed solely concerns to La Rochelle and surroundings
- The sort of tidal turbines to be tested in the platform fulfils the following characteristics:
Up to 5 meters in rotor diameter
Suitability for pitch movement as well as for fixed axis directions
Environmentally friendly materials and the least sea impact possible

Testing platform for tidal turbines
- 9 -
Background 3
The Tidal Energy Conversion Systems (TECS) are the category of technology whose purpose is to
transform the kinetic and/or potential energy of tides into electricity. Most of these technologies
involve tidal turbines and, therefore, it stands as an essential component in the field.
During the process of design of new TECS in order to be finally launched in the market, it is vital the
stage of testing, data acquisition, redesign and adjustment, mainly in a closed loop so that the final
product is reliable, effective and efficient.
In consequence, in regard to the topic and final goal of this project it is, first of all, necessary to be
acquainted with the TECS testing procedure that is nowadays applied to certify the tidal turbines.
3.1 Test conditions
3.1.1 The test site
A survey of the bathymetry of the test site shall be carried out to ensure that it is free from obstacles
and topology that could affect the performance of the TECS, or adversely affect the local quality of the
tidal currents.
Sub-bottom profiling might also be required in situations where there is a considerable volume of
suspended sediment, or layers of liquefied mud that may affect the device installation.
Bathymetry: the study of underwater depth of lake or ocean floors. In other words, bathymetry is the
underwater equivalent to topography. It usually shows seafloor relief or terrain as contour lines (called
depth contours or isobaths) and selected depths (soundings).
3.1.2 Local site considerations in resource assessment at the pre-deployment stage
The effects of seasonal migration of currents need to be considered (influence upon predicted long-
term power capture). Moreover, tidal stratification might also need to be taken into consideration, and
the scale of its existence and the need to consider it should be inferred from numerical modeling.
Likewise, wave–current interaction also exerts an influence upon the total current resource
(assessment through the application of a suitable nonlinear numerical wave analysis).
Water stratification occurs when water masses with different properties - salinity (halocline),
oxygenation (chemocline), density (pycnocline), temperature (thermocline) - form layers that act as
barriers to water mixing. These layers are normally arranged according to density, with the least dense
water masses sitting above the denser layers. Water stratification also creates barriers to nutrient
mixing between layers.

Testing platform for tidal turbines
- 10 -
3.1.3 Data measurement of speed and direction at the resource assessment stage
The device(s) to be installed shall be capable of recording the temporal variation in horizontal current
velocity vertically throughout the water column. The maximum vertical distance between sampling
levels shall be less than 1m and less than a 10% of the water depth.
3.1.4 Data analysis at the resource assessment stage
A minimum of 20 current velocity constituents is normally expected to be required for the long‑term
prediction of annual energy production to be effective. The time series predicted of current speeds to a
maximum temporal resolution of 10 min.
3.1.5 Transposing between sites and sea areas
At any test location, the proximity of the tidal current measuring device(s) relative to the TECS may
vary.
3.2 Test equipment
Figure 1. Schema of the test equipment for TECS.
3.2.1 Electric power
The net electric power of the TECS shall be measured using a 3- or 2-phase power measurement
device, such as a transducer, and be based upon measurements of current and voltage on each phase.

Testing platform for tidal turbines
- 11 -
As a guide, the full-scale range of the power measurement device needs to be set at -50% to 200% of
the TECS full rated power. All data needs to be periodically reviewed during the test to ensure that the
range limits of the power measurement device have not been exceeded.
The power measurement device shall be mounted as close to the network connection point of the
device (turbine).
3.2.2 Tidal stream and current measurements
It might be helpful to obtain measurements showing the spatial variability of the currents in order to
ascertain an appropriate measure of closeness, for example with an array of in-situ sensors or using a
remote sensing technology.
Measurement device features:
1) Record temporal variation in water depth
2) Record temporal variation in horizontal current velocity profile and the current direction
3) Measure velocity to ±2% or better
4) Suitable recording velocity range with a resolution better than ±0,05%
5) Report discrete samples of the velocity in a proper temporal interval
6) Collect and transmit data at a sampling rate of 2Hz or more
7) The absolute accuracy of the current direction measurements shall be better than ±5 degrees
8) Water level, current speed and direction ensemble data should be reported every 10 min or
less.
9) The record shall be binned at a maximum vertical spatial increment of 1 m (or more) through
the depth of the power capture area.
10) Time stamping shall be to UTC throughout the recording periods(s).
3.2.3 Seawater density
Representative value for the density of seawater (1 025 kg/m3) to be used when there is no substantial
freshwater input in the zone where the TECS is placed.
3.2.4 Tidal energy conversion system operational status
The total number of hours for which the device was available for energy production should be logged
(The non-production of electric power is not a suitable parameter to monitor).

Testing platform for tidal turbines
- 12 -
3.3 Measurements procedures for TECS device performance
3.3.1 Data collection
3.3.1.1 General
The minimum measuring period necessary to reliably define TECS performance shall not in any event
be less than 15 days.
It is desirable to incorporate redundancy in the sensor systems where possible, to allow cross-checks to
be implemented, thus ensuring that data sets do not have to be discarded because of the failure of a
single sensor.
3.3.1.2 Incident resource measurement during TECS deployment
Two bottom-mounted recording devices could be deployed near to the TECS, and located
appropriately up- and downstream of the device, along the line of the major principal axis of the tidal
current. Alternatively, a recording device could be deployed near to the TECS, and located
perpendicular to the TECS along the minor principal axis of the tidal current.
3.3.1.3 Power production measurements
The voltage and current shall be reported as an average over the same averaging period.
The power production data shall be supplied in time stamped format over the measurement period and
simultaneous in date and time with the tidal current resource records, thus enabling direct comparison
between the calculated resource and the power capture of the TECS.
3.3.2 Data issues
3.3.2.1 General
Selected data sets shall be based upon 10 min periods derived from the contiguous measured data.
Data sets shall be excluded from the database under the following circumstances:
- TECS wholly or partially unavailable
- Failure of the test equipment
- Failure of the tidal current resource recording equipment
3.3.2.2 Possible contribution from waves
There may be circumstances in which the tidal currents are at times affected by wave-induced
phenomena, such as the Stokes drift, arising from surface waves of long or moderate period and of
sufficient amplitude to penetrate to the level of the TECS power capture surface. If the site is known to

Testing platform for tidal turbines
- 13 -
be subject to bursts of wave activity of sufficient intensity as to affect the numerical values of the tidal
currents at that level, then it is advisable for a wave measurement instrument with traceable calibration
to be installed at the site, recording at the same time stamp interval as the TECS recording device.
It may also be necessary to consider the influence of the pulsating flow contributed by waves, upon the
performance of the TECS. There may even be flow reversals arising due to waves at times when the
current is weaker and the TECS is still in operation.
3.4 Derived results
3.4.1 General
The power available from the kinetic energy active across the power capture area shall be calculated
from the measured current speeds (average performance velocity) as:
3.4.2 Prediction from the power curve from measurements
3.4.2.1 Method of bins
Examples of power curves (similar to a wind turbine curve):
Figure 2. Representative turbine power curve.
Testing platform for tidal turbines
- 14 -
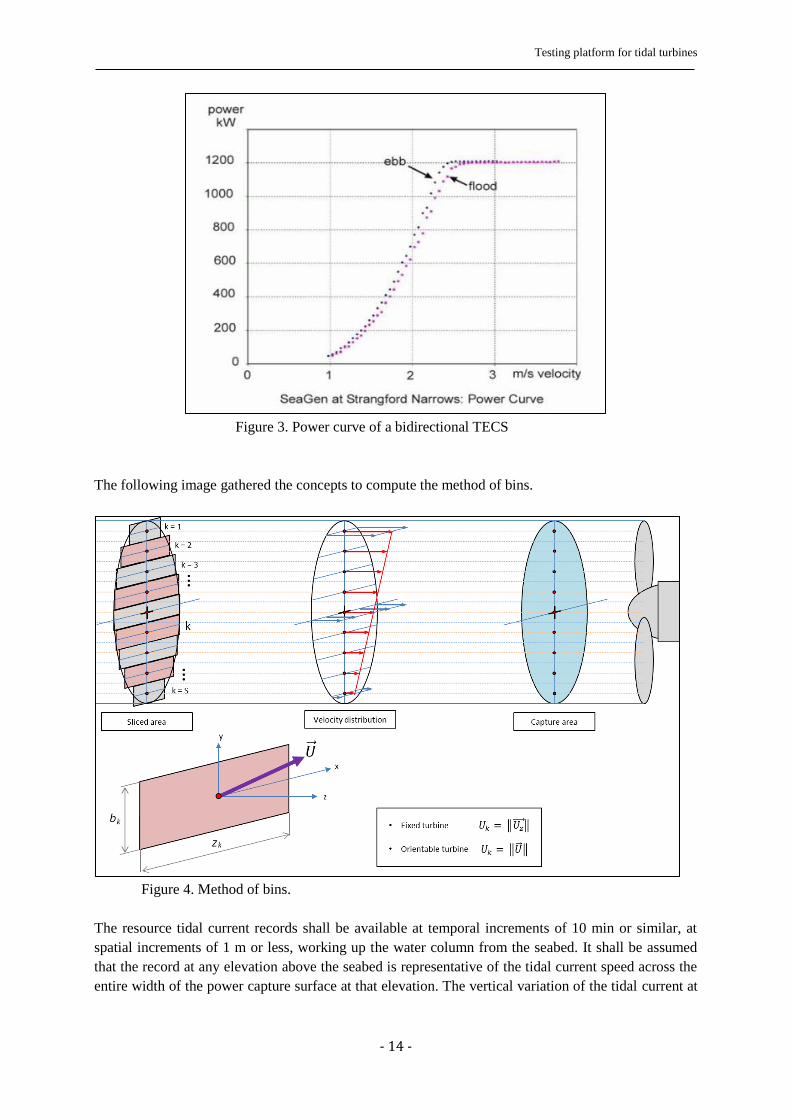
Figure 3. Power curve of a bidirectional TECS
The following image gathered the concepts to compute the method of bins.
Figure 4. Method of bins.
The resource tidal current records shall be available at temporal increments of 10 min or similar, at
spatial increments of 1 m or less, working up the water column from the seabed. It shall be assumed
that the record at any elevation above the seabed is representative of the tidal current speed across the
entire width of the power capture surface at that elevation. The vertical variation of the tidal current at

Testing platform for tidal turbines
- 15 -
each time interval shall be integrated across the power capture area, to provide an average
performance velocity for plotting on the power curve, based upon the following identity:
[
∑
]
∑
A area of the capture surface
bk width of horizontal slice k through the power capture surface
S number of horizontal slices of the power capture area, norml to the direction of tidal current
flow
k subscript number of the horizontal slice centered around speed Uk
Uk speed of flow of the tidal current normal to the power capture surface and flowing thorugh the
kth horizontal slice of the power capture surface
zk height of the slice k taken horizontally through the power capture surface
If the TECS is fixed, i.e. it has no yaw capability, then only the component of velocity perpendicular
to the power capture surface should be used for the identity of U in Equation 2. However, if the TECS
device is capable of orientating to the dominant tidal current direction prevailing at a given time, the
recorded velocity vector irrespective of direction should be used for the identity of U.
The measured power curve is to be derived by applying the method of bins to the current velocity data
in bin increments of 0,10 m/s and by calculation of the mean values of current resource across the
power capture surface and device power output for each current resource bin as follows:
∑
∑
Ni number of data sets in bin i
Pi average recorded TECS power output in bin i
P(i,j) TECS power output recorded at data point j in bin i
Uperf(i) average current velocity in bin i
Uperf(i,j) current velocity recorded for data point j in bin i
3.4.3 Power coefficient
3.4.3.1 General
The power coefficient of the device shall be expressed as:

Testing platform for tidal turbines
- 16 -
(
)
A power capture area of the device
P recorded power output (kW)
Uperf average performance velocity of the tidal current
In general, the performance of the device is likely to fall below the theoretical Betz limit.
3.4.3.2 Annual energy production
The expected annual energy production (AEP) in kWh for a device with a defined power curve shall
be obtained by combining the power curve described before with a frequency distribution of velocity
for the site:
∑
Av the predicted availability
AEP expected annual power production in kWh
NB total number of velocity bins set in increments of 0,10 m/s, in the device power curve
Pi(Uperf(i)) the power in kW generated by velocity bin i of the power device curve
Uperf(i) the average performance current velocity of bin i of the power device curve
fi(Uperf(i)) the proportion of time during the year for which the average performance current
velocity occupies a value within bin i of the device power curve
If the TECS is fixed, having no yaw capability, only the component of velocity perpendicular to the
power capture surface should be used for the identity of Uperf(i) in Equation 5. However, if the TECS
device is capable of orientating to the dominant tidal current direction prevailing at a given time, the
velocity vector irrespective of direction should be used. This consideration also arises in the derivation
of the device power curve, as discussed previously.

Testing platform for tidal turbines
- 17 -
Assessment of the offshore location for the platform installation 4
The make a proper decision when selecting the site where the platform will be fixed is fundamental.
Thus, to carry out such a crucial evaluation to lead the evidences to a final conclusion, the sea
conditions and the feasibility to fix a structure of remarkable dimension are to be taken into account.
The variables that are considered in this decision-making process are listed as follows:
- Water speed
- Stream direction
- Variation of stream direction
- Variation of water speed throughout the year
- Ship traffic
Figure 5. Map satellite view of the coastal zone of La Rochelle and surroundings.
To start off, the use of PREVIMER provides key information to start with. The PREVIMER system
aims to provide a wide range of users with observations and forecasts along French coasts (English
Channel, Bay of Bisquay and Mediterranean sea) concerning:
- Current
- Temperature, salinity
- Sea level, storm surge
- Waves
- Nutrients and plankton concentrations
The relevant data that was observed from the PREVIMER system was the speed of the water in
several days and times in which the peak current speed is created in some areas. The following image
shows a capture of the interface in which a map of the coast is shown and, furthermore, relatively
small mesh elements depict the current velocity at that precise time and position.

Testing platform for tidal turbines
- 18 -
Figure 6. Interface at the website previmer.org.
After the collection and observation of several current-speed maps, a direct conclusion is reached: the
mesh elements in which the speed is maximum throughout the zone are seamlessly the same, fact that
implies that the hydrodynamic behaviour of the current that produces one stream velocity or another is
mostly due to bathymetry conditions rather than weather or other changing conditions.
Moreover, it is observed a constant location of the current speed highs around the corners of Île de Ré
and Île d’Oléron. Even though four feasible zones have been short-listed at this point (the pair of
corners of both islands), the two corners nearer to the shore are deemed as inadequate because of ship
traffic in the whereabouts.
In regard to the two lasting possible zones of greater current speed, the one whose speed is always
higher than the other is the North edge of Île d’Oléron. Hence, this is the selected offshore point
where further data gathering will be performed at from now.
Notwithstanding the current speed, it is of the same importance to consider the bathymetry of the zone
stated above as optimal.
Testing platform for tidal turbines
- 19 -
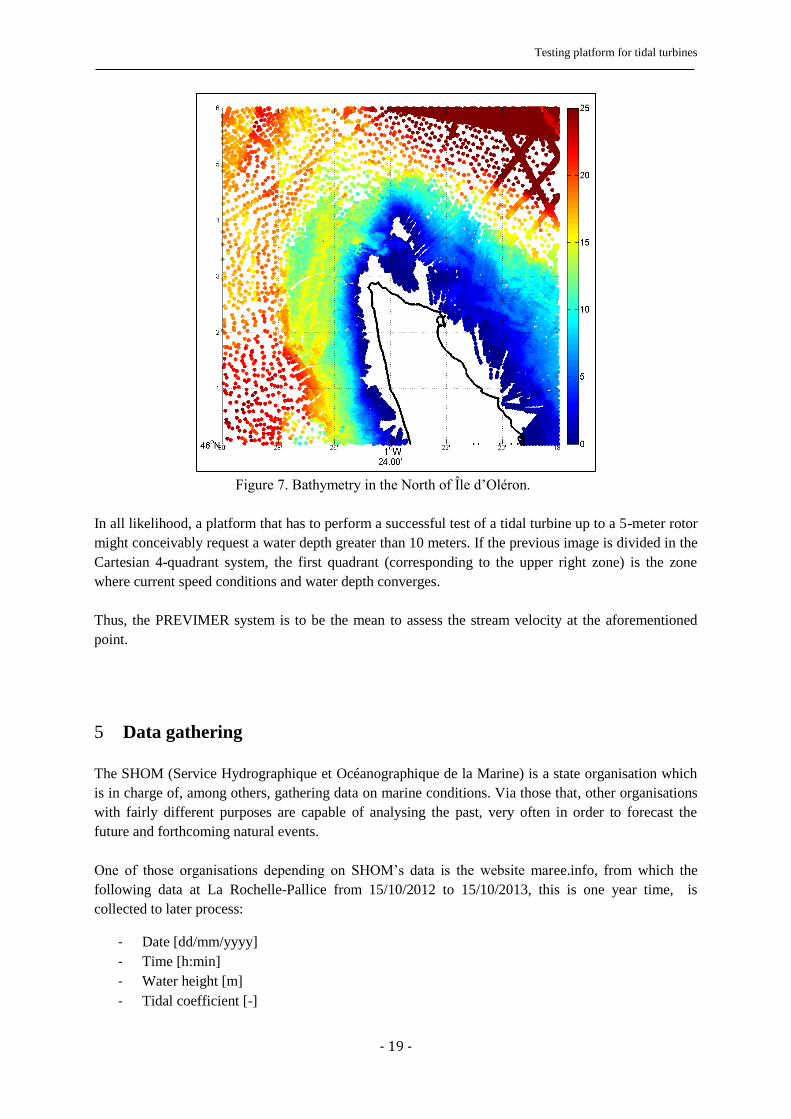
Figure 7. Bathymetry in the North of Île d’Oléron.
In all likelihood, a platform that has to perform a successful test of a tidal turbine up to a 5-meter rotor
might conceivably request a water depth greater than 10 meters. If the previous image is divided in the
Cartesian 4-quadrant system, the first quadrant (corresponding to the upper right zone) is the zone
where current speed conditions and water depth converges.
Thus, the PREVIMER system is to be the mean to assess the stream velocity at the aforementioned
point.
Data gathering 5
The SHOM (Service Hydrographique et Océanographique de la Marine) is a state organisation which
is in charge of, among others, gathering data on marine conditions. Via those that, other organisations
with fairly different purposes are capable of analysing the past, very often in order to forecast the
future and forthcoming natural events.
One of those organisations depending on SHOM’s data is the website maree.info, from which the
following data at La Rochelle-Pallice from 15/10/2012 to 15/10/2013, this is one year time, is
collected to later process:
- Date [dd/mm/yyyy]
- Time [h:min]
- Water height [m]
- Tidal coefficient [-]

Testing platform for tidal turbines
- 20 -
Figure 8. Interface of the website mare.info.
Each day contains about 4 data lines, the so-called bins, corresponding to the time when the 2 highs
and 2 lows of water level occurred.
The evolution of the water height with respect to time is the first and most intuitive result that is
obtained from the database.
Figure 9. Evolution of water height.
0
1
2
3
4
5
6
7
118355065809711213114816317819320822323825927629731232734235737238740241943444946447949450952453955657358860362063565266868470171673875477178680382083585086588089991493194896397899310081023104010571072108911041119113411491164118111961211122612411256127112881305132013351352136713821397141214271444146114781493
10 11 12 1 2 3 4 5 6 7 8 9 10
2012 2013
Wat
er
he
igh
t [m
]
Evolution of water height (1 year)

Testing platform for tidal turbines
- 21 -
The water height amplitude of the daily tides is actually experiencing a maximum or minimum each 7
days approximately. This fact implies that the tide amplitude increases during a week, and afterwards
it decreases during the second week, and so forth in a repetitive way. Furthermore, the amplitude
presents another repetitive pattern that groups the wide amplitude tides and the thin amplitude tides
each 4 weeks during 6 months, and then the pattern turns the opposite (it occurs around March the
22nd for the year 2013, see chart above).
Once arrived to this point, it is essential to define the tidal coefficient and the information that
provides.
Tidal coefficient
In order to compare tidal ranges of various harbours, Laplace characterized each harbour with a height
unit: “the height unit is the average value of the amplitude (semi-tidal range) of the largest tide which
occurs after about one day and a half the full or new moon, towards syzygies”
The notion of coefficient directly results from this definition: usually, the coefficient hundred is given
to the average tide range of neaps occurring after syzygy which is the closest to the equinox, and hence
the following equation holds:
Within which C is the tidal coefficient, H is the height of the high waters, Nmm is the semi-tide level
and Uh is the unit height.
The success in France of this coefficient notion comes from the fact that it quite rapidly provides an
indication on the amplitude of the tide. This is obviously only a relative indication, but is largely used
by anyone within the French coastal zones located at the edge of the English Channel and of the
Atlantic Ocean. In addition, this coefficient presents the advantage of leading to rapid calculation
processes of the water or current heights. Indeed, the correction charts of the handbooks, for the
calculation the tidal heights in the subordinate stations, and the current atlases provide some elements
in the case of average neaps and average springs situations which respectively correspond to
coefficients of 95 and 45.
Knowing the coefficient of the occurring tide, it is then quite easy to perform a cross multiplication in
order to calculate the corresponding heights or the currents. The results of these calculations are only
approximate ones, and the navigators have to bear it in mind, knowing that the coefficient calculated
in Brest can be adopted for any French coast, except the harbours located in the North Sea where the
relative variations of the tide are sensitively lower than in Brest. However, it would be quite dangerous
to apply the validity zone of the Brest coefficient to some too far away zones and it would not even
make any sense for the tides which are not of the semidiurnal type. However, due to the practical
advantage of this notion, it could be interesting to give it some definition which could be then used in
any case.
The most commonly used procedure to evaluate the power production of tidal turbines is by means of
the following three tidal conditions:
- An average neap tide (tidal coefficient 45)
Testing platform for tidal turbines
- 22 -
- An average tide (tidal coefficient 70)
- An average spring tide (tidal coefficient 95)
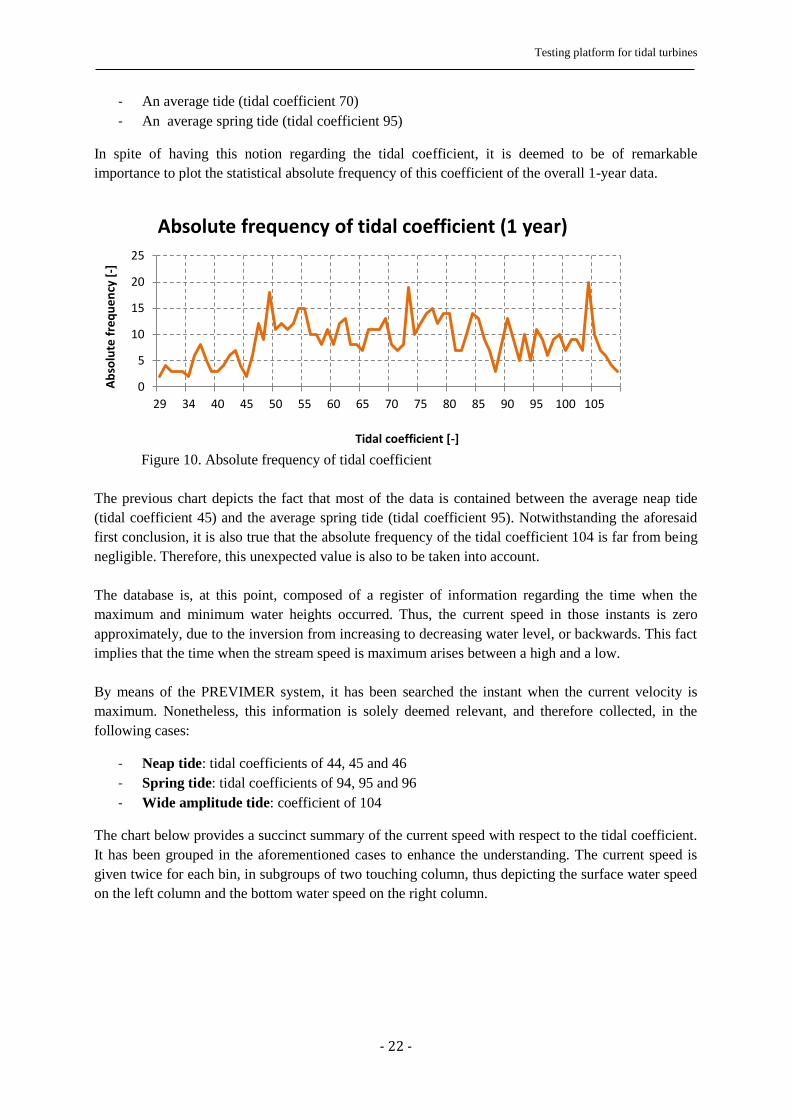
In spite of having this notion regarding the tidal coefficient, it is deemed to be of remarkable
importance to plot the statistical absolute frequency of this coefficient of the overall 1-year data.
Figure 10. Absolute frequency of tidal coefficient
The previous chart depicts the fact that most of the data is contained between the average neap tide
(tidal coefficient 45) and the average spring tide (tidal coefficient 95). Notwithstanding the aforesaid
first conclusion, it is also true that the absolute frequency of the tidal coefficient 104 is far from being
negligible. Therefore, this unexpected value is also to be taken into account.
The database is, at this point, composed of a register of information regarding the time when the
maximum and minimum water heights occurred. Thus, the current speed in those instants is zero
approximately, due to the inversion from increasing to decreasing water level, or backwards. This fact
implies that the time when the stream speed is maximum arises between a high and a low.
By means of the PREVIMER system, it has been searched the instant when the current velocity is
maximum. Nonetheless, this information is solely deemed relevant, and therefore collected, in the
following cases:
- Neap tide: tidal coefficients of 44, 45 and 46
- Spring tide: tidal coefficients of 94, 95 and 96
- Wide amplitude tide: coefficient of 104
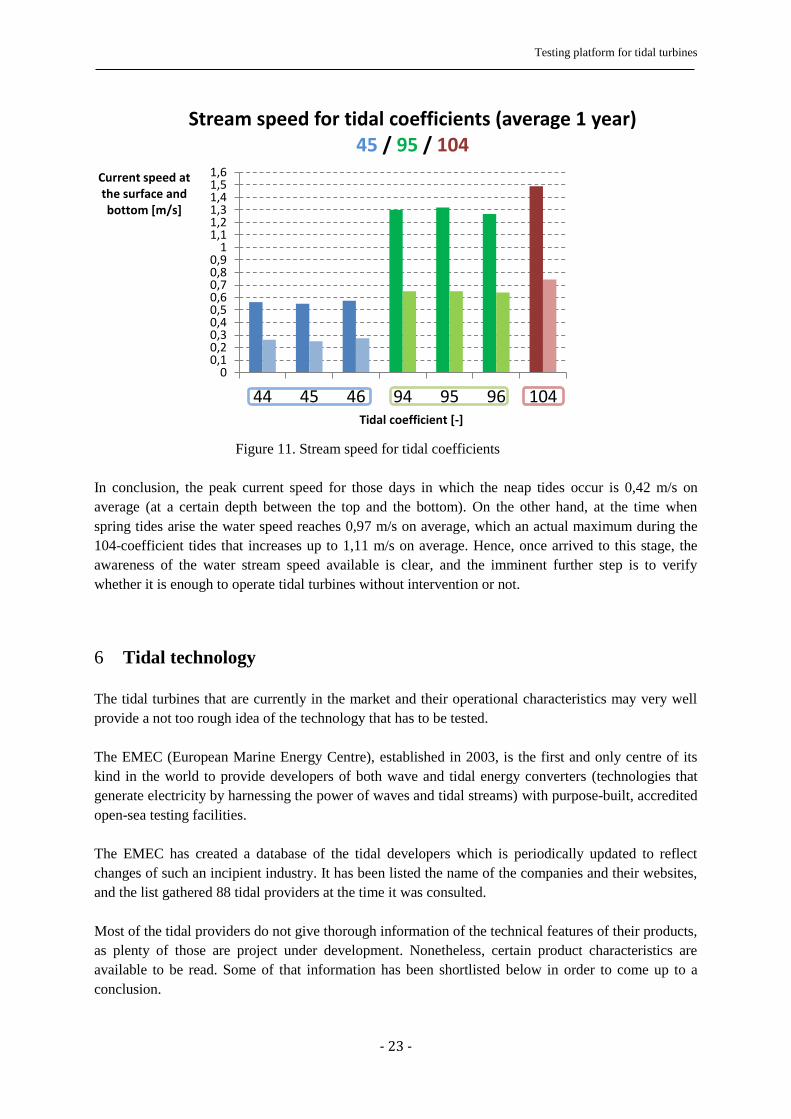
The chart below provides a succinct summary of the current speed with respect to the tidal coefficient.
It has been grouped in the aforementioned cases to enhance the understanding. The current speed is
given twice for each bin, in subgroups of two touching column, thus depicting the surface water speed
on the left column and the bottom water speed on the right column.
0
5
10
15
20
25
29 34 40 45 50 55 60 65 70 75 80 85 90 95 100 105
Ab
solu
te f
req
ue
ncy
[-]
Tidal coefficient [-]
Absolute frequency of tidal coefficient (1 year)
Testing platform for tidal turbines
- 23 -
Figure 11. Stream speed for tidal coefficients
In conclusion, the peak current speed for those days in which the neap tides occur is 0,42 m/s on
average (at a certain depth between the top and the bottom). On the other hand, at the time when
spring tides arise the water speed reaches 0,97 m/s on average, which an actual maximum during the
104-coefficient tides that increases up to 1,11 m/s on average. Hence, once arrived to this stage, the
awareness of the water stream speed available is clear, and the imminent further step is to verify
whether it is enough to operate tidal turbines without intervention or not.
Tidal technology 6
The tidal turbines that are currently in the market and their operational characteristics may very well
provide a not too rough idea of the technology that has to be tested.
The EMEC (European Marine Energy Centre), established in 2003, is the first and only centre of its
kind in the world to provide developers of both wave and tidal energy converters (technologies that
generate electricity by harnessing the power of waves and tidal streams) with purpose-built, accredited
open-sea testing facilities.
The EMEC has created a database of the tidal developers which is periodically updated to reflect
changes of such an incipient industry. It has been listed the name of the companies and their websites,
and the list gathered 88 tidal providers at the time it was consulted.
Most of the tidal providers do not give thorough information of the technical features of their products,
as plenty of those are project under development. Nonetheless, certain product characteristics are
available to be read. Some of that information has been shortlisted below in order to come up to a
conclusion.
00,10,20,30,40,50,60,70,80,9
11,11,21,31,41,51,6
44 45 46 94 95 96 104
Current speed at the surface and bottom [m/s]
Tidal coefficient [-]
Stream speed for tidal coefficients (average 1 year) 45 / 95 / 104
Testing platform for tidal turbines
- 24 -
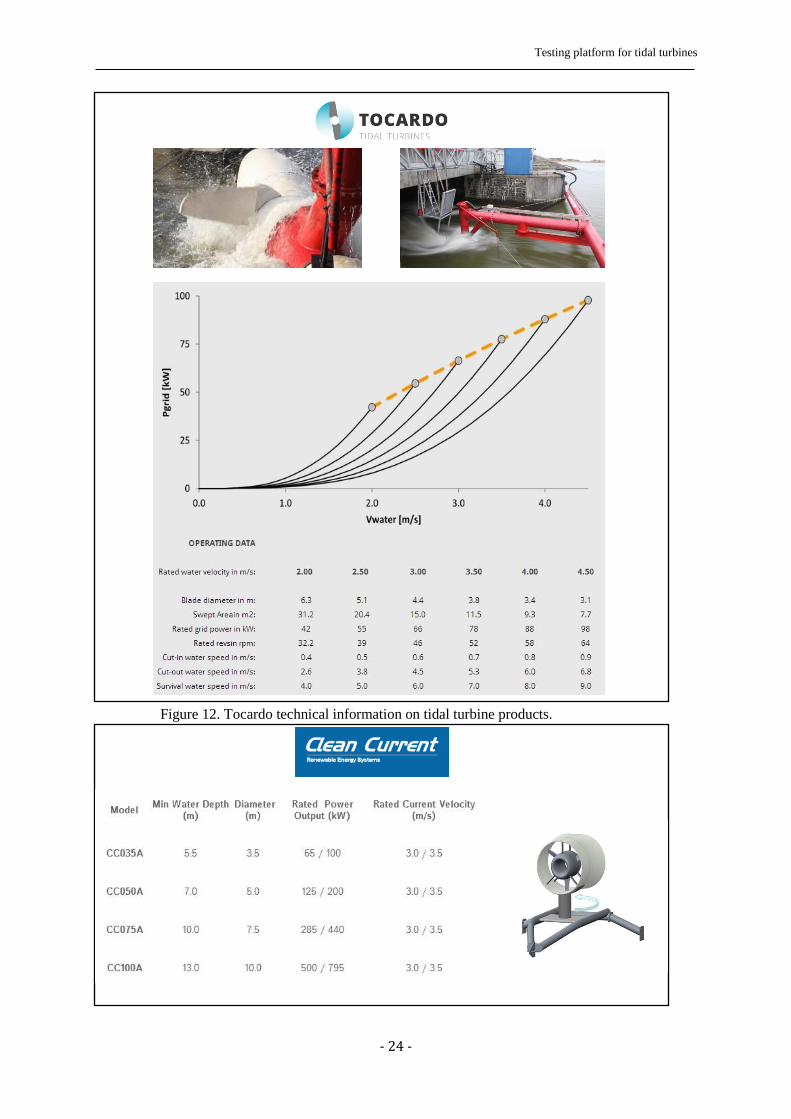
Figure 12. Tocardo technical information on tidal turbine products.

Testing platform for tidal turbines
- 25 -
Figure 13. Clean Current technical information on tidal turbine products.
Figure 14. New Energy technical information on tidal turbine products.
It is remarkable to further examine the graph and table provided by Tocardo, as it depicts the inverse
relationship between the rotor diameter and the operational range of speed. The larger the rotor is, the
slower the operational water speed requested.
These three are only examples of a larger group of turbines which operate under similar conditions.
The previous gathered information elucidates that the operation water speed range goes from 1 or 1,5
to 3 or 3,5 m/s.
Therefore, the current speed existing in the North corner of Île d’Oléron is not enough to operate and
test tidal turbines as, in many cases, the turbines would not even start to rotate.
Design of the platform 7
Once assured of the necessity to accelerate the current speed that flows at the sea location previously
selected, the design of a platform for such purpose is carrying out within this section.
First, it is important to be aware of the speed increment needed. Consequently, the three tide cases
herein mentioned are to be taken into account. As the maximum current speed at which the turbine
requests to be tested is the greater value in the operation range, the higher speed to be reached is set as
3 m/s. This velocity it is comparable with the current speed at the surface, as it is also the maximum
speed at which the water flows.

Testing platform for tidal turbines
- 26 -
The surface current speed during a neap tide is 0,56 m/s on average. To accelerate it up to 3 m/s the
increment to be experienced is +536%. On the other hand, the current speed during a spring tide is 1,3
m/s, which implies a requested boost of +231%. And last, for the 104-coefficient tides with a surface
current average speed of 1,49 m/s, the increment to reach the 3 m/s is 201%.
As it is desirable to be capable to test the greater amount of time, it is certain that the higher the speed
increment achieved, the larger the time in which tests could be performed. Therefore, it is reasonable
to set the goal of an increment of 300%, which implies a surface speed current of 1 m/s, which occurs
with a tidal coefficient around 70. Additionally, according to the database information the tidal
coefficient is equal or greater to 70 the 53,7% of the time during the year examined.
The platform layout is crucial to perform such acceleration, and the first shape that bibliography on
hydrodynamics widely suggests is the Venturi tube, which receives its name due to the Venturi effect.
The Venturi effect consists in the reduction in fluid pressure that occurs when a fluid flows through a
pipe section smaller than upstream.
Figure 15. Venturi tube
At this point, two possibilities are assessed: A square-section and a round-section tunnel.
Figure 16. Platforms with square and round sections.

Testing platform for tidal turbines
- 27 -
A circular section provides an even flux in contact with the walls in comparison with a square section
that could provoke turbulent behaviour at the edges correspondent to the vertexes of the square.
Nonetheless, the capability and ease to fix the turbines to be tested and other instruments to plane
surfaces provide the square section the most adequate shape to carry out the implementation of the
testing platform. Hence, the square-section shape is selected to be further developed.
Figure 17. Schema of a test performance inside the platform.
Next, the theoretical calculation of the Law of Conservation of Mass is applied in order to obtain the
general dimensions of the two square sections, which are the inlet section 1 and the inner section 2.
Figure 18. Double schema of the 2 sections and their dimensions.
a
b
A
B
1 2 1
2
1 2
11 1 2 2 2 1 2 1
2
2
2 1 2
2 2
Hypotheses:
To accelerate three
3 3
:
5
8,66
times :
m
S A B
S a b
V V
S A BS v S v v v v v
S a b
a b Av v
A B a
A a A a
Example
a m
A

Testing platform for tidal turbines
- 28 -
The previous calculation output shows that the inlet sides have to be at least of 8,66 m to accelerate 3
times de current speed. However, in order to be conservative throughout the process, a square section
of 10x10 m is considered.
In order to improve the hydrodynamic behaviour of the current flowing through the platform, the
edges are smoothed purposely.
Figure 19. Design improvement by rounding edges to better adapt the fluid to the wall.
The thickness of the walls is 40 cm and therefore not realistic, but it easier to work during this
incipient stage which such a value due to the meshing process.
Moreover, the dimension and distribution of the water that is intended to simulate the open sea is of
essential importance. Concerning to this point, ANSYS states that for an external flow, in general, if
the object has height H and width W, you would want your domain to be at least more than: 5H high,
10W wide, with at least 2H upstream of the object and 10H downstream of the object
Figure 20. Open sea simulation recommendations.
As a consequence, the dimensioning of the fluid is immediate using the sizes of the platform stated
above.
10 m
10 m 25 m

Testing platform for tidal turbines
- 29 -
Figure 21. Geometry of the fluid body.
Once the geometry is defined for both the solid and the fluid, the latter has to be meshed properly so as
to provide accurate results when performing the simulation by means of the software Fluent.
Furthermore, the ANSYS developers provide valuable information for different meshing processes
related to a wide array of purposes. The content that concerns to the project boundaries is gathered as
follows.
- If the direction of the flow is well known, then Quadrangular/Hexahedral elements aligned
with the flow are more accurate than Triangular elements.
Figure 22. Hex/Tri comparison
- For complex flows without dominant direction, Quadrangular and Hexahedral meshes lose
their advantage.
Figure 23. Hex/Tri comparison.
150 m
75 m
225
m
100 m
Current
direction

Testing platform for tidal turbines
- 30 -
- Sudden changes in mesh density should be avoided to enable an adequate simulation. This
specific recommendation concerns directly to the Layers on the walls in contact with the fluid.
Figure 24. Element dimension gradient
In addition, the Hexahedral elements provides best accuracy and numerical efficiency due to the good
shear layer element and the fact that is the best element concerning the memory and calculation time
per element. Hence, the selected elements to mesh the fluid are Hexahedrons.
During the meshing, it is fundamental to impose contact layers to properly simulate the interaction
between the solid and the fluid. At this first stage it has not been taken into account whether the
thickness of the layers is the suitable to this case because it is considered in further stages.
Once calculated the mesh, it is displayed as follows.
Figure 25. Meshing
The global arrangement of the mesh depicts smaller elements near the platform and the cylindrical
wall that conforms the end of the domain of study. Consequently, the thinnest elements are placed in
the zones when, presumably, more changes in terms of current direction and module are bound to
happen.
Testing platform for tidal turbines
- 31 -
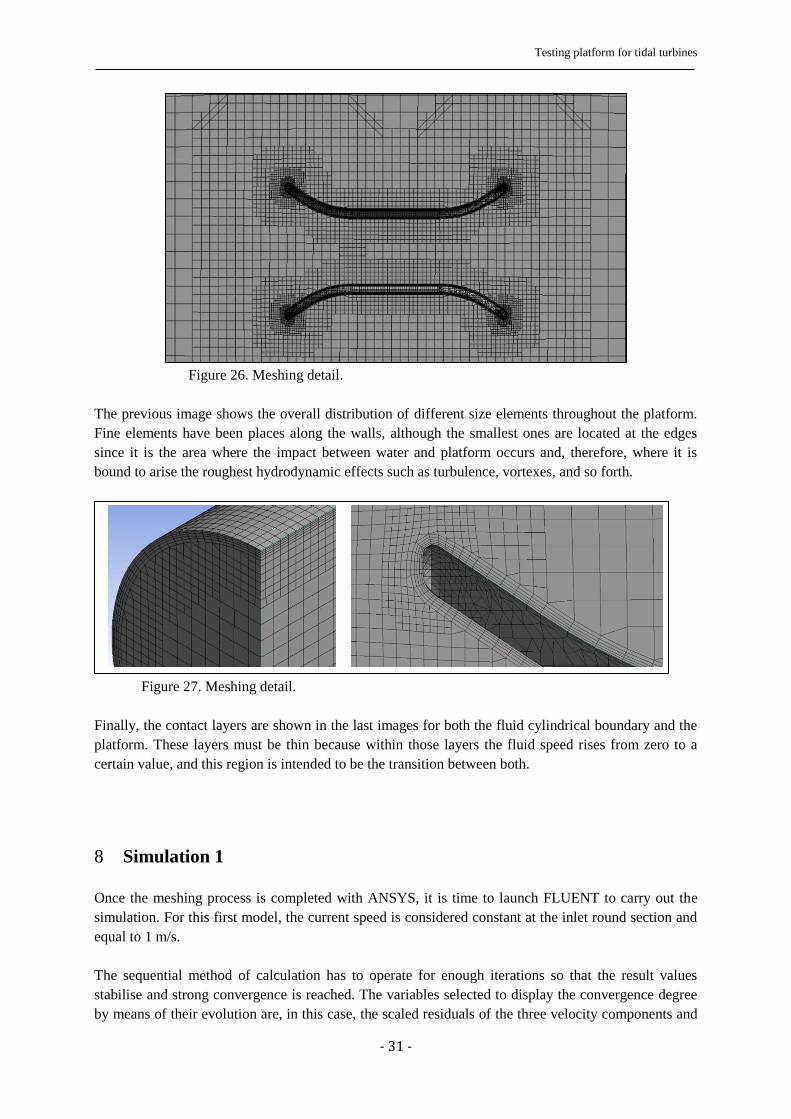
Figure 26. Meshing detail.
The previous image shows the overall distribution of different size elements throughout the platform.
Fine elements have been places along the walls, although the smallest ones are located at the edges
since it is the area where the impact between water and platform occurs and, therefore, where it is
bound to arise the roughest hydrodynamic effects such as turbulence, vortexes, and so forth.
Figure 27. Meshing detail.
Finally, the contact layers are shown in the last images for both the fluid cylindrical boundary and the
platform. These layers must be thin because within those layers the fluid speed rises from zero to a
certain value, and this region is intended to be the transition between both.
Simulation 1 8
Once the meshing process is completed with ANSYS, it is time to launch FLUENT to carry out the
simulation. For this first model, the current speed is considered constant at the inlet round section and
equal to 1 m/s.
The sequential method of calculation has to operate for enough iterations so that the result values
stabilise and strong convergence is reached. The variables selected to display the convergence degree
by means of their evolution are, in this case, the scaled residuals of the three velocity components and

Testing platform for tidal turbines
- 32 -
the two parameters of the model epsilon and k. After few iterations, the values remain fairly constant
and the iterative processes is stopped at 350, as the following graph shows.
Figure 28. FLUENT convergence after 350 iterations.
The important variable to display is the distribution of the stabilised current speed. For this purpose,
the velocity in contours is deemed as the most suitable since it provides an intuitive idea of the speed
module in each element, regardless of the direction, and grouped in intervals of velocity that are
mapped in different colours. The images below correspond to the speed contours in m/s
Figure 29. Contours of velocity Magnitude (m/s)
Testing platform for tidal turbines
- 33 -
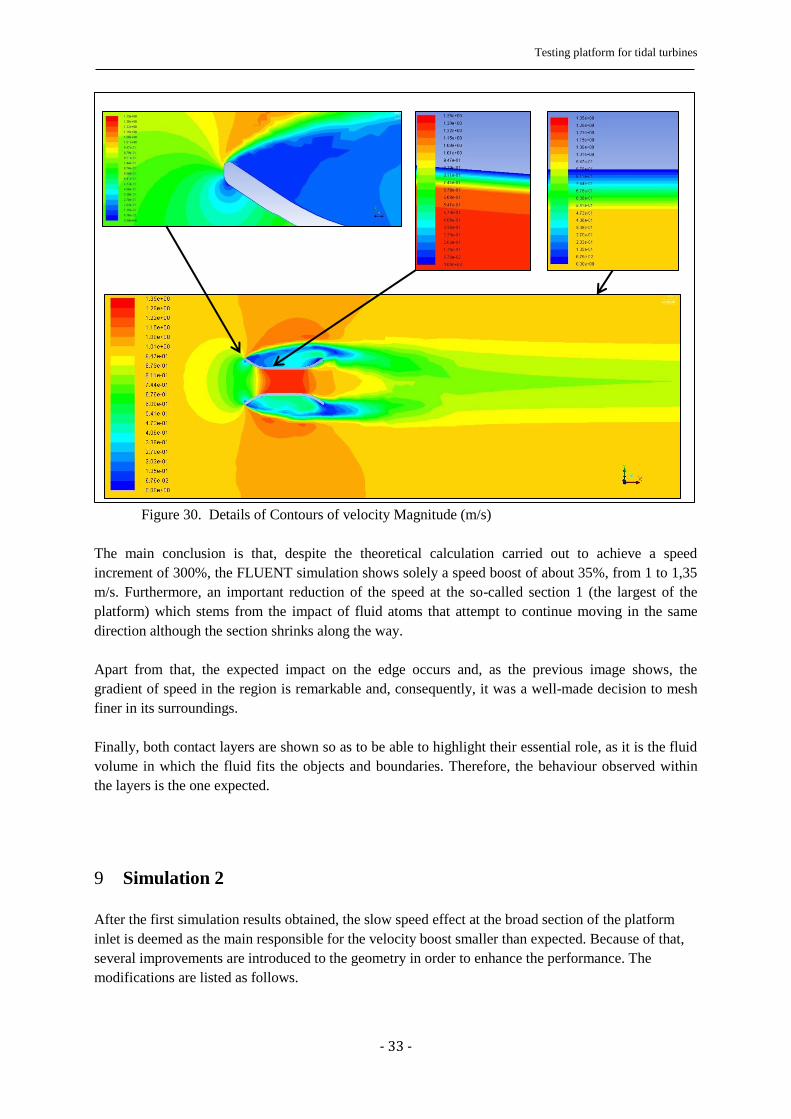
Figure 30. Details of Contours of velocity Magnitude (m/s)
The main conclusion is that, despite the theoretical calculation carried out to achieve a speed
increment of 300%, the FLUENT simulation shows solely a speed boost of about 35%, from 1 to 1,35
m/s. Furthermore, an important reduction of the speed at the so-called section 1 (the largest of the
platform) which stems from the impact of fluid atoms that attempt to continue moving in the same
direction although the section shrinks along the way.
Apart from that, the expected impact on the edge occurs and, as the previous image shows, the
gradient of speed in the region is remarkable and, consequently, it was a well-made decision to mesh
finer in its surroundings.
Finally, both contact layers are shown so as to be able to highlight their essential role, as it is the fluid
volume in which the fluid fits the objects and boundaries. Therefore, the behaviour observed within
the layers is the one expected.
Simulation 2 9
After the first simulation results obtained, the slow speed effect at the broad section of the platform
inlet is deemed as the main responsible for the velocity boost smaller than expected. Because of that,
several improvements are introduced to the geometry in order to enhance the performance. The
modifications are listed as follows.

Testing platform for tidal turbines
- 34 -
- Addition of a surface at the inlet and outlet of the platform, aligned to the overall current
direction.
Figure 31. Geometry modification between simulations 1 and 2.
- Thickness reduction from 400 mm to 10 mm in all the walls except the inlet and outlet flow-
direction surface, which reduces its thickness from 10 mm to 5 mm in the edge throughout a
slope.
Figure 32. Detail of the inlet edge.
Model for simulation 1 Model for simulation 2
5 cm
Testing platform for tidal turbines
- 35 -
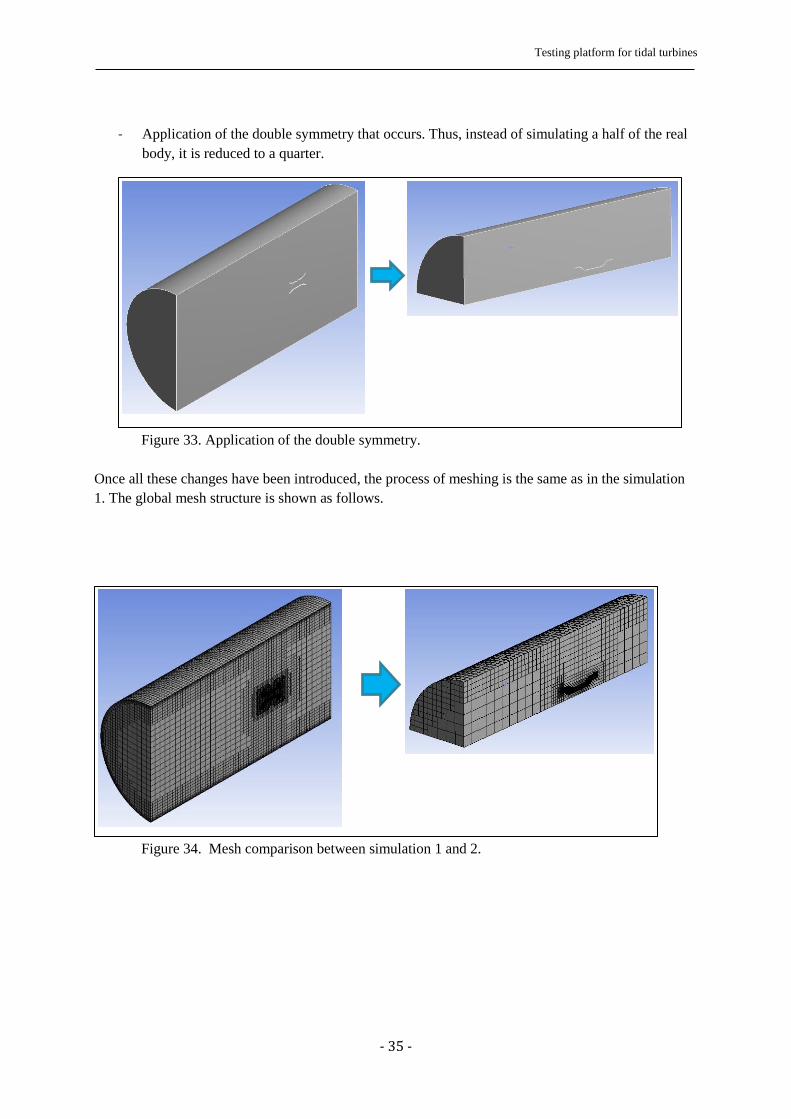
- Application of the double symmetry that occurs. Thus, instead of simulating a half of the real
body, it is reduced to a quarter.
Figure 33. Application of the double symmetry.
Once all these changes have been introduced, the process of meshing is the same as in the simulation
1. The global mesh structure is shown as follows.
Figure 34. Mesh comparison between simulation 1 and 2.

Testing platform for tidal turbines
- 36 -
The element distribution along the platform is similar to the one carried out for the first simulation.
Figure 35. Platform mesh.
However, having reduced to half of the body is essential because of the reduction of thickness, fact
that demands the use of smaller elements in contact with the inlet edge of the platform that, as a
reminder, has reduced its size from 400 mm to 5 mm.
Figure 36. Platform edge mesh.
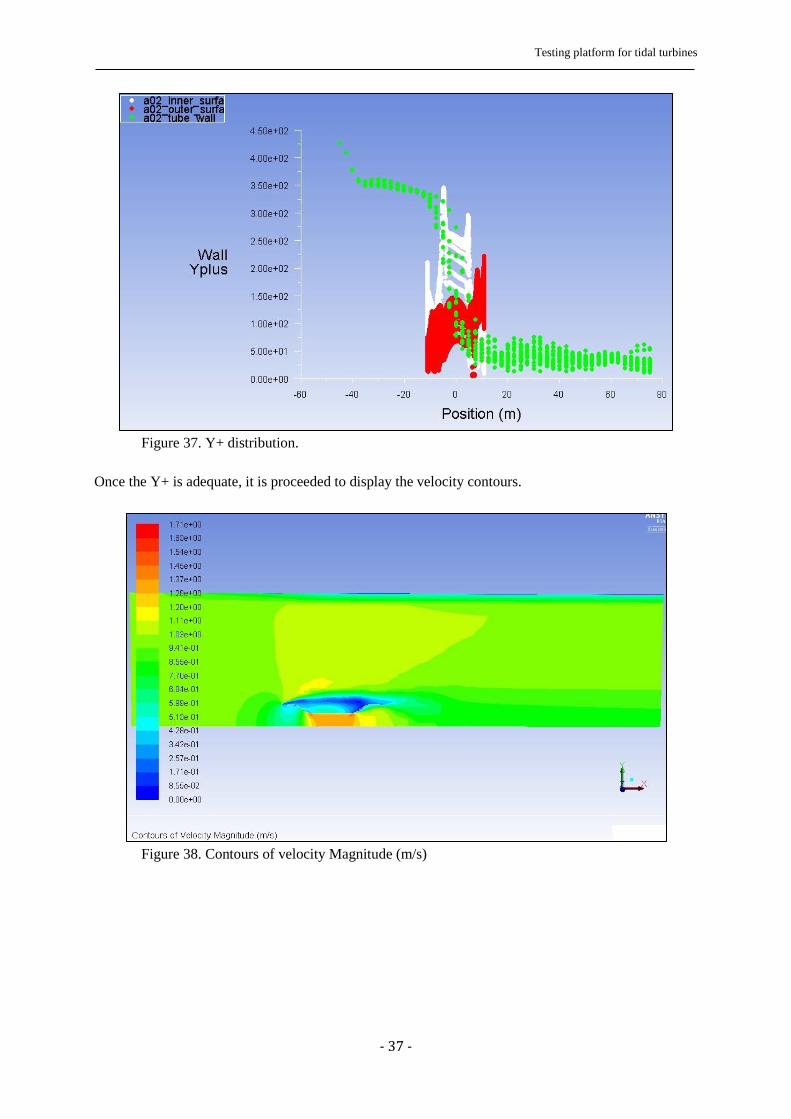
A posteriori to the meshing, the simulation with FLUENT is performed. This time, it has to be ensured
that the contact layer is adequate and capable to provide precise results. For this purpose, the
parameter Y+ should be constrained to values between 30 and 300. To modify its value, the thickness
of the contact layers when meshing has to be changed in a closed loop, performing several simulations
and re-meshing until Y+ fits inside the desired interval. The chart below shows that the majority of
values of Y+ are suitable for the position corresponding to the platform, from -12,5 m to +12,5 m
which are the overall 25 meters in length.
Testing platform for tidal turbines
- 37 -
Figure 37. Y+ distribution.
Once the Y+ is adequate, it is proceeded to display the velocity contours.
Figure 38. Contours of velocity Magnitude (m/s)
Testing platform for tidal turbines
- 38 -
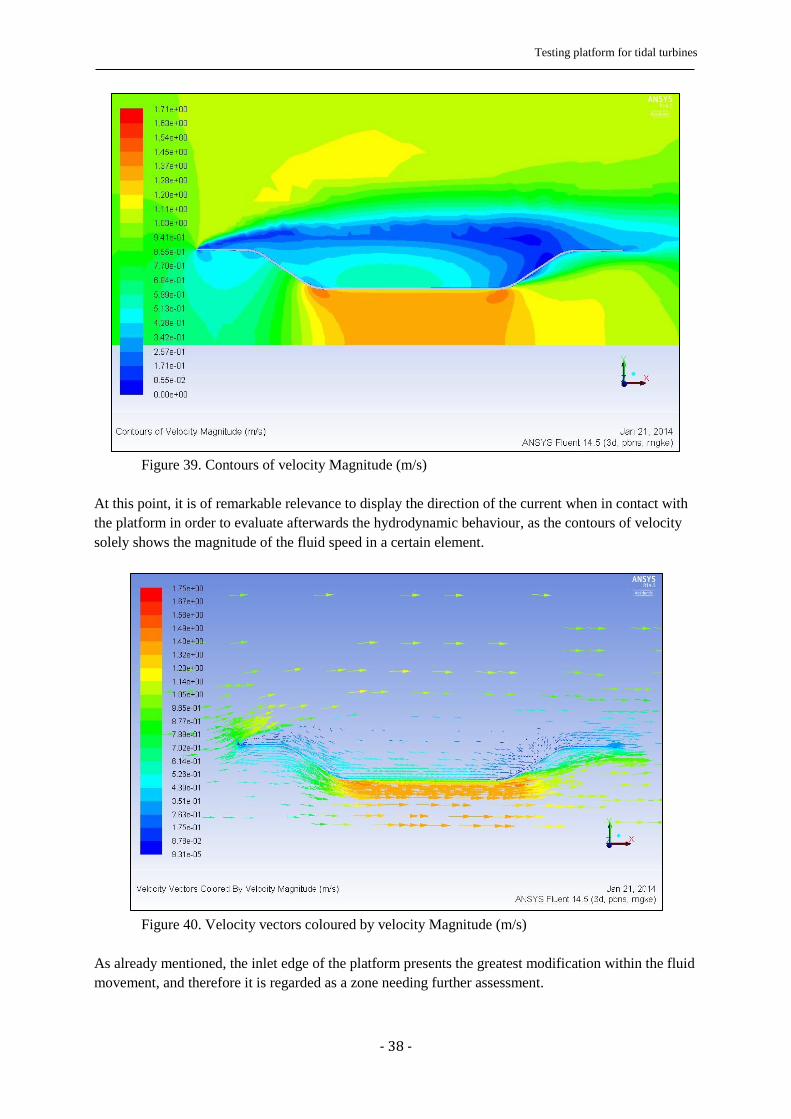
Figure 39. Contours of velocity Magnitude (m/s)
At this point, it is of remarkable relevance to display the direction of the current when in contact with
the platform in order to evaluate afterwards the hydrodynamic behaviour, as the contours of velocity
solely shows the magnitude of the fluid speed in a certain element.
Figure 40. Velocity vectors coloured by velocity Magnitude (m/s)
As already mentioned, the inlet edge of the platform presents the greatest modification within the fluid
movement, and therefore it is regarded as a zone needing further assessment.

Testing platform for tidal turbines
- 39 -
Figure 41. Velocity vectors coloured by velocity Magnitude (m/s)
Finally, the fluid speed distribution within its volume is a proper visual aid to understand the general
fluid behaviour.
Figure 42. Velocity vectors coloured by velocity Magnitude
Likewise, as did for a current stream of global speed 1 m/s, the simulation has been done with
different speeds so as to ensure that the Law of Conservation of Mass is fulfilled in the simulations.

Testing platform for tidal turbines
- 40 -
INLET OUTLET
1,0 m/s 1,33 m/s (+32,5%)
1,5 m/s 1,95 m/s (+29,7%)
2,0 m/s 2,61 m/s (+30,3%)
3,0 m/s 3,97 m/s (+32,17%)
As conclusion of this second simulation, it ought to be mentioned that the geometry improvements
have not succeeded in producing a greater acceleration of the current velocity. The phenomenon which
occurs at the platform inlet consisting in a decrement of the speed in this section still arises in spite of
the new shape of the platform.
It is also possible to observe an important deviation in the direction of the global stream which
attempts to shun the obstacle, that is to say the platform. A similar behaviour occurs in the field of
electronics when the electric current has more intensity along the wires which offer less resistance.
Structural assessment 10
Figure 43. Platform geometry
The evaluation of the hydrodynamic pressure on the platform structure is conservatively performed at
a current speed of 3 m/s, as this value has been considered to take place in extreme conditions. Once
the FLUENT simulation has converged, the values of wall pressure are imported to the ANSYS
structural analysis environment in order to calculate the impact in terms of strain and stress.
Testing platform for tidal turbines
- 41 -
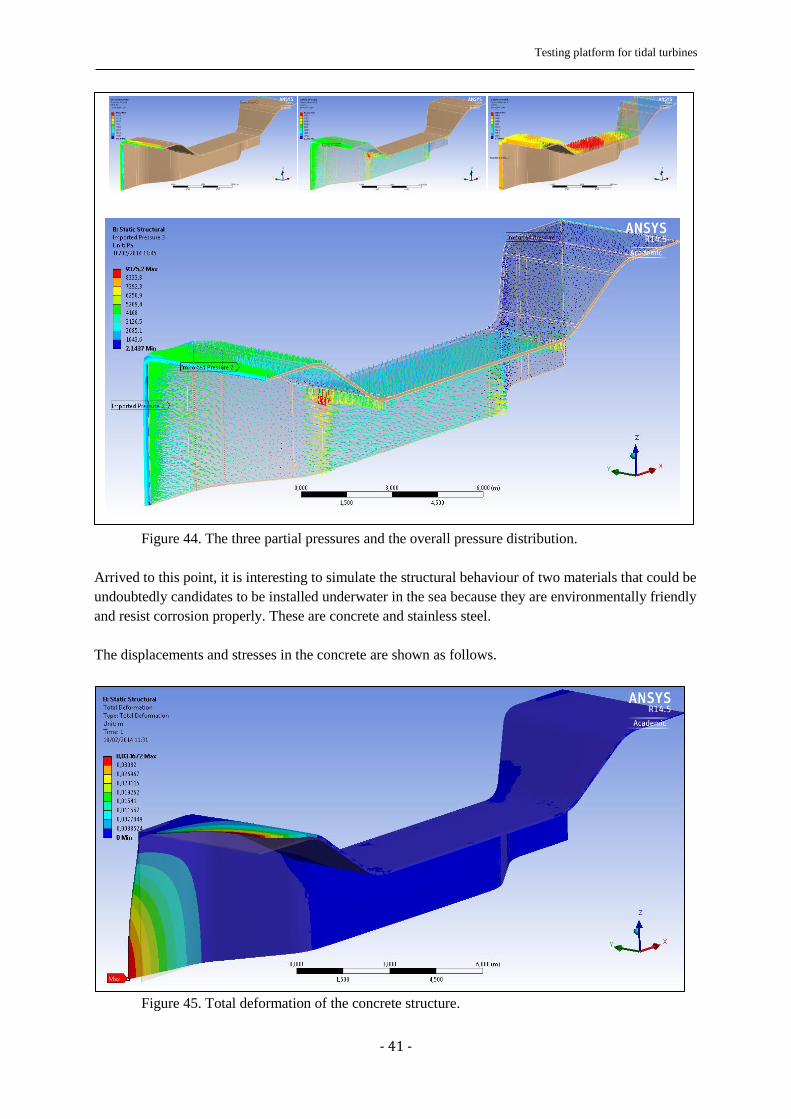
Figure 44. The three partial pressures and the overall pressure distribution.
Arrived to this point, it is interesting to simulate the structural behaviour of two materials that could be
undoubtedly candidates to be installed underwater in the sea because they are environmentally friendly
and resist corrosion properly. These are concrete and stainless steel.
The displacements and stresses in the concrete are shown as follows.
Figure 45. Total deformation of the concrete structure.

Testing platform for tidal turbines
- 42 -
Figure 46. Equivalent Stress of the concrete structure
The displacements and stresses for the stainless steel structure are shown as follows.
Figure 47. Total deformation of the stainless steel structure.

Testing platform for tidal turbines
- 43 -
Figure 48. Equivalent stress of the stainless steel structure.
To summarise, the greatest deformation is 3,5 cm for the concrete and 0,5 cm for the stainless steel. In
terms of stress, the maximum Equivalent Stress for the concrete is 25 MPa, and 20,6 MPa for the
stainless steel.
The usual Yield Strength of steels is always higher than 200 MPa, and therefore there is no possibility
of plastic deformation in this case. On the other hand, the concrete is a material with mostly plastic
behaviour, and its Tensile Strength (when fracture arises) is around 2 or 3 MPa. Therefore, this
geometry is not suitable to utilise concrete to build it, and the stainless steel resists properly the
stresses.
As prospect, some modifications could reasonably be introduced in order to be capable to construct the
platform in concrete such as using reinforced steel, increasing the thickness and rounding the edges.

Testing platform for tidal turbines
- 44 -
Bibliography
Bernard Multon. “Marine Renewable Energy Handbook”. Wiley-ISTE, 2011
Jean-Michel Tanguy. “Environmental Hydraulics: Mathematical Models”. Wiley-ISTE, 2010
PREVIMER Obervations et previsions côtières – at www.previmer.org
MARÉE.INFO Horaires, hauters, coefficients – at mare.info
The European Marine Energy Centre . “Assessment of Performance of Tidal Energy Conversion
Systems”. London, 2009
Ane Menchaca Roa. “Analyse numérique des hydroliennes à axe vertical munies d’un carénage”.
PhD Thesis. Université de Grenoble. 2012
I. G. Bryden, S. J. Couch, A. Owen, G. Melville. “Tidal current resource assessment”. J. Power
and Energy 238, IMechE, 2007
Ervin Amet. “Simulation numérique d’une hydrolienne à axe vertical de type Darrieus”. PhD
Thesis. Institut Polytechnique de Grenoble. 2009
Marie Lunde Staeterstad . “Dimensioning Loads for a Tidal Turbine”. Master Thesis. Norweigan
University of Science and Technology. 2011
H. M. Nepf, W.R. Geyer. “Intratidal variations in stratification and mixing in the Hudson estuary”.
Journal of Geophysical Research 101, 1996
Related Documents