Engineering Structures 24 (2002) 73–84 www.elsevier.com/locate/engstruct Testing of externally prestressed concrete beams Angel C. Aparicio * , Gonzalo Ramos, Juan R. Casas Civil Engineering School, Universitat Polite `cnica de Catalunya, Jordi Girona, 1–3, Mod. C-1, 08034 Barcelona, Spain Received 23 October 2000; received in revised form 18 June 2001; accepted 21 June 2001 Abstract This paper presents the results of a test program on externally prestressed concrete beams. Five monolithic and three segmental beams were tested in bending and in combined bending and shear. The most significant results are presented such as carrying capacity, prestressing steel stress increase at ultimate, shear behavior of open joints. Conclusions on ultimate load capacity of externally prestressed beams and influence of the tendon length on this capacity are obtained. These tests have been used to validate a numerical finite element model already presented. 2001 Elsevier Science Ltd. All rights reserved. Keywords: Bridges; External prestressing; Segmental construction; Prestressed concrete; Large-scale testing 1. Introduction The ultimate behavior of externally prestressed, monolithic or segmental, bridges is different from intern- ally prestressed bridges. Those differences have already been presented in several papers [1,2] and are related to the unbonded nature of the external prestressing. As a consequence the analysis of externally prestressed beams offers one additional level of difficulty in comparison with the analysis of conventional internally prestressed beams: the prestressing steel stress at ultimate can not be accurately calculated with a sectional analysis. In addition, the ultimate shear behavior of segmental bridges with dry joints, multiple shear keys and external prestressing is also different because of the lack of bonded steel crossing the joint and also because of the combination of shear with joint opening [3]. Most European codes allow no increase of prestress- ing steel stress at ultimate (f ps =0) unless an accurate analysis is performed [4]. On the other hand, American codes [5,6] and some European codes recommend values or approximate formulas for estimating f ps . It is believed that European codes are too conservative and, on the other hand, American codes sometimes rec- ommend unreasonably high increments of stress. To try * Corresponding author. Tel.: +34-934016514, fax: +34-934011036. E-mail address: [email protected] (A.C. Aparicio). 0141-0296/02/$ - see front matter 2001 Elsevier Science Ltd. All rights reserved. PII:S0141-0296(01)00062-1 to reconcile these extreme positions, a research program was initiated at the Technical University of Catalunya (UPC) to study the behavior of bridges with external prestressing. The program includes the development of a numerical analysis model [7] and the performance of parametric studies [2], as well as the performance of lab- oratory model tests. This paper presents the laboratory model tests on monolithic and segmental simply sup- ported and continuous beams. Flexural and shear tests were performed. 2. Recent literature Several tests on externally prestressed beams have already been performed. The largest test program was developed at CEBTP (France) [8], where 11 beams were tested. All the beams were simply supported, spanning 6 m, monolithic and segmental, combining external and internal prestressing, with different amounts of prestress- ing and reinforcing steel and different types of filler material in tendon ducts (wax, cement mortar). Other tests were performed at the Construction Tech- nology Laboratories, Skokie, IL [9] and designed by Figg and Muller Engineers. Two beams were tested, both segmental and spanning 9.44 m, one with internal pre- stressing and the second with external pretressing. The second one was retested after encasing parts of the exter- nal tendons with concrete.

Welcome message from author
This document is posted to help you gain knowledge. Please leave a comment to let me know what you think about it! Share it to your friends and learn new things together.
Transcript
Engineering Structures 24 (2002) 73–84www.elsevier.com/locate/engstruct
Testing of externally prestressed concrete beams
Angel C. Aparicio*, Gonzalo Ramos, Juan R. CasasCivil Engineering School, Universitat Politecnica de Catalunya, Jordi Girona, 1–3, Mod. C-1, 08034 Barcelona, Spain
Received 23 October 2000; received in revised form 18 June 2001; accepted 21 June 2001
Abstract
This paper presents the results of a test program on externally prestressed concrete beams. Five monolithic and three segmentalbeams were tested in bending and in combined bending and shear. The most significant results are presented such as carryingcapacity, prestressing steel stress increase at ultimate, shear behavior of open joints. Conclusions on ultimate load capacity ofexternally prestressed beams and influence of the tendon length on this capacity are obtained. These tests have been used to validatea numerical finite element model already presented. 2001 Elsevier Science Ltd. All rights reserved.
Keywords: Bridges; External prestressing; Segmental construction; Prestressed concrete; Large-scale testing
1. Introduction
The ultimate behavior of externally prestressed,monolithic or segmental, bridges is different from intern-ally prestressed bridges. Those differences have alreadybeen presented in several papers [1,2] and are related tothe unbonded nature of the external prestressing. As aconsequence the analysis of externally prestressed beamsoffers one additional level of difficulty in comparisonwith the analysis of conventional internally prestressedbeams: the prestressing steel stress at ultimate can notbe accurately calculated with a sectional analysis. Inaddition, the ultimate shear behavior of segmentalbridges with dry joints, multiple shear keys and externalprestressing is also different because of the lack ofbonded steel crossing the joint and also because of thecombination of shear with joint opening [3].
Most European codes allow no increase of prestress-ing steel stress at ultimate (�fps=0) unless an accurateanalysis is performed [4]. On the other hand, Americancodes [5,6] and some European codes recommend valuesor approximate formulas for estimating�fps. It isbelieved that European codes are too conservative and,on the other hand, American codes sometimes rec-ommend unreasonably high increments of stress. To try
* Corresponding author. Tel.:+34-934016514, fax:+34-934011036.E-mail address: [email protected] (A.C. Aparicio).
0141-0296/02/$ - see front matter 2001 Elsevier Science Ltd. All rights reserved.PII: S0141-0296 (01)00062-1
to reconcile these extreme positions, a research programwas initiated at the Technical University of Catalunya(UPC) to study the behavior of bridges with externalprestressing. The program includes the development ofa numerical analysis model [7] and the performance ofparametric studies [2], as well as the performance of lab-oratory model tests. This paper presents the laboratorymodel tests on monolithic and segmental simply sup-ported and continuous beams. Flexural and shear testswere performed.
2. Recent literature
Several tests on externally prestressed beams havealready been performed. The largest test program wasdeveloped at CEBTP (France) [8], where 11 beams weretested. All the beams were simply supported, spanning6 m, monolithic and segmental, combining external andinternal prestressing, with different amounts of prestress-ing and reinforcing steel and different types of fillermaterial in tendon ducts (wax, cement mortar).
Other tests were performed at the Construction Tech-nology Laboratories, Skokie, IL [9] and designed byFigg and Muller Engineers. Two beams were tested, bothsegmental and spanning 9.44 m, one with internal pre-stressing and the second with external pretressing. Thesecond one was retested after encasing parts of the exter-nal tendons with concrete.
74 A.C. Aparicio et al. / Engineering Structures 24 (2002) 73–84
At the University of Texas at Austin several tests wereperformed on a one-quarter scale three-span externallypost-tensioned box girder bridge model [10]. Each spancontained ten typical segments, and joints were eitherepoxy filled or dry. The model was tested up to failureand was repaired and tested again. A series of 12 sheartests of post-tensioned concrete segmental beams withunbonded internal tendons were also performed [3].
The only two full-scale destructive tests performed onprecast segmental box girder bridges are: one 45.25 mspan of the Second Stage Expressway (SSE) in Bangkok[11], and one 44.4 m span of the Bang Na–Bang Pli–Bang Pakong Expressway (BBBE) in Bangkok [12]. Thelast of the tests was in bending and torsion of a span27.2 m wide, for six lanes of traffic.
3. Test program
The relatively limited number of tests available doesnot cover all the aspects related to external prestressingand segmental construction. For example there is noexperimental study on the influence of the tendon lengthor the shear strength of open joints in box girders.Besides, most of the studies reported in the literature donot give complete test data. Hence, the authors carriedout a complete test program to verify the numericalmodel also developed [7], and the parametric study per-formed [2].
The test program includes simply supported and con-tinuous beams, monolithic and segmental, tested up tofailure by flexure and by shear.
The variables studied in the tests are directly involvedin the evaluation of the nominal flexural resistance. Forexternal prestressing the prestressing steel stress at ulti-mate (fps) must be calculated from the effective stress (fpe) using the equation
fps�fpe��fps (1)
where
�fps��LL0
Ep (2)
L0 is the tendon length between fixed points (anchoragesor deviators with no slip of the tendons) before loadingand �L is the increment of length of the tendon at ulti-mate, due to the deflection of the beam.
The deflection profile of the beam is the main variablebecause it governs the value of �L, and it depends on:
� The support scheme of the beam: simply supportedor continuous.
� The span-to-depth ratio of the beam.� The load scheme (symmetric or non-symmetric).� The erection of the beam (monolithic or segmental).
� The amount of prestressing.
Other variables that change the value of L0 are:
� The slip of the tendons at the deviators.� The total length of the tendons.
The tendons of continuous beams can be anchored atevery pier diaphragm or, for instance, at every other pierdiaphragm which is a technique widely used in Europebecause it reduces the cost of the prestressing. In Europethe most common type of external tendon is the doubleduct tendon, which allows their replacement. However,the anchorages are more expensive than anchorages fornormal internal tendons, so a decrease in the number ofanchorages has an economical benefit even though theprestressing is less effective at ultimate.
The tests were designed to cover all these parameters.The characteristics of the tested beams are shown inTable 1.
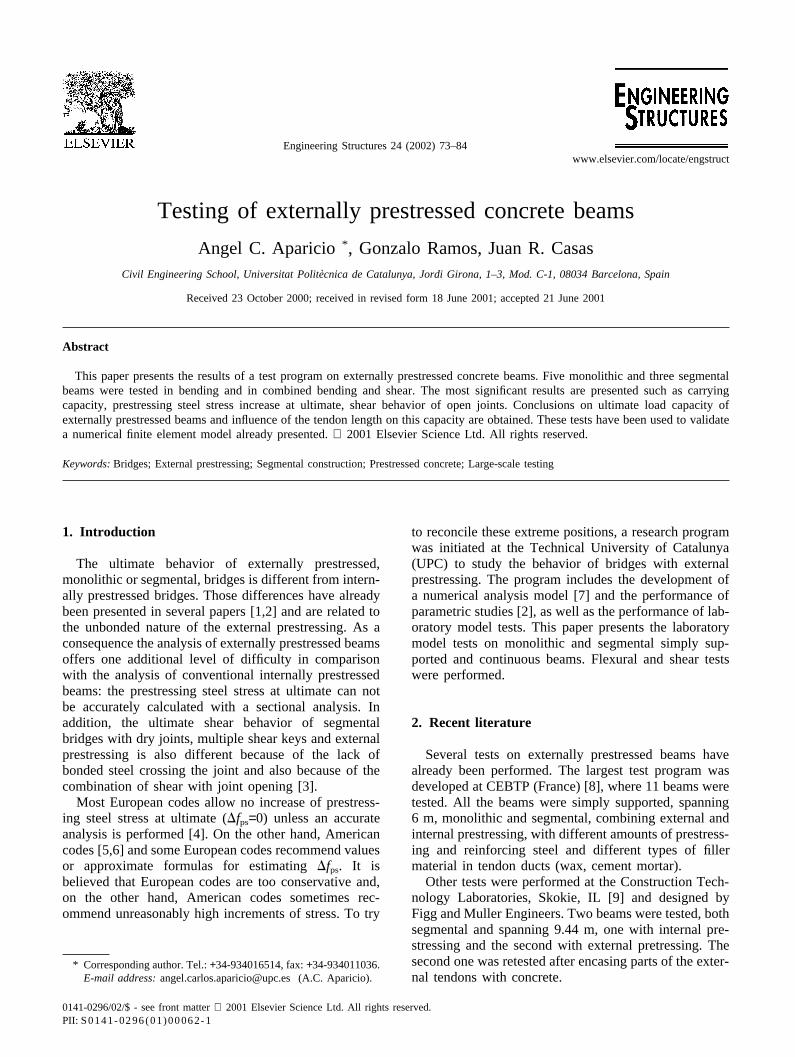
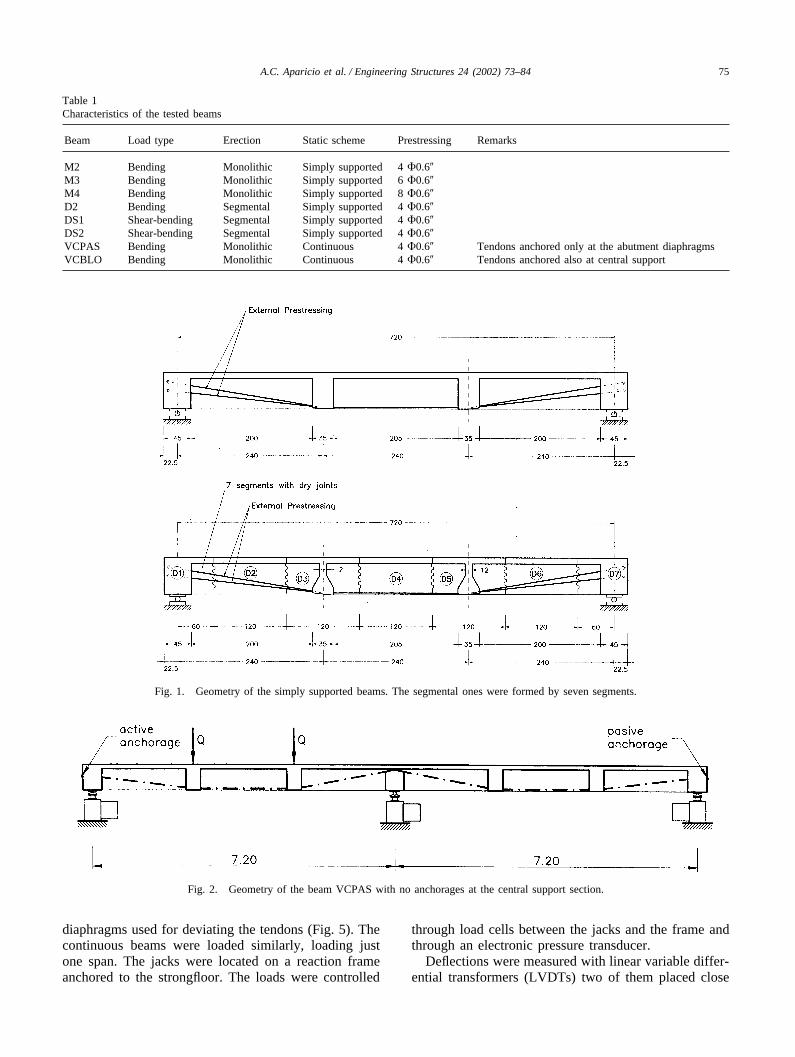
The span of the simply supported beams was 7.20 mand 7.20+7.20 m for the continuous beam, and the depthwas 0.60 m (Figs. 1–3). The cross-section was a boxgirder (Fig. 4) with webs and flanges 10 cm wide. Thetendons were deviated at 1/3 points by concrete deviatorsand placed outside the box girder to make monitoringpossible. The strands were naked, with no duct, and thedeviators were steel tubes embedded in the concrete.
The monolithic beams were reinforced with 8 mmdiameter bars, in order to resist self weight during trans-port and placing at the laboratory. The shear reinforce-ment was designed according to the Spanish code.
The segmental beams, with the same geometry as themonolithic ones, were formed by seven segments withmultiple shear keys and dry joints. There was no rein-forcing or bonded prestressing steel crossing the joints.
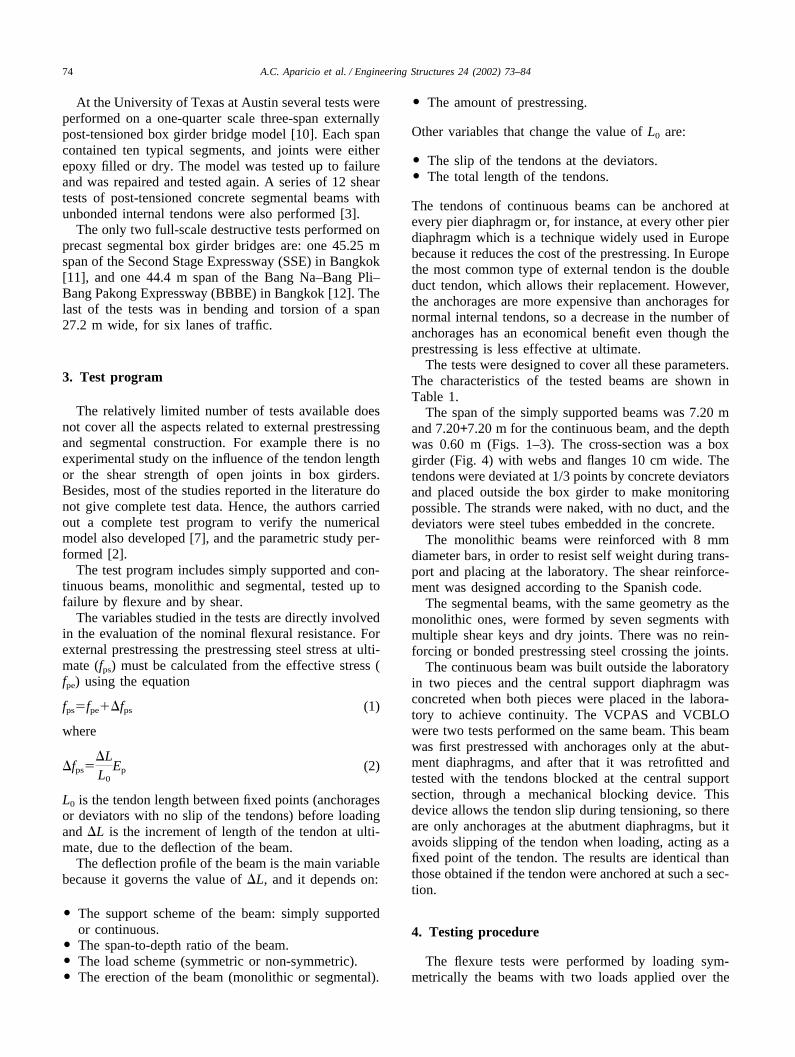
The continuous beam was built outside the laboratoryin two pieces and the central support diaphragm wasconcreted when both pieces were placed in the labora-tory to achieve continuity. The VCPAS and VCBLOwere two tests performed on the same beam. This beamwas first prestressed with anchorages only at the abut-ment diaphragms, and after that it was retrofitted andtested with the tendons blocked at the central supportsection, through a mechanical blocking device. Thisdevice allows the tendon slip during tensioning, so thereare only anchorages at the abutment diaphragms, but itavoids slipping of the tendon when loading, acting as afixed point of the tendon. The results are identical thanthose obtained if the tendon were anchored at such a sec-tion.
4. Testing procedure
The flexure tests were performed by loading sym-metrically the beams with two loads applied over the
75A.C. Aparicio et al. / Engineering Structures 24 (2002) 73–84
Table 1Characteristics of the tested beams
Beam Load type Erection Static scheme Prestressing Remarks
M2 Bending Monolithic Simply supported 4 �0.6�M3 Bending Monolithic Simply supported 6 �0.6�M4 Bending Monolithic Simply supported 8 �0.6�D2 Bending Segmental Simply supported 4 �0.6�DS1 Shear-bending Segmental Simply supported 4 �0.6�DS2 Shear-bending Segmental Simply supported 4 �0.6�VCPAS Bending Monolithic Continuous 4 �0.6� Tendons anchored only at the abutment diaphragmsVCBLO Bending Monolithic Continuous 4 �0.6� Tendons anchored also at central support
Fig. 1. Geometry of the simply supported beams. The segmental ones were formed by seven segments.
Fig. 2. Geometry of the beam VCPAS with no anchorages at the central support section.
diaphragms used for deviating the tendons (Fig. 5). Thecontinuous beams were loaded similarly, loading justone span. The jacks were located on a reaction frameanchored to the strongfloor. The loads were controlled
through load cells between the jacks and the frame andthrough an electronic pressure transducer.
Deflections were measured with linear variable differ-ential transformers (LVDTs) two of them placed close
76 A.C. Aparicio et al. / Engineering Structures 24 (2002) 73–84
Fig. 3. Geometry of the beam VCBLO with a mechanical blocking device of the tendon at the central support.
Fig. 4. Cross-section of the box girder.
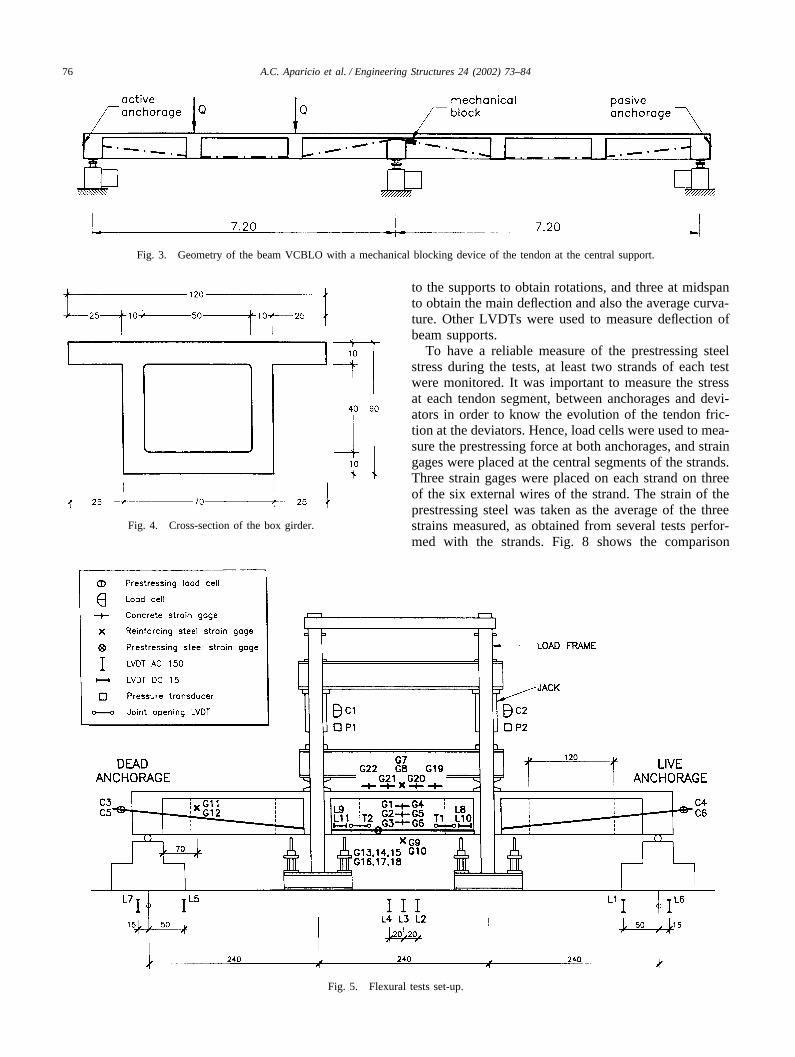
Fig. 5. Flexural tests set-up.
to the supports to obtain rotations, and three at midspanto obtain the main deflection and also the average curva-ture. Other LVDTs were used to measure deflection ofbeam supports.
To have a reliable measure of the prestressing steelstress during the tests, at least two strands of each testwere monitored. It was important to measure the stressat each tendon segment, between anchorages and devi-ators in order to know the evolution of the tendon fric-tion at the deviators. Hence, load cells were used to mea-sure the prestressing force at both anchorages, and straingages were placed at the central segments of the strands.Three strain gages were placed on each strand on threeof the six external wires of the strand. The strain of theprestressing steel was taken as the average of the threestrains measured, as obtained from several tests perfor-med with the strands. Fig. 8 shows the comparison
77A.C. Aparicio et al. / Engineering Structures 24 (2002) 73–84
between the prestressing steel stress at each segment ofthe D2 beam tendon.
It was important to measure slip of the tendons at thedeviators in order to determine the prestressing steelstress at ultimate. LVDTs attached to the tendons meas-ured slip during the tests.
The concrete compression strain was measured bystrain gages on the concrete and also on the reinforcingsteel in compression. The tension reinforcing steel stressin monolithic beams was measured also by strain gages.
Magnetic transducers monitored the joint opening ofthe segmental beams.
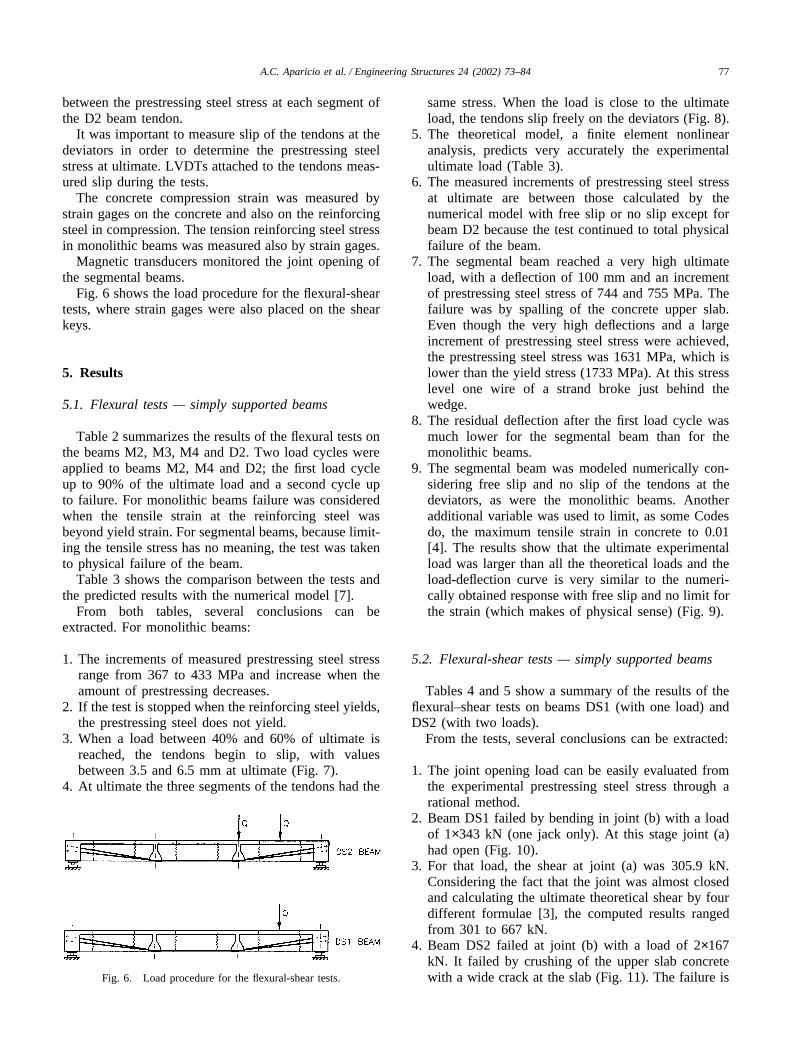
Fig. 6 shows the load procedure for the flexural-sheartests, where strain gages were also placed on the shearkeys.
5. Results
5.1. Flexural tests — simply supported beams
Table 2 summarizes the results of the flexural tests onthe beams M2, M3, M4 and D2. Two load cycles wereapplied to beams M2, M4 and D2; the first load cycleup to 90% of the ultimate load and a second cycle upto failure. For monolithic beams failure was consideredwhen the tensile strain at the reinforcing steel wasbeyond yield strain. For segmental beams, because limit-ing the tensile stress has no meaning, the test was takento physical failure of the beam.
Table 3 shows the comparison between the tests andthe predicted results with the numerical model [7].
From both tables, several conclusions can beextracted. For monolithic beams:
1. The increments of measured prestressing steel stressrange from 367 to 433 MPa and increase when theamount of prestressing decreases.
2. If the test is stopped when the reinforcing steel yields,the prestressing steel does not yield.
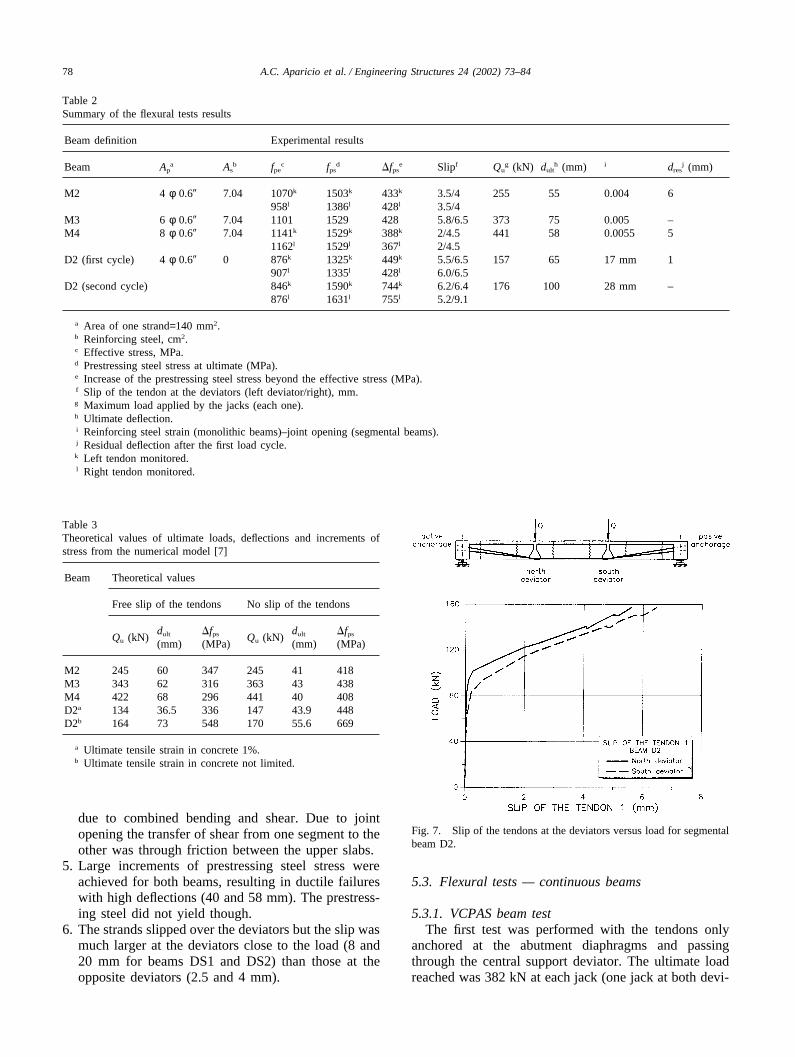
3. When a load between 40% and 60% of ultimate isreached, the tendons begin to slip, with valuesbetween 3.5 and 6.5 mm at ultimate (Fig. 7).
4. At ultimate the three segments of the tendons had the
Fig. 6. Load procedure for the flexural-shear tests.
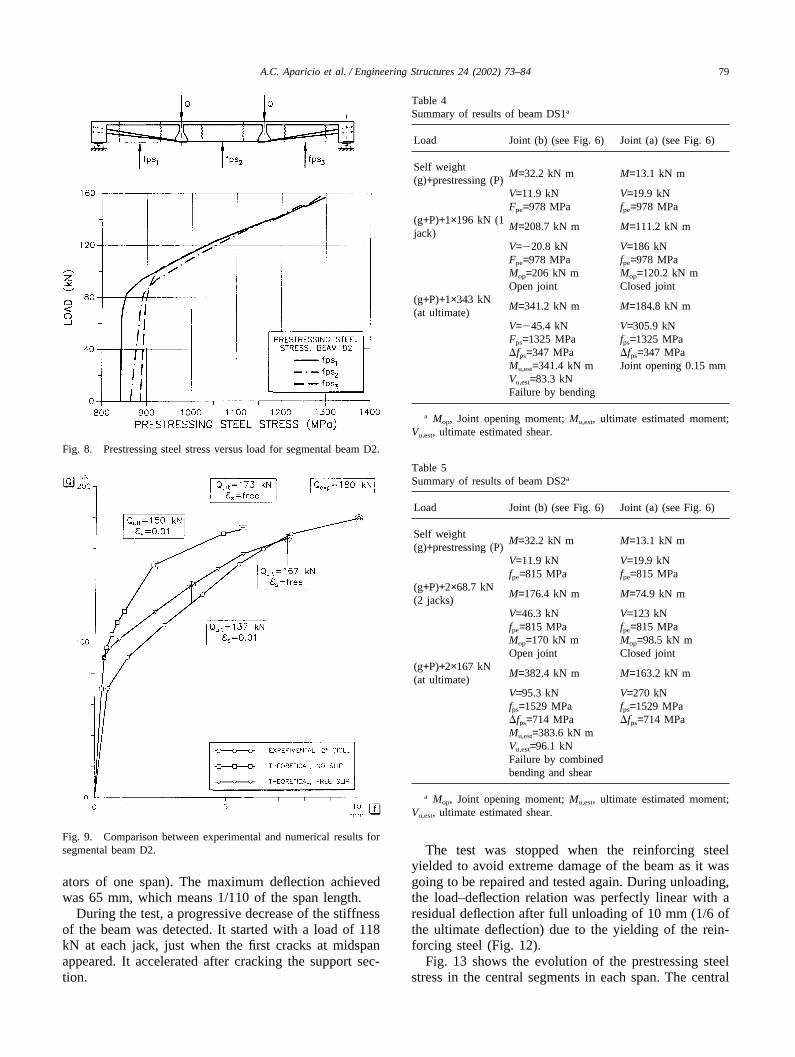
same stress. When the load is close to the ultimateload, the tendons slip freely on the deviators (Fig. 8).
5. The theoretical model, a finite element nonlinearanalysis, predicts very accurately the experimentalultimate load (Table 3).
6. The measured increments of prestressing steel stressat ultimate are between those calculated by thenumerical model with free slip or no slip except forbeam D2 because the test continued to total physicalfailure of the beam.
7. The segmental beam reached a very high ultimateload, with a deflection of 100 mm and an incrementof prestressing steel stress of 744 and 755 MPa. Thefailure was by spalling of the concrete upper slab.Even though the very high deflections and a largeincrement of prestressing steel stress were achieved,the prestressing steel stress was 1631 MPa, which islower than the yield stress (1733 MPa). At this stresslevel one wire of a strand broke just behind thewedge.
8. The residual deflection after the first load cycle wasmuch lower for the segmental beam than for themonolithic beams.
9. The segmental beam was modeled numerically con-sidering free slip and no slip of the tendons at thedeviators, as were the monolithic beams. Anotheradditional variable was used to limit, as some Codesdo, the maximum tensile strain in concrete to 0.01[4]. The results show that the ultimate experimentalload was larger than all the theoretical loads and theload-deflection curve is very similar to the numeri-cally obtained response with free slip and no limit forthe strain (which makes of physical sense) (Fig. 9).
5.2. Flexural-shear tests — simply supported beams
Tables 4 and 5 show a summary of the results of theflexural–shear tests on beams DS1 (with one load) andDS2 (with two loads).
From the tests, several conclusions can be extracted:
1. The joint opening load can be easily evaluated fromthe experimental prestressing steel stress through arational method.
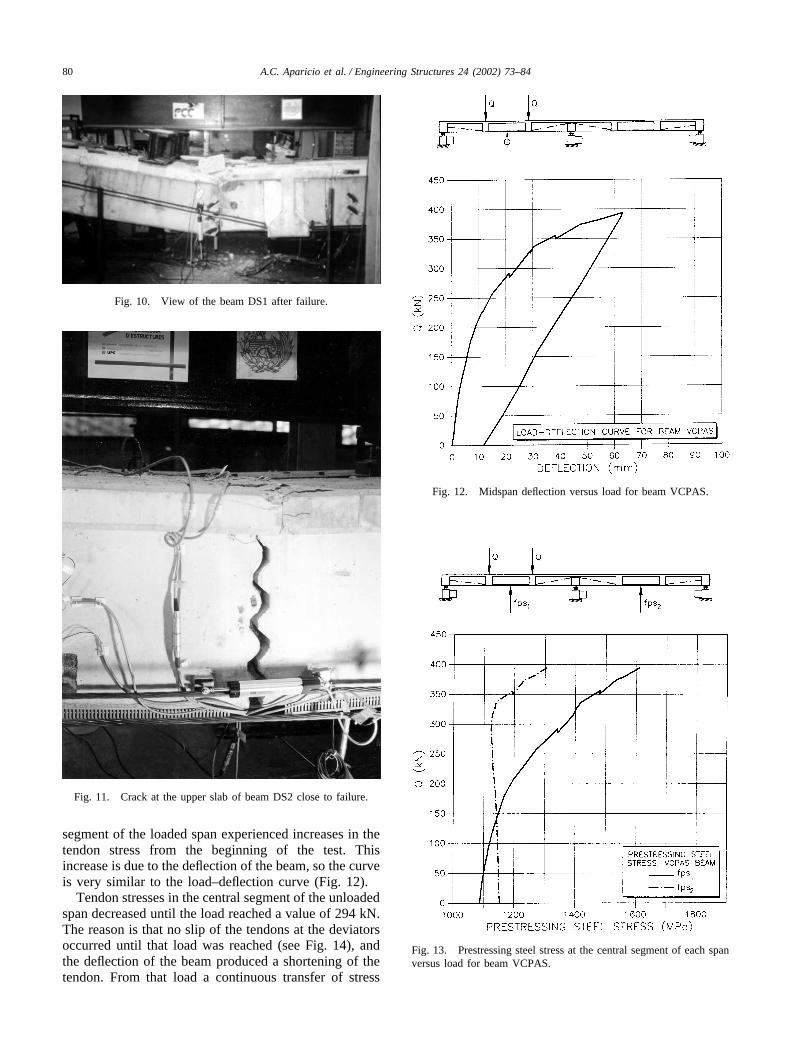
2. Beam DS1 failed by bending in joint (b) with a loadof 1×343 kN (one jack only). At this stage joint (a)had open (Fig. 10).
3. For that load, the shear at joint (a) was 305.9 kN.Considering the fact that the joint was almost closedand calculating the ultimate theoretical shear by fourdifferent formulae [3], the computed results rangedfrom 301 to 667 kN.
4. Beam DS2 failed at joint (b) with a load of 2×167kN. It failed by crushing of the upper slab concretewith a wide crack at the slab (Fig. 11). The failure is
78 A.C. Aparicio et al. / Engineering Structures 24 (2002) 73–84
Table 2Summary of the flexural tests results
Beam definition Experimental results
Beam Apa As
b fpec fps
d �fpse Slipf Qu
g (kN) dulth (mm) i dres
j (mm)
M2 4 φ 0.6� 7.04 1070k 1503k 433k 3.5/4 255 55 0.004 6958l 1386l 428l 3.5/4
M3 6 φ 0.6� 7.04 1101 1529 428 5.8/6.5 373 75 0.005 –M4 8 φ 0.6� 7.04 1141k 1529k 388k 2/4.5 441 58 0.0055 5
1162l 1529l 367l 2/4.5D2 (first cycle) 4 φ 0.6� 0 876k 1325k 449k 5.5/6.5 157 65 17 mm 1
907l 1335l 428l 6.0/6.5D2 (second cycle) 846k 1590k 744k 6.2/6.4 176 100 28 mm –
876l 1631l 755l 5.2/9.1
a Area of one strand=140 mm2.b Reinforcing steel, cm2.c Effective stress, MPa.d Prestressing steel stress at ultimate (MPa).e Increase of the prestressing steel stress beyond the effective stress (MPa).f Slip of the tendon at the deviators (left deviator/right), mm.g Maximum load applied by the jacks (each one).h Ultimate deflection.i Reinforcing steel strain (monolithic beams)–joint opening (segmental beams).j Residual deflection after the first load cycle.k Left tendon monitored.l Right tendon monitored.
Table 3Theoretical values of ultimate loads, deflections and increments ofstress from the numerical model [7]
Beam Theoretical values
Free slip of the tendons No slip of the tendons
dult �fps dult �fpsQu (kN) Qu (kN)(mm) (MPa) (mm) (MPa)
M2 245 60 347 245 41 418M3 343 62 316 363 43 438M4 422 68 296 441 40 408D2a 134 36.5 336 147 43.9 448D2b 164 73 548 170 55.6 669
a Ultimate tensile strain in concrete 1%.b Ultimate tensile strain in concrete not limited.
due to combined bending and shear. Due to jointopening the transfer of shear from one segment to theother was through friction between the upper slabs.
5. Large increments of prestressing steel stress wereachieved for both beams, resulting in ductile failureswith high deflections (40 and 58 mm). The prestress-ing steel did not yield though.
6. The strands slipped over the deviators but the slip wasmuch larger at the deviators close to the load (8 and20 mm for beams DS1 and DS2) than those at theopposite deviators (2.5 and 4 mm).
Fig. 7. Slip of the tendons at the deviators versus load for segmentalbeam D2.
5.3. Flexural tests — continuous beams
5.3.1. VCPAS beam testThe first test was performed with the tendons only
anchored at the abutment diaphragms and passingthrough the central support deviator. The ultimate loadreached was 382 kN at each jack (one jack at both devi-
79A.C. Aparicio et al. / Engineering Structures 24 (2002) 73–84
Fig. 8. Prestressing steel stress versus load for segmental beam D2.
Fig. 9. Comparison between experimental and numerical results forsegmental beam D2.
ators of one span). The maximum deflection achievedwas 65 mm, which means 1/110 of the span length.
During the test, a progressive decrease of the stiffnessof the beam was detected. It started with a load of 118kN at each jack, just when the first cracks at midspanappeared. It accelerated after cracking the support sec-tion.
Table 4Summary of results of beam DS1a
Load Joint (b) (see Fig. 6) Joint (a) (see Fig. 6)
Self weightM=32.2 kN m M=13.1 kN m
(g)+prestressing (P)V=11.9 kN V=19.9 kNFpe=978 MPa fpe=978 MPa
(g+P)+1×196 kN (1M=208.7 kN m M=111.2 kN m
jack)V=�20.8 kN V=186 kNFpe=978 MPa fpe=978 MPaMop=206 kN m Mop=120.2 kN mOpen joint Closed joint
(g+P)+1×343 kNM=341.2 kN m M=184.8 kN m
(at ultimate)V=�45.4 kN V=305.9 kNFps=1325 MPa fps=1325 MPa�fps=347 MPa �fps=347 MPaMu,est=341.4 kN m Joint opening 0.15 mmVu,est=83.3 kNFailure by bending
a Mop, Joint opening moment; Mu,est, ultimate estimated moment;Vu,est, ultimate estimated shear.
Table 5Summary of results of beam DS2a
Load Joint (b) (see Fig. 6) Joint (a) (see Fig. 6)
Self weightM=32.2 kN m M=13.1 kN m
(g)+prestressing (P)V=11.9 kN V=19.9 kNfpe=815 MPa fpe=815 MPa
(g+P)+2×68.7 kNM=176.4 kN m M=74.9 kN m
(2 jacks)V=46.3 kN V=123 kNfpe=815 MPa fpe=815 MPaMop=170 kN m Mop=98.5 kN mOpen joint Closed joint
(g+P)+2×167 kNM=382.4 kN m M=163.2 kN m
(at ultimate)V=95.3 kN V=270 kNfps=1529 MPa fps=1529 MPa�fps=714 MPa �fps=714 MPaMu,est=383.6 kN mVu,est=96.1 kNFailure by combinedbending and shear
a Mop, Joint opening moment; Mu,est, ultimate estimated moment;Vu,est, ultimate estimated shear.
The test was stopped when the reinforcing steelyielded to avoid extreme damage of the beam as it wasgoing to be repaired and tested again. During unloading,the load–deflection relation was perfectly linear with aresidual deflection after full unloading of 10 mm (1/6 ofthe ultimate deflection) due to the yielding of the rein-forcing steel (Fig. 12).
Fig. 13 shows the evolution of the prestressing steelstress in the central segments in each span. The central
80 A.C. Aparicio et al. / Engineering Structures 24 (2002) 73–84
Fig. 10. View of the beam DS1 after failure.
Fig. 11. Crack at the upper slab of beam DS2 close to failure.
segment of the loaded span experienced increases in thetendon stress from the beginning of the test. Thisincrease is due to the deflection of the beam, so the curveis very similar to the load–deflection curve (Fig. 12).
Tendon stresses in the central segment of the unloadedspan decreased until the load reached a value of 294 kN.The reason is that no slip of the tendons at the deviatorsoccurred until that load was reached (see Fig. 14), andthe deflection of the beam produced a shortening of thetendon. From that load a continuous transfer of stress
Fig. 12. Midspan deflection versus load for beam VCPAS.
Fig. 13. Prestressing steel stress at the central segment of each spanversus load for beam VCPAS.
81A.C. Aparicio et al. / Engineering Structures 24 (2002) 73–84
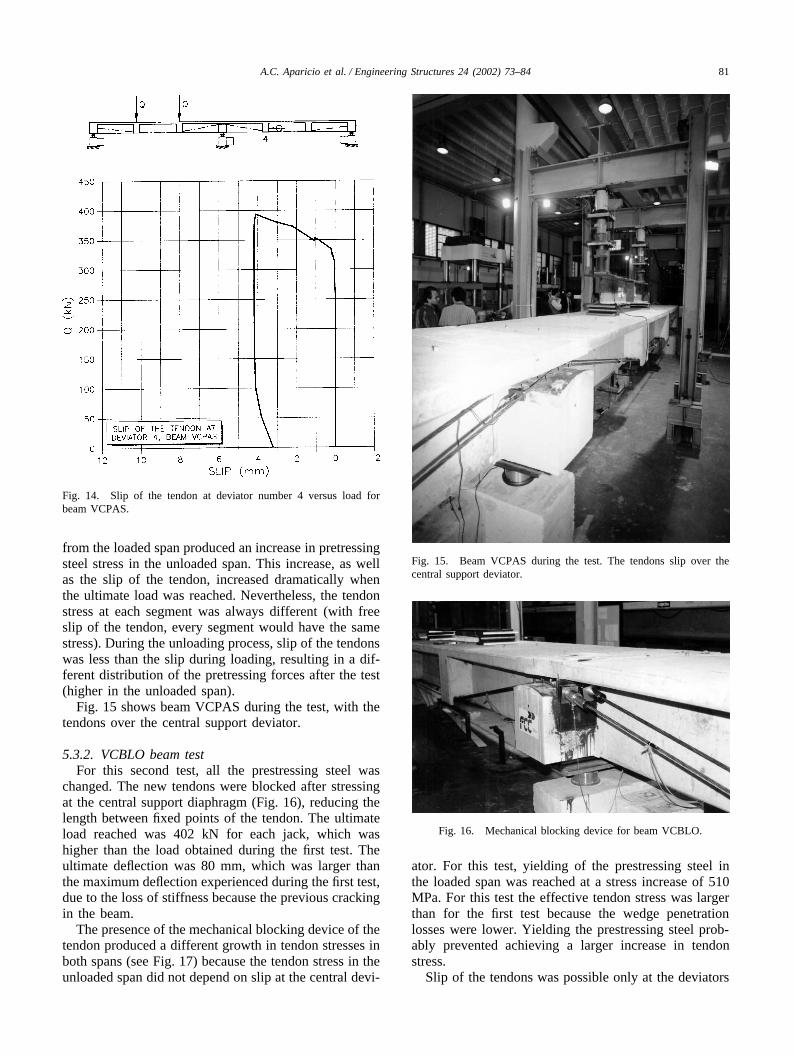
Fig. 14. Slip of the tendon at deviator number 4 versus load forbeam VCPAS.
from the loaded span produced an increase in pretressingsteel stress in the unloaded span. This increase, as wellas the slip of the tendon, increased dramatically whenthe ultimate load was reached. Nevertheless, the tendonstress at each segment was always different (with freeslip of the tendon, every segment would have the samestress). During the unloading process, slip of the tendonswas less than the slip during loading, resulting in a dif-ferent distribution of the pretressing forces after the test(higher in the unloaded span).
Fig. 15 shows beam VCPAS during the test, with thetendons over the central support deviator.
5.3.2. VCBLO beam testFor this second test, all the prestressing steel was
changed. The new tendons were blocked after stressingat the central support diaphragm (Fig. 16), reducing thelength between fixed points of the tendon. The ultimateload reached was 402 kN for each jack, which washigher than the load obtained during the first test. Theultimate deflection was 80 mm, which was larger thanthe maximum deflection experienced during the first test,due to the loss of stiffness because the previous crackingin the beam.
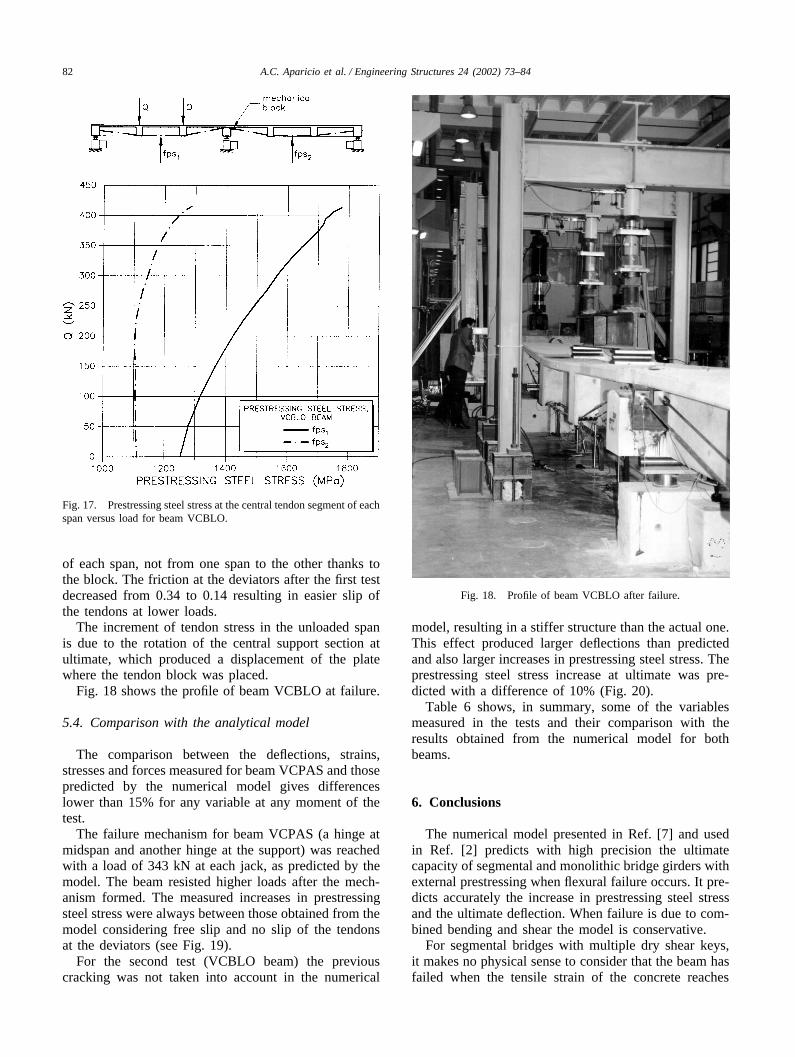
The presence of the mechanical blocking device of thetendon produced a different growth in tendon stresses inboth spans (see Fig. 17) because the tendon stress in theunloaded span did not depend on slip at the central devi-
Fig. 15. Beam VCPAS during the test. The tendons slip over thecentral support deviator.
Fig. 16. Mechanical blocking device for beam VCBLO.
ator. For this test, yielding of the prestressing steel inthe loaded span was reached at a stress increase of 510MPa. For this test the effective tendon stress was largerthan for the first test because the wedge penetrationlosses were lower. Yielding the prestressing steel prob-ably prevented achieving a larger increase in tendonstress.
Slip of the tendons was possible only at the deviators
82 A.C. Aparicio et al. / Engineering Structures 24 (2002) 73–84
Fig. 17. Prestressing steel stress at the central tendon segment of eachspan versus load for beam VCBLO.
of each span, not from one span to the other thanks tothe block. The friction at the deviators after the first testdecreased from 0.34 to 0.14 resulting in easier slip ofthe tendons at lower loads.
The increment of tendon stress in the unloaded spanis due to the rotation of the central support section atultimate, which produced a displacement of the platewhere the tendon block was placed.
Fig. 18 shows the profile of beam VCBLO at failure.
5.4. Comparison with the analytical model
The comparison between the deflections, strains,stresses and forces measured for beam VCPAS and thosepredicted by the numerical model gives differenceslower than 15% for any variable at any moment of thetest.
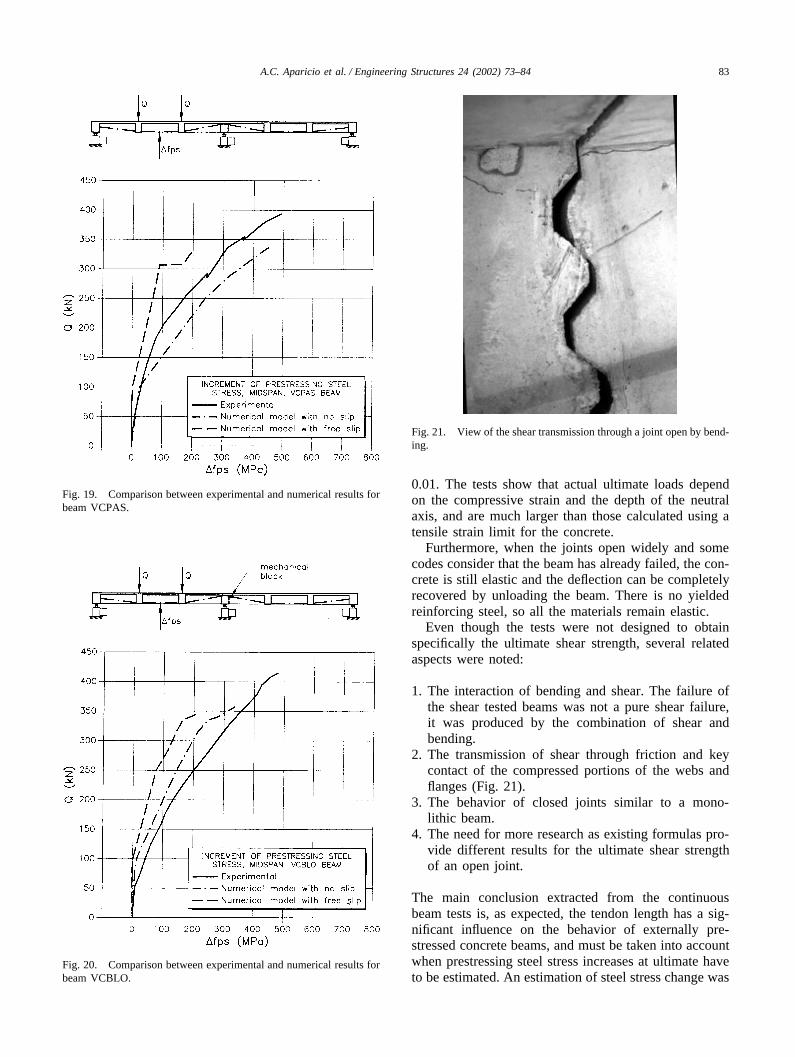
The failure mechanism for beam VCPAS (a hinge atmidspan and another hinge at the support) was reachedwith a load of 343 kN at each jack, as predicted by themodel. The beam resisted higher loads after the mech-anism formed. The measured increases in prestressingsteel stress were always between those obtained from themodel considering free slip and no slip of the tendonsat the deviators (see Fig. 19).
For the second test (VCBLO beam) the previouscracking was not taken into account in the numerical
Fig. 18. Profile of beam VCBLO after failure.
model, resulting in a stiffer structure than the actual one.This effect produced larger deflections than predictedand also larger increases in prestressing steel stress. Theprestressing steel stress increase at ultimate was pre-dicted with a difference of 10% (Fig. 20).
Table 6 shows, in summary, some of the variablesmeasured in the tests and their comparison with theresults obtained from the numerical model for bothbeams.
6. Conclusions
The numerical model presented in Ref. [7] and usedin Ref. [2] predicts with high precision the ultimatecapacity of segmental and monolithic bridge girders withexternal prestressing when flexural failure occurs. It pre-dicts accurately the increase in prestressing steel stressand the ultimate deflection. When failure is due to com-bined bending and shear the model is conservative.
For segmental bridges with multiple dry shear keys,it makes no physical sense to consider that the beam hasfailed when the tensile strain of the concrete reaches
83A.C. Aparicio et al. / Engineering Structures 24 (2002) 73–84
Fig. 19. Comparison between experimental and numerical results forbeam VCPAS.
Fig. 20. Comparison between experimental and numerical results forbeam VCBLO.
Fig. 21. View of the shear transmission through a joint open by bend-ing.
0.01. The tests show that actual ultimate loads dependon the compressive strain and the depth of the neutralaxis, and are much larger than those calculated using atensile strain limit for the concrete.
Furthermore, when the joints open widely and somecodes consider that the beam has already failed, the con-crete is still elastic and the deflection can be completelyrecovered by unloading the beam. There is no yieldedreinforcing steel, so all the materials remain elastic.
Even though the tests were not designed to obtainspecifically the ultimate shear strength, several relatedaspects were noted:
1. The interaction of bending and shear. The failure ofthe shear tested beams was not a pure shear failure,it was produced by the combination of shear andbending.
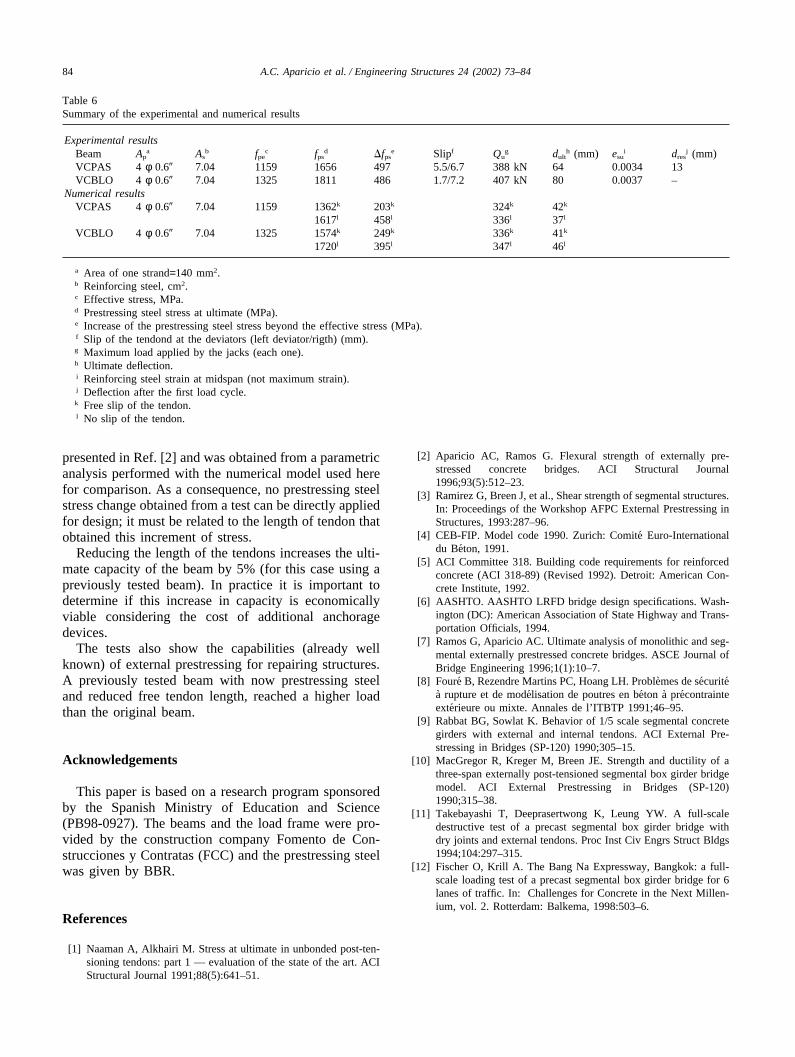
2. The transmission of shear through friction and keycontact of the compressed portions of the webs andflanges (Fig. 21).
3. The behavior of closed joints similar to a mono-lithic beam.
4. The need for more research as existing formulas pro-vide different results for the ultimate shear strengthof an open joint.
The main conclusion extracted from the continuousbeam tests is, as expected, the tendon length has a sig-nificant influence on the behavior of externally pre-stressed concrete beams, and must be taken into accountwhen prestressing steel stress increases at ultimate haveto be estimated. An estimation of steel stress change was
84 A.C. Aparicio et al. / Engineering Structures 24 (2002) 73–84
Table 6Summary of the experimental and numerical results
Experimental resultsBeam Ap
a Asb fpe
c fpsd �fps
e Slipf Qug dult
h (mm) esui dres
j (mm)VCPAS 4 φ 0.6� 7.04 1159 1656 497 5.5/6.7 388 kN 64 0.0034 13VCBLO 4 φ 0.6� 7.04 1325 1811 486 1.7/7.2 407 kN 80 0.0037 –
Numerical resultsVCPAS 4 φ 0.6� 7.04 1159 1362k 203k 324k 42k
1617l 458l 336l 37l
VCBLO 4 φ 0.6� 7.04 1325 1574k 249k 336k 41k
1720l 395l 347l 46l
a Area of one strand=140 mm2.b Reinforcing steel, cm2.c Effective stress, MPa.d Prestressing steel stress at ultimate (MPa).e Increase of the prestressing steel stress beyond the effective stress (MPa).f Slip of the tendond at the deviators (left deviator/rigth) (mm).g Maximum load applied by the jacks (each one).h Ultimate deflection.i Reinforcing steel strain at midspan (not maximum strain).j Deflection after the first load cycle.k Free slip of the tendon.l No slip of the tendon.
presented in Ref. [2] and was obtained from a parametricanalysis performed with the numerical model used herefor comparison. As a consequence, no prestressing steelstress change obtained from a test can be directly appliedfor design; it must be related to the length of tendon thatobtained this increment of stress.
Reducing the length of the tendons increases the ulti-mate capacity of the beam by 5% (for this case using apreviously tested beam). In practice it is important todetermine if this increase in capacity is economicallyviable considering the cost of additional anchoragedevices.
The tests also show the capabilities (already wellknown) of external prestressing for repairing structures.A previously tested beam with now prestressing steeland reduced free tendon length, reached a higher loadthan the original beam.
Acknowledgements
This paper is based on a research program sponsoredby the Spanish Ministry of Education and Science(PB98-0927). The beams and the load frame were pro-vided by the construction company Fomento de Con-strucciones y Contratas (FCC) and the prestressing steelwas given by BBR.
References
[1] Naaman A, Alkhairi M. Stress at ultimate in unbonded post-ten-sioning tendons: part 1 — evaluation of the state of the art. ACIStructural Journal 1991;88(5):641–51.
[2] Aparicio AC, Ramos G. Flexural strength of externally pre-stressed concrete bridges. ACI Structural Journal1996;93(5):512–23.
[3] Ramirez G, Breen J, et al., Shear strength of segmental structures.In: Proceedings of the Workshop AFPC External Prestressing inStructures, 1993:287–96.
[4] CEB-FIP. Model code 1990. Zurich: Comite Euro-Internationaldu Beton, 1991.
[5] ACI Committee 318. Building code requirements for reinforcedconcrete (ACI 318-89) (Revised 1992). Detroit: American Con-crete Institute, 1992.
[6] AASHTO. AASHTO LRFD bridge design specifications. Wash-ington (DC): American Association of State Highway and Trans-portation Officials, 1994.
[7] Ramos G, Aparicio AC. Ultimate analysis of monolithic and seg-mental externally prestressed concrete bridges. ASCE Journal ofBridge Engineering 1996;1(1):10–7.
[8] Foure B, Rezendre Martins PC, Hoang LH. Problemes de securitea rupture et de modelisation de poutres en beton a precontrainteexterieure ou mixte. Annales de l’ ITBTP 1991;46–95.
[9] Rabbat BG, Sowlat K. Behavior of 1/5 scale segmental concretegirders with external and internal tendons. ACI External Pre-stressing in Bridges (SP-120) 1990;305–15.
[10] MacGregor R, Kreger M, Breen JE. Strength and ductility of athree-span externally post-tensioned segmental box girder bridgemodel. ACI External Prestressing in Bridges (SP-120)1990;315–38.
[11] Takebayashi T, Deeprasertwong K, Leung YW. A full-scaledestructive test of a precast segmental box girder bridge withdry joints and external tendons. Proc Inst Civ Engrs Struct Bldgs1994;104:297–315.
[12] Fischer O, Krill A. The Bang Na Expressway, Bangkok: a full-scale loading test of a precast segmental box girder bridge for 6lanes of traffic. In: Challenges for Concrete in the Next Millen-ium, vol. 2. Rotterdam: Balkema, 1998:503–6.
Related Documents