International Journal of Education Humanities and Social Science ISSN: 2582-0745 Vol. 2, No. 02; 2019 http://ijehss.com/ Page 1 TESTING NEUTRALITY OF MONEY BY EXAMINING THE RELATIONSHIP BETWEEN MONEY, PRICE AND OUTPUT IN SOMALIA Abdinur Ali Mohamed and Sid-Ali Ahmed Hussein Faculty of Economics, SIMAD UNIVERSITY ABSTRACT In this paper, the relationship between money supply, price and output in Somalia have been examined. The study is based on the well-known quantity theory of money applying the OLS method. Annual time series data of the study variables for the period 1970-2010 were used in the analysis. The results indicate that there is positive relationship between money supply and output growth which is consistent theoretically with the monetarist’s view. Whereas the price level (inflation) affects the output negatively in Somalia. Key Words: Money supply, Output, Somali Economy, Quantity Theory of Money 1. INTRODUCTION In an economy the money supply and the output are very important macroeconomic variables that effectively contribute to the changes in economic conditions particularly those occur in the price levels and interest rates. The non-stability of prices causes the situation of uncertainty in economics which may hurt the sustainable output growth. The relationship between money supply and output growth is still a debated issue in the theoretical economics. The Somalia economy is still brittle and although it is contributed by remittances and telecommunications sectors, it largely depends on the primary good sectors such as agriculture and livestock sectors. This dependency on primary products as a main source of the economy and export earnings indicates the vulnerability of the country to market dynamics, price fluctuations and environmental shocks (ADB, OECD, & UNDP, 2017). The growth of real GDP in Somalia was 1.2%, 2.8%, 3.6 and 3.2 in 2012, 2013, 2015 and 2016 respectively. This shows that in these years the Somali economy was growing steadily. But the economy has declined where the real economic growth was dropped to the 2.4% in 2017. This was the consequences of less agricultural output caused by the droughts and weaker rainy season that occurred in Somalia. Inflation has been declining in the last years for example, it has fallen from 4.5% in 2013 to 1.5% in 2016 (IMF, 2017). The investigation of the relationship between money, price and output has long root discussion in both the theoretical and empirical economics. Many researchers suggested their own view about this relationship based on the findings of their studies. These previous studies include: James Topin (1965), Benjamin M. Friedman and Kenneth N. Kuttner (1992), Frank J. Bonello and

Welcome message from author
This document is posted to help you gain knowledge. Please leave a comment to let me know what you think about it! Share it to your friends and learn new things together.
Transcript

International Journal of Education Humanities and Social Science
ISSN: 2582-0745 Vol. 2, No. 02; 2019
http://ijehss.com/ Page 1
TESTING NEUTRALITY OF MONEY BY EXAMINING THE RELATIONSHIP
BETWEEN MONEY, PRICE AND OUTPUT IN SOMALIA
Abdinur Ali Mohamed and Sid-Ali Ahmed Hussein
Faculty of Economics, SIMAD UNIVERSITY
ABSTRACT
In this paper, the relationship between money supply, price and output in Somalia have been
examined. The study is based on the well-known quantity theory of money applying the OLS
method. Annual time series data of the study variables for the period 1970-2010 were used in the
analysis. The results indicate that there is positive relationship between money supply and output
growth which is consistent theoretically with the monetarist’s view. Whereas the price level
(inflation) affects the output negatively in Somalia.
Key Words: Money supply, Output, Somali Economy, Quantity Theory of Money
1. INTRODUCTION
In an economy the money supply and the output are very important macroeconomic variables
that effectively contribute to the changes in economic conditions particularly those occur in the
price levels and interest rates. The non-stability of prices causes the situation of uncertainty in
economics which may hurt the sustainable output growth. The relationship between money
supply and output growth is still a debated issue in the theoretical economics.
The Somalia economy is still brittle and although it is contributed by remittances and
telecommunications sectors, it largely depends on the primary good sectors such as agriculture
and livestock sectors. This dependency on primary
products as a main source of the economy and export earnings indicates the vulnerability of the
country to market dynamics, price fluctuations and environmental shocks (ADB, OECD, &
UNDP, 2017).
The growth of real GDP in Somalia was 1.2%, 2.8%, 3.6 and 3.2 in 2012, 2013, 2015 and 2016
respectively. This shows that in these years the Somali economy was growing steadily. But the
economy has declined where the real economic growth was dropped to the 2.4% in 2017. This
was the consequences of less agricultural output caused by the droughts and weaker rainy season
that occurred in Somalia. Inflation has been declining in the last years for example, it has fallen
from 4.5% in 2013 to 1.5% in 2016 (IMF, 2017).
The investigation of the relationship between money, price and output has long root discussion in
both the theoretical and empirical economics. Many researchers suggested their own view about
this relationship based on the findings of their studies. These previous studies include: James
Topin (1965), Benjamin M. Friedman and Kenneth N. Kuttner (1992), Frank J. Bonello and

International Journal of Education Humanities and Social Science
ISSN: 2582-0745 Vol. 2, No. 02; 2019
http://ijehss.com/ Page 2
William R. Reichenstein (1981), Terry G. Seaks and Stuart D. Allen (1980), VafaMoayedi
(2013).The empirical studies have provided conflicting evidence onthis issue.
So, this study will examine the relationship between money, price level and output in Somalia.
Identifying the relationship and the interaction between money supply, prices and output growth
in the Somali economy improves the effectiveness of the monetary policy implementation.
The paper is organized as follows: section two will be the literature review, section three
provides the methodology of the study, section four will offer the findings and discussions and
last section will be conclusion.
2. LITERATURE REVIEW
A number of studies showed the causal relationship between money supply and output. On the
other hand, there was still consistency concerning of the results of these studies, some studies
showed unidirectional causality either from output to money or from money to income, while
others are bi-direction causal. Some did not find any evidence of causal relationship.
Tork & Khaled (2012) conducted the research of Output, Money, and Prices: The Case of
Jordan. The study used the Error Correction Model (ECM) and it found that there is no causal
relationship between output and money. But money supply can generate price level movements.
Nisar , Imrana , & Zakir (2012) developed the research on the Money, Prices, Income and
causality: a case of Pakistan.The study revealed based on the Granger causality test results that
there is causality relationship coming from the money supply to the prices and output.
Biswajit (2011) examined the relationship between anticipated money, unanticipated money and
Output variations in Singapore applying the quantity theory of money. This study suggested that
there is long-term relationship between money supply and output in Singapore. Especially this
relation exists between unanticipated money supply and output not anticipated.
Cem & Levent (2008) tested the Long-run relations between Money, Prices and Output in the
case of Turkey employing the quantity theory of money. The study found positive relationship
between money supply growth and output growth in the long-run in the case of Turkey.
Liang & Huang (2011) studied the relationship between Money supply and the GDP of United
States. The study used VAR model and after applying the Granger causality test, the results
reveal that d(M2) does not Granger cause d(GDP), in the United States. But (GDP) Granger
causes d(M2 in USA.
N., Akinola, & Muftau (2017) investigated the impact of Money Supply and inflation on
Economic Growth in Nigeria. Applyingthe QTM as advanced by Keynesians, this study revealed
that there is positive relationship between money supply and output in the long-run but they are
negatively related in the short-run in Nigeria, while there is a long-run negative relationship
between inflation, interest rate and economic growth. Inflation and interest rate were also
negatively related to the economic growth in the short-run.
Iqra & Saleem ( 2013) inspected the impact of Money Supply (M2) on GDP of Pakistan. They
found that the negative relationship exists between inflation rate and GDP of Pakistan. While the
study revealed that there is positive relationship between interest rate, Consumer Price Index
(CPI) and GDP of Pakistan.
Muhammad & Mubarak (2013) developed the research about Relationship between Inflation,
Money Supply, Interest Rate and Income Growth in Nigeria 1980-2010 applying the quantity
theory of money in the view of monetary economists. Therefore, granger causality test showed
International Journal of Education Humanities and Social Science
ISSN: 2582-0745 Vol. 2, No. 02; 2019
http://ijehss.com/ Page 3
that two-way causality exists between money supply and real GDP, money supply and inflation,
real GDP and inflation, and interest rate and inflation in Nigeria.
Inder (2008) examined the Co-integration, Causality, Money and Income in India. In the long-
run, the study showed that there is long-run relationship between RGNP and RMS and NGNP
and NMS in all sample periods in India.Gaurang (2010) made the test of Causality between
Money, Prices and Output in India using a Granger causality approach and found that there is
bidirectional relationship between M3 and GDP in India.
Mohammed & Mahfuzul (2017) tested the empirical analysis of the relationship between money
Supply and per capita GDP growth rate in Bangladesh. This study implemented two econometric
models: Engle-Granger causality and Vector Error Correction Model. The study revealed that the
broad money supply has strong effects on the growth rate of the output in Bangladesh.
Şeref ( 2013) explored the Money-Income relationship and Causality: an examination for the
Turkish economy. The results of the present study suggested that there is tow-way causal
relationship exists between money supply and income represented by RGDP in Turkey.
Muhd (2007) tested causality link between money, output and prices in Malaysia. This study
showed that there is two-way causality between monetary aggregatesandoutput in case of
Malaysia.
Komain (2009) investigated the Relationship among Money, Prices and Aggregate Output in
Thailand. The paper revealed that monetary aggregates M1 affects output positively, while
output influences on long-run real money demand in Thailand.
3. THEORETICAL FRAMEWORK AND METHODOLOGY
3.1 Definitions
A price level can be defined as the average price of the goods and services produced in the
economy (Olivier & David , 2013).
Output of any country is the monetary value of all the finished goods and services produced
within a country's borders in a specific time period (Komain, 2009).
3.2 Quantity Theory of Money
The concept of the quantity theory of money (QTM) has a long root existence; it began in the
16th century. As gold and silver inflows from the Americas into Europe were being issued into
coins, there was a resulting rise in inflation. This led economist Henry Thornton in 1802 to
assume that more money equals more inflation and that an increase in money supply does not
necessarily mean an increase in
The quantity theory of money postulates that change in money supply leads to a rise in general
price level and output level remains fixed at full employment level (Cem& Levent ,2008).
Since this study involves the relationship between money supply, prices and output, this means
that the aim of this study is to examine the validity of the QTM relationship for the Somali
economy in an empirical way.
International Journal of Education Humanities and Social Science
ISSN: 2582-0745 Vol. 2, No. 02; 2019
http://ijehss.com/ Page 4
Different studies used the quantity theory of money to investigate the relationship between
money supply, prices and output including: Irving ( 1911), Cem & Levent (2008), Biswajit
(2011),Komain (2009).
𝐌𝐕 = 𝐏𝐓 (1)
Where M is the money supply, V is the Velocity of Circulation (the number of times money
changes hands), P the general price level and T the economic transactions volume in the
economy in a given time period. Because the nominal value of transactions T is difficult to
measure, it can be replaced by aggregate output level Y under the simplifying assumption that T
would be proportional to Y as follows:
𝑻 = 𝛖𝒀 (2)
Where υ is a constant of proportionality,
Substituting υYforT would yield:
𝑴 𝑽 = 𝛖𝑷 𝒀 (3) since Quantity theory of money assumes that Velocity of money is constant, this can be written
as:
𝐌 = 𝐏 𝐘 (4) If we make the variable Y a dependent variable the equation becomes:
Y= P
M (5)
This implies that the real output is equal to the amount of real money supply in the economy.
Taking the logarithm of both sides of this equation gives us:
PMY lnlnln (6)
3.1 Data Description
This study uses the annual time series data of output represented by the GDP, money supply and
GDP deflator as a proxy for relevant price level in Somalia. The data is derived from the World
Development Indicators dataset which contains 40 years from 1970 to 2010. This study will
examine the impact of money supply and price level on output. Therefore, the real output is
dependent variable and it is measured by real GDP data of Somalia. Money supply and price
level will be treated as independent variables.
3.2 Model Specification
The equation (6) shows that the output growth Y is a function of money supply growth and the
change in price level. Therefore, this equation can be written more precisely as:
lnGDP = F ln (M, P) (7)
Adding parameters to this equation provides the following:
PMGDP lnlnln 21 (8)
The GDP, M, P and are the gross domestic product, money supply, general price level and the
stochastic or error term respectively,
3.3 Testing model strengths.

International Journal of Education Humanities and Social Science
ISSN: 2582-0745 Vol. 2, No. 02; 2019
http://ijehss.com/ Page 5
We will test the several diagnostics to ensure the model strengths that include:
a) Asymptotic Normality test on the following hypotheses:
H0 : there is normality distribution in the data. H1: there is no normality distribution in the data.
b) Stability of the residuals test on the following hypotheses:
H0: the data is stable. H1: the data is not stable.
c) Multicollinearity ,Hetrokesdasticity and Autocorrelation tests on the hypotheses of :
H0: there are no problems of the Multicollinearity,Hetrokesdasticity and Autocorrelation.
H1: there are these above problems.
4. FINDINGS AND DISCUSSIONS
Table 4.1 Summary statistics of the variables
Variable
(1970-
2010)
Mea
n
Media
n
Std.
Dev.
Max Min
GDP(B.SO
S)
2.2 2.3 0.31 2.7 1.67
M
(B.SOS)
165.
0
104.0 199.
0
534.
0
0.4
GDPD
(SOS)
51.4 38.1 29.2 104.
2
19.9
In the above table, we present the measures of dispersion of the data. The maximum and
minimum amounts of Somali GDP from 1970 to 2010 were 2.7 and 1.7 Billion SOSrespectively.
And its mean was two billions and two hundred millions SOS (2.200 B). This shows that the
Somali GDP was around two billions in all of the studied time. Since it is aggregate output of the
whole Somali economy, this amount is very low according to the abundant natural resources of
Somalia and it reveals that Somalia’s resources are not utilized efficiently.
Money supply reached its highest point in the study period when it was 534 billion of Somali
Shilling and its lowest amount was 0.39 billion. This implies that the stock of money in the
Somali economy experienced some considerable changes over that time. And its mean in the
study period was 165 billion and obviously this is large value in relation to the GDP.
Price level (Inflation) has maximum value of 104.2 SOS. And its minimum amount was
19.9SOS. It has an average value of 51.3 SOS. This indicates that the prices or inflation in
Somalia was fluctuating strongly in the sample period of time of the study.

International Journal of Education Humanities and Social Science
ISSN: 2582-0745 Vol. 2, No. 02; 2019
http://ijehss.com/ Page 6
Figure 4.1 Somali GDP trends 1970 – 2010.
To understand the Somali GDP movements, it is better to divide it into two periods: before the
collapse of the Somali government which is according to the present data from 1970 up to 1991
and after the downfall of the government which is from 1991 to 2010. The first period can be
divided further as socialism era and capitalism period.
On October 20, 1970, the first anniversary of the coup, the Somalia president; Mohamed
SiadBarre declared that Somalia become socialist state. He also announced the 1971-73 Three-
Year Plan. The plan was intended to achieve a higher standard of living for every Somali, create
jobs for all who wanted to work, and the eradication of capitalist exploitation
Therefore, Somalia realized the great economic successes of socialist experiment in the first five
years of the revolution. But as the graph shows, the GDP declined in the years of 1973-74 due to
a drought that destroyed the pastoral economy. In the second half of 1970s, two economic trends
were noteworthy: increasing debt more than the export earnings and the collapse of the small
industrial sector due to economic cost of creating large modern army as a political goal and
concurrent corruption from government officials using their positions for personal gain.
After Ogadenwar 1977-78, Somalia decided to turn capitalist system and like most countries
devastated by debt could rely only on the nostrums of the IMF and its program of structural
adjustment
Somalia GDP declined as revealed by the above figure in 1983 and that was the result of new
crisis that hit Somalia in June 1983Following the fall of the SiadBarre regime in late January
1991 up to the 1995, the situation failed to improve because clan warfare intensified. After 1995,
due to excessive private investments, the economy had gotten some recovery
Figure 4.2 Somalia Money Supply evolutions 1970-2010.
-
500,000,000.00
1,000,000,000.00
1,500,000,000.00
2,000,000,000.00
2,500,000,000.00
3,000,000,000.00
1970
1975
1980
1985
1990
1995
2000
2005
2010
GDP

International Journal of Education Humanities and Social Science
ISSN: 2582-0745 Vol. 2, No. 02; 2019
http://ijehss.com/ Page 7
This graph shows that the money supply of Somalia was low and stable from before 1985. But it
began to rice from that period because Somalia implemented new macroeconomic structural
adjustments including devaluation of the Shilling. The Somalia money supply reached its peak
in1989 before the collapse of the Somali state due to the AID-encouraged structural adjustment
policies and introducing 500 shillings as new bank notes by the Central bank of Somalia.
After the breakdown of the Somali government, money supply increased dramatically between
1997 and 2001 as consequence of the printing of fake currency by warlords, business people,
faction leaders and regional administrations to fund their political or perhaps illegal purposes.
It took large bundles to make cash purchases. As the system of the government returned, the
Somali shilling showed remarkable strength simply because no more new fake currency was
issued
Figure 4.3 GDP Deflator changes in Somalia 1970-2010.
The above figure revealed that inflation in Somalia was stable in most cases before 1992. But it
increased massively between 1992 and 2000 due to the printing of counterfeit currency by some
businessmen and warlords and even regional state administrators. The inflation declined heavily
in 2001which was probably the result of the people’s expectations about new central government
functioning toward the eliminating and punishing for the illegal actions about money creations.
-
100,000,000,000.00
200,000,000,000.00
300,000,000,000.00
400,000,000,000.00
500,000,000,000.00
600,000,000,000.00
1970
1975
1980
1985
1990
1995
2000
2005
2010
Money Supply
0
50
100
150
1970 1975 1980 1985 1990 1995 2000 2005 2010
GDPD

International Journal of Education Humanities and Social Science
ISSN: 2582-0745 Vol. 2, No. 02; 2019
http://ijehss.com/ Page 8
Between 2002 and 2007, the inflation in Somalia got rise, may be caused by more spending
made by faction leaders such as warlords, Islamic courts’ leaders and issuing forgery notes by
imported machines in some areas. From the 2008 to 2010, inflation was decreasing due to steady
remittances, improvements of government systems and Dollarization effect
Table 4.2 Estimation of the model coefficients
As we can see in the above table, the two coefficients of explanatory variables; Money supply
and GDP Deflator as well as the intercept term are all statistically significant as their P-value is
0.000.
Therefore, this study shows that there is positive relationship between money supply and output
in Somalia. That is; if money supply goes up by one percent the output will increase 0.058
percent as a response to the one percentage change in money supply. But the general price level
(inflation) has a negative impact on the output in Somalia. Therefore, if general price level rises
one percent the output will decrease -0.217 percent.
In this model, R2 is equal to 0.42 that is, the regressors; Money supply and GDP Deflator can
explain 42% of the total variations in the regressand ; output. Although R2 is less than 50%, we
can say this model has goodness of fit to the data because the study uses time series data which
consists of 40 years.
In this model, F-test is statistically significant as its P-value is 0.000036. This means that the
explanatory variables; Money supply and GDP Deflator have joint influence to the explained
variable which is GDP in Somalia.
Figure: 4.4 Residual normality test : Jarque-Bera
Variable Coeff. Std.
Error
t-Statistic Prob.
C 20.910 0.173 120.72 0.0000***
lnM 0.058 0.011 5.19 0.0000***
lnGDPD -0.217 0.050 -4.31 0.0001***
0
1
2
3
4
5
6
7
-6.0e+08 -4.0e+08 -2.0e+08 1000.00 2.0e+08 4.0e+08
Series: ResidualsSample 1970 2010Observations 41
Mean -2.94e-07Median 22280823Maximum 4.93e+08Minimum -5.47e+08Std. Dev. 2.81e+08Skewness -0.179930Kurtosis 2.121114
Jarque-Bera 1.540814Probability 0.462825
International Journal of Education Humanities and Social Science
ISSN: 2582-0745 Vol. 2, No. 02; 2019
http://ijehss.com/ Page 9
After conducting the normality test of the studied data using Eviews 9 software, we found that
the data is normally distributed because the probability of Jarque-Bera is 0.463 which indicates
that we can’t reject the null hypotheses that proposed the data has normality distribution as
assumed by the Ordinary least square
Table 4.3 Stability Test: Ramsey Reset Test
The data has stability property as it can be seen from the above table because we can’t reject the
null hypotheses based on the current probability which is greater than five percent significance
level.
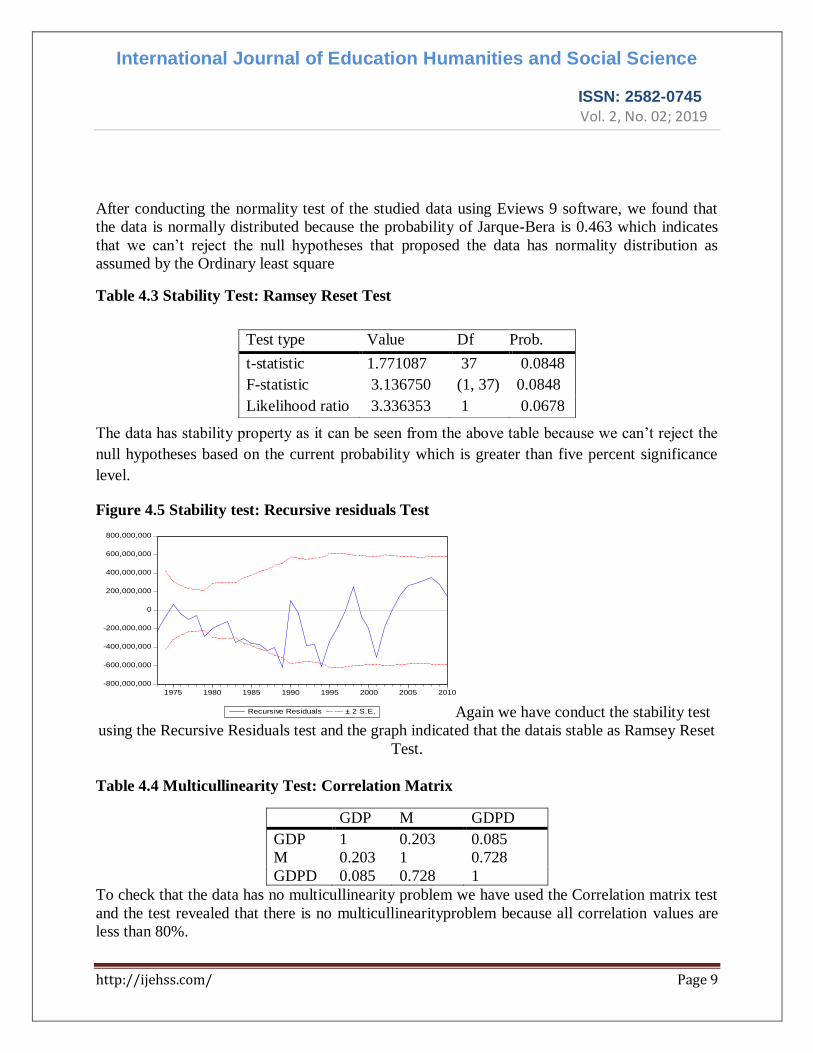
Figure 4.5 Stability test: Recursive residuals Test
-800,000,000
-600,000,000
-400,000,000
-200,000,000
0
200,000,000
400,000,000
600,000,000
800,000,000
1975 1980 1985 1990 1995 2000 2005 2010
Recursive Residuals ± 2 S.E. Again we have conduct the stability test
using the Recursive Residuals test and the graph indicated that the datais stable as Ramsey Reset
Test.
Table 4.4 Multicullinearity Test: Correlation Matrix
GDP M GDPD
GDP 1 0.203 0.085
M 0.203 1 0.728
GDPD 0.085 0.728 1
To check that the data has no multicullinearity problem we have used the Correlation matrix test
and the test revealed that there is no multicullinearityproblem because all correlation values are
less than 80%.
Test type Value Df Prob.
t-statistic 1.771087 37 0.0848
F-statistic 3.136750 (1, 37) 0.0848
Likelihood ratio 3.336353 1 0.0678

International Journal of Education Humanities and Social Science
ISSN: 2582-0745 Vol. 2, No. 02; 2019
http://ijehss.com/ Page 10
Table 4.5 Heteroskedasticity Test: Breusch-Pagan-Godfrey
F-statistic 2.237 Prob. F(2,38) 0.1207
Obs*R-squared 4.318 Prob. Chi-
Square(2)
0.1154
Scaled explained
SS
2.079 Prob. Chi-
Square(2)
0.3536
To know whether current data is free from Heteroskedasticity problem we have carried out the
Breusch-Pagan-Godfrey Test and the test showed that there is no heteroskedasticity problem as it
can be seen from the probability in the above table.
Table 4.6 Autocorrelation Test
To ensure that the data has no autocorrelation problem we executed serial correlation test and
found that there is correlation problem in the present data. Therefore, to solve this problem we
used the standard robust test which can resolve that problematic property.
In this study we have found that there is positive relationship between money supply growth and
output growth in Somalia. This means that money supply growth can influence the output growth
positively. This outcome from the current study rejects the concept of neutrality of money in the
economy of Somalia and supports the monetarists’ view. But Price level has a negative impact
on output growth in Somalia.
The money-output relationship has been documented in a number of studies employing a variety
of data sets. They found different results as this relationship has different views in economic
thoughts. Some of them suggested positive relationship between money and output. These
studies include: Muhd (2007), Cem & Levent (2008),Iqra& Saleem ( 2013), Muhammad &
Mubarak (2013), Biswajit (2011), Nisar , Imrana , & Zakir (2012), Mohammed & Mahfuzul
(2017),Komain & Tantatape (2005),Gaurang (2010), and Şeref ( 2013). All these studies have
been conducted in different countries and have gotten the same findings as our current study.
That is there is positive money-output relationship and negative price level- output relationship.
This is consistent theoretically with New keynesian view that uses monetary-business-cycle
theory and Monetarists view.
5. CONCLUSION
This study is conducted to examine the impact of money supply and price level on output growth
in Somalia. The Quantity Theory of Money which is one of the fundamental building blocks in
economic theories is applied in this research to examine its validity and applicability in the
Variable Coeff. Std. robust t-Statistic Prob.
C 20.910 0.172 121.45 0.0000
lnM 0.058 0.010 5.69 0.0000
lnGDPD -0.217 0.045 -4.84 0.0000

International Journal of Education Humanities and Social Science
ISSN: 2582-0745 Vol. 2, No. 02; 2019
http://ijehss.com/ Page 11
Somali economy. The Ordinary Least Square (OLS) is employed to estimate the coefficients of
the study variables in the model that are Money supply, Price Level measured by GDP Deflator
and Output as represented by the (GDP).
The annual time series data that consists of 40 years for the period 1970 to 2010 is used. The
main source of the data in this study is World Development Indicators dataset.
After that analysis, the notion that monetary expansion affects only the price level, but leaves
output unaffected is rejected by this study in the context of the Somali economy. We have found
the significant positive relationship between money supply and output supporting the
monetarists’ view. On the other hand, the study suggested significant negative relationship
between price level and output growth which is consistent with the popular theoretical concept of
Adam Smith and Friedman.
And arising from the above findings, this study recommends the following policies:
Firstly, this study suggests that appropriate control and management of money supply is needed.
Since the study revealed that money supply affects the output positively in Somalia, it should be
used as endogenous factor for stimulating output.
Secondly, as it is known, the Central Bank of Somalia (CBS) is not working effectively after the
collapse of the Somali government. Since the Central bank is the sole institution which is
responsible for monetary policy to guide the economic activities, it should be developed further
and capacitated to undertake necessary money policies by employing well-educated and
qualified employees and setting sufficient suitable rules for managing bank activities.
Thirdly, the Somali government should make important strategies that enable the local currency
of Somalia to be only or most frequently used means of payment in Somalia to allow the CBS to
manage the monetary policy activities effectively. Further research may examine the proper tools
which can be used as an instrument in the open market operations instead of interest rate.
REVERENCES
ADB, A. D., OECD, O. f.-p., & UNDP, U. N. (2017). Entrepreneurship And Industrialisation.
African Economic Outlook.
Benjamin., M. F., & Kenneth, N. K. (1992, Jun). Money, Income, Prices, and Interest Rates. The
American Economic Review, 82(3), 1-2.
BISWAJIT, M. (2011, January). Anticipated Money, Unanticipated Money And Output
Variations In Singapore. Journal of Quantitative Economics,, 9(1), 1-10.
Cem, S., & Levent, K. (2008). Long-Run Relations Between Money, Prices And Output: The
Case Of Turkey. Zkü Sosyal Bilimler Dergisi, 4(7), 1-15.
Dr. Nisar , A., Imrana , A., & Dr. Zakir , H. (2012). Money, Prices, Income And Causality: A
Case Study Of Pakistan. The Journal of Commerce, 4(4), 1-4.
Frank , J., & William , R. (1981). The sensitivity of policy elasticities to the time period
examined in the St. Louis equation and other tests. Working Papers.2.
IMF, I. M. (2017). World Economic Outlook. IMF.
International Journal of Education Humanities and Social Science
ISSN: 2582-0745 Vol. 2, No. 02; 2019
http://ijehss.com/ Page 12
Inder, S. Y. (2008). Co-integration, Causality, Money and Income in India. Tenth Annual
Conference on Money and Finance in the Indian Economy (pp. 1-11). Mumbai: Indira
Gandhi Institute of Development Research (IGIDR),.
Iqra , I., & Saleem , A. (2013). Impact of Money Supply (M2) on GDP of Pakistan. Global
Journal of Management and Business Research, 13(6), 1-7.
James , T. (1965). money and economic growth. Econometrica, 33(4), 1.
Komain, J. (2009, November). Relationship among Money, Prices and Aggregate Output in
Thailand. The Empirical Economics Letters, 8(11), 1.
Liang, F., & Huang, W. (2011). The Relationship Between Money Supply And The Gdp Of
United States. 4-20.
Mohammed , E. H., & Mahfuzul , H. (2017, February). Empirical Analysis of the Relationship
between Money Supply and Per Capita GDP Growth Rate in Bangladesh. Journal of
Advances in Economics and Finance, 2(1), 1-5.
Muhammad , Z. B., & Mubarak , A. S. (2013). Reationship between Inflation, Money Supply,
Interest Rate and Income Growth (Rgdp) in Nigeria. Journal of Economics and
Sustainable Development, 4(8), 1-3.
Muhammad, Z. B. (2013). Reationship between Inflation, Money Supply, Interest Rate and
Income Growth in Nigeria. Journal of Economics and Sustainable Development, 4(8), 1-
2.
Muhd, Z. A. (2007). Causality Link Between Money, Output And Prices In Malaysia: An
Empirical Re-Examination. Econometrics and International Development, 7(1).
N., M. G., Akinola , A., & Muftau O., O. (2017, May-June). Impact of Money Supply and
Inflation on Economic Growth in Nigeria. IOSR Journal of Economics and Finance, 8(3),
1-9.
Nisar, A., Imrana , A., & Zakir, H. (2013). Money, Prices, Income And Causality: A Case Study
Of Pakistan. The Journal of Commerce, 4(4), 1.
Olivier, B., & David , R. (2013). Macroeconomics. New York: Pearson Education, Inc.,.
R. W. Hafer. (1982, January). The role of fiscal policy in the St. Louis Equation. 1.
Şeref , B. (2013). Money, Income, And Causality: An Examination For. Ekonomska Istraživanja-
Economic Research, 26(1), 1-8.
Terry , G. S., & Stuart, D. A. (1980). The St. Louis Equation: A decade latter. Southern
Economic Jornal, 46(3).
Torki , M. A.-F., & Khaled , M. A.-S. (2012). Output, Money, and Prices: The Case of Jordan.
International Business Research;, 5(12), 1-6.

International Journal of Education Humanities and Social Science
ISSN: 2582-0745 Vol. 2, No. 02; 2019
http://ijehss.com/ Page 13
VAFA, M. (2013, December). Reassessing The Effect Of Fiscal And Monetary Policies In Iran:
The St. Louis Equation Revisited. Journal Of Economic Development, 38.
Related Documents