Subject to change – Peter Schmidt – 07/2004 Product: Handheld Spectrum Analyzer R&S FSH Testing Mobile Radio Antenna Systems with the R&S FSH This application note describes the procedures used to measure antenna systems for mobile radio base stations using the Handheld Spectrum Analyzer R&S FSH.

Welcome message from author
This document is posted to help you gain knowledge. Please leave a comment to let me know what you think about it! Share it to your friends and learn new things together.
Transcript

Subject to change – Peter Schmidt – 07/2004
Product: Handheld Spectrum Analyzer R&S FSH
Testing Mobile RadioAntenna Systems with the
R&S FSH
This application note describes the procedures used to measure antenna systems for mobile radio basestations using the Handheld Spectrum Analyzer R&S FSH.
Testing Antenna Systems Using the R&S FSH
1EF52_0E 2 of 35 Rohde & Schwarz
Contents1 Overview ............................................................................................. 32 Antenna Structure................................................................................ 33 Measurement Procedures for an Antenna System ............................... 54 Measuring Antenna Systems................................................................ 6
Matching Measurements................................................................. 6Matching Measurement of Antenna Systems ............................. 6Matching Measurement of Antenna Systems with a Tower-MountedAmplifier (TMA) ......................................................................... 6Matching Measurement Errors ................................................... 8
Discontinuity Measurements ........................................................... 9Introduction to DTF and Discontinuity Measurements................. 9Discontinuity Measurement on Antenna Systems..................... 12Discontinuity Measurement on Antenna Systems with Tower-Mounted Amplifier (TMA) ......................................................... 12Discontinuity Measurement behind the TMA (3G) .................... 13Checking the Wavefront Formation of a Stacked Antenna ....... 16Special Characteristics of the R&S FSH................................... 17
Measurement of the Transfer function of Active Elements .. 17Antenna System Measurements Influenced by RF .............. 17
Decoupling Measurements............................................................ 19Decoupling Measurements of Antenna Sytsems....................... 19Decoupling Measurement of Antenna Systems with Tower-MountedAmplifiers (TMA)...................................................................... 20Measurement of the Tower-Mounted Amplifier (TMA) Gain...... 21Measurement of the Whole System Gain................................. 21TMA Measurement before Installation in the Antenna System.. 22
5 Summary of Test Procedures ............................................................ 23Antenna Systems without TMA ..................................................... 23Antenna Systems with TMA .......................................................... 23
6 Example Measurements .................................................................... 24Frequency Ranges........................................................................ 24Antenna System without Tower-Mounted Amplifier ....................... 25
Matching Measurements .......................................................... 25Discontinuity Measurements .................................................... 26Decoupling Measurement ........................................................ 27
Antenna Systems with Tower-Mounted Amplifier .......................... 28Matching Measurements .......................................................... 28Discontinuity Measurements .................................................... 29Decoupling Measurement ........................................................ 30Measurement of the TMA Gain ................................................ 31Measurement of the Whole System Gain................................. 32Measurement of the TMA Gain at the Base.............................. 33
7 Additional Information........................................................................ 34Note Regarding Defective Antennas ............................................. 34Asymmetry of the Directional Lobe over the Frequency: ............... 34
8 Abbreviations..................................................................................... 359 Ordering Information.......................................................................... 35
Testing Antenna Systems Using the R&S FSH
1EF52_0E 3 of 35 Rohde & Schwarz
1 OverviewThe central components for a mobile radio base station are the antennasystem and the site infrastructure. That is not to say that the systemtechnology, the parameterization, and the line connections are not importantfactors in the quality and availability of a mobile radio site. It is, however, theinfrastructure and antenna system that require a large amount of effort tomodify. A defective GSM base station or UMTS NodeB could be completelyreplaced as needed. An antenna system and its site, on the other hand,cannot be so easily replaced.
With respect to the correct functioning of a transmitter system, the transmitand receive characteristics of an antenna system are the weakest link in thechain of equipment that forms the mobile radio network’s technical interfaceto the customer. Moreover, the transmitter system is strongly affected byweather conditions. Electrostatic discharges, as well as snow, rain, anddramatic temperature variations within a short period of time, are verydemanding on all materials. The tiniest leaks can flood and destroy cables,filters, or antenna amplifiers within a few rainy weeks. Temperaturevariations require extreme connection materials with varying thermalexpansion coefficients. Any resulting faults, at least during their initial stages,do not generally trigger an automatic fault alarm, and can therefore remainundetected by network operators for a long period of time.
For these reasons, antenna systems require special consideration.
The previously common pure matching measurements performed onantenna systems have decreased in significance since the discovery andimplementation of cross-polarized antennas. This type of measurementalone is no longer sufficient to assess the system. Instead, additionalmeasurements, such as decoupling or discontinuity measurements, are nowneeded. Often, matching measurements do not turn up anything particularlysuspicious for cross-polarized antennas in spite of significant defects, ifthese defects lie in the antenna itself. Only an additional, meaningfulmeasurement of the decoupling of the two systems will uncover possibledefects.
This application note addresses basic characteristics of antennas. Itdiscusses the specific measurements for antenna systems and how tointerpret these measurement results.
2 Antenna StructureAn antenna is an element that matches electromagnetic energy from thecharacteristic impedance of the free space (377 Ω) to the characteristicimpedance of an antenna cable (for example, coaxial cable with 50 Ωimpedance). Basing on Marconi’s discovery that a resonating radiator with ¼of the wavelength of the frequency to be sent or received over ground canwork as an antenna, a dipole with two opposing radiators forms the basis formany mobile radio antennas. For mobile radio applications, the diameter ofthe dipole radiators is large enough to increase the bandwidth of the typicallynarrowband dipole. Because individual dipoles are operated at their resonantfrequency, voltage maxima form at the ends of the dipole elements withvoltages that can achieve several thousand volts. Stringent measures mustbe taken within the antenna system to prevent discharges or ionization of theair at the dipole ends, because these can result in significant mixing productsand the associated interference in the receive path of the mobile radio

Testing Antenna Systems Using the R&S FSH
1EF52_0E 4 of 35 Rohde & Schwarz
facility. These in turn can significantly impair the operation of the receivepath.
Straight and downtilteddipole configuration
Tthese discharges are even found in incorrectly assembled connectionsand aged filter modules, especially at 430 MHz. Improperly assembledelectrical connections form capacitors and lead to ionization dischargeswithin the connectors due to the transmit power.
An antenna is generally made up of multiple stacked antenna elements(dipoles). These are connected via tuned coaxial lines. The spacing of thedipole fields is set so that a homogenous electromagnetic field forms inthe antenna’s far field that shows the desired characteristics with respectto gain, downtilt, and aperture. An antenna of this type can be electricallydowntilted if the upper dipoles transmit a little sooner than the lowerdipoles. “Electrically” means that the upper dipoles must send during asomewhat earlier phase than the lower dipoles.
Cross-polarized antenna
A cross-polarized antenna consists of two separate antenna systems thatare oriented at 90° to one another. This means that there are two separateantenna systems housed together that replace physically separatedantennas. The receive duplex gain is ensured by the polarization planesand is almost as great as the physical separation of the receive antennas.Depending on the wiring, the downlink (DL) contains various channels orradio terminals (RT) on both polarization planes whose influence in thecoverage area can be detected but is generally negligible.
The cross-polarized antenna ideally combines the need for verticalpolarization of mobile radio networks with the improved propagationpermitted by a horizontally polarized wave.

Testing Antenna Systems Using the R&S FSH
1EF52_0E 5 of 35 Rohde & Schwarz
3 Test Methods for an Antenna SystemThe following measurements can be performed on an antenna system:
• Return loss measurement: This matching measurement for an antennasystem provides information about the basic condition of the system. Ifproblems already show up during this test, it can be assumed with a highdegree of certainty that the antenna system contains faults that willaffect the customer.
• Discontinuity measurement: The measurement of discontinuities in theantenna system shows abnormal changes in the characteristicimpedance as well as the location of the discontinuities in the connectionand feeder cables and in the cable connectors (plugs and sockets). Thismeasurement makes it possible to determine the effect of thesediscontinuities on the operating frequency range of the antenna systemand to determine the radiation characteristics of the antenna itself.
• Decoupling measurement: The decoupling measurement determines theelectrical decoupling of two antenna systems in the coverage area. Thistype of measurement is both necessary and useful for cross-polarizedantennas.
To detect all possible sources of errors and to record the data for a specificantenna system, the above measurements can be carried out as follows onthe antenna system:
• Measure the return loss (RL) and the discontinuities (time domainreflection, TDR or frequency domain reflection, FDR) with a connectedantenna (= measurement of the complete system). The TDRmeasurement shows discontinuities in the cable and, if carried out withinthe operating frequency range of the antenna, it also shows theformation of the antenna field.
• Measure the return loss (RL) and the discontinuities (TDR, FDR) usingan open circuit in place of an antenna at the end of the cable. The returnloss can be used to determine the cable loss, and the discontinuitymeasurement shows the end of the cable.
• Measure the return loss (RL) and the discontinuities (TDR, FDR) with aclosed cable end. This measurement shows discontinuities, includingthose that are near the antenna.
• Measure the decoupling of both antenna systems in a cross-polarizedantenna setup. This measurement shows the electrical characteristics ofthese antennas better than a simple return loss measurement.
Measurements of the feeder cable with a disconnected antenna are desirablein theory, but rarely done in practice. Once the facilities have been handedover after completion of the construction work, disconnecting the outsidelines can result in a loss of warranty, depending on the terms of the contract.For this reason, the company setting up the antenna system should at leastmeasure the cable loss (open circuit on the end of the feeder cable).
Refer to Section 5 for a summary of the measurements, along withacceptance or assessment tests.
Testing Antenna Systems Using the R&S FSH
1EF52_0E 6 of 35 Rohde & Schwarz
4 Measuring Antenna Systems
Matching Measurements
Matching Measurement of Antenna SystemsMatching or return loss measurement is the traditional method of assessingan antenna system. The amount of the return loss is indicative of theeffectiveness with which the antenna radiates the energy supplied to it. Thelower the return loss, the more that costly RF energy is being reflected fromthe antenna and returned back to the transmit output stage. The followinghappens if too much RF energy is reflected:
• The reflected energy is not radiated from the antenna and is thereforenot available for radio transmission.
• The reflected energy is returned to the transmit output stage, resulting inadditional warming of the transmit output stage. Extreme mismatchingcan even damage the transmitter.
• The reflected energy can lead to intermodulation in the transmit outputstage.
• In the case of a mismatching, the returning energy interacts with theforward power to cause standing waves in the antenna system. Thecurrent or voltage loops caused by the standing wave can lead toimpairment (or even damage) in the filter modules, for example.
The better matched an antenna system, the better the energy is radiated. Inmodern, highly complex antenna systems (stacked, multiband cross-polarized antennas with downtilt mechanisms), there is more to considerthan just the matching, however. The energy must exit the antennadirectionally, or it must be received by the antenna in receive mode asdefined in the technical specifications. Additional (decoupling)measurements are needed to assess these characteristics.
Matching Measurement of Antenna Systems with a Tower-Mounted Amplifier (TMA)Matching measurement of an antenna system with a tower-mountedamplifier (TMA) is performed essentially the same as without the TMA.Please note that the TMA must remain without current during themeasurement so that a bypass present in the TMA will be active. A bypassof this type bypasses the receive amplifier when the TMA is without current.On the one hand, the uplink (UL) is not completely interrupted when thesupply voltage fails, and on the other hand, the bypass permits at least themost important measurements to be carried out on antenna systems withTMA.

Testing Antenna Systems Using the R&S FSH
1EF52_0E 7 of 35 Rohde & Schwarz
TMA block diagram
When interpreting the measurement results, please remember that theactual antenna matching is visible only in the passbands of the TMA filters.These filters are also looped into the signalling path when the TMA is usedin bypass mode.
In the case of a TMA without bypass, the antenna and TMA measurementscan be performed only on a very limited basis:
Matching, decoupling, and discontinuity measurements can be performedonly in the down link (DL).
The accuracy of the gain measurement on the TMA is not adequatebecause the decoupling values in the receive path must be comparedagainst the (amplified) values of the transmit path, while the degree ofdecoupling over the antenna frequency is not known.
This diagram shows the effects of the TMA transmit and receive filters on amatching measurement.
Return loss ofantenna
Return loss of TMA (withideal 50 Ω termination)
Display on the R&S FSH3: Theantenna return loss can bemeasured only in the passbandof the TMA filters.
Testing Antenna Systems Using the R&S FSH
1EF52_0E 8 of 35 Rohde & Schwarz
Matching Measurement ErrorsThe matching measurement determines the return loss for the wholeantenna system, including the RF feeder cable and jumper. Because thereturn loss of the antenna can only rarely be determined directly, it ismeasured at the base of the antenna system.
As the line attenuation increases, the relationship between the power fed tothe antenna and the power reflected back from it is adulterated because thepower flowing back and forth must overcome the cable loss. Higher lineattenuation appears to result in higher return loss; however, the return lossdoes not increase in a linear relationship to the line attenuation.
On the other hand, lower cable loss values with increasing mismatching ofthe antenna result in the measurement of better matching values at theantenna base. This can be explained by standing waves that form in thefeeder cable as the mismatching of the antenna increases. These wavesdisrupt the even distribution of current and voltage in the cable through theformation of current and voltage loops.
The relationship of the various measurement and limit values is describedwith the following formula based on the transmission theory:
)1010lg(20 202
20rA
KrK aaa
ra+⋅
+⋅=
Return loss at base of the antenna: ar
Return loss of cable with 50 Ω load: arK
Cable loss: aK
Return loss of antenna: arA
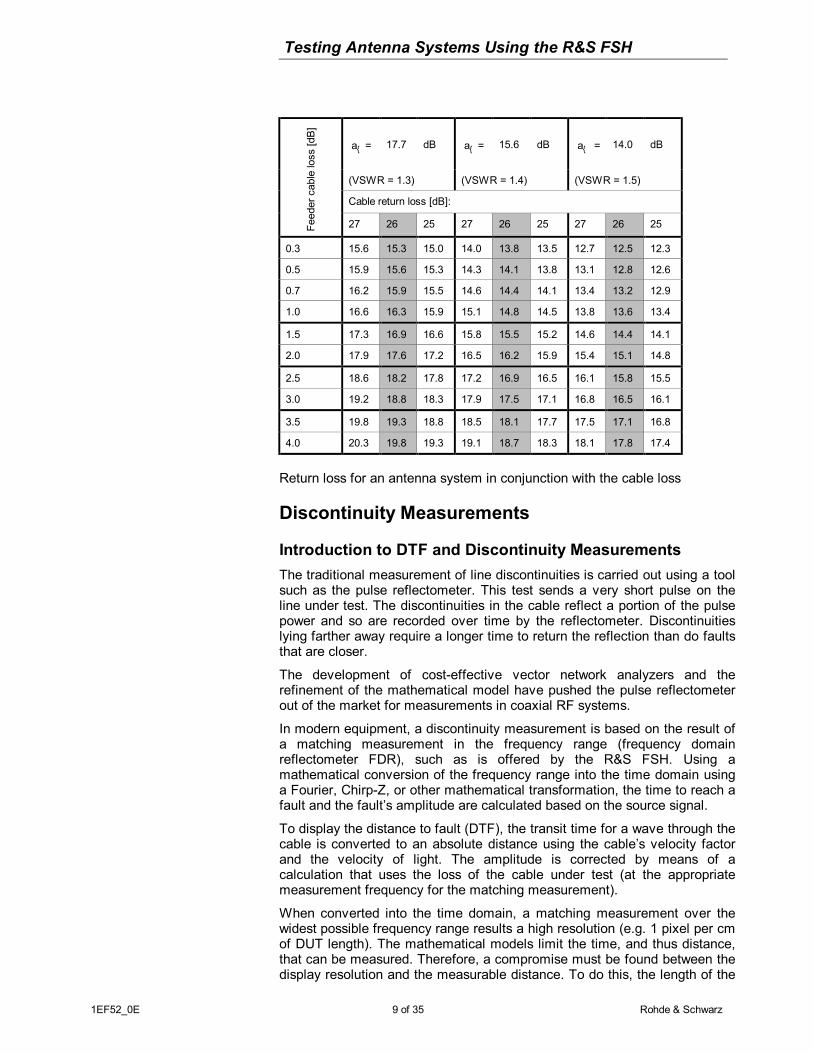
The limit values for the antenna are determined in conjunction with the cableloss, the return loss of the antenna cable, and the return loss of the antenna.These limit values are shown in the following table for the various cablelosses.
Additional influences, primarily RF discontinuities resulting from multiplecable bends, clamps that are too tight, or mismatching plugs, are not takeninto consideration. The assessment must be made based on the discontinuitymeasurement and a visual onsite check.
Example: An antenna matching of aA = 14 dB (VSWR = 1.5) — measuredover a feeder cable loss of 0.3 dB — can indicate an antennamatching value of 12.5 dB during the measurement. (The returnloss for the cable is 26 dB in this case.)
Testing Antenna Systems Using the R&S FSH
1EF52_0E 9 of 35 Rohde & Schwarz
a = 17.7 dB a = 15.6 dB a = 14.0 dB
(VSWR = 1.3) (VSWR = 1.4) (VSWR = 1.5)
Cable return loss [dB]:
Feed
er c
able
loss
[dB
]
27 26 25 27 26 25 27 26 25
0.3 15.6 15.3 15.0 14.0 13.8 13.5 12.7 12.5 12.3
0.5 15.9 15.6 15.3 14.3 14.1 13.8 13.1 12.8 12.6
0.7 16.2 15.9 15.5 14.6 14.4 14.1 13.4 13.2 12.9
1.0 16.6 16.3 15.9 15.1 14.8 14.5 13.8 13.6 13.4
1.5 17.3 16.9 16.6 15.8 15.5 15.2 14.6 14.4 14.1
2.0 17.9 17.6 17.2 16.5 16.2 15.9 15.4 15.1 14.8
2.5 18.6 18.2 17.8 17.2 16.9 16.5 16.1 15.8 15.5
3.0 19.2 18.8 18.3 17.9 17.5 17.1 16.8 16.5 16.1
3.5 19.8 19.3 18.8 18.5 18.1 17.7 17.5 17.1 16.8
4.0 20.3 19.8 19.3 19.1 18.7 18.3 18.1 17.8 17.4
Return loss for an antenna system in conjunction with the cable loss
Discontinuity Measurements
Introduction to DTF and Discontinuity MeasurementsThe traditional measurement of line discontinuities is carried out using a toolsuch as the pulse reflectometer. This test sends a very short pulse on theline under test. The discontinuities in the cable reflect a portion of the pulsepower and so are recorded over time by the reflectometer. Discontinuitieslying farther away require a longer time to return the reflection than do faultsthat are closer.
The development of cost-effective vector network analyzers and therefinement of the mathematical model have pushed the pulse reflectometerout of the market for measurements in coaxial RF systems.
In modern equipment, a discontinuity measurement is based on the result ofa matching measurement in the frequency range (frequency domainreflectometer FDR), such as is offered by the R&S FSH. Using amathematical conversion of the frequency range into the time domain usinga Fourier, Chirp-Z, or other mathematical transformation, the time to reach afault and the fault’s amplitude are calculated based on the source signal.
To display the distance to fault (DTF), the transit time for a wave through thecable is converted to an absolute distance using the cable’s velocity factorand the velocity of light. The amplitude is corrected by means of acalculation that uses the loss of the cable under test (at the appropriatemeasurement frequency for the matching measurement).
When converted into the time domain, a matching measurement over thewidest possible frequency range results a high resolution (e.g. 1 pixel per cmof DUT length). The mathematical models limit the time, and thus distance,that can be measured. Therefore, a compromise must be found between thedisplay resolution and the measurable distance. To do this, the length of the
Testing Antenna Systems Using the R&S FSH
1EF52_0E 10 of 35 Rohde & Schwarz
cable must be supplied to the measuring instrument before the measurementbegins. The measuring instrument then calculates the appropriate frequencyrange (span) for the matching measurement. Please note that the operatingfrequency range of the DUT should be selected as the center frequency.
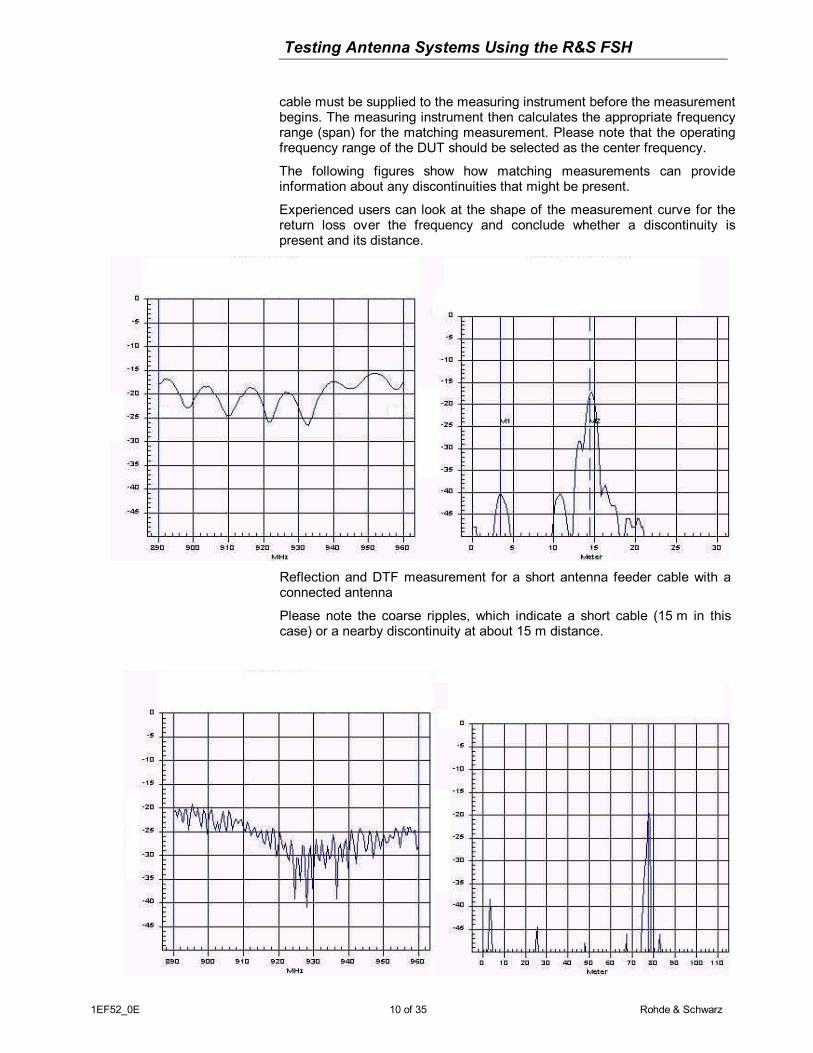
The following figures show how matching measurements can provideinformation about any discontinuities that might be present.
Experienced users can look at the shape of the measurement curve for thereturn loss over the frequency and conclude whether a discontinuity ispresent and its distance.
Reflection and DTF measurement for a short antenna feeder cable with aconnected antenna
Please note the coarse ripples, which indicate a short cable (15 m in thiscase) or a nearby discontinuity at about 15 m distance.

Testing Antenna Systems Using the R&S FSH
1EF52_0E 11 of 35 Rohde & Schwarz
Reflection and DTF measurement for a long antenna feeder cable withconnected antenna
Please note the fine ripples over the same frequency range as the lastexample. This indicates a longer antenna feeder cable or a discontinuitylocated farther away (80 m in this case).
Reflection and DTF measurement for a defective (or missing) antenna(open circuit at the end)
Please note the straight matching curve over the frequency, which does notshow any significant maximum or minimum.
Reflection and DTF measurement for a long cable having multiplediscontinuities

Testing Antenna Systems Using the R&S FSH
1EF52_0E 12 of 35 Rohde & Schwarz
Please note how fine and coarse ripples are overlaid in the return lossdisplay.
Discontinuity Measurement of Antenna SystemsEvery change in the characteristic impedance in the antenna system leads toa reflection of forward RF energy and forms a discontinuity. Every plug-inconnector or screw fastening, every kink in the cable, and the like can leadto a discontinuity of some significance. Compressing the cable leads toexactly two discontinuities, one at each of the sites where there is a changein the characteristic impedance:
Example: Two discontinuities resulting from a compressed coaxial cable
50 Ω 50 Ω40 Ω
Discontinuities
Depending on the wavelength, these two discontinuities are thenrecognizable in different ways. If the operating frequency of the affectedantenna system is relatively high, the two discontinuities are recognizable asseparate faults. If the reflected power of each discontinuity lies under a limitvalue, then there is no fault in the system.
However, if the operating frequency if relatively low — i.e. the wavelength ofthe RF signal is large relative to the distance between the discontinuities —then the two discontinuities will merge into one. In this case, the discontinuityis recognizable as a single, concentrated fault. The reflected power — as thesum of the two separate faults — will then exceed the limit value and berecognized as a fault in the antenna system.
It is therefore important that test equipment with high spatial resolution beused, and that the antenna system be measured within its operatingfrequency range.
To locate and evaluate the intensity of measured discontinuities, the cableloss and its velocity factor (the speed at which the wave propagates in thecable, in m/s) must be entered in the R&S FSH. Frequency-dependent cablemodels can be generated using the R&S FSH View software and stored inthe cable model memory of the R&S FSH. The cable parameters for adefined frequency can be entered directly into the R&S FSH.
The cable loss is used to correct the return loss of the discontinuity becauseit becomes more significant as the cable loss increases (i.e. the farther awaythe fault lies). The velocity factor of the cable is used to calculate the actualdistance to fault.
When cable models stored in the R&S FSH are opened, the value of thecable loss is calculated for the measurement frequency range. If the cableparameters are entered manually, please note that the cable loss valuecorresponds to the center frequency for the DTF measurement.
Discontinuity Measurement on Antenna Systems withTower-Mounted Amplifier (TMA)The discontinuity measurement is essentially identical to the measurementon systems without a tower-mounted amplifier (TMA). However, please note

Testing Antenna Systems Using the R&S FSH
1EF52_0E 13 of 35 Rohde & Schwarz
that the TMA forms a discontinuity in a wide frequency range because of thebuilt-in transmit and receive filters. Outside of their passbands, these filtersindicate the total reflection during matching measurement and act as stopsduring the transmission loss measurement. A TMA therefore manifests itselfas a large discontinuity during the discontinuity measurement.
Refer to the following section for the subsequent measurement steps, andfor more detailed information about assessing the measurements carried outon 3G TMA antenna systems.
Discontinuity Measurement behind the TMA (3G)A discontinuity measurement in the frequency range of the filter passbandcharacteristic — i.e. through the TMA — can, with some restrictions, be usedto detect faults located between the TMA and the antenna. The TMA filtershave only a limited bandwidth allowing a view of the antenna. The limitedbandwidth causes additional phase or group delays for the test signal, so thata DTF assessment can no longer be performed with a high degree ofaccuracy based on the measured delay or distance .
To allow an assessment of a TMA with a connected, properly functioningantenna, use the procedures and advice listed below, as well as theindividual results from on-site system measurements.
DTF Measurement over a Wide Frequency Range (3G)During DTF measurement of an antenna system, the basic DTFmeasurement should be performed with a high degree of resolution (i.e.across a wide frequency span) in order to get a good indication of faults inthe feeder cable up to the TMA.
This example measures a 3G tower-mounted amplifier. The followingsettings were selected:
Center frequency: 2045 MHzFrequency span: 1.256 GHz (60 m cable LDF6-50)
Setup: feeder cable (40 m LDF6-50) – TMA jumper cable (2m) – cross-polarized antenna.
The set frequency range is too wide for the passband of the TMA filters toallow an assessment of the path between the TMA and the antenna. In spiteof this, the following system functions can still be assessed:
1. During the matching measurement, the antenna matching canbe measured in the range of the TMA filter passbandcharacteristics.
2. No significant discontinuities are present up to the TMA.
3. The decoupling measurement (on cross-polarized antennas)does not indicate any particular problems.
4. At jumper cable lengths of approximately 2 m between theTMA and the antenna, jumps in the DTF measurement can befound about 0.5 m and 3 m after the TMA. In addition, theoutgoing wave behind the TMA is about 5 m long (see figure).The R&S FSH Zoom function is useful for viewing this.
If a different TMA is used, or if the jumper cable lengths betweenthe TMA and antenna differ from those described here, the actualdistances will be different than shown here.

Testing Antenna Systems Using the R&S FSH
1EF52_0E 14 of 35 Rohde & Schwarz
DTF Measurement in the Transmit and Receive Frequency Range(3G)
To determine the span between the TMA and theantenna, the frequency range for DTFmeasurement can be reduced to the 3Gfrequency range.
When using the UL and DL range, the maximumspan is about 310 MHz (corresponds to approx.220 m LDF4-50). The stopband for the TMAbetween the UL and the DL manifests itself as adiscontinuity.
A DTF measurement with a center frequency of 2045 MHz and a span of310 MHz (220m LDF4-50) in the following environment provided theseresults:
Jumper cable, 2 mFSH3 TMA3G cross-polar.antenna
Feeder cable

Testing Antenna Systems Using the R&S FSH
1EF52_0E 15 of 35 Rohde & Schwarz
This figure shows various measurements on a single system. Of particularinterest is that the size of the discontinuity at the TMA input is not dependenton the reflection factor at the TMA output. The length of the feeder cable iscorrectly measured at about 2 m. Visible here are the connectors at theantenna base, the antenna dipoles, and to a lesser degree the radiation ofthe antenna. Because the TMA indicates a discontinuity in the frequencyrange being used (between the transmit and receive frequency range), thecomponents behind the TMA (in this example) indicate an overmatching ofat least 7 dB. As a result, their reflection characteristics cannot be preciselyassessed.
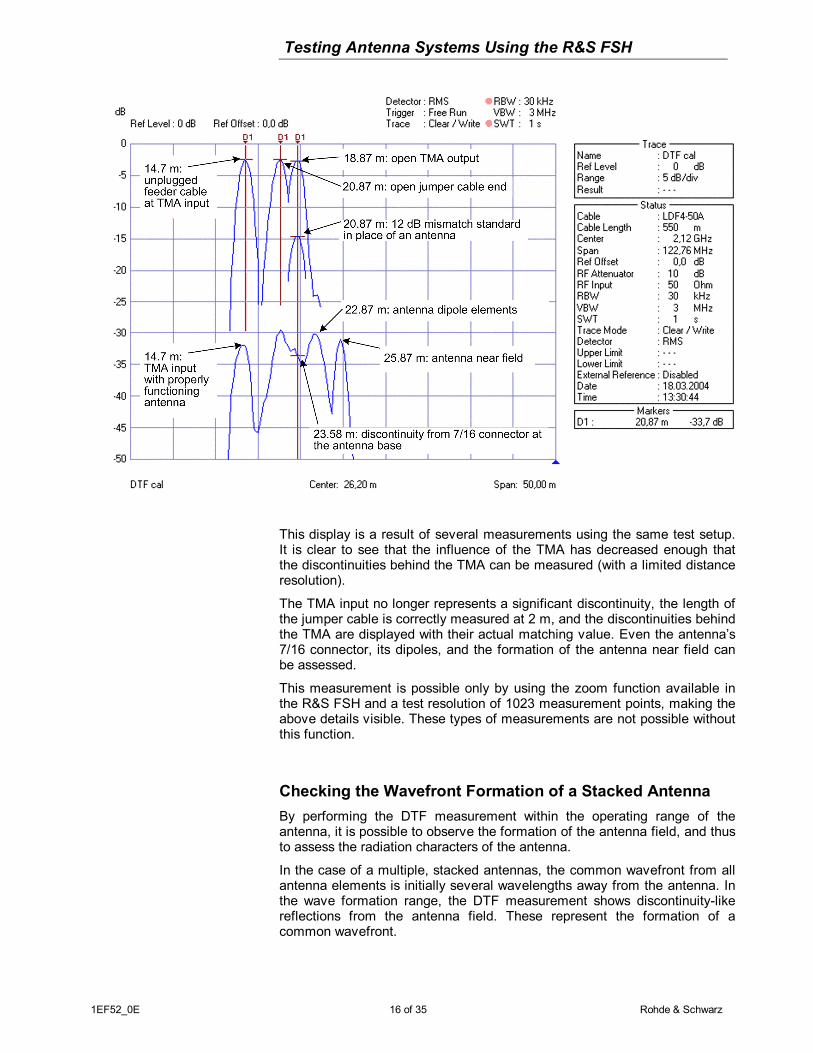
DTF Measurement Only in the Transmit Frequency Range (3G)To further reduce the effects of the TMA and to avoid the mismatching rangebetween the transmit and the receive frequency range, it makes sense tomeasure only in the transmit frequency range (DL). In addition to the widerpassband characteristic, the transmit range has less insertion loss ascompared to the receive frequency range.
The following example measures the same test configuration as definedabove, but with a center frequency of 2120 MHz and a frequency range ofabout 123 MHz (550 m cable):
Testing Antenna Systems Using the R&S FSH
1EF52_0E 16 of 35 Rohde & Schwarz
This display is a result of several measurements using the same test setup.It is clear to see that the influence of the TMA has decreased enough thatthe discontinuities behind the TMA can be measured (with a limited distanceresolution).
The TMA input no longer represents a significant discontinuity, the length ofthe jumper cable is correctly measured at 2 m, and the discontinuities behindthe TMA are displayed with their actual matching value. Even the antenna’s7/16 connector, its dipoles, and the formation of the antenna near field canbe assessed.
This measurement is possible only by using the zoom function available inthe R&S FSH and a test resolution of 1023 measurement points, making theabove details visible. These types of measurements are not possible withoutthis function.
Checking the Wavefront Formation of a Stacked AntennaBy performing the DTF measurement within the operating range of theantenna, it is possible to observe the formation of the antenna field, and thusto assess the radiation characters of the antenna.
In the case of a multiple, stacked antennas, the common wavefront from allantenna elements is initially several wavelengths away from the antenna. Inthe wave formation range, the DTF measurement shows discontinuity-likereflections from the antenna field. These represent the formation of acommon wavefront.

Testing Antenna Systems Using the R&S FSH
1EF52_0E 17 of 35 Rohde & Schwarz
Antenna
Near field
DTF measurement of a stacked antenna. Theformation of the wavefront in the near fieldarea is easily recognizable
Mismatchstandard
For comparison, this is a DTF measurement ofa mismatch standard. No antenna field forms,and the standard appears as a concentrateddiscontinuity
Special Characteristics of the R&S FSHMeasurement of the Transfer Function of Active ElementsThe R&S FSH measures the transfer function based on the trackinggenerator running synchronously with the receive frequency. The outputsignal from the tracking generator is a sinusoidal signal with an almostconstant level. Transient effects of the active elements are therefore notrelevant for the measurement, or can be avoided by matching the sweepspeed. This is not the case for measurements that use a coded signal fromthe tracking generator, which causes a jump in the output frequency in orderto suppress noise signals in the receiver using correlation. Depending on thepulse response time of the system under test, as well as the duration of thegenerator pulse, a gain value that is too low is measured for the activemodule. This is not the case with the R&S FSH.
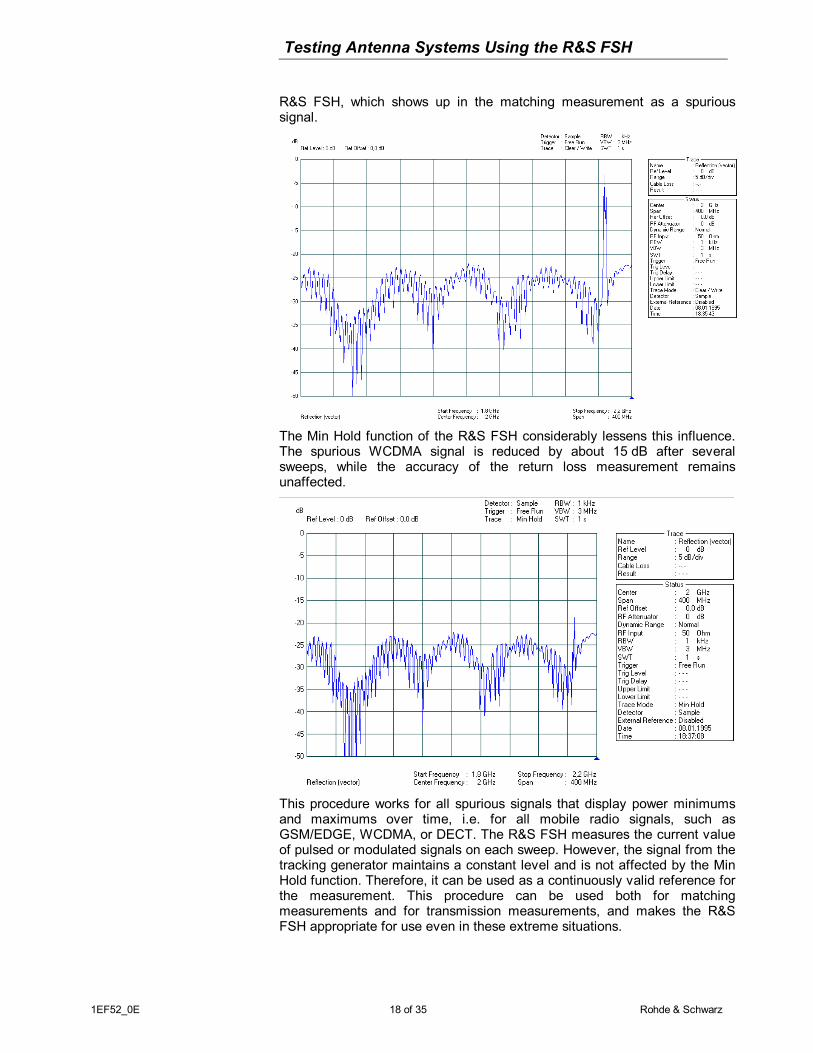
Antenna System Measurements Influenced by RFReflection, discontinuity, and decoupling measurements on antenna systemscan be affected by transmitters operating in the vicinity. If there is littledecoupling between the transmitting antenna and the antenna under test, thetransmit signal will affect the test result. For example, the interfering signalmight be found in the results of the return loss measurement. The Trace MinHold function on the R&S FSH significantly reduces the effects of interferingtransmit signals (GSM, WCDMA, etc) on the display of the test result.
The following example shows the matching measurement of a cross-polarized antenna. A WCDMA signal is transmitted on the second system ofthis antenna. As a result of the decoupling of the two systems in this antennaof about 35 dB, a noise level of about +2 dBm is present on the bridge of the
Testing Antenna Systems Using the R&S FSH
1EF52_0E 18 of 35 Rohde & Schwarz
R&S FSH, which shows up in the matching measurement as a spurioussignal.
The Min Hold function of the R&S FSH considerably lessens this influence.The spurious WCDMA signal is reduced by about 15 dB after severalsweeps, while the accuracy of the return loss measurement remainsunaffected.
This procedure works for all spurious signals that display power minimumsand maximums over time, i.e. for all mobile radio signals, such asGSM/EDGE, WCDMA, or DECT. The R&S FSH measures the current valueof pulsed or modulated signals on each sweep. However, the signal from thetracking generator maintains a constant level and is not affected by the MinHold function. Therefore, it can be used as a continuously valid reference forthe measurement. This procedure can be used both for matchingmeasurements and for transmission measurements, and makes the R&SFSH appropriate for use even in these extreme situations.

Testing Antenna Systems Using the R&S FSH
1EF52_0E 19 of 35 Rohde & Schwarz
Decoupling Measurements
Decoupling Measurements of Antenna SystemsIn the case of cross-polarized antennas, matching measurements alone arenot sufficient to ensure the proper functioning of the antenna system. Insome cross-polarized antennas, defects can be detected only by measuringthe antenna decoupling. In these antenna systems, the matchingmeasurement does not show any particular problems. The decouplingmeasurement of the two antenna systems, however, shows an abnormalprogression over the frequency.
This picture shows an example of an antenna defect — an unsolderedcable connection — on a new antenna. This type of defect is noticed onlyby performing an antenna decoupling measurement:
The GSM 1800 base station in this example had an elevated call droprate, which was due to the differing directional characteristics of the twosystems contained in the antenna.
Antenna decoupling
Ret
urn
loss
Example of a typical antenna decoupling
It is recommended that a collection oftypical SX antenna decouplings becompiled in cooperation with themanufacturer and made available to thetest engineers so that they can assess thestatus of an antenna system for a variancecomparison.
The type of antenna and the definedelectrical downtilt must be taken intoconsideration, because the decouplingcharacteristic over the frequency differs asa function of these factors.
Depending on the antenna type, it can also be useful to remove the electricaldowntilt from the antenna — i.e. to return the antenna to its status asdelivered — to make it possible to measure defined decoupling values.
Based on experience, a deviation from the nominal value of ± 3 dB shouldbe worth further investigation.
The feeder cable loss should be taken into consideration when assessing themeasured decoupling values. This cable loss increases the decoupling bythe loss of both feeder cables being measured.
Antenna systems with near field interference from buildings display adifferent decoupling over the frequency range. This is a result of thenear field interference, and is not the result of a defect.

Testing Antenna Systems Using the R&S FSH
1EF52_0E 20 of 35 Rohde & Schwarz
If there is interference in the first Fresnell zone, the radiationcharacteristics of the antenna change significantly.
This can affect the matching values, and especially the decoupling valuesof an antenna.
Decoupling Measurement of Antenna Systems with Tower-Mounted Amplifiers (TMA)Like for the matching measurement, on antenna systems with tower-mounted amplifiers, only the passband of the TMA filters is available fordetermining the decoupling of the antenna elements. During thismeasurement, the TMA gain can be determined simply by connecting anddisconnecting the TMA supply voltage.
The decoupling measurement of the antenna system must take into accountboth the cable loss of the two feeder cables and the transmission loss of theTMA. In the receive path, this loss lies in the range of 0.1 dB to 0.5 dB,depending on the TMA type. In the transmit path, it lies between 1 dB and2 dB. The loss values must be taken into consideration for every TMA to beincluded in the measurement (typically two).
This diagram shows the signalling path with the built-in modules.
Antennadecoupling
TMA filters
Display on the R&SFSH: The measuredvalues for theantenna decouplingare increased by thefeeder cable lossand the TMA filters
Signal from theR&S FSH trackinggenerator

Testing Antenna Systems Using the R&S FSH
1EF52_0E 21 of 35 Rohde & Schwarz
Measurement of the Tower-Mounted Amplifier (TMA) GainThe test setup for measuring the antenna decoupling with a built-in TMAshown in the following diagram can be used in conjunction with a bias T (DCfeeder switch) to determine the gain of the TMA being fed. By connectingand disconnecting the supply voltage, the gain is detected directly as thedifference between the decoupling measurements in the transmit path withand without power. The bias T needed for the TMA power supply is to beinserted into the signal return path of the R&S FSH, as shown in theillustration.
Test setup for measuring the antenna decoupling and the TMA gain
The gain of a TMA without bypass cannot be measured. However, byconnecting and disconnecting the power, it is possible to determine whetherthe TMA is amplified.
Measurement of the Whole System GainThe measurement of the tower-mounted amplifier described above is to beused only when testing the TMA functionality exclusively. When measuringthe gain of the TMA, the components in the receive path of the mobile radiobase station must also be taken into consideration. The TMA shouldcompensate for the receive cable loss. Moreover, the TMA may not be usedfor excessive level gain because this can make the defined RX parameters(e.g. for detecting RX level handover or for power regulation at the mobilestation) impracticable or even dangerous.
Testing Antenna Systems Using the R&S FSH
1EF52_0E 22 of 35 Rohde & Schwarz
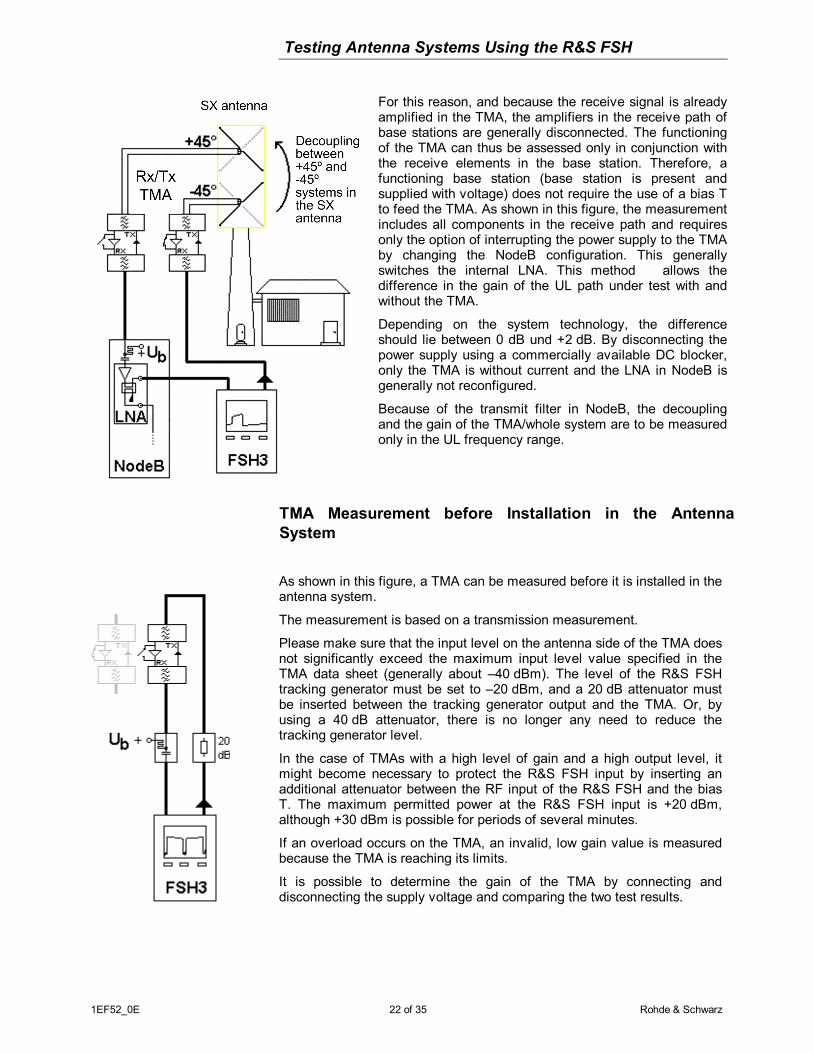
For this reason, and because the receive signal is alreadyamplified in the TMA, the amplifiers in the receive path ofbase stations are generally disconnected. The functioningof the TMA can thus be assessed only in conjunction withthe receive elements in the base station. Therefore, afunctioning base station (base station is present andsupplied with voltage) does not require the use of a bias Tto feed the TMA. As shown in this figure, the measurementincludes all components in the receive path and requiresonly the option of interrupting the power supply to the TMAby changing the NodeB configuration. This generallyswitches the internal LNA. This method allows thedifference in the gain of the UL path under test with andwithout the TMA.
Depending on the system technology, the differenceshould lie between 0 dB und +2 dB. By disconnecting thepower supply using a commercially available DC blocker,only the TMA is without current and the LNA in NodeB isgenerally not reconfigured.
Because of the transmit filter in NodeB, the decouplingand the gain of the TMA/whole system are to be measuredonly in the UL frequency range.
TMA Measurement before Installation in the AntennaSystem
As shown in this figure, a TMA can be measured before it is installed in theantenna system.
The measurement is based on a transmission measurement.
Please make sure that the input level on the antenna side of the TMA doesnot significantly exceed the maximum input level value specified in theTMA data sheet (generally about –40 dBm). The level of the R&S FSHtracking generator must be set to –20 dBm, and a 20 dB attenuator mustbe inserted between the tracking generator output and the TMA. Or, byusing a 40 dB attenuator, there is no longer any need to reduce thetracking generator level.
In the case of TMAs with a high level of gain and a high output level, itmight become necessary to protect the R&S FSH input by inserting anadditional attenuator between the RF input of the R&S FSH and the biasT. The maximum permitted power at the R&S FSH input is +20 dBm,although +30 dBm is possible for periods of several minutes.
If an overload occurs on the TMA, an invalid, low gain value is measuredbecause the TMA is reaching its limits.
It is possible to determine the gain of the TMA by connecting anddisconnecting the supply voltage and comparing the two test results.
Testing Antenna Systems Using the R&S FSH
1EF52_0E 23 of 35 Rohde & Schwarz
5 Summary of Test ProceduresThis section summarizes the test procedures that should be used to acceptor assess antenna systems composed of 2G or 3G base stations.
Antenna Systems without TMAFor all antenna systems:
• Return loss (RL) measurement with connected antenna.
• DTF measurement with connected antenna (measurement of thecomplete system). The DTF measurement shows discontinuities in thecable. If performed within the antenna’s operating frequency range, themeasurement also shows the formation of the antenna near field and thelength of the feeder cable.
For cross-polarized sector antennas:
• Decoupling measurement of both antenna systems in the case of cross-polarized antennas. This measurement shows the electricalcharacteristics of these types of antennas better than a simple returnloss measurement.
Antenna Systems with TMAFor all antenna systems:
• Return loss measurement with connected antenna, without power to theTMA (= traditional method of measuring the reflected power in anantenna system).
• DTF measurement with connected antenna, without power to the TMA(= measurement of the complete system). The DTF measurement showsdiscontinuities in the cable, the TMA, and (if performed within theoperating frequency range of the antenna/TMA) discontinuities betweenthe TMA and the antenna, as well as the formation of the antenna nearfield. For this measurement, the TMA may not be supplied with DC.
For cross-polarized sector antennas:
• Decoupling measurement of both antenna systems in the case of cross-polarized antennas, without power to the TMA (shows the decoupling ofthe antenna system through the TMA filters).
• Gain measurement of the TMA in the whole system, with power to theTMA from the base station. Measurement as described in the section“Measurement of the TMA Gain“.
• If no base station is set up: Measurement of the TMA gain with externalbias T as described in the section “Measurement of the Whole SystemGain”.

Testing Antenna Systems Using the R&S FSH
1EF52_0E 24 of 35 Rohde & Schwarz
6 Example MeasurementsThese example measurements are based on an R&S FSH, Model1145.5850.23 with firmware version 7.0 or higher, and with installed optionsR&S FSH-B1 (Distance-To-Fault Measurement) and R&S FSH-K2 (VectorTransmission and Reflection Measurements), and with the VSWR BridgeR&S FSH-Z2.
Frequency Ranges
The following frequency ranges apply for the various services:
Service Total UL DL
GSM 900 880 MHz to 960 MHz 880 MHz to 915 MHz 925 MHz to 960 MHzGSM (2G)
GSM 1800 1710 MHz to 1880 MHz 1710 MHz to 1785 MHz 1805 MHz to 1880 MHz
UMTS (3G) TDD / FDD 1900 MHz to 2170 MHz
TDD 1900 MHz to 1920 MHz
FDD 1920 MHz to 2170 MHz 1920 MHz to 1980 MHz 2110 MHz to 2170 MHz
TDD 2020 MHz to 2025 MHz
The following frequency range and marker settings are recommended for theexample measurements:
Service Start/Stop Frequencies: Markers 1+2: (UL) Markers 3+4: (TX)
GSM 900 875 MHz to 965 MHz 880 MHz, 915 MHz 925 MHz, 960 MHzGSM (2G)
GSM 1800 1700 MHz to 1890 MHz 1710 MHz, 1785 MHz 1805 MHz, 1880 MHz
UMTS (3G) TDD / FDD 1890 MHz to 2200 MHz(Center: 2045 MHzSpan: 310 MHz)
1920 MHz, 1980 MHz 2110 MHz, 2170 MHz
Once you have defined a setup, you should store it in the R&S FSH.

Testing Antenna Systems Using the R&S FSH
1EF52_0E 25 of 35 Rohde & Schwarz
Antenna System without Tower-Mounted Amplifier
Matching Measurements
Test Setup: Settings on the R&S FSH:
Attach the VSWR bridge (R&S FSH-Z2) onto the R&S FSH.
Switch on the tracking generator on the R&S FSH (Key MEAS: SoftkeyMEASURE: Select TRACKING GEN: Press the ENTER key)
Select center frequency: based on service or operating frequency range ofthe antenna system (Key FREQ: Input the frequency value).Select span: based on service (Key SPAN: Input the span value).
Select vector measurement on R&S FSH (Key MEAS: Softkey MEASMODE: Select VECTOR: Press the ENTER key).
Calibrate measurement: Press Softkey RELECT CAL and followinstructions on R&S FSH.Connect bridge output with antenna cable.
Remarks:
The antenna matching appears to be improved by the feeder cable lossand worsened by the energy returning from the antenna. Refer to thesection “Matching Measurement Errors”.
The ripples in the matching measurement can indicate possiblediscontinuities. Refer to the section “Introduction to DTF and DiscontinuityMeasurements “
Example Measurement:
Testing Antenna Systems Using the R&S FSH
1EF52_0E 26 of 35 Rohde & Schwarz
DTF Measurements
Test Setup: Settings on the R&S FSH:
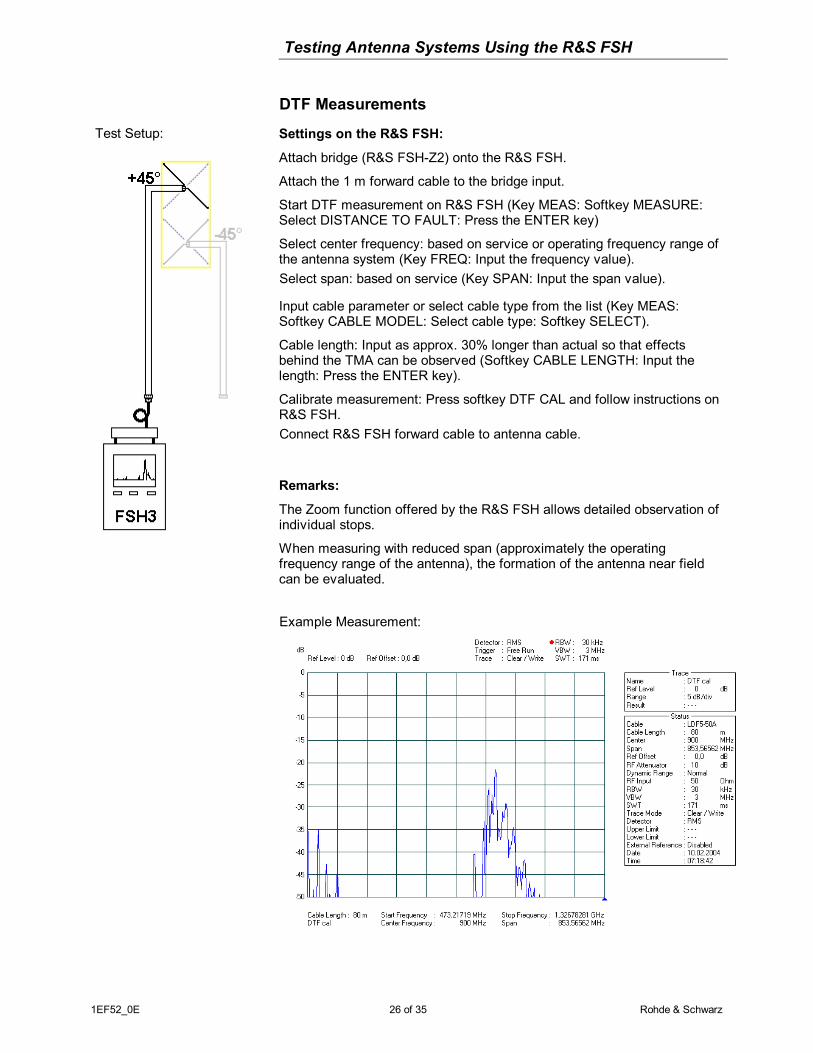
Attach bridge (R&S FSH-Z2) onto the R&S FSH.
Attach the 1 m forward cable to the bridge input.
Start DTF measurement on R&S FSH (Key MEAS: Softkey MEASURE:Select DISTANCE TO FAULT: Press the ENTER key)
Select center frequency: based on service or operating frequency range ofthe antenna system (Key FREQ: Input the frequency value).Select span: based on service (Key SPAN: Input the span value).
Input cable parameter or select cable type from the list (Key MEAS:Softkey CABLE MODEL: Select cable type: Softkey SELECT).
Cable length: Input as approx. 30% longer than actual so that effectsbehind the TMA can be observed (Softkey CABLE LENGTH: Input thelength: Press the ENTER key).
Calibrate measurement: Press softkey DTF CAL and follow instructions onR&S FSH.Connect R&S FSH forward cable to antenna cable.
Remarks:
The Zoom function offered by the R&S FSH allows detailed observation ofindividual stops.
When measuring with reduced span (approximately the operatingfrequency range of the antenna), the formation of the antenna near fieldcan be evaluated.
Example Measurement:
Testing Antenna Systems Using the R&S FSH
1EF52_0E 27 of 35 Rohde & Schwarz
Decoupling Measurement
Test Setup: Settings on the R&S FSH:
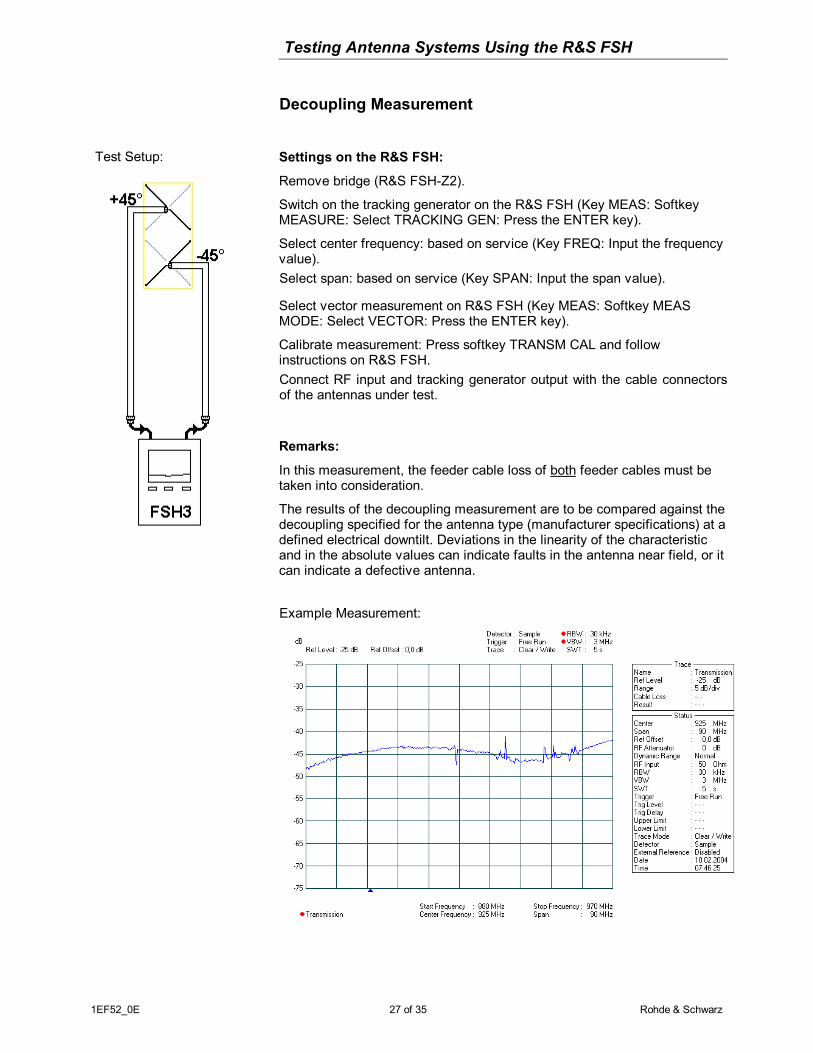
Remove bridge (R&S FSH-Z2).
Switch on the tracking generator on the R&S FSH (Key MEAS: SoftkeyMEASURE: Select TRACKING GEN: Press the ENTER key).
Select center frequency: based on service (Key FREQ: Input the frequencyvalue).Select span: based on service (Key SPAN: Input the span value).
Select vector measurement on R&S FSH (Key MEAS: Softkey MEASMODE: Select VECTOR: Press the ENTER key).
Calibrate measurement: Press softkey TRANSM CAL and followinstructions on R&S FSH.Connect RF input and tracking generator output with the cable connectorsof the antennas under test.
Remarks:
In this measurement, the feeder cable loss of both feeder cables must betaken into consideration.
The results of the decoupling measurement are to be compared against thedecoupling specified for the antenna type (manufacturer specifications) at adefined electrical downtilt. Deviations in the linearity of the characteristicand in the absolute values can indicate faults in the antenna near field, or itcan indicate a defective antenna.
Example Measurement:

Testing Antenna Systems Using the R&S FSH
1EF52_0E 28 of 35 Rohde & Schwarz
Antenna Systems with Tower-Mounted Amplifier
Matching Measurements
Test Setup: Settings on the R&S FSH:
Attach bridge (R&S FSH-Z2) onto the R&S FSH.
Switch on the tracking generator on the R&S FSH (Key MEAS: SoftkeyMEASURE: Select TRACKING GEN: Press the ENTER key)Select center frequency: based on service or operating frequency range ofthe antenna system (Key FREQ: Input the frequency value).
Select span: based on service (Key SPAN: Input the span value).
Select vector measurement on R&S FSH (Key MEAS: Softkey MEASMODE: Select VECTOR: Press the ENTER key).
Calibrate measurement: Press softkey RELECT CAL and follow instructionson R&S FSH.
TMA feed: noneConnect bridge output with antenna cable.
Remarks:
The antenna matching is improved by the feeder cable loss and the TMAand worsened by the energy returning from the antenna.
The antenna matching can be detected only in the passbands of the TMAfilters.
Refer to section “Matching Measurement of Antenna Systems with aTower-Mounted Amplifier (TMA)“.
Example Measurement:

Testing Antenna Systems Using the R&S FSH
1EF52_0E 29 of 35 Rohde & Schwarz
DTF Measurements
Test Setup: Settings on the R&S FSH:
Attach bridge onto the R&S FSH.
Attach the 1 m forward cable to the bridge input.
Switch on the DTF measurement on the R&S FSH (Key MEAS: SoftkeyMEASURE: Select DISTANCE TO FAULT: Press the ENTER key)
Select center frequency: based on service or operating frequency range ofthe antenna system (Key FREQ: Input the frequency value).
Input the cable parameters or select cable type from the list (Key MEAS:Softkey CABLE MODEL: Select cable type: Softkey SELECT).
Cable length: Input as approx. 30% longer than actual so that effectsbehind the TMA can be observed (Softkey CABLE LENGTH: Input thelength: Press the ENTER key).
Calibrate measurement: Press softkey DTF CAL and follow instructions onR&S FSH.
TMA feed: noneConnect R&S FSH forward cable with the antenna cable.
Remarks:
The Zoom function offered by the R&S FSH allows detailed observation ofindividual discontinuities.
During the measurement, only the range between the TMA and the antennacan be checked for discontinuities by matching the center frequency andthe frequency span. Refer to section “Discontinuity Measurement behindthe TMA“.
Example Measurement:

Testing Antenna Systems Using the R&S FSH
1EF52_0E 30 of 35 Rohde & Schwarz
Decoupling Measurement
Test Setup: Settings on the R&S FSH:
Remove bridge.
Switch on the tracking generator on the R&S FSH (Key MEAS:Softkey MEASURE: Select TRACKING GEN: Press the ENTER key).
Select center frequency: based on service (Key FREQ: Input thefrequency value).Select span: based on service (Key SPAN: Input the span value).
Select vector measurement on R&S FSH (Key MEAS: Softkey MEASMODE: Select VECTOR: Press the ENTER key).
Calibrate measurement: Press softkey TRANSM CAL and followinstructions on R&S FSH.
TMA feed: noneConnect RF input and tracking generator output with the cableconnectors of the antenna under test.
Remarks:
In this measurement, the feeder cable loss of both feeder cables andthe attenuation from both TMAs (which will differ in the UL and DLranges!) must be taken into consideration.
The antenna decoupling can be detected only in the passbands of theTMA filters.
The results are to be compared against the decoupling specified forthe antenna type (manufacturer specifications) at a defined electricaldowntilt.
Example Measurement:

Testing Antenna Systems Using the R&S FSH
1EF52_0E 31 of 35 Rohde & Schwarz
Measurement of the TMA Gain
Test Setup: Settings on the R&S FSH:
Remove bridge.
Switch on the tracking generator on the R&S FSH: KeyMEAS: Softkey MEASURE: Select TRACKING GEN: Pressthe ENTER key.
Select center frequency: based on service (Key FREQ:Input the frequency value).Select span: based on service (Key SPAN: Input the spanvalue).
Select vector measurement on R&S FSH: Key MEAS:Softkey MEAS MODE: Select VECTOR: Press the ENTERkey.
Calibrate measurement: Press softkey TRANSM CAL andfollow instructions on R&S FSH.
TMA feed: With external bias T.Connect RF input and tracking generator output with thecable connectors of the antenna under test.
Remarks:
The TMA gain can be determined by connecting anddisconnecting the TMA power. This measurement can beperformed in combination with the antenna decouplingmeasurement as described in the preceding section.
Example Measurement:

Testing Antenna Systems Using the R&S FSH
1EF52_0E 32 of 35 Rohde & Schwarz
Measurement of the Whole System Gain
Test Setup: Settings on the R&S FSH:Remove bridge.
Switch on the tracking generator on the R&S FSH: KeyMEAS: Softkey MEASURE: Select TRACKING GEN: Pressthe ENTER key.
Select center frequency: based on service (Key FREQ:Input the frequency value).
Select span: based on service (Key SPAN: Input the spanvalue).
Set reference level to –10 dB: Key AMPT: Input -10: Pressthe ENTER key.
Select vector measurement on R&S FSH: Key MEAS:Softkey MEAS MODE: Select VECTOR: Press the ENTERkey.
Calibrate measurement: Press softkey TRANSM CAL andfollow instructions on R&S FSH.
TMA feed: Via the base station
Remarks:
The TMA gain can be determined in conjunction with thewhole system by connecting and disconnecting the TMApower. In this measurement, only the UL range can bedetected because of the UL filter installed in the system.
Example Measurement:

Testing Antenna Systems Using the R&S FSH
1EF52_0E 33 of 35 Rohde & Schwarz
Measurement of the TMA Gain at Ground
Test Setup: Settings on the R&S FSH:
Remove bridge.
Switch on the tracking generator on the R&S FSH: Key MEAS: SoftkeyMEASURE: Select TRACKING GEN: Press the ENTER key.
Set output level of the tracking generator to –20 dBm.
Select center frequency: based on service (Key FREQ: Input thefrequency value).
Set reference level to +10 dB: Key AMPT: Input +10: Press the ENTERkey.
Select vector measurement on R&S FSH: Key MEAS: Softkey MEASMODE: Select VECTOR: Press the ENTER key.
Calibrate measurement: Press softkey TRANSM CAL and followinstructions on R&S FSH.
TMA feed: Via external bias T
Attach a 20 dB attenuator to the tracking generator output of the R&SFSH.
Remarks:
The TMA gain can be determined before it is installed in an antennasystem by connecting and disconnecting the TMA power.
A suitable attenuator should be used at the TMA input to protect the TMAagainst overloads.
Example Measurement:
Testing Antenna Systems Using the R&S FSH
1EF52_0E 34 of 35 Rohde & Schwarz
7 Additional Information
Note Regarding Defective AntennasMatching and decoupling measurements cannot preclude the possibility of adefect in the antenna system. Even though nothing suspicious might bedetected in either measurement, it is still possible that the transmit andreceive characteristics of the antenna will be unsatisfactory.
The following measurements can be used to search for defective antennasproducing insufficient radio coverage:
• RX function test (analysis of the mobile station's transmit powerreferenced to the DL level).
• Checking the DL levels on different GSM channels of the base station. Itis possible that the DL levels on the channels in a defective antennasystem are higher or lower than those on the properly functioningsystem.
• For GSM, does an intracellular handover occur shortly after the TCHassignment? The level of the affected channel could be too low becauseof antenna problems, and therefore the channel would be faulty becauseof interference.
• Reciprocal UL-DL relationship at the horizontal limits of the antennadiagram.
• The field strength in the coverage area of the antenna is too low ascompared to the theoretical value, i.e. the antenna usually displays asquint (see below).
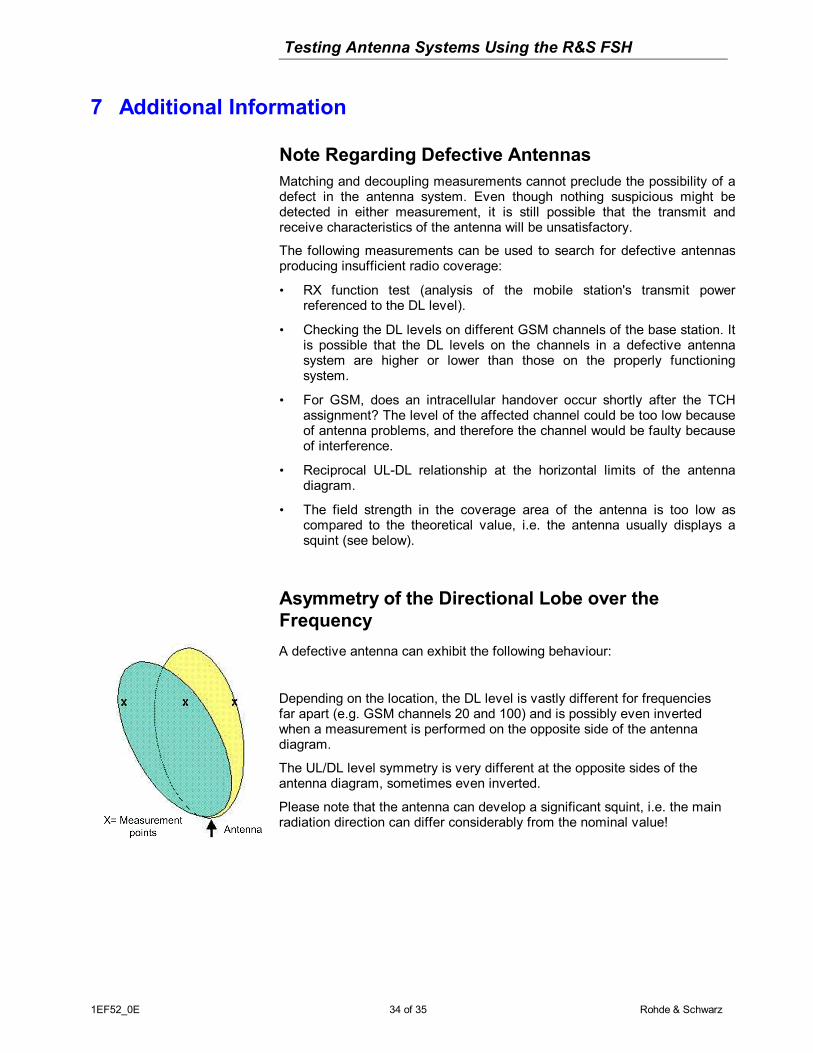
Asymmetry of the Directional Lobe over theFrequencyA defective antenna can exhibit the following behaviour:
Depending on the location, the DL level is vastly different for frequenciesfar apart (e.g. GSM channels 20 and 100) and is possibly even invertedwhen a measurement is performed on the opposite side of the antennadiagram.
The UL/DL level symmetry is very different at the opposite sides of theantenna diagram, sometimes even inverted.
Please note that the antenna can develop a significant squint, i.e. the mainradiation direction can differ considerably from the nominal value!

Testing Antenna Systems Using the R&S FSH
1EF52_0E 35 of 35 Rohde & Schwarz
8 AbbreviationsDL Downlink (transmit direction of the BTS)
DTF Distance to fault Measurement
FDR Frequency domain reflectometer
LNA Low noise amplifier
RL Return loss
Rx Receiver
SX cross-polarized
TDR Time domain reflectometer
TMA Tower-mounted amplifier
Tx Transmitter
UL Uplink (transmit direction of the mobile station)
9 Ordering InformationEquipment Type
Order NumberR&S FSH3 Handheld Spectrum Analyzer
100 kHz to 3 GHz with TrackingGenerator
1145.5740.13
R&S FSH3 Handheld Spectrum Analyzer100 kHz to 3 GHz with TrackingGenerator and Preamplifier
1145.5740.23
R&S FSH6 Handheld Spectrum Analyzer100 kHz to 6 GHz with TrackingGenerator and Preamplifier
1145.5850.26
R& FSH-B1 Distance to Fault Measurementfor R&S FSH
1145.5750.02
R&S FSH-K2 Vector Reflection andTransmission Measurement forR&S FSH
1157.3387.02
R&S FSH-Z2 VSWR Bridge for R&S FSH,10 MHz to 3 GHz
1145.5767.02
ROHDE & SCHWARZ GmbH & Co. KG . Mühldorfstraße 15 . D-81671 München . P.O.B 80 14 69 . D-81614 München .
Telephone +49 89 4129 -0 . Fax +49 89 4129 - 13777 . Internet: http://www.rohde-schwarz.com
This application note and the supplied programs may only be used subject to the conditions of use set forth in the downloadarea of the Rohde & Schwarz website.
Related Documents