Testing means, part III The two-sample t-test

Welcome message from author
This document is posted to help you gain knowledge. Please leave a comment to let me know what you think about it! Share it to your friends and learn new things together.
Transcript
Testing means, part III
The two-sample t-test
SampleNull hypothesis
The population mean is equal to
o
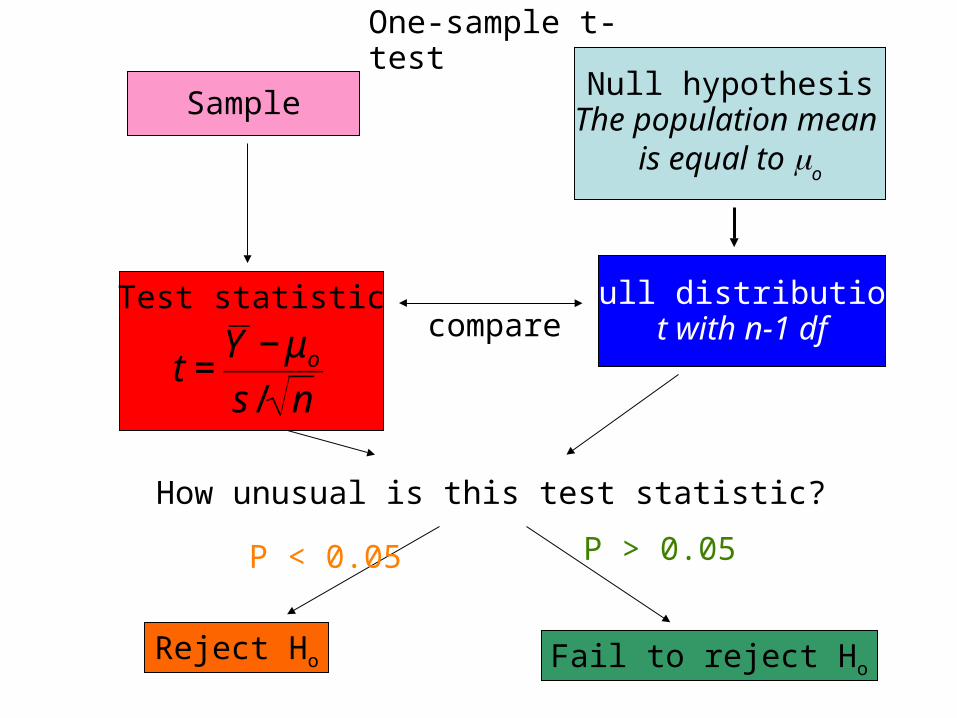
One-sample t-test
Test statistic Null distributiont with n-1 dfcompare
How unusual is this test statistic?
P < 0.05 P > 0.05
Reject Ho Fail to reject Ho
€
t =Y − μo
s / n

SampleNull hypothesis
The mean differenceis equal to
o
Paired t-test
Test statistic Null distributiont with n-1 df
*n is the number of pairscompare
How unusual is this test statistic?
P < 0.05 P > 0.05
Reject Ho Fail to reject Ho
€
t =d − μdo
SEd
4
Comparing means
• Tests with one categorical and one numerical variable
• Goal: to compare the mean of a numerical variable for different groups.
5
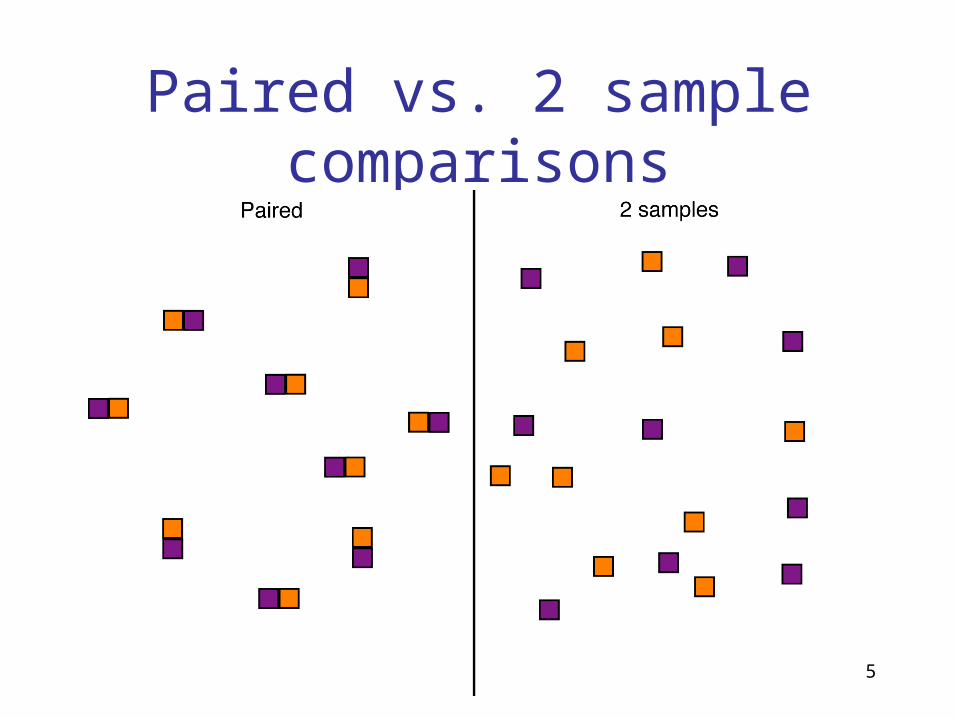
Paired vs. 2 sample comparisons
6
2 Sample Design
• Each of the two samples is a random sample from its population
7
2 Sample Design
• Each of the two samples is a random sample from its population
• The data cannot be paired
8
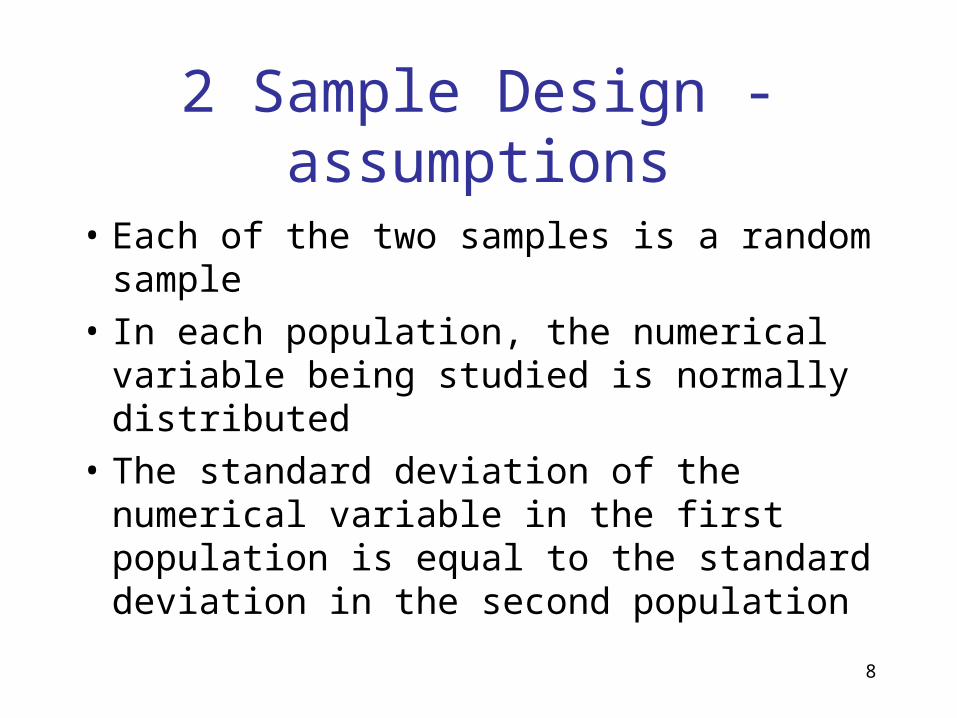
2 Sample Design - assumptions
• Each of the two samples is a random sample
• In each population, the numerical variable being studied is normally distributed
• The standard deviation of the numerical variable in the first population is equal to the standard deviation in the second population

9
Estimation: Difference between two
means
€
Y 1 −Y 2
Normal distributionStandard deviation s1=s2=s
Since both Y1 and Y2 are normally distributed, their difference will also follow a normal distribution

10
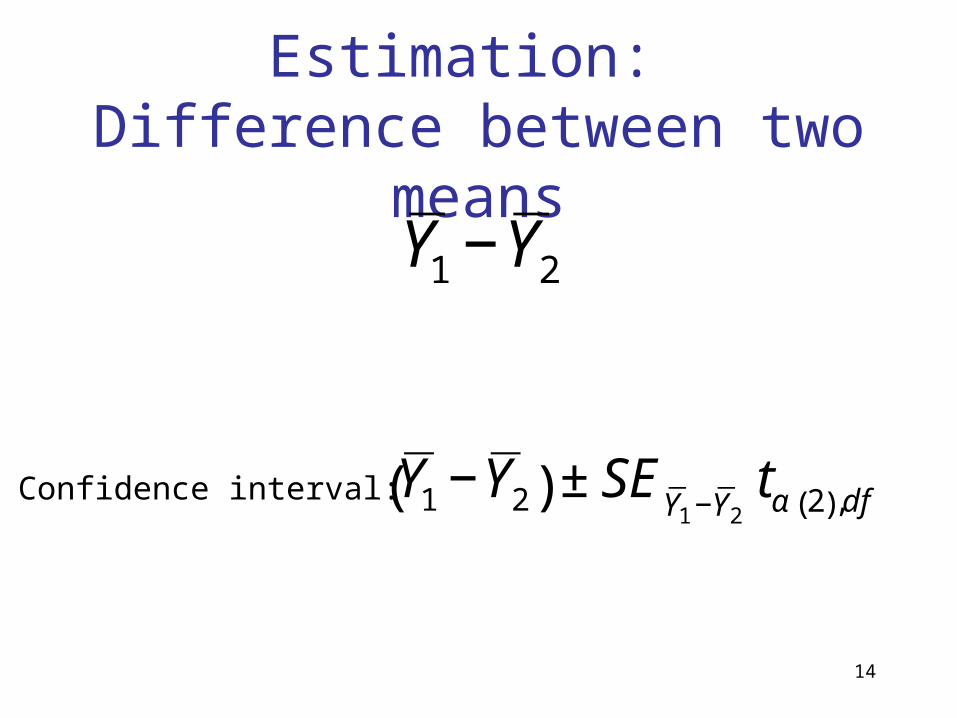
Estimation: Difference between two
means
€
Y 1 −Y 2
Confidence interval:
€
Y 1 −Y 2( ) ± SEY 1 −Y 2
tα 2( ),df
11
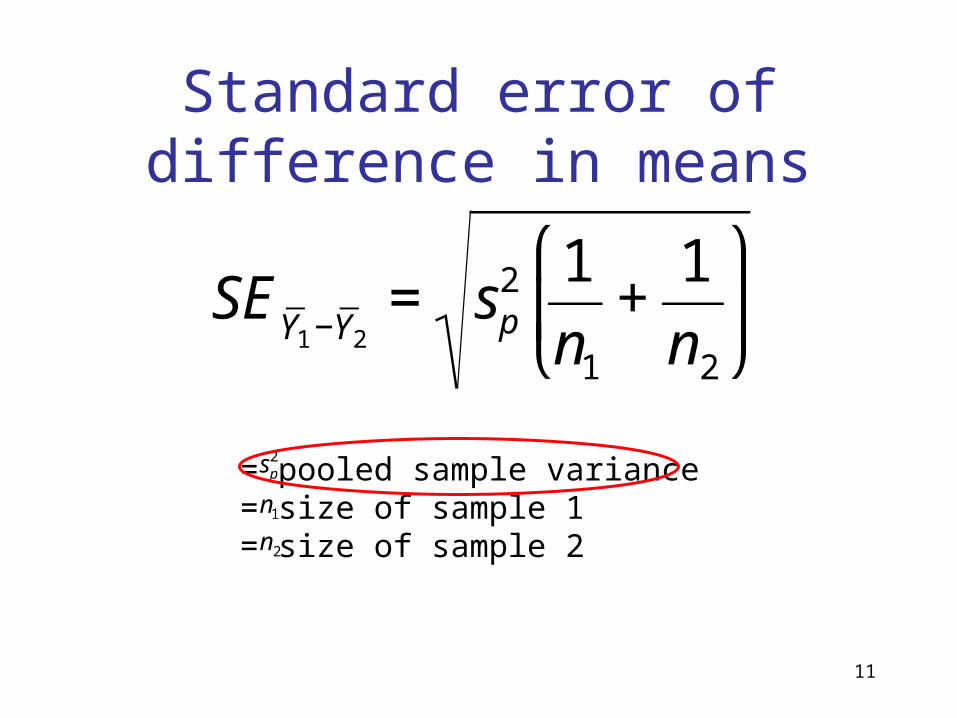
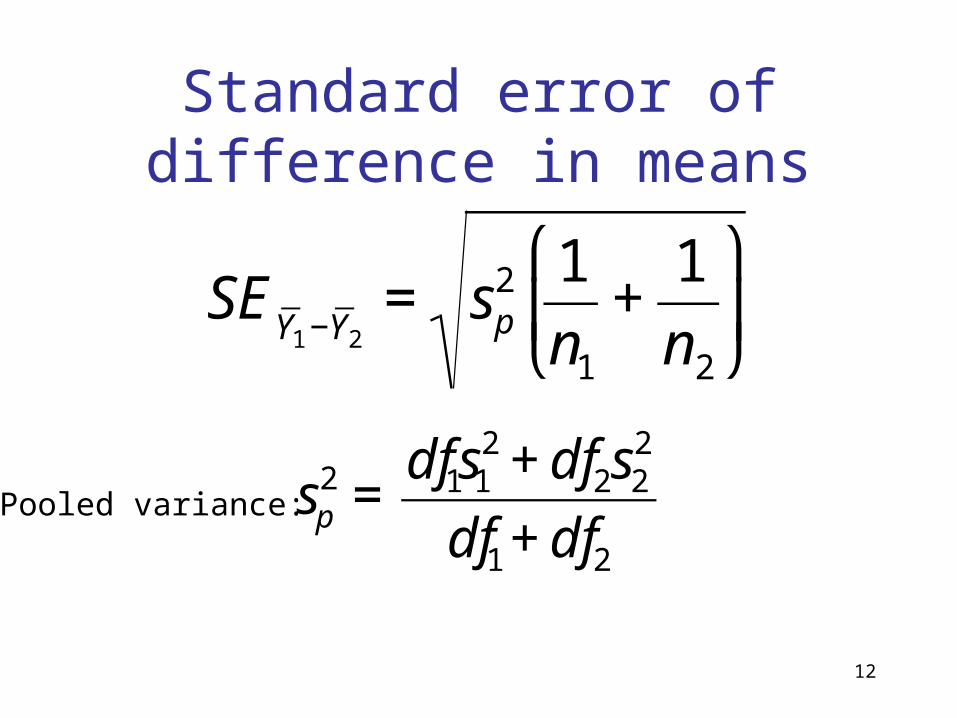
Standard error of difference in means
€
SEY 1 −Y 2
= sp2 1
n1
+1
n2
⎛
⎝ ⎜
⎞
⎠ ⎟
= pooled sample variance= size of sample 1= size of sample 2
€
sp2
n1
n2
12
Standard error of difference in means
€
SEY 1 −Y 2
= sp2 1
n1
+1
n2
⎛
⎝ ⎜
⎞
⎠ ⎟
€
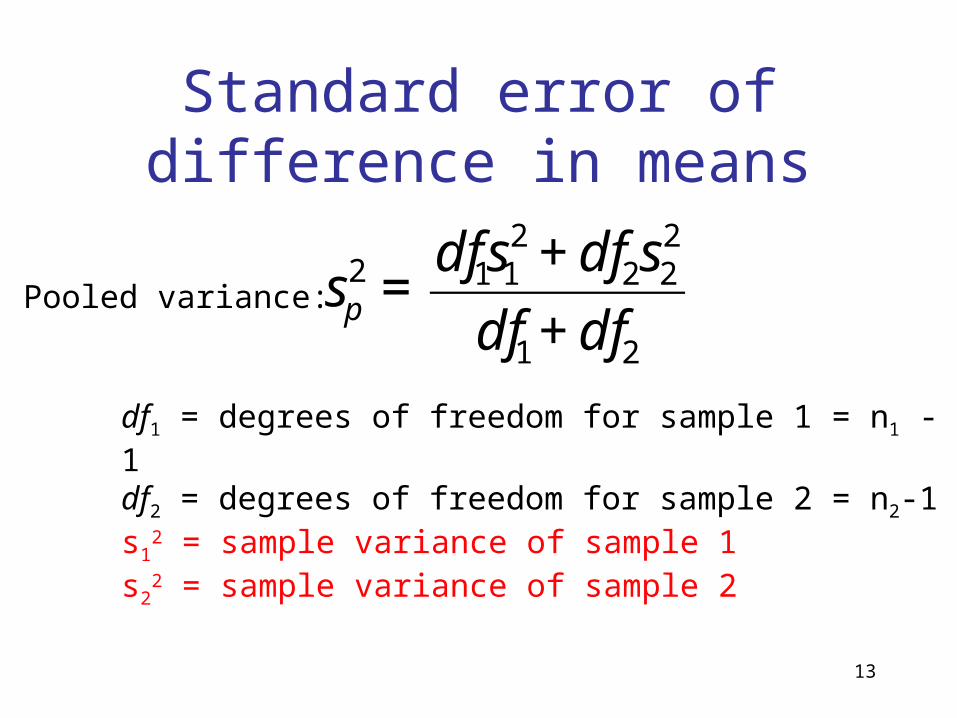
sp2 =
df1s12 + df2s2
2
df1 + df2
Pooled variance:
13
Standard error of difference in means
€
sp2 =
df1s12 + df2s2
2
df1 + df2
df1 = degrees of freedom for sample 1 = n1 -1df2 = degrees of freedom for sample 2 = n2-1s1
2 = sample variance of sample 1s2
2 = sample variance of sample 2
Pooled variance:
14
Estimation: Difference between two
means
€
Y 1 −Y 2
Confidence interval:
€
Y 1 −Y 2( ) ± SEY 1 −Y 2
tα 2( ),df
15
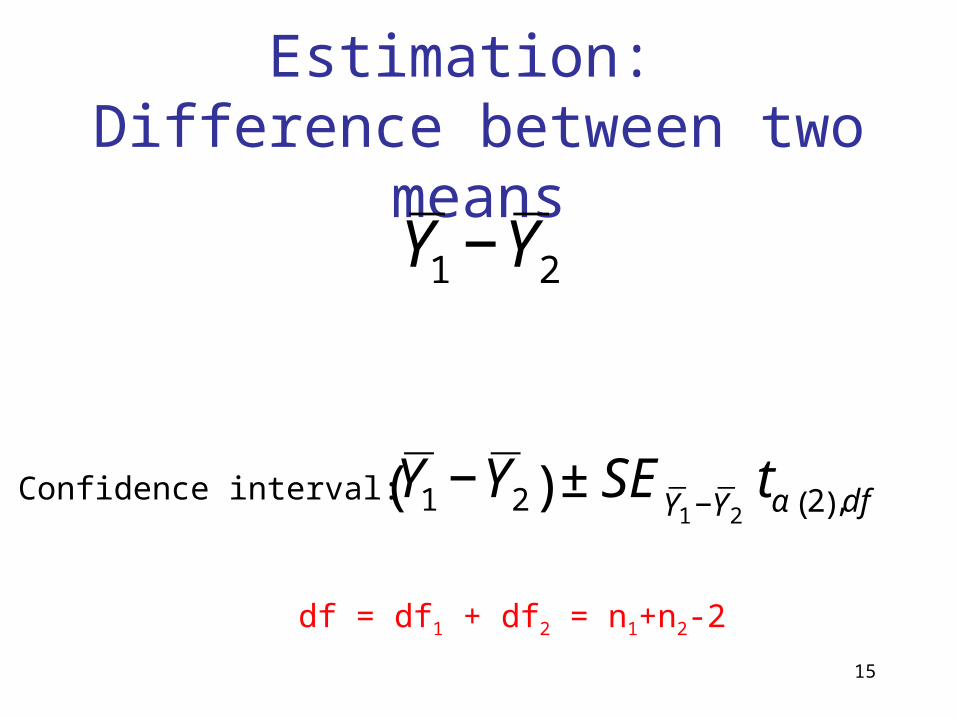
Estimation: Difference between two
means
€
Y 1 −Y 2
Confidence interval:
€
Y 1 −Y 2( ) ± SEY 1 −Y 2
tα 2( ),df
df = df1 + df2 = n1+n2-2
16
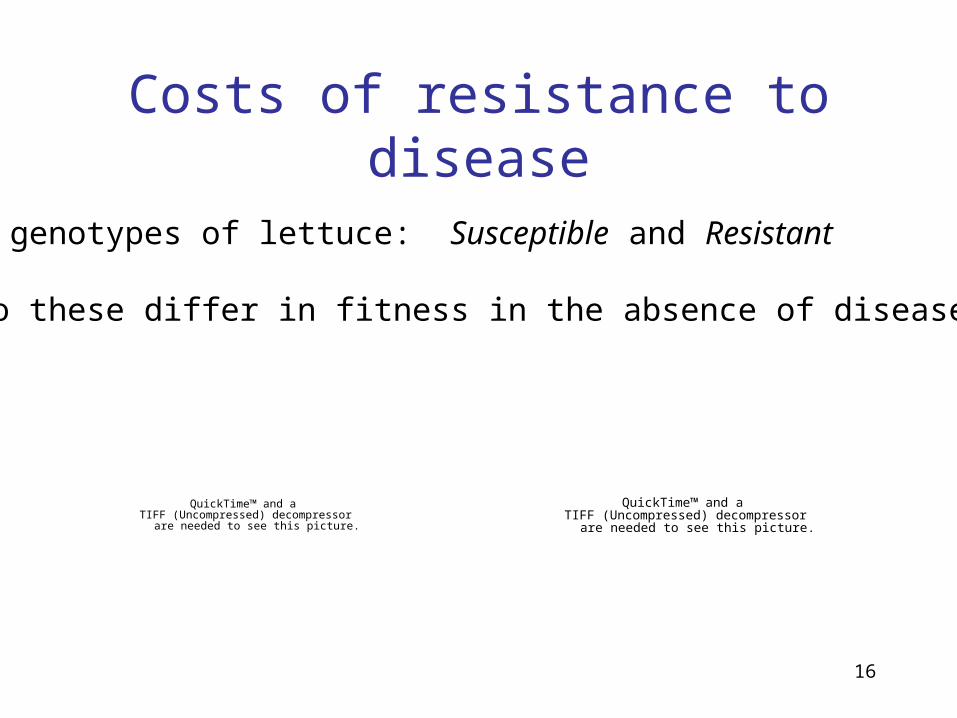
Costs of resistance to disease
2 genotypes of lettuce: Susceptible and Resistant
Do these differ in fitness in the absence of disease?
QuickTime™ and aTIFF (Uncompressed) decompressor
are needed to see this picture.
QuickTime™ and aTIFF (Uncompressed) decompressor
are needed to see this picture.

17
Data, summarizedSusceptible Resistant
Mean numberof buds
720 582
SD of numberof buds
223.6 277.3
Sample size 15 16
Both distributions are approximately normal.
18
Calculating the standard errordf1 =15 -1=14; df2 = 16-1=15
19
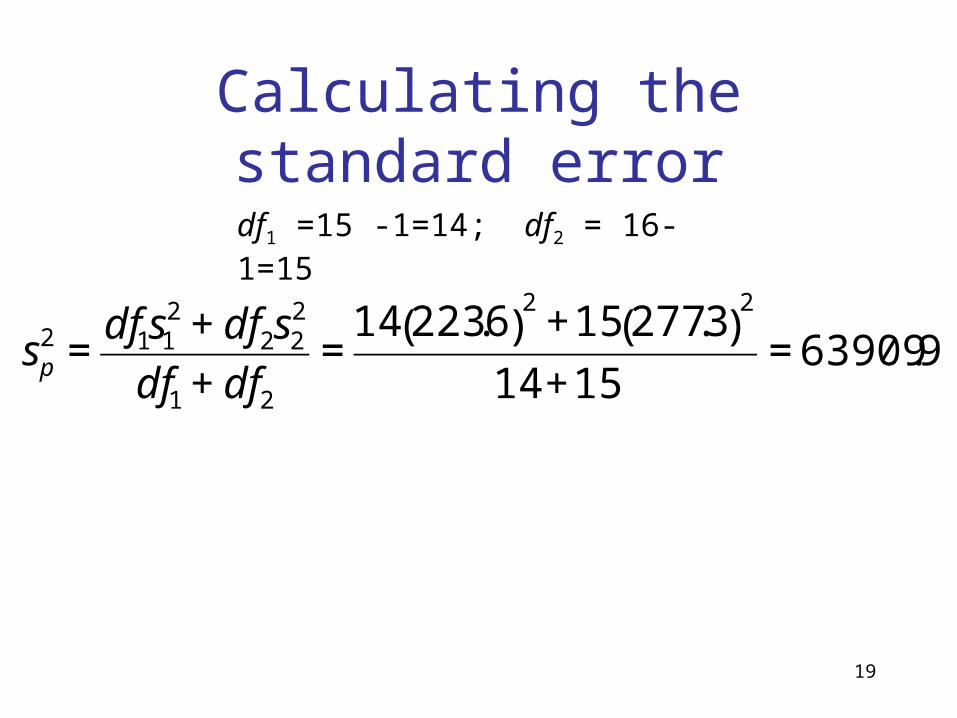
Calculating the standard errordf1 =15 -1=14; df2 = 16-1=15
€
sp2 =
df1s12 + df2s2
2
df1 + df2
=14 223.6( )
2+15 277.3( )
2
14 +15= 63909.9
20
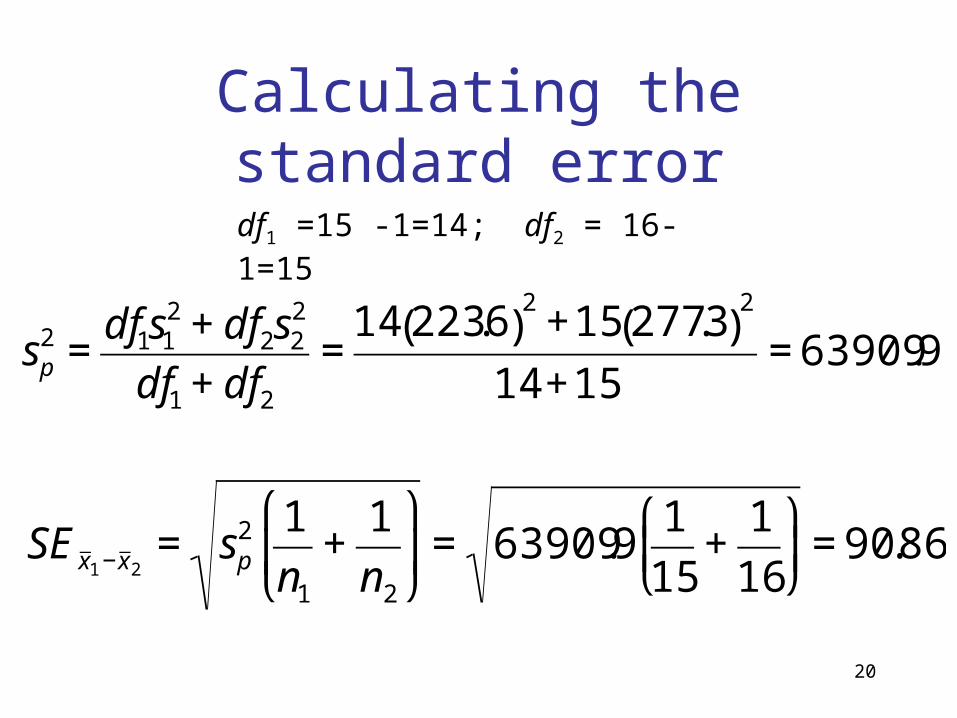
Calculating the standard errordf1 =15 -1=14; df2 = 16-1=15
€
sp2 =
df1s12 + df2s2
2
df1 + df2
=14 223.6( )
2+15 277.3( )
2
14 +15= 63909.9
€
SE x 1 −x 2= sp
2 1
n1
+1
n2
⎛
⎝ ⎜
⎞
⎠ ⎟= 63909.9
1
15+
1
16
⎛
⎝ ⎜
⎞
⎠ ⎟= 90.86

21
Finding t
df = df1 + df2= n1+n2-2
= 15+16-2=29
22
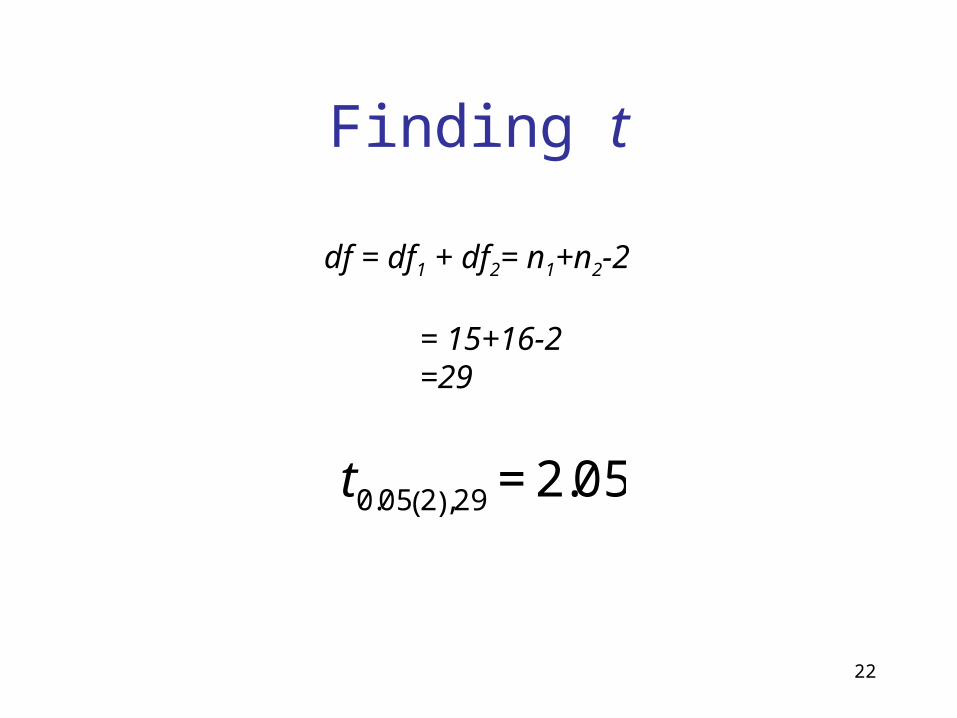
Finding t
df = df1 + df2= n1+n2-2
= 15+16-2=29
€
t0.05 2( ),29 = 2.05
23
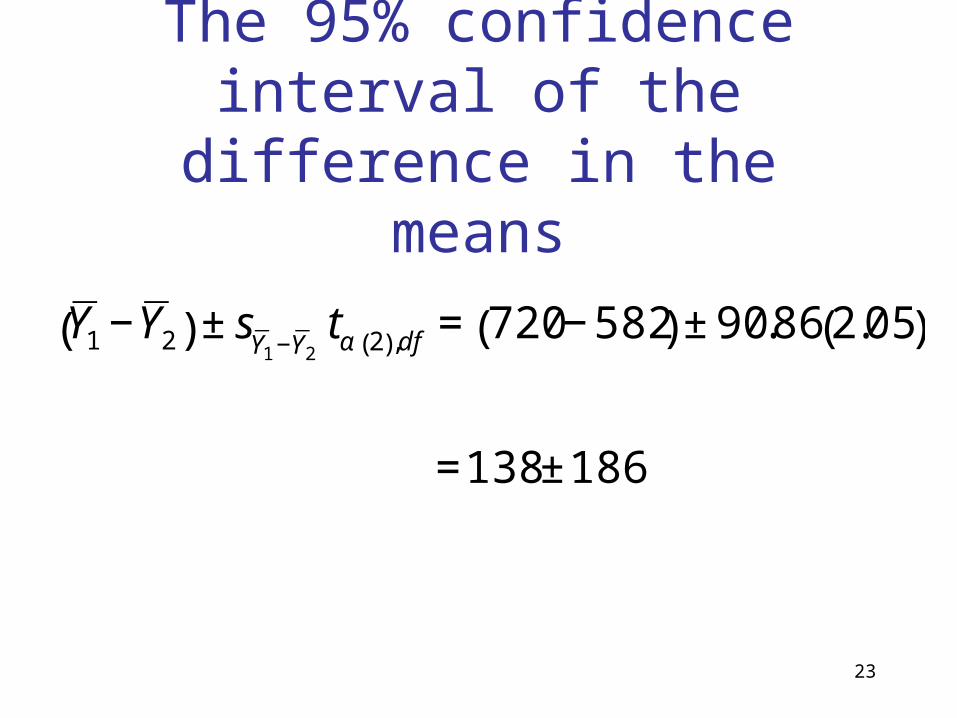
The 95% confidence interval of the
difference in the means
€
Y 1 −Y 2( ) ± sY 1 −Y 2
tα 2( ),df = 720 − 582( ) ± 90.86 2.05( )
=138 ±186
24
Testing hypotheses about the difference
in two means
2-sample t-test
The two sample t-test compares the means of a numerical
variable between two populations.
25
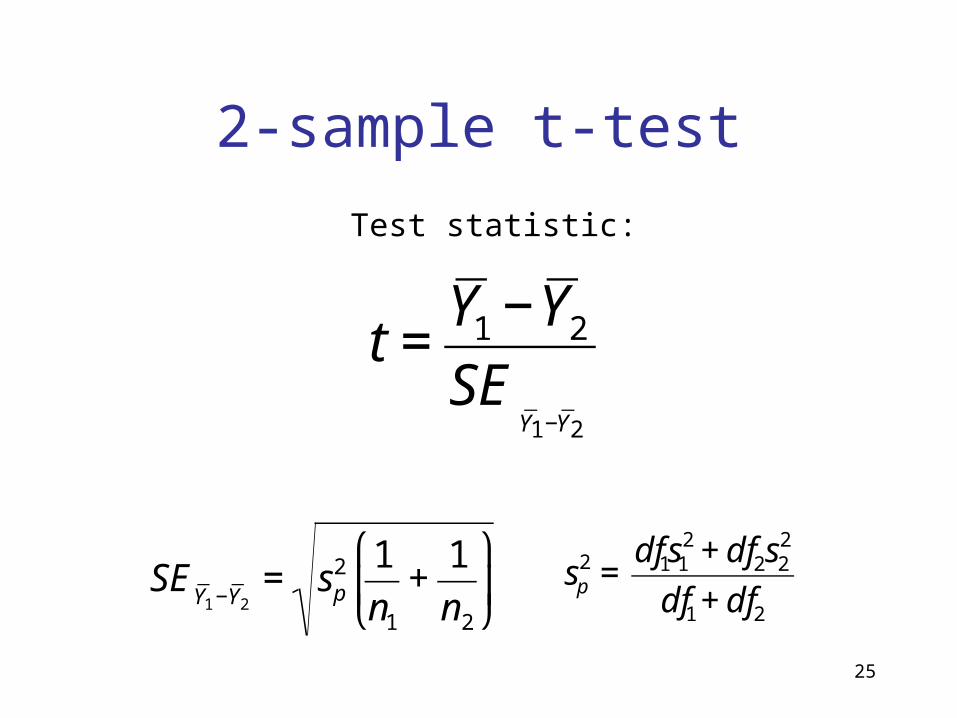
2-sample t-test
€
t =Y 1 −Y 2SE
Y 1−Y 2
Test statistic:
€
SEY 1 −Y 2
= sp2 1
n1
+1
n2
⎛
⎝ ⎜
⎞
⎠ ⎟
€
sp2 =
df1s12 + df2s2
2
df1 + df2

26
Hypotheses
H0: There is no difference between the number ofbuds in the susceptible and resistant plants.
(1 = 2)
HA: Th eresistant an dth esusceptib leplants differ inthei r mean numb ero f buds. (1 ≠ 2)
27
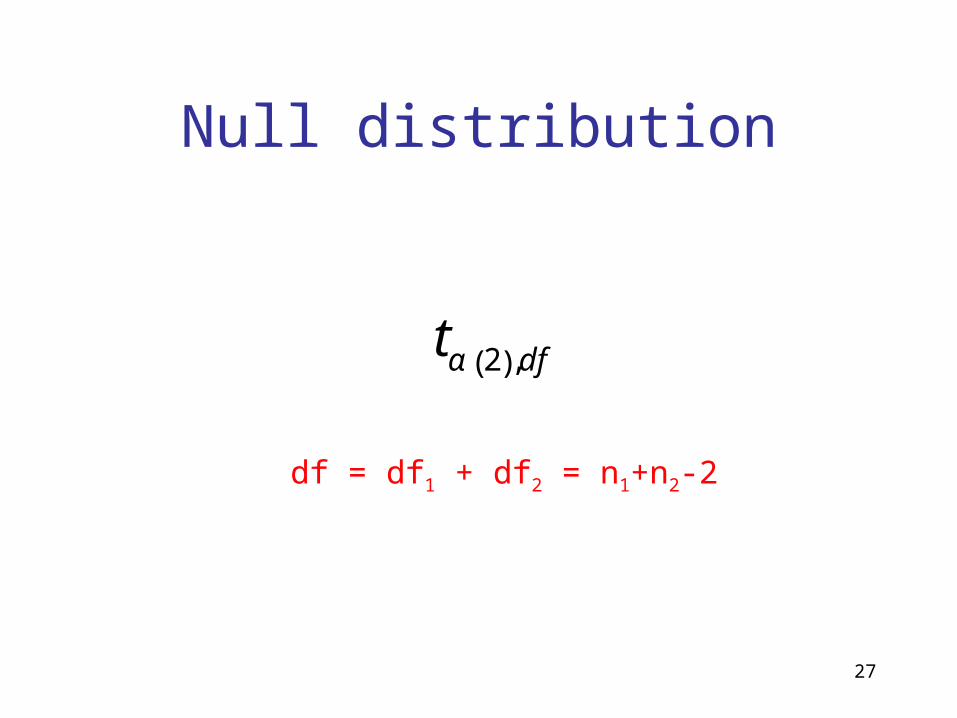
Null distribution
€
tα 2( ),df
df = df1 + df2 = n1+n2-2
28
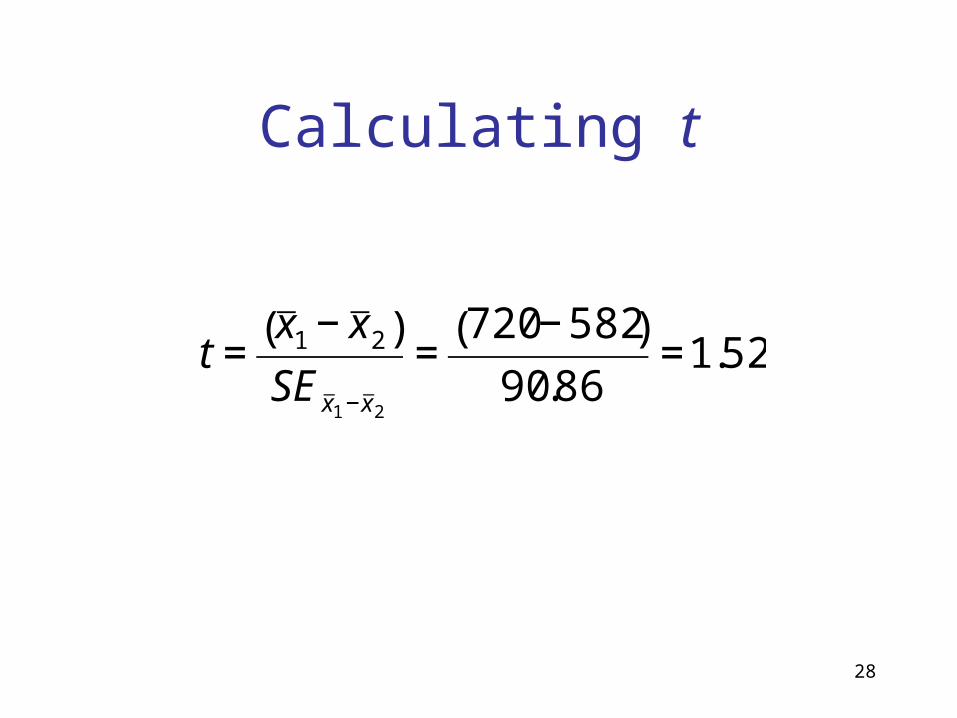
Calculating t
€
t =x 1 − x 2( )SEx 1 −x 2
=720 − 582( )
90.86=1.52

29
Drawing conclusions...
t0.05(2),29=2.05
t <2.05, so we cannot reject the null hypothesis.
These data are not sufficient to say that there is a cost of resistance.
Critical value:
30
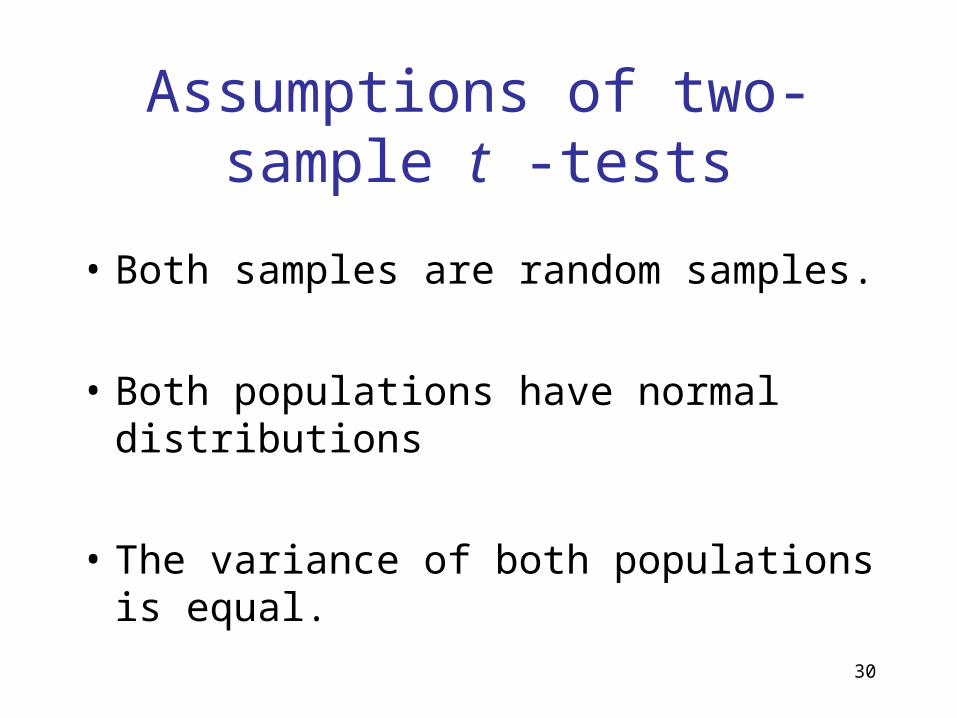
Assumptions of two-sample t -tests
• Both samples are random samples.
• Both populations have normal distributions
• The variance of both populations is equal.
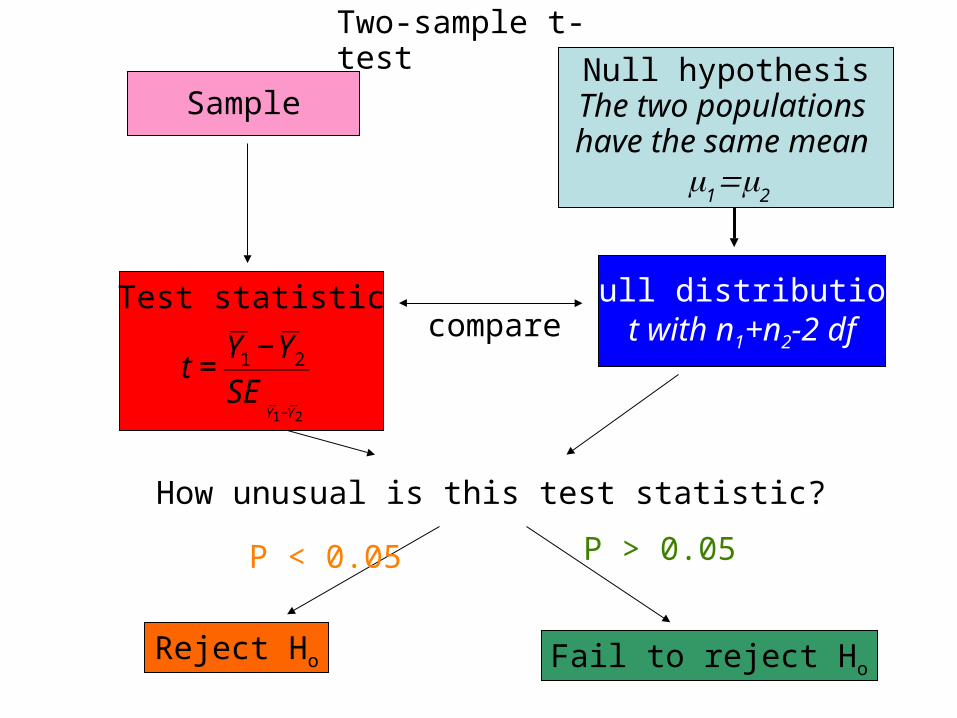
SampleNull hypothesis
The two populations have the same mean
1
2
Two-sample t-test
Test statistic Null distributiont with n1+n2-2 dfcompare
How unusual is this test statistic?
P < 0.05 P > 0.05
Reject Ho Fail to reject Ho
€
t =Y 1 −Y 2SE
Y 1−Y 2

Quick reference summary:
Two-sample t-test• What is it for? Tests whether two groups have the same mean
• What does it assume? Both samples are random samples. The numerical variable is normally distributed within both populations. The variance of the distribution is the same in the two populations
• Test statistic: t
• Distribution under Ho: t-distribution with n1+n2-2 degrees of freedom.
• Formulae:
€
t =Y 1 −Y 2SE
Y 1−Y 2
€
SEY 1 −Y 2
= sp2 1
n1
+1
n2
⎛
⎝ ⎜
⎞
⎠ ⎟
€
sp2 =
df1s12 + df2s2
2
df1 + df2

33
Comparing means when variances are not
equal
Welch’s t test
34
Burrowing owls and dung traps
QuickTime™ and aTIFF (LZW) decompressor
are needed to see this picture.

35
Dung beetles
36
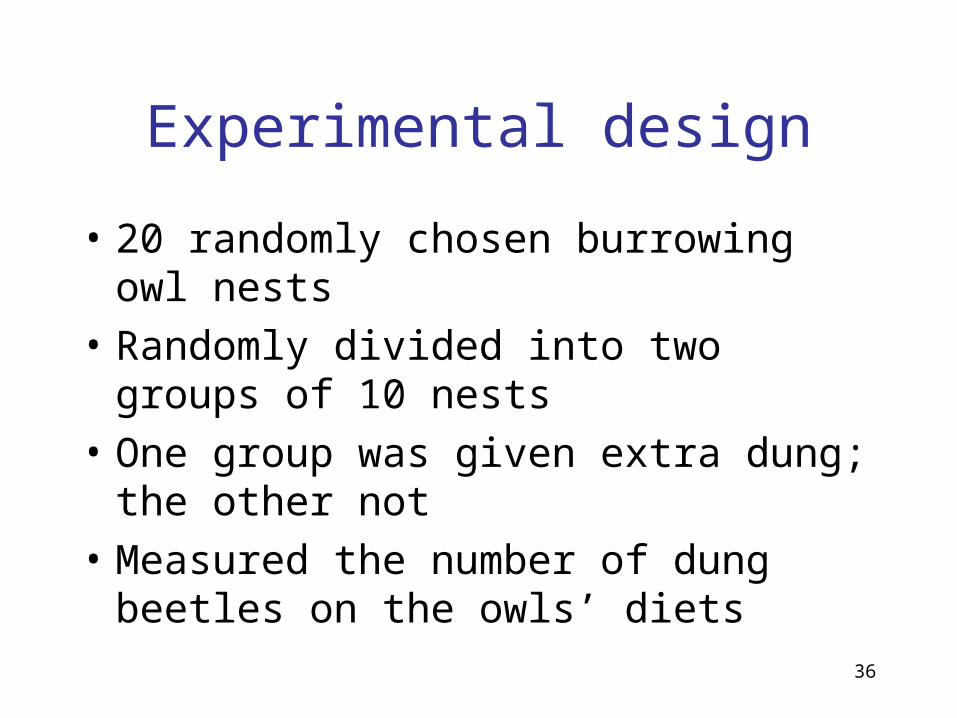
Experimental design
• 20 randomly chosen burrowing owl nests
• Randomly divided into two groups of 10 nests
• One group was given extra dung; the other not
• Measured the number of dung beetles on the owls’ diets
37
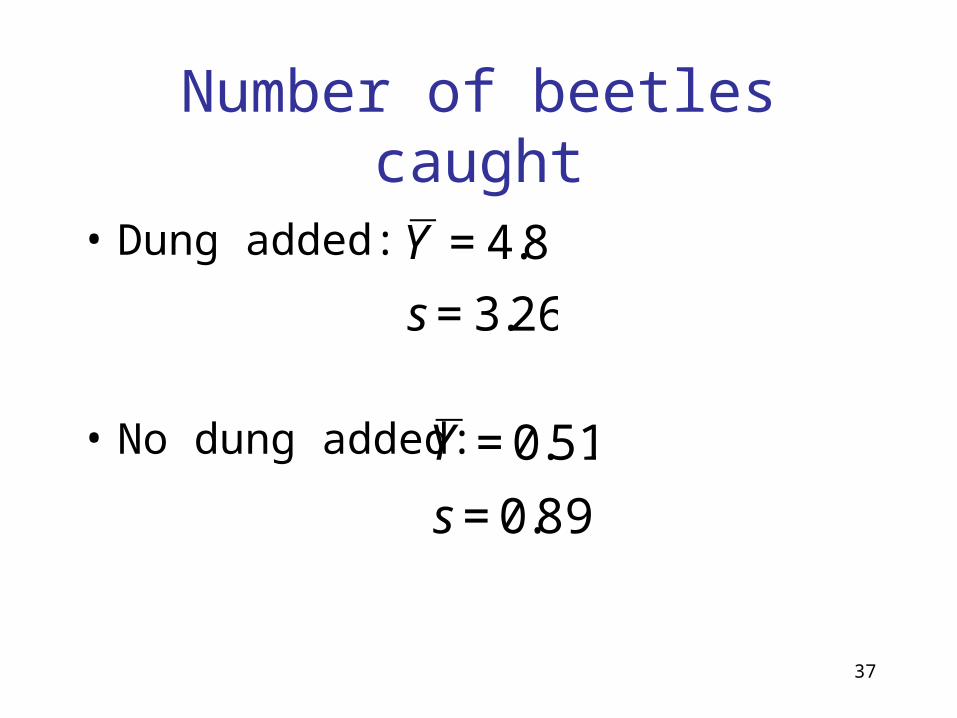
Number of beetles caught
• Dung added:
• No dung added:
€
Y = 4.8
s = 3.26
€
Y = 0.51
s = 0.89

38
Hypotheses
H0: Owls catch the same number of dung beetles with or without extra dung (1 = 2)
HA: Owls do not catch the same number of dung beetles with or without extra dung (1 2)
39
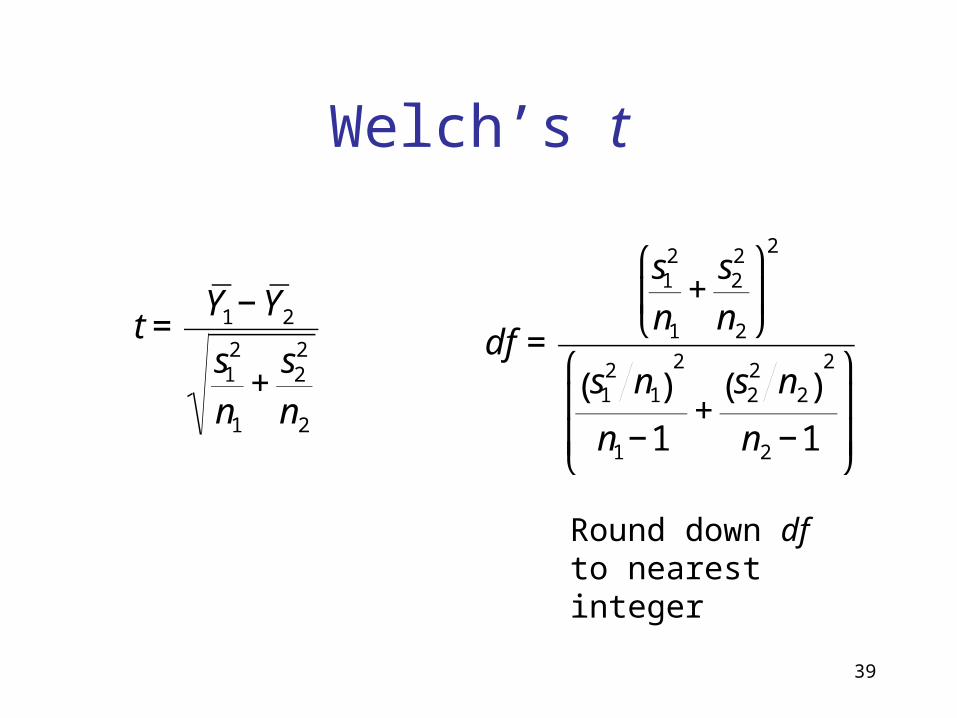
Welch’s t
€
t =Y 1 − Y 2s1
2
n1
+s2
2
n2
€
df =
s12
n1
+s2
2
n2
⎛
⎝ ⎜
⎞
⎠ ⎟
2
s12 n1( )
2
n1 −1+
s22 n2( )
2
n2 −1
⎛
⎝
⎜ ⎜
⎞
⎠
⎟ ⎟
Round down df to nearest integer
40
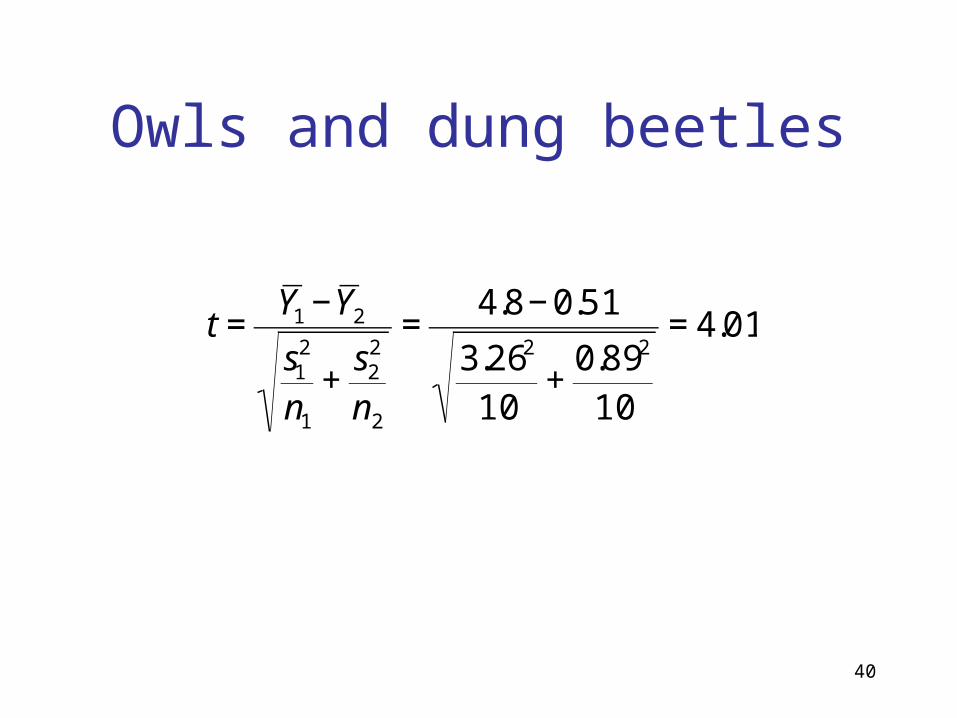
Owls and dung beetles
€
t =Y 1 −Y 2s1
2
n1
+s2
2
n2
=4.8 − 0.51
3.262
10+
0.892
10
= 4.01

41
Degrees of freedom
€
df =
s12
n1
+s2
2
n2
⎛
⎝ ⎜
⎞
⎠ ⎟
2
s12 n1( )
2
n1 −1+
s22 n2( )
2
n2 −1
⎛
⎝
⎜ ⎜
⎞
⎠
⎟ ⎟
=
3.262
10+
0.892
10
⎛
⎝ ⎜
⎞
⎠ ⎟
2
3.262 10( )2
10 −1+
0.892 10( )2
10 −1
⎛
⎝
⎜ ⎜
⎞
⎠
⎟ ⎟
=10.33
Which we round down to df= 10
42
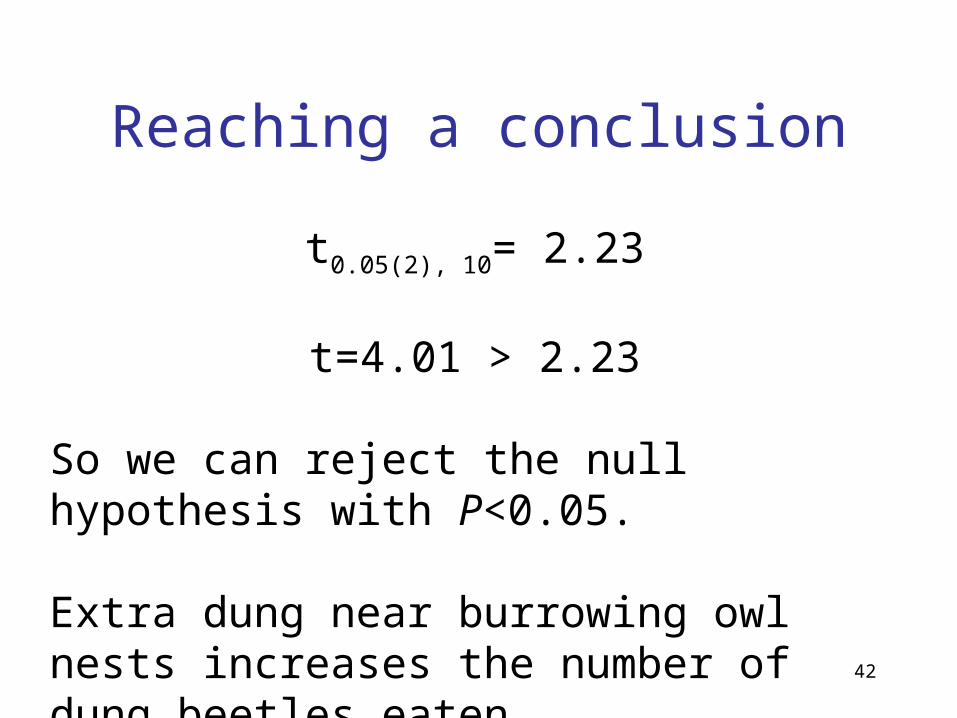
Reaching a conclusion
t0.05(2), 10= 2.23
t=4.01 > 2.23
So we can reject the null hypothesis with P<0.05.
Extra dung near burrowing owl nests increases the number of dung beetles eaten.

Quick reference summary:
Welch’s approximate t-test• What is it for? Testing the difference
between means of two groups when the standard deviations are unequal
• What does it assume? Both samples are random samples. The numerical variable is normally distributed within both populations
• Test statistic: t
• Distribution under Ho: t-distribution with adjusted degrees of freedom
• Formulae:
€
t =Y 1 − Y 2s1
2
n1
+s2
2
n2
€
df =
s12
n1
+s2
2
n2
⎛
⎝ ⎜
⎞
⎠ ⎟
2
s12 n1( )
2
n1 −1+
s22 n2( )
2
n2 −1
⎛
⎝
⎜ ⎜
⎞
⎠
⎟ ⎟
44
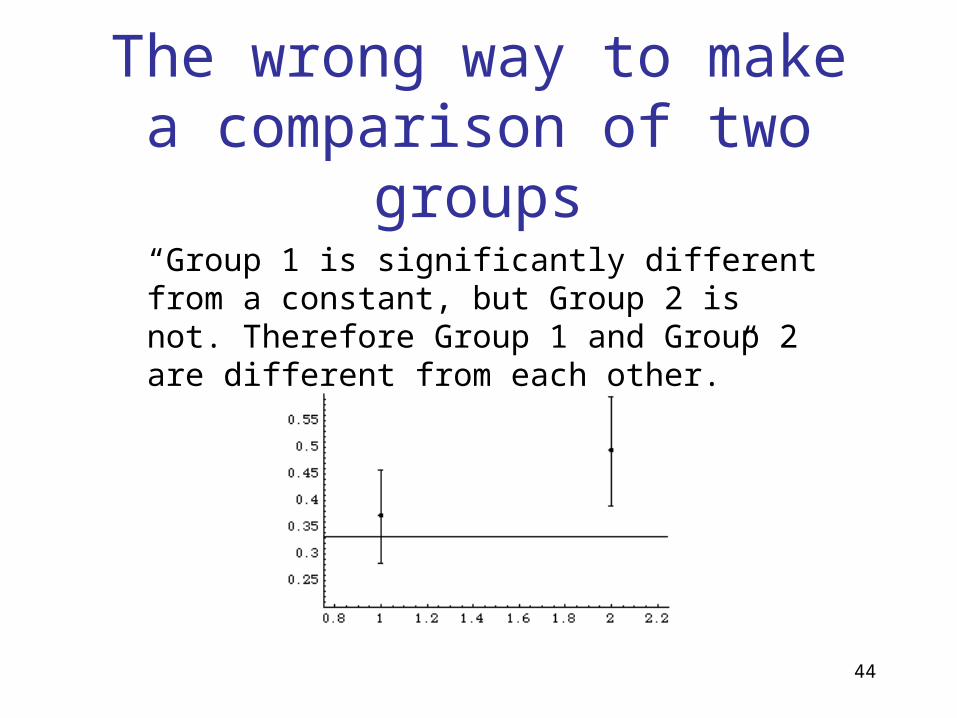
The wrong way to make a comparison of two
groups“Group 1 is significantly different from a constant, but Group 2 is not. Therefore Group 1 and Group 2 are different from each other.”
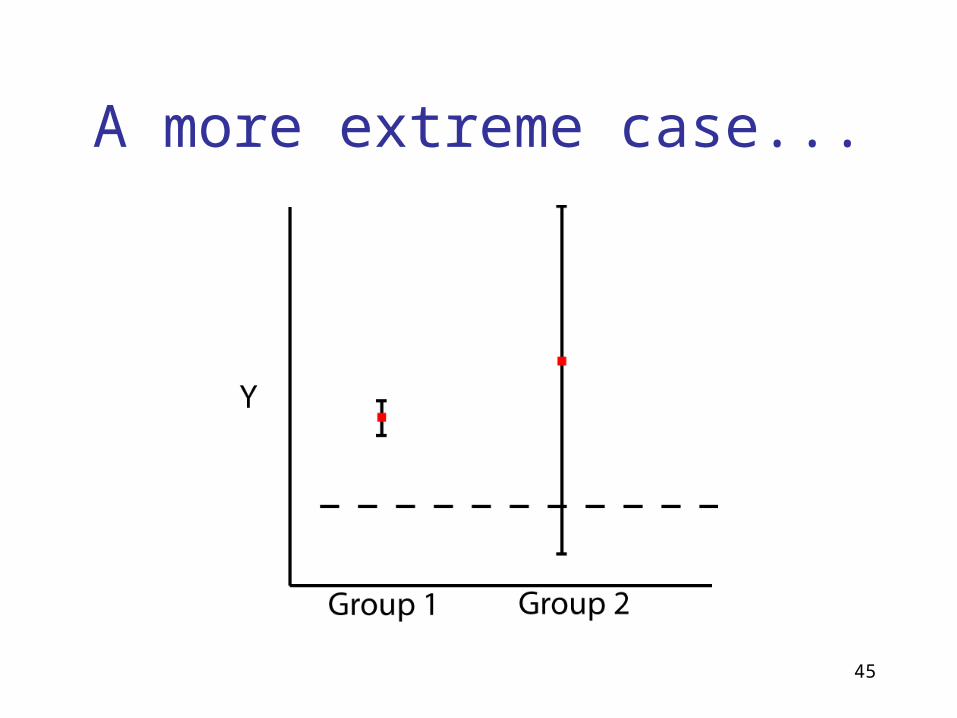
45
A more extreme case...
Related Documents