Testing High Power GaN Amplifiers for Radar Signals using Peak Power Meters Walt Strickler, VP GM Boonton Application Note Abstract Gallium nitride (GaN) technology has become a staple for high power amplifiers (PAs) used in radar applications. Moreover, the high power and/or the radar application often require the signals to be pulsed. Measuring and characterizing pulsed RF signals used in radar applications present unique challenges. Pulsed radar signals are “on” for a short time followed by a long “off” period. During “on” time, the system transmits anywhere from kilowatts to megawatts of power. The high-power pulsing can stress the power amplifier (PA) in a number of ways both during the “on/off” transitions and during prolonged “on” periods. As higher demands are being placed on these PAs in areas such as output power level, linearity, and efficiency, the behavior of the amplifier needs to be thoroughly tested and evaluated. The time domain nature of the pulsed RF signal necessitates time domain signal analysis. This article explains why a peak power meter is the ideal test instrument for characterizing the behavior of GaN power amplifiers used in radar systems.

Welcome message from author
This document is posted to help you gain knowledge. Please leave a comment to let me know what you think about it! Share it to your friends and learn new things together.
Transcript

Testing High Power GaN Amplifiers for Radar Signals using
Peak Power Meters Walt Strickler, VP GM Boonton
Application Note
AbstractGallium nitride (GaN) technology has become a staple for high power amplifiers (PAs) used in radar applications. Moreover, the high power and/or the radar application often require the signals to be pulsed. Measuring and characterizing pulsed RF signals used in radar applications present unique challenges. Pulsed radar signals are “on” for a short time followed by a long “off” period. During “on” time, the system transmits anywhere from kilowatts to megawatts of power. The high-power pulsing can stress the power amplifier (PA) in a number of ways both during the “on/off” transitions and during prolonged “on” periods. As higher demands are being placed on these PAs in areas such as output power level, linearity, and efficiency, the behavior of the amplifier needs to be thoroughly tested and evaluated. The time domain nature of the pulsed RF signal necessitates time domain signal analysis. This article explains why a peak power meter is the ideal test instrument for characterizing the behavior of GaN power amplifiers used in radar systems.

Application Note Testing High Power GaN Amplifiers for Radar Signals using Peak Power Meters 2
domain nature of the pulsed RF signal, the best way to observe the performance of the amplifier is through time domain signal analysis. This article explains why the peak power meter is a must have test instrument for characterizing the behavior of pulsed RF power amplifiers (PAs) used in radar systems.
Peak Power Meter for Pulsed Radar Measurements
The most critical analysis of the pulsed RF signal takes place in the time domain. Since peak power meters measure, analyze and dis- play the power envelope of a RF signal in the time domain, they are an essential tool for measuring, analyzing and characterizing anomalies and behavior of high power amplifiers used in pulsed radar applications. Figure 1 shows a simplified block diagram of a benchtop peak power meter.
The front end of a power meter is the RF envelope detector housed in a power sensor. The detector removes the RF carrier and generates an analog waveform representing the envelope of the RF input signal. The most critical specification of the detector is its response time to a pulsed RF signal or its risetime. If the detector does not have the bandwidth to track the envelope of the signal, accuracy of all measurements including peak, pulse and average power is compromised (Figure 2).
GaN Radar Power Amplifier Technology Overview
For many years, radar systems employed vacuum electron devices (VEDs), commonly referred to as tubes, for high power applications. Most commonly used VED technologies in radar applications today are Traveling Wave Tubes (TWT), Klystrons, Magnetrons and Gyro-trons. TWT amplifiers (TWTAs) provide multi-octave bandwidths, multi-kilowatt peak power output, support of high frequencies, as well as ruggedness. However, TWTAs are relatively costly, large vacuum tube structures that require significant size and mass. VEDs and their associated high-voltage power supplies often suffer from short lifetimes, varying from as few as several hundred hours to ten thousand hours for relatively benign environments. To address these shortcomings, engineers have researched alternatives.
About three decades ago semiconductor-based PA solutions called solid state power amplifiers (SSPA) started making modest inroads as an alternative technology for certain radar applications. Silicon-based laterally diffused metal oxide (LDMOS) offered a few hundred watts of output power, ruggedness and reliability. Its upper frequency limit of about 3 GHz (S-Band) at high output powers curbed its applicability in radar. Gallium arsenide (GaAs), a wide-bandgap semiconductor, overcame the high frequency deficiency of LDMOS, reaching above 100 GHz, yet its lower operating voltage limits its output power capability. High power GaAs amplifiers often require paralleling of multiple devices to reach desired power levels at the expense of loss in efficiency. GaAs found common use in radar but still was not a viable alternative in most high-power radar applications.
Over the last 20 years, gallium nitride (GaN) has gained popularity for use in SSPAs. GaN offers significantly higher power density, greater efficiency, and higher electron mobility (enabling it to be used at higher frequencies) relative to GaAs devices. Initially, these advantages came at the expense of lower reliability and higher cost. The lower reliability was primarily due to lack of a suitable substrate to remove heat from high power applications out of the die. This is now being addressed by placing GaN on a silicon- carbide (SiC) wafer substrate. SiC provides three times better thermal conductivity. The enhanced thermal performance improved the reliability and ruggedness. Through advances in manufacturing processes as well as increased volume, the cost of GaN high power amplifiers has decreased significantly.
Today gallium nitride (GaN) transistors are widely used in many commercial and defense applications. Many consider it the technology of choice for high-power applications in electronic warfare (EW), radar, satellites, cable TV, and mobile communica-tions. Because of the higher powers involved, many radar signals are pulsed. Measuring and characterizing pulsed RF signals used in radar applications present unique challenges. Given the time
Figure 1. Peak Power Meter Block Diagram
Detector with Insu�cient Bandwidth Wide Bandwidth DetectorVo
lts
Volts
Time Time
Figure 2. Impact of risetime and bandwidth capability of the sensor for accurately
measuring and displaying the pulse RF signal.
Detector with Insu�cient Bandwidth Wide Bandwidth Detector
Volts
Volts
Time Time
Application Note Testing High Power GaN Amplifiers for Radar Signals using Peak Power Meters 3
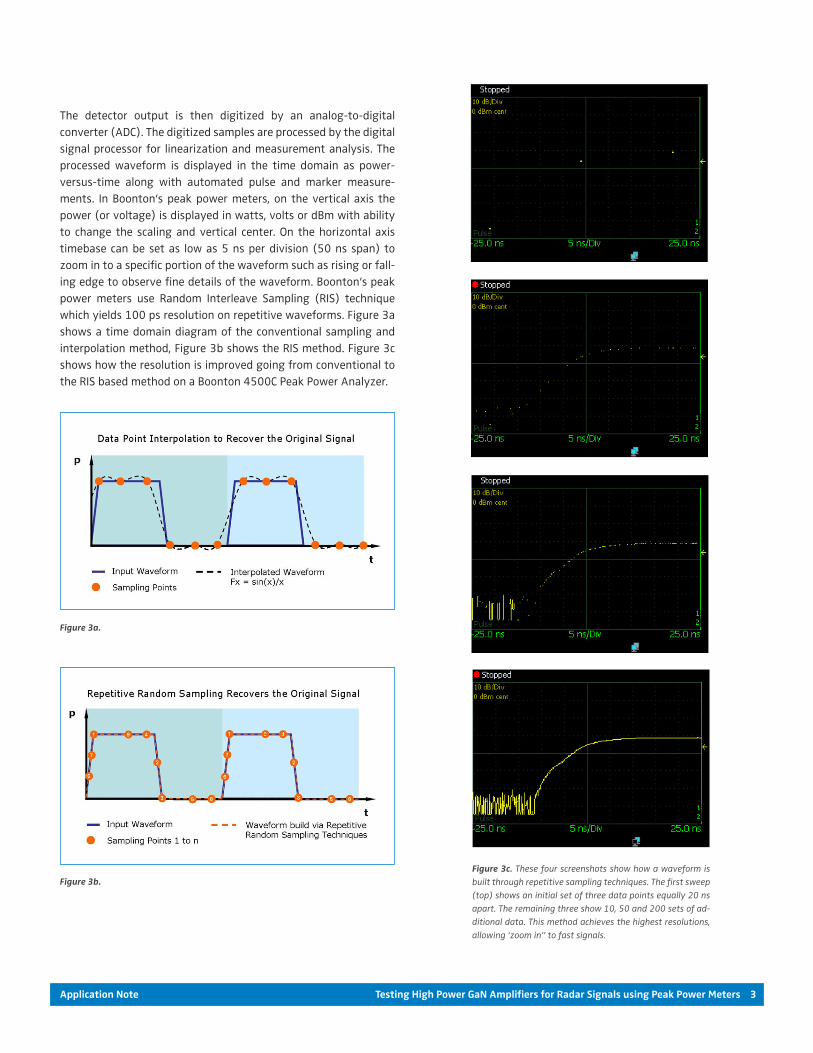
The detector output is then digitized by an analog-to-digital converter (ADC). The digitized samples are processed by the digital signal processor for linearization and measurement analysis. The processed waveform is displayed in the time domain as power- versus-time along with automated pulse and marker measure-ments. In Boonton’s peak power meters, on the vertical axis the power (or voltage) is displayed in watts, volts or dBm with ability to change the scaling and vertical center. On the horizontal axis timebase can be set as low as 5 ns per division (50 ns span) to zoom in to a specific portion of the waveform such as rising or fall-ing edge to observe fine details of the waveform. Boonton’s peak power meters use Random Interleave Sampling (RIS) technique which yields 100 ps resolution on repetitive waveforms. Figure 3a shows a time domain diagram of the conventional sampling and interpolation method, Figure 3b shows the RIS method. Figure 3c shows how the resolution is improved going from conventional to the RIS based method on a Boonton 4500C Peak Power Analyzer.
Figure 3a.
Figure 3b.Figure 3c. These four screenshots show how a waveform is built through repetitive sampling techniques. The first sweep (top) shows an initial set of three data points equally 20 ns apart. The remaining three show 10, 50 and 200 sets of ad-ditional data. This method achieves the highest resolutions, allowing ‘zoom in” to fast signals.

Application Note Testing High Power GaN Amplifiers for Radar Signals using Peak Power Meters 4
Peak power meters can be triggered by the incoming RF signal or by an external gating (baseband) trigger signal applied to auxil-iary inputs. Real-Time Power Processing™ featured in the RTP5000 Series Real-Time Peak Power Sensors allow the sensor to trigger on 100,000 pulses per second, capturing each pulse and glitch events. Advanced triggering features of Boonton peak power meters, like trigger holdoff, delays the re-arming of the trigger which is useful when working with interrogation friend or foe (IFF) radar signals.
In terms of measurement capabilities, peak power meters perform numerous manual, automated marker and automated pulse measurements. Automated pulse measurements (Figure 4) provide measurement values of a number of critical parameters that help characterize the performance of the power ampli-fier and the radar system. Rise and fall time indicate the ampli-fier’s ability to output a pulsed RF signal. Overshoot pinpoints potential ringing problems. Droop shows the amplifier’s power supply limitations with prolonged pulse widths. Pulse Width, period, pulse repetition rate and duty cycle measurements provide other time domain characteristics of the signal. There are also a number of automated marker measurements (Figure 4 on the right) that enable time gated measurements. These measure-ments are performed between two markers and provide average, peak, min and max power readings, as well as peak to average ratio, delta marker of power level and delta time marker measurements.
A significant advantage power meters have over other measure-ment instruments is the size of the power sensor. It is small and light enough to be directly connected to the measurement port without the need for a RF cable which can degrade measurement accuracy due to impedance mismatch and cable loss, especially at higher frequencies.
For automated test environments all Boonton peak power meters can be remotely accessed via various interfaces such as USB, LAN (TCP/IP), RS232 and GPIB, depending on the model.
More reading materials on the topic of power measurements are provided at the end of this article with links to articles and appli-cation notes as well as Boonton’s RF Power Measurement Guide that provides practical insights to making measurements for radar signals.
Test Set-ups for Making Pulsed Radar Measurements
Although there are numerous pulsed RF amplifier architectures, two types are considered in this article. The first is a modulating amplifier; the input is CW and the output is pulsed RF where a gating signal modulates the incoming signal to achieve the desired pulse RF signal (Figure 6).
In Figure 6 a dual channel meter measures the input signal power at P1 and the reflected power at P2 in time domain for return loss calculation, as well as monitoring anomalies of the reflected signal. At P3 the output of the amplifier is monitored and measured. Key amplifier parameters that were mentioned in the previous section are measured at P3 and P4 monitors the reflected
Figure 4. Automated Pulse & Marker Measurements using RTP5000 Series Real-Time Peak Power Sensors
Figure 5. Some of the pulse characteristics that can be measured using a peak power meter.

Application Note Testing High Power GaN Amplifiers for Radar Signals using Peak Power Meters 5
power of the load. The gating signal that modulates the RF input signal can also trigger the power meter enabling delay and latency measurements. Boonton’s highest performance benchtop peak power analyzer, model 4500C, is equipped with waveform math capabilities and is capable of displaying gain and return loss in time domain. The instrument is also equipped with two scope channels. When the gating signal to the amplifier triggers the peak power meter, both the gating signal and the output of the amplifier can be displayed on the peak power meter enabling critical timing measurements, as well as detecting if any amplifier anomalies are caused by the gating signal.
While benchtop models support one (single) or two (dual) channels, the RTP5000 Series Real-Time Peak Power Sensors can measure and display up to eight channels on a single GUI window. Using three or four USB sensors, amplifier input and output power, reflected input power and reflected load power can all be measured and displayed on the same trace window or in an automated test set-up via remote programming (up to 16 or 32 channels).
The second type is a gain only amplifier where the output is an amplified (and often distorted) version of the pulsed RF input signal (Figure 7) with no gating signal supplied to the amplifier. The set-up is ideal for analyzing not only fully assembled amplifiers but also a subassembly such as the driver stage or the final stage of the amplifier or even a semiconductor power transistor like GaN. The set-up uses three peak power meters and a directional cou-pler to make scalar like gain and return loss measurements of the amplifier.
When evaluating new technologies like GaN, monitoring power droop across the pulse width is critical as it can be an indicator of the limitations of the thermal properties of the GaN device and its package. Time domain peak power measurements can be taken at the output of the amplifier (Figure 9).
Since the power rating of a typical sensor is about +20 dBm, the output of the PA is attenuated to protect the power sensor while making the output power measurement. Before measurements can be taken, a thorough calibration procedure is required at the frequencies in which the amplifier is going to be tested to account for losses in the signal path. The losses that need to be calibrated out in the test set-up of Figure 7 and calculations required to com-pute gain and return loss are provided below.
L1: Loss from Signal Generator output to the FWD port of the directional coupler.
L2: Loss from Signal Generator output to the power amplifier input. L3: Loss from amplifier output to the 40 dB attenuator output.
L4: Loss from amplifier input into the REV port of the directional coupler.
Once the losses are measured, input, output and reflected power measurements can be made:
P1: Power reading at FWD port of the directional coupler. P2: Power measured at the 40 dB attenuator output.
P3: Power measured at REV port of the directional coupler. P A input power = P1+L1-L2
PA output power = P2+L3
PA input reflected power = P3+L4
All Boonton peak power meters are capable of adding an offset to the measurements, so the math above can be done by the meter once the losses are measured and entered to each channel as an offset.
PULSEGENERATOR
TWT AMPDUT
LOAD
PEAKPOWERSENSOR
RF OUT
DUTRF IN
DIRECTIONALCOUPLER
PULSE GATE
gated pulse
PEAKPOWERSENSOR
C1
C2
C1
C2
Figure 6. Test set-up for time domain pulse measure-ments. The input signal is CW and the output signal is pulsed RF. A gating signal modulates the incoming CW signal.
Application Note Testing High Power GaN Amplifiers for Radar Signals using Peak Power Meters 6
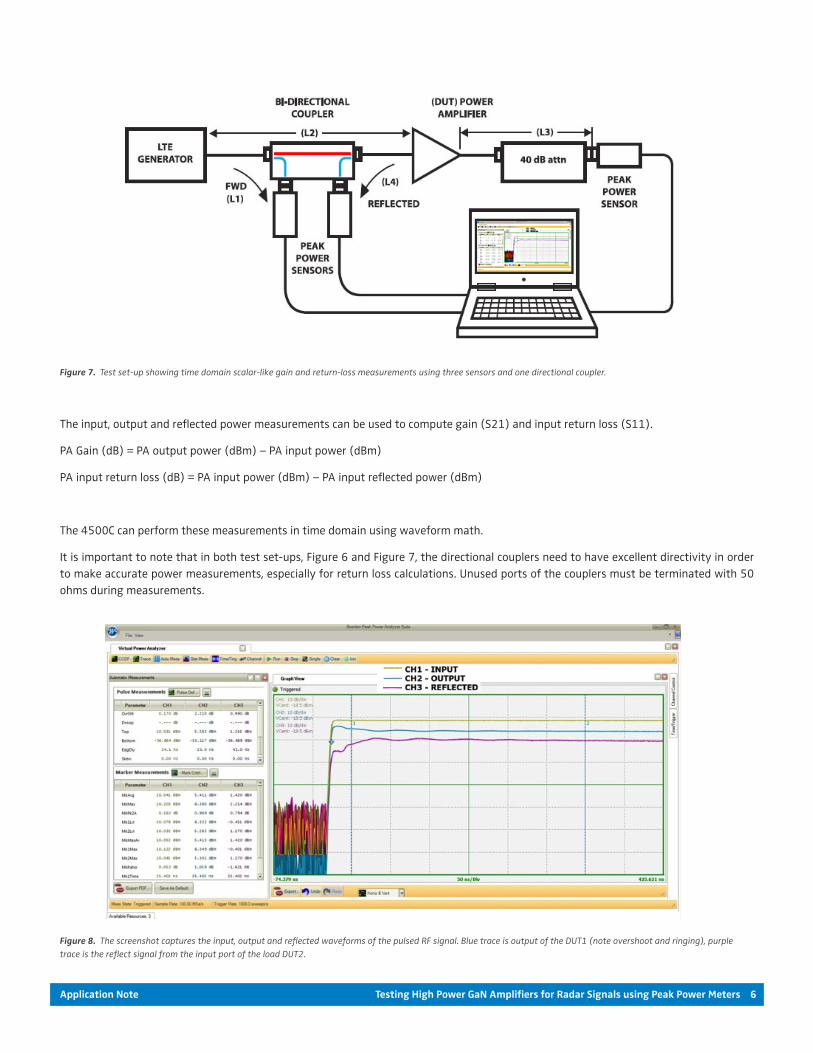
The input, output and reflected power measurements can be used to compute gain (S21) and input return loss (S11).
PA Gain (dB) = PA output power (dBm) – PA input power (dBm)
PA input return loss (dB) = PA input power (dBm) – PA input reflected power (dBm)
The 4500C can perform these measurements in time domain using waveform math.
It is important to note that in both test set-ups, Figure 6 and Figure 7, the directional couplers need to have excellent directivity in order to make accurate power measurements, especially for return loss calculations. Unused ports of the couplers must be terminated with 50 ohms during measurements.
Figure 7. Test set-up showing time domain scalar-like gain and return-loss measurements using three sensors and one directional coupler.
Figure 8. The screenshot captures the input, output and reflected waveforms of the pulsed RF signal. Blue trace is output of the DUT1 (note overshoot and ringing), purple trace is the reflect signal from the input port of the load DUT2.

Application Note Testing High Power GaN Amplifiers for Radar Signals using Peak Power Meters 7
Measurements
Figure 8 shows three waveforms measured using the test set-up in Figure 7 using the RTP5000 Series Real-Time Peak Power Sensors. The input waveform is displayed on CH1, reflected waveform on CH3 and the output on CH2. Note that automated measurements performed on all three channels are displayed to the left of the trace display window. The measurements can be transferred to a spreadsheet to perform the necessary gain and return loss calcula-tions, as well as other parameters of interest. In an automated test environment, the same measurements can be accessed through remote programming to perform gain and return loss computa-tions as well. Droop measurement capabilities are shown in Figure 9 using the Boonton RTP5318 Real-Time Peak Power Sensor. Power droop can be measured either using the automated pulse mea-surements or using automated marker measurements as well as horizontal markers. The automated marker measurements can display the droop placing markers at the desired points on the waveform and using MkRatio. Alternatively, reference lines can be placed on the vertical axis at the desired high and low points of the pulse to measure the droop. Automated Pulse measurements are computed automatically based on pulse definition irrespective of marker or reference line placements.
Conclusion
VED based amplifiers have dominated the PAs used in the aviation and warfare radar systems for the past seven decades. However, new semiconductor based SSPAs, have made inroads to various radar applications, especially GaN based ones. Regardless of technology used in the radar PA, high resolution highly accurate time domain power measurements are critical to understand the amplifier performance and behavior. Peak power meters are an essential measurement tool for time domain power analysis to test radar power amplifiers for R&D, quality, manufacturing, field support and system calibration.
Figure 9. Droop Measurement using RTP5318 Real-Time Peak Power Sensors. Blue vertical lines 1 and 2 are markers placed for automated marker measurements. Yellow dashed horizontal lines are reference lines. Automated Pulse measurements are computed automatically based on pulse definition irrespective of marker or reference line placements.

25 Eastmans Road, Parsippany, NJ 07054 | +1 973 386 9696 Wireless Telecom Group | WTGinnovation | WTGinnovation
www.boonton.com | B/APPNOTE/0918/EN Note: Specifications, terms and conditions are subject to change without prior notice.
The 4500C is highest performing benchtop peak power analyzer. It is the instrument of choice for capturing, displaying, analyzing and characterizing RF power in both the time and statistical domains. The 4500C offers best-in-class time resolution, wider measure-ment and trigger ranges, the ability to measure the narrowest pulses at higher pulse repetition frequencies over orders of magnitude longer time periods versus the closest alternative all in a form factor that is half as tall and half the weight.
The 4540 series combines a peak power meter, a CW power meter and a voltage meter, into a single 2U, half-rack instrument. It features a wide measurement range and rise time of less than 7 ns. 200 ps time resolution provides great detail for signal waveform analysis. It is ideal for capturing, displaying and analyzing RF power in time and statistical domains. 4540 meters are used widely by high power amplifier manufacturers in R&D and manufacturing test racks.
The RTP5000 Series Real-Time Peak Power Sensors deliver benchtop performance in an USB form factor. Powered by Real Time Power Processing™, the sensor is able to make 100,000 triggered measurements per second virtually no gaps in signal acquisition and zero measurement latency - making it ideal for capturing high PRI/PRR/PRF radar signals without missing a pulse or glitch events. Industry leading 3 ns risetime is meant to handle the most challenging radar signals. 195 MHz video bandwidth makes it ideal for making time gated power and crest factor measurements for broadband communication signals like 802.11ac WLAN, LTE, LTE-A and 5G.
The solutions above are ideal for design, verification, and troubleshooting of pulsed and noise-like signals used in commercial and military radar, electronic warfare (EW), wireless communications (e.g., LTE, LTE-A, and 5G), and consumer electronics (WLAN), as well as education and research applications.
Boonton Resources on Radar Testing & MoreTechnical Articles and application notes on radar and peak power meters
[1] RF Power Measurement Reference Guide
http://www.boonton.com/resource-library/power-measurement-reference-guide
[2] Importance of peak power measurements for radar systems
http://www.boonton.com/resource-library/articles/the-importance-of-peak-power-measurements-for-radar-systems
[3] Radar Testing
http://www.boonton.com/resource-library/application-briefs/radar-testing
[4] Boonton 4540 RF Power Meter Application in a Transponder Type Pulsed Radar System by Michael Mallo, Rockee Zhang and Andrew Huston of Radar Innovations Laboratory, the University of Oklahoma
http://www.boonton.com/applications/radar/4540-pulsed-radar
[5] What Real Time Power Processing™ means - 100,000 triggered measurements/second
http://www.boonton.com/resource-library/articles/real-time-usb-power-sensor
[6] Characterizing radar interference immunity
http://www.boonton.com/resource-library/articles/characterizing-radar
[7] What trigger fidelity & high resolution timebase mean for radar
http://www.boonton.com/resource-library/articles/4540-article
[8] Application Note on definitions of automated pulse and marker measurements
http://www.boonton.com/applications/radar/numerical-parameters-analysis-of-boonton-4540-peak-power-meter
[9] Advanced Trigger Capabilities of Peak Power Meters
http://www.boonton.com/applications/communications/4500b-advanced-trigger-capabilities [10] Why replace crystal detector with a peak power meter for radar
http://www.boonton.com/resource-library/application-briefs/crystal-detector-sellsheet
Videos on capabilities of Boonton peak power meters for radar and communications applications:
http://www.boonton.com/resource-library?brand=Boonton&go=videos
Boonton Peak Power Meter Solutions
Boonton has been developing power meters for seven decades, almost as long as radar systems have been around. Just as VED based amplifiers have evolved so have power meters. Boonton peak power meters have been successfully used in civilian and military aviation, warfare and weather radar systems for decades and have become the instrument of choice in radar signal testing.
Related Documents