1 USING CONSERVATION TENDERS FOR WATER QUALITY IMPROVEMENTS IN THE BURDEKIN RESEARCH REPORTS Testing for scope and scale efficiencies in water quality tenders: Final Report RESEARCH REPORT No 7. John Rolfe, Romy Greiner, Jill Windle, Atakelty Hailu and Daniel Gregg May 2008

Welcome message from author
This document is posted to help you gain knowledge. Please leave a comment to let me know what you think about it! Share it to your friends and learn new things together.
Transcript
1
USING CONSERVATION TENDERS FOR WATER QUALITY IMPROVEMENTS IN THE BURDEKIN RESEARCH REPORTS
Testing for scope and scale efficiencies in
water quality tenders: Final Report
RESEARCH REPORT No 7.
John Rolfe, Romy Greiner, Jill Windle, Atakelty Hailu and Daniel Gregg
May 2008

2
Using Conservation Tenders for Water Quality Improvements in the Burdekin Research Reports are published by the Centre of Environmental Management, Central Queensland University, Rockhampton, 4702. These reports represent the provisional findings of a research project titled ‘Optimising the efficacy of conservation tenders under varying degrees of
heterogeneity: Achieving water quality improvements in the Burdekin Dry Tropics
across different management actions in different agricultural production systems and
different parts of a river basin’
Previous reports in the series are outlined in Appendix 1.
The project is being funded by the Australian Government through the National Market Based Instruments Program, with additional support provided by the Burdekin Dry Tropics Natural Resource Management Group. The project is being conducted as a partnership between Central Queensland University, River Consulting, the University of Western Australia and the Burdekin Dry Tropics Natural Resource Management Group. The views and interpretations expressed in these reports are those of the author(s) and should not be attributed to the organisations associated with the project. Because these reports present the results of work in progress, they should not be reproduced in part or in whole without the written authorisation of the Project Leaders, Professor John Rolfe and Dr Romy Greiner.
Any comments will be gratefully received and should be directed to Professor John Rolfe or to Dr Romy Greiner:
Professor John Rolfe Dr Romy Greiner [email protected] [email protected]
(07) 4923 2132 (ph) (07) 47752448 (07) 4930 9156 (fax) (07) 47286436

3
Table of Contents
Executive Summary.......................................................................................................6
1. Introduction...............................................................................................................7
2. Conceptualising the issues ........................................................................................8
3. Water quality issues in the Lower Burdekin region................................................11
4. Performance of the case study ................................................................................14
5. Testing for scale and scope differences ..................................................................18
5.1 Variations in funding scale ...............................................................................18
5.2 Variations in geographic scope.........................................................................19
5.3 Variations in industry scope..............................................................................20
5.4 Variations in emissions scope...........................................................................21
6. Landholder workshops............................................................................................21
7. Attitudinal data........................................................................................................27
8. Agent-based modelling results................................................................................30
8.1 Design of experiments .......................................................................................30
8.2 Auction performance results ..............................................................................30
9. Conclusions.............................................................................................................33
References....................................................................................................................34
Appendix 1: Previous reports for this project: ............................................................36

4
Tables
Table 3.1 Pesticide application rates (Kg active ingredient/yr) 13
Table 3.2 Sediment and nutrient exports and targets for the catchments 13
Table 8.1. Regression of benefit per dollar on auction features: results from agent-based modelling 32
Figures
Figure 2.1 Opportunity costs separately by industry 10
Figure 2.2 Opportunity costs jointly across industry 10
Figure 3.1 Lower Burdekin Region 12
Figure 4.1 Bid values and self-funding components 16
Figure 4.2 Bid curve with cumulative bids and environmental benefits index 17
Figure 5.1 Geographical stratification of the tender area 19
Figure 5.2 Cumulative bid curves for sub-regional tender stratification 20
Figure 5.3 Cumulative bid curves by industry 21
Figure 6.1 Relative bid values of all the bids in the two tender scenarios 22
Figure 6.2 Impacts of scope and scale on participation rates 24
Figure 6.3 The influence of scope and scale issues on bid prices 25
Figure 6.4 The tradeoffs between impacts on participation rates and bid prices 26
Figure 7.1 Level of agreement with various considerations in deriving the bid price for a submission 28
Figure 7.2 Importance of considerations for participating in the Tender 29
Figure 7.3 Attractiveness of various aspects of the Tender 29
Figure 8.1 Benefits per dollar against increasing scope expansion into sediment reduction based conservation activities 31

5
Acknowledgements This work was funded by the Australian Government’s Market-Based Instruments Programme, with additional funding for the field trial provided through the Burdekin Dry Tropics NRM. The Lower Burdekin Water Quality Tender was delivered as a partnership between Central Queensland University (CQU), Burdekin Dry Tropics NRM, River Consulting and the University of Western Australia. The Bureau of Sugar Experiments Stations (BSES) and the Queensland Department of Primary Industries and Fisheries (DPI&F) contributed critical staff resources to enable implementation of the Tender. We specifically wish to thank Dr Scott Crawford, Diana O’Donnell, Paul Duncanson and Duan Biggs (BDTNRM); Adam West, Rob Milla, John Nicholas and Marnie McCulloch (DPI&F); Evan Shannon, Tony Anderson, D Millard, R Matthews, J Dowie, and M Davies (BSES); Dr Jon Brodie (ACTFR) and Dr Peter Thorburn (CSIRO) for supporting the implementation of the Tender in various capacities. We acknowledge the technical contributions to the development of the metric provided by Clinton Muller (CQU).

6
Executive Summary
The design of competitive tenders to purchase environmental services requires judgements to be made about the funding scale and tender scope, with the latter incorporating considerations of geographic area, industries involved and the types of environmental outputs required. Increasing the scale of tenders allows more environmental services to be purchased, while increasing the scope allows a greater range of proposals to be advanced. As well, there may be some administrative efficiency gains in running fewer and larger tenders. These potential efficiency gains have to be balanced against potential indirect effects on participation and bid setting, where larger scale and scope tenders may generate perverse incentives for landholders to be involved.
In the study reported here, these issues have been tested with a water quality tender performed in the Burdekin catchment in north Queensland in 2007 and 2008. The tender incorporated landholders from the cane and grazing industries in the Burdekin and Haughton catchments. Proposals were received for more than $2.1 million in funding for a range of activities that would reduce nitrogen, sediment and pesticide emissions. A metric was used to select 33 proposals out of 87 submitted, with $605,000 allocated in funding. The tender was predicted to achieve the following emission reductions:
• 491.8 tons of sediment reduction for $89.22 per ton (0.04% of catchment load)
• 96,207 kg nitrogen reduction for $4.55 per kg (1.7% of catchment load), and
• 55.6 kg Pesticide reduction for $2,221 per kg (0.04% of application in catchment).
A wide range of opportunity costs were identified for landholder to improve water quality outcomes, justifying the use of a competitive mechanism to select proposals. However, the tender process did not attract the best proposals from all landholders, and further efficiency gains would be possible if landholders had better information about which proposals to submit. These efficiency losses may be one cost of running large scale tenders.
The tender outcomes, workshop results and survey data were used to test the key issues. The results show scale and scope changes can have large direct and indirect effects on the cost-efficiency of these mechanisms. Increases in funding scale can have positive effects on participation rates, increasing the pool of proposals to consider. However, it may mean that some more expensive bids are accepted.
Changes in geographic scope were found to have little impact on efficiency, although smaller scoped auctions tend to have higher participation rates. It is still possible that smaller scoped areas have lower efficiency when there is significant variation in opportunity costs and participation rates between regions. There were large, direct, reductions in efficiency from reducing industry scope (17% lower) or focusing on separate emissions (26% lower). However, there may be offsetting increases in participation rates expected from these changes.
The project included a computational experiment (agent-based modelling) component that evaluated auction outcomes under alternative budget scales, conservation activity scopes and auction pricing formats. The results from these experiments complement the workshop results but also suggest that alternative auction pricing formats such as unfirom pricing might improve the budgetary efficiency of repeated conservation auctions. The results of the overall project show that larger scale and scoped tenders should normally be associated with efficiency gains, but these may be offset by changes in participation rates, and higher negotiations and transaction costs.

7
1. Introduction
Agricultural enterprises are often non-point sources of pollution into waterways. While regulatory controls are important in some situations, there is growing interest in the use of incentives, often bundled under a descriptive term of ‘market based instruments’, to encourage changes in behaviour through market signals rather than direct controls. There are a number of examples of tender mechanisms being used to allocate public funds for water quality improvements by landholders, as well as for other purposes such as protecting wildlife and conservation priority areas (Cason and Gangadharan 2004, Ferraro 2008). Some tender systems such as the Conservation Reserve Program in the United States (Kirwan et al. 2005), and the EcoTender system in Victoria, Australia (Eiganraam et al. 2007), include water quality as one component of desirable environmental improvements. Other mechanisms are focused more directly on water quality. The Nitrate Sensitive Areas Scheme in the United Kingdom (Cason and Gangadharan 2004) is an example of a water quality issue focus, while the Onkaparinga Catchment project in South Australia (Bryan et al. 2005) is an example of a competitive tender being used in a limited geographic area.
The use of auction mechanisms such as a conservation or a water quality tender has potential to provide better incentives to landholders (Cason et al. 2003), and can generate economic efficiencies in several ways (Latacz-Lohmann and van der Hamsvoort 1997, 1998; Stoneham et al. 2003). At a primary level they are more cost-effective than many other funding allocation methods such as grants because they focus on selecting the most efficient proposals from landholders to generate desired outcomes. As well, tenders can generate other efficiencies by providing more appropriate incentives to landholders to innovate and search for better ways of achieving outputs. While these advantages are well understood in theoretical terms, a particular challenge in the performance of a conservation tender is to design and perform them so that net efficiencies are gained. To achieve efficiencies from the performance of a conservation or a water quality tender, several key tasks need to be performed (Latacz-Lohmann and van der Hamsvoort 1997, 1998). The first is to frame the tender within the current institutional and policy setting. The key tasks here are to identify the level of available budget, identify the geographic scope of the project and decide which types of agricultural enterprises or industries are eligible to compete. The second key task is to design the tender process. This includes having an appropriate auction design (Klemperer 2002) so that feasible and cost-effective proposals are submitted by landholders, and having an appropriate selection process (metric design) to identify the best value proposals. The third is to minimise administrative and transaction costs, and to ensure that program objectives are delivered. It is important that the auction design, metric design and contract design stages generate appropriate incentives for landholders with low administrative overheads and transaction costs, and do not create (or at least minimise) perverse incentives. The focus of this project and report is on the framing stage, where choices have to be made about the funding scale, environmental targets, geographic scope and industry scope of a water quality tender. There are likely to be some efficiency gains associated with tenders that are larger in scale and scope because there are more
8
opportunities for landholders with cost-effective proposals to participate. However, there may be several offsetting costs associated with these tenders, including higher administration and transaction costs, particularly those associated with the assessment of bids over multiple areas and water quality impacts. There may also be changes in landholder behaviour to consider, with potential impacts on both participation rates and bid levels as both scale and scope of a tender mechanism changes. These reasons mean that there may sometimes be net efficiencies in running smaller-scale, targeted tenders rather than larger scale general tenders. In this report the effects of performing a tender at different levels of scale and scope are assessed to provide insights into the efficiency gains and losses associated with framing water quality tenders at different levels. The context in which these proposals are to be evaluated is the application of a water quality improvement tender in the Lower Burdekin region in North Queensland, Australia. Water quality improvements are being targeted by government because the river systems discharge into the Great Barrier Reef lagoon, and pollutants may ultimately harm the reef (Furnas 2003, Wolanski and De’ath 2005). Entering into contracts where landholder are paid to improve water quality emissions are one potential way of addressing concerns about the health of the Great Barrier Reef. The research into the potential design of a water quality tender has been performed in two main phases. The first has involved the conduct of a ‘real’ tender across different aspects of scope. This allows some tests of scale and scope efficiency to be conducted. The second has involved field experiments with landholders where the impacts of tender scale and scope changes on potential participation and bid construction have been assessed. The report is structured in the following way. In the next section, an overview of the underlying issues is provided, followed by an overview the case study area in Section 3. The performance of the actual tender is described in section 4, and the resulting scope efficiency tests are described in section 5. The field experiments and results are reviewed in section 6. An overview of the landholders’ attitudes to the tender are presented in Section 7 and the results of the agent based modelling are outlined in section 8. The conclusions are provided in the final section.
2. Conceptualising the issues Conservation auctions such as the Conservation Reserve Program (CRP) in the United States (Kirwan et al. 2005) and the BushTender program in Australia (Stoneham et al. 2003) have been used to identify landholders who can provide on-farm conservation and biodiversity protection actions at lowest cost. Under the programs, landholders are invited to submit tenders specifying their proposed actions and compensation (bid) levels, and a subsequent evaluation process identifies the biodiversity benefits involved and the most cost effective proposals. Use of these mechanisms reflects growing interest in the adoption of market-based instruments to improve natural resource management and environmental outcomes (Latacz-Lohmann and van der Hamsvoort 1997, 1998; Cason and Gangadharan 2004). Competitive auction mechanisms have two theoretical advantages over fixed rate payments. Auction prices are more likely to reflect the marginal value of the resources

9
being used to produce the good or service, and as the mechanism introduces an element of competition between producers, the scope for rent seeking behaviour is reduced (Latacz-Lohmann and van der Hamsvoort 1998). These advantages mean that competitive bidding, as compared to fixed rate payments, can significantly increase the cost effectiveness of conservation or water quality contracting on private land (Latacz-Lohmann and van der Hamsvoort 1997, 1998). The efficiency of a competitive tender is also related to the size and coverage of the mechanism. Here, scale is defined as the size of the tender, largely measured by the funding allocation, while scope is defined as the coverage of a tender over geographic, industry and environmental target dimensions. Increasing scale can generate efficiencies by holding fewer, larger tenders, thus minimising transaction costs. Competition in a conservation or water quality auction is enhanced when the scope of the tender is larger, because there are more potential participants in an agricultural region. Some mechanisms, such as the Conservation Reserve Program in the United States, have a broad scope so as to increase participation, give near-universal access for equity purposes, and generate administration efficiencies (Kirwin et al. 2005). However, a broadly scoped tender comes at a cost. Because they may encompass multiple agricultural sectors, different geographic areas and a variety of environmental targets, it is more difficult to target specific outcomes without generating substantial design complexities. For these reasons, competitive tenders in Australia have tended to be more targeted, often focused on specific areas (e.g. catchments), industry types (e.g. broadscale agriculture) and environmental goals (e.g. protection of native vegetation). Benefits of holding smaller scale auctions are that the risk of failure or some mis-allocation of funds are lower, implying that the design and allocation stages may not need to be as rigorous. Benefits of having narrowly scoped auctions are that the design and assessment processes tend to be simpler, and that the number of issues and stakeholders to engage with are minimised. Other potential benefits are that it may be easier to target issues or equity outcomes specific to industries or regional areas. These reasons explain why many of the trials for conservation auctions have been exploratory in nature and relatively narrow in terms of scale and scope. However, there are also a number of challenges in running a program of auctions that are narrow in scale and scope. The first is that it may be very difficult to allocate an appropriate level of funding to each program to generate efficient outcomes. In economic terms, allocative efficiency across programs will be reached when the marginal cost per environmental benefit is equivalent for the last unit funded in each program. The allocation problem can be illustrated with the aid of Figure 2.1, where the opportunity costs of generating environmental improvements in two different industries are represented. The diagrams represent cumulative ascending bid curves for landholders in Industries A and B to generate a supply of environmental services. The variations in opportunity costs between industries means that the supply functions have very different shapes.

10
Figure 2.1 Opportunity costs separately by industry
Because the potential supply of environmental services is difficult to predict in advance, separate conservation auctions will tend to differ in the efficiency of outcomes. There are potential efficiencies in running a single auction, where the bids are combined into a single opportunity cost curve. This ensures that there is more consistency in the funding for environmental improvements across industry, and that there are not differences in the investment for the last unit of marginal benefit gained. The allocation problems are minimised, as increasing the scale and scope of conservation auctions helps to ensure that more actions are available for a given level of funding. These benefits are shown in Figure 2.2, where the potential bids from landholders across two industries are combined into a single bid function.
Figure 2.2 Opportunity costs jointly across industry
Industry A Industry B $ $
Funding level A
Funding level B
Environmental improvement
Environmental improvement
Industries A and B
Funding
level A + B
$
Funding level A + B net of transaction costs
Environment
benefit
11
There may be different cost structures associated with increasing the scale and scope of conservation auctions. At one level, administration costs may be streamlined by having only a single auction to organise and perform. However, there may be a range of different administration and transaction costs to consider when moving to more consolidated auction formats. Transaction costs relevant to natural resource management issues can include additional engagement, negotiation, institutional and compliance costs associated with changing management practices by landholders (McCann et al. 2005). Key administration and transaction costs to consider in larger scale and scope auctions include:
• political economy costs of dealing with a wider range of interests across institutional boundaries,
• transaction costs of designing a conservation auction with a range of different stakeholders and partners,
• transaction costs of engaging and negotiating agreements with a wider range of landholders,
• auction design costs associated with more complex contingencies such as varying engagement rates and the setting of reserve prices,
• contract design costs associated with more complex contingencies such as setting performance indicators and monitoring conditions across different industries,
• metric design costs associated with achieving increased preciseness of information and dealing with a wider range of potential actions and environmental improvements, and
• the effect of larger scale auctions on incentives, including effects on participation and engagement rates, and crowding-out impacts on voluntary conservation efforts and attention to duty-of-care.
The implication of this framework is that while a number of issues can be identified as relevant for determining the scale and scope of conservation auctions, these can be summarised into three key considerations:
1. The efficiency gains associated from holding larger scale and scope auctions (or the efficiency losses associated with smaller ones),
2. The change in transaction costs (including administration costs) associated with holding larger scale and scope auctions, and
3. The creation of different incentives for landholders in participation and bidding as scale and scope changes.
3. Water quality issues in the Lower Burdekin region These design issues are applied in a case study application, where a water quality tender has been implemented within the Lower Burdekin catchment in northern Queensland, Australia. The tender area covers different catchment areas with a specific focus on two main agricultural industries (cattle grazing and sugarcane production) (Figure 3.1). The Lower Burdekin region includes the lower part of the Burdekin catchment, which is below the Burdekin Falls Dam, as well as two smaller coastal catchments: the Haughton River and Barratta Creek catchments. The three adjacent waterways share the coastal floodplains and are hydrologically linked

12
through the Burdekin Irrigation Area. Land use in the Haughton and Barratta catchments are similar to the Lower Burdekin, with grazing and sugarcane production the dominant agricultural land uses. The study are of interest covered approximately 7,500 km2, with sugarcane grown on 725 km2 and low value grazing occupying much of the rest of the region.
Figure 3.1 Lower Burdekin Region
There are a number of linkages between agriculture and water quality issues. The application of nutrients and pesticides in sugarcane farming in the floodplain areas has increased the risk of offsite contamination in surface and groundwater resources (GBRMPA 2001). The presence of elevated nutrient levels has reduced water quality within groundwater aquifers and the unmetered extraction of groundwater for agricultural production has led to saltwater intrusion (GBRMPA 2001). Excessive grazing has led to soil erosion and the movement of sediments into waterways. A total of 868, 000 hectares within the Lower Burdekin and Haughton Barratta catchments have been deemed ‘hot spot’ locations, on the basis that they are contributing one tonne or more of sediment per hectare a year to the coast (Beare et al. 2003). Only a small percentage of land within the catchments is under any form of conservation protection, accounting for one per cent of the entire Burdekin and eight per cent of the Haughton and Barratta systems (GBRMPA 2001). The aspects of water quality which are most important to the health of the Great Barrier Reef are suspended sediment as well as nutrient and pesticide concentrations. Quantifying the exact contributions to the Great Barrier Reef lagoon from catchments and establishing targets for these contributions is a complex task given the variables to be addressed (Furnas 2003). The best available guidelines are those set by the Great Barrier Reef Marine Park Authority (GBRMPA 2001) in a report to the Ministerial Council on targets for pollutant loads. Pesticide application rates in the catchments are

13
recorded in Table 3.1, with target reduction levels set at 50%. The current and targeted sediment and nutrient contributions from the catchments are detailed in Table 3.2. Table 3.1 Pesticide application rates (Kg active ingredient/yr)
Pesticide Lower Burdekin
Catchment Haughton and Barratta
Catchments
Atrazine 19, 300 24, 299
Diuron 3, 272 4, 123
2-4D 5, 465 6, 887
Chlorpyritos 207 285
MEMC 196 247
Source: GBRMPA (2001)
Table 3.2 Sediment and nutrient exports and targets for the catchments
Burdekin Catchment Haughton and Barratta Catchments
2001
Tons/year
2011 Target
Tons/year
Reduction Target
2001 Tons/year
2011 Target
Tons/year
Reduction Target
Sediment export
2, 442, 232 1, 221, 616 50% 172, 454 115, 544 33%
Total N export
11, 134 7, 460 33% 801 401 50%
Total P Export
2, 438 1, 219 50% 175 88 50%
Source: GBRMPA (2001)
There are a number of activities and management changes that landholders can undertake to reduce water quality impacts. Based on the recognised best management practices to improve water quality leaving farms, in this case study the types of actions that can be considered to improve water quality in the Burdekin can be summarised into the following broad groups:
1. Nutrient management
• such as better nutrient budgeting and fertiliser application processes
leading to lower application rates and reductions in N and P.
2. Waste water management
• such as recycle pits, sediment traps, drain design, road design, tailwater
management, riparian and wetland management, buffer zones.
3. Pesticide management
• such as reductions in the application of key herbicides and pesticides 4. Sediment management
• such as improved ground cover, minimum tillage, reduced stocking rates. The groups of actions that are relevant to sugarcane growers are nutrient management, waste water management and pesticide management. As sugarcane is cultivated in very flat areas of the Burdekin, soil erosion is not considered to be an issue of
14
environmental concern. For grazing enterprises, sediment management is likely to be the only action that will be relevant as soil erosion and associated sediment (and phosphorus) loads are the key impacts on water quality. There are very low levels of nitrogen and pesticides emitted from grazing. A policy maker designing a water quality tender in the region faces substantial choice about the way in which a tender could be scoped. Separate tenders could be run across the different industries, with approximately 700 sugar cane growers and 30 beef cattle producers in the area of interest. Separate tenders could also be run across the different catchments, with an approximately equal number of producers in the lower Burdekin compared to the combined Haughton and Barratta catchments. Alternatively, tenders could be run for each specific issue being addressed, such as the four key areas of action outlined above or the key environment targets of nutrient, pesticide and sediment reduction.
4. Performance of the case study The Burdekin Water Quality tender was run by the Burdekin Dry Tropics Natural Resource Management Group in 2007 and 2008, with $600,000 available for landholder incentives from government programs. A single tender was performed that invited water quality improvements across the two industries and three catchment areas of interest. The geographic and industry scope of the tender was chosen to test how funding and environmental outcomes may have changed if the tender had been split by industry type, geographic area or type of action targeted. Key aspects of the tender design and process are summarised as follows:
• Single bidding round,
• Sealed bids,
• Discriminatory pricing,
• An (unspecified) reserve price,
• Multiple bids allowed from landholders,
• No cap on bids,
• One year contracts for successful bidders,
• Two payment periods for successful bidders: 60% upfront and 40% on completion,
• Simple contracts used to secure agreements, and
• Simple monitoring and reporting processes.
The performance of the tender followed the stages outlined by Latacz-Lohmann and van der Hamsvoort (1998) and Stoneham et al. (2003):
1. Details of the tender were publicised and promoted1 (August 2007). 2. Landholders could register by completing an Expression of Interest form
(September to November 2007).
1 Tender information could be viewed at: www.burdekindrytropics.org.au/watertender/index.html
15
3. Those landholders received a visit from extension and tender design staff to identify suitable projects and explain the process (September to December 2007).
4. Landholders submitted bids (January 2008), 5. Bids were evaluated and assessed (February to March 2008). 6. Landholders were informed of the outcomes, and contracts drawn up with
successful applicants (April 2008). A key step in the tender was the development of the metric used to assess and rank the bids. In the water quality tender the challenge was to design an evaluation tool which could compare projects:
• Across different pollutants,
• Across different industries,
• Across different management activities,
• Across areas with different environmental pressure,
• Across type – where type can include infrastructure or land management, and where some projects are more verifiable and therefore the expected outcomes are more likely to be realised,
• Across time – where some project may provide more permanent structures that will continue providing environmental benefits well after the completion of the one year contract, and
• Across the scope of management approaches, i.e. from a single uncoordinated action to one that is part of a more integrated farming systems approach.
The estimated environmental benefits of proposals was measured as the environmental benefit score (EBS). The EBS was calculated in a 3-step process:
1. Environmental Benefits = Reduced Emissions x Effectiveness Adjustments (for each type of emission)
2. Relative Environmental Scores = Environmental Benefits / GBRMPA targets (for each type of emission)
3. Environmental Benefits Score (EBS) = (Σ Relative Environmental Scores) x Farming Systems Score x Future Intentions Score
The cost effectiveness of each proposal was then assessed on the basis of relative bid value.
4. Relative Bid Value = EBS / Bid Price ($) In the evaluation process, each project was assessed in terms of the marginal changes in emissions that would result from the proposed action, together with adjustment factors for:
• The area of land or drainage involved,
• The type of soil (cane only),
• Rate of off-farm movement into ground water and surface runoff (cane only),
• Fertilizer and pesticide application rates (cane only),
• Capacity of recycle pits or other interception structures ,
• Number of years benefits would continue for (maximum of five),
16
• Type of farming systems involved,
• Future intentions of landholder,
• Rainfall (grazing only),
• Current land condition (grazing only), and
• Slope (grazing only).
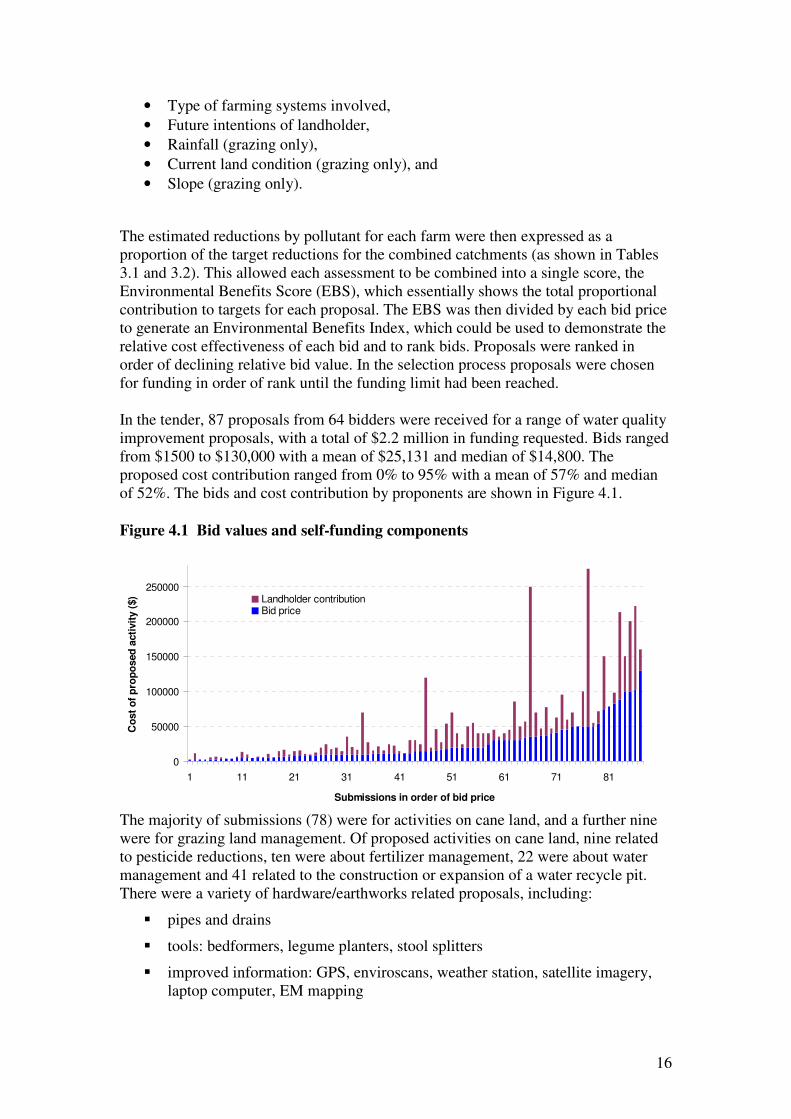
The estimated reductions by pollutant for each farm were then expressed as a proportion of the target reductions for the combined catchments (as shown in Tables 3.1 and 3.2). This allowed each assessment to be combined into a single score, the Environmental Benefits Score (EBS), which essentially shows the total proportional contribution to targets for each proposal. The EBS was then divided by each bid price to generate an Environmental Benefits Index, which could be used to demonstrate the relative cost effectiveness of each bid and to rank bids. Proposals were ranked in order of declining relative bid value. In the selection process proposals were chosen for funding in order of rank until the funding limit had been reached. In the tender, 87 proposals from 64 bidders were received for a range of water quality improvement proposals, with a total of $2.2 million in funding requested. Bids ranged from $1500 to $130,000 with a mean of $25,131 and median of $14,800. The proposed cost contribution ranged from 0% to 95% with a mean of 57% and median of 52%. The bids and cost contribution by proponents are shown in Figure 4.1.
Figure 4.1 Bid values and self-funding components
0
50000
100000
150000
200000
250000
1 11 21 31 41 51 61 71 81
Submissions in order of bid price
Co
st
of
pro
po
sed
acti
vit
y (
$) Landholder contribution
Bid price
The majority of submissions (78) were for activities on cane land, and a further nine were for grazing land management. Of proposed activities on cane land, nine related to pesticide reductions, ten were about fertilizer management, 22 were about water management and 41 related to the construction or expansion of a water recycle pit. There were a variety of hardware/earthworks related proposals, including:
� pipes and drains
� tools: bedformers, legume planters, stool splitters
� improved information: GPS, enviroscans, weather station, satellite imagery, laptop computer, EM mapping
17
� irrigation technology: trickle and drip irrigation, centre pivot, lateral move irrigators
� pesticide applicators: shielded and hooded sprayers
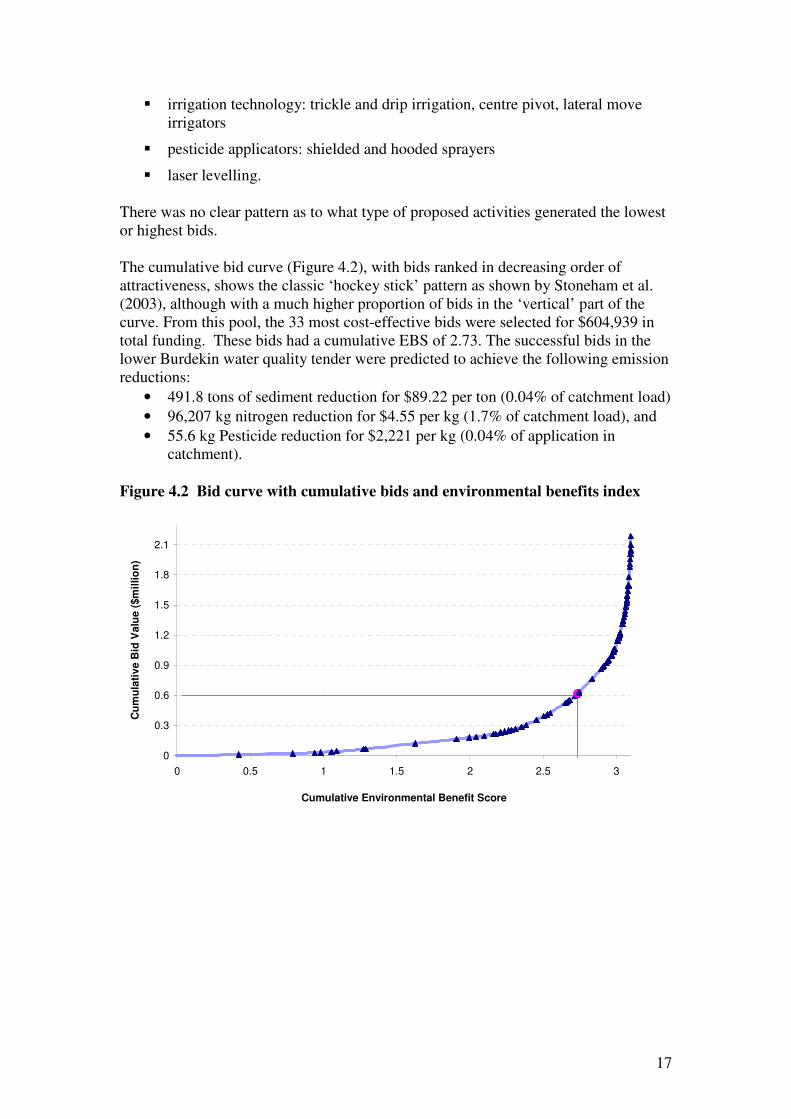
� laser levelling. There was no clear pattern as to what type of proposed activities generated the lowest or highest bids. The cumulative bid curve (Figure 4.2), with bids ranked in decreasing order of attractiveness, shows the classic ‘hockey stick’ pattern as shown by Stoneham et al. (2003), although with a much higher proportion of bids in the ‘vertical’ part of the curve. From this pool, the 33 most cost-effective bids were selected for $604,939 in total funding. These bids had a cumulative EBS of 2.73. The successful bids in the lower Burdekin water quality tender were predicted to achieve the following emission reductions:
• 491.8 tons of sediment reduction for $89.22 per ton (0.04% of catchment load)
• 96,207 kg nitrogen reduction for $4.55 per kg (1.7% of catchment load), and
• 55.6 kg Pesticide reduction for $2,221 per kg (0.04% of application in catchment).
Figure 4.2 Bid curve with cumulative bids and environmental benefits index
0
0.3
0.6
0.9
1.2
1.5
1.8
2.1
0 0.5 1 1.5 2 2.5 3
Cumulative Environmental Benefit Score
Cu
mu
lati
ve B
id V
alu
e (
$m
illio
n)
18
5. Testing for scale and scope differences
5.1 Variations in funding scale
The cumulative bid curve (Figure 4.2) demonstrates that a close relationship exists between the funding scale and the cost-efficiency of the tender mechanism. If funding had been set at a higher or a lower level than $600,000, there would have been a significant difference in the marginal environmental benefits per funding dollar for the last bids funded, although a more limited impact on the level of overall benefits. If the funding for the landholders had been doubled (to $1.2 million), the cumulative EBS would have only increased by 11% (from 2.73 to 3.03). Conversely, if only $300,000 had been allocated (half of the available funding), there would have only been a 14% reduction in the cumulative EBS (to 2.35). The conclusion to be drawn is that if the financial scale is set too high in relation to the scope of the project, substantial inefficiencies may be generated. There are two key points to note about the cumulative bid curve (Figure 4.1). First, the shape of the curve demonstrates substantial variation in the opportunity costs of improving water quality. This justifies the use of a competitive framework to select proposals from landholders. To illustrate the variation in costs across landholders, the 10 most highly ranked projects cost $180,574 and were modelled to capture 47,510 kgs of Nitrogen ($1.70/kg), 51.6 kgs of Pesticide ($1,579/kg), and 29.8 tons of Sediment ($117.4/ton). In comparison, the 10 lowest ranked projects would have cost $495,808 and were modelled to capture 870 kgs of Nitrogen ($290.78/kg), no Pesticides and 18 tons of Sediment ($13,480/ton). The level of cost-effectiveness varied by more than 100 times between the 10 most highly-ranked projects and the 10 most lowly-ranked projects. This variation in opportunity costs provides very strong justification for the use of a competitive tender mechanism to select projects as compared to a more uniform allocation of funding. The second key point to note is that a number of proposals were offered that generated very small environmental benefits and almost no improvement in the cumulative environmental benefits score. This can be shown by the number of bids in the almost vertical section of the cumulative bid curve. The number of bids with very low environmental benefits suggests that the auction process has failed to some extent to attract effective bids from landholders. This may be because landholders had poor information about how to structure environmental proposals or were focused on associated production gains. The results from the workshops (shown later in this report) reveals that many landholders could have submitted more cost-effective and competitive bids. In this project, the combination of a time constraints with a large scale application meant that there were a number of staff and agencies involved with limited training and only a minimal time for field visits, leading to a sub-optimal outcome. Time constraints, poor information transfer, increased complexity and the use of third parties for delivery may lead to ineffectual and sub-optimal bids being submitted.

19
5.2 Variations in geographic scope
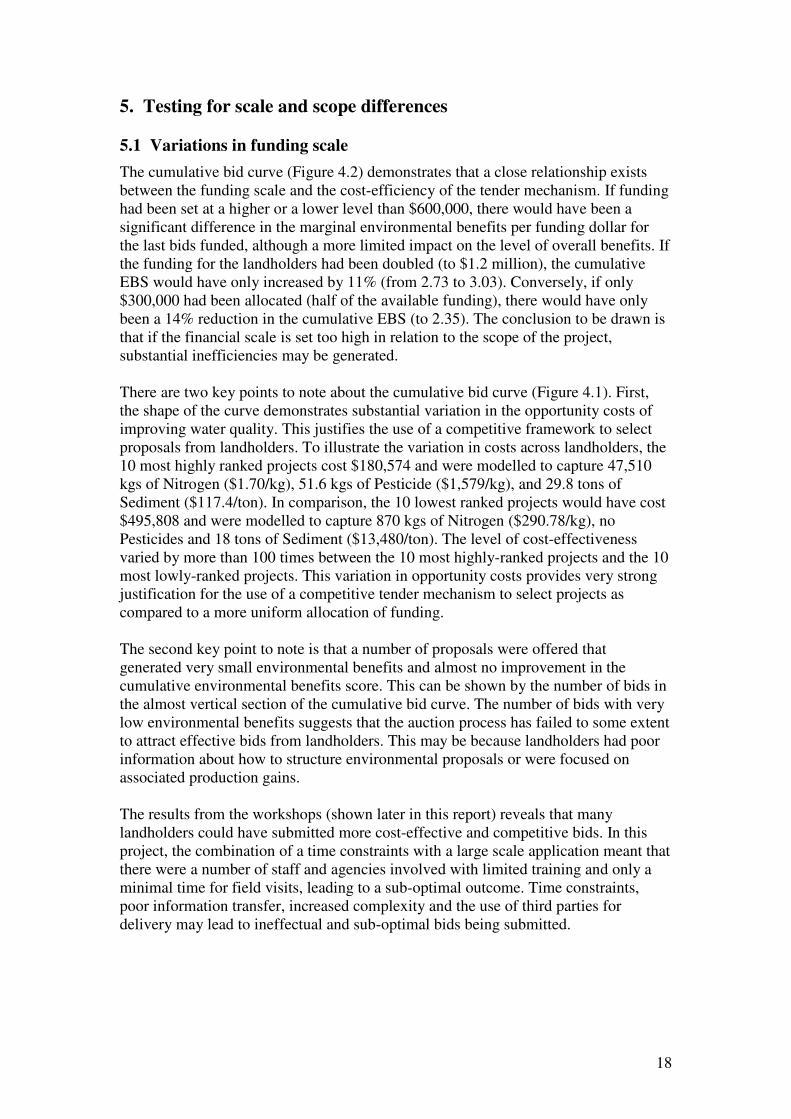
During the tender design process, two key areas were considered as sub-areas for potential investment (Figure 5.1). The Barratta Creek boundary between a western (cane plus grazing) and eastern (cane only) investment areas was chosen because it provided a clear geographical delineation and divided the Lower Burdekin into two regions with a similar number of farms. To conduct the ex-post test relating to scale of tender, the submissions were split into two groups according to their location. A total of 25 submissions were located in investment area 1, compared to 62 submissions in investment area 2. Submissions were then ranked within their subregional groups on the basis of cost efficiency against a nominal allocation of $300,000 for each area. The sub-regional bid curves are shown in Figure 5.2. The environmental benefit score associated with this investment is EBSIA1=0.95 for investment area 1 at a cost of $303,775, and EBS IA2=1.78 for investment area 2, at a cost of $298,204.
Figure 5.1 Geographical stratification of the tender area
Investment Area 1: West of Barratta Creek (green); Investment Area 2: Cane-only east of Barratta Creek (purple)
20
Figure 5.2 Cumulative bid curves for sub-regional tender stratification
0
0.3
0.6
0.9
1.2
0 0.5 1 1.5 2 2.5
Cumulative Environmental Benefit Score
Cu
mu
lati
ve
Bid
Va
lue
($
milli
on
)
Investment area 1: West of Barratta Creek
Investment area 2: Cane-only east of Barratta Creek
A comparison of successful submissions in this exercise reveals that of successful submissions in the combined tender, only one (a recycle pit) missed out from investment area 2, while one additional (slightly less efficient) submission was successful from within investment area 1 (nutrient management activity). When compared to a total EBS of 2.73 in the joint pool, an allocation by regional area would have reduced overall efficiency by less than 1%. However the efficiency loss could have been larger if there had been systematic variation in opportunity costs across regions. The potential for this is shown in Figure 5.2, where there is a significant difference in the cumulative EBS score per region There was limited evidence from this study that allocating funds within sub-regions would result in efficiency losses, although it could potentially occur if regions differ by opportunity costs and/or participation rates.
5.3 Variations in industry scope
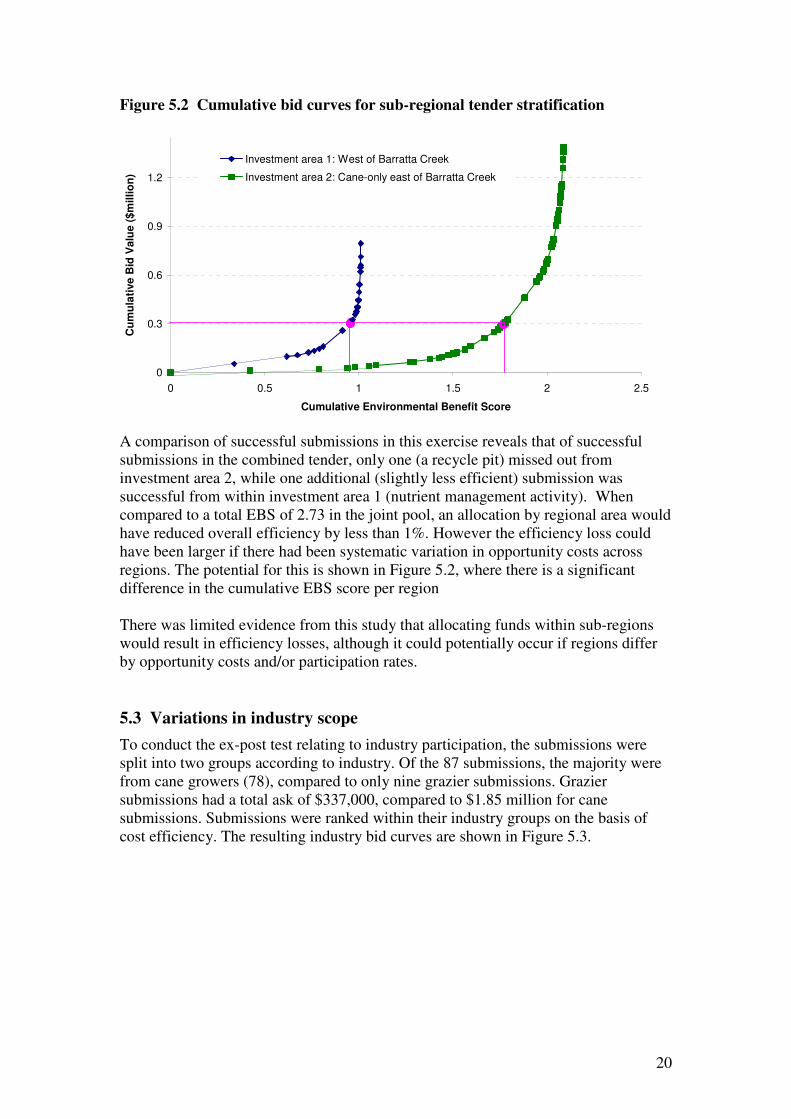
To conduct the ex-post test relating to industry participation, the submissions were split into two groups according to industry. Of the 87 submissions, the majority were from cane growers (78), compared to only nine grazier submissions. Grazier submissions had a total ask of $337,000, compared to $1.85 million for cane submissions. Submissions were ranked within their industry groups on the basis of cost efficiency. The resulting industry bid curves are shown in Figure 5.3.
21
Figure 5.3 Cumulative bid curves by industry
0
0.3
0.6
0.9
1.2
1.5
0 0.5 1 1.5 2 2.5 3
Cumulative Environmental Benefit Score
Cu
mu
lati
ve B
id V
alu
e (
$m
illi
on
)
Sugar Cane
Grazing
If the funding had been allocated equally between the two industries, a $300,000 investment in grazing management would have generated a cumulative EBS of 0.156, while a $300,000 investment in cane industry management would have generated a cumulative EBS of 2.258. When compared to a total EBS of 2.73 in the joint pool, an allocation by industry would have reduced overall efficiency by 17%.
5.4 Variations in emissions scope
To conduct the ex-post test relating to emissions type, the submissions were divided into the three main categories of Nitrogen, Pesticide and Sediment emissions. The bids were then ranked against a hypothetical allocation of $200,000 for each pollutant type. This generated cumulative EBIs of 0.840 for Nitrogen emissions, 1.025 for Pesticide emissions (only $45,863 in bids available for allocation), and 0.153 for Sediment emissions. The total cumulative EBS that is generated is 2.018, a reduction of 26% in efficiency. The efficiency of the allocation for Nitrogen reductions is more than five times the efficiency of allocations to sediments. The results demonstrate that substantial reductions in efficiency can be generated by focusing tenders within rather than across specific environmental outcomes. Allocating funds to specific environmental targets can generate significant efficiency losses.
6. Landholder workshops Further tests for impacts of scale and scope on participation and bid levels were conducted through the use of field experiments. Field experiments involve farmers as participants, and can provide direct feedback on how landholders of interest would behave if different forms of conservation auctions were introduced (List and Shogren 1998, List and Lucking-Reiley 2002). In this project, two workshops were held in March 2008 with 36 tender participants, representing slightly over half of the

22
landholders involved in the tender process. The workshops were timed to occur after the bid assessment process had been completed but before the results had been announced. This meant that participants could be confident that:
• the exercises they completed in the workshops would have no influence on the tender outcomes; and
• the information they provided would not be influenced by the results of the tender bid and whether or not their bid had been successful.
The first part of the workshop required participants to develop a desktop bid proposal to reduce their fertiliser application rates over a three year period. A key advantage of holding the workshop after the actual tender had been conducted was that participants were familiar with the process of developing a tender application. While the exercise was hypothetical, participants were asked to make their bids as realistic as possible as the results would be used to expand the information gathered in the trial tender. Information on current fertilizer practices and rates was collected to help frame proposals against current practices and minimise any potential for hypothetical or strategic bias. Few landholders submitted a proposal to directly reduce fertilizer use in the main auction round. One purpose of the workshop was to create additional bids from landholders which could then be pooled and compared with previous bids submitted in the auction round. The results of this process are shown in Figure 6.1, and demonstrate that introducing more competition into the tender mechanism (using multiple bids from the same group of participants) would have increased cost efficiencies. The inclusion of 32 additional bids from workshop participants would generate a cost reduction of 43% for nitrogen emissions, 33.4% for sediment emissions and 52% for pesticide emissions. Encouraging more competition and targeting the most appropriate bids from landholders can generate significant efficiency gains.
Figure 6.1 Relative bid values of all the bids in the two tender scenarios

23
An additional purpose of the workshop was to identify if the pattern of bid formation was consistent between tender and workshop applications. Very different patterns emerged, with bids in the workshop showing a range of environmental benefits and bid values. This generated a more consistent EBI, rather than one ranging from very high values to very low values. In graphical terms, the cumulative EBIs from the workshop bids sloped gently upwards rather than ending in a near vertical line (Figure 6.1). These results confirm that the large number of uncompetitive bids from the actual tender process may have been the consequence of poor information and understanding from landholders. Better tender processes that helped landholders to identify and target environmental improvements would have generated more competition and increased efficiency. The second part of the workshop exercises focused on the effects that changes in scope and scale may have on participation and bid construction in a tender scheme. Keeping in mind their initial bid proposal to reduce fertilizer applications, participants were presented with a number of different scenarios and then asked about their likelihood of participating and whether they would adjust their bid price. Landholders could indicate their likelihood of participation on a scale from 1 (very unlikely) to 10 (very likely), and any potential changes in bid price in terms of actual amounts or percentage changes. An initial scenario was used to determine a baseline from which any variation could be compared. The baseline scenario outlined a proposal with a funding pool of $400,000 (each year for three years) and was limited to Burdekin sugarcane growers. Other scenarios were then described to assess: Changes in scale:
a) Increasing the funding pool to $600,000, and b) Decreasing the funding pool to $200,000.
Changing the scope:
c) $400,000 funding but open to all primary producers, and d) $400,000 funding but open to sugarcane growers in Mackay and Proserpine as
well as the Burdekin. The influence of transaction costs in terms of verifying their actions:
e) $400,000 funding and a low level of verification with a requirement to undertake a higher level monitoring, such as having to take water samples after each irrigation event, and
f) $400,000 funding and a high level of verification with a requirement to undertake a higher level monitoring, such as having fertiliser purchases checked by an auditor.
An example of a task that was presented to respondents is shown below.

24
2. Suppose now that the funding pool was increased to $600.000 per year for three years. a) How likely do you think you would be to enter a submission: On a scale from 1 (very unlikely) to 10 (very likely), please circle the appropriate level.
Very unlikely Very likely
1 2 3 4 5 6 7 8 9 10
b) Do you think this would affect your bid price at all? YES No IF YES, would you change your bid amount? YES No IF YES, By how much? Increase by Amount $______ or percentage ______%
Or Decrease by Amount $______ or percentage ______%
___________________________________________________________________ To estimate the potential participation rates under the different scenarios any rating with a score of 5 or higher was considered a positive indication of participation. The results are presented in Figure 6.2. There was clear evidence that the scale of a scheme will have an impact on participation. When the funding pool was increased by 50% from $400,000 to $600,000, nominated participation rates in the scheme increased by 10.3%, from 61.5% to 71.8%. Conversely, when the scale was decreased by 50% to a funding pool of $200,000, nominated participation rates dropped by twice as much (20.5%), from 61.5% to 41.0%.
Figure 6.2 Impacts of scope and scale on participation rates
0%
10%
20%
30%
40%
50%
60%
70%
80%
$400,000
sugar only
$600,000
sugar only
$200,000
sugar only
$400,000 all
pimary
producers
$400,000
sugar other
regions
$400,000 low
verification
$400,000
high
verification
Pa
rtic
ipa
tio
n
Increasing the scope of the tender (from sugarcane growers to all primary producers) had a negative impact on participation, but increasing the scope to include other primary producers in their own region was more acceptable than including sugarcane growers from other regions (Figure 6.2). When the scheme was extended to other primary producers in the Burdekin region, there was a 5.1% drop in participation from 61.5% to 56.4%. The effect was greater when the scope of the tender was increased to include sugarcane growers in other districts (Mackay and Proserpine), with the participation rate falling by 30.7% from 61.5% to 30.8%.

25
Increasing the transaction costs associated with more stringent verification procedures had some negative impact on participation, but not as much as having a low funding pool or extending the scope to include other regions. Implementing a low level of verification and increasing the monitoring requirement to include the need for water sampling after irrigation events decreased participation rates by 15.3% from 61.5% to 46.2%. The high verification level and more intrusive monitoring requirement of having an auditor check fertiliser purchases, reduced the likelihood of participating by a further 2.6% to 43.6% (Figure 6.2). Some landholders also indicated that changes in scale and scope would affect their bid price. Approximately one third of respondents indicated that the change in tender scenario would affect their bid price, with a smaller proportion identifying the change in bid amount involved (Figure 6.3). Increasing scope to include all primary producers had the least impact, with only 24% suggesting it would affect their bid price. However, there was some variation in the extent to which participants would respond by altering their actual bid amount. The scenario that induced the lowest number of participants to change their bid amount (13%) was the option to extend the tender to other regions, but still involve only sugarcane growers. Even though this was only a small group, their change was quite large with bids decreasing by an average of 30%. Clearly some participants considered the inclusion of sugarcane growers from other regions as increasing the competitive environment and to retain their chances of success, they would have to submit a more competitive bid.
Figure 6.3 The influence of scope and scale issues on bid prices
26
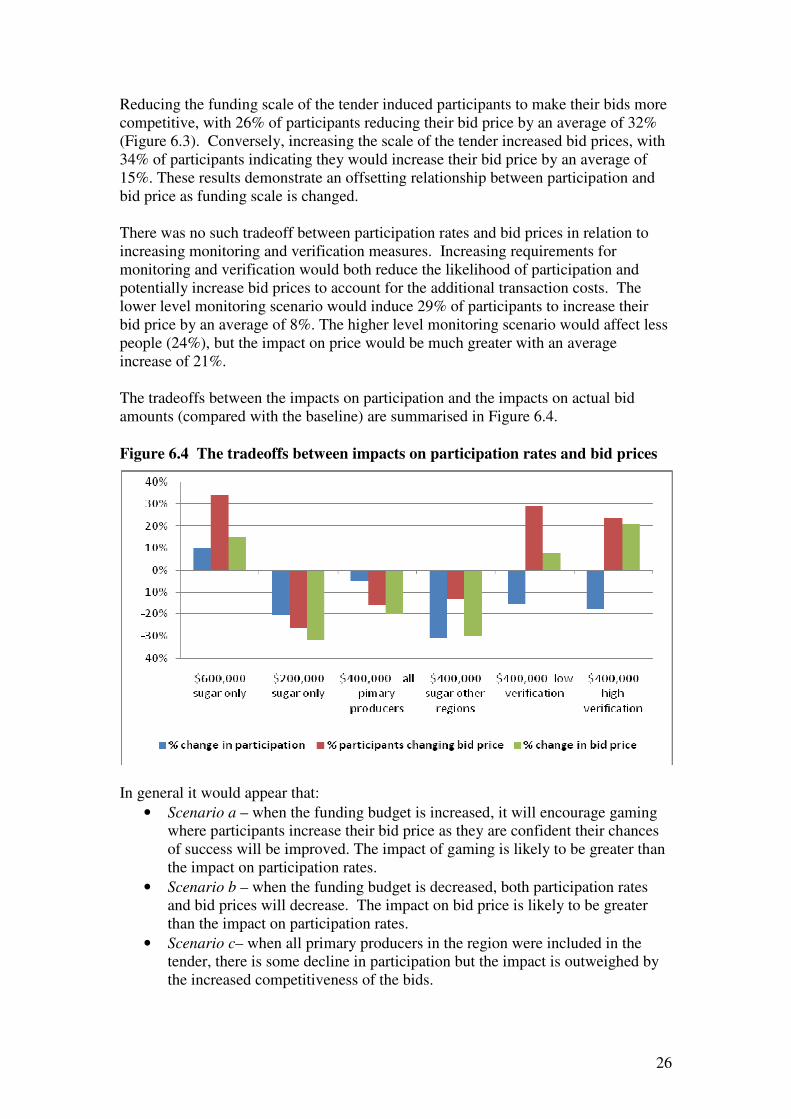
Reducing the funding scale of the tender induced participants to make their bids more competitive, with 26% of participants reducing their bid price by an average of 32% (Figure 6.3). Conversely, increasing the scale of the tender increased bid prices, with 34% of participants indicating they would increase their bid price by an average of 15%. These results demonstrate an offsetting relationship between participation and bid price as funding scale is changed. There was no such tradeoff between participation rates and bid prices in relation to increasing monitoring and verification measures. Increasing requirements for monitoring and verification would both reduce the likelihood of participation and potentially increase bid prices to account for the additional transaction costs. The lower level monitoring scenario would induce 29% of participants to increase their bid price by an average of 8%. The higher level monitoring scenario would affect less people (24%), but the impact on price would be much greater with an average increase of 21%. The tradeoffs between the impacts on participation and the impacts on actual bid amounts (compared with the baseline) are summarised in Figure 6.4.
Figure 6.4 The tradeoffs between impacts on participation rates and bid prices
In general it would appear that:
• Scenario a – when the funding budget is increased, it will encourage gaming where participants increase their bid price as they are confident their chances of success will be improved. The impact of gaming is likely to be greater than the impact on participation rates.
• Scenario b – when the funding budget is decreased, both participation rates and bid prices will decrease. The impact on bid price is likely to be greater than the impact on participation rates.
• Scenario c– when all primary producers in the region were included in the tender, there is some decline in participation but the impact is outweighed by the increased competitiveness of the bids.

27
• Scenario d – when sugarcane growers from other regions are included, the impact of lower participation is likely to outweigh the impact on increased price competition. However, there will be some substantial competitive gains to be made.
• Scenario e – when a low level of monitoring measures are imposed, there will be a negative impact on participation and many participants will increase their bid prices, but by relatively small amounts.
• Scenario f – imposing a high level of monitoring measures will have a relatively small impact on participation compared to a low level standard, but will have a much more substantial impact on bid prices.
7. Attitudinal data Two exercises were conducted to assess the views of landholders towards the tender scheme and other issues. One survey was conducted with landholders attending the workshops (39 participants), while the other was sent to all landholders after the results of the tender had been announced (46 participants).Given that only 64 different enterprises submitted proposals to the Tender, this represents very satisfactory participation rates. A key focus of the surveys was to collect additional information on the different transaction costs involved in the tender process. The data collected in the workshop generated the following results:
• The majority of participants did not include the transaction costs incurred in developing a bid in their bid price. These cost become part of a de facto cost-share arrangement.
• The average cost in terms of the time taken to develop a bid proposal was approximately $220. The potential cost of monitoring activities averaged approximately $640.
• Demographic and attitudinal variables did not appear to be related to bid construction, suggesting that bids are largely driven by farm characteristics and opportunity costs.
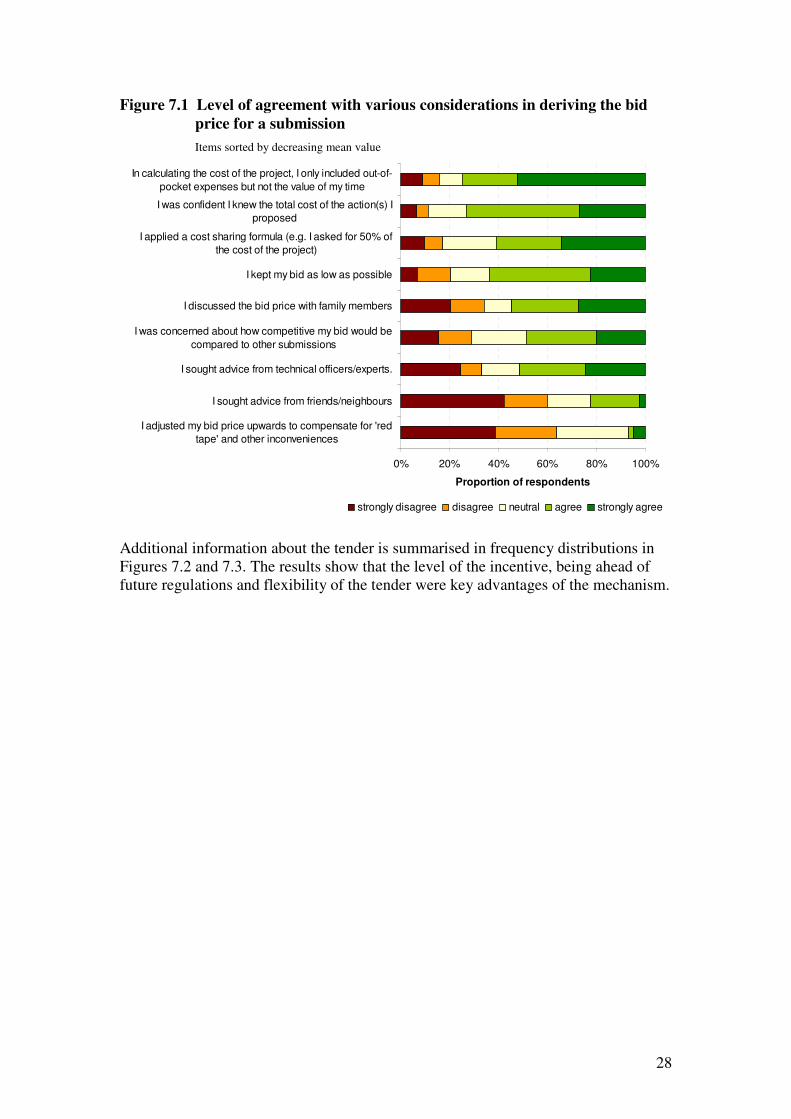
Similar results about bid formation were gained from the general survey (Figure 7.1). The results show that many transaction costs were not included in bid prices, landholders were prepared to share costs, that bids were kept low, and landholders were generally confident that they knew the total cost of proposed activities.
28
Figure 7.1 Level of agreement with various considerations in deriving the bid price for a submission
Items sorted by decreasing mean value
0% 20% 40% 60% 80% 100%
I adjusted my bid price upwards to compensate for 'red
tape' and other inconveniences
I sought advice from friends/neighbours
I sought advice from technical officers/experts.
I was concerned about how competitive my bid would be
compared to other submissions
I discussed the bid price with family members
I kept my bid as low as possible
I applied a cost sharing formula (e.g. I asked for 50% of
the cost of the project)
I was confident I knew the total cost of the action(s) I
proposed
In calculating the cost of the project, I only included out-of-
pocket expenses but not the value of my time
Proportion of respondents
strongly disagree disagree neutral agree strongly agree
Additional information about the tender is summarised in frequency distributions in Figures 7.2 and 7.3. The results show that the level of the incentive, being ahead of future regulations and flexibility of the tender were key advantages of the mechanism.

29
Figure 7.2 Importance of considerations for participating in the Tender
Items sorted by decreasing mean value
0% 20% 40% 60% 80% 100%
I have successfully applied for grants/other
funding previously
This appeared to be a novel type of scheme
Having field officers help develop the
submission made participation easy
Extra income is helpful for the viability of the
farm
I want to be ahead of possible future
environmental regulations
The requested payment would help me do
some things now that I was hoping to do in the
future
Propotion of respondents
very unimportant unimportant neutralimportant very important
Figure 7.3 Attractiveness of various aspects of the Tender
Items sorted by decreasing mean value
0% 20% 40% 60% 80% 100%
The competitive element of the tender
The fact that actions were considered retrospectively
(from date of submission of expression of interest)
Having industry officers (BSES/DPI) involved in the
design and field visits.
The fact that cane growers and graziers were involved
Receiving assistance in developing a submission
The fact that there was no upper limit to the bid
Receiving a field visit to discuss actions
The fact that I could stipulate actions which best suited
my farm and situation
Proportion of respondents
very unattractive unattractive neutral attractive very attractive
30
8. Agent-based modelling results Computational experiments were used to complement the field trials and the experimental workshops, using the data to simulate how the auctions would perform in slightly different settings. The simulations involved assumptions that bidders would learn through the auction rounds to increase the rents (net revenue) they obtain from auction contracts. For this reason, one could consider the computational experiments as an evaluation of the robustness of auction outcomes to auction repetition and bidder learning. The learning algorithms used in this study combine features of the directional learning algorithm used in the study of single unit auctions by Hailu and Schilizzi (2004) and the reinforcement learning algorithm used for the study of multi-unit auction by Hailu and Thoyer (2006, 2007). The results provide some lessons for designing future (and repeated) auction rounds.
8.1 Design of experiments
The following features of were varied independently in the computational experiments: a) Scope of the auction: The range of conservation activities covered in the auction
imitated the effects of the changes in the scope of the tender across industries, given the predominance of sediment focused projects in the grazing industry while nutrient and pesticide based projects were concentrated in the sugar cane industry. The shares of nutrient, pesticide and sediment reduction in the environmental benefits (EBS) score value were varied between 0 and 1 to generate a mix of activities covering a wide range of heterogeneity in projects. In a given simulation, each bidder was assigned nitrogen, pesticide and sediment shares drawn from a distribution, which were translated into nitrogen, pesticide and sediment levels. Opportunity costs accompanying the effort levels were generated and scaled using a Data Envelopment Analysis (DEA) frontier constructed from the Burdekin bid data.
b) Auction budget: Two auction budgets were used, $600K and $300K. The first level represents the actual budget in the field trials, with the lower budget increasing the “degree of rationing” or competitiveness in the auction.
c) Endogeneity of bidder participation: Simulations were conducted for a case where bidders continue to participate even when they are not successful in their bids and for a case where participation is dependent on auction outcomes. In this case of endogenous participation, bidders who lose in the auction rounds become more and more likely to drop out of the bidding rounds until they are indifferent between bidding and not bidding. Inactive bidders drop back in with a probability that is increasing in the average net contract prevailing among the successful bidders.
d) Auction price format: The field trial, like most MBI trials conducted to date, has used a pay-as-bid or discriminatory pricing format. In the agent-based simulations, this payment format is compared to the alternative format of uniform pricing where winning bidders would be paid the same per unit of environmental benefit.
In all cases, the modelling involved a starting bidding population of 100 participants; the actual number of Burdekin bids was 88. All experiments were replicated 50 times and the results reported below are averages over those 50 replications unless otherwise indicated.
8.2 Auction performance results
The results consistently indicate that allocating a greater share of funding to sediment based projects, with all other features of the auction fixed, is detrimental to the performance of the auction. The environmental benefits generated per $1,000,000 of funding fall consistently as the share of allocation to sediment increases (Figure 8.1). This outcome is a reflection of the more costly nature of sediment based activities and highlights the need for the identification

31
of scope/budgetary efficiency trade-offs based on the nature of conservation activities that prevail in different industries.
Figure 8.1 Benefits per dollar against increasing scope expansion into sediment reduction based conservation activities
0.2 0.3 0.4 0.5 0.6 0.7
2.2
2.4
2.6
2.8
3.0
3.2
3.4
% Sediment share
EB
S/M
$
The benefits of a lower budget with a higher degree of rationing are very strong. The benefits per dollar from the auction with a budget of $300,000 can be between 40 and 100% above those where the budget is $600,000. On average, the benefits were 67% higher. The benefits of the higher degree of rationing (or increased competition for a given budget) are notably higher when the scope of the auction is such that it covers higher cost activities. Results for repeated auctions where bidders stay active even after bids are unsuccessful are only marginally higher than for cases where bidders drop out (and drop back in). The weakness of these results seems to be due to the way the participation rules are formulated in the simulation, being biased in favour of bidding. For example, in our experiments, a bidder who just lost in auction might participate in the next one with a probability of at least 0.5 depending on their net revenue from the contracts in previous rounds. In practice, bidders might be more responsive to bid failures and the results reported here would understate the importance of investments in landholder participation. Finally, the use of uniform pricing rather than discriminatory pricing in repeated auctions would lead higher benefits per conservation dollar. With uniform pricing, bidders get paid the price of the marginal winner. Their own bids influence whether they win or not but not how much they get paid (unless they are the most expensive winner). This auction leads to more truthful bidding or to less overbidding. The simulations indicate that with uniform pricing in repeated auctions, one could increase the benefits per dollar by between 15 and 55%. The benefits from uniform pricing are especially higher if bidders tend to drop out following bid failures. The following table presents results from a regression of the benefits per dollar from the simulation results against the different auction design features. These results highlight the

32
importance of the auction design features, with 93% of the benefit per dollar variations explained by their inclusion in the regression.
Table 8.1. Regression of benefit per dollar on auction features: results from agent-based modelling
Auction feature Coef. t-stat
(Intercept) 0.00811 60.987
Share of Pesticide 0.00057 4.309
Share of Sediment -0.00322 -20.727
Budget (300K/600K) -0.00001 -31.243
Discriminatory pricing (dummy) -0.00101 -16.253
Activity threshold (dummy, 0 if bidders do not drop out) -0.00007 -1.169
R-squared 0.93

33
9. Conclusions The research outlined in this report addresses the issue of setting the scale and scope of tenders for environmental services. Although the size and coverage of a tender mechanism may have major impacts on subsequent net efficiency, little attention has previously been paid to these issues. The research reported here has been based on a major field trial conducted to improve water quality from agriculture, with the aim of improving the health of the Great Barrier Reef in Australia. The conduct of the field trial, post-hoc tests on other potential funding allocations, and a series of field experiments with landholders have helped to identify the potential impact of scale and scope differences. The project also included agent-based modelling simulations aimed at exploring these issues and the choice of pricing format (the pay-as-bid versus uniform pricing) for repeated auctions. The scale and scope of tender mechanisms for purchasing environmental services have impacts on efficiency through both direct and indirect impacts. The direct scale effects means that the funding allocated to a tender proposal has to be tailored to the extent and the cost-effectiveness of the proposals that will be received. The direct scope effects mean that efficiencies are likely to be generated by increasing the geographic, industry and environment target scope of a tender mechanism. The results of this study suggest that the largest efficiency gains are to be found in increasing scope across the type of environmental services required and the industries involved, rather than across broad geographic regions. Increasing the scale and scope of tender mechanisms will not automatically generate net efficiencies because of the potential offsetting impacts of the indirect effects, particularly in terms of changes in participation and bid prices. The tender results and the agent based modelling shows that there are large efficiency gains from ensuring the funding scale is tailored to adequate levels of competition. The results of field experiments with landholders in this study suggest that increasing the funding scale of a tender may increase participation but at the potential cost of higher bid levels. Increasing the scope of a tender leads to decreased participation and lower bid prices, while increasing monitoring and verification requirements leads to decreased participation and higher bid prices. As well, larger scale and scope tenders may be associated with higher administration and transaction costs, and may require more detailed assessment to evaluate proposals across different regions, industries and activities. The need for careful consideration of scope issues is also highlighted by the results from the agent-based modelling exercise. These indicate that the expansion in scope to cover higher cost activities or industries would be detrimental to the auction if the expansion is done without accompanying effort that maintains or enhances participation from other industries or regions. The results of this study have implications for the design and implementation of tender mechanisms to purchase environmental services from landholders. It is clear that focusing the scope of tenders too narrowly, or misjudging the scale of funding relative to scope, can generate substantial inefficiencies. At the same time, policy makers have to also consider the design costs, transaction costs and indirect impacts that may counterbalance efficiency gains in moving to larger scale and scoped tenders.

34
References Beare, S., Bell, R., Blias, A., Gooday, P., Heaney, A., Hooper, S., Langenkamp, D.,
Love, G., Levantis, C., Mues, C., Qureshi, E. and Riley, C. 2003. Natural
Resource Management in the Burdekin River Catchment: Integrated
Assessment of Resource Management at the Catchment Scale – A Case Study, Australian Bureau of Agricultural Resource Economics Report 03.18, Canberra.
Bryan, B., Gatti, S., Connor, J., Garrod, M. and King, D. 2005. Catchment Care - Developing an Auction Process for Biodiversity and Water Quality Gains, CSIRO Land and Water, Australia.
Cason, T. N. and Gangadharan, L. 2004. Auction design for voluntary conservation programs. American Journal of Agricultural Economics 86: 1211-1217.
Cason, T., L. Gangadharan, and Duke, C. 2003. A laboratory study of auctions for reducing non-point source pollution. Journal of Environmental Economics and
Management 46: 446– 71. Eigenramm, M., Strappazzon, L., Landsdell, N., Beverly, C. and Stoneham, G. 2007.
Designing frameworks to deliver unknown information to support market-based instruments. Agricultural Economics, 37: 261-269.
Ferraro, P.J. 2008. Asymmetric information and contract design for payments for environmental services. Ecological Economics, 65(4): 810-821.
Furnas M. 2003. Catchments and Corals: Terrestrial Runoff to the Great Barrier
Reef, Australian Institute of Marine Science, Townsville. Great Barrier Reef Marine Park Authority (GBRMPA), 2001. Great Barrier Reef
Catchment Water Quality Action Plan: A report to the Ministerial Council on targets for pollutant loads, Great Barrier Reef Marine Park Authority, Townsville.
Hailu, A. and S. Schilizzi. 2004. ‘Are auctions more efficient than fixed price schemes when bidders learn?’, Australian Journal of Management, 29, 147-68.
Hailu, A. and S. Thoyer. 2006. “Multi-unit auction format design” Journal of
Economic Interaction and Co-ordination, 1: 129-146. Hailu, A. and S. Thoyer. 2007. “Designing multi-unit multiple bid auctions: An agent-
based computational model of uniform, discriminatory and generalized Vickrey auctions” Economic Record, 83(S1): S57-S72, Sep 2007.
Klemperer, P. 2002. What really matters in auction design? Journal of Economic
Perspectives 16: 169-189. Kirwan, B., R. N. Lubowski and Roberts, M. J. 2005. How cost-effective are land-
retirement auctions? Estimating the difference between payments and willingness to accept in the Conservation Reserve Program. American Journal
of Agricultural Economics 87: 1239-1247. Latacz-Lohmann, U.and van der Hamsvoort, C. 1997. Auctioning conservation
contracts: a theoretical analysis and application. American Journal of
Agricultural Economics 79: 407-418. Latacz-Lohmann, U. and van der Hamsvoort, C. 1998. Auctions as a means of
creating a market for public goods from agriculture. Journal of Agricultural
Economics 49: 334-345. List, J.A. and Lucking-Reiley, D. 2002. Bidding behavior and decision costs in field
experiments. Economic Inquiry 40: 611-619.

35
List, J. and Shogren, J. 1998. Calibration of the difference between actual and hypothetical valuations in a field experiment. Journal of Economic Behavior
and Organization 37: 193-205. McCann, L., Colby, B., Easter, K. W., Kasterine, A. and Kuperan, K. V. 2005.
Transaction cost measurement for evaluating environmental policies. Ecological Economics, Vol. 52(4): 527-542.
Stoneham, G., Chaudhri, V., Ha, A. and Strappazzon, L. 2003. Auctions for conservation contracts: an empirical examination of Victoria’s BushTender trial. Australian Journal of Agricultural and Resource Economics 47 (4): 477-500.
Wolanski, E. and De’ath, G. 2005. Predicting the impacts of present and future human land-use on the Great Barrier Reef. Estuaries, Coastal and Shelf Science, 64: 504-508.
36
Appendix 1: Previous reports for this project:
Rolfe, J., Greiner, R., Windle, J. and Hailu, A. 2007 Identifying scale and scope issues
in establishing conservation tenders, Using Conservation Tenders for Water Quality Improvements in the Burdekin Research Report 1, Central Queensland University, Rockhampton.
Rolfe, J., Muller, C., Greiner, R. and Windle, J. 2007 Overview of the Burdekin Case
Study, Using Conservation Tenders for Water Quality Improvements in the Burdekin Research Report 2, Central Queensland University, Rockhampton.
Rolfe, J., Windle, J., Muller, C. and Greiner, R. 2007 Designing a metric for
conservation tenders at different levels of scope and scale, Using Conservation Tenders for Water Quality Improvements in the Burdekin Research Report 3, Central Queensland University, Rockhampton.
Windle, J., Rolfe, J., Greiner, R., and Gregg, D. 2008. Using conservation tenders for
water quality improvements in the Burdekin. Results from experimental workshops. Using Conservation Tenders for Water Quality Improvements in the Burdekin Research Report 4, Central Queensland University, Rockhampton.
Greiner, R., Rolfe, J., Windle, J., and Gregg, D. 2008. Tender results and feedback
from ex-poast participant survey, Using Conservation Tenders for Water Quality Improvements in the Burdekin Research Report 5, Central Queensland University, Rockhampton.
Related Documents