Testing for Mean-Variance Spanning with Short Sales Constraints and Transaction Costs: The Case of Emerging Markets FRANS A. DE ROON, THEO E. NIJMAN, and BAS J. M. WERKER* ABSTRACT We propose regression-based tests for mean-variance spanning in the case where investors face market frictions such as short sales constraints and transaction costs. We test whether U.S. investors can extend their efficient set by investing in emerging markets when accounting for such frictions. For the period after the major liberalizations in the emerging markets, we find strong evidence for diver- sification benefits when market frictions are excluded, but this evidence disap- pears when investors face short sales constraints or small transaction costs. Although simulations suggest that there is a possible small-sample bias, this bias appears to be too small to affect our conclusions. THE QUESTION OF WHETHER OR NOT an investor can extend his efficient set by including additional assets in his portfolio has recently received consider- able attention in the literature. If extension of the efficient set is not possi- ble for a specific mean-variance utility function, the mean-variance frontier of the benchmark assets and of the benchmark assets plus the additional assets intersect, that is, they have one point in common. If extension of the efficient set is not possible for any mean-variance utility function, the mean- variance frontier of the initial assets spans the frontier of the larger set of the initial assets plus the additional assets. These concepts are discussed by Huberman and Kandel ~1987!, who propose regression-based tests of the hypotheses of spanning and intersection for mean-variance investors. It is well known by now that a shift in the mean-variance frontier from adding assets to the investment opportunity set is tantamount to a shift in the volatility bounds of the kernels that price the assets under consideration ~e.g., DeSantis ~1994! and Bekaert and Urias ~1996!! and that the issue is also very closely related to performance evaluation ~see, e.g., Jobson and * De Roon is from Erasmus University Rotterdam and CEPR, Nijman and Werker are from Tilburg University. Geert Bekaert, Feico Drost, Bruno Gerard, Pierre Hillion, Erzo Luttmer, Bertrand Melenberg, René Stulz ~the editor!, and an anonymous referee have provided many helpful comments and suggestions. We are also grateful to comments made by participants of the 1997 EFA meetings in Vienna and the 1998 AFA meetings in Chicago, and by seminar participants at INSEAD, the Norwegian School of Management, and the Stockholm School of Economics. The last author thanks the Humbold Universität zu Berlin for its hospitality during a time when part of this research was carried out. THE JOURNAL OF FINANCE • VOL. LVI, NO. 2 • APRIL 2001 721

Welcome message from author
This document is posted to help you gain knowledge. Please leave a comment to let me know what you think about it! Share it to your friends and learn new things together.
Transcript

Testing for Mean-Variance Spanning with ShortSales Constraints and Transaction Costs:
The Case of Emerging Markets
FRANS A. DE ROON, THEO E. NIJMAN, and BAS J. M. WERKER*
ABSTRACT
We propose regression-based tests for mean-variance spanning in the case whereinvestors face market frictions such as short sales constraints and transactioncosts. We test whether U.S. investors can extend their efficient set by investing inemerging markets when accounting for such frictions. For the period after themajor liberalizations in the emerging markets, we find strong evidence for diver-sification benefits when market frictions are excluded, but this evidence disap-pears when investors face short sales constraints or small transaction costs. Althoughsimulations suggest that there is a possible small-sample bias, this bias appears tobe too small to affect our conclusions.
THE QUESTION OF WHETHER OR NOT an investor can extend his efficient set byincluding additional assets in his portfolio has recently received consider-able attention in the literature. If extension of the efficient set is not possi-ble for a specific mean-variance utility function, the mean-variance frontierof the benchmark assets and of the benchmark assets plus the additionalassets intersect, that is, they have one point in common. If extension of theefficient set is not possible for any mean-variance utility function, the mean-variance frontier of the initial assets spans the frontier of the larger set ofthe initial assets plus the additional assets. These concepts are discussed byHuberman and Kandel ~1987!, who propose regression-based tests of thehypotheses of spanning and intersection for mean-variance investors. It iswell known by now that a shift in the mean-variance frontier from addingassets to the investment opportunity set is tantamount to a shift in thevolatility bounds of the kernels that price the assets under consideration~e.g., DeSantis ~1994! and Bekaert and Urias ~1996!! and that the issue isalso very closely related to performance evaluation ~see, e.g., Jobson and
* De Roon is from Erasmus University Rotterdam and CEPR, Nijman and Werker are fromTilburg University. Geert Bekaert, Feico Drost, Bruno Gerard, Pierre Hillion, Erzo Luttmer,Bertrand Melenberg, René Stulz ~the editor!, and an anonymous referee have provided manyhelpful comments and suggestions. We are also grateful to comments made by participants ofthe 1997 EFA meetings in Vienna and the 1998 AFA meetings in Chicago, and by seminarparticipants at INSEAD, the Norwegian School of Management, and the Stockholm School ofEconomics. The last author thanks the Humbold Universität zu Berlin for its hospitality duringa time when part of this research was carried out.
THE JOURNAL OF FINANCE • VOL. LVI, NO. 2 • APRIL 2001
721

Korkie ~1988! and Chen and Knez ~1996!!. DeRoon, Nijman, and Werker~1997a! show how tests for spanning can be extended to allow for other util-ity functions, and to allow for the presence of nonmarketable risks.
Tests for intersection and spanning have been applied to numerous prob-lems in the finance literature. A crucial assumption in almost all these ap-plications is the absence of market frictions such as short sales restrictionsand transaction costs. However, for many investors such frictions are im-portant facts of life. The aim of this paper is to extend the tests for mean-variance spanning and intersection to take these market frictions into account.
The presence of transaction costs and short sales constraints is perhapsmost predominant in the case of emerging markets. Using the EmergingMarkets Data Base ~EMDB! of the International Finance Corporation ~IFC!,both DeSantis ~1994! and Harvey ~1995! show that the mean-variance fron-tier that is based on well-developed Western markets only significantly shiftsoutward when the emerging markets are included. However, these resultspresuppose that there are no transaction costs or any other market frictionsfor both the developed and the emerging markets. Bekaert and Urias ~1996!try to overcome this problem using returns on closed-end country funds,because the returns on these funds are attainable to investors. Based onemerging market country funds, Bekaert and Urias find only mixed evi-dence for the diversification benefits of emerging markets. Although the useof country funds adjusts for the effect of transaction costs and short salesconstraints that investors face in emerging markets, it does not account forshort sales constraints and transaction costs on the country funds them-selves or on the benchmark assets.
Using industry portfolios, multinational corporation stocks, closed-end coun-try funds, and American depository receipts, Errunza, Hogan, and Hung ~1999!show that U.S. investors can create mimicking portfolios from U.S.-tradedsecurities that are highly correlated with the IFC emerging markets indices.Their spanning tests show that for five out of the nine emerging marketsthat they study, direct investments in the emerging markets provide signif-icant diversification benefits beyond diversified portfolios created from U.S.-traded securities. Errunza et al. ~1999! do not consider short sales constraintsor transaction costs on either the emerging markets or the U.S.-traded secu-rities. Note that the effect of transaction costs will probably be smaller forthe U.S.-traded securities than for the emerging markets, but that shortsales constraints may cause the diversification benefits from direct invest-ments in the emerging markets to be even stronger than suggested by theresults of Errunza et al. ~1999!.
We provide direct evidence on the effect of transaction costs and shortselling constraints on the diversification benefits of emerging markets byusing the same IFC indices as in DeSantis ~1994! and Harvey ~1995!, butincorporating these market frictions in our testing methodology. If frictionsare ignored, we find that there are significant diversification benefits fromadding emerging markets to an international stock portfolio that invests inthe United States, Europe, and Japan. The evidence in favor of these diver-
722 The Journal of Finance

sification benefits disappears when we take short sales constraints and in-vestability restrictions into account, because in this case, for the threegeographical regions, the hypothesis of spanning cannot be rejected. Thiseffect is mainly due to the short sales constraints for the emerging marketsand not to the short sales constraints on the benchmark assets. Also, withan investment horizon of six months and round trip costs of 0.5 percent onthe benchmark assets, we find that significant diversification benefits frominvesting in the emerging markets are absent with only small transactioncosts on the emerging markets. Although our simulations suggest that thereis a possible small-sample bias in the asymptotic test, the magnitude of thebias appears to be small.
The plan of this paper is as follows. In Section I we, first of all, formulatethe hypotheses of mean-variance spanning and intersection in the case ofshort sales restrictions. Regression-based tests for these hypotheses are pro-posed in Section II. The empirical results on investing in emerging marketsare presented in Section III and in the final section we give some concludingremarks.
I. Mean-variance Spanning With Short Sales Constraints
Consider a set of K assets, whose gross returns are given by the vectorRt11. Investors can hold portfolios w [ C , IRK such that w 'iK 5 1, whereiK is a K-vector containing only ones. The set of returns available to inves-tors is therefore given by
X 5 $Rt11p : Rt11
p 5 w 'Rt11, w [ C, and w 'iK 5 1%.
In case there are no market frictions, we have C 5 IRK. If, in addition, theLaw of One Price holds, there exists a stochastic discount factor Mt11 suchthat
E @Mt11Rt116It # 5 iK , ~1!
where It denotes the information set that is available to investors at time t~see, e.g., Duffie ~1996!!. In this paper, we will restrict ourselves to uncon-ditional versions of equation ~1! and to unconditional mean-variance span-ning. Extensions of our results to the conditional case are straightforwardhowever ~see, e.g., DeSantis ~1994! and DeRoon et al. ~1997a!!. The stochas-tic discount factor m~v!t11 that has expectation v and that corresponds to amean-variance utility function, is a linear function of the asset returns:
m~v!t11 5 v1 a '~Rt11 2 E @Rt11# !, ~2a!
a 5 Var@Rt11#21~iK 2 vE @Rt11# !. ~2b!
Short Sales Constraints and Transaction Costs 723

From Hansen and Jagannathan ~1991! we know that the discount factorgiven in equation ~2! has the lowest variance of all stochastic discount fac-tors with expectation v, that price Rt11 correctly. It is also well known thatw 5 a0~a 'iK ! is a mean-variance efficient portfolio that has a zero-beta re-turn equal to 10v.
Now consider the presence of market frictions such as short sales con-straints and transaction costs. These can be dealt with by letting C be aparticular subset of IRK and0or by adjusting the vector of returns Rt11 toref lect the frictions. In case of short sales constraints, C 5 IR1
K , the nonneg-ative part of IRK.1 When there are short sales constraints on the portfolioholdings, the condition in equation ~1! must be replaced by
E @m~v!t11Rt11# # iK , ~3!
where the inequality sign applies componentwise.The mean-variance efficient frontier without short sales can be found by
solving the problem
max$w%
w 'E @Rt11# 2 212gw ' Var@Rt11#w,
~4!
s.t. w 'iK 5 1 and wi $ 0, ∀i,
where g is the coefficient of risk aversion. From the Kuhn-Tucker condi-tions, mean-variance efficient portfolios w* satisfy
E @Rt11# 2 hiK 1 d 5 g Var@Rt11#w*,
wi* , di $ 0, ∀i, ~5!
di wi* 5 0, ∀i.
The vector d contains the Kuhn-Tucker multipliers for the restrictions thatthe portfolio weights are nonnegative. The Lagrange multiplier for the re-striction that w 'iK 5 1 is equal to h, the intercept of the line that is tangentto the mean-variance frontier in mean-standard deviation space.
Now take the mean-variance efficient portfolio for which h 5 10v, with vthe expectation of a stochastic discount factor that prices Rt11 correctly sub-ject to short sales constraints. Denote by Rt11
~v! the L-dimensional subvectorof Rt11 that only contains the returns of the assets for which the short salesconstraints in equation ~5! are not binding and let superscripts ~v! refer tothis subset. It is straightforward to show that the mean-variance efficient
1 More generally, if we have a vector of lower bounds w0 on the portfolio weights, then wehave that w $ w0 and w 2 w0 [ IR1
K.
724 The Journal of Finance

portfolio in equation ~5! is equal to the mean-variance efficient portfoliowithout short sales constraints of the assets in Rt11
~v! only ~see, e.g., Marko-witz ~1991!!:
E @Rt11~v! # 2
1
viL 5 g~v! Var@Rt11
~v! #w ~v! and
~6!
E @Rt11# 21
viK 1 d 5 g~v! Cov@Rt11,Rt11
~v! #w ~v!,
where Cov@Rt11,Rt11~v! # is the K 3 L-dimensional covariance matrix of Rt11
and its subvector Rt11~v! .
Because the mean-variance stochastic discount factor is a linear functionof the mean-variance efficient portfolio, in case of short sales restrictions,the mean-variance stochastic discount factor that prices Rt11, mR~v!t11, isequal to
mR~v!t11 5 v1 a ~v!'~Rt11~v! 2 E @Rt11
~v! # !,~7!
a ~v! 5 Var@Rt11~v! #21~iL 2 vE @Rt11
~v! # !.
It is not hard to show that the stochastic discount factor as defined in equa-tion ~7! has the lowest variance of all pricing kernels that price Rt11 cor-rectly, subject to short sales constraints. Therefore, in case of short salesconstraints, the duality between mean-variance frontiers and volatility boundsstill holds.
Next consider a set of N additional assets with return vector rt11 besidesthe set of K benchmark assets with return vector Rt11. Mean-variance span-ning of the assets rt11 by the benchmark assets Rt11 occurs if the mean-variance stochastic discount factors that price Rt11 correctly also price rt11,that is, if
E @mR~v!t11rt11# # iN , ~8!
holds for all values of v. Substituting equation ~7! into equation ~8!, this isequivalent to
vE @rt11# 1 Cov@rt11,Rt11~v! #Var@Rt11
~v! #21~iL 2 vE @Rt11~v! # ! # iN . ~9!
The inequality sign in equation ~8! ref lects the fact that there are shortsales constraints on rt11. In the absence of short sales constraints on rt11,the inequality becomes an equality. If there is only one value of v for whichequation ~8! holds, then there is intersection.
Short Sales Constraints and Transaction Costs 725

When taking transaction costs into account, it is useful to differentiatebetween the return on a long position in asset i, ti
, Ri, t11, and the return ona short position in asset i, ti
s Ri, t11 ~see, e.g., Luttmer ~1996!!. Let ERt11 be a2K-dimensional vector, the first K elements of which are the returns on thelong positions in the assets i 5 1, . . . , K, and the last K elements of whichare the returns on the short positions in these same assets. Thus, ERi, t11 5ti
, Ri, t11 and ERi1K, t11 5 tis Ri, t11. Considering ERt11 as the vector of returns
on 2K different assets, transaction costs can now be handled by requiringthat investors cannot go short in the first K assets ~C 5 IR1
K ! and cannotgo long in the last K assets ~C 5 IR2
K !. Let KmR~v!t11 be the mean-variancestochastic discount factor that prices ERt11 correctly and let ERt11
~v! be theL-dimensional subvector of ERt11 for which the constraints on the short andlong positions are not binding. The notation is therefore analogous to thecase of short sales constraints only. The mean-variance stochastic discountfactor is now given by2
KmR~v!t11 5 v1 Ia ~v!'~ ERt11~v! 2 E @ ERt11
~v! # !,~10!
Ia ~v! 5 Var@ ERt11~v! #21~iL 2 vE @ ERt11
~v! # !.
In a similar way, we consider long and short positions in the N additionalasset as 2N different assets. The returns on long positions in the additionalassets are given by ~ Irt11
, !k 5 tk, rk, t11, k 5 1,2,..., N, and the returns on short
positions are given by ~ Irt11s !k 5 tk
s rk, t11, k 5 1,2,..., N. The returns on theadditional assets are then spanned by the benchmark assets if
E @ KmR@ j #~v!t11 Irt11
, # # iN , ∀j,~11!
E @ KmR@ j #~v!t11 Irt11
s # $ iN , ∀j.
II. Testing for Intersection and Spanning
Absent short sales constraints and any other market frictions, the hypoth-eses of mean-variance intersection and spanning are equivalent to the con-dition that
E @mR~v!t11rt11# 5 iN , ~12!
for one value of v ~intersection! or for all values of v ~spanning!. It is wellknown that in this case tests for intersection and spanning can be based onthe regression
rt11 5 a 1 BRt11 1 «t11, ~13!
2 In the portfolio problem with transaction costs, agents are prevented from taking simul-taneous short and long positions in one asset, which would effectively create a long position ina risk-free asset with a negative return. Therefore, Var@ ERt11
~v! # is a nonsingular matrix.
726 The Journal of Finance

with E @«t11# 5 0 and E @«t11Rt11' # 5 0. Intersection for a given value of v
implies that av1 ~BiK 2 iN ! 5 0, and spanning implies that a 5 0 and BiK 2iN 5 0 ~Huberman and Kandel ~1987!, Bekaert and Urias ~1996!!. Alterna-tively, GMM tests can be used to test for intersection and spanning ~DeSantis~1994!, Hansen, Heaton, and Luttmer ~1995!, Chen and Knez ~1996!!. Asshown in the previous section, if there are short sales restrictions on thebenchmark assets Rt11, the stochastic discount factor mR~v!t11 is a linearfunction of Rt11
~v! only, and if there are short sales restrictions on the addi-tional assets rt11, then the equality in equation ~12! becomes an inequality.For a given value of v, the restrictions implied by intersection are given inequation ~9!. These restrictions are equivalent to the restrictions that in theregression
rt11 5 a~v! 1 B~v!Rt11~v! 1 «t11
~v! , ~14!
it holds true that
va~v! 1 ~B~v!iL 2 iN ! # 0. ~15!
Intuitively, since in case of short sales constraints, the mean-variance effi-cient portfolio of Rt11 for a given value of v consists of positions in only thoseassets for which the constraints are not binding, intersection requires thatthere is intersection at the unrestricted frontier of Rt11
~v! .A Wald test can be used to test the inequality constraints in equation ~15!
~see, e.g., Kodde and Palm ~1986!!. Denote the left hand side of equation ~15!as vaJ ~v!, where aJ ~v! is the N-dimensional vector of Jensen’s alphas ofthe assets rt11 relative to the mean-variance efficient portfolio of Rt11
~v! withzero-beta return 10v. The sample equivalent of aJ ~v! is [aJ ~v!, and the esti-mated N 3 N covariance matrix of [aJ ~v!, Var@ [aJ ~v!# , can be obtained fromthe restricted covariance matrix of the OLS-estimates of equation ~14!, wherethe restrictions are given by va~v! 1 ~B~v!iL 2 iN ! 5 0. Following Kodde andPalm ~1986!, under the null hypothesis and standard regularity conditions,the test statistic
j~v! 5 min$aJ ~v!#0%
~ [aJ ~v! 2 aJ ~v!!' Var@ [aJ ~v!#21~ [aJ ~v! 2 aJ ~v!!, ~16!
is asymptotically distributed as a mixture of x2 distributions. For the caseconsidered here, where we test whether there is intersection for the N assetsrt11, the probability of j~v! exceeding a given value c is, under the nullhypothesis, given by ~see, e.g., Kodde and Palm ~1986!!
Pr$j~v! $ c% 5 (i50
N
Pr$xi2 $ c%w~N, i,Var@ [aJ ~v!# !, ~17!
Short Sales Constraints and Transaction Costs 727

where w~N, i,Var@ [aJ # ! are probability weights.3 Given the estimated covari-ance matrix Var@ [aJ ~v!# , the probabilities can be determined using numericalsimulation, as proposed by Gouriéroux, Holly, and Montfort ~1982!. Alterna-tively, without calculating the weights, Kodde and Palm ~1986! give expres-sions for an upper and a lower bound on the p values of j~v!.
Of course, when implementing the intersection test in empirical applica-tions, it is usually the case that for a particular value of v, we do not observewhich assets are in Rt11
~v! , but have to derive this information from the assetreturns in our sample. It is shown in the Appendix that this does not affectthe limit distribution of the Wald test statistic for the restrictions in equa-tion ~15! however, if v corresponds to an efficient portfolio where none of theweights in w ~v! is exactly zero ~i.e., wi
*5 0 and di . 0!. If this latter situationoccurs, then it is easily verified that the size of the test ~conditional on Rt11
~v! !does not depend on Rt11
~v! , and hence the unconditional size equals the onechosen, which shows the validity of our test.
Glen and Jorion ~1993! propose a test for intersection with short salesconstraints based on the difference in Sharpe ratios4 of the benchmark as-sets and the total set of assets. Unlike the test statistic in equation ~16!however, their test does not yield a known distribution. Apart from this, ourprocedure has the advantage that we avoid the assumption that one of theassets is riskless and that the test can also be used to test for spanning.
Up to now, we considered tests for intersection. Spanning implies that therestrictions in equation ~15! hold for all relevant values of v. Notice that fora given set of K asset returns Rt11, there is only a finite number of subsetswith L~v! elements, L~v! [ $1,2,..., K % , with Rt11
~v! the L~v!-dimensional vectorcontaining the returns on the subset of the assets. Let V @ j # be the set ofthose values of v for which the subset of assets for which the short salesconstraints in the mean-variance efficient portfolios are not binding is thesame, and denote the L@ j #-dimensional vector of returns for these assets asRt11
@ j # , that is, Rt11@j# 5 Rt11
~v! if and only if v [ V @ j #. Similarly, each variable orparameter that refers to the set Rt11
@ j # will be denoted with a superscript @ j #.Because for v [ V @ j # the mean-variance efficient frontier of Rt11 coincideswith the mean-variance frontier of Rt11
@ j # , the mean-variance frontier of Rt11with short sales constraints consists of a finite number of parts of the un-restricted mean-variance frontiers of the subsets Rt11
@ j # . It follows that thereturn on the additional assets rt11 are spanned by the returns on the bench-mark assets Rt11 if
E @mR@ j #~v!t11rt11# # iN , ∀j, ~18!
3 The weights w~N, i,Var@ [aJ # ! are the probabilities that ~N 2 i ! of the N elements of a vectorwith a N~0,Var@ [aJ # ! distribution are strictly negative.
4 In fact, the test statistic in equation ~16! can also be expressed in terms of Sharpe ratios.For details, see DeRoon, Nijman, and Werker ~1997b!.
728 The Journal of Finance

where mR@ j #~v!t11 is the mean-variance pricing kernel with expectation v that
is linear in Rt11@ j # . If there are only short sales constraints on the benchmark
assets Rt11 and not on the additional assets rt11, the inequality in equation~18! becomes an equality. If there are only short sales constraints on rt11
and not on Rt11, Rt11@ j # 5 Rt11.
If there are short sales constraints, then the mean-variance frontier ofRt11 consists of parts of the unrestricted mean-variance frontiers of the sub-sets of returns Rt11
@ j # , j 5 1,2, . . . , M, and rt11 can only be spanned by thereturns Rt11 if it is spanned by the M subsets of Rt11. If there are also shortsales restrictions on rt11, then the conditions in equation ~18! imply thatthere is mean-variance spanning if and only if in the M regressions
rt11 5 a@ j # 1 B@ j #Rt11@ j # 1 «t11
@ j # , ~19a!
a@ j #v1 B@ j #i@ j # # iN , for all v[ V @ j #. ~19b!
where i@ j # is an L@ j #-dimensional vector consisting of ones. The hypothesisthat there is spanning can therefore easily be tested by using a multivariateregression of rt11 on all Rt11
@ j # and using a Wald test for the restrictions ineach of these regressions. Denoting vmin
@ j # 5 minv[V @ j # v, and vmax@ j # 5 maxv[V @ j # v,
the restrictions in equation ~19b! are satisfied if there is intersection for vmin@ j #
and for vmax@ j # , because in that case, there is also intersection for all the in-
termediate values of v @ j #. Therefore, testing for spanning comes down tojointly testing the restrictions:
a@ j #vmin@ j # 1 B@ j #i@ j # # iN ,
~20!
a@ j #vmax@ j # 1 B@ j #i@ j # # iN ,
for j 5 1, . . . , M. Again, a Wald test statistic for the inequality restrictions inequation ~20! is asymptotically distributed as a mixture of x2 distributions.With transaction costs, testing for intersection or spanning is completelyanalogous to the case of short sales constraints, except that we have to takeinto account both negativity and positivity constraints.
The total range of v can be limited beforehand. An upper bound on v isobtained if we do not impose the requirement that investors should investall their wealth in the available assets, but may choose to invest only part oftheir wealth, that is, 0 # w 'i # 1 ~see also Luttmer ~1996!!. In effect, thisallows for the possibility of taking long positions in a risk-free asset withzero net return. This implies that the upper bound for v is 1. If we moveupward along the mean-variance frontier, v decreases until 10v equals theintercept of the asymptote of the lines tangent to the mean-variance fron-tier. This intercept is equal to the expected return on the global minimum
Short Sales Constraints and Transaction Costs 729

variance portfolio, E @Rt11GMV# , implying that the lower bound on v is given by
v 5 10E @Rt11GMV# . Of course, these boundaries have to be adjusted in case
there are short sales constraints and0or transaction costs on the benchmarkassets Rt11.
The intersection and spanning tests presented here are closely related tothe region subset test in Hansen et al. ~1995!, which is essentially a test forintersection. Hanson et al. ~1995! estimate the minimum variance stochasticdiscount factor m~v!t11 under nonnegativity constraints ~which induces anonstandard limit distribution!, in which case they end up with testing equal-ity restrictions. On the other hand, our regression-based estimator is un-restricted with a standard asymptotic distribution, but we end up with moredifficult inequality restrictions that have to be tested. This latter problem iswell studied in the literature, however ~see, e.g., Gouriéroux et al. ~1982!and Kodde and Palm ~1986!!.5
To have an indication of the power of the spanning test with short salesconstraints, Figure 1 presents the power as a function of the intercept a @ j # inthe spanning regression ~19a!. The figure contains the power function forthe Wald spanning test statistics in the case where there are no frictions, inthe case where there are short sales constraints for the new asset rt11 only,and in the case where there are short sales constraints for both the newassets as well as for the benchmark assets. When there are short sales con-straints on the benchmark assets, the test depends on the benchmark assetsthat are included in the segments, and hence the power function for the caseof short sales constraints on all assets is shown when the elements in R@ j #
are known as well as when they have to be estimated. The slope parametersare chosen such that in the case of short sales constraints, our test hasmaximum rejection probability in the null if the intercept a @ j # is equal tozero.
For each value of a @ j #, the small-sample power is derived from a series of1,000 simulations. In addition, for the case of no short sales, we also add thetheoretical power of the spanning test, which may serve as a benchmark forthe other tests.6 For each simulation, 10 years of monthly data are generatedand the empirical power for a size of 5 percent is determined. The bench-mark indices are assumed to be the three stock indices used in the empiricalapplication in Section III, where the data generating process for these indi-ces is based on the summary statistics in Table II, assuming multivariatenormality. For the new asset, the monthly standard deviation of the residual«t11 in equation ~19a! is 10 percent, which is representative for the emergingmarkets that are analyzed in Section III. The figure plots the power forsmall values of a @ j #, because these appear to be the most relevant ones inthe empirical application. Notice that a @ j # , 0, which is tantamount to a
5 A detailed comparison between our test and the region subset test proposed by Hansenet al. ~1995! is provided in DeRoon et al. ~1997b!. This comparison can be obtained from theauthors upon request.
6 We thank the referee for making this suggestion.
730 The Journal of Finance
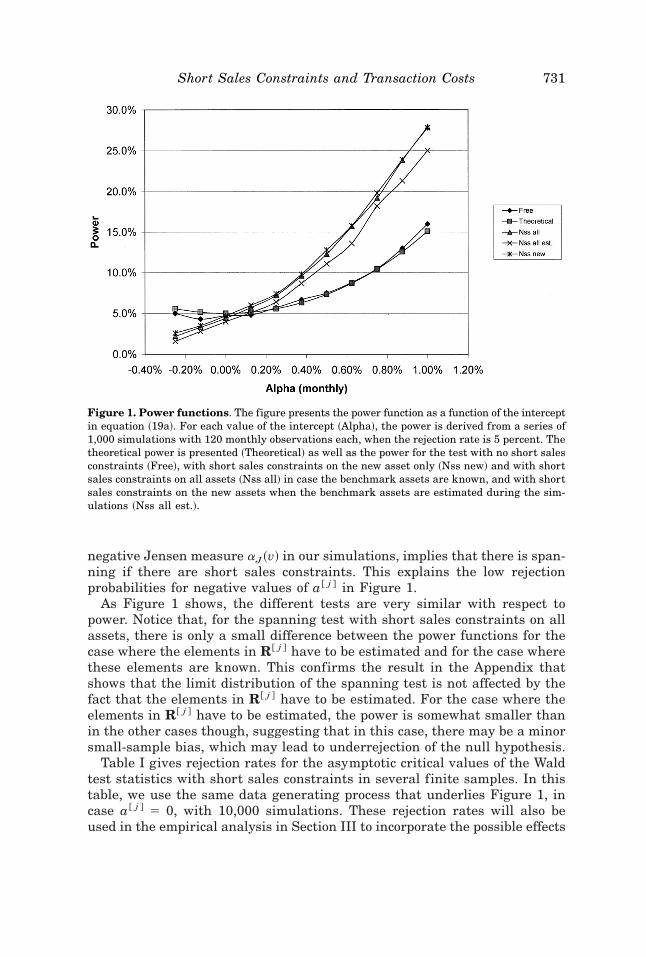
negative Jensen measure aJ~v! in our simulations, implies that there is span-ning if there are short sales constraints. This explains the low rejectionprobabilities for negative values of a @ j # in Figure 1.
As Figure 1 shows, the different tests are very similar with respect topower. Notice that, for the spanning test with short sales constraints on allassets, there is only a small difference between the power functions for thecase where the elements in R@ j # have to be estimated and for the case wherethese elements are known. This confirms the result in the Appendix thatshows that the limit distribution of the spanning test is not affected by thefact that the elements in R@ j # have to be estimated. For the case where theelements in R@ j # have to be estimated, the power is somewhat smaller thanin the other cases though, suggesting that in this case, there may be a minorsmall-sample bias, which may lead to underrejection of the null hypothesis.
Table I gives rejection rates for the asymptotic critical values of the Waldtest statistics with short sales constraints in several finite samples. In thistable, we use the same data generating process that underlies Figure 1, incase a @ j # 5 0, with 10,000 simulations. These rejection rates will also beused in the empirical analysis in Section III to incorporate the possible effects
Figure 1. Power functions. The figure presents the power function as a function of the interceptin equation ~19a!. For each value of the intercept ~Alpha!, the power is derived from a series of1,000 simulations with 120 monthly observations each, when the rejection rate is 5 percent. Thetheoretical power is presented ~Theoretical! as well as the power for the test with no short salesconstraints ~Free!, with short sales constraints on the new asset only ~Nss new! and with shortsales constraints on all assets ~Nss all! in case the benchmark assets are known, and with shortsales constraints on the new assets when the benchmark assets are estimated during the sim-ulations ~Nss all est.!.
Short Sales Constraints and Transaction Costs 731

of a small-sample bias. The first three columns of Table I show the rejectionprobabilities in finite samples using the asymptotic critical values, in thecase where there are only short sales constraints on the new asset. Fromthese numbers, it appears that the rejection rates in finite samples arealmost indistinguishable from the asymptotic rejection rates. Therefore, inthis case there does not seem to be a small-sample bias, and we can usethe asymptotic test with confidence, even in samples as small as five yearsof monthly data. The last three columns show similar rejection rates in thecase where there are short sales constraints on both the new asset and thebenchmark assets. Here the elements R@ j # are not assumed to be known,but have to be estimated. For this case, there does seem to be a possiblesmall-sample bias. The rejection rates are always smaller than the asymp-totic ones and appear to be increasing monotonically with the sample size.The bias appears to be small, though, and for sample sizes of 10 years ofmonthly data, the rejection rates are close enough to the asymptotic onesfor the test to be used with confidence. For the empirical analysis inSection III the large sample properties of the tests appear to be suffi-ciently informative, as the small-sample adjustment does not alter any ofthe conclusions.
III. Empirical Results for Emerging Markets
A. Data
We use 17 indices from the Emerging Markets Data Base of the Inter-national Finance Corporation. Monthly observations on the Global Indicesare available over the period of January 1985 until June 1996, for six Latin
Table I
Simulated Rejection Rates of the Wald Test StatisticsThe table contains the rejection rates in finite samples of the Wald test statistics for spanningfor several significance levels. p values are given for the spanning test when there are shortsales constraints on the new assets only ~nss new! and when there are short sales constraintson both the new assets and the benchmark assets ~nss all!. When there are short sales on allassets, the relevant subsets from the benchmark assets where the short sales constraints arenot binding are estimated during the simulation. The p values are derived form a series of10,000 simulations with 5, 10, 25, or 50 years of monthly data. The simulation assumes that thenew asset is spanned by the three benchmark assets which are given in Table II.
nss new nss all
Significance 0.100 0.050 0.010 0.100 0.050 0.010
5 years 0.099 0.050 0.011 0.083 0.042 0.00810 years 0.096 0.050 0.009 0.089 0.044 0.00825 years 0.100 0.051 0.010 0.092 0.046 0.01050 years 0.097 0.049 0.010 0.097 0.049 0.009
732 The Journal of Finance

American countries, seven Asian countries, one European, one Middle Eastern,and two African countries. The Morgan Stanley Capital International ~MSCI!Indices for the United States, Europe, and Japan serve as the benchmarkassets. The dataset is therefore very similar to the ones used by DeSantis~1994! and Harvey ~1995!. For all these indices we use ~unhedged! monthlyholding returns in U.S. dollars. The indices for both the emerging marketsand for the developed markets are calculated with dividends reinvested. Alldata are obtained from Datastream.
Bekaert et al. ~1998! provide ample indications that the behavior of theemerging market returns might have been changing over time. One impor-tant reason for this is the many liberalizations that have taken place in theemerging markets ~see, e.g., Bekaert ~1995!!, causing the emerging marketsto become more integrated with the developed markets. Therefore, we focuson the diversification benefits that are offered by the emerging markets forthe postliberalization periods only. Starting dates for the emerging marketsdata that we used ~if different from January 1985! are given in Panel B ofTable II. Results for the regions Latin America, Asia, and “Other” are basedon data since the last liberalization in that region.
Some basic summary statistics for net monthly holding returns are givenin Table II. Table II provides summary data on the three benchmark indicesas well as for the emerging markets. In this table and the following, theemerging markets are organized according to their geographical region: LatinAmerica, Asia, and Other. A quick look at the data reveals that the emergingmarkets indices are usually much more variable than the benchmark indi-ces, but also have somewhat higher average returns. For the monthly hold-ing returns we use, the average standard deviation of the emerging marketsindices is 10.43 percent and the average expected return is 1.82 percent,compared with 5.54 percent and 1.46 percent for the benchmark indices.Also notice that there is substantial cross-sectional variation in the averagereturns of the emerging markets. The average correlation of the emergingmarkets with the developed markets ~not reported in Table II! is only 0.09whereas the correlation between the developed markets themselves is ashigh as 0.33.
B. Results for Spanning Tests With Short Sales Constraints
Based on the summary statistics, it may be conjectured that, in the ab-sence of market frictions, many emerging markets yield diversification ben-efits relative to the benchmark indices for the United States, Europe, andJapan. Table III shows Wald test statistics for the hypothesis that the re-turns on these three indices span the returns for each emerging market. Foreach group, the first line shows the spanning test statistic and the associ-ated p value in case there are no short sales restrictions on any asset. Thejoint tests for spanning for all the emerging markets within a geographicalgroup show that spanning is always rejected at any confidence level. Theseresults merely confirm the findings of, for instance, DeSantis ~1994! and
Short Sales Constraints and Transaction Costs 733

Harvey ~1995!, as well as those of Errunza et al. ~1999!. As noted before,however, the diversification benefits suggested by the first line in Table IIImay not be attainable to investors, because they may require short selling ofthe emerging markets indices, the benchmark indices, or both.
If we do not allow investors to go short in the emerging markets, whilestill retaining the possibility to sell the benchmark indices short, the con-clusions are very different. The joint tests for spanning for Latin Americaand Asia no longer reject the null hypothesis in this case. It is only for thegroup Other that we still find significant diversification benefits from emerg-ing markets. Notice that for the individual countries, the p values are oftensmaller than in the no-frictions case, because now a one-sided null distribution
Table II
Summary StatisticsPanel A provides summary statistics for monthly dollar returns on the MSCI Indices that serveas the benchmark assets. Panel B provides summary statistics for the IFC Emerging MarketsData Base. The overall sample period is January 1985 until June 1996, giving a total of 138observations. For the emerging markets, if major liberalizations occurred in this period, onlythe postliberalization periods as indicated in the last column of Panel B are used.
Panel A: Benchmark Assets ~January 1985–June 1996!
Avg. ~%! St. Dev. ~%!
United States 1.38 4.16Europe 1.58 4.91Japan 1.43 7.55
Panel B: Emerging Markets ~Postliberalization Periods!
Avg. ~%! St. dev. ~%! Liberalization
Latin AmericaArgentina Arg 3.16 17.42 Dec 1989Brazil Bra 2.91 14.12 Jul 1991Chile Chi 2.59 7.80 Apr 1990Colombia Col 3.18 11.33 Feb 1991Mexico Mex 1.96 9.92 May 1989Venezuela Ven 0.29 13.39 Dec 1990
AsiaIndia Ind 0.58 8.66 Nov 1992Korea Kor 0.49 7.68 Jan 1992Malaysia Mal 1.37 7.64 —Pakistan Pak 1.93 9.93 Feb 1991Philippines Phi 2.44 8.39 Nov 1991Taiwan Tai 1.47 11.22 Jan 1991Thailand Tha 2.39 8.69 —
OtherGreece Gre 2.11 11.81 —Jordan Jor 0.64 4.86 —Nigeria Nig 1.69 15.27 —Zimbabwe Zim 2.51 9.21 —
734 The Journal of Finance

Table III
Spanning Tests with Short Sales ConstraintsThe table presents test results for the hypothesis that there is mean-variance spanning ofemerging markets by three benchmark assets, which are the MSCI indices for the United States,Europe, and Japan, after liberalizations in the emerging markets have taken place. For eachemerging market, results are shown for the period after liberalization of the stock market hastaken place, as reported in Table II. If there is no liberalization during the sample period, theentire sample from January 1985 until June 1996 is used. The numbers in the table are Waldtest statistics. The numbers in parentheses are p values associated with the asymptotic distri-bution of the Wald test statistics.
Panel A: Latin America
Arg Bra Chi Col Mex Ven All
No restrictionsWald 2.12 2.28 4.38 5.14 1.02 1.85 18.12~ p! ~0.347! ~0.320! ~0.112! ~0.077! ~0.599! ~0.397! ~0.000!
No short sales of emerging marketsWald 0.76 0.85 3.52 4.01 0.93 0.01 5.60~ p! ~0.221! ~0.242! ~0.036! ~0.031! ~0.201! ~0.524! ~0.163!
@**# @**#No short sales
Wald 0.27 0.40 3.51 4.01 0.85 0.01 5.03~ p! ~0.606! ~0.298! ~0.061! ~0.026! ~0.194! ~0.480! ~0.148!
@**# @**#Investable indices, no short sales
Wald 0.27 0.38 3.94 4.43 0.95 3.78 5.57~ p! ~0.603! ~0.301! ~0.047! ~0.023! ~0.170! ~0.026! ~0.127!
@**# @**#
Panel B: Asia
Ind Kor Mal Pak Phi Tai Tha All
No restrictionsWald 3.16 3.33 0.74 4.42 3.19 1.31 4.60 16.50~ p! ~0.206! ~0.189! ~0.689! ~0.110! ~0.203! ~0.520! ~0.100! ~0.000!
No short sales of emerging marketsWald 0.12 0.12 0.05 1.95 2.72 0.70 3.28 1.33~ p! ~0.433! ~0.436! ~0.481! ~0.112! ~0.065! ~0.249! ~0.044! ~0.633!
@*# @**#No short sales
Wald 0.12 0.13 0.05 1.67 2.67 0.55 3.25 1.30~ p! ~0.451! ~0.404! ~0.680! ~0.094! ~0.068! ~0.226! ~0.082! ~0.655!
@**# @**#Investable indices, no short sales
Wald 0.21 0.18 0.97 2.03 1.63 0.53 0.61 3.11~ p! ~0.403! ~0.369! ~0.329! ~0.088! ~0.114! ~0.236! ~0.429! ~0.362!
@*#
Panel C: Other
Gre Jor Nig Zim All
No restrictionsWald 4.28 76.37 4.29 24.29 105.07~ p! ~0.118! ~0.000! ~0.117! ~0.000! ~0.000!
No short sales of emerging marketsWald 1.59 1.09 0.83 8.38 11.16~ p! ~0.125! ~0.186! ~0.227! ~0.001! ~0.013!
@***# @**#No short sales
Wald 1.58 1.08 0.83 8.31 11.08~ p! ~0.227! ~0.312! ~0.387! ~0.006! ~0.036!
@***# @**#Investable indices, no short sales
Wald 1.59 1.02 NA 3.21 3.25~ p! ~0.240! ~0.334! NA ~0.105! ~0.391!
@**#
Significance levels based on simulated test statistics are given in square brackets: * 5 10percent, ** 5 5 percent, *** 5 1 percent. NA 5 Not available.
Short Sales Constraints and Transaction Costs 735

is the relevant one. For some individual countries, like Chile and Colombia,the outward shift of the estimated mean-variance frontier is big enough toreject the null hypothesis of spanning. For individual countries, the 5 per-cent critical value of the test statistic is determined by the x1
2 distribution.Even though the estimated outward shift that results from adding all sixLatin American countries is even bigger, the joint test shows that this shiftis not big enough for the resulting test statistic to exceed the 5 percentcritical value, which is now determined by a mixture of xi
2 distributions,with i 5 1,2, . . . ,6. A similar situation occurs for the Asian markets.7 For bothLatin America and Asia, the estimated diversification benefits mainly resultfrom one or two countries only. There is too much sampling error in the datafor the diversification benefits to show up in the joint tests. This also showsup in the estimated mean-variance efficient portfolio weights, which showthat in case of short sales constraints, investors would mainly like to investin Chile and Colombia ~for Latin America! or in the Philippines ~for Asia!.These results can be obtained from the authors upon request. Finally, theuse of the p values that are adjusted for small-sample bias as reported inTable I ~and from similar simulation results for the joint tests! does not alterany of the conclusions.
It may be the case though, that the diversification benefits offered by theemerging markets depend on whether or not the portfolio of the benchmarkassets contains short positions. To account for short sales restrictions on thebenchmark assets as well, Table III also presents spanning tests in the casewhere there are short sales restrictions on both the emerging markets andthe benchmark assets. These results are presented in the third line for eachgeographical group in Table III. Adding short sales constraints on the bench-mark assets does not change the results. The Wald test statistics are similarto the case when there are short sales constraints on the emerging marketsonly, implying that there are no diversification benefits for the emergingmarkets of Latin America and Asia. For the group Other, the joint test stillrejects the null hypothesis of spanning. Again, the conclusions do not changewhen we use the adjusted p values from Table I, even though in this casethere may be a small-sample bias.
To shed some light on these results, Figure 2 shows the mean-variancefrontiers for the benchmark assets and the Asian markets for the cases dis-cussed above. From this figure, it is obvious that there is a big shift in theunrestricted frontier if the Asian markets are added to the three benchmarkassets. Adding short sales constraints for the Asian markets causes the di-versification benefits to be much less pronounced, as can be seen from theinward shift of the frontier, which is now segmented. According to the testsin Table III, this inward shift makes the difference with the frontier of the
7 In addition to this, because the postliberalization periods are different for different coun-tries, the joint test for the Asian markets is based on a smaller number of observations than thetest for Thailand, for instance, which may result in a joint test statistic that is numericallysmaller than the individual ones.
736 The Journal of Finance

benchmark assets insignificant. Finally, adding short sales constraints onthe benchmark assets as well only makes a small difference in the frontiers.For the frontier of the benchmark assets, short sales constraints mainlymake a difference for the inefficient part of the frontier and they put anupper limit on the efficient part. For the frontier of all markets together,adding short sales constraints on the benchmarks hardly makes a differencerelative to the case where there are short sales constraints on the Asianmarkets only. Therefore, this figure illustrates that the main effect of shortsales constraints operates through the emerging markets, as we also con-cluded from the results in Table III.
The results above show that adding short sales constraints considerablyweakens the evidence in favor of emerging markets, except for the groupOther. This latter result must be interpreted with some caution, becauseeven for the emerging markets for which the null hypothesis is rejected, thediversification benefits may not be attainable, because of foreign ownershiprestrictions. Bekaert ~1995! discusses several measures of the extent of for-eign ownership restrictions in emerging markets. These measures suggestthat these restrictions may be important for the countries for which thehypothesis of spanning is rejected ~in particular for Zimbabwe!. Thus, thediversification benefits suggested by Table III may be difficult or impossibleto obtain.
To address this issue, the last line for each geographical group in Table IIIgives the results for the spanning tests in case the IFC Investable Indicesare used instead of the Global Indices. The null hypothesis is again whether
Figure 2. Mean-variance frontiers for the benchmark assets and Asia. The figure presentsthe unconstrained and segmented frontiers for the benchmark assets ~Bench! and for the bench-marks plus the Asian markets ~All! with ~free! or with no ~nss! short sales allowed.
Short Sales Constraints and Transaction Costs 737
the emerging market indices are spanned by the benchmark assets in casethere are short sales constraints on both the emerging markets and thebenchmark assets. Joint tests for all emerging markets within a geograph-ical group now never reject the hypothesis of spanning, including the groupOther. This suggests that ownership restrictions for these countries are in-deed binding.
C. Results for Spanning Tests With Transaction Costs
In this section, we consider the effects of transaction costs on the hypoth-esis that the mean-variance frontier of the benchmark indices spans thefrontiers of the benchmark indices plus the individual emerging markets.We assume that investors face a round trip cost of 0.5 percent when tradingthe benchmark assets, and that they have a holding period of six months.8With a holding period of six months and a round trip cost of 0.5 percent onthe benchmark assets, efficient portfolios consist of long positions in theMSCI Indices for the U.S., Europe, and Japan index or in the U.S. andEurope index only.
Our analysis focuses on the transaction costs that are needed to keep in-vestors out of the emerging markets. In addition to paying transaction costs,investors are also not allowed to sell the emerging markets short and we usethe IFC Investable Indices to incorporate possible ownership restrictions.Table IV presents levels of transaction costs in the emerging markets abovewhich the hypothesis of spanning cannot be rejected at the 5 percent and 10percent level, respectively. For instance, in the case of Argentina, a round-trip cost below 0.10 percent is needed to reject spanning by the benchmarkassets at the 10 percent level. For Venezuela, for instance, spanning cannever be rejected at the 10 percent level, no matter how low the transactioncosts are, which is indicated as “NR.” The estimates in Table IV suggest thatwith 0.5 percent round-trip costs on the benchmark assets and short sellingrestrictions on the emerging markets, transaction costs for the emergingmarkets need not be particularly high to keep investors out of these mar-kets. Especially in the Asian markets, we often find that even in the absenceof transaction costs on the emerging markets, spanning is not rejected. It isonly in a few cases that a transaction cost of at least two times the level inthe benchmark assets is needed to keep investors out of the market.
To get some further intuition about the importance of these transactioncosts, the third line for each geographic group in Table IV gives an estimateof the actual round-trip costs in the emerging markets. These estimates arefrom Barings Securities and reported by Bekaert et al. ~1998!. The reportedtransaction costs are calculated from the percentage spread, which is thedifference between the offer and bid price divided by the average of the offerand bid price for a security. For each country, the percentage spreads of
8 Results for holding periods of 3 and 12 months are similar to those for 6 months and canbe obtained from the authors upon request.
738 The Journal of Finance

individual stocks are weighted by the capitalization of each stock withineach country ~see Bekaert et al. ~1998!!. Interestingly, except for Colombia,the actual transaction costs are always higher than the calculated 10 per-cent bounds in Table IV, and the actual transaction costs are in every casehigher than the 5 percent bounds. This shows that, at least for a holdingperiod of six months, the joint effects of transaction costs in the emergingmarkets, short sales constraints, a round-trip cost of 0.5 percent on the bench-mark assets, and possible ownership restrictions make it hard to reject thehypothesis of mean-variance spanning.
IV. Concluding Remarks
In this paper, we show how regression techniques can be used to test formean-variance spanning and intersection in the case where there are shortsales constraints and0or transaction costs. When there are short sales
Table IV
Transaction Cost BoundsThe table presents estimated transaction cost bounds for the emerging markets in order toreject spanning of each emerging market by three benchmark assets at the 5 percent and10 percent significance levels. The three benchmark assets are the MSCI indices for the UnitedStates, Europe, and Japan. The table assumes that there is a 0.5 percent round-trip cost on thebenchmark assets and that there is a holding period of one month. The estimated transactioncosts are in percentages. All results are based on the IFC Investable Indices for the postliberal-ization periods. The actual transaction costs are from Baring Securities as reported by Bekaertet al. ~1996!.
Panel A: Latin America
Arg Bra Chi Col Mex Ven
10% bound 0.10 0.05 1.00 1.40 0.50 NR5% bound NR NR 0.65 0.80 NR NRActual tr. cost 1.55 0.85 3.93 1.00 0.93 NA
Panel B: Asia
Ind Kor Mal Pak Phi Tai Tha
10% bound NR NR NR NR 0.10 NR NR5% bound NR NR NR NR NR NR NRActual tr. cost 1.50 NA 0.69 0.38 0.94 0.47 0.70
Panel C: Other
Gre Jor Nig Zim
10% bound NR 0.25 NA 1.205% bound NR 0.10 NA 0.50Actual tr. cost 0.48 0.58 NA NA
NR 5 never rejected in the absence of transaction costs. NA 5 not available.
Short Sales Constraints and Transaction Costs 739

constraints on the benchmark assets, the mean-variance frontier consists ofparts of the mean-variance frontiers of subsets of the set of benchmark as-sets. If the benchmark assets are to span a new set of assets, there has to bespanning for each subset of the benchmark assets. This can be incorporatedin regression-based tests for spanning, by using a multivariate regression inwhich the returns on the new assets are regressed on the returns of therelevant subsets of the benchmark assets. Short sales restrictions on thenew assets require testing for inequality restrictions rather than equalities.Following the ideas presented in, for example, Luttmer ~1996!, transactioncosts can be handled by looking at short and long positions in an asset astwo different securities. Transaction costs can then be dealt with in the sameway as short sales constraints.
There is substantial evidence available in the literature that suggeststhat, in the absence of market frictions, U.S. investors can benefit fromincluding emerging markets assets in their well-diversified internationalportfolio of developed market assets. We try to shed some further light onthis issue by testing whether emerging market indices are spanned bydeveloped market indices when investors face short sales constraints and0ortransaction costs. We find that, when accounting for short sales con-straints and investability restrictions, the evidence in favor of diversifica-tion benefits of the emerging markets disappears, that is, for the threegeographical regions, we can no longer reject the hypothesis of spanning.This is mainly due to the short sales constraints on the emerging markets.Although our simulations suggest that there is a possible small-samplebias in the asymptotic test, the size of this bias is small and does not affectour conclusions. Also, with a round-trip cost of 0.5 percent in the developedmarkets and a holding period of six months, only small transaction costs inthe emerging markets are needed for possible diversification benefits to beinsignificant.
Appendix: Proof of the Validity of the Test
In this appendix, we prove a simple but useful lemma. This lemma showsthat the fact that we possibly use the incorrect regressions in our spanningand intersection tests ~due to sample variation! is asymptotically negligible.Short sales restrictions on the benchmark assets are handled by testing forspanning and intersection on subsets of the available assets, where there isonly a finite number of such subsets. The probability of choosing the rightsubsets tends to one and this turns out to be a sufficient condition for thevalidity of the tests. Suppose that we are given a finite number of Wald teststatistics, j~v @1# !T , . . . , j~v @M # !T , as defined in equation ~16!, where T is thesample size. Let the space of all possible values of v be partitioned inV @1#, . . . ,V @M #, with the interpretation that, depending on the value of theparameter v, one of the test statistics j~v @1# !T has desirable properties. Let jindicate the set V @ j # to which v @ j # belongs. If v0 denotes the true value of v,
740 The Journal of Finance

one would like to use the test j~v0!T , of course, but this is not possible,because v0 is unknown. Assume, however, that we are given a parameterestimate [vT , such that, under v0
Pr$ [vT [ V @ j # % r 1, T r `.
Now we have the following result.
LEMMA 1: For each c [ IR, we have
limTr`
Pr$j~ [vT !T # c% 2 Pr$j~v0!T # c% 5 0.
Proof: The proof is very straightforward, using
Pr$j~ [vT !T # c% 5 (j51
M
Pr$j~v @ j # !T # c and v @ j # 5 [vT %
5 Pr$j~v0!T # c% 2 Pr$j~v0!T # c and v0 Þ [vT %
1 (vÞv0
Pr$j~v!T # c and v5 [vT %,
and that the latter two terms converge to zero. Q.E.D.
REFERENCES
Bekaert, Geert, 1995, Market integration and investment barriers in emerging equity markets,World Bank Economic Review 9, 75–107.
Bekaert, Geert, Claude B. Erb, Harvey, Campbell R., and Viskanta, Tadas E., 1998, Distribu-tional characteristics of emerging market returns and asset allocation, Journal of PortfolioManagement, Winter, 102–116.
Bekaert, Geert, and Michael S. Urias, 1996, Diversification, integration, and emerging marketclosed-end funds, Journal of Finance 51, 835–870.
Chen, Zhiwu, and Peter J. Knez, 1996, Portfolio performance measurement: Theory and appli-cations, Review of Financial Studies 9, 511–556.
De Roon, Frans A., Theo E. Nijman, and Bas J. M. Werker, 1997a, Testing for spanning withfutures contracts and nontraded assets: A general approach, CentER Discussion Paper 9683,Tilburg University.
De Roon, Frans A., Theo E. Nijman, and Bas J. M. Werker, 1997b, Testing for mean-variancespanning with short sales constraints and transaction costs: The case of emerging markets,CentER Discussion Paper 9807, Tilburg University.
De Santis, Giorgio, 1994, Asset pricing and portfolio diversification: Evidence from emergingfinancial markets, Working paper, University of Southern California.
Duffie, Darrel, 1996, Dynamic Asset Pricing Theory ~Princeton University Press, Princeton,NJ!.
Errunza, Vihang, Ked Hogan, and Mao-Wei Hung, 1999, Can the gains from international di-versification be achieved without investing abroad? Journal of Finance 54, 2075–2107.
Glen, Jack, and Philippe Jorion, 1993, Currency hedging for international portfolios, Journal ofFinance 48, 1865–1886.
Short Sales Constraints and Transaction Costs 741

Gouriéroux, Christian, Alberto Holly, and Alain Montfort, 1982, Likelihood ratio test, Wald testand Kuhn-Tucker test in linear models with inequality constraints on the regression pa-rameters, Econometrica 50, 63–80.
Hansen, Lars Peter, John Heaton, and Erzo H. J. Luttmer, 1995, Econometric evaluation ofasset pricing models, Review of Financial Studies 8, 237–274.
Hansen, Lars Peter, and Ravi Jagannathan, 1991, Implications of security market data formodels of dynamic economies, Journal of Political Economy 99, 225–262.
Harvey, Campbell R., 1995, Predictable risk and returns in emerging markets, Review of Fi-nancial Studies 8, 773–816.
Huberman, Gur, and Shmuel Kandel, 1987, Mean-variance spanning, Journal of Finance 42,873–888.
Jobson, J. D., and Bob M. Korkie, 1989, A performance interpretation of multivariate tests ofintersection, spanning and asset pricing, Journal of Financial and Quantitative Analysis24, 185-204.
Kodde, David A., and Franz C. Palm, 1986, Wald criteria for jointly testing equality and in-equality restrictions, Econometrica 54, 1243–1248.
Luttmer, Erzo G. J., 1996, Asset pricing in economies with frictions, Econometrica 64, 1429–1467.
Markowitz, Harry M., 1991, Portfolio Selection ~Blackwell Publishers, Cambridge, MA!.
742 The Journal of Finance
Related Documents