TESTING AND IMPROVING METHOD OF INDENTIFYING INTERACTING GALAXIES L. Sun ABSTRACT In this report I conducted a given method of selecting the sample of groups of galaxies that interact dynamically in the Sloan Digital Sky Survey (SDSS) database. By using SQL database quires, I gathered all the potential associated pairs of galaxies and from which I selected 30 candidates randomly. Then I checked all the candidates one by one with the images and data given by SDSS website to test the accuracy of this method and the results were satisfactory. Also, using spreadsheet software, I plotted the relation of color indices (g-r) and (i-z) for each pair of galaxies and measured the correlation coefficients and found important properties of color correlations in the compact galaxy groups. Finally, I discussed the advantages and shortcomings of the original methods and suggested some ways to enhance the performance of the selecting method. 1. INTRODUCTION Interacting galaxies or associated galaxies are galaxies whose gravitational fields result in a disturbance of one another. Typically interacting galaxies are in the forms of galaxy interactions and galaxy cannibalism depending on the size of galaxies involved. Interacting galaxies are very important astrophysically because interaction is a crucial step in galaxy evolution. What’s more, the interaction can deform, or even radically change, the shape and state of the galaxies, often triggering new bursts of star formation because of their high local densities, providing abundant useful and valuable materials in astronomy study. For example, the Cartwhell galaxy, which is similar to our own Milky Way, is interacting with a smaller galaxy, creating spokes of stars and gas, and a bright blue ring of new star formation. 1 Compact group of galaxies, galaxy groups in which the distance 1 http://astronomy.swin.edu.au/cosmos/i/interacting+gal axies between members is not much larger than the diameter of the member, are the wombs of interacting galaxies. Due to high densities and low velocity dispersions, the environments in compact groups provide more frequent and prevalent tidal activity and galaxy mergers. So far, compact group of galaxies are not well studied as larger galaxy system due to the difficulty of discerning them from the field. 2 In this paper I attempt to automatically identify a sample of close groups of galaxies that may potentially be associated dynamically. With the huge database given by The Sloan Digital Sky Survey (SDSS), it is challenging to identify a class of object precisely and effectively. Therefore, testing the reliability of a selecting method is necessary since it can indicate the precision and efficiency of the method as well as provide ways to improve the given method. Interacting galaxies have distinct features of appearance. The effect of tidal force due to 2 Brian et al .2004, AJ, 127,18111859

Welcome message from author
This document is posted to help you gain knowledge. Please leave a comment to let me know what you think about it! Share it to your friends and learn new things together.
Transcript

TESTING AND IMPROVING METHOD OF INDENTIFYING INTERACTING GALAXIES
L. Sun
ABSTRACT In this report I conducted a given method of selecting the sample of groups of galaxies that interact dynamically in the Sloan Digital Sky Survey (SDSS) database. By using SQL database quires, I gathered all the potential associated pairs of galaxies and from which I selected 30 candidates randomly. Then I checked all the candidates one by one with the images and data given by SDSS website to test the accuracy of this method and the results were satisfactory. Also, using spreadsheet software, I plotted the relation of color indices (g-r) and (i-z) for each pair of galaxies and measured the correlation coefficients and found important properties of color correlations in the compact galaxy groups. Finally, I discussed the advantages and shortcomings of the original methods and suggested some ways to enhance the performance of the selecting method.
1. INTRODUCTION
Interacting galaxies or associated galaxies are galaxies whose gravitational fields result in a disturbance of one another. Typically interacting galaxies are in the forms of galaxy interactions and galaxy cannibalism depending on the size of galaxies involved. Interacting galaxies are very important astrophysically because interaction is a crucial step in galaxy evolution. What’s more, the interaction can deform, or even radically change, the shape and state of the galaxies, often triggering new bursts of star formation because of their high local densities, providing abundant useful and valuable materials in astronomy study. For example, the Cartwhell galaxy, which is similar to our own Milky Way, is interacting with a smaller galaxy, creating spokes of stars and gas, and a bright blue ring of new star formation.1 Compact group of galaxies, galaxy groups in which the distance
1 http://astronomy.swin.edu.au/cosmos/i/interacting+galaxies
between members is not much larger than the diameter of the member, are the wombs of interacting galaxies. Due to high densities and low velocity dispersions, the environments in compact groups provide more frequent and prevalent tidal activity and galaxy mergers. So far, compact group of galaxies are not well studied as larger galaxy system due to the difficulty of discerning them from the field. 2
In this paper I attempt to automatically identify a sample of close groups of galaxies that may potentially be associated dynamically. With the huge database given by The Sloan Digital Sky Survey (SDSS), it is challenging to identify a class of object precisely and effectively. Therefore, testing the reliability of a selecting method is necessary since it can indicate the precision and efficiency of the method as well as provide ways to improve the given method. Interacting galaxies have distinct features of appearance. The effect of tidal force due to 2 Brian et al .2004, AJ, 127,1811-‐1859

gravity will cause significant distortion with the extension of the spiral arm, also called tidal tails. Moreover, the nucleus will become luminous containing numerous bursts of forming new stars. Such specialties in appearance offers the validity of discern the interacting galaxies by observing the photos in the database manually, which is the key to justify if our way of automatic identifying the celestial bodies does give us the objects we want with high accuracy.
The basic procedure of this research is first to narrow the all objects in SDSS query down to the extent that those are separated by less than 30 arcsecond and those have individual measured spectra. Then we keep narrowing what we have by confining distinct spectra, galaxy classification, well-measured redshifts, less than 1000km/s recessional velocity difference and less than 10 acrsecond angular separation. After that, randomly select several candidate paired-galaxies, observe them and justify whether they are interacting galaxies. Then by analyzing several parameters like the light intensity under different wavelength scales according to SDSS’s ugriz system, find the advantages and shortcomings of this selecting method and make improvement.
2. METHODS
With the idea that interacting galaxy pairs are relatively closed to each other, we deduced that they should have very small angular separation on the sky. So we would focus on the object pairs which are have tiny angular separation, say less than tens of arcsecond. Also, we wanted to make sure the objects are indeed galaxies, so searching the in range of celestial bodies that are classified as galaxies is necessary. Moreover, notice that small angular separation only confined the
closeness in the horizontal direction. In order to guarantee the galaxy pairs to have a close distance from the Earth, their recessional velocity distance should be close so that they would have similar redshift observed from the Earth, and this should be based on the redshifts are measured with high precision. The criteria stated above are what we depended on when screening out the associated galaxies from the huge amount of celestial objects. By registering for an individual user account on SDSS CasJobs, the computational facility provided by SDSS for catalog queries that are longer than those permitted in their regular web search interface, we could acquire a new batch query. Queries to SDSS use SQL database queries, we could acquire all the celestial bodies in the SDSS database by typing in certain values of parameters such as classification, angular separation, or recession velocity. Noticing that it would take quiet long for computer to gather all the objects that have properties described in last paragraph from the numerous data, we need to first take a basic sample to scale down the scope of searching. We set the database query to select the initial set of galaxies that are separated by 30 acrsecond or less on the sky and have associated spectroscopic data. After about 30 minutes, the web generated a local table containing 10829 rows with the parameters: g1_id, g1_ra, g1_dec, g1_u, g1_g, g1_r, g1_i, g1_z, g1_flags, g2_id, g2_ra, g2_dec, g2_u, g2_g, g2_r, g2_i, g2_z, g2_flags, g1_redshift, g2_redshift. After the table being returned, we applied additional codes of constraints of distinct spectra, galaxy classification, well-measured redshifts, less than 1000km/s recessional velocity difference and less than 10 acrsecond angular separation described
above to the query we just generated, in less than a minute, the web produced a local table containing 1524 rows of galaxy pairs. It would be more scientific if we could check all the 1524 objects we found whether they are associated paired galaxies. However, due to time limits, we randomly chose 30 pairs of galaxies for testing by using random number generator. Then we pick those rows out from Zgpair 2 as our testing table (see Table1 at the end). We accessed SDSS images by coping and pasting the right ascension and declination of each candidate from individual rows of the columns “g1_ra” and “g1_dec” in the item blank at SDSS’s website:http://cas.sdss.org/astrodr7/en/tools/search/radial.asp. Since we confined the separation of two galaxies under 10 arcseconds, we can set the radius of 0.2 acrmins and we could simultaneously find the data for galaxy 2. By observing and comparing the images, we could judge certain pair of galaxies is associated or not (sample figures are shown at the end of article). After comparing all the galaxy pairs, we tried to found the properties of interacting galaxies in terms of parameters in ugriz system. We choose color indices (g-r) and (i-z) by generating columns “g1_g-g1_r”, “g2_g-g2_r”, “g1_i-g1_z”, and “g2_i-g2_z”. We plotted “g1_g-g1_r”, “g2_g-g2_r” in one graph and “g1_i-g1_z”, “g2_i-g2_z” in another. Then measured the correlation coefficients for the two color indices between the two galaxies in pairs. Finally, we found some relations between the coefficients in two indices and the fact that two galaxies are associated, and we used such relation to improve the precision and efficiency of selecting methods.
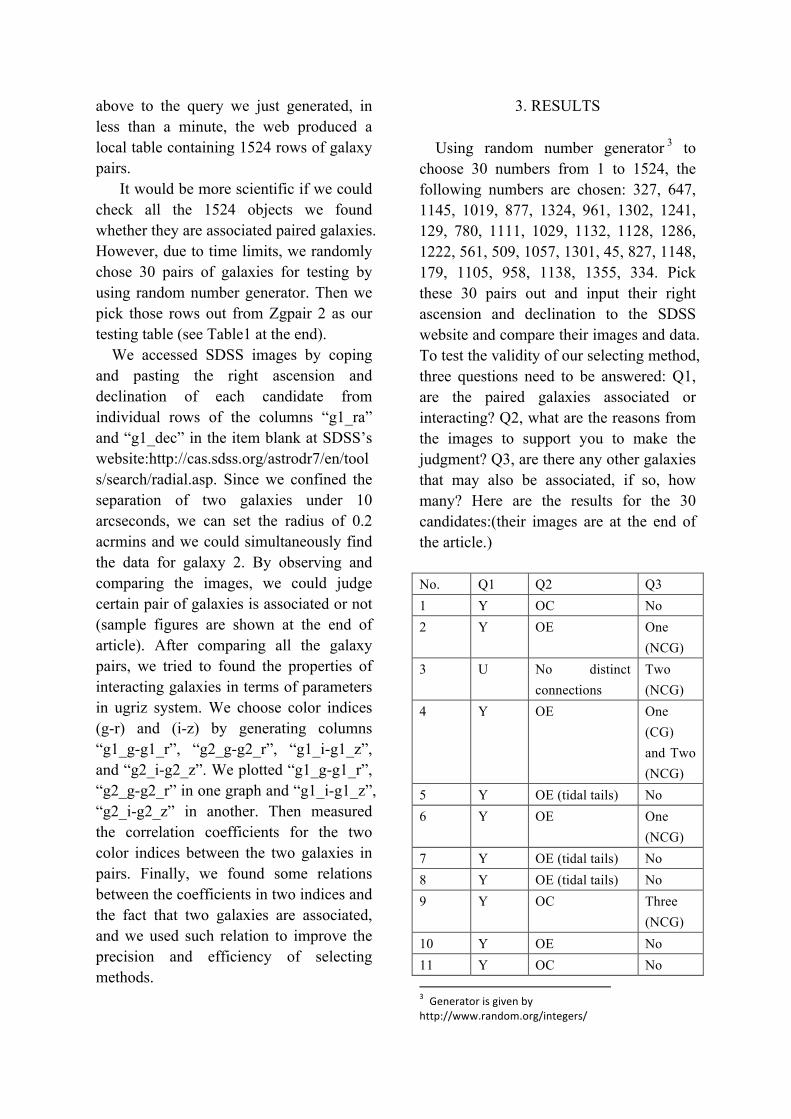
3. RESULTS
Using random number generator 3 to choose 30 numbers from 1 to 1524, the following numbers are chosen: 327, 647, 1145, 1019, 877, 1324, 961, 1302, 1241, 129, 780, 1111, 1029, 1132, 1128, 1286, 1222, 561, 509, 1057, 1301, 45, 827, 1148, 179, 1105, 958, 1138, 1355, 334. Pick these 30 pairs out and input their right ascension and declination to the SDSS website and compare their images and data. To test the validity of our selecting method, three questions need to be answered: Q1, are the paired galaxies associated or interacting? Q2, what are the reasons from the images to support you to make the judgment? Q3, are there any other galaxies that may also be associated, if so, how many? Here are the results for the 30 candidates:(their images are at the end of the article.) No. Q1 Q2 Q3 1 Y OC No 2 Y OE One
(NCG) 3 U No distinct
connections Two (NCG)
4 Y OE One (CG) and Two (NCG)
5 Y OE (tidal tails) No 6 Y OE One
(NCG) 7 Y OE (tidal tails) No 8 Y OE (tidal tails) No 9 Y OC Three
(NCG) 10 Y OE No 11 Y OC No 3 Generator is given by http://www.random.org/integers/
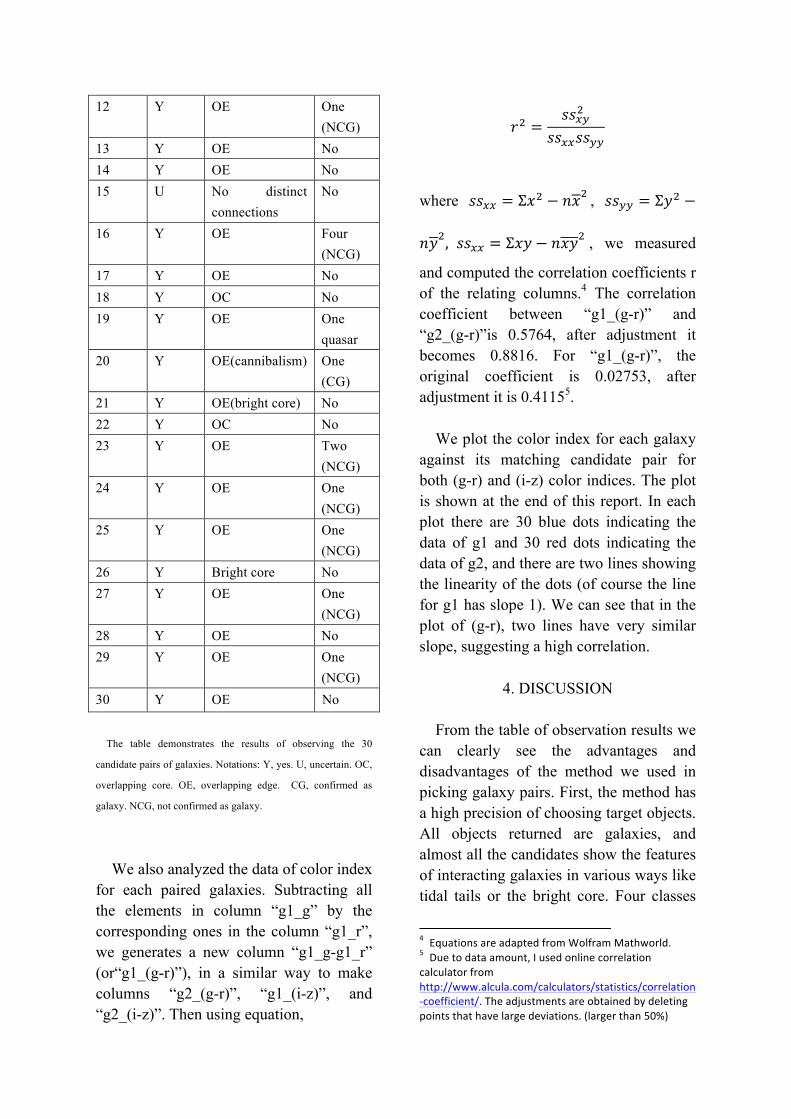
12 Y OE One (NCG)
13 Y OE No 14 Y OE No 15 U No distinct
connections No
16 Y OE Four (NCG)
17 Y OE No 18 Y OC No 19 Y OE One
quasar 20 Y OE(cannibalism) One
(CG) 21 Y OE(bright core) No 22 Y OC No 23 Y OE Two
(NCG) 24 Y OE One
(NCG) 25 Y OE One
(NCG) 26 Y Bright core No 27 Y OE One
(NCG) 28 Y OE No 29 Y OE One
(NCG) 30 Y OE No
The table demonstrates the results of observing the 30
candidate pairs of galaxies. Notations: Y, yes. U, uncertain. OC,
overlapping core. OE, overlapping edge. CG, confirmed as
galaxy. NCG, not confirmed as galaxy.
We also analyzed the data of color index for each paired galaxies. Subtracting all the elements in column “g1_g” by the corresponding ones in the column “g1_r”, we generates a new column “g1_g-g1_r” (or“g1_(g-r)”), in a similar way to make columns “g2_(g-r)”, “g1_(i-z)”, and “g2_(i-z)”. Then using equation,
𝑟! =𝑠𝑠!"!
𝑠𝑠!!𝑠𝑠!!
where 𝑠𝑠!! = Σ𝑥! − 𝑛𝑥! , 𝑠𝑠!! = Σ𝑦! −
𝑛𝑦!, 𝑠𝑠!! = Σ𝑥𝑦 − 𝑛𝑥𝑦! , we measured
and computed the correlation coefficients r of the relating columns.4 The correlation coefficient between “g1_(g-r)” and “g2_(g-r)”is 0.5764, after adjustment it becomes 0.8816. For “g1_(g-r)”, the original coefficient is 0.02753, after adjustment it is 0.41155.
We plot the color index for each galaxy against its matching candidate pair for both (g-r) and (i-z) color indices. The plot is shown at the end of this report. In each plot there are 30 blue dots indicating the data of g1 and 30 red dots indicating the data of g2, and there are two lines showing the linearity of the dots (of course the line for g1 has slope 1). We can see that in the plot of (g-r), two lines have very similar slope, suggesting a high correlation.
4. DISCUSSION From the table of observation results we can clearly see the advantages and disadvantages of the method we used in picking galaxy pairs. First, the method has a high precision of choosing target objects. All objects returned are galaxies, and almost all the candidates show the features of interacting galaxies in various ways like tidal tails or the bright core. Four classes
4 Equations are adapted from Wolfram Mathworld. 5 Due to data amount, I used online correlation calculator from http://www.alcula.com/calculators/statistics/correlation-‐coefficient/. The adjustments are obtained by deleting points that have large deviations. (larger than 50%)
of objects are mainly contained in the images: galaxies, groups of stars that are not identified as galaxies, pulsars, and bright stars that maybe relatively closer to the Earth. The last one, bright stars, are the major contaminating sources because sometimes their light rays connect the target galaxy, causing illusions of tidal tails (see Fig. 12 in the end). Other objects like pulsars could also cause identifying error, but in most cases they are distinguishable due to different shapes and colors. Other thing needed to mention is that, although few pairs seem to be isolated on the picture, they could not be very far apart because of their small difference in recession velocity, suggesting the potential possibility of galactic association. In general the efficiency and accuracy is high, suggesting that this method is feasible.
However, several disadvantages expose at the same time, providing space for enhancement. The most important defect of our method is the disability of providing information about interacting galaxies group that has more than 2 members. Many-galaxy-interaction is not rare in the universe, for instance, the multiple interaction of Messier 81 group of galaxies6. And also from the 30 candidates, we found two systems that have more than two confirmed galaxies within 0.2 arcminutes. (For example, see Fig. 11 at the end of article) Due to the command of coding, the origin method can only compare the association between two galaxies, missing information about the important portion of associated multi-galaxy group. What’s more, for two
6 http://astronomy.swin.edu.au/cosmos/i/interacting+galaxies
really large galaxies that are not very far from the Earth, interaction can happen even if they separate by a distance greater than 10 arcseconds, so it is not fully scientific to confine the candidates. From pictures of the candidates, sometimes there are faint patterns from a galaxy-like object far from the paired system that may also show the galactic interaction. From the two plots we found that the linear relation between (g-r) and (g-r) are good. The paired galaxies are closely related on range (g-r), and there is distinguishable correlation on color indices (i-z) though it was not as good as in (g-r).
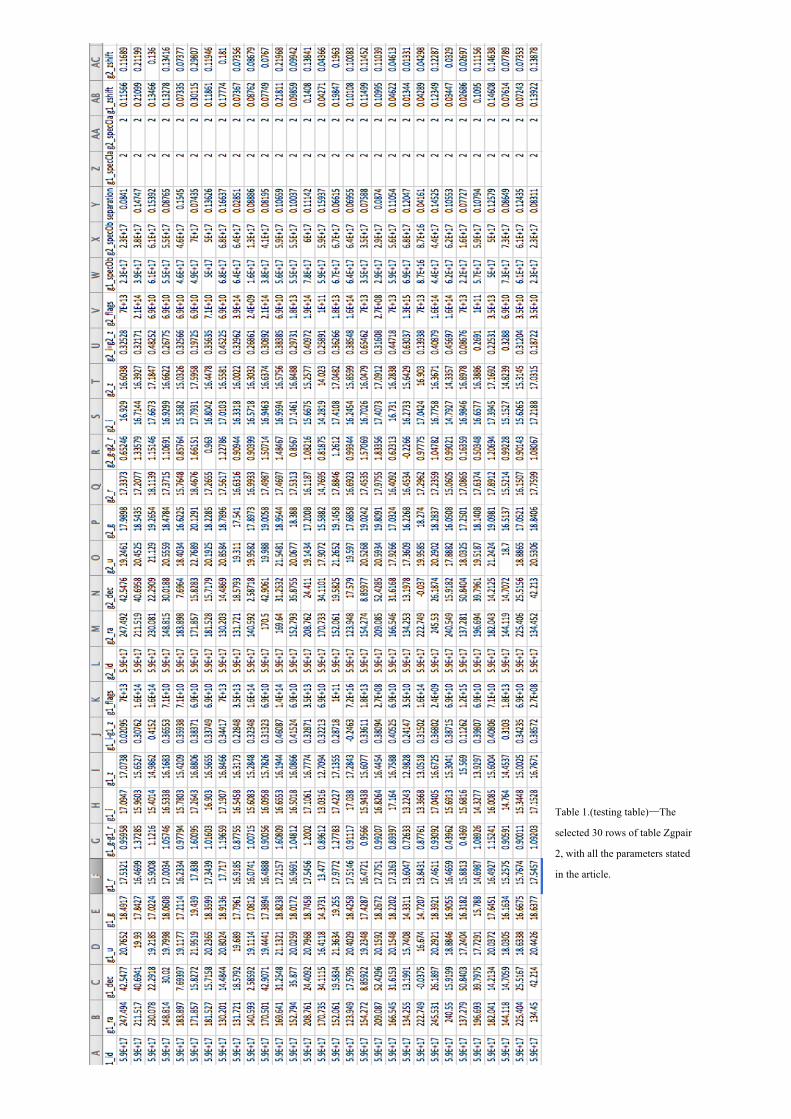
Table 1.(testing table)—The
selected 30 rows of table Zgpair
2, with all the parameters stated
in the article.
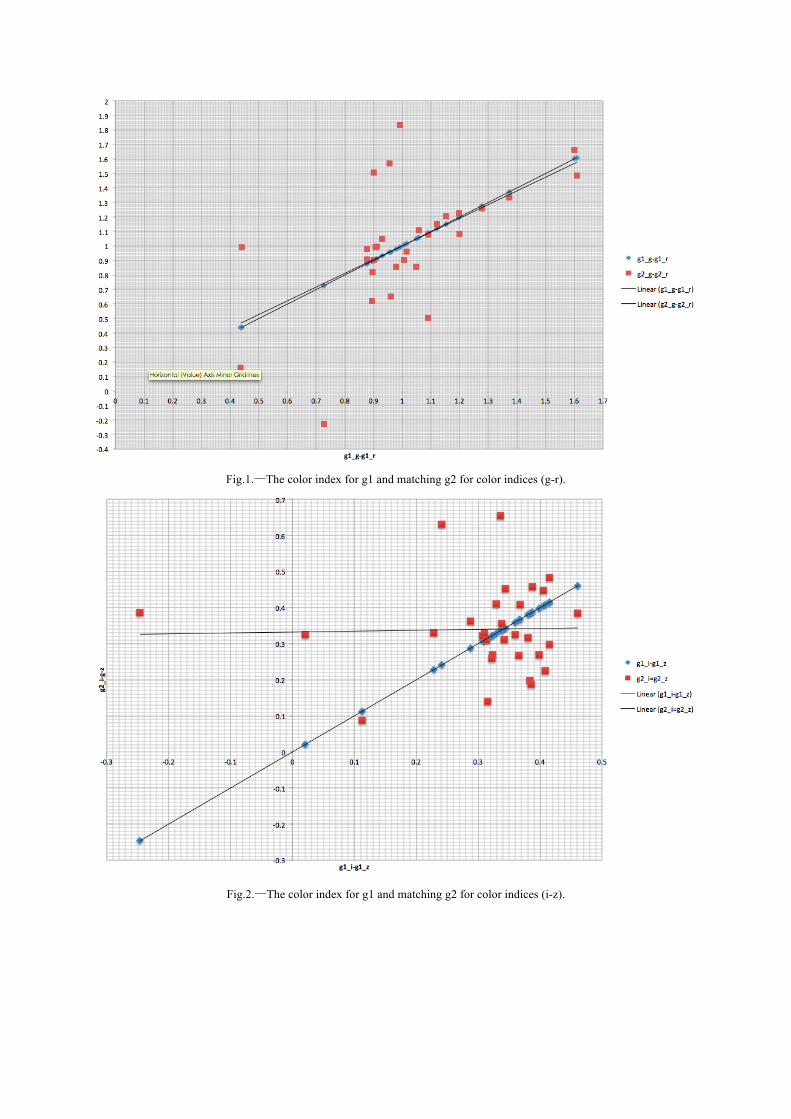
Fig.1.—The color index for g1 and matching g2 for color indices (g-r).
Fig.2.—The color index for g1 and matching g2 for color indices (i-z).

The images of first four selected pairs of galaxies (From SDSS website):
Fig.3.—Galaxy 1 in candidate pair 1 Fig.4.—Galaxy 2 in candidate pair 1
Fig.5.—Galaxy 1 in candidate pair 2 Fig.6.—Galaxy 2 in candidate pair 2
Fig.7.—Galaxy 1 in candidate pair 3 Fig.8.—Galaxy 2 in candidate pair 3
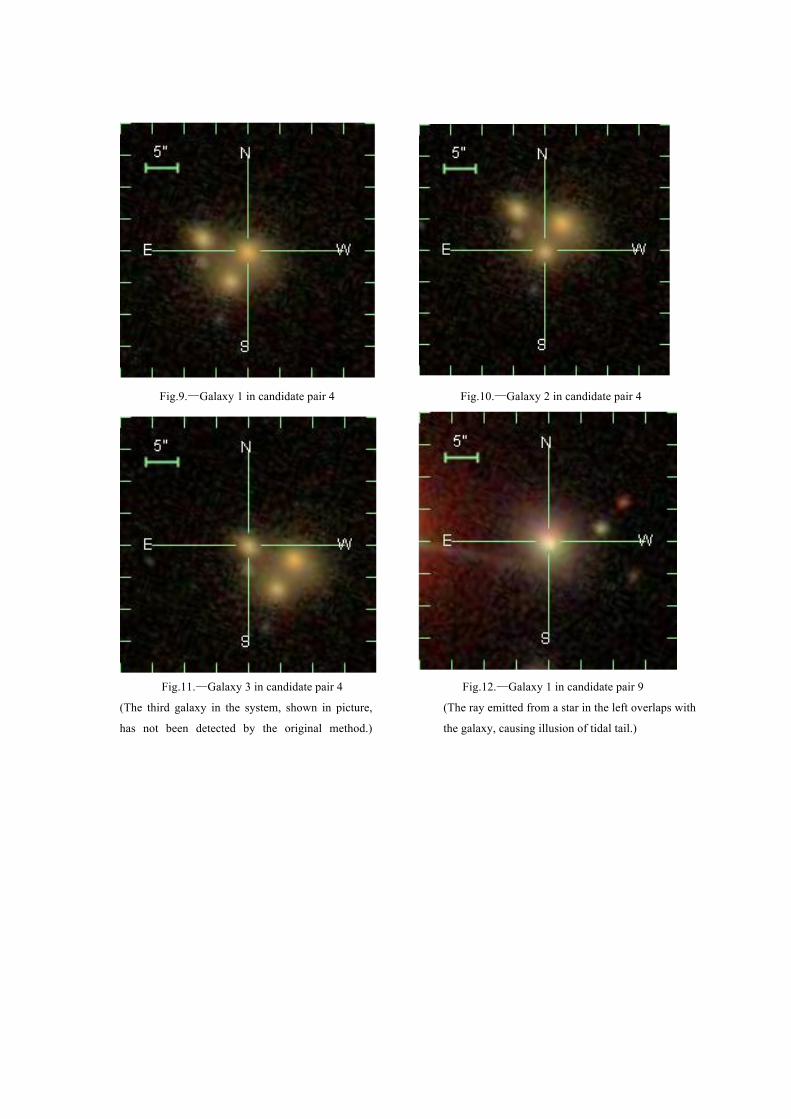
Fig.9.—Galaxy 1 in candidate pair 4 Fig.10.—Galaxy 2 in candidate pair 4
Fig.11.—Galaxy 3 in candidate pair 4 Fig.12.—Galaxy 1 in candidate pair 9
(The third galaxy in the system, shown in picture,
has not been detected by the original method.)
(The ray emitted from a star in the left overlaps with
the galaxy, causing illusion of tidal tail.)
Related Documents