Journal of Paleolimnology 28: 329–348, 2002. 329 2002 Kluwer Academic Publishers. Printed in the Netherlands. Testate amoebae as paleoindicators of surface-moisture changes on Michigan peatlands: modern ecology and hydrological calibration Robert K. Booth Department of Botany, University of Wyoming, Laramie, WY 82071 -3165, USA (e-mail: rkbooth@uwyo.edu) Received 13 December 2001; accepted in revised form 19 March 2002 Key words: Great Lakes region, Michigan, Paleohydrology, Peatlands, Rhizopoda, Testate amoebae Abstract Peatland testate amoebae are sensitive indicators of local hydrology and have been used as proxies for surface moisture conditions in fossil studies. However, few regional calibration datasets exist in North America, and knowledge of testate amoeba ecology and distribution patterns are limited. The objectives of this study were to (1) investigate the relationship between testate amoebae, environment, and Sphagnum species in Michigan peatlands; (2) generate transfer functions from this dataset that can be applied to fossil data; and (3) describe vertical variation of testate amoebae inhabiting Sphagnum moss. Testate amoeba assemblages from 139 microsites within 11 peatlands in Michigan were compared to assess variability between and within peatlands. Most peatlands contained similar testate amoeba assemblages, although within individual peatlands the amount of assemblage variability is correlated to the amount of environmental heterogeneity. Of the measured environmental variables, depth to water table showed the strongest relationship with testate amoebae. Depth to water table can be reconstructed from fossil data with a mean error of 67.5 cm, although predictive ability deteriorates in extremely dry environments ( .30 cm water table depth).Vertical variation in testate amoeba assemblages was investigated at 89 Sphagnum-dominated microsites by directly comparing amoeba assemblages and the abundance and frequency of common taxa in upper and lower portions of the Sphagnum stem. Except for extremely dry microsites, considerable vertical variation in assemblage composition exists. Many agglutinate taxa are more abundant on lower portions of the Sphagnum stem, and taxa containing symbiotic zoochlorellae are more abundant on upper portions. Refinements in sampling procedures and analysis may improve the predictive ability of transfer functions. Introduction allogenic factors in controlling stratigraphic changes in different peatland types and at differing stages of Peatland stratigraphy, particularly the stratigraphy of peatland development has not been completely re- bogs, has been used as a source of paleoclimate data solved (e.g., Tolonen et al. (1985), Foster and Wright for over a century. Early paleoclimate work on peat- (1990), Almquist-Jacobson and Foster (1995), Hu lands was focused on documenting times of high- and Davis (1995), Hendon et al. (2001)), a growing magnitude hydrological change, typically at millen- body of evidence documents high-frequency, low- nial timescales (e.g., Sernander (1908)). Concerns magnitude climatic changes from bog stratigraphy about the integrity of the stratigraphic record, the (e.g., Charman et al. (1999), Mauquoy and Barber extent of autogenic influences (i.e., non-climatic), and (1999), Barber et al. (2000), Hendon et al. (2001)). A a now-refuted paradigm of bog development (Barber few studies also suggest that sensitive paleoclimate 1981; Backeus 1990), all hampered investigations of records may even be obtained from peatlands that are lower magnitude and higher frequency climatic not truly ombrotrophic (Anderson 1998; Hendon et al. changes until the late 1970’s (e.g., Aaby (1976)). 2001), although more research is needed to assess the Although the relative importance of autogenic and climatic sensitivity of these systems. During the past

Welcome message from author
This document is posted to help you gain knowledge. Please leave a comment to let me know what you think about it! Share it to your friends and learn new things together.
Transcript
Journal of Paleolimnology 28: 329–348, 2002. 329 2002 Kluwer Academic Publishers. Printed in the Netherlands.
Testate amoebae as paleoindicators of surface-moisture changes onMichigan peatlands: modern ecology and hydrological calibration
Robert K. BoothDepartment of Botany, University of Wyoming, Laramie, WY 82071-3165, USA (e-mail: [email protected])
Received 13 December 2001; accepted in revised form 19 March 2002
Key words: Great Lakes region, Michigan, Paleohydrology, Peatlands, Rhizopoda, Testate amoebae
Abstract
Peatland testate amoebae are sensitive indicators of local hydrology and have been used as proxies for surfacemoisture conditions in fossil studies. However, few regional calibration datasets exist in North America, andknowledge of testate amoeba ecology and distribution patterns are limited. The objectives of this study were to (1)investigate the relationship between testate amoebae, environment, and Sphagnum species in Michigan peatlands;(2) generate transfer functions from this dataset that can be applied to fossil data; and (3) describe verticalvariation of testate amoebae inhabiting Sphagnum moss. Testate amoeba assemblages from 139 microsites within11 peatlands in Michigan were compared to assess variability between and within peatlands. Most peatlandscontained similar testate amoeba assemblages, although within individual peatlands the amount of assemblagevariability is correlated to the amount of environmental heterogeneity. Of the measured environmental variables,depth to water table showed the strongest relationship with testate amoebae. Depth to water table can bereconstructed from fossil data with a mean error of 67.5 cm, although predictive ability deteriorates in extremelydry environments (.30 cm water table depth).Vertical variation in testate amoeba assemblages was investigated at89 Sphagnum-dominated microsites by directly comparing amoeba assemblages and the abundance and frequencyof common taxa in upper and lower portions of the Sphagnum stem. Except for extremely dry microsites,considerable vertical variation in assemblage composition exists. Many agglutinate taxa are more abundant onlower portions of the Sphagnum stem, and taxa containing symbiotic zoochlorellae are more abundant on upperportions. Refinements in sampling procedures and analysis may improve the predictive ability of transferfunctions.
Introduction allogenic factors in controlling stratigraphic changesin different peatland types and at differing stages of
Peatland stratigraphy, particularly the stratigraphy of peatland development has not been completely re-bogs, has been used as a source of paleoclimate data solved (e.g., Tolonen et al. (1985), Foster and Wrightfor over a century. Early paleoclimate work on peat- (1990), Almquist-Jacobson and Foster (1995), Hulands was focused on documenting times of high- and Davis (1995), Hendon et al. (2001)), a growingmagnitude hydrological change, typically at millen- body of evidence documents high-frequency, low-nial timescales (e.g., Sernander (1908)). Concerns magnitude climatic changes from bog stratigraphyabout the integrity of the stratigraphic record, the (e.g., Charman et al. (1999), Mauquoy and Barberextent of autogenic influences (i.e., non-climatic), and (1999), Barber et al. (2000), Hendon et al. (2001)). Aa now-refuted paradigm of bog development (Barber few studies also suggest that sensitive paleoclimate1981; Backeus 1990), all hampered investigations of records may even be obtained from peatlands that arelower magnitude and higher frequency climatic not truly ombrotrophic (Anderson 1998; Hendon et al.changes until the late 1970’s (e.g., Aaby (1976)). 2001), although more research is needed to assess theAlthough the relative importance of autogenic and climatic sensitivity of these systems. During the past
330
decade techniques have been developed and refined from this horizon best represent what would be foundfor quantitative inference of past climatic changes in the fossil record (Warner 1987; Tolonen et al.using a variety of climate proxies, including plant 1992). Stratification of testate amoeba taxa has beenmacrofossils (e.g., Barber et al. (2000)), testate observed vertically along the Sphagnum stem, andamoebae (e.g., Woodland et al. (1998)), and measure- this spatial variation has been attributed primarily toments of humification (Blackford and Chambers gradients of light, temperature, food, and oxygen1993). However, especially in the case of testate (Heal 1962; Meisterfeld 1977). Vertical variationamoeba analysis, further development of biological along the Sphagnum stem is also a gradient fromproxies requires a better knowledge of species-en- mostly alive testate amoebae in the aerobic, uppervironment relationships, and the collection of cali- portions and mostly empty tests in the more anaero-
¨bration datasets from a variety of geographic regions bic, lower portions (Schonborn 1963). However,and peatland types. quantitative comparisons between amoeba assem-
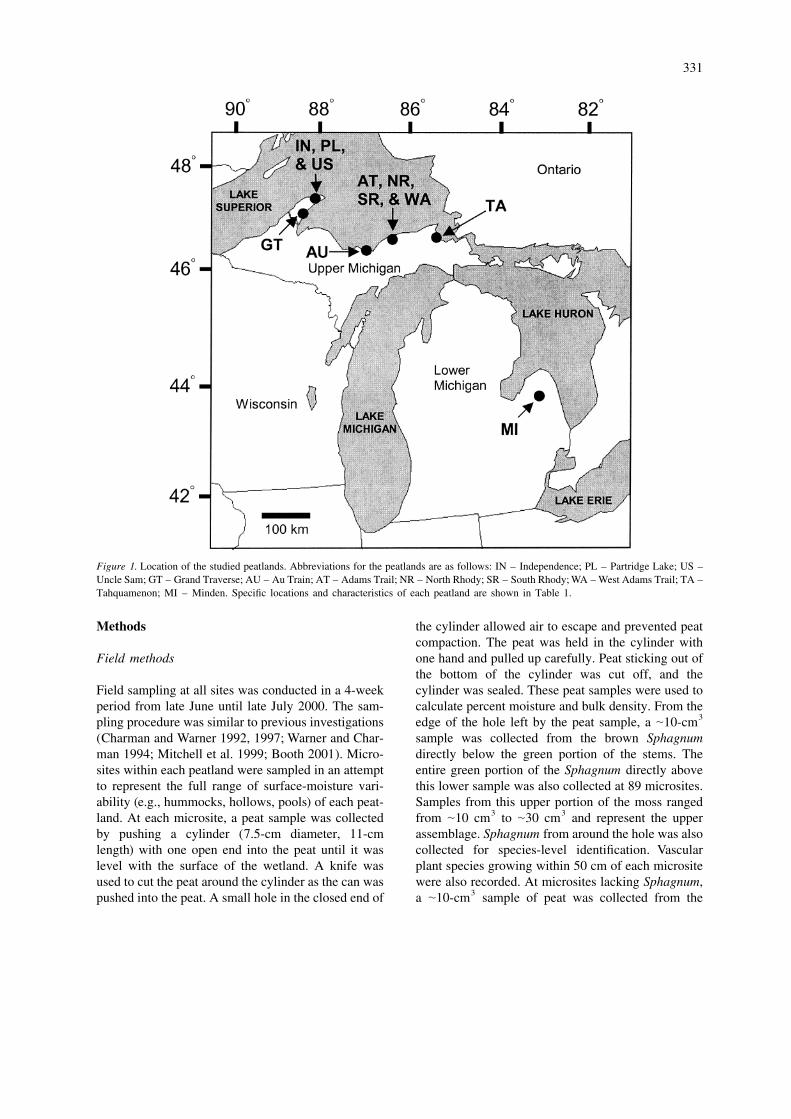
Testate amoebae (Protozoa: Rhizopoda) inhabit blages found on the upper, chlorophyllous portion ofmoist soils, wetlands, and lakes. Fossil tests can the Sphagnum stem and those characterizing theusually be identified to species and recovered from lower, non-chlorophyllous portion of the Sphagnumsediments in quantities sufficiently large to permit stem are needed. These comparisons can provideestimation of relative abundance (Warner 1990). The insights into the taphonomy and ecology of testatedominant control on taxa distribution patterns in amoebae, and may guide the collection of morewetland habitats is substrate moisture (Tolonen 1986; representative calibration datasets. In this paper, IWarner 1987, 1990), although trophic status (Tolonen refer to the testate amoeba assemblages found on theet al. 1992), pH (e.g., Charman and Warner (1992), upper and lower portions of the stem as upper andMitchell et al. (1999), Booth (2001)), and other lower assemblages.aspects of water chemistry (Woodland et al. 1998; In this study I investigate the relationship amongMitchell et al. 2000a) are also important factors. testate amoebae, vegetation, pH, water table depth,Many taxa are cosmopolitan in distribution, although substrate percent moisture, depth of the living moss,comparisons of species’ hydrological preferences are and bulk density from 139 samples collected from 11difficult because most studies have only measured peatlands in Michigan, USA. I investigate controls onhydrological data at a single time during the year. testate amoebae distribution between and within theseHowever, qualitative comparisons of the hydrologic peatlands, and develop transfer functions from thispreferences of taxa along relative moisture gradients dataset to infer water table depth from fossil data. Iin North America, Europe, and New Zealand suggest also compare testate amoeba assemblages inhabitingthat many have similar preferences among locations upper and lower portions of the Sphagnum stem at 89(Charman et al. 2000; Booth 2001). Transfer func- microsites within eight of these peatlands. I attempt totions to infer moisture conditions from testate amoeba quantify and describe differences in these assem-assemblages have been developed from regions in blages and develop hypotheses to explain these differ-North America (Charman and Warner 1992, 1997; ences.Warner and Charman 1994; Booth 2001), Europe(Tolonen et al. 1992; Woodland et al. 1998; Mitchellet al. 1999), Russia (Bobrov et al. 1999), and New Study sitesZealand (Charman 1997). Transfer functions based ontestate amoebae have been used to infer centennial- Eleven peatlands in Michigan were sampled for mod-scale climate patterns in England for the last 4500 ern testate amoebae (Figure 1). The peatlands spanyears (Charman and Hendon 2000; Hendon et al. the entire gradient from ombrotrophic to minerot-2001), although they have not yet been extensively rophic, and the amount of environmental variationused for high-resolution paleoclimate reconstructions within each peatland varies considerably (Table 1).in other regions. However, because fossil records from oligotrophic,
Testate amoebae are especially abundant and di- Sphagnum-dominated peatlands (i.e., poor fens andverse in Sphagnum-dominated habitats. Modern tes- bogs) would be expected to yield more climaticallytate amoeba samples are usually collected from the sensitive records than those from strongly minero-brown Sphagnum directly below the green portion of trophic peatlands, I focused primarily on Sphagnum-the stems, because it has been suggested that samples dominated sites.
331
Figure 1. Location of the studied peatlands. Abbreviations for the peatlands are as follows: IN – Independence; PL – Partridge Lake; US –Uncle Sam; GT – Grand Traverse; AU – Au Train; AT – Adams Trail; NR – North Rhody; SR – South Rhody; WA – West Adams Trail; TA –Tahquamenon; MI – Minden. Specific locations and characteristics of each peatland are shown in Table 1.
Methods the cylinder allowed air to escape and prevented peatcompaction. The peat was held in the cylinder with
Field methods one hand and pulled up carefully. Peat sticking out ofthe bottom of the cylinder was cut off, and the
Field sampling at all sites was conducted in a 4-week cylinder was sealed. These peat samples were used toperiod from late June until late July 2000. The sam- calculate percent moisture and bulk density. From the
3pling procedure was similar to previous investigations edge of the hole left by the peat sample, a |10-cm(Charman and Warner 1992, 1997; Warner and Char- sample was collected from the brown Sphagnumman 1994; Mitchell et al. 1999; Booth 2001). Micro- directly below the green portion of the stems. Thesites within each peatland were sampled in an attempt entire green portion of the Sphagnum directly aboveto represent the full range of surface-moisture vari- this lower sample was also collected at 89 microsites.ability (e.g., hummocks, hollows, pools) of each peat- Samples from this upper portion of the moss ranged
3 3land. At each microsite, a peat sample was collected from |10 cm to |30 cm and represent the upperby pushing a cylinder (7.5-cm diameter, 11-cm assemblage. Sphagnum from around the hole was alsolength) with one open end into the peat until it was collected for species-level identification. Vascularlevel with the surface of the wetland. A knife was plant species growing within 50 cm of each micrositeused to cut the peat around the cylinder as the can was were also recorded. At microsites lacking Sphagnum,
3pushed into the peat. A small hole in the closed end of a |10-cm sample of peat was collected from the
332
Tab
le1.
Site
char
acte
rist
ics,
incl
udin
gth
era
nge
ofen
viro
nmen
tal
vari
able
sm
easu
red
(%M
–pe
rcen
tm
oist
ure;
WT
D–
wat
erta
ble
dept
h;B
D–
bulk
dens
ity),
num
ber
ofte
stat
eam
oeba
mic
rosi
tes
sam
pled
(n),
Spha
gnum
spp.
pres
ent,
and
age
nera
ldes
crip
tion
ofea
chpe
atla
nd.N
egat
ive
valu
esof
wat
erta
ble
dept
hre
fer
tosi
tes
with
stan
ding
wat
er.D
omin
antv
ascu
lar
plan
tspe
cies
incl
ude
thos
eth
atha
da
perc
entc
over
ofgr
eate
rth
an20
%w
ithin
50cm
ofa
test
ate
amoe
basa
mpl
e.
Site
nam
ean
dlo
catio
npH
%M
WT
DB
Dn
Spha
gnum
spp.
Gen
eral
desc
ript
ion
and
dom
inan
t3
(cm
)(g
/cm
)va
scul
arpl
ant
spec
ies
Ada
ms
Tra
ilB
og(A
T)
(468
3295
299N
,868
393299
W)
3.7–
4.0
72.5
–87.
812
to2
20.
13–0
.15
10S.
papi
llos
um,
S.m
agel
lani
cum
,S.
Ope
n,po
orfe
ndo
min
ated
byC
arex
olig
ospe
rma,
capi
llif
oliu
m,
S.an
gust
ifol
ium
,S.
rube
llum
,S.
Car
exsp
p.,
Sche
uchz
eria
palu
stri
s,an
dR
hync
hosp
ora
viri
dum
,S.
isov
iita
eal
baA
uT
rain
Bay
(AU
)(4
682594
899N
,86
85193
699W
)3.
5–6.
464
.1–8
6.3
29to
227
0.13
–0.1
722
S.pa
pill
osum
,S.
fall
ax,
S.m
agel
lani
cum
,S.
Mic
rosi
tes
rang
ing
from
rich
topo
orfe
ns.
Dom
inan
tm
ajus
ssp.
norv
egic
um,
S.an
gust
ifol
ium
,S.
plan
tsp
ecie
sin
clud
edC
arex
lasi
ocar
pa,
Car
expu
lchr
umol
igos
perm
a,M
enya
nthe
str
ifol
iata
,R
hync
hosp
ora
alba
,Sc
heuc
hzer
iapa
lust
ris,
Cha
mae
daph
neca
lycu
lata
,M
yric
aga
le,V
acci
nium
oxyc
occo
s,an
dT
ypha
lati
foli
aG
rand
Tra
vers
eB
ay(G
T)
(478
995699
N,
888
1591
799W
)3.
7–5.
240
.0–8
0.8
45to
50.
13–0
.52
8S.
pulc
hrum
,S.
papi
llos
um,
S.fa
llax
,S.
Mic
rosi
tes
rang
ing
from
mod
erat
eto
poor
fen.
angu
stif
oliu
m,
S.m
ajus
ssp.
maj
usD
omin
ant
plan
tsp
ecie
sin
clud
eC
arex
olig
ospe
rma,
Cha
mae
daph
neca
lycu
lata
,an
dA
ndro
med
agl
auco
phyl
laIn
depe
nden
ceB
og(I
N)
(478
259999
N,
888
093799
W)
3.7–
4.4
56.6
–85.
936
to2
140.
12–0
.22
29S.
viri
dum
,S.
maj
usss
p.no
rveg
icum
,S.
Mic
rosi
tes
rang
ing
from
mod
erat
eto
poor
fen,
with
mag
ella
nicu
m,
S.fu
scum
,S.
papi
llos
um,
S.sc
atte
red
hum
moc
ksco
ntai
ning
Pic
eam
aria
na,
Lar
ixan
gust
ifol
ium
,S.
maj
usss
p.m
ajus
lari
cina
,an
dC
ham
aeda
phne
caly
cula
ta.
Hol
low
san
dpo
ols
char
acte
rize
dby
Nym
phae
aod
orat
a,M
enya
nthe
str
ifol
iata
,Sc
heuc
hzer
iapa
lust
ris,
Rhy
ncho
spor
aal
ba,
and
Rhy
ncho
spor
afu
sca
Min
den
Bog
(MI)
(438
3694
399N
,82
85091
099W
)3.
4–3.
638
.5–7
8.9
48to
120.
13–0
.23
14S.
palu
stre
,S.
russ
owii
,S.
papi
llos
um,
S.R
aise
dbo
gw
ithsc
atte
red
Pic
eam
aria
na.
Kal
mia
isov
iita
e,S.
fall
ax,
S.m
agel
lani
cum
,S.
poli
foli
aan
dC
ham
aeda
phne
caly
cula
taar
edo
min
ant.
bart
lett
ianu
m,
S.an
gust
ifol
ium
,S.
capi
llif
oliu
mN
orth
Rho
dyB
og(N
R)
(468
3495
799N
,86
849
2099
W)
3.8–
4.3
60.7
–76.
327
to13
0.13
–0.1
812
S.pa
pill
osum
,S.
mag
ella
nicu
m,
S.O
pen,
poor
fen
with
Cha
med
aphn
eca
lycu
lata
,C
arex
angu
stif
oliu
mol
igos
perm
a,an
dC
arex
lim
osa
Part
ridg
eL
ake
Bog
(PL
)(4
782591
199N
,88
809
2799
W)
3.5–
5.4
63.3
–85.
026
to2
100.
11–0
.17
20S.
angu
stif
oliu
m,
S.m
agel
lani
cum
,S.
fusc
um,
Ric
hto
poor
fen
(floa
ting
mat
)w
ithC
ham
aeda
phne
S.is
ovii
tae
S.ru
ssow
ii,
S.m
ajus
ssp.
caly
cula
ta,
Rhy
ncho
spor
aal
ba,V
acci
nium
oxyc
occo
s,no
rveg
icum
Led
umgr
oenl
andi
cum
,an
dSc
heuc
hzer
iapa
lust
ris
Sout
hR
hody
Bog
(SR
)(4
683395
799N
,86
849
3099
W)
3.7–
4.2
76.3
–82.
025
to2
0.14
–0.1
816
S.m
agel
lani
cum
,S.
maj
usss
p.m
ajus
,S.
Ope
n,po
orfe
nw
ithC
arex
olig
ospe
rma,
Car
excu
spid
atum
,S.
viri
dum
,S.
fall
ax,
S.li
mos
a,C
ham
aeda
phne
caly
cula
ta,
and
Vacc
iniu
man
gust
ifol
ium
,S.
papi
llos
um,
S.m
ajus
ssp.
oxyc
occo
sno
rveg
icum
Tah
quam
enon
Bay
(TA
)(4
682893
199N
,84
85994
199W
)4.
2–5.
167
.3–7
8.7
50to
90.
16–0
.17
4S.
cent
rale
,S.
papi
llos
um,
S.m
agel
lani
cum
,S.
Poor
tom
oder
atel
yri
chfe
n,w
ithso
me
mic
rosi
tes
fall
ax,
S.ru
ssow
iiop
enan
dot
hers
fore
sted
.D
omin
ant
spec
ies
incl
ude
Car
extr
ispe
rma,
Smil
acin
ara
cem
osa,
and
othe
rC
arex
spp.
Unc
leSa
mB
og(U
S)
(478
259999
N,
888
095999
W)
3.3–
3.7
50.5
–62.
650
to48
0.15
–0.1
78
S.m
agel
lani
cum
,S.
angu
stif
oliu
m,
S.ru
ssow
ii,
Fore
sted
bog
dom
inat
edby
Pic
eam
aria
na.
Som
eS.
girg
enso
hnii
Pin
usst
robu
s,L
arix
lari
cina
,an
dB
etul
aal
legh
anie
nsis
.U
nder
stor
ydo
min
ated
byL
edum
groe
nlan
dicu
m,V
acci
nium
myr
till
oide
s,an
dC
ham
aeda
phne
caly
cula
taW
est
Ada
ms
Tra
ilB
og(W
A)
(468
3391
299N
,86
869
1799
W)
3.9–
3.9
74.4
–80.
119
to19
0.16
–0.1
84
S.m
agel
lani
cum
,S.
fall
ax,
S.pa
pill
osum
,S.
Ope
n,po
orfe
nw
ithC
ham
aeda
phne
caly
cula
ta,
angu
stif
oliu
mA
ndro
med
agl
auco
phyl
la,
and
Car
exsp
p.
333
surface of the peatland. The depth to the water table Nebela vitraea Penard, Nebela flabellulum Leidy,and pH were measured at each microsite. pH was Nebela tubulosa Penard, Quadruella symmetricameasured as close to the amoeba sample as possible, (Wallich) Schulze) were eliminated from the datasettypically by squeezing the water from the adjacent prior to the calculation of relative abundances. TaxaSphagnum or peat. At sites with standing water, depth included in the analyses, including taxonomic au-to water table was recorded as a negative value (i.e., thorities, are listed in Table 2. Sphagnum speciesdistance from the peat surface to the water surface). present at less than three sites (S. bartlettianum Warn-
storf, S. centrale C. Jensen, S. cuspidatum Hoffman,Dataset descriptions S. fuscum (Schimp.) Klinggraff, S. girgensohnii Rus-
sow, S. palustre Linnaeus, S. pulchrum (Braithw.)The calibration dataset consists of all the lower as- Warnstorf) were not included in the analyses.semblages and the samples collected from substrates Direct and indirect gradient analysis techniquesother than Sphagnum. These samples are comparable were used to investigate relationships among sites,to datasets collected for the development of transfer environment, Sphagnum species, and testate amoebaefunctions in other studies (e.g., Charman and Warner in the calibration dataset. Four models were used to(1992, 1997), Charman (1997), Warner and Charman develop transfer functions using the program CALI-(1994),Woodland et al. (1998), Mitchell et al. (1999), BRATE (Juggins 1998). These models includedBooth (2001)). The upper and lower assemblage weighted averaging (WA), tolerance downweighteddataset consists of pairs of upper and lower assem- averaging (WA-Tol), partial least squares (PLS), andblages, with each pair corresponding to one microsite. weighted averaging partial least squares (WA-PLS)
(Birks 1995, 1998). These models were chosen be-Laboratory methods cause they have been used successfully to develop
transfer functions from testate amoeba data in otherTestate amoebae were isolated from peat using the studies (e.g., Woodland et al. (1998), Charmanmethod of Hendon and Charman (1997). Samples (1997), Charman and Warner (1992), Booth (2001)).were boiled in distilled water for 10 min and washed Indirect and direct gradient analysis techniquesthrough 355 and 15-mm sieves. The material caught in were also used to investigate relationships amongthe 15-mm sieve was stained with two drops of environment, Sphagnum species, and upper and lowersafranine and stored in glycerol. Slides were prepared, assemblages. A community coefficient was alsoand all testate amoebae were identified and counted calculated between each pair of upper and loweruntil a total of at least 150 was reached. Taxonomy assemblages using Sørenson’s index of taxonomicfollows Charman et al. (2000), except as indicated in similarity and this index of similarity was comparedTable 2. The relative abundance of each taxon was to environmental variables using linear correlation.calculated as a percent of the total number of testate Species richness, and the abundance and frequency ofamoebae counted. Habrotrocha angusticollis, a com- common taxa (those present in at least 25 upper-lowermonly fossilized rotifer (Warner 1988), was included sample pairs), were compared between upper andin the analysis and count total. lower assemblages. Regression was used to compare
the abundance of each taxon in upper and lowerAnalytical techniques assemblages. Chi-Square tests and odds ratios were
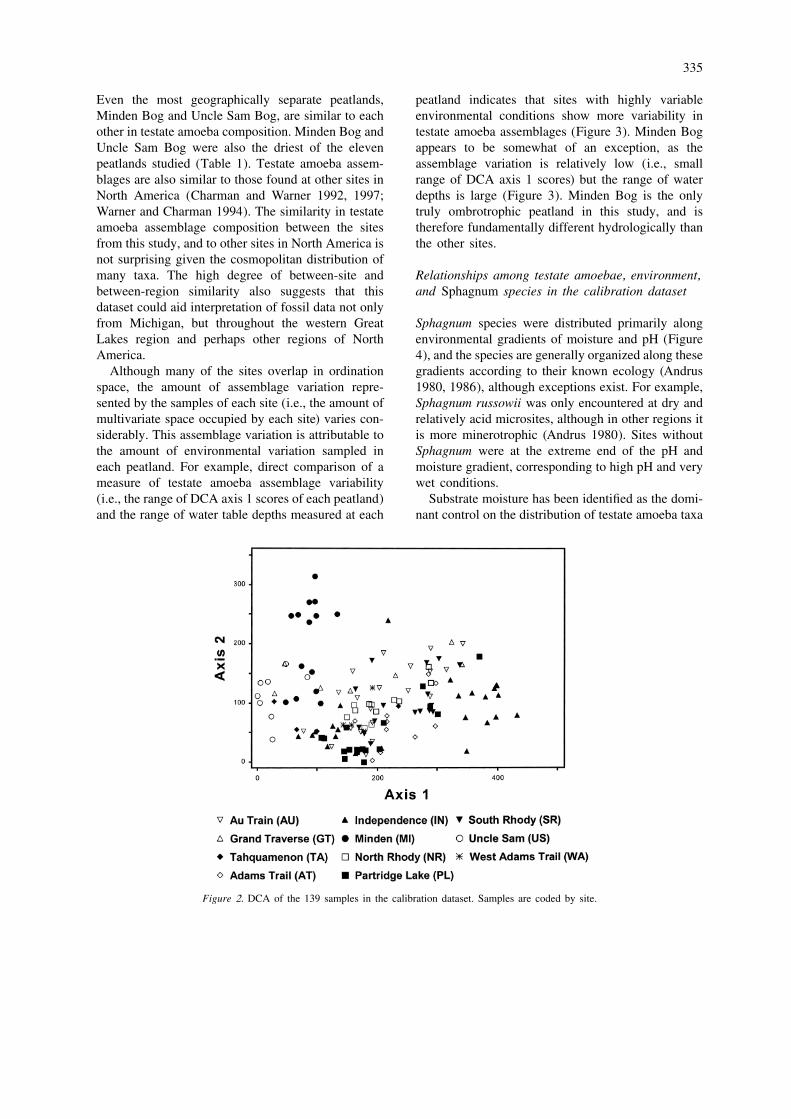
used to assess differences in the frequency of taxa inOutlier analysis was performed with the software PC- the two groups.ORD (McCune and Mefford 1999). Five samplesfrom the calibration dataset had species or environ-mental data more than 2 S.D. from the mean and were Results and discussionidentified as outliers. These samples were removedfrom further analysis. The resulting calibration dataset Variability among sites in the calibration datasetincluded 139 assemblages, of which 89 samples col-lected from Sphagnum had associated upper assem- Detrended correspondence analysis (DCA) was usedblages. Taxa encountered in less than five samples to investigate the similarity of the 139 assemblages at(Cryptodifflugia sacculus Penard, Lesquereusia the different study sites. Samples from most sites
¨modesta (Ehrenberg) Butschli, Nebela barbata Leidy, overlap a great deal in ordination space (Figure 2).
334
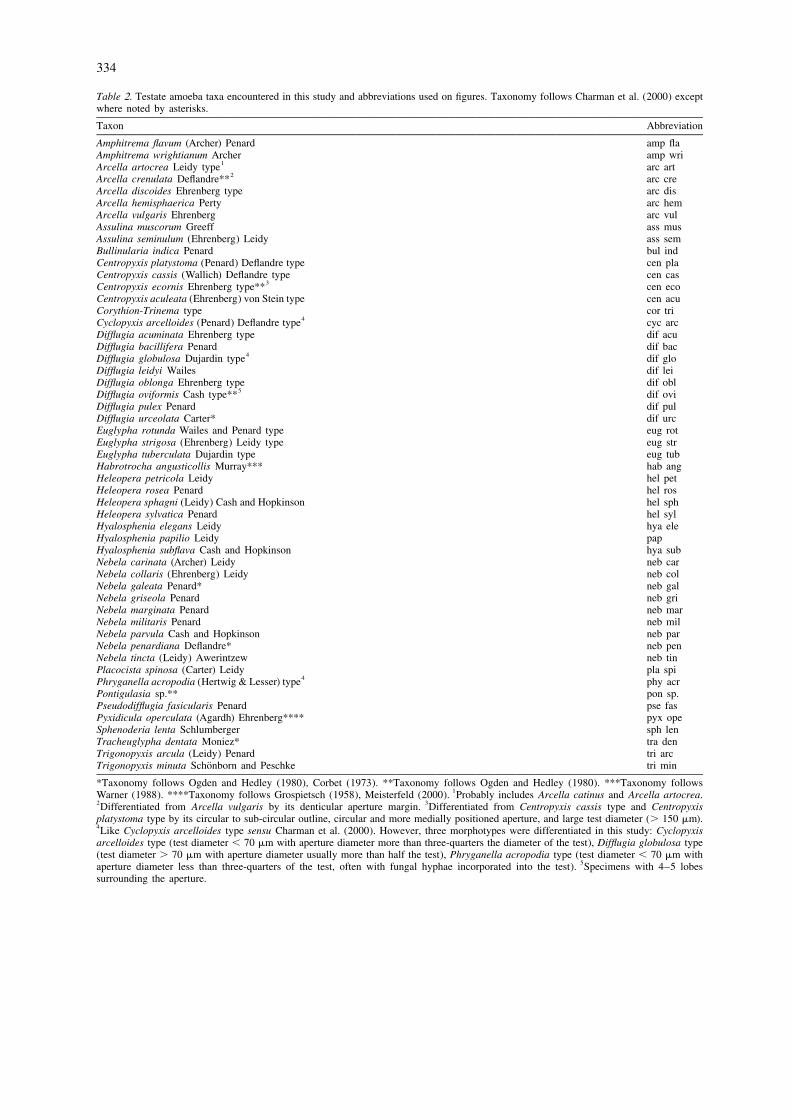
Table 2. Testate amoeba taxa encountered in this study and abbreviations used on figures. Taxonomy follows Charman et al. (2000) exceptwhere noted by asterisks.
Taxon Abbreviation
Amphitrema flavum (Archer) Penard amp flaAmphitrema wrightianum Archer amp wri
1Arcella artocrea Leidy type arc art2Arcella crenulata Deflandre** arc cre
Arcella discoides Ehrenberg type arc disArcella hemisphaerica Perty arc hemArcella vulgaris Ehrenberg arc vulAssulina muscorum Greeff ass musAssulina seminulum (Ehrenberg) Leidy ass semBullinularia indica Penard bul indCentropyxis platystoma (Penard) Deflandre type cen plaCentropyxis cassis (Wallich) Deflandre type cen cas
3Centropyxis ecornis Ehrenberg type** cen ecoCentropyxis aculeata (Ehrenberg) von Stein type cen acuCorythion-Trinema type cor tri
4Cyclopyxis arcelloides (Penard) Deflandre type cyc arcDifflugia acuminata Ehrenberg type dif acuDifflugia bacillifera Penard dif bac
4Difflugia globulosa Dujardin type dif gloDifflugia leidyi Wailes dif leiDifflugia oblonga Ehrenberg type dif obl
5Difflugia oviformis Cash type** dif oviDifflugia pulex Penard dif pulDifflugia urceolata Carter* dif urcEuglypha rotunda Wailes and Penard type eug rotEuglypha strigosa (Ehrenberg) Leidy type eug strEuglypha tuberculata Dujardin type eug tubHabrotrocha angusticollis Murray*** hab angHeleopera petricola Leidy hel petHeleopera rosea Penard hel rosHeleopera sphagni (Leidy) Cash and Hopkinson hel sphHeleopera sylvatica Penard hel sylHyalosphenia elegans Leidy hya eleHyalosphenia papilio Leidy papHyalosphenia subflava Cash and Hopkinson hya subNebela carinata (Archer) Leidy neb carNebela collaris (Ehrenberg) Leidy neb colNebela galeata Penard* neb galNebela griseola Penard neb griNebela marginata Penard neb marNebela militaris Penard neb milNebela parvula Cash and Hopkinson neb parNebela penardiana Deflandre* neb penNebela tincta (Leidy) Awerintzew neb tinPlacocista spinosa (Carter) Leidy pla spi
4Phryganella acropodia (Hertwig & Lesser) type phy acrPontigulasia sp.** pon sp.Pseudodifflugia fasicularis Penard pse fasPyxidicula operculata (Agardh) Ehrenberg**** pyx opeSphenoderia lenta Schlumberger sph lenTracheuglypha dentata Moniez* tra denTrigonopyxis arcula (Leidy) Penard tri arc
¨Trigonopyxis minuta Schonborn and Peschke tri min
*Taxonomy follows Ogden and Hedley (1980), Corbet (1973). **Taxonomy follows Ogden and Hedley (1980). ***Taxonomy follows1Warner (1988). ****Taxonomy follows Grospietsch (1958), Meisterfeld (2000). Probably includes Arcella catinus and Arcella artocrea.
2 3Differentiated from Arcella vulgaris by its denticular aperture margin. Differentiated from Centropyxis cassis type and Centropyxisplatystoma type by its circular to sub-circular outline, circular and more medially positioned aperture, and large test diameter (. 150 mm).4Like Cyclopyxis arcelloides type sensu Charman et al. (2000). However, three morphotypes were differentiated in this study: Cyclopyxisarcelloides type (test diameter , 70 mm with aperture diameter more than three-quarters the diameter of the test), Difflugia globulosa type(test diameter . 70 mm with aperture diameter usually more than half the test), Phryganella acropodia type (test diameter , 70 mm with
5aperture diameter less than three-quarters of the test, often with fungal hyphae incorporated into the test). Specimens with 4–5 lobessurrounding the aperture.
335
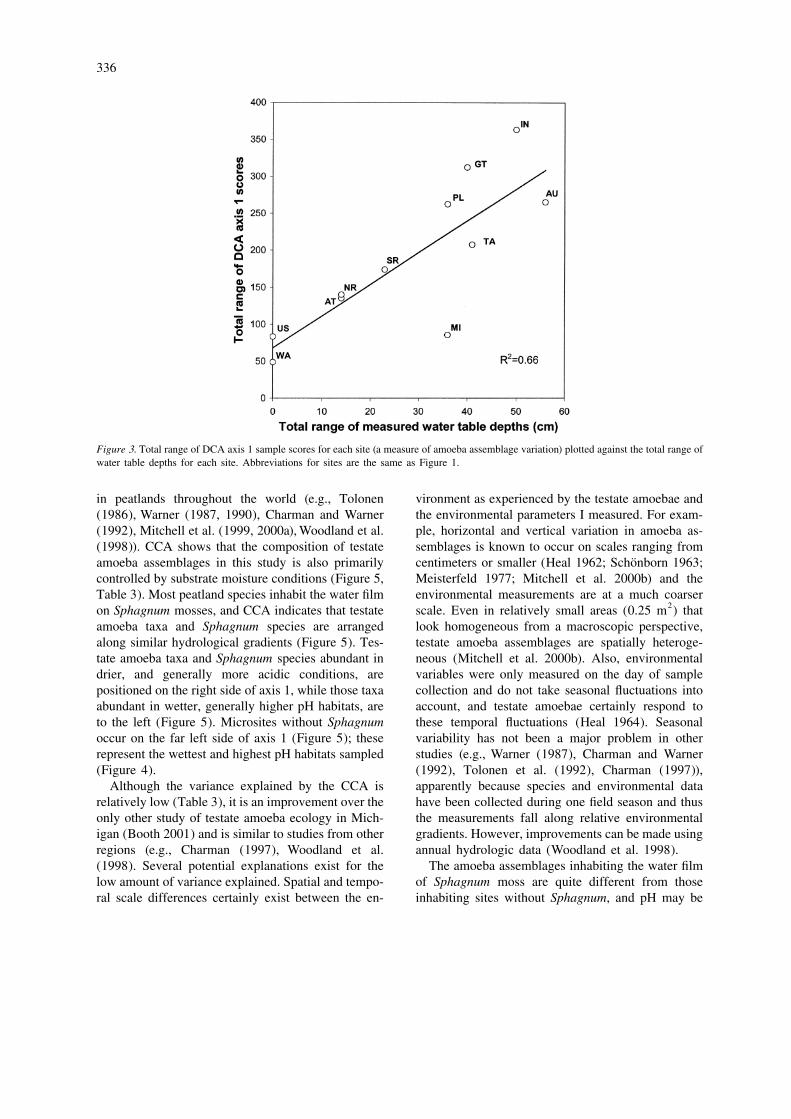
Even the most geographically separate peatlands, peatland indicates that sites with highly variableMinden Bog and Uncle Sam Bog, are similar to each environmental conditions show more variability inother in testate amoeba composition. Minden Bog and testate amoeba assemblages (Figure 3). Minden BogUncle Sam Bog were also the driest of the eleven appears to be somewhat of an exception, as thepeatlands studied (Table 1). Testate amoeba assem- assemblage variation is relatively low (i.e., smallblages are also similar to those found at other sites in range of DCA axis 1 scores) but the range of waterNorth America (Charman and Warner 1992, 1997; depths is large (Figure 3). Minden Bog is the onlyWarner and Charman 1994). The similarity in testate truly ombrotrophic peatland in this study, and isamoeba assemblage composition between the sites therefore fundamentally different hydrologically thanfrom this study, and to other sites in North America is the other sites.not surprising given the cosmopolitan distribution ofmany taxa. The high degree of between-site and Relationships among testate amoebae, environment,between-region similarity also suggests that this and Sphagnum species in the calibration datasetdataset could aid interpretation of fossil data not onlyfrom Michigan, but throughout the western Great Sphagnum species were distributed primarily alongLakes region and perhaps other regions of North environmental gradients of moisture and pH (FigureAmerica. 4), and the species are generally organized along these
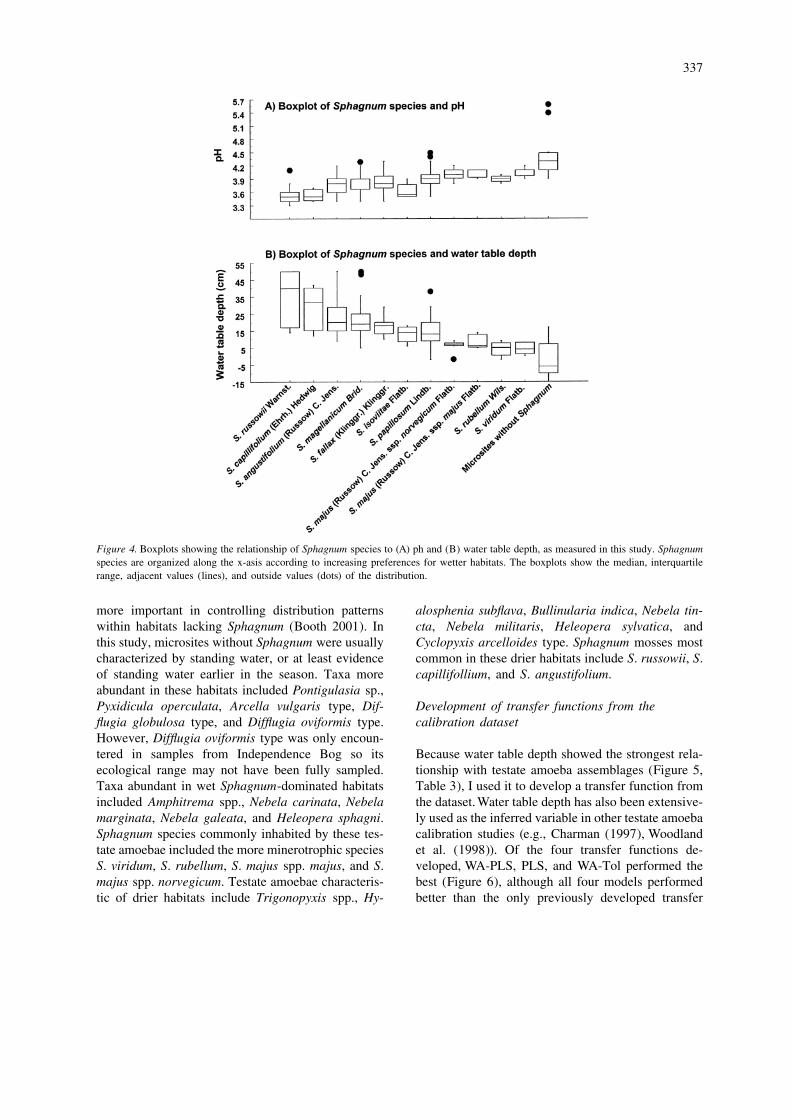
Although many of the sites overlap in ordination gradients according to their known ecology (Andrusspace, the amount of assemblage variation repre- 1980, 1986), although exceptions exist. For example,sented by the samples of each site (i.e., the amount of Sphagnum russowii was only encountered at dry andmultivariate space occupied by each site) varies con- relatively acid microsites, although in other regions itsiderably. This assemblage variation is attributable to is more minerotrophic (Andrus 1980). Sites withoutthe amount of environmental variation sampled in Sphagnum were at the extreme end of the pH andeach peatland. For example, direct comparison of a moisture gradient, corresponding to high pH and verymeasure of testate amoeba assemblage variability wet conditions.(i.e., the range of DCA axis 1 scores of each peatland) Substrate moisture has been identified as the domi-and the range of water table depths measured at each nant control on the distribution of testate amoeba taxa
Figure 2. DCA of the 139 samples in the calibration dataset. Samples are coded by site.
336
Figure 3. Total range of DCA axis 1 sample scores for each site (a measure of amoeba assemblage variation) plotted against the total range ofwater table depths for each site. Abbreviations for sites are the same as Figure 1.
in peatlands throughout the world (e.g., Tolonen vironment as experienced by the testate amoebae and(1986), Warner (1987, 1990), Charman and Warner the environmental parameters I measured. For exam-(1992), Mitchell et al. (1999, 2000a), Woodland et al. ple, horizontal and vertical variation in amoeba as-(1998)). CCA shows that the composition of testate semblages is known to occur on scales ranging from
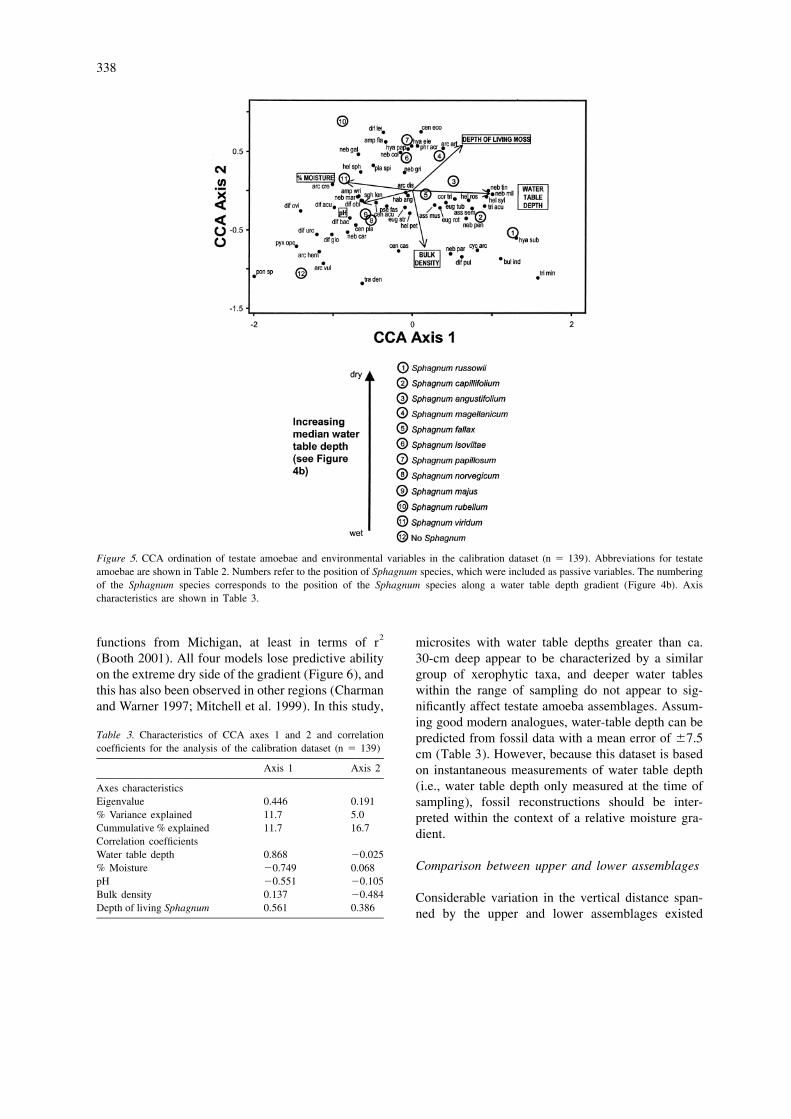
¨amoeba assemblages in this study is also primarily centimeters or smaller (Heal 1962; Schonborn 1963;controlled by substrate moisture conditions (Figure 5, Meisterfeld 1977; Mitchell et al. 2000b) and theTable 3). Most peatland species inhabit the water film environmental measurements are at a much coarser
2on Sphagnum mosses, and CCA indicates that testate scale. Even in relatively small areas (0.25 m ) thatamoeba taxa and Sphagnum species are arranged look homogeneous from a macroscopic perspective,along similar hydrological gradients (Figure 5). Tes- testate amoeba assemblages are spatially heteroge-tate amoeba taxa and Sphagnum species abundant in neous (Mitchell et al. 2000b). Also, environmentaldrier, and generally more acidic conditions, are variables were only measured on the day of samplepositioned on the right side of axis 1, while those taxa collection and do not take seasonal fluctuations intoabundant in wetter, generally higher pH habitats, are account, and testate amoebae certainly respond toto the left (Figure 5). Microsites without Sphagnum these temporal fluctuations (Heal 1964). Seasonaloccur on the far left side of axis 1 (Figure 5); these variability has not been a major problem in otherrepresent the wettest and highest pH habitats sampled studies (e.g., Warner (1987), Charman and Warner(Figure 4). (1992), Tolonen et al. (1992), Charman (1997)),
Although the variance explained by the CCA is apparently because species and environmental datarelatively low (Table 3), it is an improvement over the have been collected during one field season and thusonly other study of testate amoeba ecology in Mich- the measurements fall along relative environmentaligan (Booth 2001) and is similar to studies from other gradients. However, improvements can be made usingregions (e.g., Charman (1997), Woodland et al. annual hydrologic data (Woodland et al. 1998).(1998). Several potential explanations exist for the The amoeba assemblages inhabiting the water filmlow amount of variance explained. Spatial and tempo- of Sphagnum moss are quite different from thoseral scale differences certainly exist between the en- inhabiting sites without Sphagnum, and pH may be
337
Figure 4. Boxplots showing the relationship of Sphagnum species to (A) ph and (B) water table depth, as measured in this study. Sphagnumspecies are organized along the x-asis according to increasing preferences for wetter habitats. The boxplots show the median, interquartilerange, adjacent values (lines), and outside values (dots) of the distribution.
more important in controlling distribution patterns alosphenia subflava, Bullinularia indica, Nebela tin-within habitats lacking Sphagnum (Booth 2001). In cta, Nebela militaris, Heleopera sylvatica, andthis study, microsites without Sphagnum were usually Cyclopyxis arcelloides type. Sphagnum mosses mostcharacterized by standing water, or at least evidence common in these drier habitats include S. russowii, S.of standing water earlier in the season. Taxa more capillifollium, and S. angustifolium.abundant in these habitats included Pontigulasia sp.,Pyxidicula operculata, Arcella vulgaris type, Dif- Development of transfer functions from theflugia globulosa type, and Difflugia oviformis type. calibration datasetHowever, Difflugia oviformis type was only encoun-tered in samples from Independence Bog so its Because water table depth showed the strongest rela-ecological range may not have been fully sampled. tionship with testate amoeba assemblages (Figure 5,Taxa abundant in wet Sphagnum-dominated habitats Table 3), I used it to develop a transfer function fromincluded Amphitrema spp., Nebela carinata, Nebela the dataset. Water table depth has also been extensive-marginata, Nebela galeata, and Heleopera sphagni. ly used as the inferred variable in other testate amoebaSphagnum species commonly inhabited by these tes- calibration studies (e.g., Charman (1997), Woodlandtate amoebae included the more minerotrophic species et al. (1998)). Of the four transfer functions de-S. viridum, S. rubellum, S. majus spp. majus, and S. veloped, WA-PLS, PLS, and WA-Tol performed themajus spp. norvegicum. Testate amoebae characteris- best (Figure 6), although all four models performedtic of drier habitats include Trigonopyxis spp., Hy- better than the only previously developed transfer
338
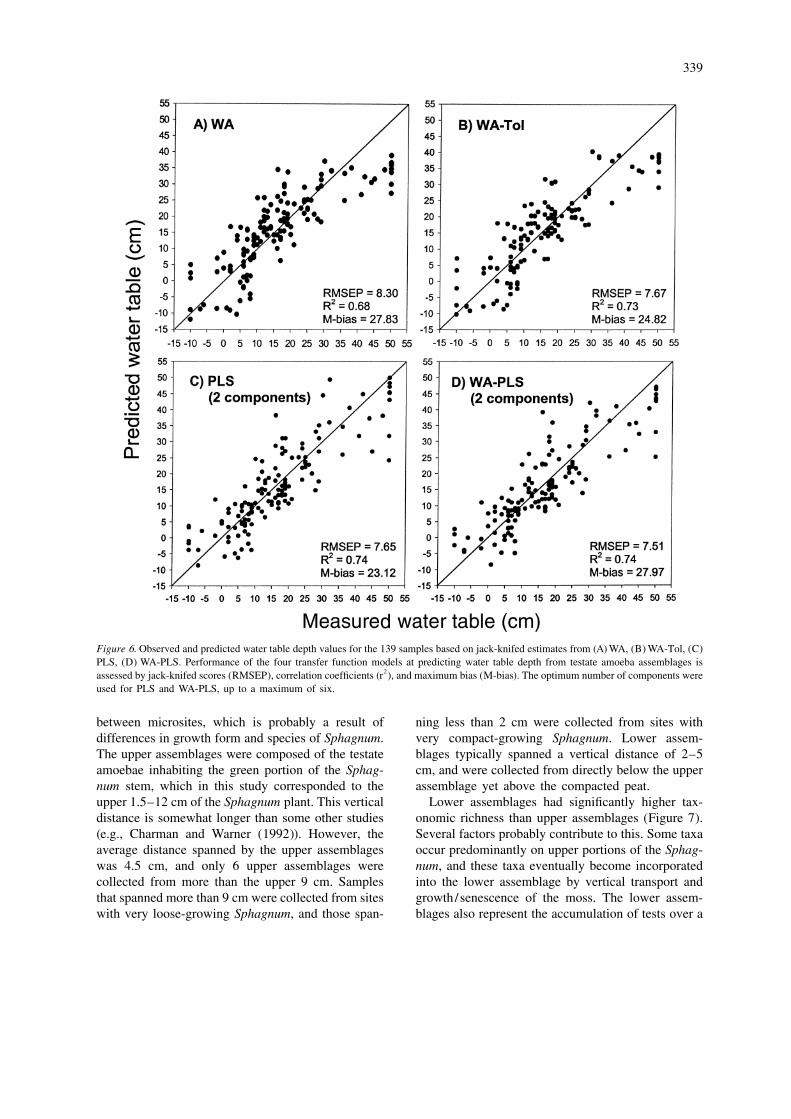
Figure 5. CCA ordination of testate amoebae and environmental variables in the calibration dataset (n 5 139). Abbreviations for testateamoebae are shown in Table 2. Numbers refer to the position of Sphagnum species, which were included as passive variables. The numberingof the Sphagnum species corresponds to the position of the Sphagnum species along a water table depth gradient (Figure 4b). Axischaracteristics are shown in Table 3.
2functions from Michigan, at least in terms of r microsites with water table depths greater than ca.(Booth 2001). All four models lose predictive ability 30-cm deep appear to be characterized by a similaron the extreme dry side of the gradient (Figure 6), and group of xerophytic taxa, and deeper water tablesthis has also been observed in other regions (Charman within the range of sampling do not appear to sig-and Warner 1997; Mitchell et al. 1999). In this study, nificantly affect testate amoeba assemblages. Assum-
ing good modern analogues, water-table depth can beTable 3. Characteristics of CCA axes 1 and 2 and correlation predicted from fossil data with a mean error of 67.5coefficients for the analysis of the calibration dataset (n 5 139) cm (Table 3). However, because this dataset is based
Axis 1 Axis 2 on instantaneous measurements of water table depth(i.e., water table depth only measured at the time ofAxes characteristics
Eigenvalue 0.446 0.191 sampling), fossil reconstructions should be inter-% Variance explained 11.7 5.0 preted within the context of a relative moisture gra-Cummulative % explained 11.7 16.7 dient.Correlation coefficientsWater table depth 0.868 20.025
Comparison between upper and lower assemblages% Moisture 20.749 0.068pH 20.551 20.105Bulk density 0.137 20.484 Considerable variation in the vertical distance span-Depth of living Sphagnum 0.561 0.386 ned by the upper and lower assemblages existed
339
Figure 6. Observed and predicted water table depth values for the 139 samples based on jack-knifed estimates from (A) WA, (B) WA-Tol, (C)PLS, (D) WA-PLS. Performance of the four transfer function models at predicting water table depth from testate amoeba assemblages is
2assessed by jack-knifed scores (RMSEP), correlation coefficients (r ), and maximum bias (M-bias). The optimum number of components wereused for PLS and WA-PLS, up to a maximum of six.
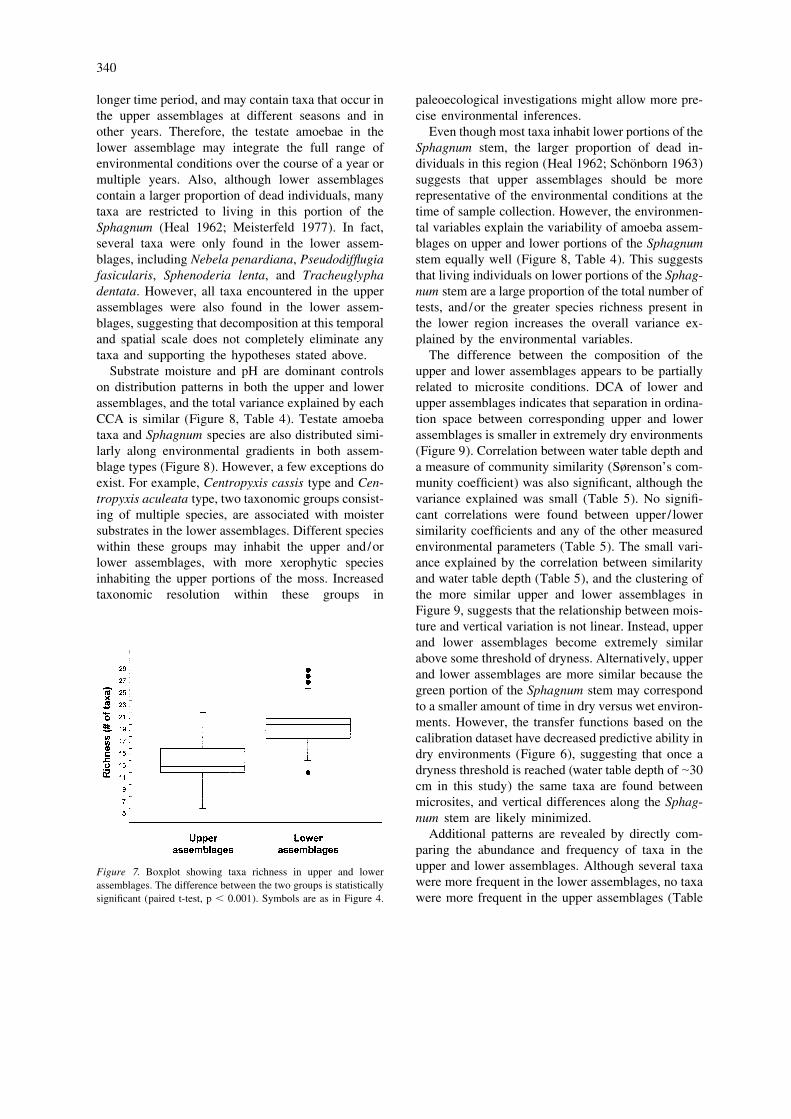
between microsites, which is probably a result of ning less than 2 cm were collected from sites withdifferences in growth form and species of Sphagnum. very compact-growing Sphagnum. Lower assem-The upper assemblages were composed of the testate blages typically spanned a vertical distance of 2–5amoebae inhabiting the green portion of the Sphag- cm, and were collected from directly below the uppernum stem, which in this study corresponded to the assemblage yet above the compacted peat.upper 1.5–12 cm of the Sphagnum plant. This vertical Lower assemblages had significantly higher tax-distance is somewhat longer than some other studies onomic richness than upper assemblages (Figure 7).(e.g., Charman and Warner (1992)). However, the Several factors probably contribute to this. Some taxaaverage distance spanned by the upper assemblages occur predominantly on upper portions of the Sphag-was 4.5 cm, and only 6 upper assemblages were num, and these taxa eventually become incorporatedcollected from more than the upper 9 cm. Samples into the lower assemblage by vertical transport andthat spanned more than 9 cm were collected from sites growth/senescence of the moss. The lower assem-with very loose-growing Sphagnum, and those span- blages also represent the accumulation of tests over a
340
longer time period, and may contain taxa that occur in paleoecological investigations might allow more pre-the upper assemblages at different seasons and in cise environmental inferences.other years. Therefore, the testate amoebae in the Even though most taxa inhabit lower portions of thelower assemblage may integrate the full range of Sphagnum stem, the larger proportion of dead in-
¨environmental conditions over the course of a year or dividuals in this region (Heal 1962; Schonborn 1963)multiple years. Also, although lower assemblages suggests that upper assemblages should be morecontain a larger proportion of dead individuals, many representative of the environmental conditions at thetaxa are restricted to living in this portion of the time of sample collection. However, the environmen-Sphagnum (Heal 1962; Meisterfeld 1977). In fact, tal variables explain the variability of amoeba assem-several taxa were only found in the lower assem- blages on upper and lower portions of the Sphagnumblages, including Nebela penardiana, Pseudodifflugia stem equally well (Figure 8, Table 4). This suggestsfasicularis, Sphenoderia lenta, and Tracheuglypha that living individuals on lower portions of the Sphag-dentata. However, all taxa encountered in the upper num stem are a large proportion of the total number ofassemblages were also found in the lower assem- tests, and/or the greater species richness present inblages, suggesting that decomposition at this temporal the lower region increases the overall variance ex-and spatial scale does not completely eliminate any plained by the environmental variables.taxa and supporting the hypotheses stated above. The difference between the composition of the
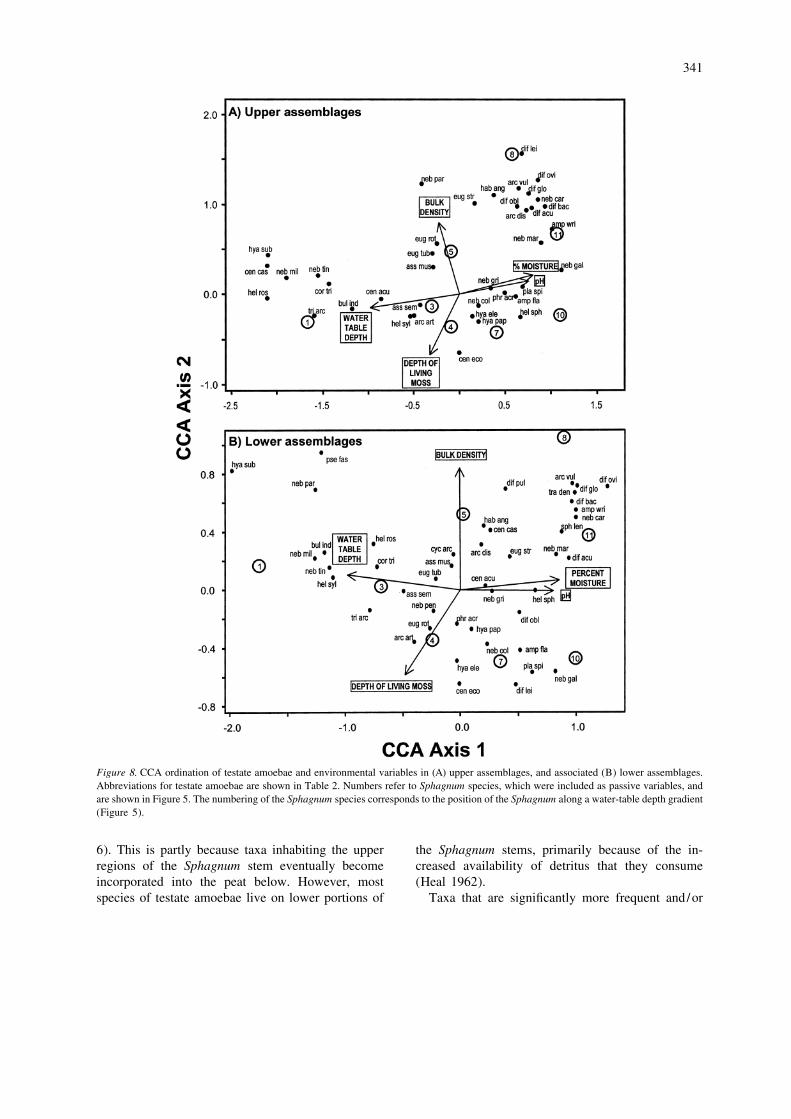
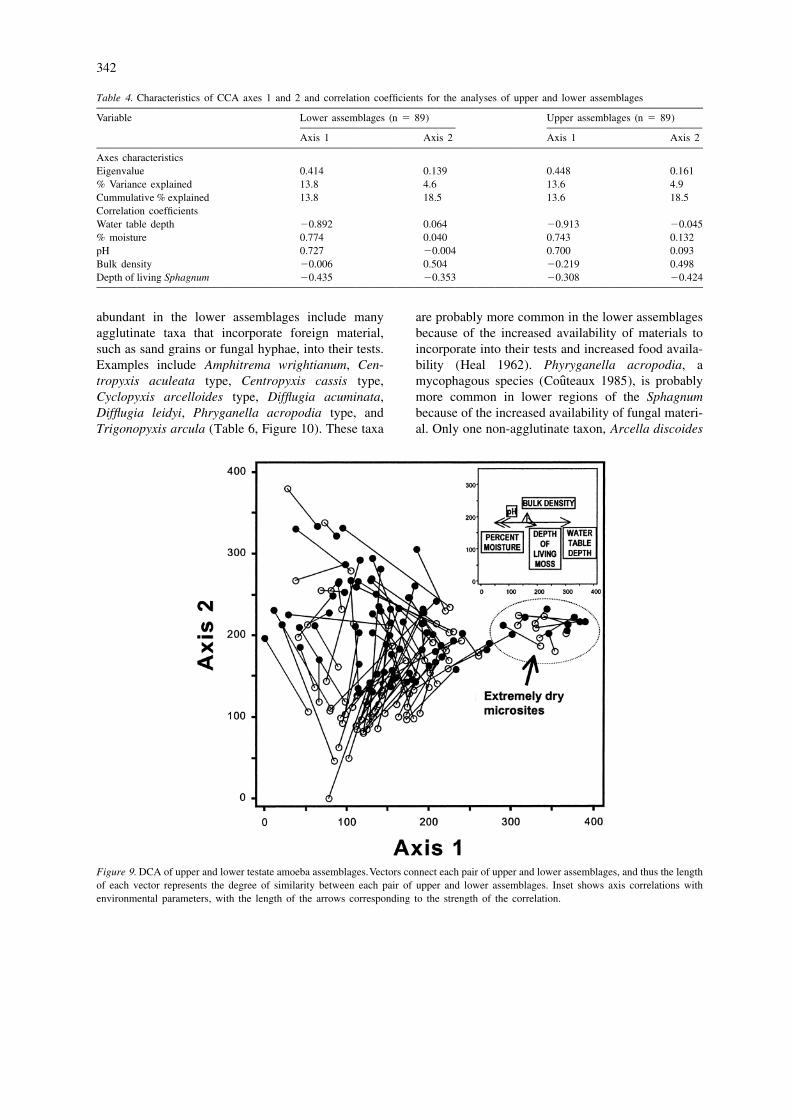
Substrate moisture and pH are dominant controls upper and lower assemblages appears to be partiallyon distribution patterns in both the upper and lower related to microsite conditions. DCA of lower andassemblages, and the total variance explained by each upper assemblages indicates that separation in ordina-CCA is similar (Figure 8, Table 4). Testate amoeba tion space between corresponding upper and lowertaxa and Sphagnum species are also distributed simi- assemblages is smaller in extremely dry environmentslarly along environmental gradients in both assem- (Figure 9). Correlation between water table depth andblage types (Figure 8). However, a few exceptions do a measure of community similarity (Sørenson’s com-exist. For example, Centropyxis cassis type and Cen- munity coefficient) was also significant, although thetropyxis aculeata type, two taxonomic groups consist- variance explained was small (Table 5). No signifi-ing of multiple species, are associated with moister cant correlations were found between upper / lowersubstrates in the lower assemblages. Different species similarity coefficients and any of the other measuredwithin these groups may inhabit the upper and/or environmental parameters (Table 5). The small vari-lower assemblages, with more xerophytic species ance explained by the correlation between similarityinhabiting the upper portions of the moss. Increased and water table depth (Table 5), and the clustering oftaxonomic resolution within these groups in the more similar upper and lower assemblages in
Figure 9, suggests that the relationship between mois-ture and vertical variation is not linear. Instead, upperand lower assemblages become extremely similarabove some threshold of dryness. Alternatively, upperand lower assemblages are more similar because thegreen portion of the Sphagnum stem may correspondto a smaller amount of time in dry versus wet environ-ments. However, the transfer functions based on thecalibration dataset have decreased predictive ability indry environments (Figure 6), suggesting that once adryness threshold is reached (water table depth of |30cm in this study) the same taxa are found betweenmicrosites, and vertical differences along the Sphag-num stem are likely minimized.
Additional patterns are revealed by directly com-paring the abundance and frequency of taxa in theupper and lower assemblages. Although several taxaFigure 7. Boxplot showing taxa richness in upper and lowerwere more frequent in the lower assemblages, no taxaassemblages. The difference between the two groups is statistically
significant (paired t-test, p , 0.001). Symbols are as in Figure 4. were more frequent in the upper assemblages (Table
341
Figure 8. CCA ordination of testate amoebae and environmental variables in (A) upper assemblages, and associated (B) lower assemblages.Abbreviations for testate amoebae are shown in Table 2. Numbers refer to Sphagnum species, which were included as passive variables, andare shown in Figure 5. The numbering of the Sphagnum species corresponds to the position of the Sphagnum along a water-table depth gradient(Figure 5).
6). This is partly because taxa inhabiting the upper the Sphagnum stems, primarily because of the in-regions of the Sphagnum stem eventually become creased availability of detritus that they consumeincorporated into the peat below. However, most (Heal 1962).species of testate amoebae live on lower portions of Taxa that are significantly more frequent and/or
342
Table 4. Characteristics of CCA axes 1 and 2 and correlation coefficients for the analyses of upper and lower assemblages
Variable Lower assemblages (n 5 89) Upper assemblages (n 5 89)
Axis 1 Axis 2 Axis 1 Axis 2
Axes characteristicsEigenvalue 0.414 0.139 0.448 0.161% Variance explained 13.8 4.6 13.6 4.9Cummulative % explained 13.8 18.5 13.6 18.5Correlation coefficientsWater table depth 20.892 0.064 20.913 20.045% moisture 0.774 0.040 0.743 0.132pH 0.727 20.004 0.700 0.093Bulk density 20.006 0.504 20.219 0.498Depth of living Sphagnum 20.435 20.353 20.308 20.424
abundant in the lower assemblages include many are probably more common in the lower assemblagesagglutinate taxa that incorporate foreign material, because of the increased availability of materials tosuch as sand grains or fungal hyphae, into their tests. incorporate into their tests and increased food availa-Examples include Amphitrema wrightianum, Cen- bility (Heal 1962). Phyryganella acropodia, a
ˆtropyxis aculeata type, Centropyxis cassis type, mycophagous species (Couteaux 1985), is probablyCyclopyxis arcelloides type, Difflugia acuminata, more common in lower regions of the SphagnumDifflugia leidyi, Phryganella acropodia type, and because of the increased availability of fungal materi-Trigonopyxis arcula (Table 6, Figure 10). These taxa al. Only one non-agglutinate taxon, Arcella discoides
Figure 9. DCA of upper and lower testate amoeba assemblages.Vectors connect each pair of upper and lower assemblages, and thus the lengthof each vector represents the degree of similarity between each pair of upper and lower assemblages. Inset shows axis correlations withenvironmental parameters, with the length of the arrows corresponding to the strength of the correlation.
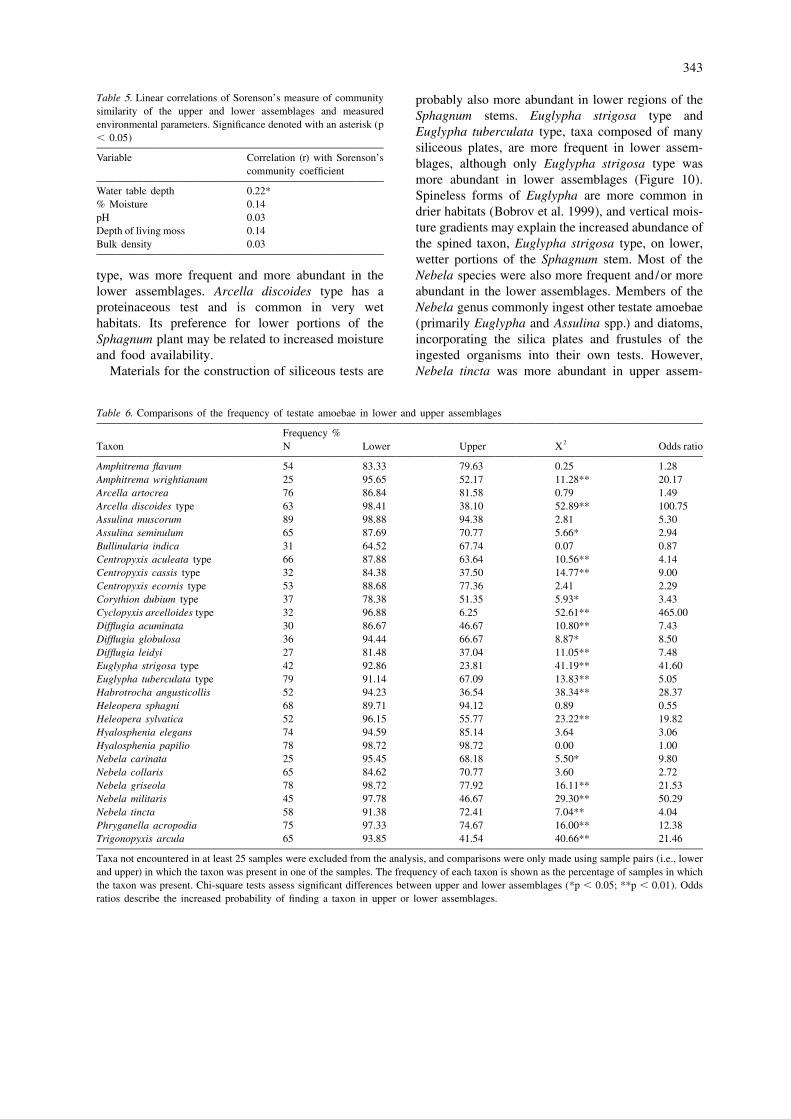
343
Table 5. Linear correlations of Sorenson’s measure of community probably also more abundant in lower regions of thesimilarity of the upper and lower assemblages and measured Sphagnum stems. Euglypha strigosa type andenvironmental parameters. Significance denoted with an asterisk (p
Euglypha tuberculata type, taxa composed of many, 0.05)
siliceous plates, are more frequent in lower assem-Variable Correlation (r) with Sorenson’s blages, although only Euglypha strigosa type was
community coefficientmore abundant in lower assemblages (Figure 10).
Water table depth 0.22* Spineless forms of Euglypha are more common in% Moisture 0.14
drier habitats (Bobrov et al. 1999), and vertical mois-pH 0.03ture gradients may explain the increased abundance ofDepth of living moss 0.14
Bulk density 0.03 the spined taxon, Euglypha strigosa type, on lower,wetter portions of the Sphagnum stem. Most of the
type, was more frequent and more abundant in the Nebela species were also more frequent and/or morelower assemblages. Arcella discoides type has a abundant in the lower assemblages. Members of theproteinaceous test and is common in very wet Nebela genus commonly ingest other testate amoebaehabitats. Its preference for lower portions of the (primarily Euglypha and Assulina spp.) and diatoms,Sphagnum plant may be related to increased moisture incorporating the silica plates and frustules of theand food availability. ingested organisms into their own tests. However,
Materials for the construction of siliceous tests are Nebela tincta was more abundant in upper assem-
Table 6. Comparisons of the frequency of testate amoebae in lower and upper assemblages
Frequency %2Taxon N Lower Upper X Odds ratio
Amphitrema flavum 54 83.33 79.63 0.25 1.28Amphitrema wrightianum 25 95.65 52.17 11.28** 20.17Arcella artocrea 76 86.84 81.58 0.79 1.49Arcella discoides type 63 98.41 38.10 52.89** 100.75Assulina muscorum 89 98.88 94.38 2.81 5.30Assulina seminulum 65 87.69 70.77 5.66* 2.94Bullinularia indica 31 64.52 67.74 0.07 0.87Centropyxis aculeata type 66 87.88 63.64 10.56** 4.14Centropyxis cassis type 32 84.38 37.50 14.77** 9.00Centropyxis ecornis type 53 88.68 77.36 2.41 2.29Corythion dubium type 37 78.38 51.35 5.93* 3.43Cyclopyxis arcelloides type 32 96.88 6.25 52.61** 465.00Difflugia acuminata 30 86.67 46.67 10.80** 7.43Difflugia globulosa 36 94.44 66.67 8.87* 8.50Difflugia leidyi 27 81.48 37.04 11.05** 7.48Euglypha strigosa type 42 92.86 23.81 41.19** 41.60Euglypha tuberculata type 79 91.14 67.09 13.83** 5.05Habrotrocha angusticollis 52 94.23 36.54 38.34** 28.37Heleopera sphagni 68 89.71 94.12 0.89 0.55Heleopera sylvatica 52 96.15 55.77 23.22** 19.82Hyalosphenia elegans 74 94.59 85.14 3.64 3.06Hyalosphenia papilio 78 98.72 98.72 0.00 1.00Nebela carinata 25 95.45 68.18 5.50* 9.80Nebela collaris 65 84.62 70.77 3.60 2.72Nebela griseola 78 98.72 77.92 16.11** 21.53Nebela militaris 45 97.78 46.67 29.30** 50.29Nebela tincta 58 91.38 72.41 7.04** 4.04Phryganella acropodia 75 97.33 74.67 16.00** 12.38Trigonopyxis arcula 65 93.85 41.54 40.66** 21.46
Taxa not encountered in at least 25 samples were excluded from the analysis, and comparisons were only made using sample pairs (i.e., lowerand upper) in which the taxon was present in one of the samples. The frequency of each taxon is shown as the percentage of samples in whichthe taxon was present. Chi-square tests assess significant differences between upper and lower assemblages (*p , 0.05; **p , 0.01). Oddsratios describe the increased probability of finding a taxon in upper or lower assemblages.
344
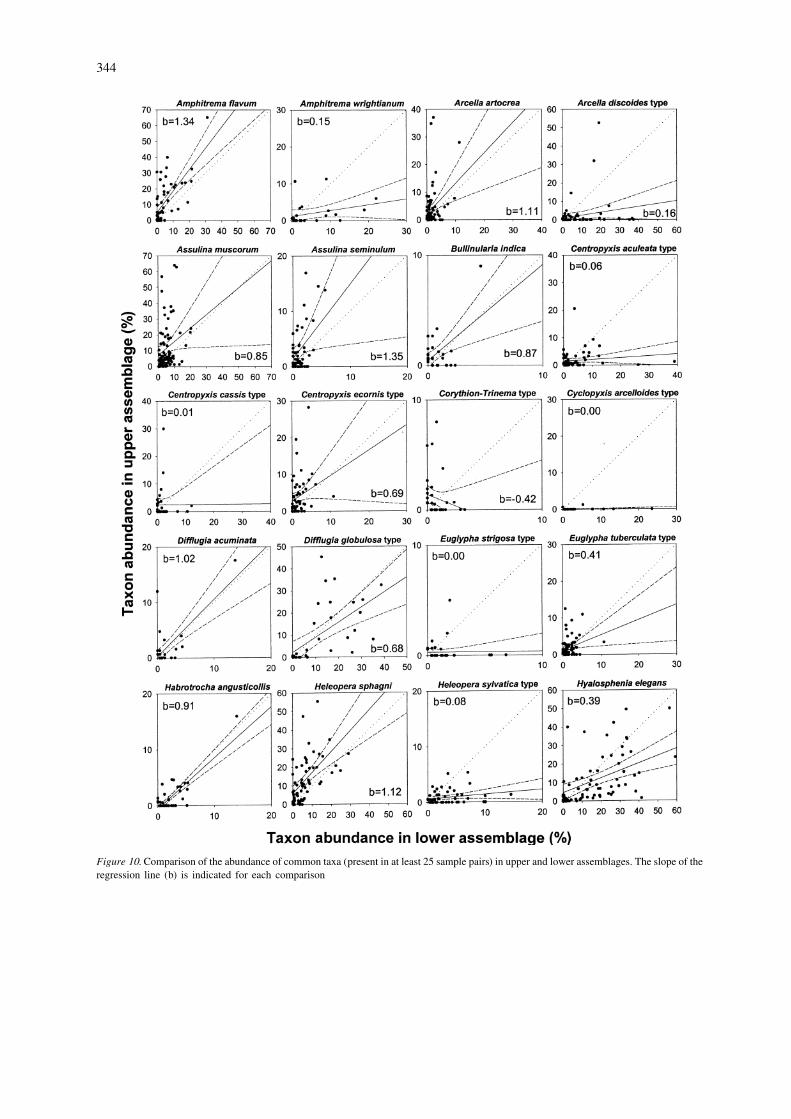
Figure 10. Comparison of the abundance of common taxa (present in at least 25 sample pairs) in upper and lower assemblages. The slope of theregression line (b) is indicated for each comparison
345
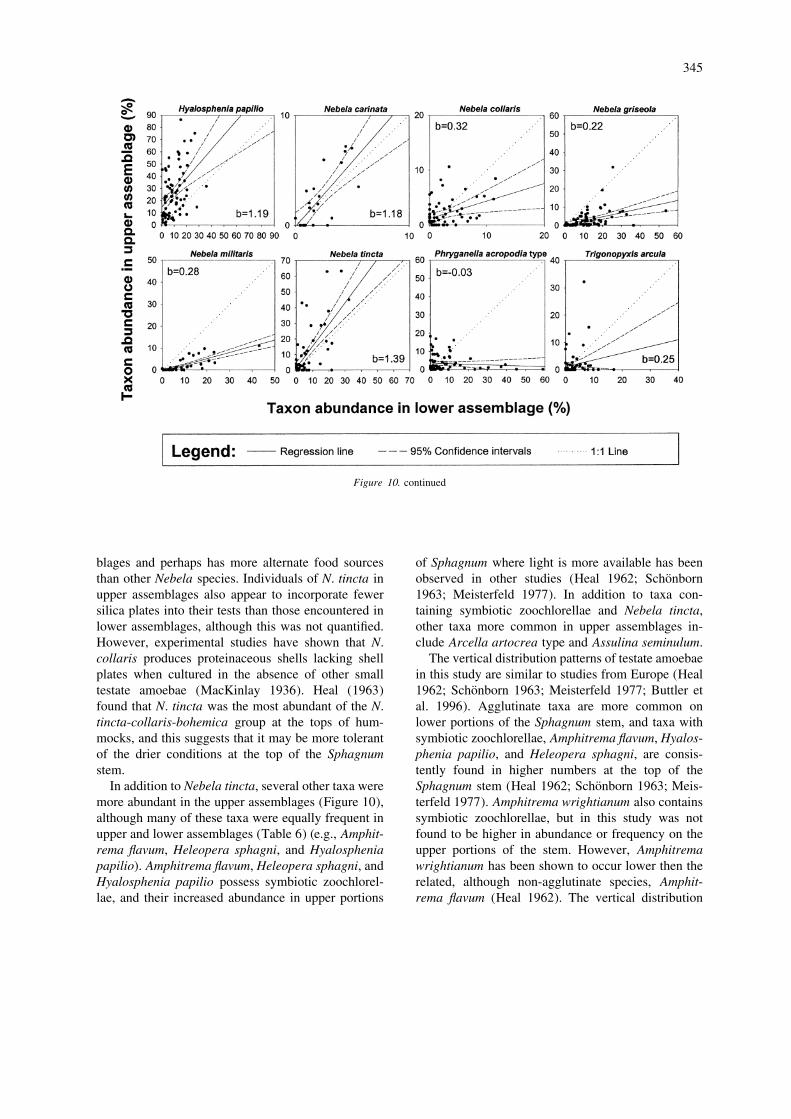
Figure 10. continued
blages and perhaps has more alternate food sources of Sphagnum where light is more available has been¨than other Nebela species. Individuals of N. tincta in observed in other studies (Heal 1962; Schonborn
upper assemblages also appear to incorporate fewer 1963; Meisterfeld 1977). In addition to taxa con-silica plates into their tests than those encountered in taining symbiotic zoochlorellae and Nebela tincta,lower assemblages, although this was not quantified. other taxa more common in upper assemblages in-However, experimental studies have shown that N. clude Arcella artocrea type and Assulina seminulum.collaris produces proteinaceous shells lacking shell The vertical distribution patterns of testate amoebaeplates when cultured in the absence of other small in this study are similar to studies from Europe (Heal
¨testate amoebae (MacKinlay 1936). Heal (1963) 1962; Schonborn 1963; Meisterfeld 1977; Buttler etfound that N. tincta was the most abundant of the N. al. 1996). Agglutinate taxa are more common ontincta-collaris-bohemica group at the tops of hum- lower portions of the Sphagnum stem, and taxa withmocks, and this suggests that it may be more tolerant symbiotic zoochlorellae, Amphitrema flavum, Hyalos-of the drier conditions at the top of the Sphagnum phenia papilio, and Heleopera sphagni, are consis-stem. tently found in higher numbers at the top of the
¨In addition to Nebela tincta, several other taxa were Sphagnum stem (Heal 1962; Schonborn 1963; Meis-more abundant in the upper assemblages (Figure 10), terfeld 1977). Amphitrema wrightianum also containsalthough many of these taxa were equally frequent in symbiotic zoochlorellae, but in this study was notupper and lower assemblages (Table 6) (e.g., Amphit- found to be higher in abundance or frequency on therema flavum, Heleopera sphagni, and Hyalosphenia upper portions of the stem. However, Amphitremapapilio). Amphitrema flavum, Heleopera sphagni, and wrightianum has been shown to occur lower then theHyalosphenia papilio possess symbiotic zoochlorel- related, although non-agglutinate species, Amphit-lae, and their increased abundance in upper portions rema flavum (Heal 1962). The vertical distribution
346
pattern of Amphitrema wrightianum has been inter- The increased variance explained by combiningpreted as a compromise between the availability of lower and upper assemblages (Table 7) suggests thatlight and particles for test construction (Heal 1962). improvements in the predictive ability of transfer
functions may be possible. Sampling the entire verti-Implications of vertical variation to the collection cal region of Sphagnum where living testate amoebaeof calibration datasets occur may result in more accurate depictions of
species-environment relationships. However, morePrevious calibration datasets derived from Sphagnum- research is needed on the effects of sampling largerdominated peatlands have used assemblages collected vertical regions of Sphagnum and determining thefrom the lower portions of the Sphagnum stem, be- vertical extent of the zone where living testatecause assemblages from this horizon are thought to amoebae occur. Identification and quantification ofbest represent what is found in the fossil record living individuals would also improve the correlation(Warner 1987; Tolonen et al. 1992). This study indi- between amoeba assemblages and hydrology, espe-cates that taxon richness is higher on lower portions of cially when comparisons are made with instantaneousthe Sphagnum stem (Figure 7), all taxa present in measurements of hydrologic conditions. Althoughupper assemblages are also present in lower assem- living and dead individuals are easily distinguished inblages (Table 6), and significant differences exist in some taxa, in others it is difficult or impossible (Healthe abundance of some taxa between upper and lower 1964), and some living individuals can remain en-portions of the Sphagnum stem (Figure 10). However, cysted for long periods of time.the relationships between environmental variables andtestate amoebae are just as strong in both assemblagetypes (Figure 8, Table 4), probably because living Conclusionsindividuals occur on both portions of the Sphagnum
¨stem (Heal 1962; Schonborn 1963). Since a greater Testate amoeba assemblages are primarily controlledpercentage of living individuals probably comprise by local hydrology in Michigan peatlands, similar toupper assemblages, and living individuals should other regions. Particularly in Sphagnum-dominatedbetter represent the environmental conditions at the peatlands, testate amoebae have considerable poten-time of sampling, combination of the two assemblage tial in the reconstruction of past surface-moisturetypes might show stronger relationships with the variability. Testate amoebae have been underused inenvironmental variables than either assemblage type North American paleoclimate studies, although theiralone. To test this hypothesis I combined the raw data sensitivity to low-magnitude and high-frequency hy-from each upper and lower assemblage pair and drologic fluctuations offers advantages over otherrepeated the CCA. The analysis of the combined climate proxies (Charman et al. 1999). The calibra-dataset indicates that relationships with the environ- tion dataset presented in this study can be used tomental variables improve, and the total variance ex- quantitatively infer past surface-moisture conditionsplained increases (Table 7) compared to separate from fossil testate amoeba data in the western Greatanalyses of the two assemblage types (Table 4). Lakes region and perhaps other regions in North
America. Water table depth can be reconstructed fromTable 7. Characteristics of CCA axes 1 and 2 and correlation fossil data with a mean error of 67.5 cm, althoughcoefficients for the analysis of the combined upper and lower reconstructed water table values should be interpretedassemblage dataset (n 5 89) along a relative moisture gradient.
Axis 1 Axis 2 Vertical variation of amoeba assemblages along thestems of Sphagnum moss is considerable, althoughAxes characteristics
Eigenvalue 0.408 0.141 this variation appears to be reduced in dry environ-% Variance explained 16.7 5.8 ments. Taxa with agglutinate or siliceous shells areCummulative % explained 16.7 22.5 generally more abundant lower on the SphagnumCorrelation coefficients
stem whereas taxa with symbiotic zoochlorellae areWater table depth 20.929 20.017generally found higher on the stem. In addition to% Moisture 0.782 0.094
pH 0.737 0.064 light and the availability of materials for test construc-Bulk density 20.120 0.523 tion, vertical variation is probably related to gradientsDepth of living Sphagnum 20.382 20.416 of moisture and food. Assemblages characterizing the
347
Quaternary Science Data. Quat. Res. Assoc., Cambridge, USAupper portions of the Sphagnum stem are not moreTechnical Guide 5., pp. 161–254.representative of environmental conditions than those
Birks H.J.B. 1998. Numerical tools in palaeolimnology – progress,inhabiting lower portions of the Sphagnum stem, potentialities, and problems. J. Paleolim. 20: 307–332.although taxon richness is higher on lower portions. Blackford J.J. and Chambers F.M. 1993. Determining the degree ofFurther developments in sampling methodology, and peat decomposition in peat-based palaeoclimatic studies. Int.
Peat J. 5: 7–24.perhaps the identification and quantification of livingBobrov A.A., Charman D.J. and Warner B.G. 1999. Ecology oftestate amoebae, may facilitate the collection of more
testate amoebae (Protozoa: Rhizopoda) on peatlands in westernrepresentative calibration datasets. Russia with special attention to niche separation in closely
related taxa. Protist 150: 125–136.Booth R.K. 2001. Ecology of testate amoebae (Protozoa) in two
Lake Superior coastal wetlands: implication for paleoecologyAcknowledgementsand environmental monitoring. Wetlands 21: 564–576.
Buttler A., Warner B.G., Grosvernier P. and Matthey Y. 1996.Funding for this project came from a Society of Vertical patterns of testate amoebae (Protozoa: Rhizopoda) andWetland Scientists Student Research Grant and a peat-forming vegetation on cutover bogs in the Jura, Switzerland.
New Phytol. 134: 371–382.Paleobiological Fund Student Research Grant. Addi-Charman D.J. 1997. Modelling hydrological relationships of testatetional support came from a USGS-BRD Grant to S.T.
amoebae (Protozoa: Rhizopoda) on New Zealand peatlands. J. R.Jackson. Field and lab assistance were provided by R.Soc. New Zealand 27: 465–483.
Dunn and K. Rosenlund. I am grateful to R.E. Andrus Charman D.J. and Hendon D. 2000. Long-term changes in soilfor providing the Sphagnum identifications, and to E. water tables over the past 4500 years: relationships with climate
and North Atlantic atmospheric circulation and sea surfaceHolt and J.E. Meeker for helping with Carex identifi-temperature. Climatic Change 47: 45–59.cations. Statistical advice was provided by K. Gerow
Charman D.J. and Warner B.G. 1992. Relationship between testateand S. Miller. Early drafts of the manuscript wereamoebae (Protozoa: Rhizopoda) and microenvironmental param-
improved by suggestions from S.T. Jackson, J.A. eters on a forested peatland in northeastern Ontario. Can. J. Zool.Beiswenger, and members of the Quaternary Plant 70: 2474–2482.
Charman D.J. and Warner B.G. 1997. The ecology of testateEcology Laboratory at the University of Wyoming.amoebae (Protozoa: Rhizopoda) in oceanic peatlands in New-The comments of D.J. Charman and one anonymousfoundland, Canada: modeling hydrological relationships forreviewer improved the final version of the manuscript.paleoenvironmental reconstruction. Ecoscience 4: 555–562.
Charman D.J., Hendon D. and Packman S. 1999. Multiproxysurface wetness records from replicate cores on an ombrotrophicmire: implications for Holocene paleoclimate records. J. Quat.ReferencesSci. 14: 451–463.
Charman D.J., Hendon D. and Woodland W.A. 2000. The Identifi-Aaby B. 1976. Cyclic climatic variations in climate over the pastcation of Testate Amoebae (Protozoa: Rhizopoda) in Peats. Quat.5,500 yrs reflected in raised bogs. Nature 263: 281–284.Res. Assoc., London, UK, Technical Guide No. 9.Almquist-Jacobson H. and Foster D.R. 1995. Toward an integrated
Corbet S.A. 1973. An illustrated introduction to the testatemodel for raised-bog development: theory and practice. EcologyRhizopods in Sphagnum with special reference to the area76: 2503–2516.around Malham Tarn, Yorkshire. Fld. Stud. 3: 801–838.Anderson D.E. 1998. A reconstruction of Holocene climaticˆCouteaux M. 1985. Relationships between testate amoebae andchanges from peat bogs in north-west Scotland. Boreas 27: 208–fungi in humus microcosms. Soil Biology and Biochemistry 17:224.339–345.Andrus R.E. 1980. Sphagnaceae (peat moss family) of New York
Foster D.R. and Wright H.E. 1990. Role of ecosystem developmentState. Bull. N.Y. St. Mus. Albany 442: 1–89.and climate change in bog formation in central Sweden. EcologyAndrus R.E. 1986. Some aspects of Sphagnum ecology. Can. J.71: 450–463.Bot. 64: 416–426.
Grospietsch T. 1958. Wechseltierchen (Rhizopoden). Kosmos,Backeus I. 1990. The cyclic regeneration on bogs – a hypothesisStuttgart, Germany, 80 pp.that became an established truth. Striae 31: 22–35.
Heal O.W. 1962. The abundance and micro-distribution of testateBarber K.E. 1981. Peat Stratigraphy and Climatic Change: Aamoebae (Rhizopoda: Testacea) in Sphagnum. Oikos 13: 35–47.Palaeoecological Test of the Theory of Cyclic Peat Bog Regene-
Heal O.W. 1963. Morphological variation in certain Testacearation. Balkema, Rotterdam, The Netherlands.(Protozoa: Rhizopoda). Arch. Protistenk 106: 351–368.Barber K.E., Maddy D., Rose N., Stevenson A.C., Stoneman R. and
Heal O.W. 1964. Observations on the seasonal and spatial dis-Thompson R. 2000. Replicated proxy-climate signals over thetribution of testacea (Protozoa: Rhizopoda) in Sphagnum. J.last 2000 yrs from two distant UK peat bogs: new evidence forAnim. Ecol. 33: 395–412.regional paleoclimate teleconnections. Quat. Sci. Rev. 19: 481–
Hendon D. and Charman D.J. 1997. The preparation of testate487.amoebae (Protozoa: Rhizopoda) samples from peat. Holocene 7:Birks H.J.B. 1995. Quantitative paleoenvironmental reconstruc-199–205.tions. In: Maddy D. and Brew J.S. (eds), Statistical Modelling of
348
Hendon D., Charman D.J. and Kent M. 2001. Palaeohydrological amoebae (Protozoa) in a Sphagnum magellanicum carpet. Mi-records derived from testate amoebae analysis from peatlands in crob. Ecol. 39: 290–300.northern England: within-site variability, between-site com- Ogden C.G. and Hedley R.H. 1980. An Atlas of Freshwater Testateparability and palaeoclimatic implications. Holocene 11: 127– Amoebae. British Museum of Natural History and Oxford Uni-148. versity Press, London and Oxford, UK, 222 pp.
¨Hu F.S. and Davis R.B. 1995. Post-glacial development of a Maine Schonborn W. 1963. Die Stratigraphie lebender Testaceen imbog and paleoenvironmental implications. Can. J. Bot. 73: 638– Sphagnetum der Hochmoore. Limnologica 1: 315–321.649. Sernander R. 1908. On the evidence of Postglacial changes of
Juggins S. 1998. CALIBRATE Version 0.82. University of New- climate furnished by the peat mosses of Northern Europe. Geol.¨ ¨castle, Newcastle upon Tyne, UK. For. Stockh. Forh. 30: 467–478.
MacKinlay R.B. 1936. Observations on Nebela collaris Leidy (pro Tolonen K. 1986. Rhizopod analysis. In: Berglund B.E. (ed.),parte), a testate amoebae of moorland waters. J. r. Microsc. Soc. Handbook of Holocene Palaeoecology and Palaeohydrology.56 Part 1: 307–325. John Wiley and Sons, New York, USA, pp. 467–468.
Mauquoy D. and Barber K.E. 1999. A replicated 3000 yr proxy- Tolonen K., Huttunen P. and Jungner H. 1985. Regeneration of twoclimate record from Coom Rigg Moss and Felecia Moss, the coastal raised bogs in eastern North America. Suomal. Tiedeakat.Border Mires, northern England. J. Quat. Sci. 14: 263–275. Toim. Series A1 39: 5–51.
McCune B. and Mefford M.J. 1999. PCORD for Windows: Multi- Tolonen K., Warner B.G. and Vasander H. 1992. Ecology ofvariate Analysis of Ecological Data, Version 4.17. MjM Soft- Testaceans (Protozoa: Rhizopoda) in mires in southern Finland:ware, Gleneden Beach, OR, USA. I. Autecology. Arch. Protistenk. 142: 119–138.
Meisterfeld R. 1977. Die horizontale und vertikale Verteilung der Warner B.G. 1987. Abundance and diversity of testate amoebaeTestaceen (Rhizopoda, Testacea in Sphagnum). Arch. Protistenk. (Rhizopoda, Testacea) in Sphagnum peatlands in southwestern79: 319–356. Ontario, Canada. Arch. Protistenk. 133: 173–189.
Meisterfeld R. 2000. Order Arcellinida Kent, 1880. In: Lee J.J., Warner B.G. 1988. Holocene fossil Habrotrocha angusticollisLeedale G.F. and Bradbury P. (eds), The Illustrated Guide to the (Bdelloidea: Rotifera) in North America. J. Paleolim. 1: 141–Protozoa. Society of Protozoologists, Lawrence, KS, USA 2nd 147.edition., pp. 827–860. Warner B.G. 1990. Testate amoebae (Protozoa). In: Warner B.G.
Mitchell E.A.D., Butler A.J. and Warner B.G. 1999. Ecology of (ed.), Methods in Quaternary Ecology. Geological Association oftestate amoebae (Protozoa: Rhizopoda) in Sphagnum peatlands Canada, St. Johns, Newfoundland, Canada Geoscience Canadain the Jura Mountains, Switzerland and France. Ecoscience 6: Reprint Series 5., pp. 65–74.565–576. Warner B.G. and Charman D.J. 1994. Holocene changes on a
Mitchell E.A.D., Buttler A., Grosvernier P., Rydin H., Albinsson C., peatland in northwestern Ontario interpreted from testateGreenup A.L. et al. 2000a. Relationships among testate amoebae amoebae (Protozoa) analysis. Boreas 23: 271–279.(Protozoa), vegetation and water chemistry in five Sphagnum- Woodland W.A., Charman D.J. and Sims P.C. 1998. Quantitativedominated peatlands in Europe. New Phytol. 146: 95–106. estimates of water tables and soil moisture in Holocene peatlands
Mitchell E.A.D., Borcard D., Butler A.J., Grosvernier P., Gilbert D. from testate amoebae. Holocene 8: 261–273.and Gobat J.-M. 2000b. Horizontal distribution patterns of testate
Related Documents