PURDUE UNIVERSITY GRADUATE SCHOOL Thesis Acceptance This is to certify that the thesis prepared By Entitled Complies with University regulations and meets the standards of the Graduate School for originality and quality For the degree of Final examining committee members , Chair Approved by Major Professor(s): Approved by Head of Graduate Program: Date of Graduate Program Head's Approval: Christopher Grant Blake THE POTENTIAL OF TEXT-BASED INTERNET CHATS FOR IMPROVING ESL ORAL FLUENCY Doctor of Philosophy April Ginther Margie Berns Elena Benedicto Scott Schaffer 6-14-2006 April Ginther Irwin Weiser

Welcome message from author
This document is posted to help you gain knowledge. Please leave a comment to let me know what you think about it! Share it to your friends and learn new things together.
Transcript
PURDUE UNIVERSITYGRADUATE SCHOOL
Thesis Acceptance
This is to certify that the thesis prepared
By
Entitled
Complies with University regulations and meets the standards of the Graduate School for originality
and quality
For the degree of
Final examining committee members
, Chair
Approved by Major Professor(s):
Approved by Head of Graduate Program:
Date of Graduate Program Head's Approval:
Christopher Grant Blake
THE POTENTIAL OF TEXT-BASED INTERNET CHATS FOR IMPROVING ESLORAL FLUENCY
Doctor of Philosophy
April Ginther
Margie Berns
Elena Benedicto
Scott Schaffer
6-14-2006
April Ginther
Irwin Weiser


THE POTENTIAL OF TEXT-BASED INTERNET CHATS FOR IMPROVING ESL ORAL FLUENCY
A Dissertation
Submitted to the Faculty
of
Purdue University
by
Christopher Grant Blake
In Partial Fulfillment of the
Requirements for the Degree
of
Doctor of Philosophy
August 2006 Purdue University
West Lafayette, Indiana
UMI Number: 3239774
32397742007
UMI MicroformCopyright
All rights reserved. This microform edition is protected against unauthorized copying under Title 17, United States Code.
ProQuest Information and Learning Company 300 North Zeeb Road
P.O. Box 1346 Ann Arbor, MI 48106-1346
by ProQuest Information and Learning Company.

ii
To Jeannie -
my magnificent wife.
iii
ACKNOWLEDGMENTS
I would like to take this opportunity to thank the wonderful people who
have supported and guided me through this project. Let me begin by thanking
my supervisor and major professor, Dr. April Ginther, for giving countless hours
to mentor me along this dissertation journey. You have opened my eyes to a
completely new and exciting approach to second language research and have
given me the confidence to continue this work in the years to come. I want to
express my deep gratitude to Dr. Margie Berns who inspired me from the very
beginning to pursue this degree and who has motivated me to the end. Your
input during this period of my life has been invaluable.
Heartfelt appreciation goes to my other committee members as well.
Thank you Dr. Scott Schaffer for reminding me—both in and out of class—that
the field of education is all about people. Your genuine interest in students is
expressed in so many ways and will always be an example to me. Thank you Dr.
Elena Benedicto for jumping on board at the last minute. You provided such
brilliant input when I was just venturing out in this field, and I am so grateful that
you have lent your critical eye once again.
This dissertation would not have been possible without many other
wonderful people who believed in me and gave of their precious time, talent, and
resources. I am indebted to Annett Benson and the staff of Purdue Village
Language Center who so graciously let me use their classroom and computer
facilities to conduct the teaching phase of the project. I also owe so much to Dr.
Dachuang Cao who guided me through the statistical analysis of data in this
project and saved me from sleepless nights.
iv
I want to express my love and appreciation to my parents and parents-in-
law who gave endless hours of their time to watch my four beautiful children and
support me over the past five years. Marianne Becker, I will never forget the
many days you rushed to my aid at the last minute and helped me shift from
changing diapers to conducting research. A crown awaits you! And finally, I
want to say thank you to my magnificent wife, Jeannie. You have given up so
much to help make this dream a reality. You are my dearest friend on this
journey of life and I can’t wait to see what lies ahead!
v
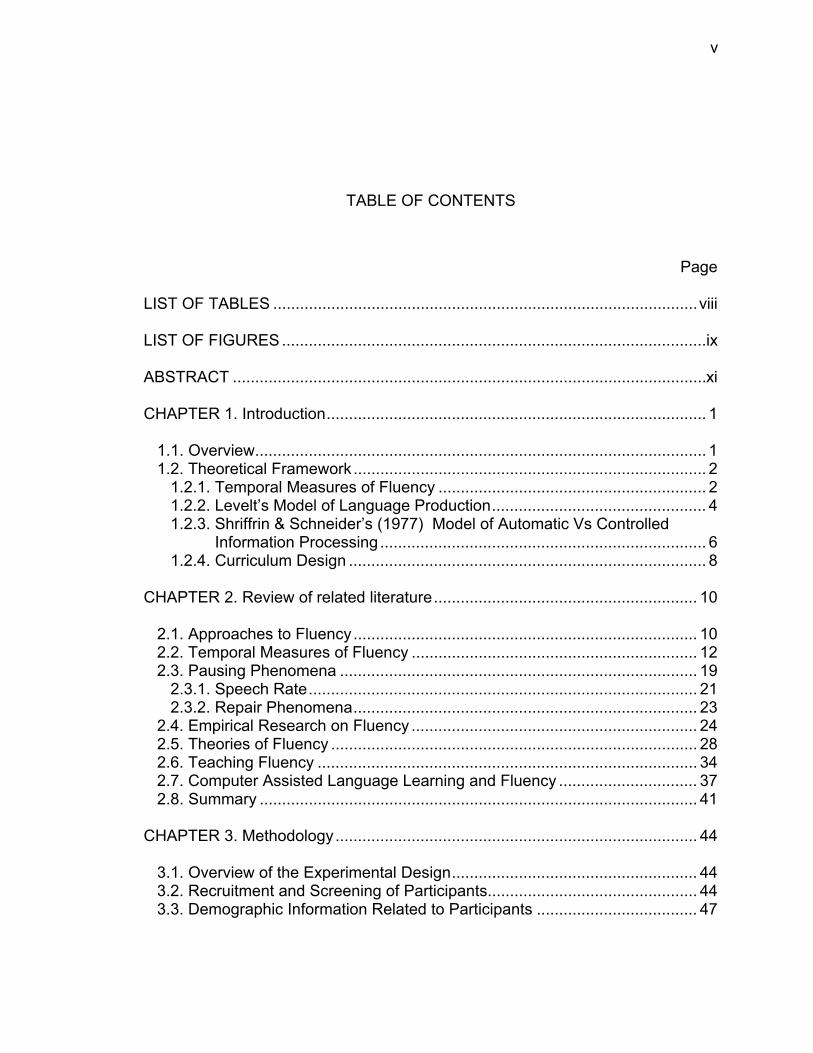
TABLE OF CONTENTS
Page LIST OF TABLES ...............................................................................................viii LIST OF FIGURES ...............................................................................................ix ABSTRACT ..........................................................................................................xi CHAPTER 1. Introduction..................................................................................... 1
1.1. Overview..................................................................................................... 1 1.2. Theoretical Framework............................................................................... 2
1.2.1. Temporal Measures of Fluency ............................................................ 2 1.2.2. Levelt’s Model of Language Production................................................ 4 1.2.3. Shriffrin & Schneider’s (1977) Model of Automatic Vs Controlled Information Processing ......................................................................... 6 1.2.4. Curriculum Design ................................................................................ 8
CHAPTER 2. Review of related literature........................................................... 10
2.1. Approaches to Fluency............................................................................. 10 2.2. Temporal Measures of Fluency ................................................................ 12 2.3. Pausing Phenomena ................................................................................ 19
2.3.1. Speech Rate....................................................................................... 21 2.3.2. Repair Phenomena............................................................................. 23
2.4. Empirical Research on Fluency ................................................................ 24 2.5. Theories of Fluency .................................................................................. 28 2.6. Teaching Fluency ..................................................................................... 34 2.7. Computer Assisted Language Learning and Fluency ............................... 37 2.8. Summary .................................................................................................. 41
CHAPTER 3. Methodology................................................................................. 44
3.1. Overview of the Experimental Design....................................................... 44 3.2. Recruitment and Screening of Participants............................................... 44 3.3. Demographic Information Related to Participants .................................... 47
vi
Page
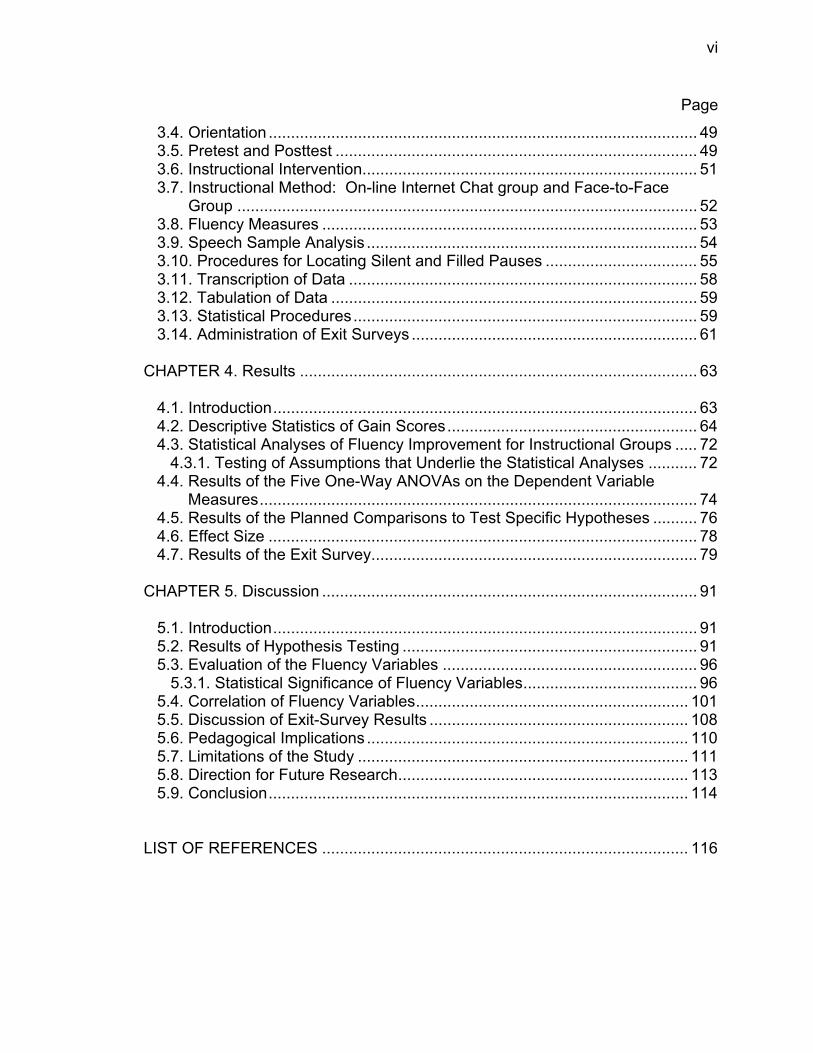
3.4. Orientation ................................................................................................ 49 3.5. Pretest and Posttest ................................................................................. 49 3.6. Instructional Intervention........................................................................... 51 3.7. Instructional Method: On-line Internet Chat group and Face-to-Face Group ....................................................................................................... 52 3.8. Fluency Measures .................................................................................... 53 3.9. Speech Sample Analysis .......................................................................... 54 3.10. Procedures for Locating Silent and Filled Pauses .................................. 55 3.11. Transcription of Data .............................................................................. 58 3.12. Tabulation of Data .................................................................................. 59 3.13. Statistical Procedures............................................................................. 59 3.14. Administration of Exit Surveys ................................................................ 61
CHAPTER 4. Results ......................................................................................... 63
4.1. Introduction............................................................................................... 63 4.2. Descriptive Statistics of Gain Scores........................................................ 64 4.3. Statistical Analyses of Fluency Improvement for Instructional Groups ..... 72
4.3.1. Testing of Assumptions that Underlie the Statistical Analyses ........... 72 4.4. Results of the Five One-Way ANOVAs on the Dependent Variable Measures.................................................................................................. 74
4.5. Results of the Planned Comparisons to Test Specific Hypotheses .......... 76 4.6. Effect Size ................................................................................................ 78 4.7. Results of the Exit Survey......................................................................... 79
CHAPTER 5. Discussion .................................................................................... 91
5.1. Introduction............................................................................................... 91 5.2. Results of Hypothesis Testing .................................................................. 91 5.3. Evaluation of the Fluency Variables ......................................................... 96
5.3.1. Statistical Significance of Fluency Variables....................................... 96 5.4. Correlation of Fluency Variables............................................................. 101 5.5. Discussion of Exit-Survey Results .......................................................... 108 5.6. Pedagogical Implications ........................................................................ 110 5.7. Limitations of the Study .......................................................................... 111 5.8. Direction for Future Research................................................................. 113 5.9. Conclusion.............................................................................................. 114
LIST OF REFERENCES .................................................................................. 116
vii
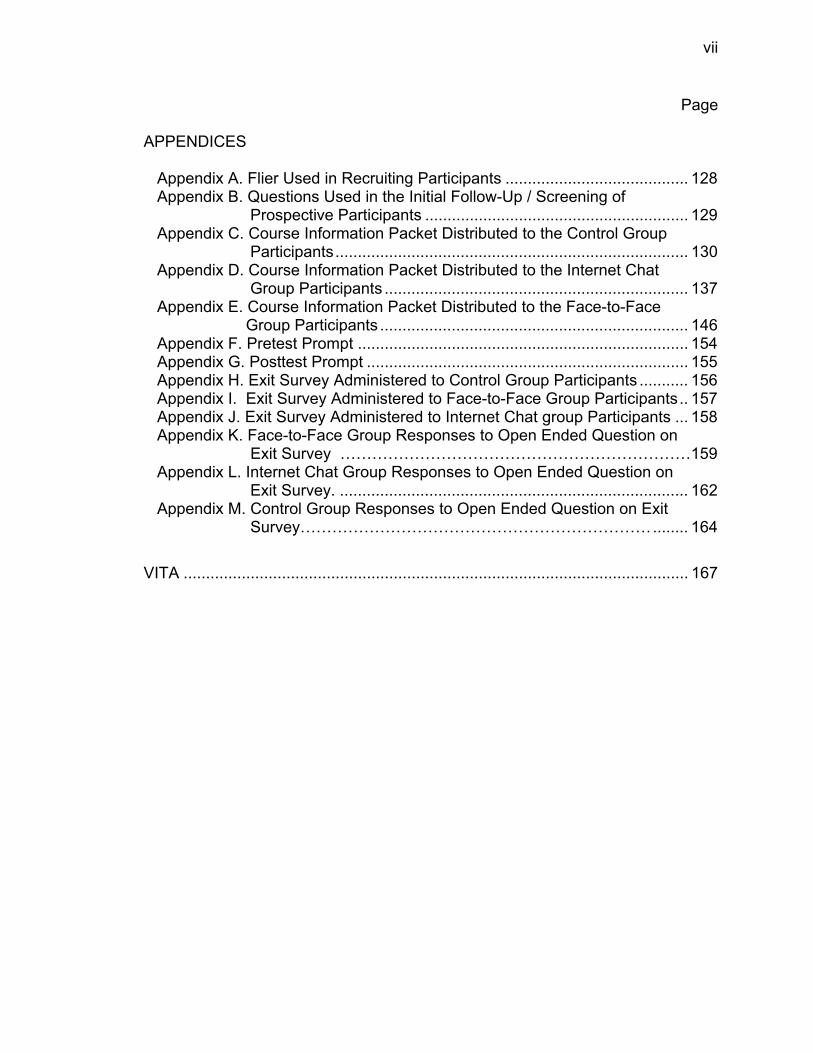
Page APPENDICES
Appendix A. Flier Used in Recruiting Participants ......................................... 128 Appendix B. Questions Used in the Initial Follow-Up / Screening of Prospective Participants ........................................................... 129 Appendix C. Course Information Packet Distributed to the Control Group Participants............................................................................... 130 Appendix D. Course Information Packet Distributed to the Internet Chat Group Participants .................................................................... 137 Appendix E. Course Information Packet Distributed to the Face-to-Face Group Participants ..................................................................... 146 Appendix F. Pretest Prompt .......................................................................... 154 Appendix G. Posttest Prompt ........................................................................ 155 Appendix H. Exit Survey Administered to Control Group Participants ........... 156 Appendix I. Exit Survey Administered to Face-to-Face Group Participants.. 157 Appendix J. Exit Survey Administered to Internet Chat group Participants ... 158 Appendix K. Face-to-Face Group Responses to Open Ended Question on Exit Survey …………………………………………………………159 Appendix L. Internet Chat Group Responses to Open Ended Question on Exit Survey. .............................................................................. 162 Appendix M. Control Group Responses to Open Ended Question on Exit Survey…………………………………………………………........ 164
VITA ................................................................................................................. 167
viii
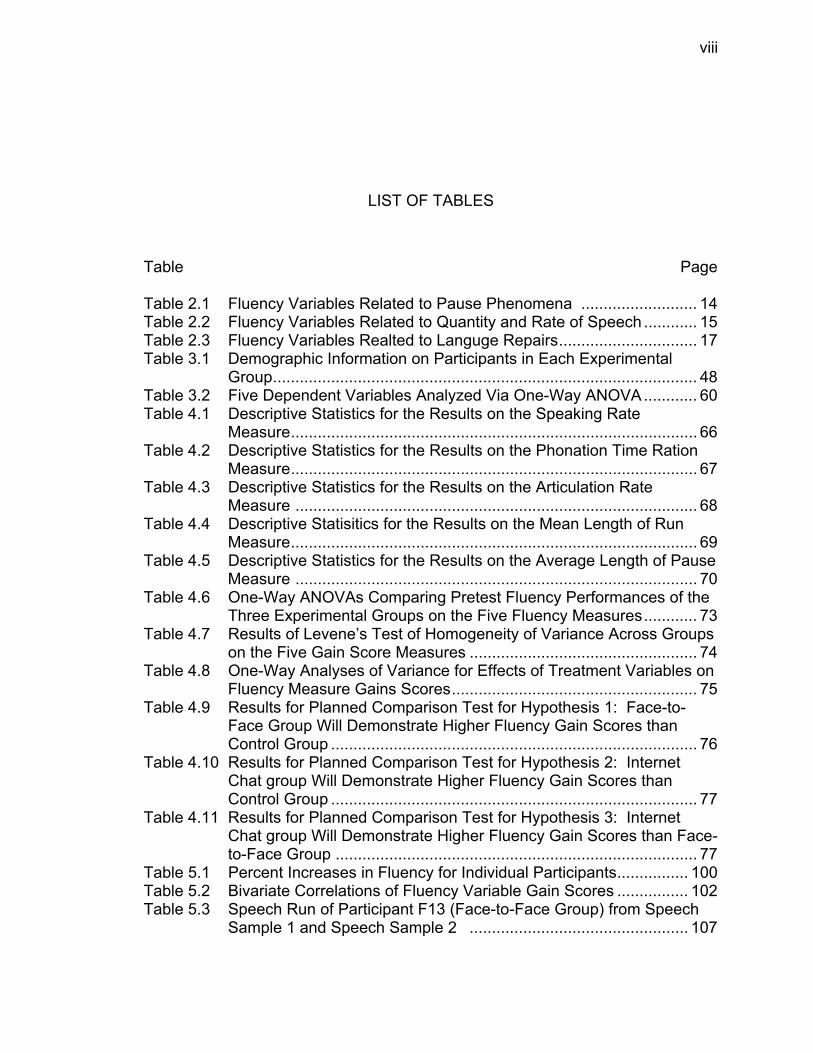
LIST OF TABLES
Table Page Table 2.1 Fluency Variables Related to Pause Phenomena .......................... 14 Table 2.2 Fluency Variables Related to Quantity and Rate of Speech ............ 15 Table 2.3 Fluency Variables Realted to Languge Repairs............................... 17 Table 3.1 Demographic Information on Participants in Each Experimental Group............................................................................................... 48 Table 3.2 Five Dependent Variables Analyzed Via One-Way ANOVA............ 60 Table 4.1 Descriptive Statistics for the Results on the Speaking Rate Measure........................................................................................... 66 Table 4.2 Descriptive Statistics for the Results on the Phonation Time Ration Measure........................................................................................... 67 Table 4.3 Descriptive Statistics for the Results on the Articulation Rate Measure .......................................................................................... 68 Table 4.4 Descriptive Statisitics for the Results on the Mean Length of Run Measure........................................................................................... 69 Table 4.5 Descriptive Statistics for the Results on the Average Length of Pause Measure .......................................................................................... 70 Table 4.6 One-Way ANOVAs Comparing Pretest Fluency Performances of the Three Experimental Groups on the Five Fluency Measures............ 73 Table 4.7 Results of Levene’s Test of Homogeneity of Variance Across Groups on the Five Gain Score Measures ................................................... 74 Table 4.8 One-Way Analyses of Variance for Effects of Treatment Variables on Fluency Measure Gains Scores....................................................... 75 Table 4.9 Results for Planned Comparison Test for Hypothesis 1: Face-to- Face Group Will Demonstrate Higher Fluency Gain Scores than Control Group .................................................................................. 76 Table 4.10 Results for Planned Comparison Test for Hypothesis 2: Internet Chat group Will Demonstrate Higher Fluency Gain Scores than Control Group .................................................................................. 77 Table 4.11 Results for Planned Comparison Test for Hypothesis 3: Internet Chat group Will Demonstrate Higher Fluency Gain Scores than Face- to-Face Group ................................................................................. 77 Table 5.1 Percent Increases in Fluency for Individual Participants................ 100 Table 5.2 Bivariate Correlations of Fluency Variable Gain Scores ................ 102 Table 5.3 Speech Run of Participant F13 (Face-to-Face Group) from Speech Sample 1 and Speech Sample 2 ................................................. 107
ix
LIST OF FIGURES
Figure Page Figure 3.1. Overview of Experimental Design ................................................. 45 Figure 3.2. Sample view of 3.75 second segment of speech as displayed in the PRAAT editing window............................................................ 56 Figure 3.3. Sample of speech in PRAAT demonstrating the changes that occur in formants when shifting from a word segment to a filled
pause. ........................................................................................... 58 Figure 4.1 Percent Increase from Pretest to Posttest for Each Group on the Speaking Rate Measure ............................................................... 66 Figure 4.2 Percent Increase from Pretest to Posttest for Each Group on the Phonation Time Ratio Measure .................................................... 67 Figure 4.3 Percent Increase from Pretest to Posttest for Each Group on the Articulation Rate Measure ............................................................ 68 Figure 4.4 Percent Increase from Pretest to Posttest for Each Group on the Mean Length of Run Measure ...................................................... 69 Figure 4.5 Percent Increase from Pretest to Posttest for Each Group on the Average Length of Pause Measure .............................................. 70 Figure 4.6. Responses to Exit Survey Item #1 – “Course helped me to improve my fluency.” ..................................................................... 82 Figure 4.7. Responses to Exit Survey Item #2 – “Course helped me to improve my listening.” ................................................................... 82 Figure 4.8. Responses to Exit Survey Item #3 – “Course helped me to improve knowledge of American culture.”..................................... 83 Figure 4.9. Responses to Exit Survey Item #4 – “Course helped me to i mprove my vocabulary.”................................................................ 83 Figure 4.10. Responses to Exit Survey Item #5 – “The topics selected for this course were useful to me.”............................................................ 84 Figure 4.11. Responses to Exit Survey Item #6 – “I felt connected to other students in the course.” ................................................................. 84 Figure 4.12. Responses to Exit Survey Item #7 – “I Would Recommend this Course to a Friend ........................................................................ 85 Figure 4.13. Responses to Exit Survey Item #8 – “I Feel More Comfortable Using English Now” ....................................................................... 85 Figure 4.14. Responses to Exit Survey Item #9 – “The Course Would Have Been Better Had it Met in a Face-to-Face Classroom.” ................ 86
x
Figure Page
Figure 4.15. Responses to Exit Survey Item #10 – “Overall, I Think This Was a Beneficial Course.” ........................................................................ 86 Figure 4.16. Responses to Exit Survey Item #11 – “I am proficient at Typing.” 87 Figure 4.17. Responses to Exit Survey Item #12 – “I am Proficient at Using Computers.” ................................................................................... 87 Figure 4.18. Responses to Exit Survey Item #13 Regarding the Usefulness of the On-Line Listening Passage Activities...................................... 88 Figure 4.19. Responses to Exit Survey Item #14 Regarding the Usefulness of the On-Line New Expressions Activities. ...................................... 88 Figure 4.20. Responses to Exit Survey Item #15 Regarding the Usefulness of the On-Line Unit Quizzes............................................................... 89 Figure 4.21. Responses to Exit Survey Item #16 Regarding the Usefulness of the On-Line Chat Component of the Course. ............................... 89 Figure 4.22. Responses to Exit Survey Item #17 Regarding the Usefulness of the Face-to-Face Component of the Course ............................... 90 Figure 5.1. Options for Improving Speaking Rate Gain Scores..................... 104 Figure 5.2. Options for Improving Phonation Time Ratio Gain Scores.......... 105 Figure 5.3. Temporal Representation of Options for Improving Phonation Time Ratio................................................................................... 106
xi
ABSTRACT
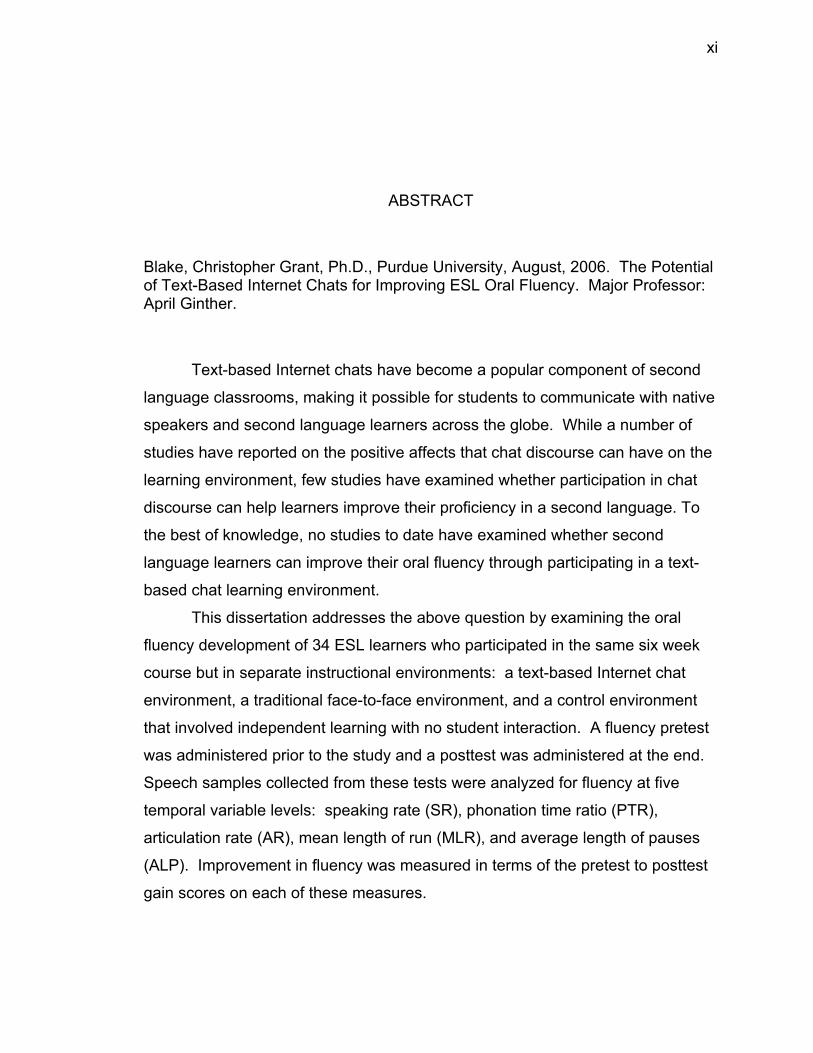
Blake, Christopher Grant, Ph.D., Purdue University, August, 2006. The Potential of Text-Based Internet Chats for Improving ESL Oral Fluency. Major Professor: April Ginther.
Text-based Internet chats have become a popular component of second
language classrooms, making it possible for students to communicate with native
speakers and second language learners across the globe. While a number of
studies have reported on the positive affects that chat discourse can have on the
learning environment, few studies have examined whether participation in chat
discourse can help learners improve their proficiency in a second language. To
the best of knowledge, no studies to date have examined whether second
language learners can improve their oral fluency through participating in a text-
based chat learning environment.
This dissertation addresses the above question by examining the oral
fluency development of 34 ESL learners who participated in the same six week
course but in separate instructional environments: a text-based Internet chat
environment, a traditional face-to-face environment, and a control environment
that involved independent learning with no student interaction. A fluency pretest
was administered prior to the study and a posttest was administered at the end.
Speech samples collected from these tests were analyzed for fluency at five
temporal variable levels: speaking rate (SR), phonation time ratio (PTR),
articulation rate (AR), mean length of run (MLR), and average length of pauses
(ALP). Improvement in fluency was measured in terms of the pretest to posttest
gain scores on each of these measures.
xii
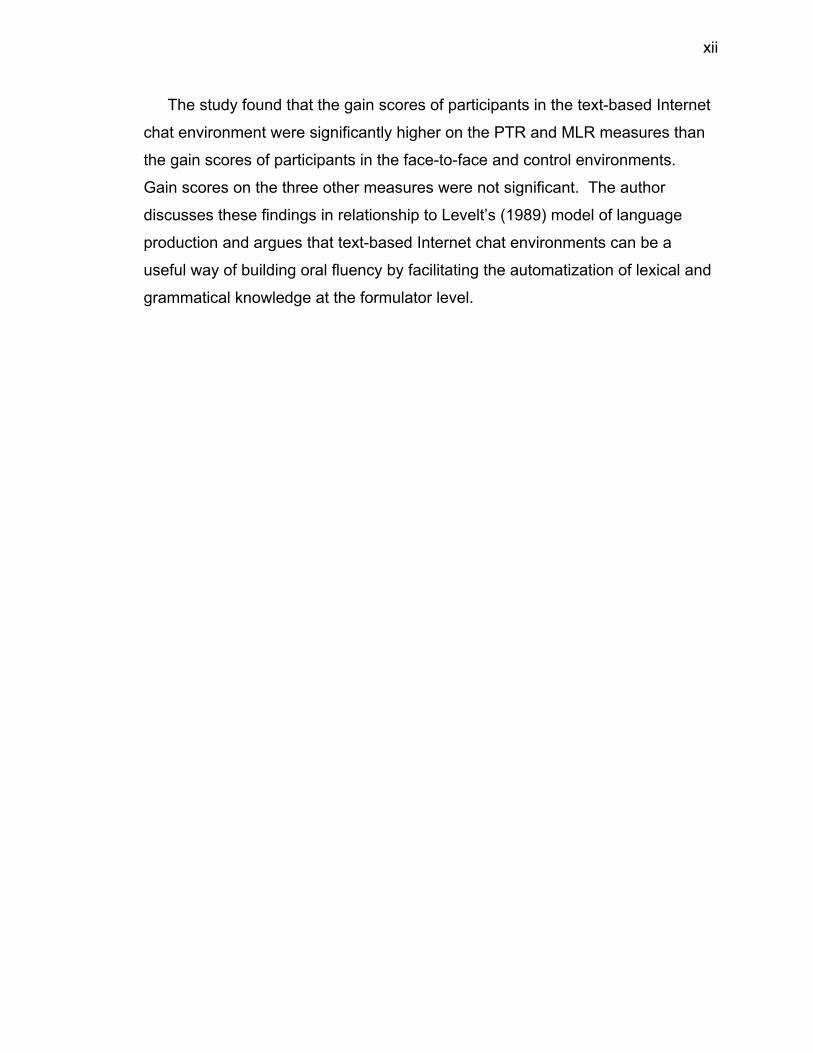
The study found that the gain scores of participants in the text-based Internet
chat environment were significantly higher on the PTR and MLR measures than
the gain scores of participants in the face-to-face and control environments.
Gain scores on the three other measures were not significant. The author
discusses these findings in relationship to Levelt’s (1989) model of language
production and argues that text-based Internet chat environments can be a
useful way of building oral fluency by facilitating the automatization of lexical and
grammatical knowledge at the formulator level.
1
CHAPTER 1. INTRODUCTION
1.1. Overview
The purpose of this dissertation is to examine whether ESL oral fluency
can be improved through the medium of a text-based Internet chat environment.
Over the past decade, text-based Internet chat rooms have become an
increasingly popular component of on-line second language courses. In this
environment, participants communicate with each other in real time by typing
messages that instantly appear on the computer screens of other members who
are logged into the virtual meeting space. These chat rooms give students the
opportunity to use the target language with other learners and to interact with
teachers and visitors who join the discussions. Although recent advancements in
technology have added visual and audio options—enabling participants to
communicate via cameras and microphones connected to their computers—the
text approach continues to be one of the most reliable and economically feasible
methods of connecting learners and instructors around the globe.
While it is generally assumed that chat rooms are useful elements in on-
line language courses, few studies have addressed the potential of this
instructional medium for improving oral proficiency. This may be due to an
underlying assumption that oral skills can only be developed in an oral learning
environment such as the traditional face-to-face classroom. Although one can
imagine how the lexical / syntactic skills developed in a text-based chat
environment might lead to improvements in an area such as writing, the transfer
to oral proficiency seems less straightforward. At the same time, if it were found
that oral fluency skills could be developed in a text-based chat environment,
2
there would be immediate implications for areas such as distance education that
rely heavily on text-based approaches to teaching.
The present study examines this possibility by asking the following
question:
In an ESL class with similar students and comparable teaching materials,
will there be differences in fluency improvement between students who
take the course in a text-based Internet chat environment, those who take
the same course in a traditional face-to-face environment, and students in
a control environment that does not involve participant interaction?
It is hypothesized that participants in the text-based Internet chat instructional
environment will demonstrate gains in oral fluency that are greater than those
made by participants in the traditional face-to-face instructional environment.
This hypothesis and the method by which it will be tested are supported by a
theoretical framework that pertains to research in fluency, language production,
and human information processing.
1.2. Theoretical Framework
1.2.1. Temporal Measures of Fluency
Although spoken fluency is a multi-faceted phenomenon involving the
successful interaction of many variables, empirical studies indicate that it is
linked to a relatively narrow range of temporal measures. Some of the variables
cited in the literature as being indicative of fluency include
1) rate of speech (Ejzenberg, 2000; Freed, 2000; Kormos & Denes, 2004;
Lennon, 1990; Towell et al., 1996),
2) mean length of run (Kormos & Denes, 2004; Raupach, 1987; Towell et al.,
1996),
3
3) phonation time ratio (Kormos & Denes, 2004; Raupach, 1987; Towell et al.,
1996; van Gelderen, 1994),
4) articulation rate (Towell et al., 1996),
5) average length of pauses (Kormos & Denes, 2004; Towell et al.),
6) amount of filled pauses (Rohde, 1985) and filled pauses per T-unit, (Lennon,
1990),
7) percent of T-units followed by a pause (Lennon, 1990),
8) stressed words per minute (Kormos & Denes, 2004).
Of the eight measures listed above, the first five have been selected for
this study for the reason that they are relatively easy to obtain through digital
voice analysis and have been validated repeatedly in the literature (see Towel et
al. 1996). By adopting these measures, the current study takes a focused
approach—more often referred to as the narrow approach—to defining and
measuring fluency. This approach has been characterized by Lennon (1990) as
“native-like rapidity” in a language (p.390) and by Fillmore (1979) as “the ability to
fill time with talk” (p.93). It stands in contrast to an alternative approach that
Lennon refers to as the broad sense of fluency. The broad sense or global
approach views fluency as overall proficiency in a language. Rather than
focusing on specific temporal variables, fluency at this level refers to a variety of
language features such as accuracy, lexical complexity, and even
appropriateness and idiomaticity. Expressions like “Sally speaks German
fluently” or “ChiHo is fluent in English” reflect this approach. Holistic evaluation
forms completed by trained raters are the fluency measures typically employed
when taking a global approach to fluency.
Although researchers such as Sajavaara and Lehtonen (1978) argue that
fluency is too complex to be reduced to a handful of temporal variables, other
studies (e.g. Freed, 1995; Kormos & Denes, 2004; Lehtonen, 1981; Lennon,
1984, , 1990; Olynyk, D'Anglejan, & Sankoff, 1987; Riggenbach, 1991; Rohde,
1985) indicate that there is a correlation between certain temporal variables and
the holistic measures employed at the global level. This evidence together with
4
the fact that temporal variables lend themselves more readily to quantitative
analysis are the main factors behind the measurement paradigm that has been
adopted for the current study.
1.2.2. Levelt’s Model of Language Production
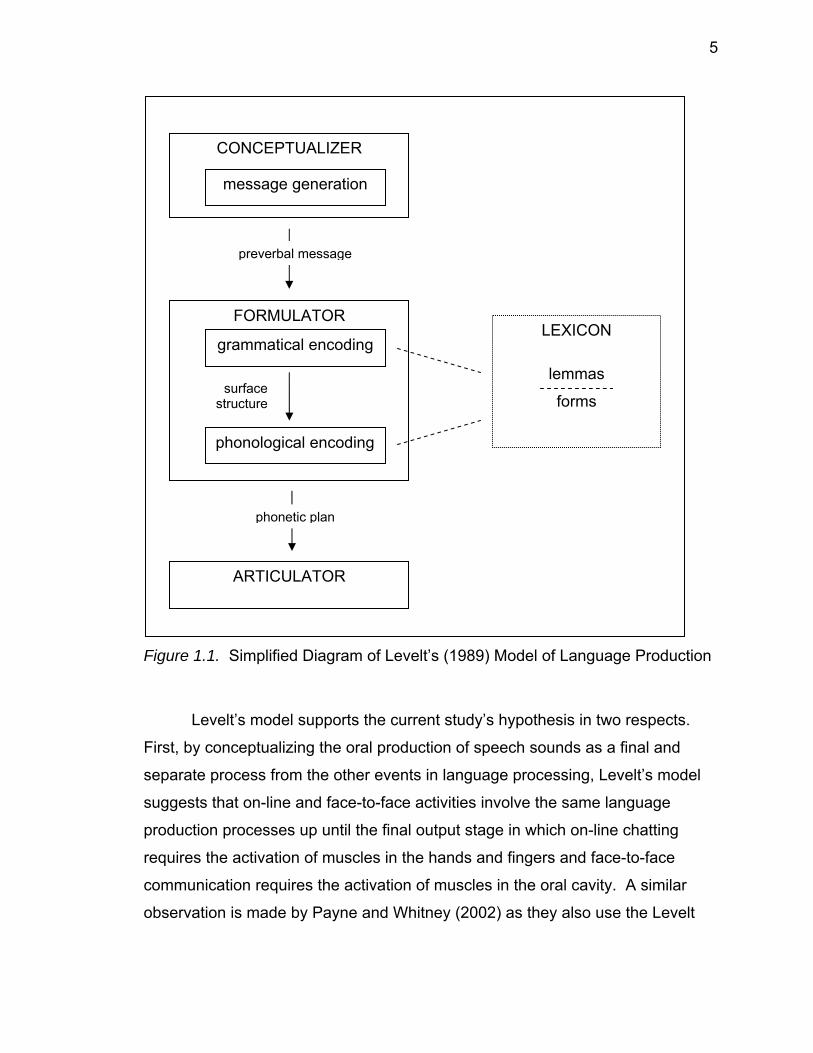
Levelt (1989) views language production as occurring in a series of three
modular stages: conceptualization, formulation, and articulation. A simplified
portrayal of Levelt’s model is presented in Figure 1.1. In the conceptualization
stage, the speaker first determines the semantic content of what she or he wants
to say and then generates a preverbal message. At this first stage, there are no
lexical items or grammatical structures associated with the message, but only a
conceptual outline or preverbal proposition of what is to be said.
The next stage of language production occurs in the formulator in which
semantic and morphophonological information is applied to the preverbal
message and the appropriate lexical items are selected. All of the linguistic
information that the speaker needs for formulating the message is stored in what
Levelt refers to broadly as the lexicon—an independent module that can be
accessed at either the formulation or comprehension stages of communication.
After a phonetic plan has been generated by the formulator, the speaker can
either articulate the message via the articulator or internally scan and evaluate
the message (as internal speech) in his or her speech comprehension system—
conceived by Levelt as yet another independent module. Finally, in the
articulation stage, the articulator takes the phonetic plan generated by the
formulator and puts it into actual speech via activation of the lungs and other
speech organs.
5
Figure 1.1. Simplified Diagram of Levelt’s (1989) Model of Language Production
Levelt’s model supports the current study’s hypothesis in two respects.
First, by conceptualizing the oral production of speech sounds as a final and
separate process from the other events in language processing, Levelt’s model
suggests that on-line and face-to-face activities involve the same language
production processes up until the final output stage in which on-line chatting
requires the activation of muscles in the hands and fingers and face-to-face
communication requires the activation of muscles in the oral cavity. A similar
observation is made by Payne and Whitney (2002) as they also use the Levelt
CONCEPTUALIZER
message generation
FORMULATOR
grammatical encoding
ARTICULATOR
phonological encoding
surface structure
LEXICON
lemmas
forms
preverbal message
phonetic plan
6
model to explain their finding that ESL participants involved in on-line chat
activities were are able to improve their oral proficiency levels as much as
students who were involved in only face-to-face activities.
A second link to Levelt’s theory is in regard to the specific events that take
place in the language production process at the formulator level. As noted
above, this second stage involves the speaker accessing his or her mental
lexicon to find the appropriate words and grammatical structures that best match
the content of the preverbal message. If Levelt’s first stage of conceptualization
is not language specific as de Bot (1992) suggests, then it can be argued that the
processes that take place at the formulation stage are the most significant for
fluent performance in a second language. In other words, to the degree to which
the second language speaker can access the appropriate lemmas (semantic
representations) and lexemes (morphophonological representations) that are
necessary for the speech act, he or she will be capable of performing a given
task in a fluent manner—barring, of course, any articulation problems that would
interfere in the production process. Since the above process takes place prior to
the engagement of the articulator, it follows that both on-line and face-to-face
language activities have equal potential for reinforcing the cognitive processes at
this level.
1.2.3. Shriffrin & Schneider’s (1977) Model of Automatic Vs Controlled
Information Processing
Shiffrin & Schneider (1977) view information processing as taking place in
one of two different modes—controlled search or automatic detection.
Processing at the controlled search level requires high levels of attention and
makes use of the limited capacity of short term memory. According to the
authors, controlled processing operations are most often utilized when a person
is learning something for the first time or when the information is relatively
unfamiliar. In these novel cognitive situations, a person must carefully think
7
through every step of the activity from beginning to end. Without this careful
allocation of attention, successful completion of the task is unlikely. Driving a
manual shift car for the first time is a useful analogy of a controlled search
process. The new driver must give attention to both the clutch and the
accelerator pedals—focusing on the appropriate timing of each. At this stage, if
the driver tries to focus on another new task—such as learning how to operate a
new stereo system in the car—successful performance of either task would be
difficult at best.
Automatic detection processing, on the other hand, takes place through
repeated practice and exposure to activities at the controlled level. Unlike
controlled search activities, automatic processes are not dependent upon short
term memory but instead are stored in long term memory. One advantage of
automatic activities cited by Shiffrin & Schneider is that they can be carried out
while completing other tasks at the controlled search level. For example, if
driving a manual shift car has become an automatic activity, then it will be
possible to carry out this activity while simultaneously searching for a road on a
map or listening carefully to a radio program.
Although Shiffrin and Schneider’s model does not directly address issues
in language fluency, the construct is nonetheless relevant to the current study
when applied to Levelt’s model of language production. As already discussed,
the ability to speak a second language, according to Levelt’s model, depends
upon successfully accessing linguistic knowledge from the lexicon. If this
process of accessing information at the formulator level is viewed through Shiffrin
and Schneider’s framework, then lexical retrieval at any given point may be
placed on a continuum from being highly controlled to highly automatic.
Automaticity in this framework is then largely determined by the degree to
which the second language speaker is familiar with the communication context
and has experience accessing the required information in the lexicon. A fluent
performance could thus be explained as one in which the language speaker is
able to perform the tasks automatically and without a great deal of effort. Such a
8
view of fluency is found repeatedly in the literature (Carr, 1992; Pawley & Syder,
1983; Payne & Whitney, 2002; Schmidt, 1992; Segalowitz, 2000; Segalowitz &
Freed, 2004; Segalowitz & Segalowitz, 1993; Segalowitz, Segalowitz, & Wood,
1998; Wood, 2001). The hypothesis in the current study that fluency can be
improved in an on-line environment is based, in part, on the assumption that
using English in an on-line chat environment will help to build automaticity at the
formulator level via repeated exposure to and practice of English structures in the
on-line activities.
1.2.4. Curriculum Design
A fourth area of theory that comes to bear on the current study is from the
field of language curriculum design, especially as it pertains to computer assisted
language learning (CALL) and distance education. These assumptions relate to
the nature of distance education, the sequencing of language instruction, and the
potential of synchronous communication for enhancing oral fluency. Early
research in distance education focused on comparing the learning outcomes of
face-to-face and distance education environments. Various types of media
environments were also compared with each other in the hope of finding an
approach that would result in higher achievement and greater student
satisfaction than traditional approaches. As noted by Russell (1999) in his review
of over 350 distance education studies from 1928 to 1996, the common finding in
the majority of these studies was that there was “no significant difference” in the
learning outcomes of distance education and traditional face-to-face courses.
In an earlier publication, Clark (1994) admonished educators to abandon
the idea that enhanced media would lead to enhanced learning. Instead, he
argued that the focus in distance education should be on the development of
teaching methods that are appropriate for the learning context. More recently,
research in distance education has moved away from comparing different types
of media to instead focusing on the interaction between the learner and the
9
distance learning environment. In such studies, for example examinations of
interactivity in distance learning, the focus shifts from the media itself to the
appropriate use of media and methods to arrive at the desired learning outcome
(e.g. Bloch, 2002; Hughes & Hewson, 1998; McHenry & Bozik, 1995; Pujol,
1995; Reinhart, 1998; Scott, 2002; Vrasidas & McIsaac, 1999).
The assumptions in the current study are informed by the findings presented
above. Rather than comparing on-line and face-to-face learning methods as
ends in themselves, this study examines the outcomes of both environments with
the goal of understanding if the language production processes facilitated by
these approaches are comparable. The question, in other words, is not whether
one environment is better than the other, but rather does the type of interaction
that takes place in one environment (on-line chatting) facilitate similar language
production processes and language outcomes as in the other environment (face-
to-face chatting). A control group is included in the research design and is used
as a benchmark for assessing fluency development in the two experimental
groups. Contrary to most studies in which a finding of “no-difference” is the least
desirable outcome, such a result in this study would be a welcome validation of
on-line chat approaches to fluency building—especially in contexts where face-
to-face language practice is not possible.
10
CHAPTER 2. REVIEW OF RELATED LITERATURE
2.1. Approaches to Fluency
Fluency is conceptualized in various ways in the literature. After reviewing
the literature, Schmitt-Gevers (1993) concluded that there were over 32 possible
definitions of the term. Lennon (1990) provides a useful way of managing the
discussion by parsing the use of fluency into either the broad or narrow sense.
At the broad level, fluency is used synonymously with the term proficiency, as in
the statement “Nancy speaks Spanish fluently.” This holistic use refers to a
range of competencies including grammatical, lexical, and semantic and in this
way is similar to the notion of communicative competence (Canale, 1983; Canale
& Swain, 1980; Hymes, 1971; Savignon, 1997). For example, in one of the
earliest and most frequently cited works on the subject, Fillmore (1979) argues
that fluency includes features such as speech rate, complexity, coherence,
appropriateness, and even creativity. He states that the “maximally gifted wielder
of a language” would be adept in all of these areas (p.93). Just as Canale and
Swain would not consider a speaker to be communicatively competent based on
grammatical accuracy alone, Fillmore does not consider a speaker to be fluent
simply because he or she can speak at a rapid pace with few pauses. Instead,
successful performance is attributed to abilities at multiple sub-levels.
The broad approach to fluency is adopted by others. Brumfit (1984)
defines fluency as “the maximally effective operation of the language system so
far acquired by the student” (p.57); Faerch, Haastrup, and Phillipson (1984) call
it “the capacity to be able to put what one wants to say into words with ease”
(p.143). Clahsen (1987) likens it to “nativelike competence” in the target
language (p.67); Sajavaara (1987) refers to it as “the communicative
11
acceptability of the speech act” (p.62); and Lesson (1975) views fluency as a
“multi-faceted phenomenon” that involves “a complex of linguistic and
psychomotor skills” at both the encoding and decoding level (p. v).
Sajavaara and Lehtonen (1978) summarize the underlying rationale of this
approach. While they acknowledge the assessment problems that come with a
“loose application” of the term, they make a case against the alternative by citing
a range of variables that can affect how a message is delivered and perceived
(e.g., nature of the speech task, sociolinguist context, “internal pressures” of the
speaker). The authors maintain that fluency cannot be boiled down to a few
isolatable variables such as rate of speech, length of pauses, and phonetic
density. They state: “Whatever fluency is, it is not a variable which is open to
either physical or grammatical means of measurement. It is . . . obvious that it is
much easier to give an exact definition for ‘disfluency’ than for fluency” (p.51).
In contrast with the broad sense of fluency, Lennon (1990) describes the
narrow sense as “one, presumably isolatable, component of oral proficiency”
(p. 389), and this component he argues is native-like rapidity and smoothness.
Unlike the broad approach which views fluency as a person’s overall proficiency
in a language, the narrow approach focuses on specific features relating to the
manner of the speaker’s oral production (e.g., rate of speech and various
pausing phenomena). Descriptors such as effortless, efficient, and smooth, are
used to describe a fluent speaker at this level in contrast to terms such as
accurate, appropriate, idiomatic, and clear at the broad level. Because the
expression narrow approach has negative connotations (e.g., reductionist) and
lacks descriptive qualities, the term focused approach will be used in the
remainder of this thesis in reference to this perspective of fluency.
Like its counterpart, the focused approach also has its share of advocates.
The underlying rationale for this approach is that it is precise and thereby more
conducive to empirical research. For example, Heike (1985) calls for the use of
explicit variables in measuring fluency and the employment of strategies that
“overcome the holistic notion of fluency that guides our thinking” (p.135);
12
Schmidt (1992) states that the focused approach is better than the alternative
which “appears to differ little from the concept of proficiency” (p.359); and
Chambers (1997) argues that the use of measurable fluency variables “provides
a useful anchorage for a concept which is prone to vagueness and multiple
interpretations” (p.538). It is this defining aspect of the focused approach—its
focus on definable and measurable variables—that makes it especially attractive
to researchers.
A potential weakness of the focused approach is addressed in
Riggenbach (1991) in which the author explains that one participant in the study
demonstrated strong fluency at the focused level (e.g., high speech rate and low
frequency of pauses) but was perceived by the rater panel as being dysfluent.
Riggenbach comments that the low ratings assigned by the panel were probably
due to the participant’s low level of proficiency as demonstrated by the frequent
grammatical inaccuracies in her speech. The author uses this case as evidence
that “fluency is more of a holistic concept than traditional definitions of fluency
have offered” (p.434). Although the author does not specify exactly what is
meant by “traditional definitions,” one may assume from the context of the
discussion that she is referring to definitions that are based on temporal
measures.
2.2. Temporal Measures of Fluency
The term temporal variables refers to a range of time-related variables that
are used to measure fluency and other aspects of oral language production. The
use of temporal variables goes back to research conducted by Goldman-Eisler in
the 1950’s and 1960’s (e.g. Goldman-Eisler, 1958, 1968) in which the author
examined the cognitive processes behind speech production. In a summative
work, Goldman-Eisler (1968) explains the significance of temporal variables in
speech:
13
Speech is a serial phenomenon, an activity spread out in time. It does
not, however, fill time continuously, particularly when it is spontaneous,
but comes in fits and starts with intermittent periods of non-speech. A
passage of speech extending into time consists of two sorts of time: time
of vocal action and time of silence. (p.11)
Goldman Eisler’s early work in psycholinguistic research inspired other
studies that employed temporal variables to examine cross-linguistic phenomena
of speech as well as the cognitive processes behind second language production
(e.g. Dechert, 1984; Dechert, Mohle, & Raupach, 1984; Dechert & Raupach,
1980; Dechert & Raupach, 1987; Grosjean, 1980; Mohle, 1984; O'Connell, 1980;
Raupach, 1980b; Raupach, 1984; Raupach, 1987; Sajavaara, 1987). Many of
the variables used in these studies have been employed in second language
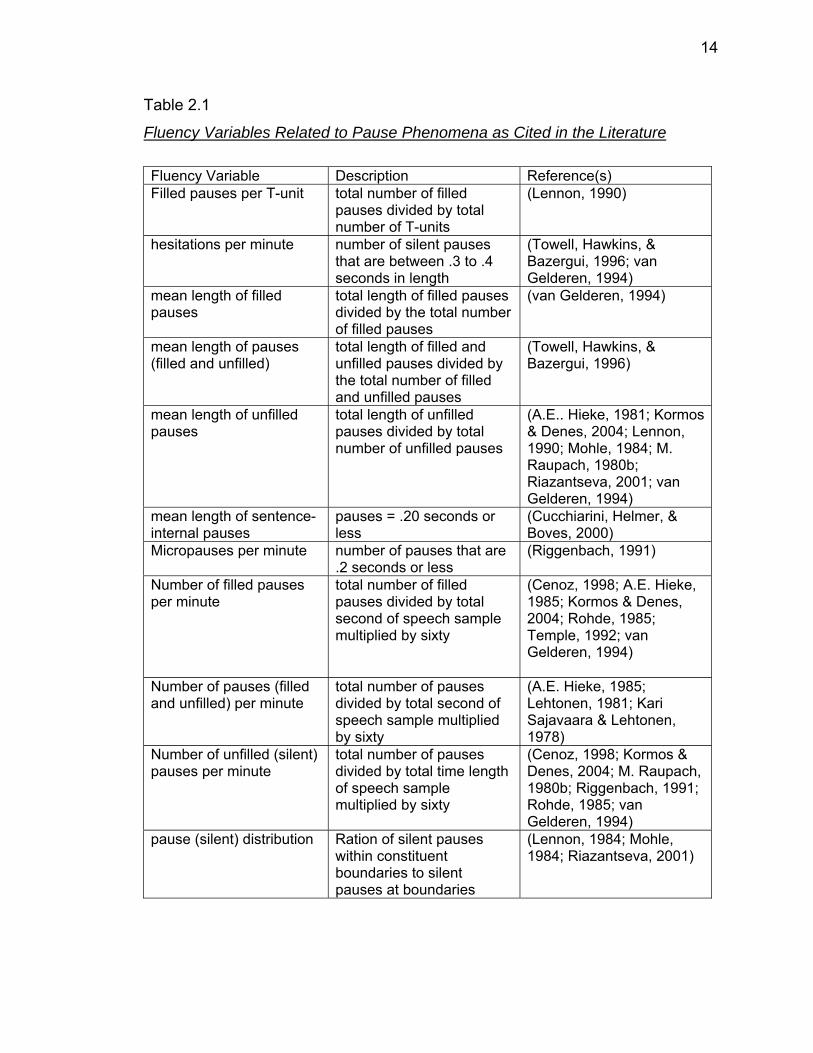
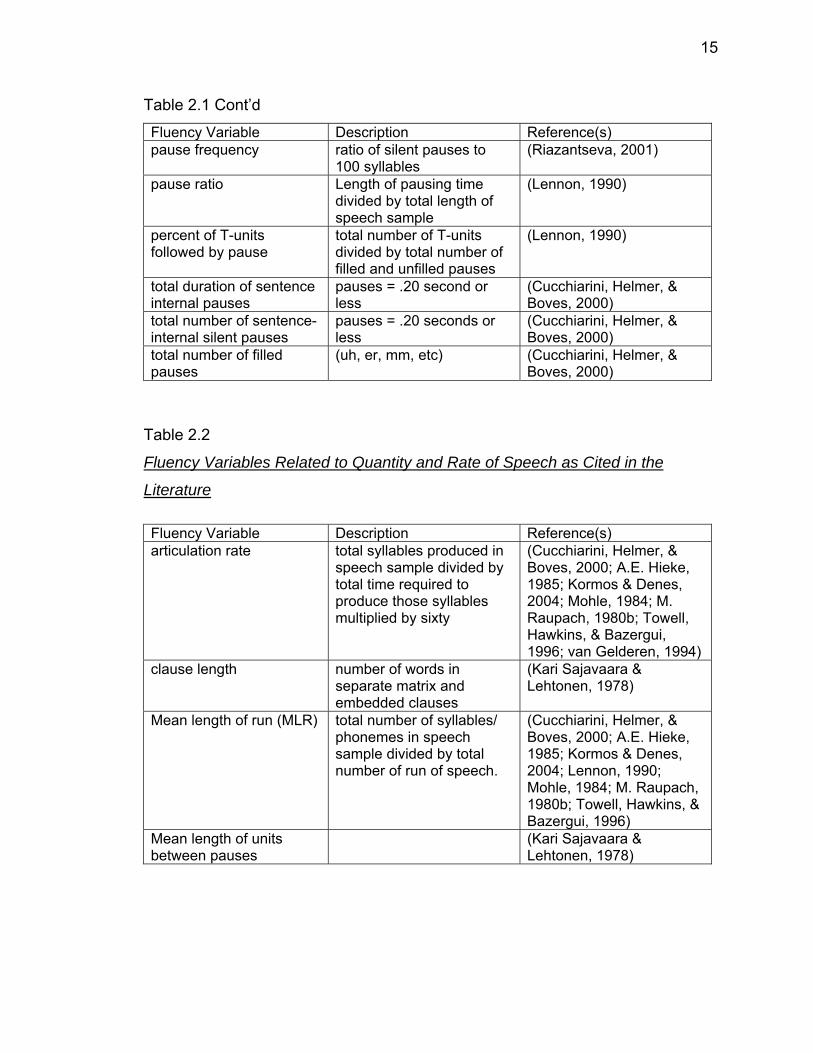
fluency studies as well. Tables 2.1 - 2.3 present an inventory of nearly 50
fluency variables that have been cited in the literature from 1978 to 2004.
14
Table 2.1
Fluency Variables Related to Pause Phenomena as Cited in the Literature
Fluency Variable Description Reference(s) Filled pauses per T-unit total number of filled
pauses divided by total number of T-units
(Lennon, 1990)
hesitations per minute number of silent pauses that are between .3 to .4 seconds in length
(Towell, Hawkins, & Bazergui, 1996; van Gelderen, 1994)
mean length of filled pauses
total length of filled pauses divided by the total number of filled pauses
(van Gelderen, 1994)
mean length of pauses (filled and unfilled)
total length of filled and unfilled pauses divided by the total number of filled and unfilled pauses
(Towell, Hawkins, & Bazergui, 1996)
mean length of unfilled pauses
total length of unfilled pauses divided by total number of unfilled pauses
(A.E.. Hieke, 1981; Kormos & Denes, 2004; Lennon, 1990; Mohle, 1984; M. Raupach, 1980b; Riazantseva, 2001; van Gelderen, 1994)
mean length of sentence-internal pauses
pauses = .20 seconds or less
(Cucchiarini, Helmer, & Boves, 2000)
Micropauses per minute number of pauses that are .2 seconds or less
(Riggenbach, 1991)
Number of filled pauses per minute
total number of filled pauses divided by total second of speech sample multiplied by sixty
(Cenoz, 1998; A.E. Hieke, 1985; Kormos & Denes, 2004; Rohde, 1985; Temple, 1992; van Gelderen, 1994)
Number of pauses (filled and unfilled) per minute
total number of pauses divided by total second of speech sample multiplied by sixty
(A.E. Hieke, 1985; Lehtonen, 1981; Kari Sajavaara & Lehtonen, 1978)
Number of unfilled (silent) pauses per minute
total number of pauses divided by total time length of speech sample multiplied by sixty
(Cenoz, 1998; Kormos & Denes, 2004; M. Raupach, 1980b; Riggenbach, 1991; Rohde, 1985; van Gelderen, 1994)
pause (silent) distribution Ration of silent pauses within constituent boundaries to silent pauses at boundaries
(Lennon, 1984; Mohle, 1984; Riazantseva, 2001)
15
Table 2.1 Cont’d Fluency Variable Description Reference(s) pause frequency ratio of silent pauses to
100 syllables (Riazantseva, 2001)
pause ratio Length of pausing time divided by total length of speech sample
(Lennon, 1990)
percent of T-units followed by pause
total number of T-units divided by total number of filled and unfilled pauses
(Lennon, 1990)
total duration of sentence internal pauses
pauses = .20 second or less
(Cucchiarini, Helmer, & Boves, 2000)
total number of sentence-internal silent pauses
pauses = .20 seconds or less
(Cucchiarini, Helmer, & Boves, 2000)
total number of filled pauses
(uh, er, mm, etc) (Cucchiarini, Helmer, & Boves, 2000)
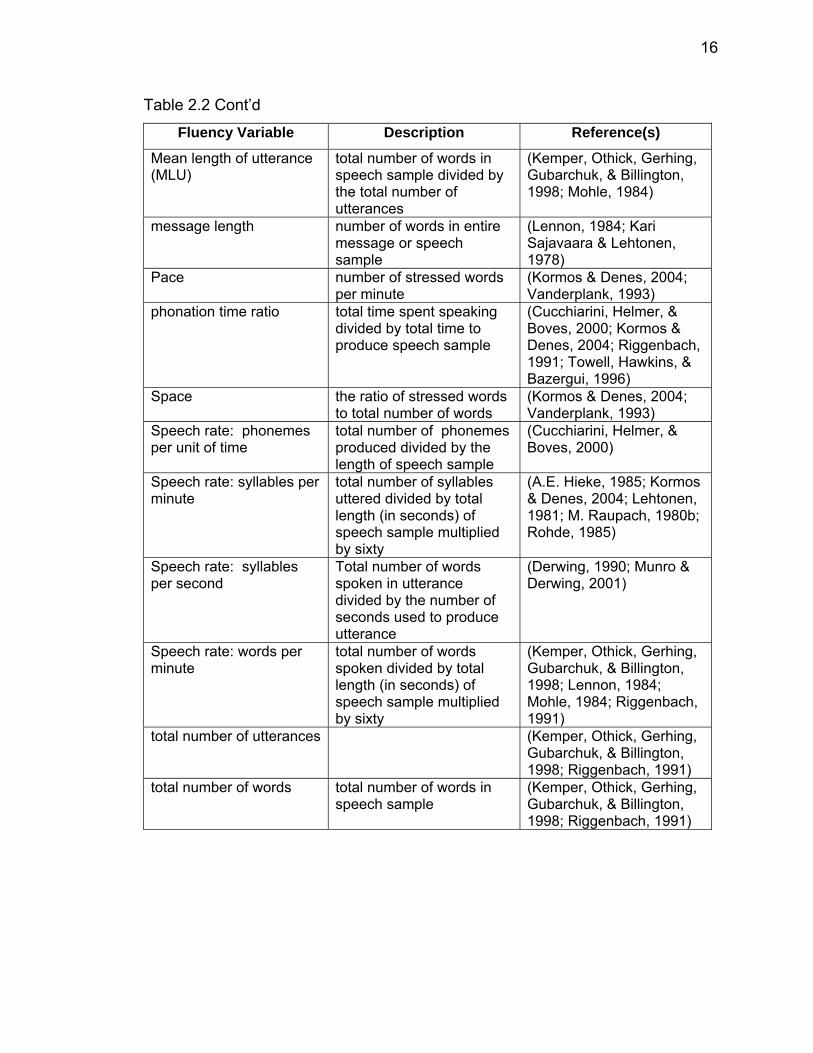
Table 2.2
Fluency Variables Related to Quantity and Rate of Speech as Cited in the
Literature
Fluency Variable Description Reference(s) articulation rate total syllables produced in
speech sample divided by total time required to produce those syllables multiplied by sixty
(Cucchiarini, Helmer, & Boves, 2000; A.E. Hieke, 1985; Kormos & Denes, 2004; Mohle, 1984; M. Raupach, 1980b; Towell, Hawkins, & Bazergui, 1996; van Gelderen, 1994)
clause length number of words in separate matrix and embedded clauses
(Kari Sajavaara & Lehtonen, 1978)
Mean length of run (MLR)
total number of syllables/ phonemes in speech sample divided by total number of run of speech.
(Cucchiarini, Helmer, & Boves, 2000; A.E. Hieke, 1985; Kormos & Denes, 2004; Lennon, 1990; Mohle, 1984; M. Raupach, 1980b; Towell, Hawkins, & Bazergui, 1996)
Mean length of units between pauses
(Kari Sajavaara & Lehtonen, 1978)
16
Table 2.2 Cont’d
Fluency Variable Description Reference(s)
Mean length of utterance (MLU)
total number of words in speech sample divided by the total number of utterances
(Kemper, Othick, Gerhing, Gubarchuk, & Billington, 1998; Mohle, 1984)
message length number of words in entire message or speech sample
(Lennon, 1984; Kari Sajavaara & Lehtonen, 1978)
Pace number of stressed words per minute
(Kormos & Denes, 2004; Vanderplank, 1993)
phonation time ratio total time spent speaking divided by total time to produce speech sample
(Cucchiarini, Helmer, & Boves, 2000; Kormos & Denes, 2004; Riggenbach, 1991; Towell, Hawkins, & Bazergui, 1996)
Space the ratio of stressed words to total number of words
(Kormos & Denes, 2004; Vanderplank, 1993)
Speech rate: phonemes per unit of time
total number of phonemes produced divided by the length of speech sample
(Cucchiarini, Helmer, & Boves, 2000)
Speech rate: syllables per minute
total number of syllables uttered divided by total length (in seconds) of speech sample multiplied by sixty
(A.E. Hieke, 1985; Kormos & Denes, 2004; Lehtonen, 1981; M. Raupach, 1980b; Rohde, 1985)
Speech rate: syllables per second
Total number of words spoken in utterance divided by the number of seconds used to produce utterance
(Derwing, 1990; Munro & Derwing, 2001)
Speech rate: words per minute
total number of words spoken divided by total length (in seconds) of speech sample multiplied by sixty
(Kemper, Othick, Gerhing, Gubarchuk, & Billington, 1998; Lennon, 1984; Mohle, 1984; Riggenbach, 1991)
total number of utterances (Kemper, Othick, Gerhing, Gubarchuk, & Billington, 1998; Riggenbach, 1991)
total number of words total number of words in speech sample
(Kemper, Othick, Gerhing, Gubarchuk, & Billington, 1998; Riggenbach, 1991)
17
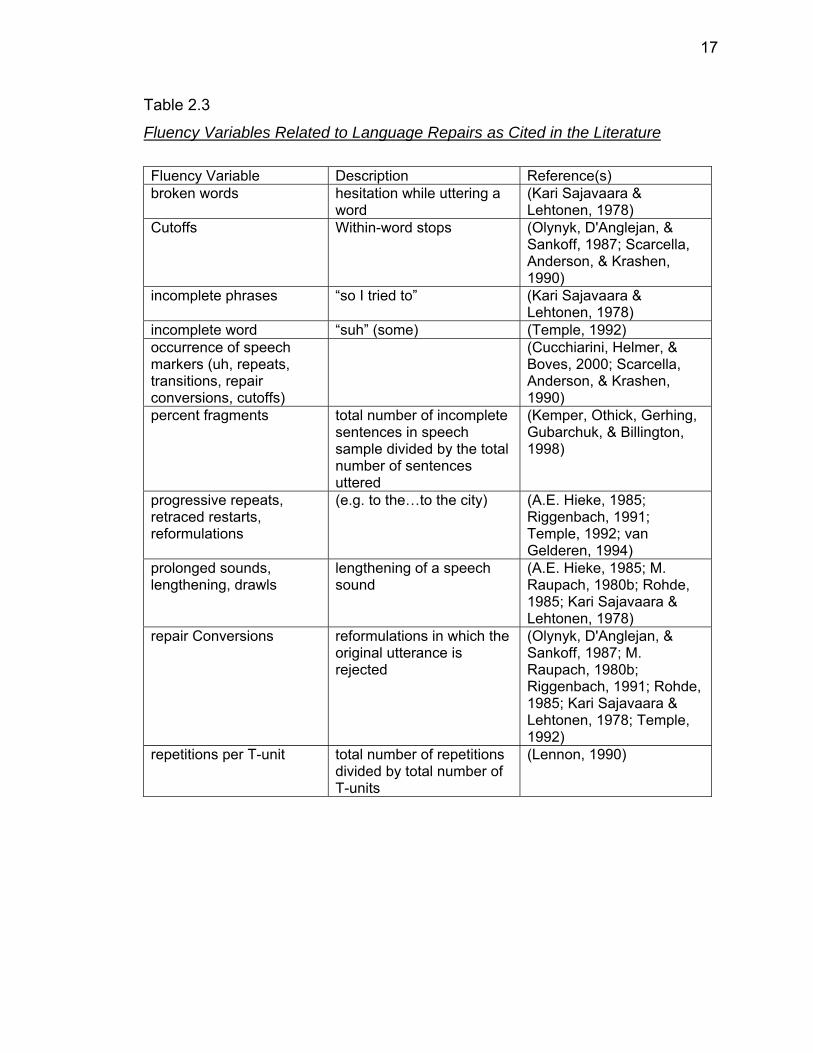
Table 2.3
Fluency Variables Related to Language Repairs as Cited in the Literature
Fluency Variable Description Reference(s) broken words hesitation while uttering a
word (Kari Sajavaara & Lehtonen, 1978)
Cutoffs Within-word stops (Olynyk, D'Anglejan, & Sankoff, 1987; Scarcella, Anderson, & Krashen, 1990)
incomplete phrases “so I tried to” (Kari Sajavaara & Lehtonen, 1978)
incomplete word “suh” (some) (Temple, 1992) occurrence of speech markers (uh, repeats, transitions, repair conversions, cutoffs)
(Cucchiarini, Helmer, & Boves, 2000; Scarcella, Anderson, & Krashen, 1990)
percent fragments total number of incomplete sentences in speech sample divided by the total number of sentences uttered
(Kemper, Othick, Gerhing, Gubarchuk, & Billington, 1998)
progressive repeats, retraced restarts, reformulations
(e.g. to the…to the city) (A.E. Hieke, 1985; Riggenbach, 1991; Temple, 1992; van Gelderen, 1994)
prolonged sounds, lengthening, drawls
lengthening of a speech sound
(A.E. Hieke, 1985; M. Raupach, 1980b; Rohde, 1985; Kari Sajavaara & Lehtonen, 1978)
repair Conversions reformulations in which the original utterance is rejected
(Olynyk, D'Anglejan, & Sankoff, 1987; M. Raupach, 1980b; Riggenbach, 1991; Rohde, 1985; Kari Sajavaara & Lehtonen, 1978; Temple, 1992)
repetitions per T-unit total number of repetitions divided by total number of T-units
(Lennon, 1990)
18
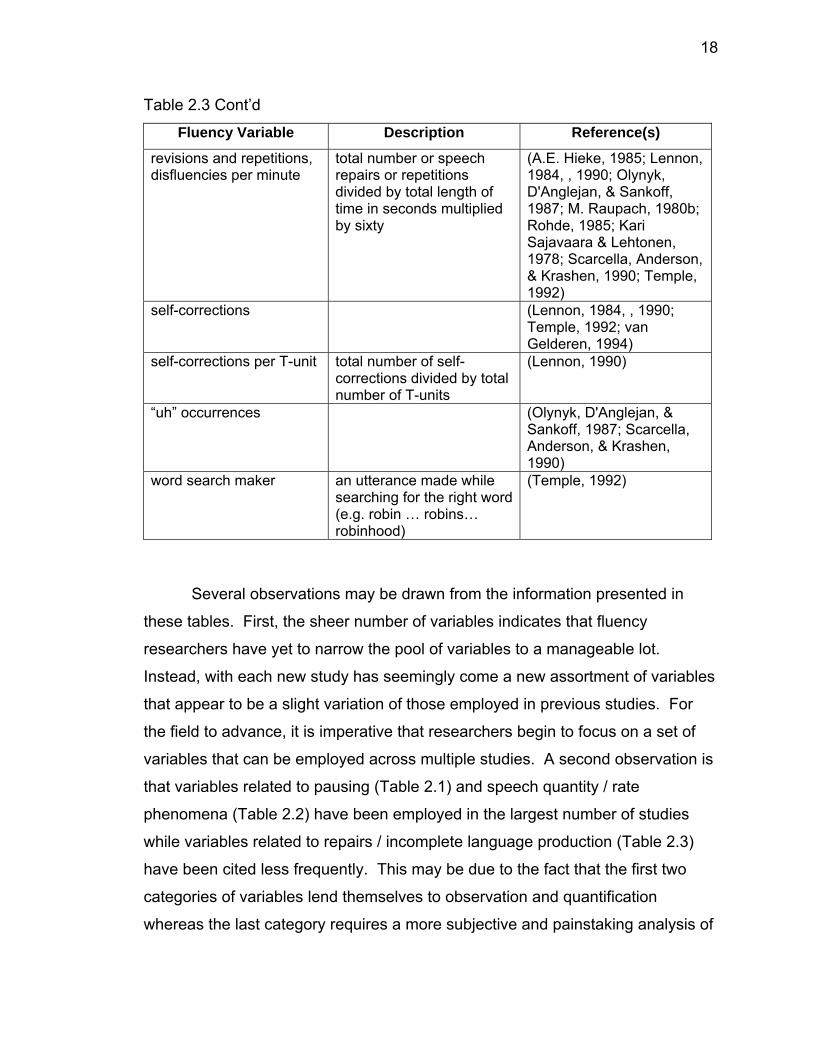
Table 2.3 Cont’d
Fluency Variable Description Reference(s)
revisions and repetitions, disfluencies per minute
total number or speech repairs or repetitions divided by total length of time in seconds multiplied by sixty
(A.E. Hieke, 1985; Lennon, 1984, , 1990; Olynyk, D'Anglejan, & Sankoff, 1987; M. Raupach, 1980b; Rohde, 1985; Kari Sajavaara & Lehtonen, 1978; Scarcella, Anderson, & Krashen, 1990; Temple, 1992)
self-corrections (Lennon, 1984, , 1990; Temple, 1992; van Gelderen, 1994)
self-corrections per T-unit total number of self-corrections divided by total number of T-units
(Lennon, 1990)
“uh” occurrences (Olynyk, D'Anglejan, & Sankoff, 1987; Scarcella, Anderson, & Krashen, 1990)
word search maker an utterance made while searching for the right word(e.g. robin … robins… robinhood)
(Temple, 1992)
Several observations may be drawn from the information presented in
these tables. First, the sheer number of variables indicates that fluency
researchers have yet to narrow the pool of variables to a manageable lot.
Instead, with each new study has seemingly come a new assortment of variables
that appear to be a slight variation of those employed in previous studies. For
the field to advance, it is imperative that researchers begin to focus on a set of
variables that can be employed across multiple studies. A second observation is
that variables related to pausing (Table 2.1) and speech quantity / rate
phenomena (Table 2.2) have been employed in the largest number of studies
while variables related to repairs / incomplete language production (Table 2.3)
have been cited less frequently. This may be due to the fact that the first two
categories of variables lend themselves to observation and quantification
whereas the last category requires a more subjective and painstaking analysis of
19
speech. Finally, it should be noted that the vast majority of the cited studies were
published in the 1980’s and 1990’s with only five having been published within
the past five years. This is somewhat surprising, especially considering that
recent developments in technology have made the collection and analysis of
such data much easier than in the past. As already stated, there is an obvious
need to narrow the range of fluency variables employed in the field, but this will
only occur if studies like these continue in the future. The following sections
provide more detailed description of the categories presented in these tables.
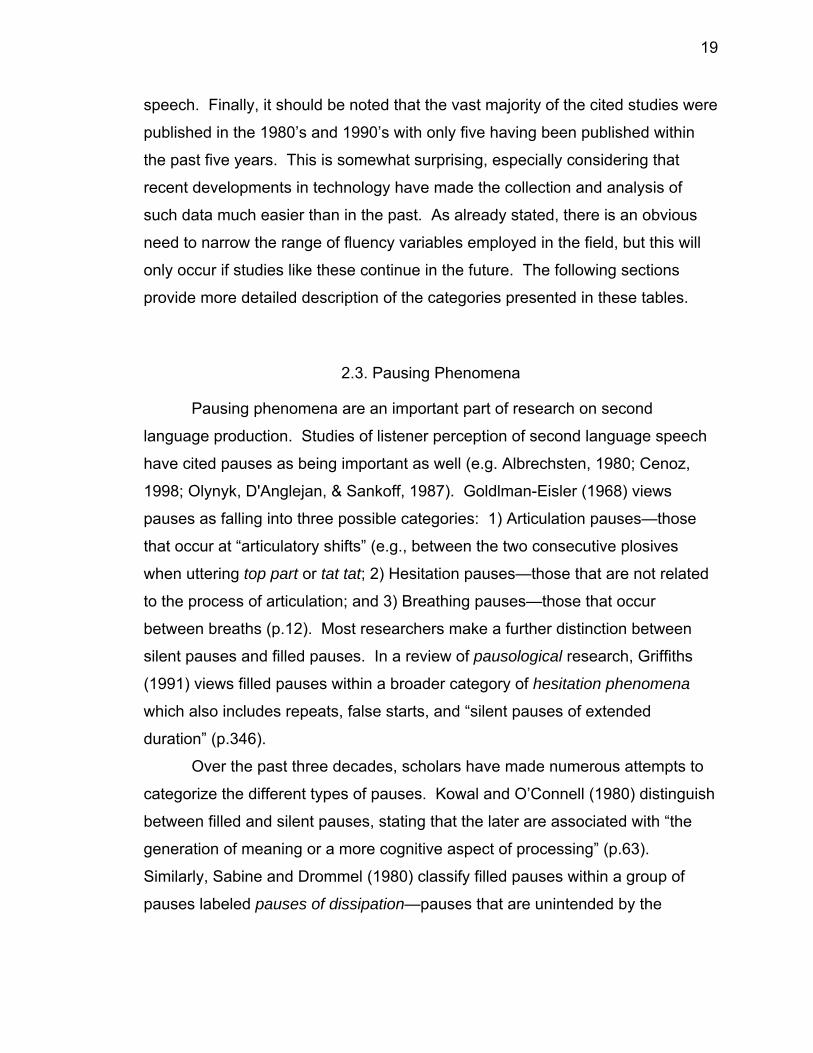
2.3. Pausing Phenomena
Pausing phenomena are an important part of research on second
language production. Studies of listener perception of second language speech
have cited pauses as being important as well (e.g. Albrechsten, 1980; Cenoz,
1998; Olynyk, D'Anglejan, & Sankoff, 1987). Goldlman-Eisler (1968) views
pauses as falling into three possible categories: 1) Articulation pauses—those
that occur at “articulatory shifts” (e.g., between the two consecutive plosives
when uttering top part or tat tat; 2) Hesitation pauses—those that are not related
to the process of articulation; and 3) Breathing pauses—those that occur
between breaths (p.12). Most researchers make a further distinction between
silent pauses and filled pauses. In a review of pausological research, Griffiths
(1991) views filled pauses within a broader category of hesitation phenomena
which also includes repeats, false starts, and “silent pauses of extended
duration” (p.346).
Over the past three decades, scholars have made numerous attempts to
categorize the different types of pauses. Kowal and O’Connell (1980) distinguish
between filled and silent pauses, stating that the later are associated with “the
generation of meaning or a more cognitive aspect of processing” (p.63).
Similarly, Sabine and Drommel (1980) classify filled pauses within a group of
pauses labeled pauses of dissipation—pauses that are unintended by the
20
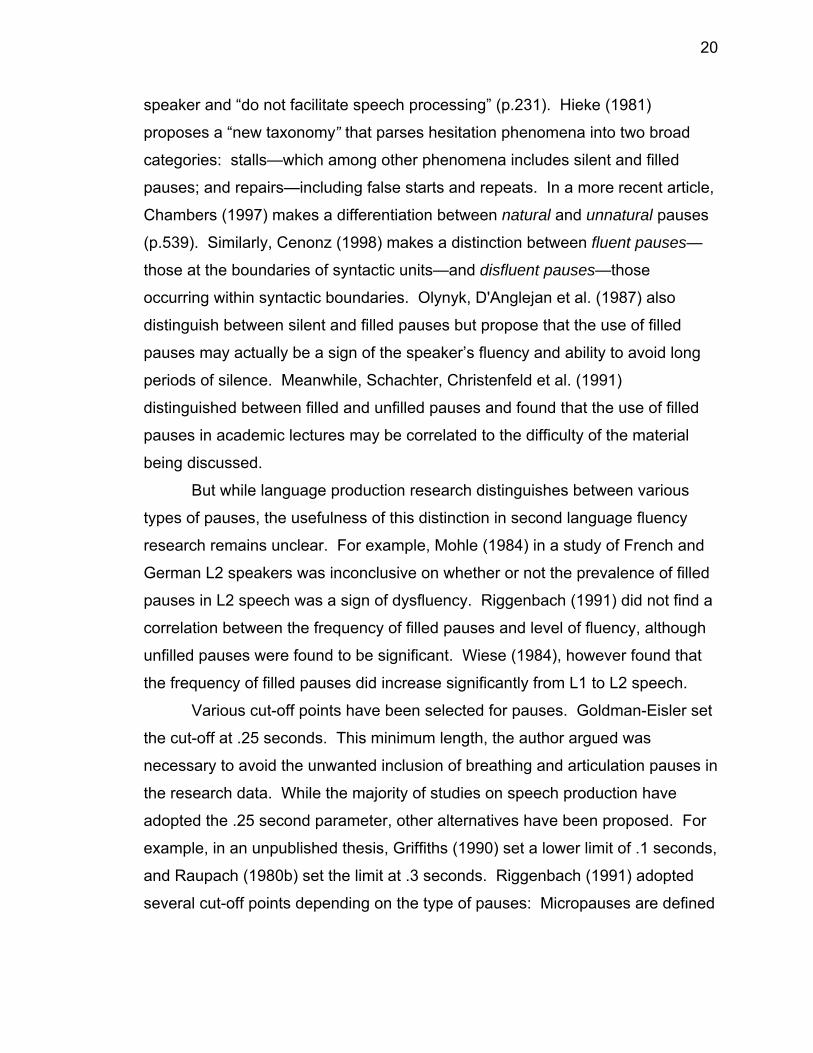
speaker and “do not facilitate speech processing” (p.231). Hieke (1981)
proposes a “new taxonomy” that parses hesitation phenomena into two broad
categories: stalls—which among other phenomena includes silent and filled
pauses; and repairs—including false starts and repeats. In a more recent article,
Chambers (1997) makes a differentiation between natural and unnatural pauses
(p.539). Similarly, Cenonz (1998) makes a distinction between fluent pauses—
those at the boundaries of syntactic units—and disfluent pauses—those
occurring within syntactic boundaries. Olynyk, D'Anglejan et al. (1987) also
distinguish between silent and filled pauses but propose that the use of filled
pauses may actually be a sign of the speaker’s fluency and ability to avoid long
periods of silence. Meanwhile, Schachter, Christenfeld et al. (1991)
distinguished between filled and unfilled pauses and found that the use of filled
pauses in academic lectures may be correlated to the difficulty of the material
being discussed.
But while language production research distinguishes between various
types of pauses, the usefulness of this distinction in second language fluency
research remains unclear. For example, Mohle (1984) in a study of French and
German L2 speakers was inconclusive on whether or not the prevalence of filled
pauses in L2 speech was a sign of dysfluency. Riggenbach (1991) did not find a
correlation between the frequency of filled pauses and level of fluency, although
unfilled pauses were found to be significant. Wiese (1984), however found that
the frequency of filled pauses did increase significantly from L1 to L2 speech.
Various cut-off points have been selected for pauses. Goldman-Eisler set
the cut-off at .25 seconds. This minimum length, the author argued was
necessary to avoid the unwanted inclusion of breathing and articulation pauses in
the research data. While the majority of studies on speech production have
adopted the .25 second parameter, other alternatives have been proposed. For
example, in an unpublished thesis, Griffiths (1990) set a lower limit of .1 seconds,
and Raupach (1980b) set the limit at .3 seconds. Riggenbach (1991) adopted
several cut-off points depending on the type of pauses: Micropauses are defined
21
as those of .20 seconds or less, hesitations are those between .3 and .4
seconds, and unfilled pauses are those between .5 and 3 seconds. Meanwhile,
Towel et al. (1996) set the cut-off at .28 seconds, citing practical measurement
issues.
Many of the variables used in fluency studies are related to pausing
phenomena. Goldman-Eisler proposed seven pause-related variables, nearly all
of which can be found in subsequent literature on the topic. These variables are
1) placement of pauses in relation to grammatical boundaries (Cenoz, 1998;
Lennon, 1984; Mohle, 1984; Riazantseva, 2001); 2) length of pauses (Kormos &
Denes, 2004; Mohle, 1984; Raupach, 1980b; Riazantseva, 2001; van Gelderen,
1994); 3) frequency of pauses (Riggenbach, 1991) (Cenoz, 1998; Riazantseva,
2001); 4) relative duration of pauses (total pausing as a percentage of total
utterance time); 5) rate of speech production (syllables per utterance) (Hieke,
1985; Kormos & Denes, 2004; Lehtonen, 1981; Raupach, 1980b; Rohde, 1985);
6) the nature of the speech task associated with the pauses (e.g. planned vs
spontaneous); 7) the nature of the speech act associated with the pause
(subconscious vs preconceived). The final two variables are rarely cited in
studies on fluency but are arguably an important facet of pause phenomena—
especially if one considers research in sociolinguistics and the integral role that
context plays in language production.
2.3.1. Speech Rate
Speech rate in general terms is the ratio of speech output in x units per
unit of time. In research, this rate is reported as either syllables per second or
words per minute. As noted by Chambers (1997), the rate of speech in any
given speech sample is a measure of both articulation rate, usually expressed in
syllables per second, and pause time. In this way, speech rates are highest
when a speaker utters a relatively high number of syllables per second and
spends relatively little time pausing. As the frequency and/or length of pauses
22
increases, the speech rate will be reduced. Due to the correlation of speech rate
and pausing, Goldman-Eisler includes speech rate in the inventory of pause
phenomena variables. As noted by Griffiths (1991), the literature generally
supports this position. At the same time, speech rate in its own right has been
the subject of numerous studies on native and non-native production of speech
(Blau, 1990; Chaudron, 1988; Derwing, 1990; Flaherty, 1979; Harvey, 1984;
Lehtonen, 1981; Pica, 1988; Wesche & Ready, 1985; Zhou, 1997), and the
unique issues it presents warrant discussion in this chapter.
Speech rate-related variables cited in the literature include articulation rate
(Hieke, 1985; Kormos & Denes, 2004; Mohle, 1984; Raupach, 1980b; van
Gelderen, 1994); mean length of run—defined as the average number of
syllables uttered between pause boundaries (Hieke, 1985; Kormos & Denes,
2004; Mohle, 1984; Raupach, 1980b); mean length of utterance—defined as the
average number of words spoken per utterance (Kemper, Othick, Gerhing,
Gubarchuk, & Billington, 1998; Mohle, 1984); phonation time ratio—defined as
the total time spend speaking divided by the total time spent to produce the
speech sample (Kormos & Denes, 2004; Riggenbach, 1991; Towell, Hawkins et
al., 1996); and speech rate— defined as the average number of words spoken
per second (Derwing, 1990).
An important question related to speech rate and fluency is “what is a
normal or ideal speech rate?” According to Levelt (1989), speech is usually
produced at a rate of two to three words per second (p.22) and Kowal and
O’Connell (1980) refer to a normal rate of 3.50 syllables per second (p.64). But
studies of speech rate in the literature present a more complicated picture. In a
comparative study of Finnish, English, and Swedish speakers speaking their
native languages, Lehtonen (1981) concluded, “there is no single normal speech
rate (p.331)” and argued that acceptable speech rate depends on the context of
the utterance. This argument is supported by research conducted by Grosjean
and Deschamps (1975) and cited in Raupach (1980a) in which the authors found
that the French native speaking rate was significantly lower in elicited cartoon
23
descriptions than in samples from radio interviews. Mohle (1984) arrived at a
similar conclusion comparing the speech rates of French and German L1 and L2
speakers across two different language tasks—cartoon descriptions and
answering questions.
Evidence that speech rate varies across languages is also presented in
the literature. Raupach (1980b), for example, found the speech rate of native
French speakers to be significantly lower than that of German speakers, and
Lehtonen (1981) reported that the articulation rate of Finnish is faster than that of
English due to the “phonological simplicity” of the Finnish syllables (p.329).
Wiese (1984), however, found no significant speech rate differences when
comparing speech samples from native speakers of English and German.
2.3.2. Repair Phenomena
Self-repair is a broad category of speech production phenomena that
includes variables such as repetitions, re-starts, false starts, and cutoffs.
Grosjean (1980) classifies these variables as hesitation phenomena and notes
that although they do not immediately relate to what has traditionally been
understood as temporal variables (e.g., variables related to speech rate and
pausing), they have become a significant component in speech production
research. A rationale for including these variables is presented by Raupach
(1980) who argues that the study of pause distribution in speech should “include
all available hesitation phenomena that work directly on the percentage of pause
time in speech performance” (p.270). And Mohle (1984) argues “such
phenomena occur regularly . . . in foreign and native language production and
are important factors in the study of language-planning processes” (p.44).
Although the use of these variables in language production research may
be helpful overall, their application in fluency research has come with mixed
results. Riggenbach (1991) found that repair phenomena such as retraced
restarts (restarting an utterance by using some of the original utterance),
24
repetitions, insertions, and unretraced restarts (restarting an utterance using
none of the original utterance) were not statistically significant in distinguishing
levels of fluency among non-native speakers of English. Similarly, Kormos and
Denes (2004) did not find these variables, classified by the authors as
disfluencies, to be significantly correlated with level of fluency. They cite
research in Rekart and Dunkel (1992) and van Gelderen (1994) as supportive of
their findings. Olynyk, D'Anglejan et al. (1987) also found that repair-related
variables were not useful in distinguishing between fluency levels. However,
Rehbein (1987) in a qualitative study of three non-native speakers of German,
found that fluent sounding speakers used repair strategies as “a strategic
counterbalance to compensate for deficiencies in fluent production” (p.101).
2.4. Empirical Research on Fluency
An important question in fluency research relates to which temporal
variables most strongly correlate with fluent and / or dysfluent language
production. While Sajavaara and Lehtonen (1978) and Lehtonen (1981) maintain
that the testing of fluent speech—in the broad sense—“is not possible by means
of instrumental method” (p.331), other authors such as Hieke (1985) and
Chambers (1997) have argued for research that incorporates this form of
measurement. Early work by Fillmore (1979) and Cole (1980) represent
preliminary efforts in this regard. Since that time, a number of empirical studies
have provided insight into which temporal variables are most useful for assessing
fluency in second language speech production. A review of these studies and
their results generally support Hieke’s early observation: “speech rate remains
the most significant and practical quantitative measure of oral proficiency since it
is capable of significantly differentiating native from nonnative speech” (p.139).
Lehtonen (1981) compared the articulation rate, speech rate, and pause
ratio among three groups of English speakers: six native English speakers, 14
English L2 students at the intermediate level, and 44 English L2 students at the
25
lowest proficiency level. The author found both pause ratio and speech rate to be
correlated with fluency level when examining the recorded samples of free
speech. Interestingly, the rate of speech of the high level university L2 speakers
surpassed that of the native English speakers—a finding that the author
concludes may be due to the fact that the native speakers were all English
teachers and may have been accustomed to speaking at a slower rate in order
for students to understand them. The author concluded that while speech rate is
a useful way of measuring fluency differences between different levels of
speakers of the same language, it may not be so reliable when comparing
speakers of different languages since speech rate in L2 may be effected by
syllabification patterns of the native language.
Lennon (1984) compared the speech samples of L2 English speakers
retelling a story in English with the speech sample of the “model” native English
story teller. The study found that the L2 speakers spoke at a slower rate than the
model (131 average WPM vs 152 for the native speaker) and with a higher rate
of pausing (44% mean vs 36% mean) with differences also being detected in the
location of the pauses.
Rhode (1985) collected two-minute speech samples from eight Danish
speakers of English and asked a panel of 19 native English speakers to assign a
global fluency rating to each of the samples. Four of the speech samples—one
from each fluency level—were then selected for in-depth analysis at the temporal
variable level. After comparing the temporal variable data with the global fluency
ratings, the author concluded that filled pauses were the best indicator of
disfluency whereas successful false starts—cases in which a sentence broke
down and then was restarted successfully—were the best indicator of
compensatory fluency. An obvious limitation in the study, however, was the
small sample size which made it impossible to determine if the findings were
statistically significant.
Olynyk, D'Anglejan et al. (1987) compared the French L1 and English L2
speech of 10 college students in Quebec, five of whom had been judged as
26
having high fluency in English and five as having low proficiency in English.
Speech samples were comprised of the students’ self-recorded speech in three
different contexts. The five-minute samples from each context were analyzed for
six speech marker variables—uhs, repeats, transitions, repair, conversions, and
cut-offs—and comparisons were made between the native and second language
performance. While the authors found that there was considerable transfer of
speech marker use from the first to the second language, they found no
significant differences between the high and low fluency groups in terms of the
frequency with which the markers were used.
Lennon (1990) examined the oral English performance of four German
students studying abroad in England. At two points in their semester abroad, the
students were asked to complete a language task in which they were shown a
set of six pictures and then asked to tell the story behind the picture sequence.
The recorded sets of responses were then played to a panel of nine native
English speaking judges who were asked to provide global fluency ratings for
each speech sample and to judge if fluency improvement had been made
between the first and second observations. The same pairs of speech samples
were analyzed across 12 temporal variables to determine which of them
correlated with gains made in fluency between the first and second observations.
After comparing the pretest and posttest group means on each measure, Lennon
found that the t values were significant for the variables 1) Pruned Words Per
Minute, 2) Filled Pauses Per T-Unit, and 3) Percent of T-Units Followed by a
Pause, with all four participants demonstrating gains on the first two variables.
Riggenbach (1991) made quantitative comparisons between six speech
samples that had been pre-rated for fluency by a group of trained raters. The
speech samples, consisting of five-minute recorded homework assignments,
were collected and analyzed for variables related to pausing, rate of speech, and
self-repair. The author found that rate of speech and unfilled pauses were the
only two variables that correlated with the raters’ fluency scores. A problem with
the design of this study is that the student participants were from different
27
classes and the assigned dialogue topics were not identical across the
participants. This factor combined with the small sample size probably
contributed to the author’s trouble in finding variables that were of statistical
significance.
Freed (1995) compared the holistic fluency ratings assigned to 15
American L2 speakers of French who had studied abroad for a semester in
France with the ratings assigned to a comparable group of students who had not
studied abroad. The speech samples from four students in each group were
then analyzed at the temporal variable level. Comparisons between the two
groups at the holistic fluency level indicated that the students who had studied
abroad made greater gains in fluency than the students who had remained in the
US. At the temporal variable level, the study found that rate of speech was the
only statistically significant variable that distinguished between the two groups—
the study abroad students uttering more words in the samples at a faster rate.
Towell, Hawkins et al. (1996) examined speech samples from 12 non-
native speakers of French at three different points in their course of study, six
months of which was spent studying abroad in French speaking country. After
analyzing the data across the four variables of speaking rate, phonation time
ratio, articulation rate, and mean length of run, the authors found that mean
length of run (MLR) was the “best indicator of the development of fluency in
performing this particular exercise” (p. 103).
Riazantseva (2001) examined speech samples from 30 Russian speakers
of English who had been separated into intermediate and high proficiency
groups. The two speech samples—a topic narrative and a cartoon description—
were analyzed for pause duration, pause frequency, and pause distribution
(within or outside of constituent boundaries). Results were compared between
the two proficiency groups. The author found that the high proficiency speakers
used shorter and fewer pauses but that the distribution of pauses was not related
to the level of proficiency.
28
Kormos & Denes (2004) also compared data on temporal variables
against fluency ratings given by a panel of judges to understand which underlying
variables affect perception of fluency. Speech samples from 16 Hungarian
speakers of English were analyzed across 10 variables. Five of the variables—
speech rate, phonation time ratio, mean length of run, mean length of pauses,
and number of stressed words per minute—were found to correlate with level of
fluency. Based on their findings, the authors concluded that differences in
fluency scores can be attributed largely to a small group of variables including
intonation features (defined as stressed words per minute) but excluding filled
and unfilled pauses.
While the above studies have employed a wide range of variables, rate of
speech is the measure most frequently cited for its correlation with overall gains
in fluency. The rate and duration of pauses appears to be another important
variable, although it is not clear whether filled pauses, unfilled pauses, or both
should be considered. Meanwhile, mean length of speech run (MLR) is a
variable that has received more recent attention. Although relatively few studies
have employed this measure to date, the available data suggests that it is a
reliable indicator of fluency improvement. Finally, it should be noted that the
majority of the studies were very small in size with only two of the 10 studies
reporting a sample size of 30 or larger. Unfortunately, this factor makes it difficult
to determine with any degree of certainty which variables are the most reliable
and significant indicators of fluency. As discussed earlier, current advances in
technology may help to alleviate this problem by making it easier for researchers
to gather and analyze data on larger groups of participants.
2.5. Theories of Fluency
Much of the theoretical research on fluency is rooted in the discipline of
psycholinguistics. Fluency from a psycholinguistic perspective is viewed as a
function of how linguistic information is stored in the brain and how that
29
information is then processed in human communication. McLaughlin, Rossman,
and McLeod make the connection as they state “the hallmarks of automatic
processing are increased speed and reallocated attention” (p.154). An early and
frequently cited study is Shiffrin and Schneider (1977a) in which participants
were found to perform much better at a letter identification task when they were
able to base their responses on a previous set of learned information. The
researchers proposed that automatic processing is more efficient and less
effortful because it involves certain responses that always become active under
certain inputs. Controlled processing, however, requires more attention and is
less efficient because stimulus nodes in the memory have not yet been
established.
The focus on the cognitive processes that effect fluency development can
be attributed in large part to the work of Levelt (1989) who developed a model for
speech production (see Figure 1.1 in Chapter 1). Although this model was
conceptualized with the native speaker in mind, it has been employed by a
number of researchers to explain second language production (de Bot, 1992;
Payne & Whitney, 2002; Towell, Hawkins et al., 1996). Levelt views language
production as occurring in a series of three modular stages: conceptualization,
formulation, and articulation.
In the conceptualization stage, the speaker first determines the semantic
content of what she or he wants to say and then generates a preverbal message.
At this first stage, there are no lexical items or grammatical structures associated
with the message but only a conceptual outline of what is to be said. The next
stage occurs in the formulator in which semantic and morphophonological
information is applied to the preverbal message and the appropriate lexical items
are selected. All of the linguistic information that the speaker needs for
formulating the message is stored in what Levelt refers to broadly as the lexicon,
an independent module that can be accessed at either the formulation or
comprehension stages of communication.
30
After a phonetic plan has been generated by the formulator, the speaker
can either articulate the message via the articulator or internally scan and
evaluate the message (as internal speech) in his or her speech comprehension
system—conceived by Levelt as yet another independent module. Finally, in the
articulation stage, the articulator takes the phonetic plan generated by the
formulator and puts it into actual speech via activation of the lungs and other
speech organs.
Along with Levelt’s model, a number of other theories have been proposed
to explain the cognitive processes that underlie fluent communication. Schmidt
(1992) reviews seven theories related to fluency that are presented in the
psychological literature. A brief summary of each of these theories is presented
below:
1) Automatic and controlled processing theory (Shiffrin & Schneider, 1977b)
maintains that automatic skills are fast, effortless, and do not require the use of
short-term memory, whereas controlled processing is comparatively slow and
requires effort and introspection on the part of the subject. Fluency under this
theory is viewed as automatic processing—the necessary linguistic knowledge
having become automatized for the speaker;
2) ACT * (pronounced act star) theory (Anderson, 1983) explains skill
development as a process of information going from declarative to procedural
memory. At the declarative stage, the learner can state the rule, but it is not until
the information has become proceduralized that the information becomes
embedded with a specific use of the information;
3) Executive control theory (Bialystok, 1982) explains L2 fluency development as
a process of increased control over linguistic knowledge as implicit knowledge
becomes more explicit over time. A fluent language speaker in this framework is
one who has command over the relevant linguistic information and is able to
manipulate this knowledge in a way that appears effortless;
4) Restructuring theory (Cheng, 1985; McLaughlin, 1990) argues that rather than
information processing become better (or automatic), information retrieval
31
improves when the process is reorganized so as to be more efficient. This theory
might explain improvement in fluency as due to a shift in how the language user
processes the language.
5) Instance theory (Logan, 1988) explains automaticity as a function of memory
retrieval and reaction time. The more instances an item is retrieved from
memory, the quicker the reaction time becomes. Schmidt notes that this theory
supports the work of Pawley and Syder (1983) who view native fluency as a
result of native speakers building up large numbers of memorized word
sequences or lexical sentence stems.
6) Strength theory (MacKay, 1982) views automaticity as taking place when
connections between stimulus and response are strengthened. Although
strength model studies have been limited to investigations of syntactic accuracy,
it is presumed that in regard to fluency, strengthening would take place, bottom-
up, through the practice of language tasks. As Schmidt notes, this theory has
some resemblance to the audiolingual approach which claimed that language
tasks had to be learned and practiced in a specific order— beginning with those
at a lower level and movie to higher levels.
7) Chunking theory (Newell, 1990; Servan-Schreiber & Anderson, 1990) claims
that information is learned in chunks and that language creativity is largely based
on new uses or configurations of already learned chunks. This theory closely
relates to the ideas proposed by Pawley and Syder (1983) and others regarding
the function of lexical sentence stems.
While all of these theories are relevant to second language fluency, three
of them—Shiffrin and Schneider’s theory of automatic and controlled processing,
Anderson’s ACT* theory, and chunking theory—along with Levelt’s model of
speech production have received the widest attention in second language
research. Scholars have invoked various combinations of these theories to
explain fluency at both the both the broad and narrow level.
McLaughlin (1980) makes a case for applying human processing theory in
language research, arguing that the theory is more useful than Krashen’s Monitor
32
Model since it is “based on behavioral acts, not on inner states of consciousness”
(p.294). McLaughlin et al (1983) subsequently apply the theory of automatic
processing to explain why second language learners may have difficulty carrying
on a conversation in the second language even when they know all of the words
and grammatical structures to complete the task. The authors argue such
individuals “cannot handle at one time the two competing demands of
maintaining the flow of conversation and speaking accurately in a formal sense”
(p.146). However, when the information has become automatic for the learner,
the burden of carrying out such a task is greatly reduced and hence the speech
becomes more fluent.
Towell (1987) applies both the ACT* theory and the controlled vs
automatic processing theory to explain how advanced language learners process
language. The author examines longitudinal data consisting of transcribed
speech samples from language learners at consecutive years in their language
study program. Towel uses four temporal variables (speaking rate, phonation
time ratio, mean length of utterance, and articulation rate) as evidence that the
learner’s knowledge of language structures moves from declarative to
procedural, and that the processing (e.g. production) of language moves from
controlled to automatic. Perhaps the most important point that Towell makes is
that competence (including both declarative and proceduralized knowledge) and
performance (including both controlled and automatic processes) are interrelated
concepts, and both must be considered when examining how second language
learners develop fluency.
Another approach to fluency that has gained widespread attention in
research is chunking theory. This theory focuses on lexical units that have been
referred to as lexical sentence stems, prefabricated phrases, lexical chunks,
lexical phrases, and formulaic language. In a formative and frequently cited work
on the subject, Pawley and Syder (1983) define a lexicalized sentence stem as
“a unit of clause length or longer whose grammatical form and lexical content is
wholly or largely fixed” (p.191). They argue that native speakers have a
33
memorized repertoire of thousands of sentence stems and that use of these
stems is a central facet of fluent sounding speech: “Indeed, we believe that
memorized sentences and phrases are the normal building blocks of fluent
spoken discourse, and at the same time, that they provide building blocks of
fluent spoken discourse” (p.208). The authors also present the case for a
speech strategy referred to as “chaining style” in which fluent sounding speakers
string together multiple sentence stems in an almost automatic fashion. Schmitt
(2000) summarizes the psycholinguistic connection between lexical stems and
fluency:
The mind makes use of a relatively abundant resource (long-term
memory) to compensate for a relative lack in another (processing
capacity) by storing a number of frequently needed lexical chunks as
whole units. These can be easily retrieved and used without the need to
compose them on-line through word selection and grammatical
sequencing. This means there is less demand on cognitive capacity,
because the lexical chunks are ‘ready to go’, and require little or no
additional processing. (p. 400)
Elements of chunking theory are employed by Rehbein (1987) to explain data
from a qualitative study that compared speech samples from native and non-
native speakers of German and Turkish. An analysis of these samples indicated
that the native speakers used formulaic language to their advantage—creating
an overall impression of fluency. Yet Rehbein also makes the important point
that speech formulae can hinder fluency if the speaker utters runs of unbroken
speech without giving attention to what segments sound natural together.
In summary, human information processing theories are useful in
understanding fluency phenomena at both the broad level of overall proficiency
and the narrow level of specific temporal variables. At the broad level, an L2
learner’s development of fluency can be explained as the reallocation of attention
from the correct use of grammatical rules to a focus on content and meaning.
This framework also explains why highly proficient language speakers perform
34
exponentially better on oral exams: Because the underlying knowledge of
language rules has become automatic for these individuals, they are able to
devote considerable more attention to hallmark features of a native speech
performance in their presentations. For example, interesting asides, idiomatic
expressions, humor, and clever self-corrections are all possible when less
attention is needed to accomplish the basic language requirements of the task.
At the focused level, a theory of automatic processing also helps to
explain the temporal features of fluency discussed earlier. Since controlled
processing requires more attention, it follows that a language learner with lower
proficiency will need to speak at a slower rate with longer and more frequent
pauses than a learner with higher proficiency for whom language rules have
become proceduralized. The link between impressionistic variables, such as
effort and smoothness, and temporal variables is also realized under this theory.
Because, by definition, automatic processes require less attentional effort and
controlled processes require more, it follows that the oral delivery of a low-
proficiency L2 speaker will seem relatively effortful and that the delivery of a
language learner with higher proficiency will seem relatively effortless. Slow
speaking rate, pauses, and short run of speech may all be viewed as overt
signals of an underlying process indicating either automatic or controlled
information processing.
2.6. Teaching Fluency
The question of how fluency can be facilitated in the L2 classroom is a
perennial question with numerous articles and books having been published on
the subject. Much of the discussion has approached fluency through the
communicative competence paradigm—viewing fluency as an overall ability to
communicate in the target language. For example, Brumfit (1984) describes
fluency instruction as that which focuses on communicating a message rather
than producing accurate linguistic forms. He states: “language work focused
35
predominantly on language is always accuracy work, however ‘fluently’ it may be
performed, whereas language work which entails using the target language as if
it is a mother tongue is always fluency work” (p.53). And in another work on
communicative language teaching, Brumfit (1979) argues more forcibly for
fluency (vs accuracy) instruction by stating “language teaching needs to
concentrate far more on the concept of ‘fluency’ in order to restore a genuine
educational perspective to its aims” (p.189). As noted by Richards and Rodgers
(1986) this distinction between fluency and accuracy is an important principle of
communicative language teaching—as are the distinctions between meaning /
form and use / usage.
While Berns (1990) and others emphasize that communicative language
teaching is a general approach involving many possible methods, fluency
instruction within a communicative teaching framework often involves task-based
learning methods. Richards (2002) plainly states, “A core component of fluency-
based pedagogy is task work” (p.36). And in an early work, Johnson (1979) goes
so far as to argue that “fluency in communicative process can only develop within
a ‘task-oriented teaching’—one which provides ‘actual meaning’ by focusing on
tasks to be mediated through language. . .” (p.200).
In recent years, much has been written on the usefulness of task-based
teaching methods for improving both fluency and accuracy (Ellis, 2003; Skehan,
1996; Skehan & Foster, 1997; Ur, 1981) While there are many methodologies
within the task-based approach, the underlying assumption is that fluency and
accuracy are best developed through meaning-focused (vs form-focused)
communication tasks. This assumption, however, is challenged by Swan (2005)
who devotes an entire book to refuting the task-based approach and emphasizes
that there is little empirical evidence to support it.
Alternatives to task-based fluency teaching can be found within the human
information processing framework. Unlike those in the communicative teaching
paradigm, these methods tend to be form-focused in nature with an emphasis on
specific language features (e.g. rate of speech, pausing, vocabulary) and
36
behavioral learning strategies (e.g. repetitions and drills). Because fluency in this
discipline is understood in terms of measurable, temporal variables, it is not
surprising that much of the research on the subject of teaching fluency is rooted
in experimental studies that examine the effectiveness of one or more
approaches.
Nation (1989) examined the use of the 4/3/2 technique—one that involves
giving a presentation repeatedly at succeeding shorter timer intervals—with a
group of six advanced level language learners to determine whether the
technique is helping for improving speaking fluency. Fluency in the study was
measured in a focused manner by rate of speech (words per minute), false
starts, filled pauses, and repeated words and in the broader sense by examining
accuracy and control of content. The study found that in seven of the eight
cases, the rate of speech increased between the first and third presentation, and
the number of false starts, filled pauses, and repeated words decreased for all of
the cases. More modest improvements were noted in the areas of accuracy and
content. In similar veins, Brown (2000) cites research indicating the usefulness
of repetition and recycling of activities, Foster and Skehan (1997) cite the
usefulness of pre-task planning, and Temple (1994) points to the potential of
mimicking activities for contributing to fluency development in L2 learners.
Yet another approach to fluency instruction is the lexical approach
(Baigent, 1999; House, 1996; Nattinger & DeCarrico, 1992; Willis, 1990;
Woolard, Summer 2004). Rooted in the theory of lexical chunking, this approach
is largely attributed to Lewis (1993; 1997a; 1997b; 2000), and is based on two
frequently quoted principles from an early work: “language consists of
grammaticalized lexis, not lexicalised grammar” and “grammar as structure is
subordinate to lexis” (Lewis, 1993, p.89). In the classroom, these ideas are
implemented in methods such as looking for lexical groups in reading passages,
brainstorming for collocates of key words, guessing the meanings of words from
context, and using concordancers to search for (and memorize) collocations that
occur in natural speech.
37
Harwood (2002) discusses several limitations of the lexical approach.
These include the difficulty of sifting through corpora data to find the appropriate
items to use in the class; the challenge of adapting naturalistic data for use in the
classroom; and the potential of overwhelming students with too much lexical
information. Harwood cites Thornbury (1998) in claiming that the lexical
approach is still a work in progress and due to practical limitations has yet to be
widely adapted in the classroom. This, along with the fact that there have been
no empirical studies to date on the effect of the lexical approach on fluency
development, makes the impact of the approach seem limited at best.
2.7. Computer Assisted Language Learning and Fluency
The focus of the current study is the potential of text-based Internet chats
for improving the oral fluency of second language learners, and thus a review of
the related body of literature on CALL (computer assisted language learning) is
warranted in this chapter. While the research that has been conducted on CALL
is too vast for even a cursory review, the following section will outline the main
areas that have been addressed in the literature and then provide a more
comprehensive review of the research that has been conducted specifically on
fluency.
The proliferation of computers in second language teaching is evidenced
by the hundreds of ESL software programs available in any given ESL catalogue
that claim to help learners improve their English at nearly every skill level. Even
pronunciation which has traditionally been viewed as one of the least computer-
friendly areas is now being addressed, thanks to the improvement of voice
recognition technology and increasingly sophisticated programs that enable
computers to make attempts at artificial intelligence. ESL websites are another
facet of the recent advances in CALL. A visit to Dave’s ESL Café—a
clearinghouse for dozens of ESL websites—reveals the profusion of on-line
materials that is now available to ESL/EFL learners. Like the software programs,
38
many of these websites offer support in a range of language learning skills with
grammar and listening websites being the most prevalent.
As off-line and on-line computer support continues to develop, there is a
growing body of research that discusses the potential value and possible
applications of these modes of learning. For example, research has addressed
the way in which computer technology can raise the status of the ESL learner in
the learning process (Markley, 1998; Sullivan, 1998; Warschauer, Turbee, &
Roberts, 1996); the nature of discourse in the computer mediated ESL classroom
(Bloch, 2002; Darhower, 2002; Kelm, 1992; Sotillo, 2000); the potential of
computer applications in a distance education environment (Opp-Beckman,
2002; Swaffar, Romano, Markley, & Arens, 1998; Wat-Aksorn, 2000; Ypsilandis,
2002); learner interaction with CALL software (Giardini & Vergaro, 1998;
Hamilton, 1998; Hegelheimer & Tower, 2004); benefits of E-mail (Holliday, 1997;
Stockwell & Harrington, 2003); and various applications of computer and web
technology in the ESL classroom (Allodi, Dokter, & Kuipers, 1997; Bush & Terry,
1997; Dudeney, 2000; Gitsaki & Taylor, 1999; Goodfellow & Lamy, 1998;
Reynard, 2003; Vitanova, 2000; Warschauer & Whittake, 1997).
While the research sheds light on the utility of computer technology in the
ESL classroom, most studies stop short of evaluating the effectiveness of these
tools in terms of learner outcomes. Although scholars and practitioners agree
that computer technology adds a certain je ne sais quoi to the language
classroom, few understand exactly what that special element is and whether or
not it adds anything to the process of second language acquisition. In the field of
distance education, the “no difference” finding has been so frequently reported in
side-by-side outcome studies that educators frequently publicize the claim that
on-line study is an equivalent alternative to face-to-face classes. But such
findings are not so assuring within the broader context of CALL. Since CALL in
many cases is not a substitute but rather an add-on to traditional modes of
learning, one should question the wisdom of pouring vast sums of money into
39
these resources if, in fact, these technologies do not lead to some measurable
difference in learner performance.
One area that has received very little attention is the usefulness of text-
based Internet chats for improving ESL proficiency; this in spite of the fact that
most ESL distance learning websites now contain an on-line chat component that
students are encouraged to use. In a typical text-based chat room, participants
communicate with each other in real time by typing messages on their personal
computers. As soon as a message has been typed and “sent,” it is instantly
displayed on the computer monitors of all of the other participants in the group.
In such a format, communication takes place simultaneously with multiple
members composing, reading, and replying to messages at the same time. In
many cases, these chat rooms are informal and even unstructured with the
members being allowed to enter, exit, and choose topics at will. While some chat
discussions are lead by an instructor who plays the role of facilitator and gives
feedback on various questions, it is more common for ESL chat rooms to be run
by the students themselves in a type of “English hour” format.
While it could be argued that the main purpose of these chats is not to
develop second language proficiency but rather to create a sense of community
between learners and instructors, it should not be overlooked that these chats
are often the only form of real communication that takes place in the on-line
classroom. Wang and Sun (2001) maintain that real-time Internet technology
“brings the distance learner into the real world” and represents “a new era in
history of distance education” (p.555). Hence, it would make sense to investigate
the measurable benefits that come from this technology and whether there are
any similarities between on-line communication and the communication that
takes place in the traditional face-to-face language classroom.
Several studies have compared the classroom participation of ESL
students in on-line and face-to face environments. Warschauer (1997) found that
there was more equality of participation between high and low proficiency
learners in an on-line ESL course and that the language used was grammatically
40
more complex that that in the off-line course. Students in the on-line course also
indicated greater overall satisfaction with the electronic discussion (e.g. Internet
chat) environment—a greater percentage indicating that they could express
themselves freely and a smaller percentage indicating that they felt stressed
when participating. In another study, Banitz and Hendrickx (2003) investigated
turn-taking behavior and the use of back channels (e.g. okay, yeah, uhuh) to
compare Internet chat and face-to-face conversations of three participants.
The authors found that the two environments were overall very similar
across measures and concluded that “Internet chats might actually represent an
alternative to teaching a long distance EFL speaking class” (p.193). In a similar
vein, Chun (1998) examined the on-line chat transcripts of German language
students (n=14) over the period of one year. The author explored features such
as number and length of turns, grammatical complexity, and the number and
types of different discourse structures represented in the transcripts. Chun found
that the student interactions were substantial both in quality and quantity and
were similar across most measures to what had been observed in face-to-face
classrooms. One exception is that student discussions in the on-line learning
environments were less teacher-centered and more student-initiated than
discussions in face-to-face language classrooms.
Chenoweth and Murday (2003) compared the language improvement of
French L2 students in an on-line (Internet chat) course (n=8) with a comparable
group of students in a face-to-face course (n=12). Measures were collected in
oral and written production along with listening and reading comprehension and
grammar. The authors found that were no statistical differences in language
gains on any of the measures with the exception of the writing measure on which
the on-line students made greater gains than the off-line students.
Payne and Whitney (2002) compared the oral proficiency development of
ESL students in two experimental on-line groups (n=13; n=11) with that of two
comparable groups in a traditional face-to-face class (n=17; n=17). Students in
the experimental group spent half of the course hours interacting in a text-based
41
Internet chat room (six students per room) and the other half in the traditional
classroom setting. Speaking proficiency in this study was measured by a holistic
test in which participants were asked to give a five-minute response to a written
prompt. The recorded response was then judged by a panel of trained raters. At
the end of the study, the pretest to posttest gain scores were averaged and
compared across groups. The authors found that students in the on-line group
made significantly higher gains in oral proficiency than the students in the face-
to-face group (p<.05) with the on-line group having an average gain score of 9.82
points and the face-to-face group having an average gain score of 11.76 points.
These results were attributed to the higher amount of participation in the chat
rooms and the fact that most of the students subvocalized the written language
that they produced in the rooms. The study also relied heavily on Levelt’s theory
of language processing:
Based on Levelt’s model of language production, synchronous online
conferencing in a second language should develop the same cognitive
mechanisms that are needed to produce the target language in face-to-f
ace L2 conversation. In fact, the only difference from an information
processing perspective should be engaging the musculature to produce
overt speech. (p.15)
2.8. Summary
A review of the literature reveals two main approaches to fluency—the
broad approach and the focused approach— with the focused approach being
most widely used in psycholinguistic research. This is due to the fact that the
temporal measures associated with the focused approach lend themselves to
empirical studies. While a host of temporal-related variables have been
employed to measure fluency, speech rate (e.g. words or syllables per minute)
and the related variable of mean length of run (MLR) have been most prevalently
used in recent fluency studies. At the same time, the theory of controlled vs
42
automatic processing and Levelt’s theory of language processing have
dominated much of the discussion and seem to work well for explaining observed
fluency development in second language learners.
Much of the discussion of teaching fluency has come from within the
discipline of communicative language teaching. This is due to the fact that 1) the
communicative approach has been the dominant L2 pedagogical model for the
past three decades, and 2) the communicative model lends itself to activities that
engender observed fluency. Other approaches to teaching fluency such as
repetition or drill-oriented activities have received less attention, although these
activities lend themselves to empirical assessment and tend to receive wider
support within psycholinguistic research. The lexical approach to fluency
teaching has also gained popularity in the last 10 years and is also closely
related to psycholinguistic theory on chunking and working memory. But
empirical research on the effectiveness of the lexical approach is almost non-
existent—most likely because of the logistical and pedagogical challenges of
designing such a study.
Finally, the area of computer assisted language teaching has become a
very popular topic of research over the past 10 years with entire journals being
devoted to the subject. The research has explored numerous applications of
CALL and has established that CALL environments have an observable and
positive impact on learner-subject and learner-learner interaction. Only a few
studies, however, have focused on the usefulness of CALL for facilitating oral
English proficiency, and to this author’s knowledge, no studies to date have
examined the usefulness of synchronous chats for improving oral fluency as
measured by temporal variables—this in spite of the fact that nearly all on-line
ESL courses make use of a text-based chat component.
With the above in mind, the current study contributes to the existing
research on fluency and CALL by 1) examining the potential of text-based
Internet chats for improving oral fluency; 2) further exploring the usefulness of
Levelt’s model of language production and the theory of automatic processing for

43
explaining fluency development in the classroom setting; and 3) building on
previous studies that have used temporal variables for measuring second
language fluency.
44
CHAPTER 3. METHODOLOGY
3.1. Overview of the Experimental Design
An overview of the experimental design is presented in Figure 3.1. The
study examined the fluency gain scores of ESL participants who were randomly
assigned to one of three different instructional environments: a text-based
Internet chat environment, a face-to-face environment, and a control environment
in which the students completed on-line activities but did not interact with either
the instructor or the students. Each group participated in 12 class sessions over
a period of six weeks. A fluency pretest was administered a week before
instruction began, and a fluency posttest was administered a week after
instruction ended. Gain scores were calculated by subtracting pre scores from
post scores. Upon completion of the posttest, participants were asked to respond
to an exit survey that focused on their perceptions of the instructional
environment.
3.2. Recruitment and Screening of Participants
Forty-eight participants were recruited for the study and a total of 34
participants completed all stages of the study from beginning to end.
Recruitment methods included 1) posting fliers (Appendix A) around two
apartment complexes –each with a large number of international residents; 2)
distributing fliers (via instructors) to students taking English classes in the Purdue
Village ESL school; 3) distributing fliers (via instructors) to students in the Purdue
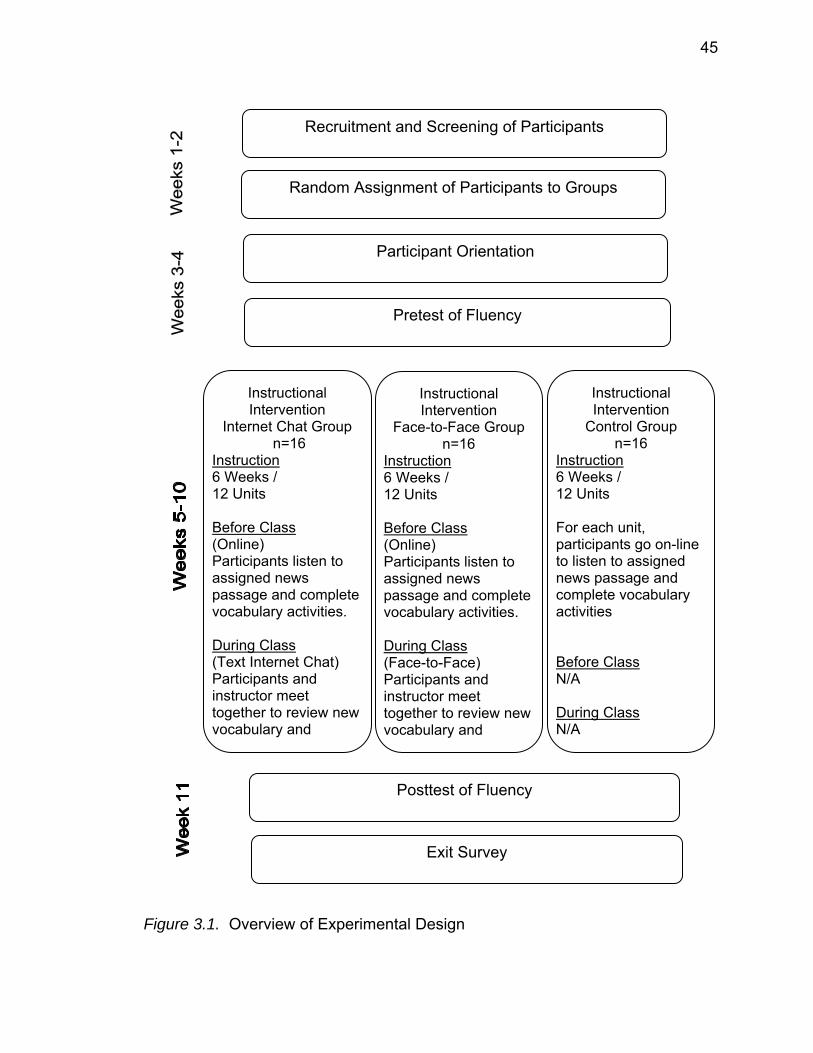
45
Figure 3.1. Overview of Experimental Design
Recruitment and Screening of Participants
Random Assignment of Participants to Groups
Participant Orientation
Pretest of Fluency
Instructional Intervention
Internet Chat Group n=16
Instruction 6 Weeks / 12 Units
Before Class (Online) Participants listen to assigned news passage and complete vocabulary activities. During Class (Text Internet Chat) Participants and instructor meet together to review new vocabulary and
Instructional Intervention
Face-to-Face Group n=16
Instruction 6 Weeks / 12 Units Before Class (Online) Participants listen to assigned news passage and complete vocabulary activities. During Class (Face-to-Face) Participants and instructor meet together to review new vocabulary and
Instructional Intervention
Control Group n=16
Instruction 6 Weeks / 12 Units For each unit, participants go on-line to listen to assigned news passage and complete vocabulary activities Before Class N/A During Class N/A
Posttest of Fluency
Exit Survey
46
Oral English Proficiency Program; 4) posting a message on Purdue For Sale—
an electronic message board that advertises goods and services to the
Purdue community; 4) sending an e-mail announcement to students enrolled in
an ESL course that is offered in the Department of Electrical and Computer
Engineering; and 6) making an announcement at a local community event
attended by a large group of international residents. As an incentive, along with
the six free weeks of language instruction, participants received written feedback
on their English proficiency and a signed certificate upon completion of the
course.
Nearly 200 individuals responded either by telephone or e-mail to the
announcements. The researcher replied to volunteers by conducting a follow-up
/ screening interview over the phone (see Appendix B). During the interview, the
researcher gathered information related to the volunteer’s background (age,
home country, and student status), proficiency in English, familiarity with using
computers, and availability for taking the class during the scheduled dates.
Volunteers who were not available during the designated dates or who had no
prior computer experience were exempted from the study.
To reduce the potential affect that the variable of English proficiency level
would have on gains in fluency, the researcher conducted an informal screening
of English proficiency during the phone interview by comparing the volunteer’s
speaking ability against the holistic rating scale used for the TSE.
Only those volunteers who were judged to be at an intermediate level of English
(e.g. a 3 or 4 on the TSE scale) were considered eligible for the study. English
performance at this level is characterized as understandable and sufficient to
complete a task yet with hesitations and non-native features that either
occasionally or consistently require effort on the part of the listener.
After 48 volunteers were interviewed and selected, the researcher stopped
the initial follow-up / screening process and randomly assigned each of the
eligible volunteers to one of the three instructional groups. This process involved
assigning a number (1-48) to each of the volunteers and using a random number
47
table to select volunteers into groups. For example, the first volunteer with a
matching number was assigned to the Control group, the second to the Face-to-
Face group, the third to the Internet Chat group, the fourth to the Control group
and so on until each participant had been assigned to one of the three groups. In
two cases when a volunteer dropped out of the study prior to the start of the
course, the researcher went back to the volunteer list and proceeded to conduct
interviews until an eligible replacement was found. Dropouts were not replaced
after course instruction began in order to prevent the introduction of an
extraneous variable—length of participation.
3.3. Demographic Information Related to Participants
Because 14 participants dropped out after the course began, the total
number of participants in the study was reduced to 34. Table 3.1 presents the
total number of participants in each group and summarizes their demographic
information.

48
Table 3.1
Demographic Information on Participants in Each Experimental Group
Group Sex Native
Language Region Student /
Spouse
Control N=10
Female: 8 Male: 2
Chinese: 6 German: 1 Japanese: 1 Polish: 1 Turkish: 1
Asia: 7 Europe: 2 Middle East: 1
Student: 4 Spouse: 6
Face-to-Face N= 14
Female: 10 Male 4:
Chinese: 8 Korean: 4 Arabic: 1 Polish: 1
Asia: 12 Europe: 1 Middle East: 1
Student: 5 Spouse: 9
Internet Chat N=10
Female: 8 Male: 2
Chinese: 6 Korean: 1 Spanish: 1 Japanese: 2
Asia: 9 Latin America: 1
Student: 4 Spouse: 6
As indicated in Table 3.1, the Control Group and Internet Chat group each
had 10 participants while the Face-to-Face Group had 14 participants. The three
groups had roughly the same ratio of female to male students with the Control
and Internet Chat groups each having 20 percent male and 80 percent female
students and the Face-to-Face group having 29 percent male and 71 percent
female students. The majority of participants in each group was from Asia and
spoke Mandarin Chinese as a native language. The Control group had the
widest representation of countries and languages with participants from Asia,
Europe, and the Middle East. The Internet Chat group was the most
homogeneous in this respect with nine participants from Asia and one student
from Latin America. In terms of the student status of the participants, the three
groups were comparable. Four of the 10 participants in both the Control and
Internet Chat groups were enrolled in some form of coursework while five of the
14 participants in the Face-to-Face group were enrolled in coursework. The
49
remaining participants in each group were married to Purdue students but were
not enrolled in classes themselves—hence the label of spouse in the table.
3.4. Orientation
After randomly assigning volunteers to groups, the researcher sent a
course information packet to the prospective participants by e-mail attachment.
(Appendix C - E). This packet contained 1) specific information about the course
to which the volunteer had been assigned; 2) instructions on how to access the
course materials on-line; and 3) a form on which the volunteer was asked to
indicate preferred times for taking the pretest and the class. When a volunteer
encountered difficulty in accessing the course materials on-line, the researcher
worked with him or her— either by phone or e-mail— to resolve the problem.
Nearly all of the problems and questions pertained to the software requirements
of WebCT Vista and difficulties in downloading or enabling this software. After
the course began, several participants encountered additional problems in
accessing the chat room. These problems were again found to be related to the
software requirements of the WebCT Vista platform and adjustments that needed
to be made on the participants’ web browsers. The researcher worked with
these participants on a case-by-case basis and the problems were resolved.
3.5. Pretest and Posttest
The same procedures were followed for the pretest and posttest with the
exception of administering a consent form at the pretest session and an exit
survey at the posttest session. The technology, schedule, and procedure for the
tests are described below:
Technology: Both the pretest and posttest were administered on PCs in a
reserved computer lab in Purdue Village. Each participant was given a headset
with a built-in microphone for making the recording. Test responses were
50
collected as digital sound files using Microsoft Sound Recorder—a software
program that is part of the Microsoft Windows package. Recording times were
automatically limited to the 60 second default which is built into the recording
software. At the end of the test session, the researcher saved the speech data in
a designated folder in the researcher’s home directory.
Schedule: Test sessions were scheduled at half-hour intervals. This
allowed time for seating participants, administering consent forms, reviewing
instructions, and answering questions related to the test prompt. The researcher
had prepared for up to four participants to take the tests simultaneously. But as it
worked out, no more than three participants were ever in the room at the same
time, and since they arrived at different times, it was possible to work with each
participant individually.
Procedure: After seating the participant and allowing time for him or her to
read and sign the consent from, the researcher explained the purpose of the test
and gave general instructions for taking it. To prevent the participant from giving
a rehearsed response, the researcher asked that he or she refrain from writing
notes and emphasized that a response should be recorded as soon as the test
prompt was understood. The researcher then gave a demonstration of the test
procedures including how to speak into the microphone and which button to click
to start recording a response. After answering questions, the researcher gave
the participant a paper version of the test prompt (Appendix F & G) with the
reminder that he or she should click on the record button and give a one-minute
response when ready. After the participant had recorded a response, the
researcher 1) checked to make sure that the recording had worked; 2) saved the
response as a wave file; and 3) dismissed the participant—thanking him or her
for coming to the test.
51
3.6. Instructional Intervention
The study was comprised of three instructional groups—each with a
different type of interaction. Participants in the Face-to-Face group met with the
instructor in a traditional classroom and used oral English to communicate with
each other; participants in the Internet Chat group met together with the
instructor in a WebCt Vista chat room and used typed messages to communicate
with each other in real time; participants in the Control group did not interact with
each other during the course but instead completed the required coursework
independently.
The same curriculum was used for all three groups in the 12-unit, 6-week
course. For each unit, participants first logged onto the course’s WebCT Vista
website and listened to a news passage that had been selected from the
Learning Resources website (HTTP://LITERACYNET.ORG/CNNSF/).
Participants were then directed to review a list of new vocabulary items and
complete a listening activity and vocabulary activity that accompanied the news
passage. The vocabulary words were either taken directly from the news
passage or were related to the topic. All of the vocabulary words were
characterized as being 1) idiomatic, 2) common in everyday speech, and 3) the
type of words whose meaning and usage would be difficult to grasp from a
dictionary.
For the Control group, the unit instruction stopped here. For the Face-to-
Face group and the Internet Chat group, the web instruction was followed by a
class session in which the participants met together (either face to face or in a
chat room) to review the new vocabulary and discuss the content of the news
passage. The same instructor taught both groups of participants for the six-week
period. The method of instruction for the Internet Chat group and Face-to-Face
group is described below.
52
3.7. Instructional Method: Internet Chat group and Face-to-Face Group
The Internet Chat group met in a synchronous, text-based, Internet chat
room that was accessed through the WebCT Vista course website. One section
met on Monday and Friday afternoons from 2:00pm - 3:00pm and the other
section met on Tuesday and Thursday evenings from 9:00pm - 10:00pm. The
Face-to-Face Group met in a classroom in the Purdue Village ESOL center. One
section met on Monday and Friday afternoons from 4:00 - 5:00pm and the other
section met on Tuesday and Thursday evenings from 7:00pm – 8:00pm. All 12
class sessions for both instructional groups followed the format below.
Warm-Up: During the first 10 minutes, the instructor welcomed
participants as they arrived and encouraged participation by asking questions like
“How was your weekend?,” “What did you do today?,” Have you had dinner
yet?,” etc. These types of informal questions proved to be useful in generating
follow-up questions from other members of the class who had already arrived for
the class. In both the Internet Chat group classes and the Face-to-Face group
classes, the initial warm-up discussions became longer and livelier over the six
weeks as participants became more familiar with each other.
Vocabulary Review: In the second part of the class, students reviewed
the new vocabulary words and expressions for the unit. In the Internet Chat
group class, these words and expressions, along with their definitions, were
displayed in the chat room window using the whiteboard tool that is part of
WebCT vista. In the Face-to-Face group class, the instructor wrote this
information on a dry erase board. To help participants gain experience in using
the words, the instructor asked participants to take turns using these words in
sentences. The Internet Chat group participants typed their sample sentences
simultaneously while the Face-to-Face group participants took turns giving their
sentences. In both cases, after participants gave their sample sentences, the
instructor made comments and corrections where necessary.
53
Discussion: The third part of each class session consisted of an open
discussion on the news passage topic. The discussion typically began with the
instructor raising a question, but in some cases, the first question was posited by
one of the participants. To prevent a series of yes / no responses, the instructor
posited open ended questions that elicited more discourse. The Internet Chat
group participants were encouraged to contribute their ideas spontaneously
without concern for taking turns. This format allowed participants to continuously
contribute to the chat room discussion but also required that they make
connections between the disjointed comments flowing onto the screen. The
Face-to-Face group classes followed a traditional format with participants taking
turns to share their ideas. With both groups, the instructor made a point to call
on the quieter members of the class when it seemed that only one or two
participants were dominating the discussion.
Conclusion: The final part of each class consisted of a short wrap-up time
during which the instructor thanked the participants for coming, reminded them
about the topic for the next class, and said goodbye. Participants in the Internet
Chat group classes often lingered in the chat room for up to 30 minutes after
being dismissed, while participants in the Face-to-Face group classes left the
classroom with the instructor as soon as it finished.
3.8. Fluency Measures
Five temporal measures of fluency were employed in this study. These
measures were collected for the both the pretest and posttest samples of
speech. Improvement of fluency on each measure was determined by
subtracting the pretest score from the posttest score, the resulting value being
the fluency gain score for that measure. In cases in which the posttest score for
a measure was lower than the pretest score, the gain score was reported as a
negative value.
54
1) Speaking Rate (SR) – Reported as syllables per second. Calculated by
dividing the total number of syllables produced in the speech sample by the total
length of time—in seconds— required to produce the speech sample (including
pause time).
2) Phonation / time ratio (PTR) – Reported as a decimal percentage.
Calculated by dividing the total number of syllables produced in the speech
sample (not including filled pause syllables) by the total time, in seconds,
required to produce the speech sample (including pause time).
3) Articulation rate (AR) – Reported as syllables per second. Calculated by
dividing the total number of syllables produced in the speech sample by the
amount of time—in seconds—required to produce those syllables (excluding
pause time).
4) Mean Length of Run (MLR) – Reported as a decimal number. Calculated
by dividing the total number of syllables produced in the speech sample
(excluding filled pauses) by the total number of runs produced in the speech
sample. Note: A run is defined as a speech segment occurring between pauses
of .25 seconds or greater.
5) Average Length of Pauses (ALP) – Reported as a decimal number.
Calculated by dividing the total length of pause time (both silent and filled) by the
total number of pauses.
3.9. Speech Sample Analysis
The pretest and posttest speech samples were analyzed for fluency using
PRAAT—a speech analysis software program that converts sound files into a
three dimensional spectrogram and allows the researcher to transcribe and
analyze very small segments of recorded speech. (Samples of the PRAAT
editing windows are presented in Figure 3.2 and 3.3.) In the present study, the
PRAAT software was especially useful for determining the specific time counter
location of the onset and coda of the filled and unfilled pauses. After locating the
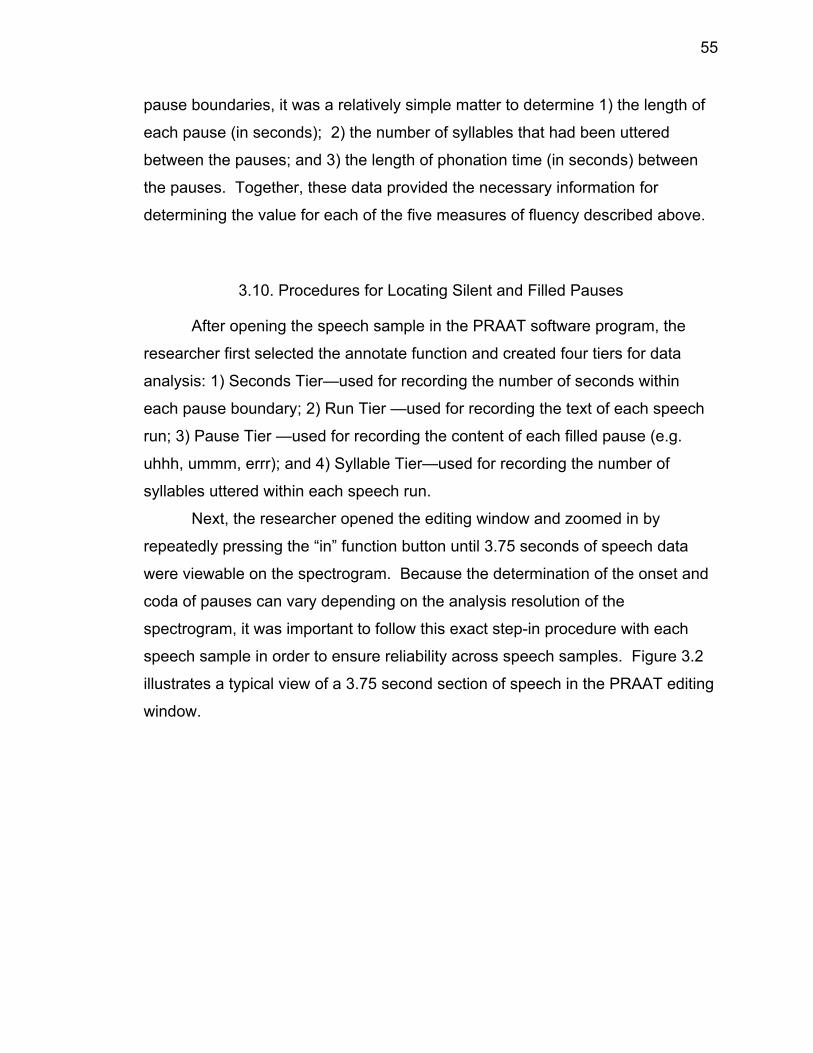
55
pause boundaries, it was a relatively simple matter to determine 1) the length of
each pause (in seconds); 2) the number of syllables that had been uttered
between the pauses; and 3) the length of phonation time (in seconds) between
the pauses. Together, these data provided the necessary information for
determining the value for each of the five measures of fluency described above.
3.10. Procedures for Locating Silent and Filled Pauses
After opening the speech sample in the PRAAT software program, the
researcher first selected the annotate function and created four tiers for data
analysis: 1) Seconds Tier—used for recording the number of seconds within
each pause boundary; 2) Run Tier —used for recording the text of each speech
run; 3) Pause Tier —used for recording the content of each filled pause (e.g.
uhhh, ummm, errr); and 4) Syllable Tier—used for recording the number of
syllables uttered within each speech run.
Next, the researcher opened the editing window and zoomed in by
repeatedly pressing the “in” function button until 3.75 seconds of speech data
were viewable on the spectrogram. Because the determination of the onset and
coda of pauses can vary depending on the analysis resolution of the
spectrogram, it was important to follow this exact step-in procedure with each
speech sample in order to ensure reliability across speech samples. Figure 3.2
illustrates a typical view of a 3.75 second section of speech in the PRAAT editing
window.
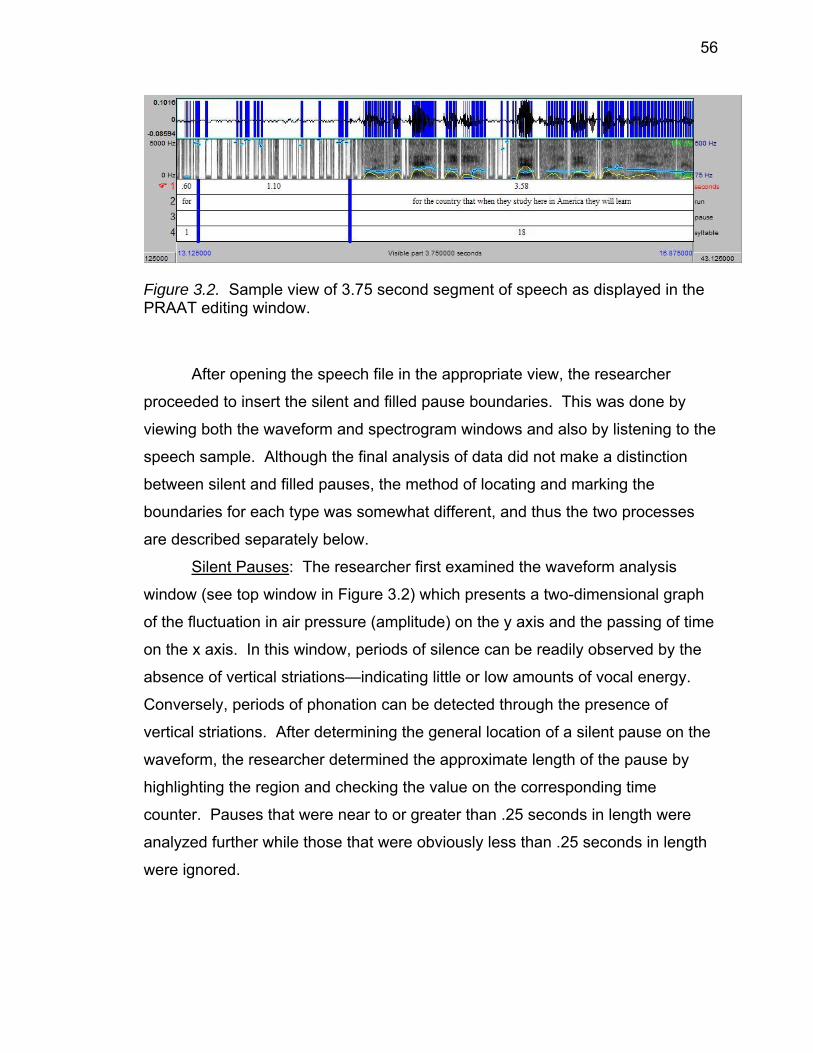
56
Figure 3.2. Sample view of 3.75 second segment of speech as displayed in the PRAAT editing window.
After opening the speech file in the appropriate view, the researcher
proceeded to insert the silent and filled pause boundaries. This was done by
viewing both the waveform and spectrogram windows and also by listening to the
speech sample. Although the final analysis of data did not make a distinction
between silent and filled pauses, the method of locating and marking the
boundaries for each type was somewhat different, and thus the two processes
are described separately below.
Silent Pauses: The researcher first examined the waveform analysis
window (see top window in Figure 3.2) which presents a two-dimensional graph
of the fluctuation in air pressure (amplitude) on the y axis and the passing of time
on the x axis. In this window, periods of silence can be readily observed by the
absence of vertical striations—indicating little or low amounts of vocal energy.
Conversely, periods of phonation can be detected through the presence of
vertical striations. After determining the general location of a silent pause on the
waveform, the researcher determined the approximate length of the pause by
highlighting the region and checking the value on the corresponding time
counter. Pauses that were near to or greater than .25 seconds in length were
analyzed further while those that were obviously less than .25 seconds in length
were ignored.
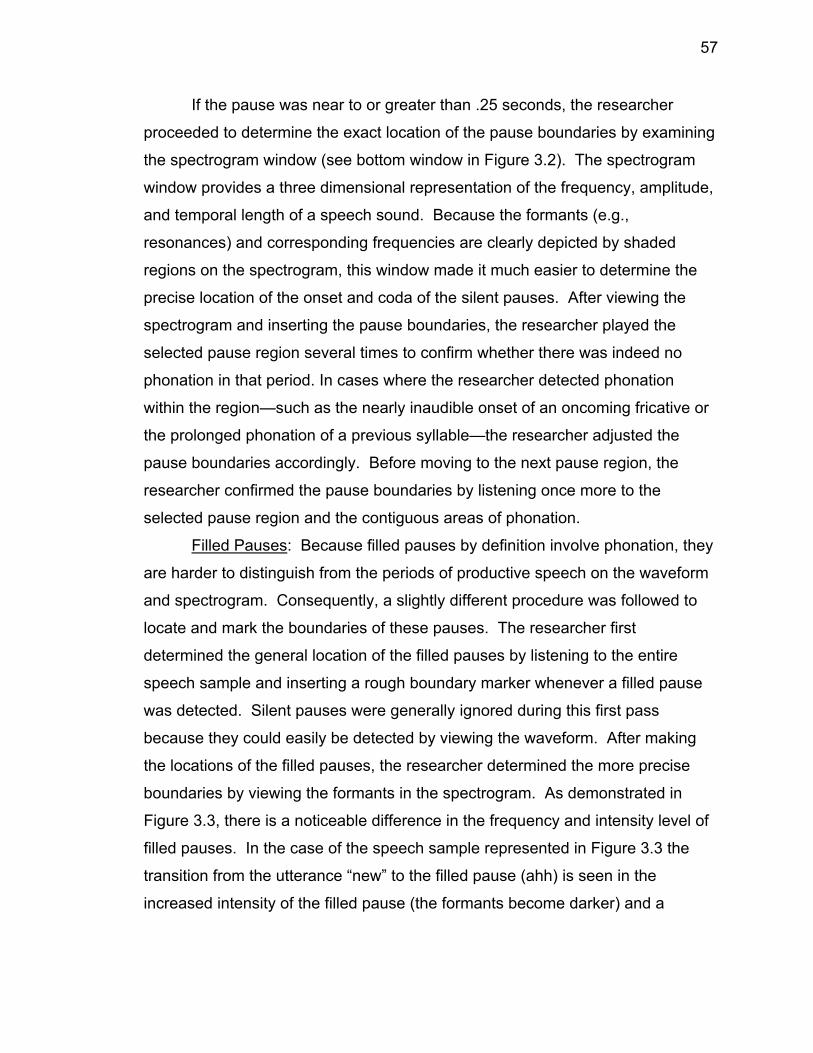
57
If the pause was near to or greater than .25 seconds, the researcher
proceeded to determine the exact location of the pause boundaries by examining
the spectrogram window (see bottom window in Figure 3.2). The spectrogram
window provides a three dimensional representation of the frequency, amplitude,
and temporal length of a speech sound. Because the formants (e.g.,
resonances) and corresponding frequencies are clearly depicted by shaded
regions on the spectrogram, this window made it much easier to determine the
precise location of the onset and coda of the silent pauses. After viewing the
spectrogram and inserting the pause boundaries, the researcher played the
selected pause region several times to confirm whether there was indeed no
phonation in that period. In cases where the researcher detected phonation
within the region—such as the nearly inaudible onset of an oncoming fricative or
the prolonged phonation of a previous syllable—the researcher adjusted the
pause boundaries accordingly. Before moving to the next pause region, the
researcher confirmed the pause boundaries by listening once more to the
selected pause region and the contiguous areas of phonation.
Filled Pauses: Because filled pauses by definition involve phonation, they
are harder to distinguish from the periods of productive speech on the waveform
and spectrogram. Consequently, a slightly different procedure was followed to
locate and mark the boundaries of these pauses. The researcher first
determined the general location of the filled pauses by listening to the entire
speech sample and inserting a rough boundary marker whenever a filled pause
was detected. Silent pauses were generally ignored during this first pass
because they could easily be detected by viewing the waveform. After making
the locations of the filled pauses, the researcher determined the more precise
boundaries by viewing the formants in the spectrogram. As demonstrated in
Figure 3.3, there is a noticeable difference in the frequency and intensity level of
filled pauses. In the case of the speech sample represented in Figure 3.3 the
transition from the utterance “new” to the filled pause (ahh) is seen in the
increased intensity of the filled pause (the formants become darker) and a
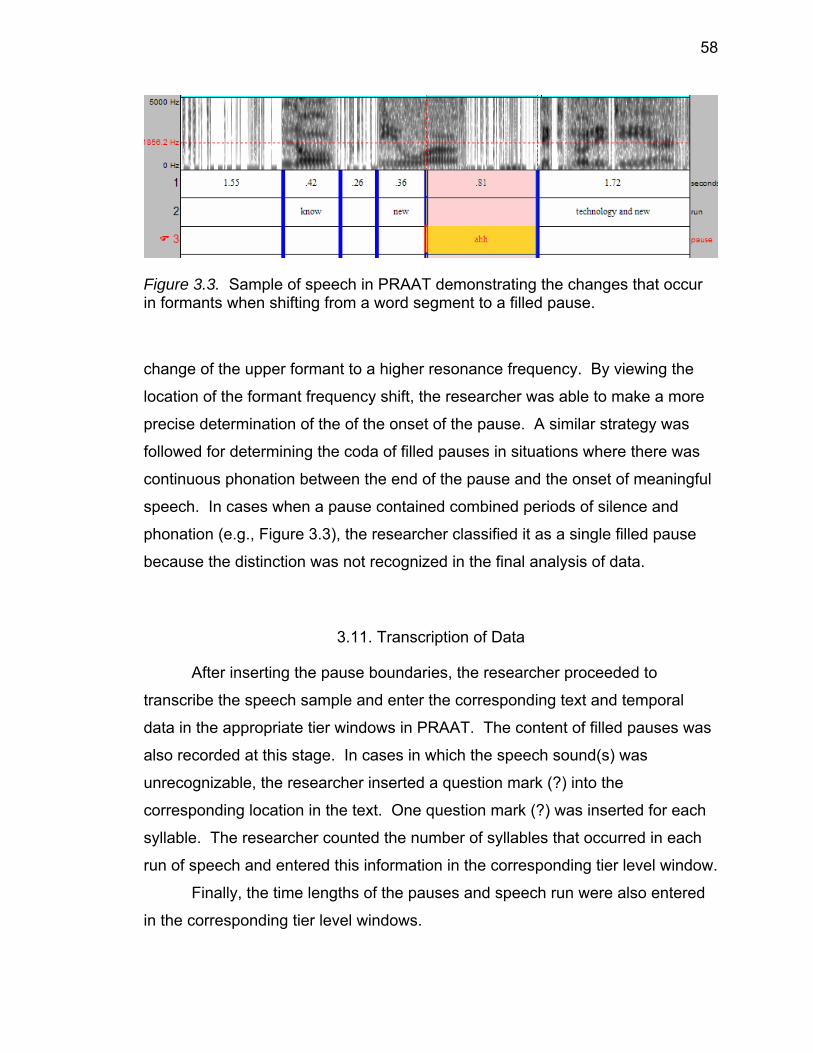
58
Figure 3.3. Sample of speech in PRAAT demonstrating the changes that occur in formants when shifting from a word segment to a filled pause.
change of the upper formant to a higher resonance frequency. By viewing the
location of the formant frequency shift, the researcher was able to make a more
precise determination of the of the onset of the pause. A similar strategy was
followed for determining the coda of filled pauses in situations where there was
continuous phonation between the end of the pause and the onset of meaningful
speech. In cases when a pause contained combined periods of silence and
phonation (e.g., Figure 3.3), the researcher classified it as a single filled pause
because the distinction was not recognized in the final analysis of data.
3.11. Transcription of Data
After inserting the pause boundaries, the researcher proceeded to
transcribe the speech sample and enter the corresponding text and temporal
data in the appropriate tier windows in PRAAT. The content of filled pauses was
also recorded at this stage. In cases in which the speech sound(s) was
unrecognizable, the researcher inserted a question mark (?) into the
corresponding location in the text. One question mark (?) was inserted for each
syllable. The researcher counted the number of syllables that occurred in each
run of speech and entered this information in the corresponding tier level window.
Finally, the time lengths of the pauses and speech run were also entered
in the corresponding tier level windows.
59
3.12. Tabulation of Data
Upon completing the analysis of the pretest and posttest samples of
speech, the researcher proceeded to tabulate the data in an Excel spreadsheet.
A separate Excel document was created for each participant and the pretest and
posttest data were entered on two different worksheet pages within the
document. Ten columns were created within each page—five columns for
entering the raw data (length of each pause, transcription of each speech run,
syllable length of each speech run, second length of each speech run, total
length of speech sample) and five columns corresponding to the five variables
that were being measured. The researcher then used the mathematical
functions within Excel to calculate the values for each of the five fluency
variables. Finally, the research use the copy / paste functions to transfer the
fluency data to a master spreadsheet containing the data for all of the
participants. The data on the master spreadsheet was then read and analyzed
by a statistical software program as described in the section below.
3.13. Statistical Procedures
All data from the study were analyzed using the statistical software
program SPSS. To determine whether gains in fluency were related to the
instructional condition, a one-way ANOVA (analysis of variance) was performed.
A one-way ANOVA is typically employed in experiments involving only one
independent variable (hence one-way ANOVA), and is used to examine whether
there is a significant difference between the mean scores of three or more groups
on one dependent variable. Table 3.1 presents the five dependent variable
measures that were analyzed by the one-way ANOVA procedures in the present
study.
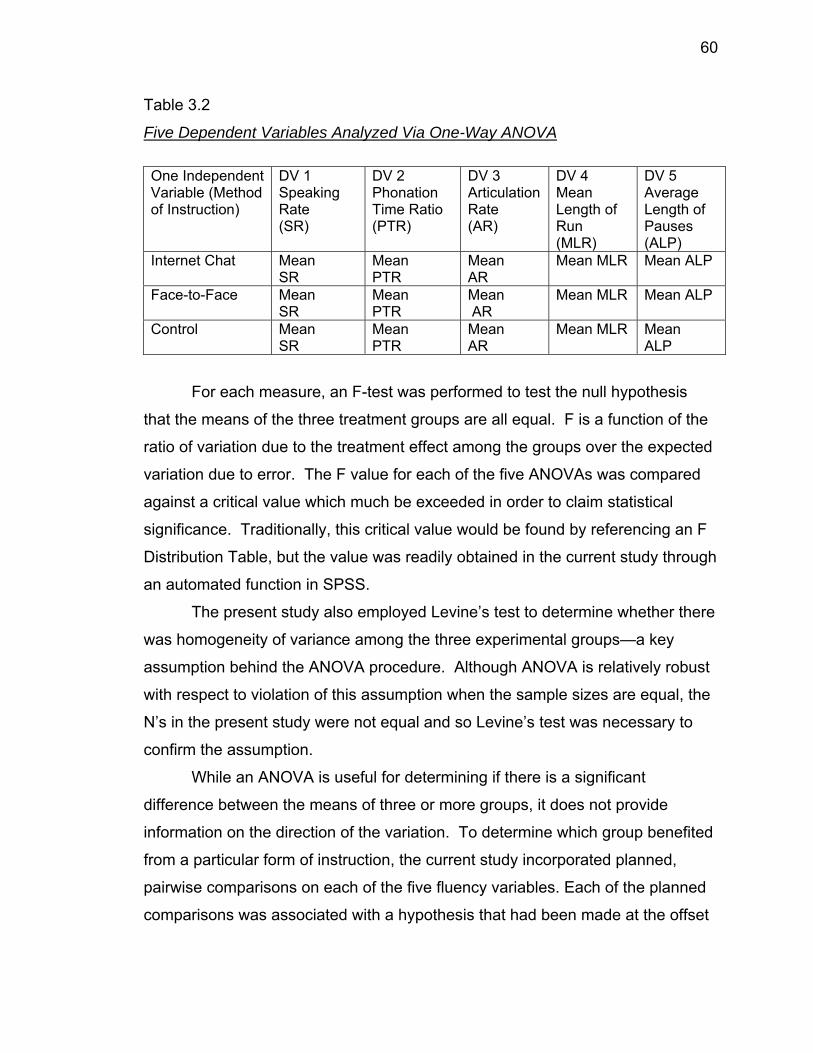
60
Table 3.2
Five Dependent Variables Analyzed Via One-Way ANOVA
One Independent Variable (Method of Instruction)
DV 1 Speaking Rate (SR)
DV 2 Phonation Time Ratio (PTR)
DV 3 Articulation Rate (AR)
DV 4 Mean Length of Run (MLR)
DV 5 Average Length of Pauses (ALP)
Internet Chat Mean SR
Mean PTR
Mean AR
Mean MLR Mean ALP
Face-to-Face Mean SR
Mean PTR
Mean AR
Mean MLR Mean ALP
Control Mean SR
Mean PTR
Mean AR
Mean MLR Mean ALP
For each measure, an F-test was performed to test the null hypothesis
that the means of the three treatment groups are all equal. F is a function of the
ratio of variation due to the treatment effect among the groups over the expected
variation due to error. The F value for each of the five ANOVAs was compared
against a critical value which much be exceeded in order to claim statistical
significance. Traditionally, this critical value would be found by referencing an F
Distribution Table, but the value was readily obtained in the current study through
an automated function in SPSS.
The present study also employed Levine’s test to determine whether there
was homogeneity of variance among the three experimental groups—a key
assumption behind the ANOVA procedure. Although ANOVA is relatively robust
with respect to violation of this assumption when the sample sizes are equal, the
N’s in the present study were not equal and so Levine’s test was necessary to
confirm the assumption.
While an ANOVA is useful for determining if there is a significant
difference between the means of three or more groups, it does not provide
information on the direction of the variation. To determine which group benefited
from a particular form of instruction, the current study incorporated planned,
pairwise comparisons on each of the five fluency variables. Each of the planned
comparisons was associated with a hypothesis that had been made at the offset
61
of the study. The hypotheses and the related pairwise comparisons are
presented below.
• •Hypothesis 1: Mean of the Internet Chat group is equal or greater to that
of the Face-to Face Group. (Pairwise = Internet chat vs face-to-face)
• •Hypothesis 2: Mean of the Face-to-Face Group is greater than that of the
Control Group. (Pairwise = Face-to-Face vs Control)
• •Hypothesis 3: Mean of the Internet Chat group is greater than that of the
Face-to-Face Group. (Pairwise = Internet Chat vs Face-to-Face)
Finally, effect size (ES) was calculated to determine the relative
magnitude of the gains scores in each of treatment groups in comparison with
scores observed in the Control group. The effect size for each variable was
calculated by using the Cohen’s d equation: d = M1-M2 / σ. In this equation, M1
is the average score of the experimental group, M2 is the average score of the
control group, and σ is the pooled standard deviation of the two groups.
3.14. Administration of Exit Surveys
An exit survey was administered to each participant upon completion of
the posttest at the end of the study (Appendix H - J). The purpose of the
questionnaire was to gain insight into how each of the learning environments was
perceived by the participants who engaged in the environment. In this way, it
was possible to compare the subjective impressions of each group of participants
with their actual performance on the fluency measurements—allowing some
insight into issues related to the face validity of each learning environment.
The questionnaire consisted of 15 or 16 Likert Scale items (depending on
the form) items and an open ended question. Questions were divided into five
thematic categories:
1) Evaluation of potential language benefits of the course
2) Evaluation of potential social benefits of the course
62
3) Self-Evaluation of proficiency in typing and using computers
4) Evaluation of specific components of the course
5) An open-ended question on the back of the survey allowed space for
participants to be more specific about the overall impression of the course and to
give suggestions for future implementations of the course.
The responses for each question were tabulated in an Excel spreadsheet
and reported in the form of histograms. Because the number of participants in
each group were not equal, the results were reported in percentages.
63
CHAPTER 4. RESULTS
4.1. Introduction
This chapter describes the results of the data analysis to investigate the
primary research question in this study: Can ESL oral fluency be improved
through the medium of a text-based Internet chat environment? A secondary
question regarding the impressions of participants towards the three different
learning environments employed in the study is also explored in the data
analysis. The data for investigating the primary question are the participants’
pretest to posttest gain scores that were calculated for each of the five measures
of fluency. The data for investigating the secondary question are the quantitative
and qualitative responses to an exit study administered at the end of the study.
The first section of this chapter presents descriptive statistics on the
fluency gains made in each of the three groups. The second section presents
the quantitative analyses of the three groups on the five measures of fluency.
The three research hypotheses are addressed by presenting results of the one
way ANOVA and the accompanying pairwise comparisons. The effect size for
the treatment variables is also presented. The third section of this chapter
summarizes the participant responses on the exit survey that was administered
at the end of the study. Although small in scale, it provides insight into the
affective dimensions of the study and the degree to which participants in each
group believed that their English proficiency improved over the six-week period.
64
4.2. Descriptive Statistics of Gain Scores
Tables 4.1 – 4.5 present the average pretest, posttest, and gain scores for
each of the five fluency measures. The percent of improvement from pretest to
posttest is presented in the final column of each table. The percent improvement
is also presented in the histograms in Figures 4.1 – 4.5. The data clearly indicate
that while each group in the study made gains in fluency, the gains made by
participants in the Internet Chat group were the highest. The Internet Chat
group demonstrated higher average gain scores on all five measures when
compared to the Control group and higher average gains scores on all but one
measure—articulation rate—when compared to the Face-to-Face group.
On the speaking rate measure (syllables per second including pause
time), participants in the Control group made an average gain of only a tenth of a
syllable per second or roughly four percent, participants in the Face-to-Face
group improved by .36 syllables per second or 15 percent, and participants in the
Internet Chat group made an average gain of .47 syllables per second or nearly
20 percent. In terms of the phonation time ratio measure (speaking time divided
by total length of speech sample), participants in the Control group improved
their scores on average from .65 to .68 which is a four percent increase,
participants in the Face-to-Face group increased their scores on average from
.61 to .66 which reflects an eight percent increase, and participants in the
Internet Chat group increased their scores on average from .62 to .73 which
reflects a 17 percent increase.
On the articulation rate measure (syllables per second not including pause
time), participants in the Control group made an average gain of .05 syllables per
second or one percent, participants in the Face-to-Face group made an average
gain of .24 syllables per second or six percent, and participants in the Internet
Chat group made an average gain of .05 syllables per second or nearly two
percent. On the mean length of run measure (average number of syllables
65
uttered between pause boundaries), participants in the Control group made an
average gain of .50 syllables per speech run or eight percent, participants in the
Face-to-Face group made an average gain of .79 syllables per speech run or
roughly 14 percent, and participants in the Internet Chat group made an average
increase of 2.06 syllables per speech run which is a 38 percent increase.
Finally, on the average length of pause measure (average length of
pauses .25 second or longer), participants demonstrated an average decrease of
.04 seconds per pause or five percent, participants in the Internet Chat group
demonstrated an average decrease of .14 seconds per pause or 14 percent, and
participants in the Internet Chat group demonstrated an average decrease of .18
seconds per pause or 21 percent.
Some general observations from the descriptive data should be noted
here. First, the results from the gain score calculations show that even the
Control group performed better on the posttest measures of fluency. This
outcome was expected and may be attributed to the fact that six weeks expired
between the pretest and posttest—allowing participants to improve English
fluency even outside of the classroom setting. Gains made in the Control group
may also be related to the fact that the participants were familiar with the test
administrator and the testing conditions upon taking the posttest. Although
different prompts were used for the pretest and posttest, it is likely that the
similarity of tasks and technical procedures between the two exams facilitated
stronger performance on the posttest.
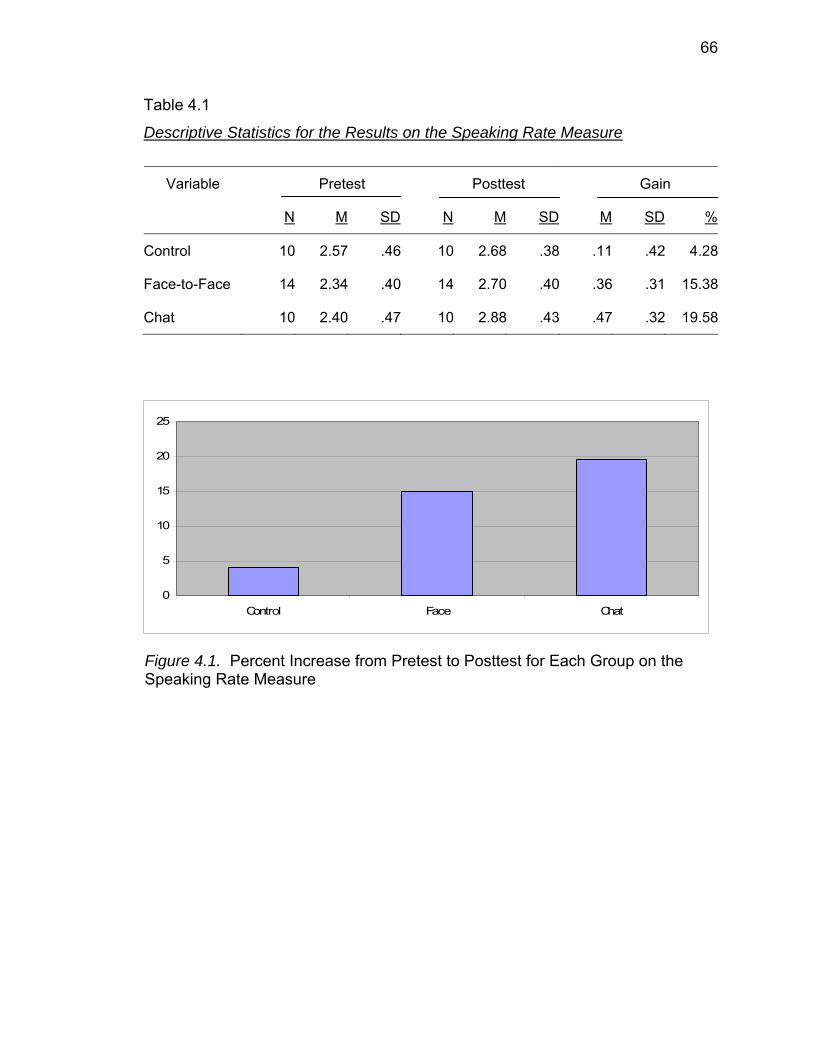
66
Table 4.1
Descriptive Statistics for the Results on the Speaking Rate Measure
Pretest Posttest Gain Variable
N M SD N M SD M SD %
Control 10 2.57 .46 10 2.68 .38 .11 .42 4.28
Face-to-Face 14 2.34 .40 14 2.70 .40 .36 .31 15.38
Chat 10 2.40 .47 10 2.88 .43 .47 .32 19.58
Figure 4.1. Percent Increase from Pretest to Posttest for Each Group on the Speaking Rate Measure
0
5
10
15
20
25
Control Face Chat
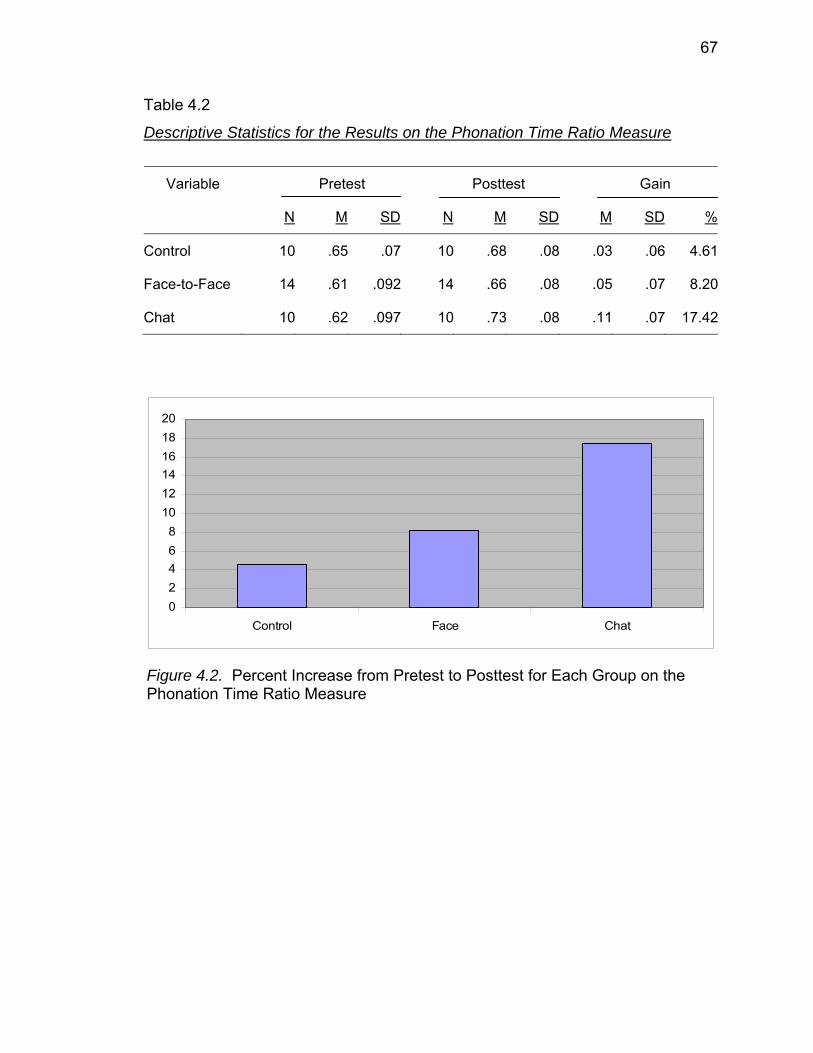
67
Table 4.2
Descriptive Statistics for the Results on the Phonation Time Ratio Measure
Pretest Posttest Gain Variable
N M SD N M SD M SD %
Control 10 .65 .07 10 .68 .08 .03 .06 4.61
Face-to-Face 14 .61 .092 14 .66 .08 .05 .07 8.20
Chat 10 .62 .097 10 .73 .08 .11 .07 17.42
Figure 4.2. Percent Increase from Pretest to Posttest for Each Group on the Phonation Time Ratio Measure
02468
101214161820
Control Face Chat
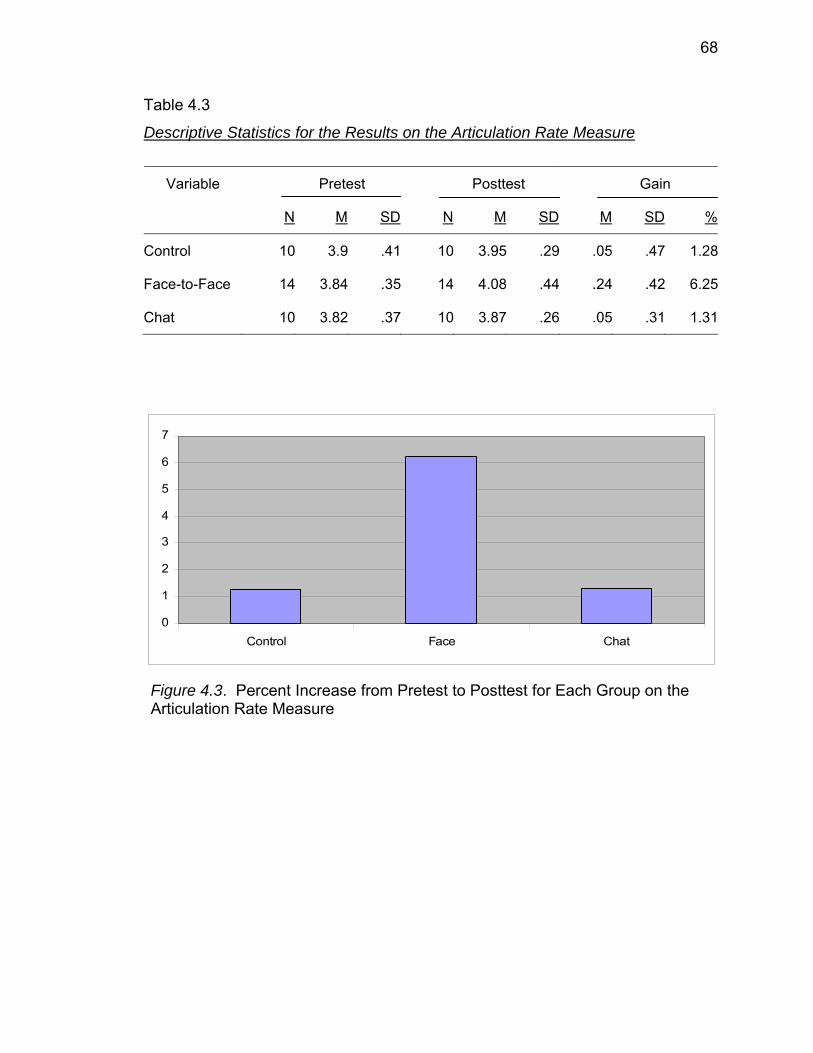
68
Table 4.3
Descriptive Statistics for the Results on the Articulation Rate Measure
Pretest Posttest Gain Variable
N M SD N M SD M SD %
Control 10 3.9 .41 10 3.95 .29 .05 .47 1.28
Face-to-Face 14 3.84 .35 14 4.08 .44 .24 .42 6.25
Chat 10 3.82 .37 10 3.87 .26 .05 .31 1.31
0
1
2
3
4
5
6
7
Control Face Chat
Figure 4.3. Percent Increase from Pretest to Posttest for Each Group on the Articulation Rate Measure

69
Table 4.4
Descriptive Statistics for the Results on the Mean Length of Run Measure
Pretest Posttest Gain Variable
N M SD N M SD M SD %
Control 10 5.79 1.36 10 6.29 1.52 .50 .81 8.64
Face-to-Face 14 5.53 1.42 14 6.32 1.17 .79 1.74 14.29
Chat 10 5.49 1.37 10 7.61 2.06 2.12 1.36 38.62
0
5
10
15
20
25
30
35
40
45
Control Face Chat
Figure 4.4. Percent Increase from Pretest to Posttest for Each Group on the Mean Length of Run Measure

70
Table 4.5
Descriptive Statistics for the Results on the Average Length of Pause Measure
Pretest Posttest Gain
Variable N M SD N M SD M SD %
Control 10 .78 .13 10 .74 .14 -.04 .21 5.13
Face-to-Face 14 .96 .39 14 .82 .24 -.14 .31 14.58
Chat 10 .85 .16 10 .67 .15 -.18 .17 21.18
0
5
10
15
20
25
Control Face Chat
Figure 4.5. Percent Increase from Pretest to Posttest for Each Group on the Average Length of Pause Measure
71
A second general observation is that the largest gain scores were made
on the mean length of run measure with the three groups demonstrating a
combined average gain of 20 percent in the number of syllables uttered between
pauses of .25 seconds or greater. The lowest gain scores for all three groups
were made on the measure of articulation rate with a combined average gain of
just under three percent or slightly over a tenth of a syllable per second. The
negative gain scores reported by all three groups on the average length of pause
measure is expected because length of pauses is inversely correlated with
fluency.
A final general observation of the descriptive data relates to the reported
standard deviation for the three groups on the various fluency measures. While
the standard deviation is comparable between the three groups on four of the five
measures, it is notably higher for the Face-to-Face and Internet Chat groups on
the mean length of run (MLR) measure (see Table 4.4). A closer look at the data
reveals a considerable degree of dispersion of scores within the Face-to-Face
and Internet Chat groups on the MLR measure whereas the Control group had
relatively little within group variation on the measure. A possible explanation for
this is that there was an interaction between the two teaching environments
(face-to-face and on-line chat) and the learners within those environments as far
as improvement on the mean length of run measure is concerned. In other
words, it is possible that the on-line chat (or face to face) environment was
especially conducive to fluency gains on the MLR variable for some participants
while it was not especially conducive to gains for others. This scenario seems
especially plausible when considering the argument made by Towel, Hawkins et
al. (1996) that of all the fluency variables, MLR is most closely related to the
acquisition of lexical knowledge. If this is the case, then it would seem
reasonable that gains on the MLR variable would show the greatest amount of
within group dispersion with learners responding very differently to the particular
learning environment as far as lexical acquisition is concerned.
72
4.3. Statistical Analyses of Fluency Improvement for Instructional Groups
This section reports on several analyses that were conducted to test the
three hypotheses of the study: 1) Participants in the face-to-face classroom will
demonstrate gains in fluency that are higher than the gains made by participants
in the control group; 2) Participants in the text-based, Internet chat classroom will
demonstrate gains in fluency that are higher than the gains made by participants
in the control group; and 3) Participants in the text-based Internet chat classroom
will demonstrate gains in fluency that are higher than the gains made by
participants in the face-to-face classroom. The analyses reported in this section
were performed on the gain score data for the three experimental groups.
Because the statistical analyses were based on the assumption that 1) the three
groups had similar fluency levels at the beginning of the study and 2) the
variances within each group were comparable, two additional analyses were
performed to test these assumptions. The results of these tests are presented
below.
4.3.1. Testing of Assumptions that Underlie the Statistical Analyses
One fundamental assumption in the study was that the randomized
assignment of participants to experimental groups would create groups that had
similar fluency levels at the start of the study. To test this assumption, an
ANOVA was conducted for each fluency measure on the pretest scores. The
results of the five one-way ANOVAs are presented in Table 4.6. The results of
the one-way ANOVA procedures indicate that there were no significant
differences on the three groups’ pretest scores on any of the fluency measures
(p<.05). Although the variance between groups is the greatest on the average
length of pauses measure (F=1.36, p<.271), it is still well outside the margin of
significance. These results thus confirmed that the participants in each of the
three groups began the study at a similar level of fluency.
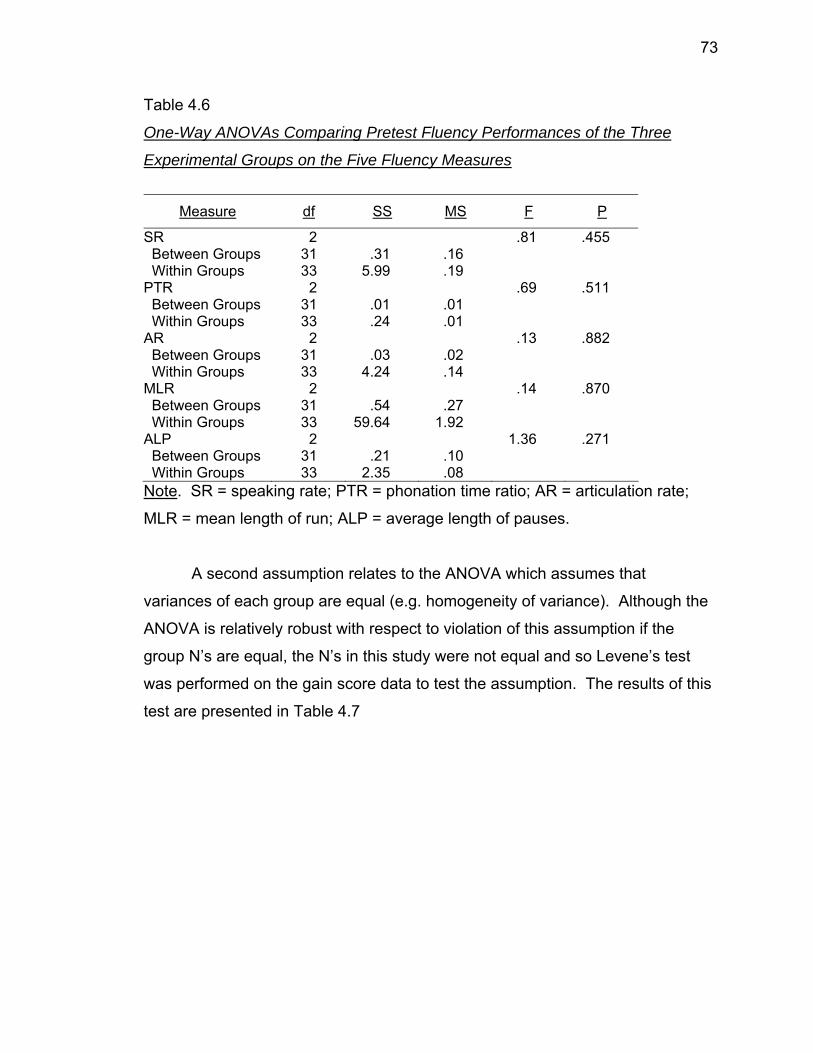
73
Table 4.6
One-Way ANOVAs Comparing Pretest Fluency Performances of the Three
Experimental Groups on the Five Fluency Measures
Measure df SS MS F P
SR Between Groups Within Groups
2 31 33
.31
5.99
.16 .19
.81 .455
PTR Between Groups Within Groups
2 31 33
.01 .24
.01 .01
.69 .511
AR Between Groups Within Groups
2 31 33
.03
4.24
.02 .14
.13 .882
MLR Between Groups Within Groups
2 31 33
.54
59.64
.27
1.92
.14 .870
ALP Between Groups Within Groups
2 31 33
.21
2.35
.10 .08
1.36 .271
Note. SR = speaking rate; PTR = phonation time ratio; AR = articulation rate;
MLR = mean length of run; ALP = average length of pauses.
A second assumption relates to the ANOVA which assumes that
variances of each group are equal (e.g. homogeneity of variance). Although the
ANOVA is relatively robust with respect to violation of this assumption if the
group N’s are equal, the N’s in this study were not equal and so Levene’s test
was performed on the gain score data to test the assumption. The results of this
test are presented in Table 4.7
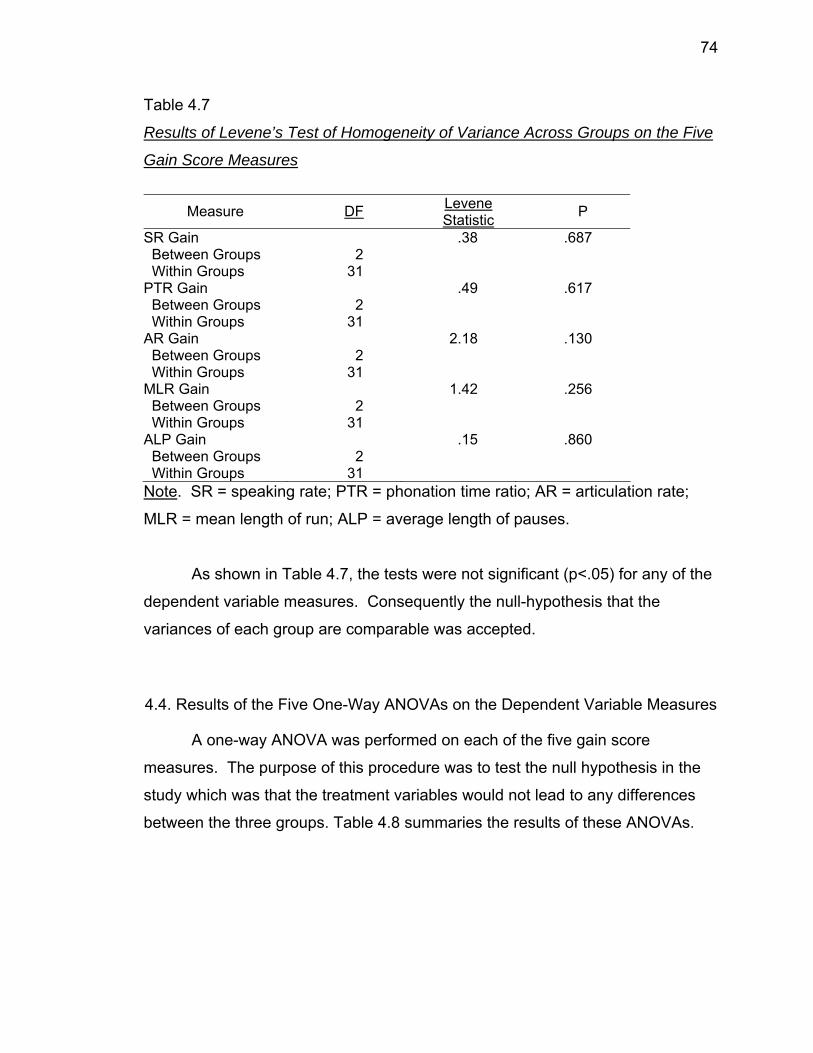
74
Table 4.7
Results of Levene’s Test of Homogeneity of Variance Across Groups on the Five
Gain Score Measures
Measure DF Levene Statistic P
SR Gain Between Groups Within Groups
2
31
.38 .687
PTR Gain Between Groups Within Groups
2
31
.49 .617
AR Gain Between Groups Within Groups
2
31
2.18 .130
MLR Gain Between Groups Within Groups
2
31
1.42 .256
ALP Gain Between Groups Within Groups
2
31
.15 .860
Note. SR = speaking rate; PTR = phonation time ratio; AR = articulation rate;
MLR = mean length of run; ALP = average length of pauses.
As shown in Table 4.7, the tests were not significant (p<.05) for any of the
dependent variable measures. Consequently the null-hypothesis that the
variances of each group are comparable was accepted.
4.4. Results of the Five One-Way ANOVAs on the Dependent Variable Measures
A one-way ANOVA was performed on each of the five gain score
measures. The purpose of this procedure was to test the null hypothesis in the
study which was that the treatment variables would not lead to any differences
between the three groups. Table 4.8 summaries the results of these ANOVAs.
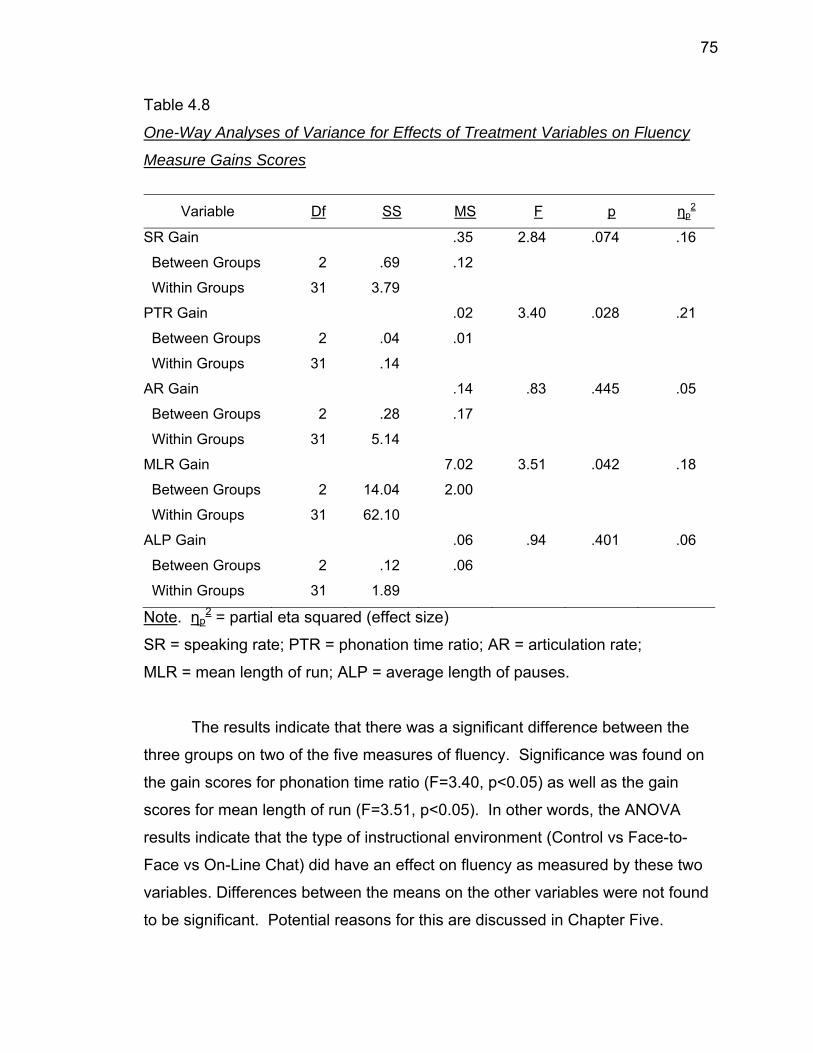
75
Table 4.8
One-Way Analyses of Variance for Effects of Treatment Variables on Fluency
Measure Gains Scores
Variable Df SS MS F p ηp2
SR Gain
Between Groups
Within Groups
2
31
.69
3.79
.35
.12
2.84 .074 .16
PTR Gain
Between Groups
Within Groups
2
31
.04
.14
.02
.01
3.40 .028 .21
AR Gain
Between Groups
Within Groups
2
31
.28
5.14
.14
.17
.83 .445 .05
MLR Gain
Between Groups
Within Groups
2
31
14.04
62.10
7.02
2.00
3.51 .042 .18
ALP Gain
Between Groups
Within Groups
2
31
.12
1.89
.06
.06
.94 .401 .06
Note. ηp2 = partial eta squared (effect size)
SR = speaking rate; PTR = phonation time ratio; AR = articulation rate;
MLR = mean length of run; ALP = average length of pauses.
The results indicate that there was a significant difference between the
three groups on two of the five measures of fluency. Significance was found on
the gain scores for phonation time ratio (F=3.40, p<0.05) as well as the gain
scores for mean length of run (F=3.51, p<0.05). In other words, the ANOVA
results indicate that the type of instructional environment (Control vs Face-to-
Face vs On-Line Chat) did have an effect on fluency as measured by these two
variables. Differences between the means on the other variables were not found
to be significant. Potential reasons for this are discussed in Chapter Five.
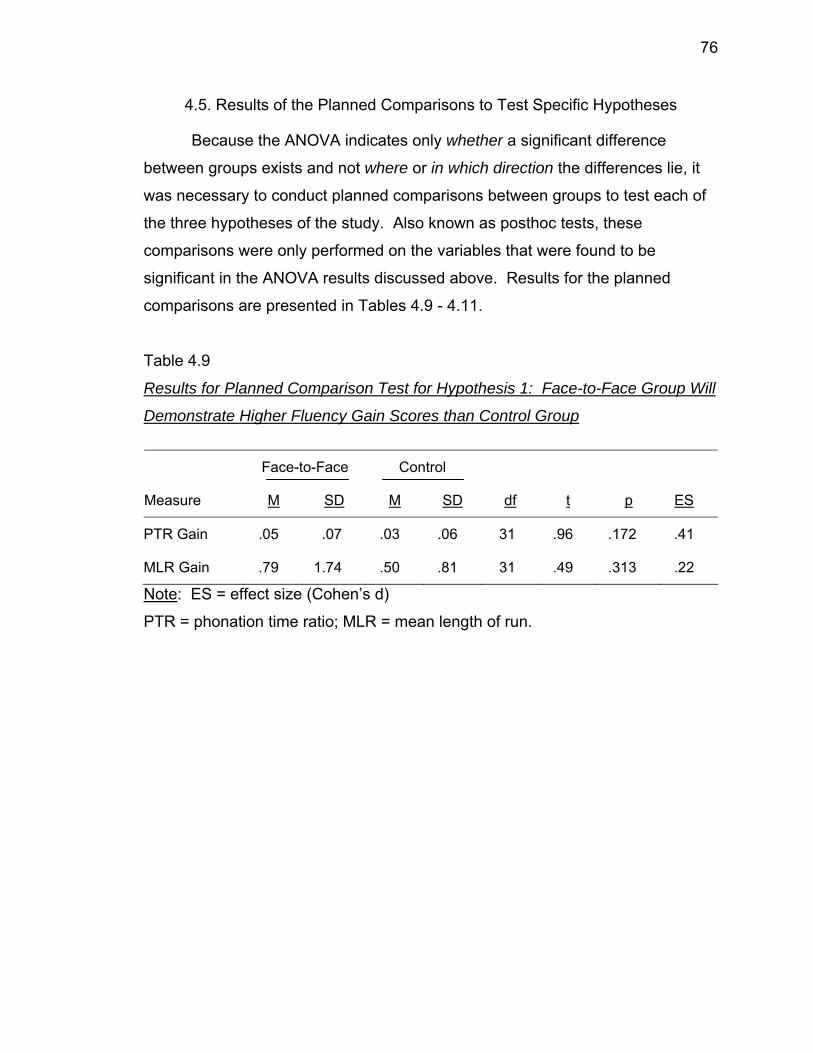
76
4.5. Results of the Planned Comparisons to Test Specific Hypotheses
Because the ANOVA indicates only whether a significant difference
between groups exists and not where or in which direction the differences lie, it
was necessary to conduct planned comparisons between groups to test each of
the three hypotheses of the study. Also known as posthoc tests, these
comparisons were only performed on the variables that were found to be
significant in the ANOVA results discussed above. Results for the planned
comparisons are presented in Tables 4.9 - 4.11.
Table 4.9
Results for Planned Comparison Test for Hypothesis 1: Face-to-Face Group Will
Demonstrate Higher Fluency Gain Scores than Control Group
Face-to-Face Control
Measure M SD M SD df t p ES
PTR Gain .05 .07 .03 .06 31 .96 .172 .41
MLR Gain .79 1.74 .50 .81 31 .49 .313 .22
Note: ES = effect size (Cohen’s d)
PTR = phonation time ratio; MLR = mean length of run.
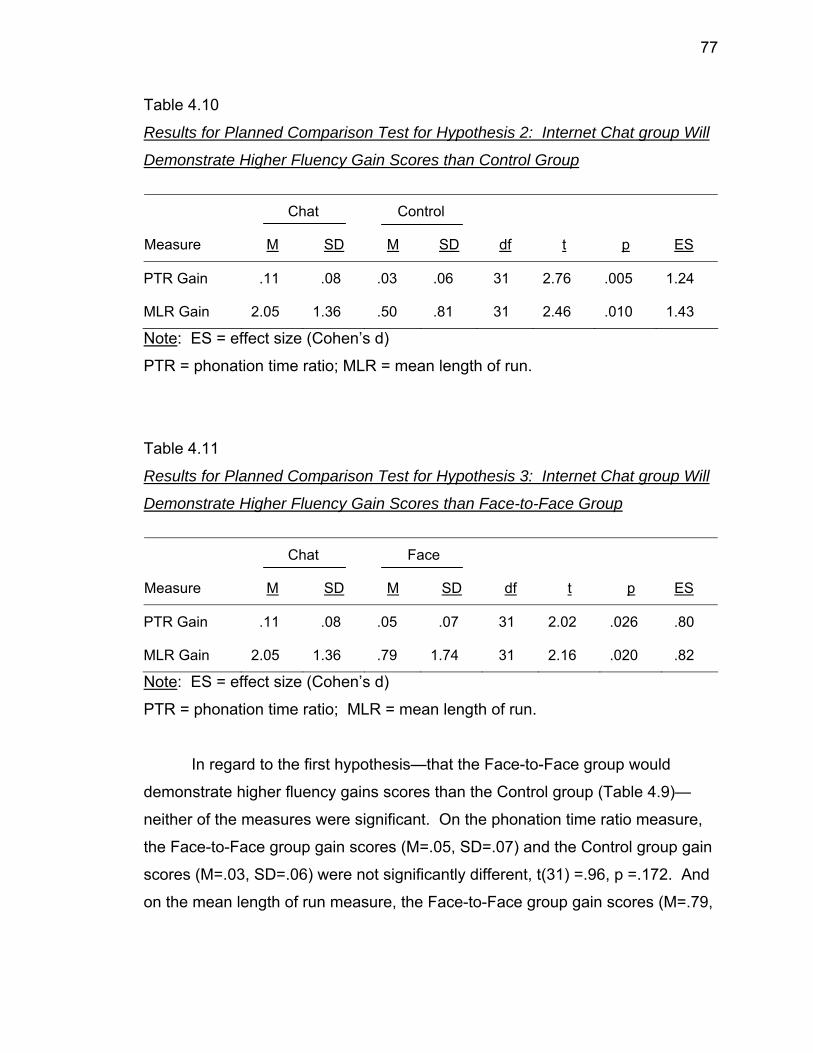
77
Table 4.10
Results for Planned Comparison Test for Hypothesis 2: Internet Chat group Will
Demonstrate Higher Fluency Gain Scores than Control Group
Chat Control
Measure M SD M SD df t p ES
PTR Gain .11 .08 .03 .06 31 2.76 .005 1.24
MLR Gain 2.05 1.36 .50 .81 31 2.46 .010 1.43
Note: ES = effect size (Cohen’s d)
PTR = phonation time ratio; MLR = mean length of run.
Table 4.11
Results for Planned Comparison Test for Hypothesis 3: Internet Chat group Will
Demonstrate Higher Fluency Gain Scores than Face-to-Face Group
Chat Face
Measure M SD M SD df t p ES
PTR Gain .11 .08 .05 .07 31 2.02 .026 .80
MLR Gain 2.05 1.36 .79 1.74 31 2.16 .020 .82
Note: ES = effect size (Cohen’s d)
PTR = phonation time ratio; MLR = mean length of run.
In regard to the first hypothesis—that the Face-to-Face group would
demonstrate higher fluency gains scores than the Control group (Table 4.9)—
neither of the measures were significant. On the phonation time ratio measure,
the Face-to-Face group gain scores (M=.05, SD=.07) and the Control group gain
scores (M=.03, SD=.06) were not significantly different, t(31) =.96, p =.172. And
on the mean length of run measure, the Face-to-Face group gain scores (M=.79,
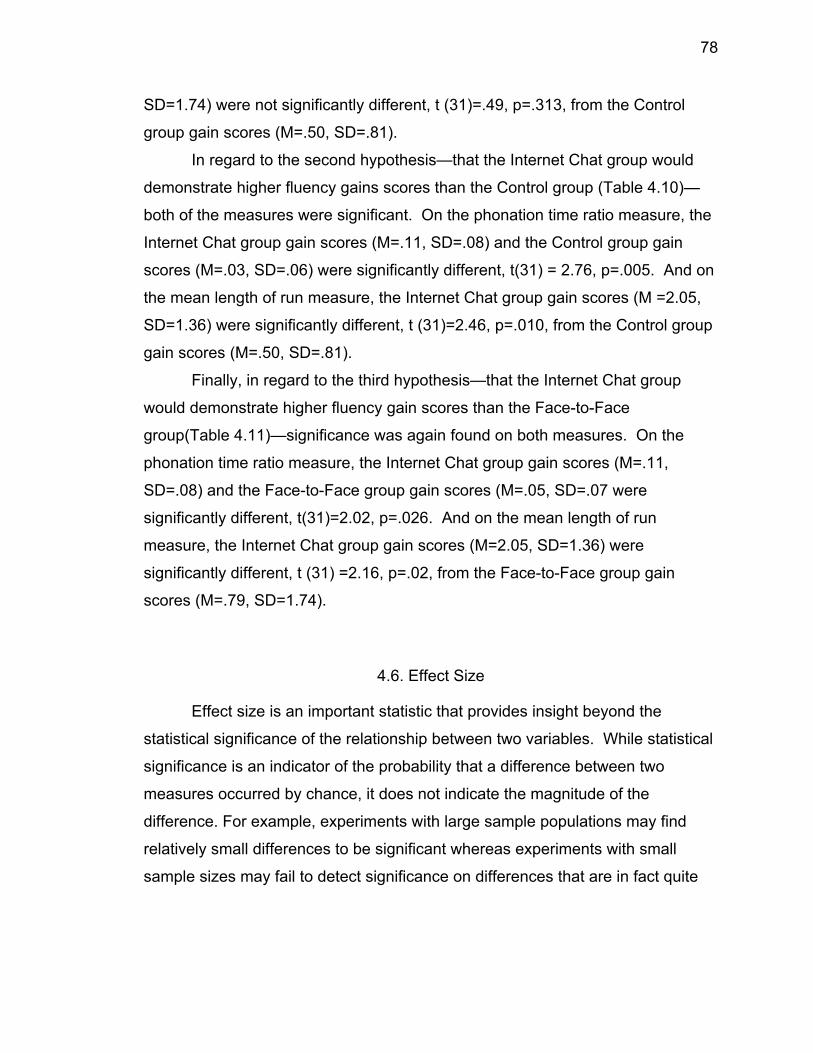
78
SD=1.74) were not significantly different, t (31)=.49, p=.313, from the Control
group gain scores (M=.50, SD=.81).
In regard to the second hypothesis—that the Internet Chat group would
demonstrate higher fluency gains scores than the Control group (Table 4.10)—
both of the measures were significant. On the phonation time ratio measure, the
Internet Chat group gain scores (M=.11, SD=.08) and the Control group gain
scores (M=.03, SD=.06) were significantly different, t(31) = 2.76, p=.005. And on
the mean length of run measure, the Internet Chat group gain scores (M =2.05,
SD=1.36) were significantly different, t (31)=2.46, p=.010, from the Control group
gain scores (M=.50, SD=.81).
Finally, in regard to the third hypothesis—that the Internet Chat group
would demonstrate higher fluency gain scores than the Face-to-Face
group(Table 4.11)—significance was again found on both measures. On the
phonation time ratio measure, the Internet Chat group gain scores (M=.11,
SD=.08) and the Face-to-Face group gain scores (M=.05, SD=.07 were
significantly different, t(31)=2.02, p=.026. And on the mean length of run
measure, the Internet Chat group gain scores (M=2.05, SD=1.36) were
significantly different, t (31) =2.16, p=.02, from the Face-to-Face group gain
scores (M=.79, SD=1.74).
4.6. Effect Size
Effect size is an important statistic that provides insight beyond the
statistical significance of the relationship between two variables. While statistical
significance is an indicator of the probability that a difference between two
measures occurred by chance, it does not indicate the magnitude of the
difference. For example, experiments with large sample populations may find
relatively small differences to be significant whereas experiments with small
sample sizes may fail to detect significance on differences that are in fact quite
79
large. In a study such as this one, effect size is a useful indicator of the degree
to which two groups differ in respect to the treatment effect.
The effect sizes for each of the planned comparisons are presented in the
final columns of Tables 4.9 - 4.11. Cohen (1988) defines small effect sizes as
those that are .2 (or less), medium as .5, and large as .8 or higher. By this
standard, the effect sizes for both measures are quite high when comparing the
Internet Chat group with the Control group and the Internet Chat group with the
Face-to-Face group but relatively low when comparing the Face-to-Face group
with the Control group. This suggests that the treatment effect of the on-line chat
environment was in fact quite strong as far as the phonation time ratio and mean
length of run variables are concerned.
4.7. Results of the Exit Survey
This section presents the findings from the survey that was administered
to all participants at the end of the study. Figures 4.1 – 4.17 present histograms
showing the percent of respondents from each group who strongly agreed,
somewhat agreed, etc with each item on the survey. Because the number of
participants in each group was not equal, the histograms are based on
percentages rather than frequency counts. The histograms reveal that a larger
percentage of the Face-to-Face group participants strongly or somewhat agreed
that the course helped them to improve their fluency (Figure 4.6) and listening
(Figure 4.7), while clearly a larger percentage of the Internet Chat group
participants strongly or somewhat agreed that the course had helped them to
improve their knowledge of American culture (Figure 4.8) and vocabulary (Figure
4.9). Approximately 40 percent of participants in both the Face-to-Face and
Control groups strongly agreed that the course has helped them to feel more
comfortable using English (Figure 4.13) while only 20 percent of the Control
group participants strongly agreed with the statement.
80
In regard to the statement, “I felt connected to other students in the
course,” (Figure 4.11) the responses were somewhat surprising. Only 10 percent
more participants in the Face-to-Face group strongly agreed with the statement
than those in the Internet Chat group (50 percent vs 40 percent respectively).
Even more surprising was the fact that 30 percent of the Control group
participants either strongly agreed or somewhat agree with this statement—this
in spite of the fact that they had no contact with the other participants who were
taking the course. A possible explanation for this is presented in Chapter 5.
A higher percentage of participants in the Face-to-Face and Internet Chat
groups expressed overall satisfaction with the course than those in Control
group. Nearly all of the participants in the Face-to-Face and Internet Chat
groups strongly agreed that they would recommend the course to a friend (Figure
4.12) and 100 percent of the participants in these two groups indicated that the
course had been beneficial overall (Figure 4.15). In contrast, only 30 percent of
the Control group participants strongly agreed that they would recommend the
course to a friend and only 40 percent strongly agreed that the course had been
beneficial overall.
In terms of the topics and activities selected for the course, participants in
all three groups expressed nearly the same levels of agreement on whether the
selected topics had been useful to them (Figure 4.10) with 60 to 70 percent of
participants in all three groups strongly agreeing that the topics had been useful.
Roughly the same percentage of participants from each group thought that the
on-line listening activities had been useful (Figure 4.18). However, there was a
more clear difference between groups in regard to the on-line new expressions
activities with 100 percent of the Internet Chat group participants finding them
very useful whereas only 70 percent of the Control group and 78 percent of the
Face-to-Face group participants indicating that the new expressions activities
had been very useful. Opinions were also quite different across groups in regard
to the on-line quiz activities (Figure 4.20) with 70 percent of the Internet Chat
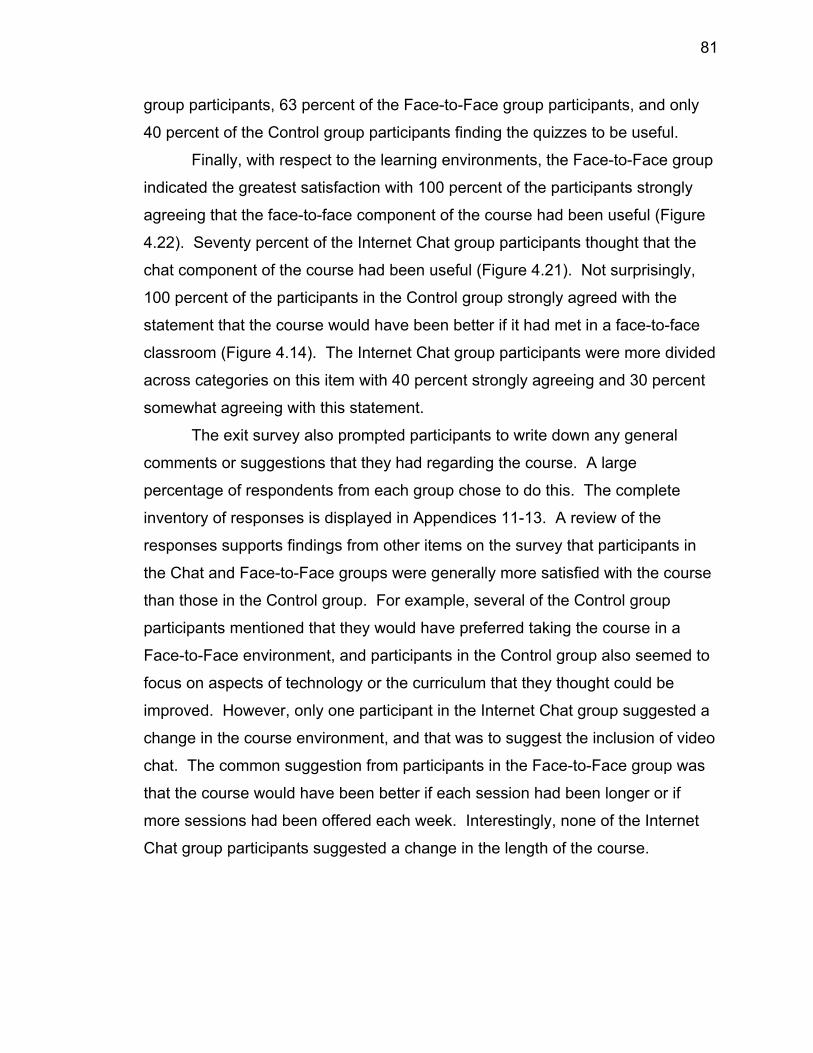
81
group participants, 63 percent of the Face-to-Face group participants, and only
40 percent of the Control group participants finding the quizzes to be useful.
Finally, with respect to the learning environments, the Face-to-Face group
indicated the greatest satisfaction with 100 percent of the participants strongly
agreeing that the face-to-face component of the course had been useful (Figure
4.22). Seventy percent of the Internet Chat group participants thought that the
chat component of the course had been useful (Figure 4.21). Not surprisingly,
100 percent of the participants in the Control group strongly agreed with the
statement that the course would have been better if it had met in a face-to-face
classroom (Figure 4.14). The Internet Chat group participants were more divided
across categories on this item with 40 percent strongly agreeing and 30 percent
somewhat agreeing with this statement.
The exit survey also prompted participants to write down any general
comments or suggestions that they had regarding the course. A large
percentage of respondents from each group chose to do this. The complete
inventory of responses is displayed in Appendices 11-13. A review of the
responses supports findings from other items on the survey that participants in
the Chat and Face-to-Face groups were generally more satisfied with the course
than those in the Control group. For example, several of the Control group
participants mentioned that they would have preferred taking the course in a
Face-to-Face environment, and participants in the Control group also seemed to
focus on aspects of technology or the curriculum that they thought could be
improved. However, only one participant in the Internet Chat group suggested a
change in the course environment, and that was to suggest the inclusion of video
chat. The common suggestion from participants in the Face-to-Face group was
that the course would have been better if each session had been longer or if
more sessions had been offered each week. Interestingly, none of the Internet
Chat group participants suggested a change in the length of the course.
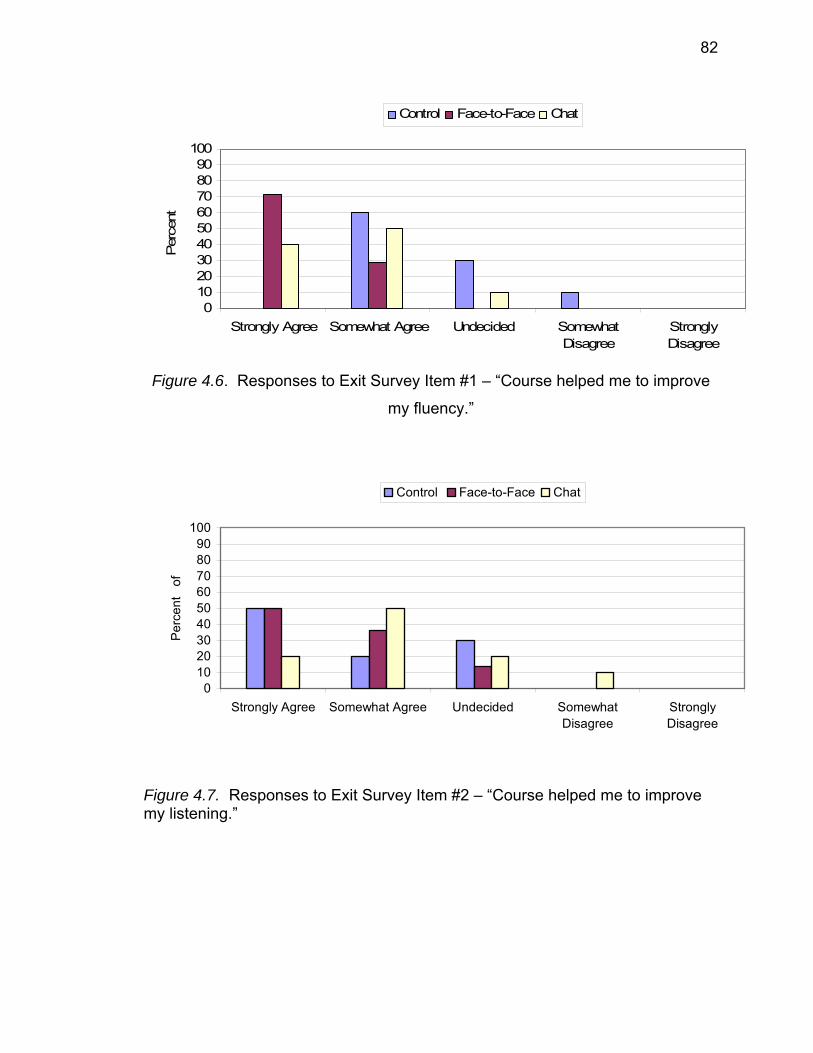
82
0102030405060708090
100
Strongly Agree Somewhat Agree Undecided SomewhatDisagree
StronglyDisagree
Per
cent
Control Face-to-Face Chat
Figure 4.6. Responses to Exit Survey Item #1 – “Course helped me to improve
my fluency.”
0102030405060708090
100
Strongly Agree Somewhat Agree Undecided SomewhatDisagree
StronglyDisagree
Per
cent
of
Control Face-to-Face Chat
Figure 4.7. Responses to Exit Survey Item #2 – “Course helped me to improve my listening.”
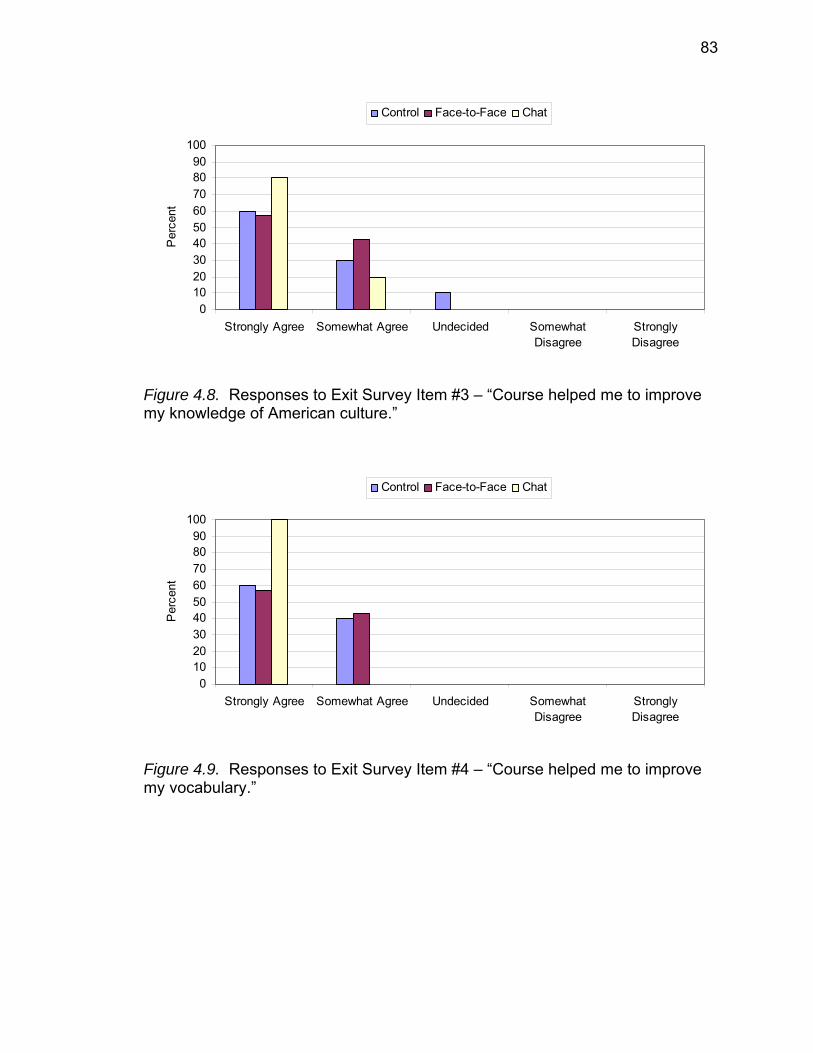
83
0102030405060708090
100
Strongly Agree Somewhat Agree Undecided SomewhatDisagree
StronglyDisagree
Per
cent
Control Face-to-Face Chat
Figure 4.8. Responses to Exit Survey Item #3 – “Course helped me to improve my knowledge of American culture.”
0102030405060708090
100
Strongly Agree Somewhat Agree Undecided SomewhatDisagree
StronglyDisagree
Per
cent
Control Face-to-Face Chat
Figure 4.9. Responses to Exit Survey Item #4 – “Course helped me to improve my vocabulary.”
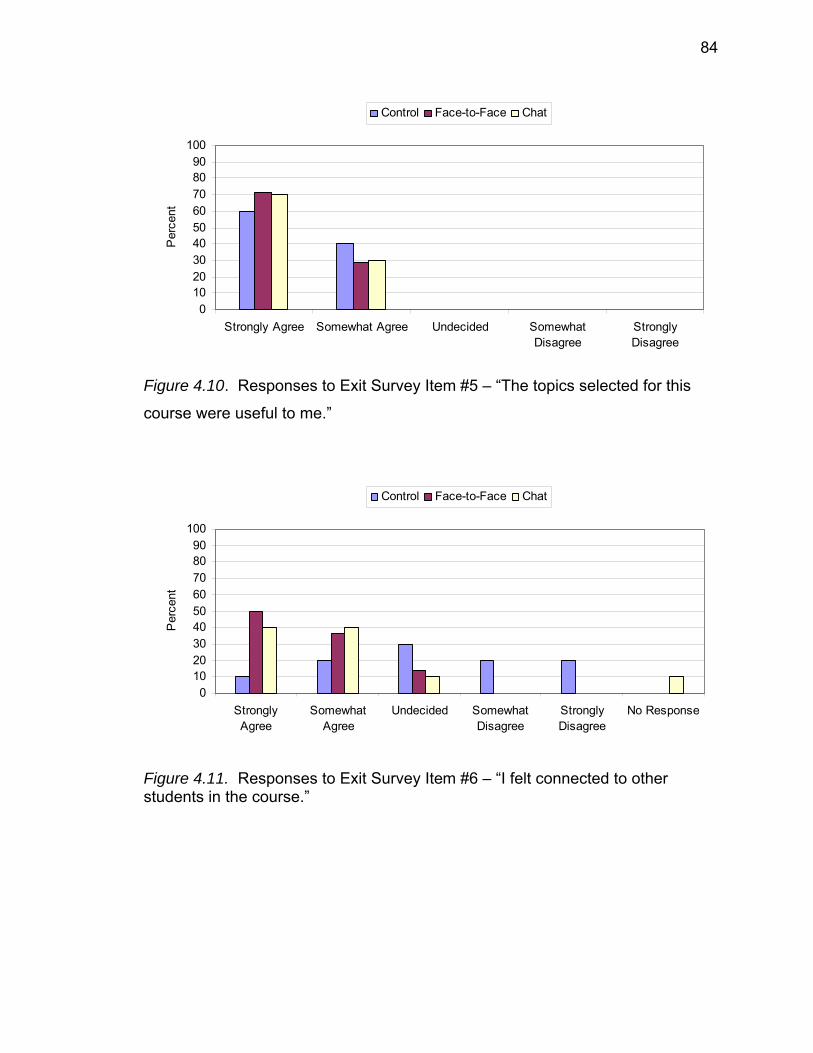
84
0102030405060708090
100
Strongly Agree Somewhat Agree Undecided SomewhatDisagree
StronglyDisagree
Per
cent
Control Face-to-Face Chat
Figure 4.10. Responses to Exit Survey Item #5 – “The topics selected for this
course were useful to me.”
0102030405060708090
100
StronglyAgree
SomewhatAgree
Undecided SomewhatDisagree
StronglyDisagree
No Response
Per
cent
Control Face-to-Face Chat
Figure 4.11. Responses to Exit Survey Item #6 – “I felt connected to other students in the course.”
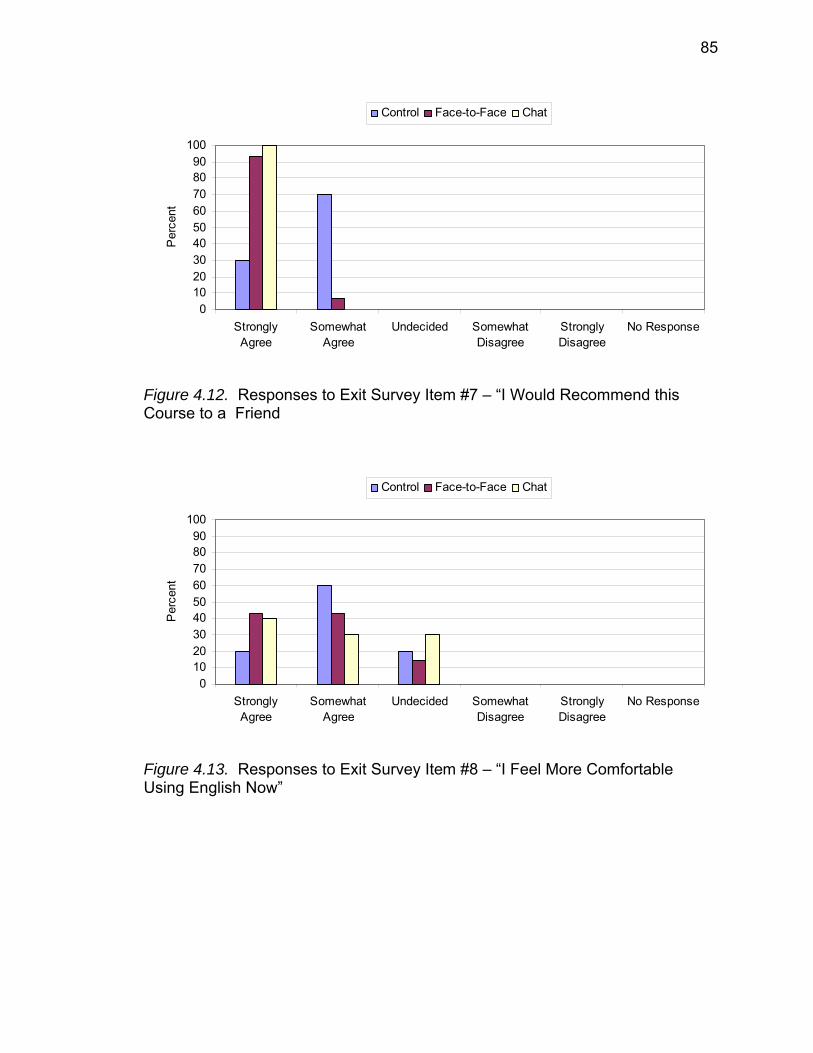
85
0102030405060708090
100
StronglyAgree
SomewhatAgree
Undecided SomewhatDisagree
StronglyDisagree
No Response
Per
cent
Control Face-to-Face Chat
Figure 4.12. Responses to Exit Survey Item #7 – “I Would Recommend this Course to a Friend
0102030405060708090
100
StronglyAgree
SomewhatAgree
Undecided SomewhatDisagree
StronglyDisagree
No Response
Per
cent
Control Face-to-Face Chat
Figure 4.13. Responses to Exit Survey Item #8 – “I Feel More Comfortable Using English Now”
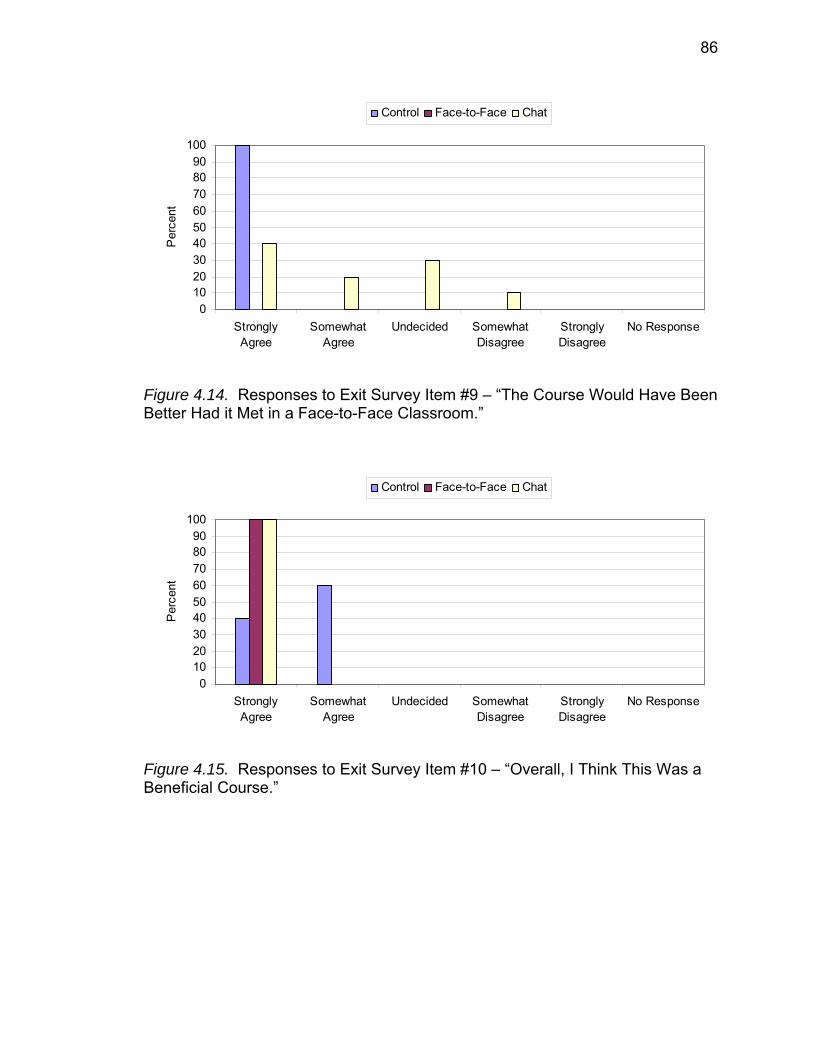
86
0102030405060708090
100
StronglyAgree
SomewhatAgree
Undecided SomewhatDisagree
StronglyDisagree
No Response
Per
cent
Control Face-to-Face Chat
Figure 4.14. Responses to Exit Survey Item #9 – “The Course Would Have Been Better Had it Met in a Face-to-Face Classroom.”
0102030405060708090
100
StronglyAgree
SomewhatAgree
Undecided SomewhatDisagree
StronglyDisagree
No Response
Per
cent
Control Face-to-Face Chat
Figure 4.15. Responses to Exit Survey Item #10 – “Overall, I Think This Was a Beneficial Course.”

87
0102030405060708090
100
StronglyAgree
SomewhatAgree
Undecided SomewhatDisagree
StronglyDisagree
No Response
Per
cent
Control Face-to-Face Chat
Figure 4.16. Responses to Exit Survey Item #11 – “I am proficient at Typing.”
0102030405060708090
100
StronglyAgree
SomewhatAgree
Undecided SomewhatDisagree
StronglyDisagree
No Response
Per
cent
Control Face-to-Face Chat
Figure 4.17. Responses to Exit Survey Item #12 – “I am Proficient at Using Computers.”
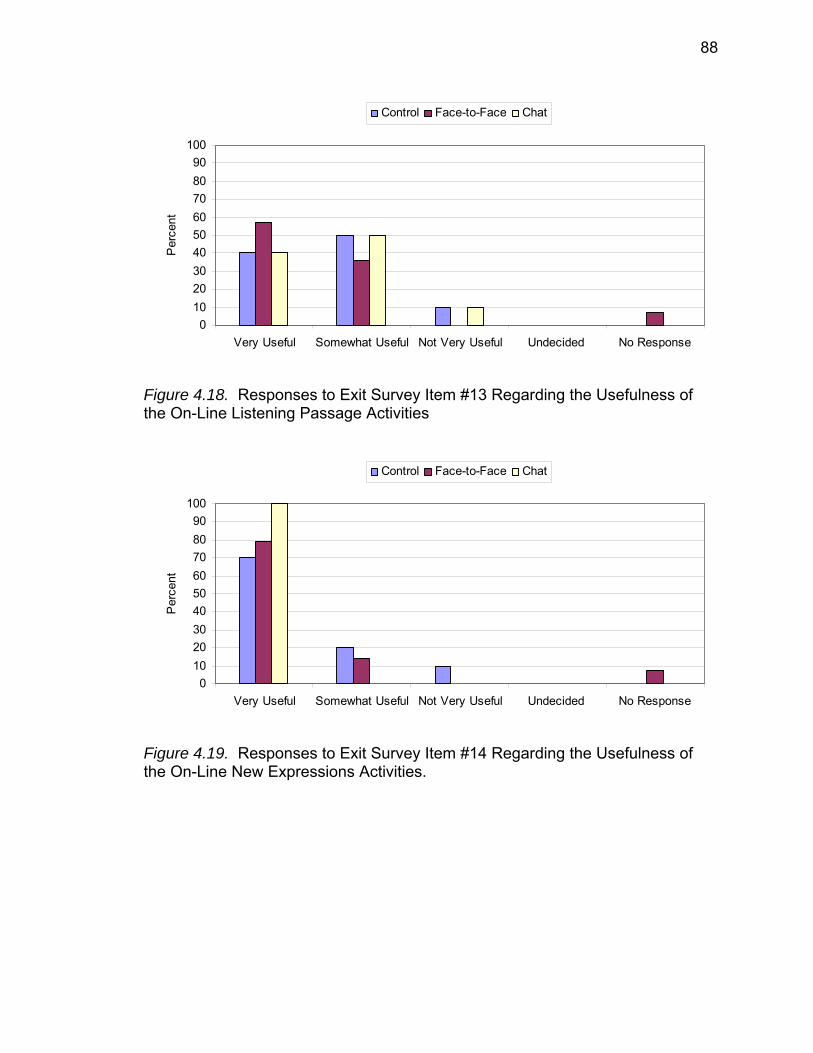
88
0102030405060708090
100
Very Useful Somewhat Useful Not Very Useful Undecided No Response
Per
cent
Control Face-to-Face Chat
Figure 4.18. Responses to Exit Survey Item #13 Regarding the Usefulness of the On-Line Listening Passage Activities
0102030405060708090
100
Very Useful Somewhat Useful Not Very Useful Undecided No Response
Per
cent
Control Face-to-Face Chat
Figure 4.19. Responses to Exit Survey Item #14 Regarding the Usefulness of the On-Line New Expressions Activities.
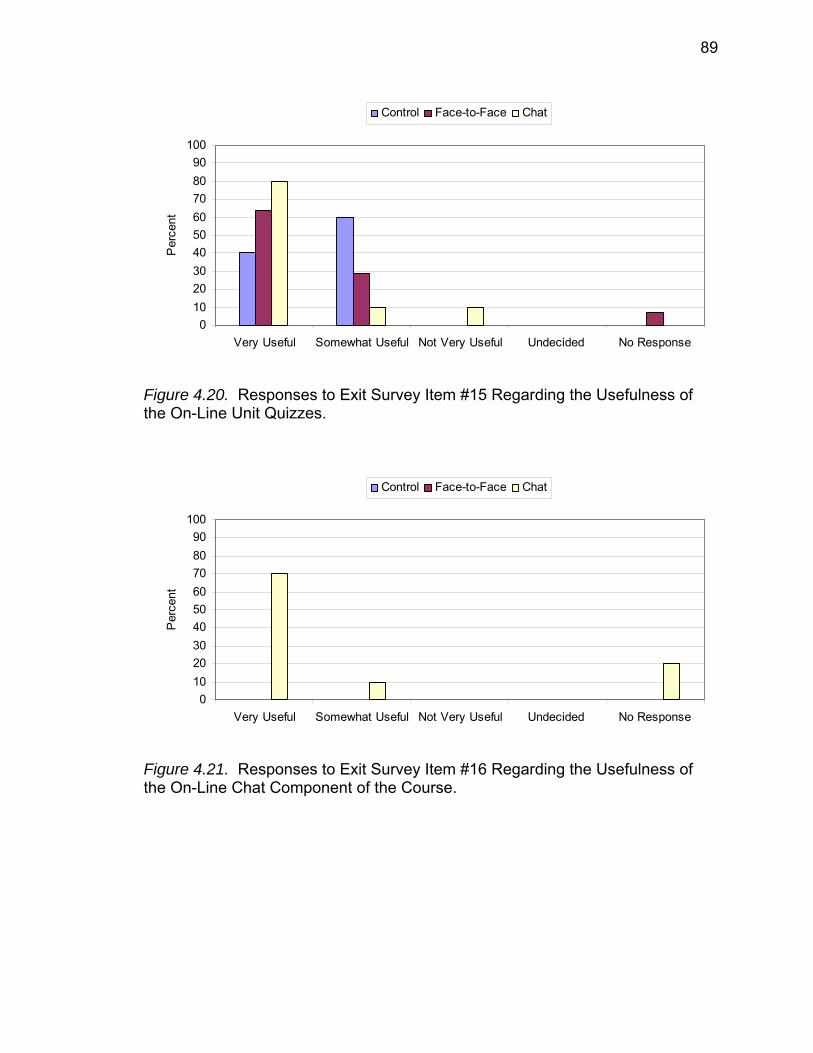
89
0102030405060708090
100
Very Useful Somewhat Useful Not Very Useful Undecided No Response
Per
cent
Control Face-to-Face Chat
Figure 4.20. Responses to Exit Survey Item #15 Regarding the Usefulness of the On-Line Unit Quizzes.
0102030405060708090
100
Very Useful Somewhat Useful Not Very Useful Undecided No Response
Per
cent
Control Face-to-Face Chat
Figure 4.21. Responses to Exit Survey Item #16 Regarding the Usefulness of the On-Line Chat Component of the Course.
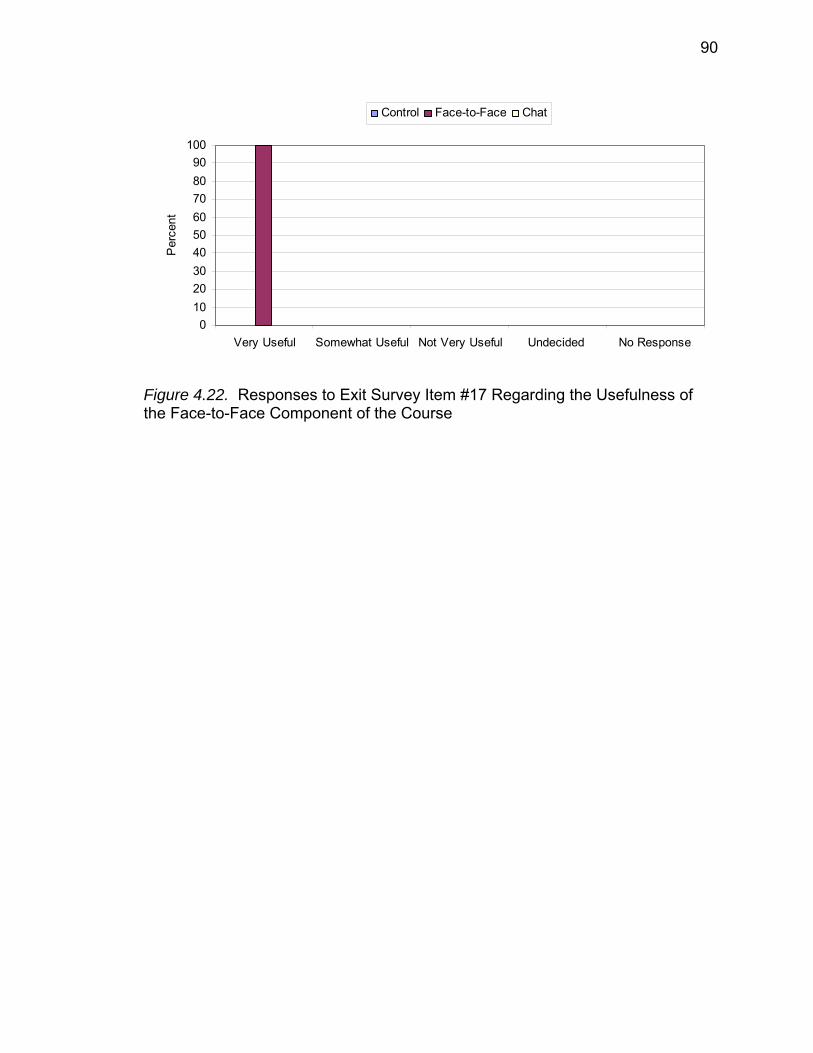
90
0102030405060708090
100
Very Useful Somewhat Useful Not Very Useful Undecided No Response
Per
cent
Control Face-to-Face Chat
Figure 4.22. Responses to Exit Survey Item #17 Regarding the Usefulness of the Face-to-Face Component of the Course
91
CHAPTER 5. DISCUSSION
5.1. Introduction
This chapter presents the research findings from the previous chapter in
context and provides explanations for what was observed in the study. First, the
three research hypothesis are revisited and analyzed in light of the data that was
collected and analyzed. Second, using the same data, the five temporal
variables are analyzed and tentative conclusions are drawn about which of these
variables was the most effective for analyzing fluency. Third, the results from the
exit survey are discussed in more detail. Next, the weaknesses of the study and
research design are presented and suggestions are given for similar research in
the future. Finally, the chapter concludes by discussing the potential implications
of this research in the design and delivery of ESL curriculums and distance
learning environments.
5.2. Results of Hypothesis Testing
Hypothesis 1: Participants in the Face-to-Face group will demonstrate higher
fluency gain scores than those in the Control group.
Significance was not found on any of the temporal variable measures
when comparing the gain scores of the Face-to-Face and Control group and so
the first hypothesis could not be confirmed. The relatively low effect sizes for the
fluency measures also indicates that the instructional condition did not have a
substantial influence on fluency improvement in the two groups.
92
Although not directly related to the main research question, this
hypothesis was important to the study due to it being rooted in the underlying
assumption that fluency in a language improves through use of the language.
There are several possible explanations for the surprisingly low fluency gains in
the Face-to-Face group. First, it could be argued that the treatment period (e.g.
length of the course) was too short. Perhaps if the course had taken place over
a period of one semester, greater gains in fluency could have been detected.
This potential shortcoming of the study is addressed in a later section of this
chapter. However, it is not a plausible explanation for the relatively low fluency
gains in the Face-to-Face group, especially when considering that much higher
gains were demonstrated by the Internet Chat group during the same six-week
period. For the same reason, the alternative explanation—that the temporal
variables were not adequate or valid for measuring gains in fluency gains—
should also be rejected. If the temporal variables were useful for detecting
fluency gains in the Internet Chat group, then it would seem that the variables
should be useful in the other groups as well.
A more likely explanation for the minimal gains in fluency in the Face-to-
Face group relates to the limitations that are inherent to the face-to-face learning
environment. Unlike the text-based chat environment in which participants do
not need to adhere to rules of turn taking, the discourse conventions in a
traditional environment limit the class discussion to only one speaker at a time.
This was confirmed by the researcher who observed that participants in the face-
to-face classes were restricted to far fewer turns to use English than participants
in the on-line chat classroom. If improvement in fluency is indeed dependent on
use of the language, as research and common sense suggests, it is
understandable why the Face-to-Face group made relatively small gains in
fluency, given the structure of the course. The implications of these observations
for the design of face-to-face and on-line ESL courses are discussed later in this
chapter.
93
Hypothesis 2: Participants in the Internet Chat group will demonstrate higher
fluency gain scores than those in the Control group.
Support for the second hypothesis was found on the phonation time ratio
measure (t (31) = 2.758, p=.005) and mean length of run measure (t (31) =
2.455, p= .010). The effect size for the chat environment variable was
exceptionally high for both the phonation time ratio variable (1.24) and the mean
length of run variable (1.43). According to the percentile equivalents, an effect
size of 1.43 places the average Internet Chat group gain score at nearly the 93rd
percentile of scores in the Control group.
Unlike the first hypothesis which played a peripheral role in the study, the
second hypothesis (along with the third) was central to the main research
question (e.g. can fluency be improved though the medium of a text-based
internet chat environment?) The significantly higher gain scores of the Internet
Chat group on two of the measures provide support for the notion that oral
fluency improvement is indeed possible within a text-based chat environment.
The strong fluency gains in the Internet Chat group compared to those in
the Control group can be explained by the fact that the Internet Chat group
participants were communicating in English with other class members (during
class sessions) over the six-week course period whereas the Control group
participants were studying independently and not using English to communicate
with each other. Although it is true that the participants in the Internet Chat group
were not speaking to each other via vocal utterances, they were in-fact, engaging
in a form of real-time communication that required effective access of the lexicon
as detailed in Levelt’s (1989) model of language production. These findings are
consistent with those in Payne and Whitney (2002), one of the only other studies
to examine the development of oral proficiency in a chat environment.
Hyothesis 3: Participants in the Internet Chat group will demonstrate higher
fluency gain scores than those in the Face-to-Face group.
94
Support was also found for the final hypothesis with the Internet Chat
group demonstrating significantly higher gains scores than the Face-to-Face
group on the phonation time ratio (t (31) = 2.016, p = .026) and mean length of
run (t (31) = 2.160, p = .020) measure. The effect size on both of these variables
was approximately .80 which is considered to be relatively large.
Although the third hypothesis was not as strongly supported by the data
as the second hypothesis, one may argue that the findings are still impressive—
especially when considering that on-line chat instruction was being compared
with face-to-face instruction which has traditionally been considered the sine qua
non of fluency instruction. The descriptive statistics presented in Tables 4.1-4.5
reveal that the Internet Chat group made higher average gain scores than the
Face-to-Face group on all five measures. As discussed in the next section, it is
likely that statistical significance would have been attained on additional fluency
variables for this hypothesis if the sample size had been larger.
There are several explanations for the stronger gains in fluency
demonstrated in the Internet Chat group. One explanation is that the Face-to-
Face group did not have as much opportunity to use English during the class
periods as the Internet Chat group. As already discussed, the six to eight
participants in each of the Face-to-Face groups were seated around a large
table. During class discussions, each member waited and listened while another
class member took a turn. This structure limited the average participation in a
one hour period to perhaps only three or four turns per participant, depending on
how long each participant spoke. In the Internet Chat group, however, turn-
taking was not observed and participants contributed their ideas simultaneously.
In fact, as participants became interested in the discussion topic, it was common
for several responses to appear on the monitor in rapid sequence. Of course this
is possible and even appropriate in a chat room environment where it is difficult
and even undesirable to structure the course in such a way that all of the
participants stare at a blank screen while waiting for one of the class members to
type a response. Such an environment would create long moments of delay and
95
reduce the effectiveness of the course. The inherent difference between the two
environments in this regard made it possible for the Internet Chat group
participants to use English far more in the chat environment than in the face-to-
face environment.
A second explanation for the higher gains in fluency in the Internet Chat
group again relates to the nature of the chat environment. As mentioned in
Chapter 2, other studies have shown that on-line chat environments tend to
reduce the barriers that inhibit communication in a traditional discussion
environment. For example, second language learners are sometimes reluctant
to speak in a group because they are afraid of making mistakes or not having the
“right words” to express their meaning. The pressure of having to use English
while other class members are waiting and watching may reduce the degree to
which English is used in any given classroom. The on-line chat environment
reduces these concerns by giving students more privacy as they frame their
ideas and put together their thoughts in the second language. This is reflected
on the exit survey of one Internet Chat group participant who commented that his
/ her English had improved “because of typing English freely (and) not caring my
mistakes so much” (see Appendix L, Number 7).
A third possible explanation for the stronger fluency gains in the Internet
Chat group again relates to the chat room learning environment and is illustrated
by the following comment from a Internet Chat group participant on the exit
survey “I learned the English by using my eyes, hands (typing), and hearing
[student referring to the on-line listening activities]. It worked very much”
(Appendix L, Number 5). As demonstrated in this comment, one potential
advantage of the chat environment is that the learner is able to see the words
and sentences that are being generated by the instructor and the other
participants in the course. When the instructor corrects a grammatical or
vocabulary mistake, the correction can be readily seen. In the face-to-face
environment, the instructor’s corrections or “recasts” may go unnoticed, or
96
perhaps the students may have difficulty comprehending the nature of the
correction since they hear it only for a moment.
Indeed, it seems that the text- based chat room environment would be
especially helpful for learners who process information better when it is
presented in a visual form. Although the researcher / instructor made frequent
use of a white board in the face-to-face classroom to write down new vocabulary
items and their definitions, it was obviously infeasible to display every sentence
that was being uttered by the instructor and participants during the class. This
key difference between the text-based chat and face-to-face learning
environments should be explored in future research.
5.3. Evaluation of the Fluency Variables
Five fluency variables were selected for this study based on their
dominance in the literature. Analysis of the data from this study reveals that the
five variables performed quite differently as measures of fluency. A closer
examination of these variables is necessary for determining which variables (or
combination of variables) should be employed in future research of this kind. In
this section, two aspects of these variables are examined: 1) the degree to
which each of the variables yielded statistical significance for fluency gains, 2)
the degree to which each of the five variables correlated with the other fluency
measures.
5.3.1. Statistical Significance of Fluency Variables
Statistical significance is an indicator of the probability that an observed
difference between two groups occurred by chance. The degree to which the
fluency variables in this study yielded statistically significant results depended on
several factors. First, the number of participants played an important role. The
smaller the sample size, the more difficult it is to detect differences between
97
groups. Because this study had a relatively small sample size of 34 participants,
it was much more difficult to attain statistical significance for group difference on
the various fluency gains scores. Another factor that influenced the statistical
significance of the findings was the actual performance of participants in the
study. For obvious reasons, if all three groups of participants in the study made
similar gains in fluency from the pretest to posttest on a certain variable, then the
F scores on that variable would not be significant. Finally, statistical significance
in a study like this is affected by the number of variables employed in the study.
When more than one variable is used in a study, the Alpha level is typically
lowered to reduce the chance that a Type 1 error is made (e.g. falsely concluding
that difference between group exists). In this study, applying the Bonferonni
adjustment would have reduced the Alpha level to .017 (.05 / 3) for any one
variable—making it impossible to claim statistical significance on any of the
variables. In future studies as this one, this factor will be taken into consideration
in order to increase the statistical power.
The greatest differences between the three groups in this study were
detected on the mean length of run and phonation time ratio variables. Although
it was not significant at the .05 alpha level, the performance of the speaking rate
variable also was relatively strong with a p value on the ANOVA of .074 (see
Table 4.8). This is consistent with other studies discussed in Chapter 2 which
found these three variables to be the strongest predictors of fluency. To better
understand why the differences between the three groups were most significant
at these variable levels, it is useful to examine the data for the individual
participants in each of the three groups.
As seen in Table 5.1, for each group of participants, the percent
improvement in fluency scores from the pretest to the posttest was highest for
the mean length of run variable with the Control group making an average gain of
nine percent, the Face-to-Face group making an average gain of 20 percent, and
the Internet Chat group making an average gain of 40 percent. The second
highest gains were made on the variable of speaking rate with the Control group
98
making an average gain of six percent, the Face-to-Face group making an
average gain of 17 percent, and the Internet Chat group making an average gain
of 22 percent. (These close percentage values for the Face-to-Face and Internet
Chat groups are a likely reason why speaking rate was not found to be significant
in the one-way ANOVA). Lower overall gains were made on the measures of
phonation time ratio and average length of pauses, and articulation rate showed
the smallest pretest to posttest variation with an average increase of only four
percent across the three groups. It should be emphasized that although the
degree of improvement was noticeably different for the three groups, the relative
improvement among the five variables was remarkably consistent across groups.
Considering the information already presented on the statistical significance of
the variables, this allows for several conclusions to be drawn.
First, it appears that gains in fluency are indeed best measured through
the mean length of run (MLR) variable. Even for the Control group which
demonstrated minimal overall improvement from pretest to posttest, the strongest
gains were still made on the this measure. Towell et al. (1996) has hypothesized
that MLR is the single best indicator that proceduralization of knowledge has
taken place at the formulator level. In their qualitative analysis of the data, the
authors find some indication that improvement in the length (e.g. density) of
speech run is associated with increased efficiency in sentence building through
the use of prefabricated syntactic units. Although it is beyond the scope of this
study to analyze and compare the run of speech that were produced by
participants in the pretest and posttest speech samples, one may speculate that
the increased MLR scores were accompanied by increased use of prefabricated
expressions which according to Pawley and Syder (1983) is a hallmark of fluent
speech production. Given that all three groups in the six week course were
involved in vocabulary and listening activities—both of which seem conducive to
improving the use of prefabricated expressions—it is understandable why the
strongest gains posted by all three groups were at the MLR level.
99
A second conclusion that may be drawn from this data is that articulation
rate (AR) is a relatively weak indicator of fluency development. As seen in Table
5.1, the average gain for AR across all three groups was only four percent or
roughly a tenth of a syllable per second. At the same time, a number of
participants who made strong gains on the MLR variable actually had a decrease
in articulation from the pretest to posttest (e.g. Chat 1, Chat 6, Face 4). This
finding supports the hypothesis put forward by Towel et al. that gains in AR can
be attributed to proceduralization at the articulator level (e.g. the speaker become
adept at uttering words rapidly) rather than proceduralization at the formulator
level as already discussed. The fact that the strongest (although still small) gains
in articulation rate were demonstrated by the Face-to-Face group is also worth
noting here. If articulation rate is strictly related to development at the Aritculator
level in Levelt’s model, then it is not surprising that the group with the highest
overall gains was the group that was actually using the articulator in the
classroom sessions to produce speech. By regularly engaging the mouth
musculature to produce speech, one may hypothesize that the Face-to-Face
group was able to become more comfortable in articulating sounds and thereby
develop proceduralization at this level.
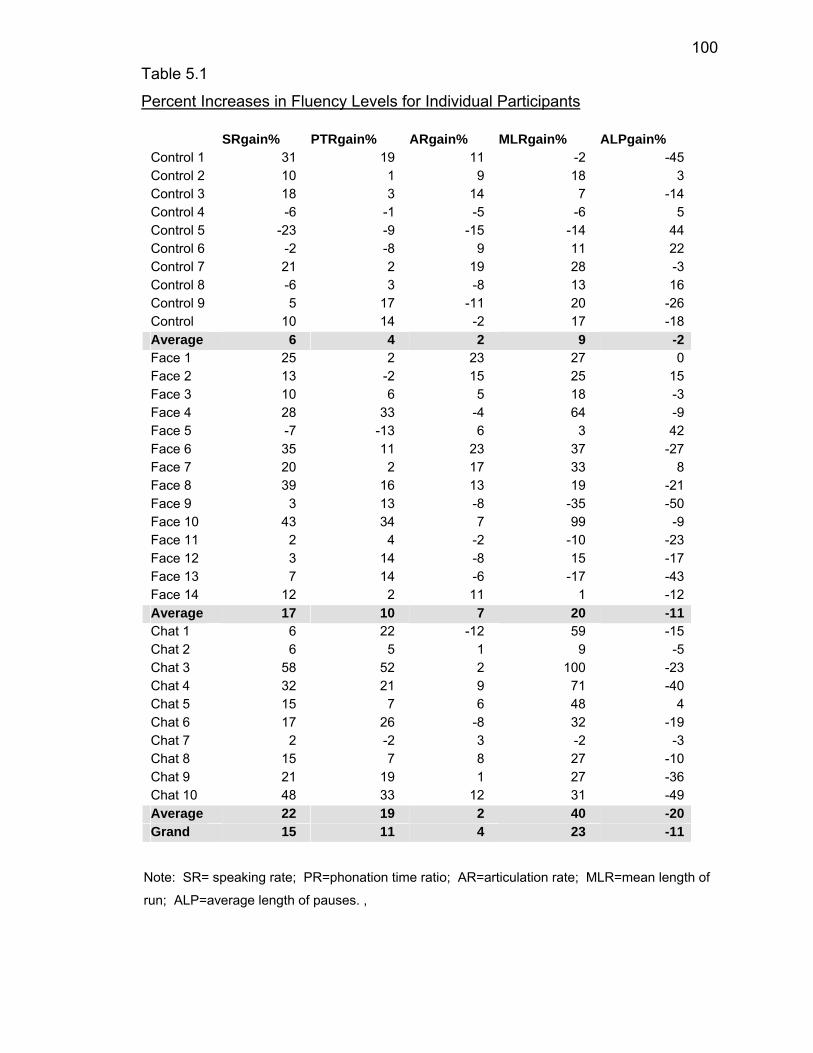
100
musculature in the classroom setting to articulate English sounds, one may
Note: SR= speaking rate; PR=phonation time ratio; AR=articulation rate; MLR=mean length of
run; ALP=average length of pauses. ,
SRgain% PTRgain% ARgain% MLRgain% ALPgain% Control 1 31 19 11 -2 -45Control 2 10 1 9 18 3Control 3 18 3 14 7 -14Control 4 -6 -1 -5 -6 5Control 5 -23 -9 -15 -14 44Control 6 -2 -8 9 11 22Control 7 21 2 19 28 -3Control 8 -6 3 -8 13 16Control 9 5 17 -11 20 -26Control 10 14 -2 17 -18Average 6 4 2 9 -2Face 1 25 2 23 27 0Face 2 13 -2 15 25 15Face 3 10 6 5 18 -3Face 4 28 33 -4 64 -9Face 5 -7 -13 6 3 42Face 6 35 11 23 37 -27Face 7 20 2 17 33 8Face 8 39 16 13 19 -21Face 9 3 13 -8 -35 -50Face 10 43 34 7 99 -9Face 11 2 4 -2 -10 -23Face 12 3 14 -8 15 -17Face 13 7 14 -6 -17 -43Face 14 12 2 11 1 -12Average 17 10 7 20 -11Chat 1 6 22 -12 59 -15Chat 2 6 5 1 9 -5Chat 3 58 52 2 100 -23Chat 4 32 21 9 71 -40Chat 5 15 7 6 48 4Chat 6 17 26 -8 32 -19Chat 7 2 -2 3 -2 -3Chat 8 15 7 8 27 -10Chat 9 21 19 1 27 -36Chat 10 48 33 12 31 -49Average 22 19 2 40 -20Grand 15 11 4 23 -11
Table 5.1
Percent Increases in Fluency Levels for Individual Participants
101
Finally, the data indicates that the average length of pauses (ALP)
measure may be most meaningful when considered together with the MLR
variable. As seen in table 5.1, of the five participants in the Control group who
had an increase in ALP from pretest to posttest (Control 2,4,5,6,8), two (Control
4,5) demonstrated declines on the MLR variable. However, of the three
participants in the Face-to-Face group (Face 2,5,7) and one participant in the
Internet Chat group (Chat 5) who demonstrated an increase in the ALP variable,
all demonstrated increases on the MLR variable. This suggests that the ESL
learners who participated in the Face-to-Face and Internet Chat groups were
able to make better use of their increased pause times on the posttest—perhaps
using the longer pauses to plan what to say in the subsequent run of speech.
This finding is supported by Towell et al. (1996) who posit the notion that
proceduralization of knowledge at the formulator level is best indicated when a
speaker demonstrates an increase in phonation time ratio and mean length of
run while decreasing or showing no change on the average length of pause
variable.
5.4. Correlation of Fluency Variables
Another way to reflect on the five fluency variables that were used in this
study is to examine their correlation with one another. By examining the
variables in this way and determining which variable(s) are the most efficient
predictors of fluency, it may be possible to reduce the number of variables used
in future studies of this kind and thereby increase the potential significance of the
findings overall. Towel et al. have stated that the speaking rate variable is the
best overall indicator that proceduralization of knowledge has taken place
somewhere within Levelt’s model (e.g. at either the Conceptualizer, Formulator,
or Articulator levels). Although a rationale is not given, if this is true, it seem
logical that it is due to a strong correlation of speaking rate with the other four
fluency variables –various combination of which the authors argue are indicative
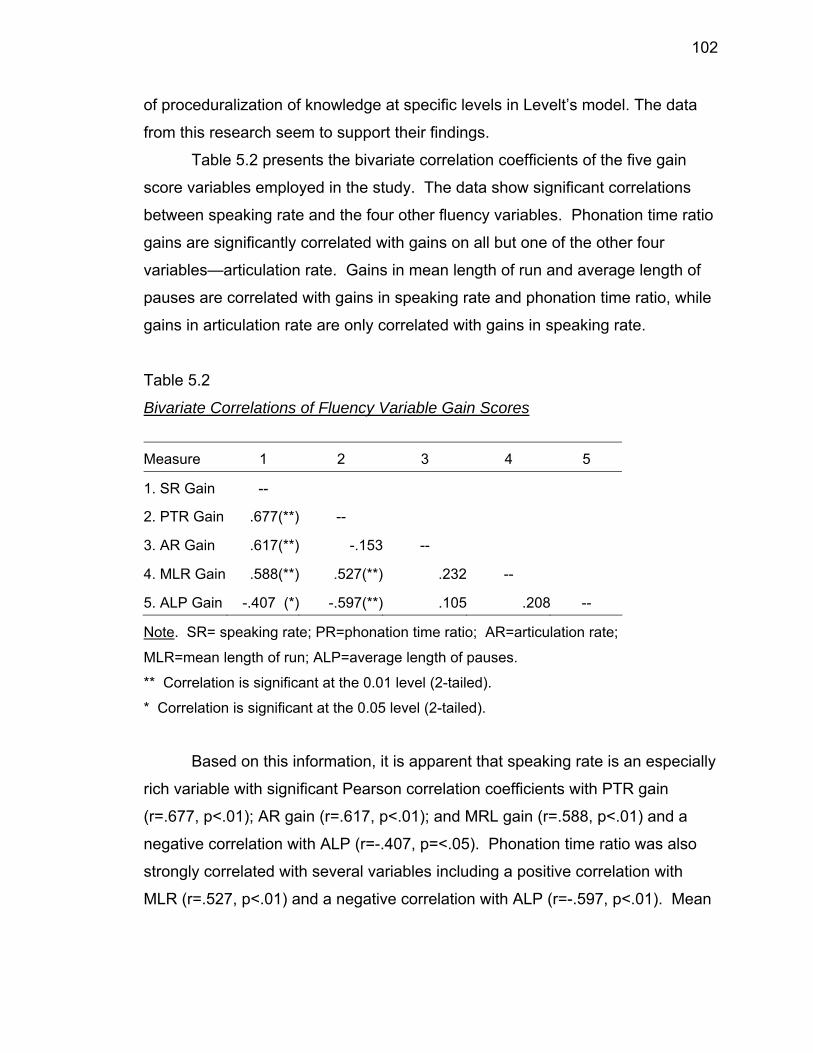
102
of proceduralization of knowledge at specific levels in Levelt’s model. The data
from this research seem to support their findings.
Table 5.2 presents the bivariate correlation coefficients of the five gain
score variables employed in the study. The data show significant correlations
between speaking rate and the four other fluency variables. Phonation time ratio
gains are significantly correlated with gains on all but one of the other four
variables—articulation rate. Gains in mean length of run and average length of
pauses are correlated with gains in speaking rate and phonation time ratio, while
gains in articulation rate are only correlated with gains in speaking rate.
Table 5.2
Bivariate Correlations of Fluency Variable Gain Scores
Measure 1 2 3 4 5
1. SR Gain --
2. PTR Gain .677(**) --
3. AR Gain .617(**) -.153 --
4. MLR Gain .588(**) .527(**) .232 --
5. ALP Gain -.407 (*) -.597(**) .105 .208 --
Note. SR= speaking rate; PR=phonation time ratio; AR=articulation rate;
MLR=mean length of run; ALP=average length of pauses.
** Correlation is significant at the 0.01 level (2-tailed).
* Correlation is significant at the 0.05 level (2-tailed).
Based on this information, it is apparent that speaking rate is an especially
rich variable with significant Pearson correlation coefficients with PTR gain
(r=.677, p<.01); AR gain (r=.617, p<.01); and MRL gain (r=.588, p<.01) and a
negative correlation with ALP (r=-.407, p=<.05). Phonation time ratio was also
strongly correlated with several variables including a positive correlation with
MLR (r=.527, p<.01) and a negative correlation with ALP (r=-.597, p<.01). Mean
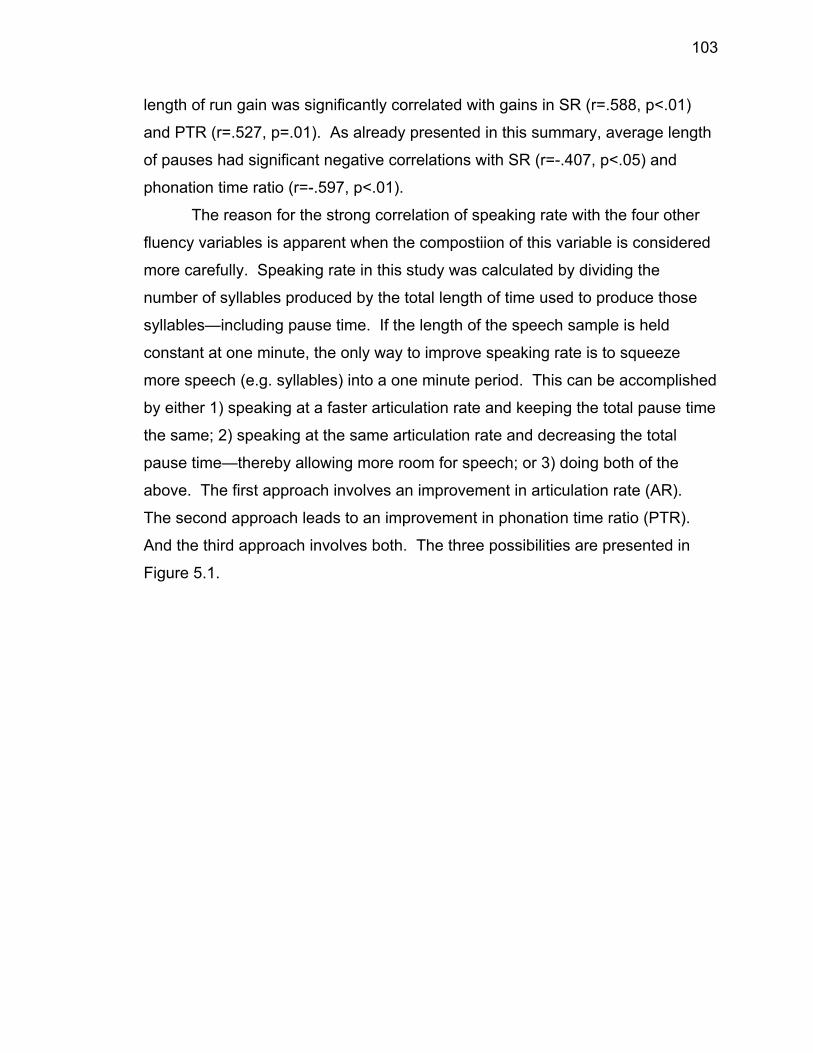
103
length of run gain was significantly correlated with gains in SR (r=.588, p<.01)
and PTR (r=.527, p=.01). As already presented in this summary, average length
of pauses had significant negative correlations with SR (r=-.407, p<.05) and
phonation time ratio (r=-.597, p<.01).
The reason for the strong correlation of speaking rate with the four other
fluency variables is apparent when the compostiion of this variable is considered
more carefully. Speaking rate in this study was calculated by dividing the
number of syllables produced by the total length of time used to produce those
syllables—including pause time. If the length of the speech sample is held
constant at one minute, the only way to improve speaking rate is to squeeze
more speech (e.g. syllables) into a one minute period. This can be accomplished
by either 1) speaking at a faster articulation rate and keeping the total pause time
the same; 2) speaking at the same articulation rate and decreasing the total
pause time—thereby allowing more room for speech; or 3) doing both of the
above. The first approach involves an improvement in articulation rate (AR).
The second approach leads to an improvement in phonation time ratio (PTR).
And the third approach involves both. The three possibilities are presented in
Figure 5.1.
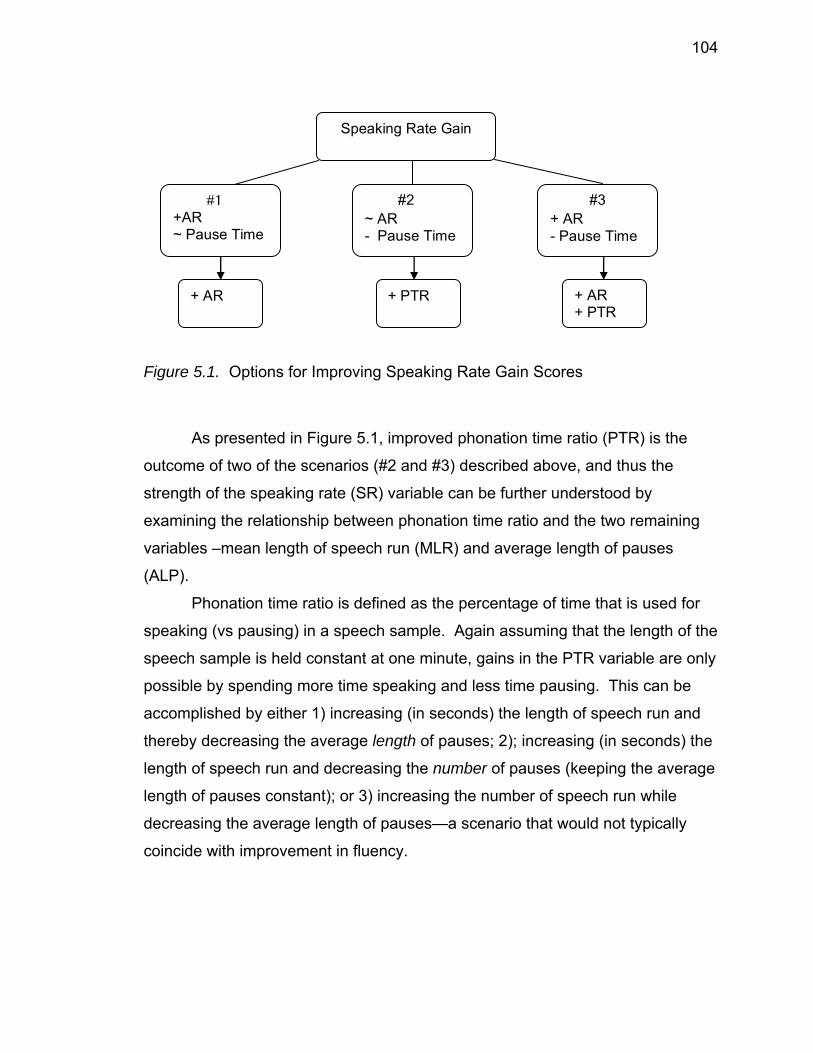
104
Figure 5.1. Options for Improving Speaking Rate Gain Scores
As presented in Figure 5.1, improved phonation time ratio (PTR) is the
outcome of two of the scenarios (#2 and #3) described above, and thus the
strength of the speaking rate (SR) variable can be further understood by
examining the relationship between phonation time ratio and the two remaining
variables –mean length of speech run (MLR) and average length of pauses
(ALP).
Phonation time ratio is defined as the percentage of time that is used for
speaking (vs pausing) in a speech sample. Again assuming that the length of the
speech sample is held constant at one minute, gains in the PTR variable are only
possible by spending more time speaking and less time pausing. This can be
accomplished by either 1) increasing (in seconds) the length of speech run and
thereby decreasing the average length of pauses; 2); increasing (in seconds) the
length of speech run and decreasing the number of pauses (keeping the average
length of pauses constant); or 3) increasing the number of speech run while
decreasing the average length of pauses—a scenario that would not typically
coincide with improvement in fluency.
+ AR + PTR + AR + PTR
Speaking Rate Gain
~ AR - Pause Time
+AR ~ Pause Time
+ AR - Pause Time
#1 #2 #3
105
Assuming that the articulation rate remains constant or increases, two of
the above scenarios will be accompanied by an increase in mean length of run
(MLR) (e.g. longer speech run lead to more syllables per run) and two of the
scenarios will also involve a decrease in the average length of pauses (ALP).
Hence the strong correlation between gains in phonation time ratio and gains in
the MLR and ALP variables. The three possibilities are displayed in Figures 5.2
and 5.3.
Figure 5.2. Options for Improving Phonation Time Ratio Gain Scores
Phonation Time Ratio Gain
+ Run Time ~ ALP - Pause #
+Run Time - ALP ~Pause #
~ Run Time - ALP + Pause #
+ MLR - ALP
+ MLR - ALP
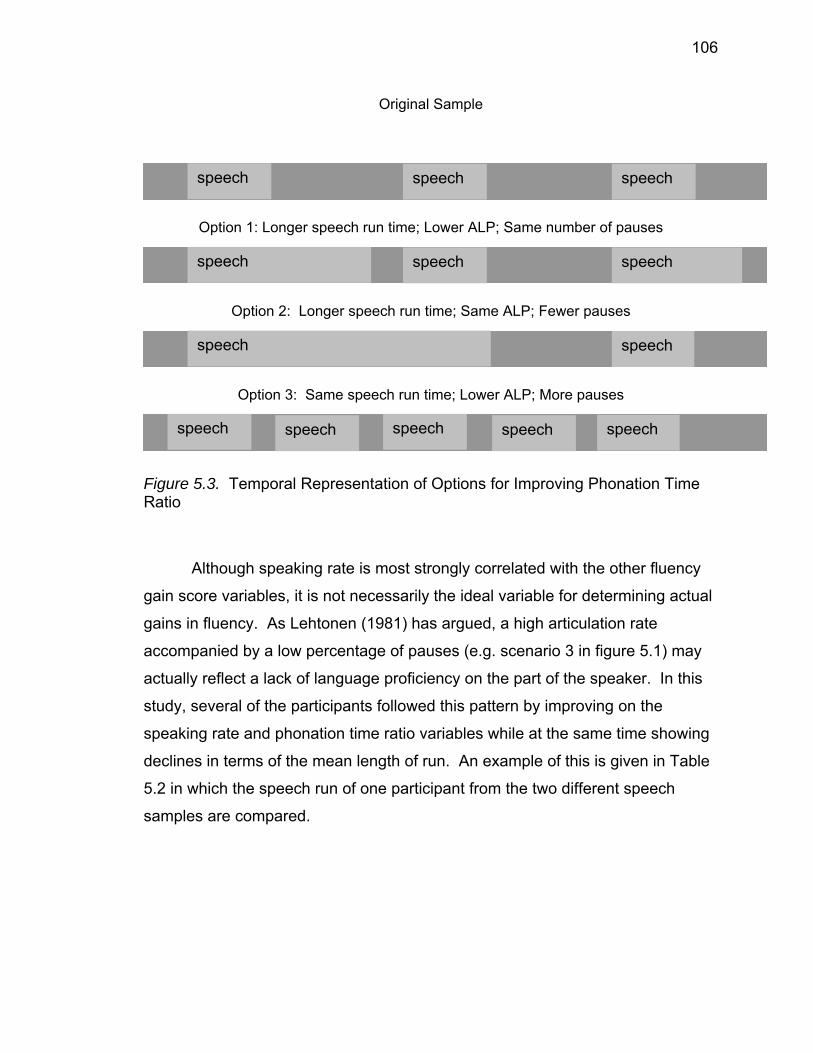
106
Original Sample
Option 1: Longer speech run time; Lower ALP; Same number of pauses
Option 2: Longer speech run time; Same ALP; Fewer pauses
Option 3: Same speech run time; Lower ALP; More pauses
Figure 5.3. Temporal Representation of Options for Improving Phonation Time Ratio
Although speaking rate is most strongly correlated with the other fluency
gain score variables, it is not necessarily the ideal variable for determining actual
gains in fluency. As Lehtonen (1981) has argued, a high articulation rate
accompanied by a low percentage of pauses (e.g. scenario 3 in figure 5.1) may
actually reflect a lack of language proficiency on the part of the speaker. In this
study, several of the participants followed this pattern by improving on the
speaking rate and phonation time ratio variables while at the same time showing
declines in terms of the mean length of run. An example of this is given in Table
5.2 in which the speech run of one participant from the two different speech
samples are compared.
speech speech speech
speech speech speech
speech speech
speech speech speech speech speech
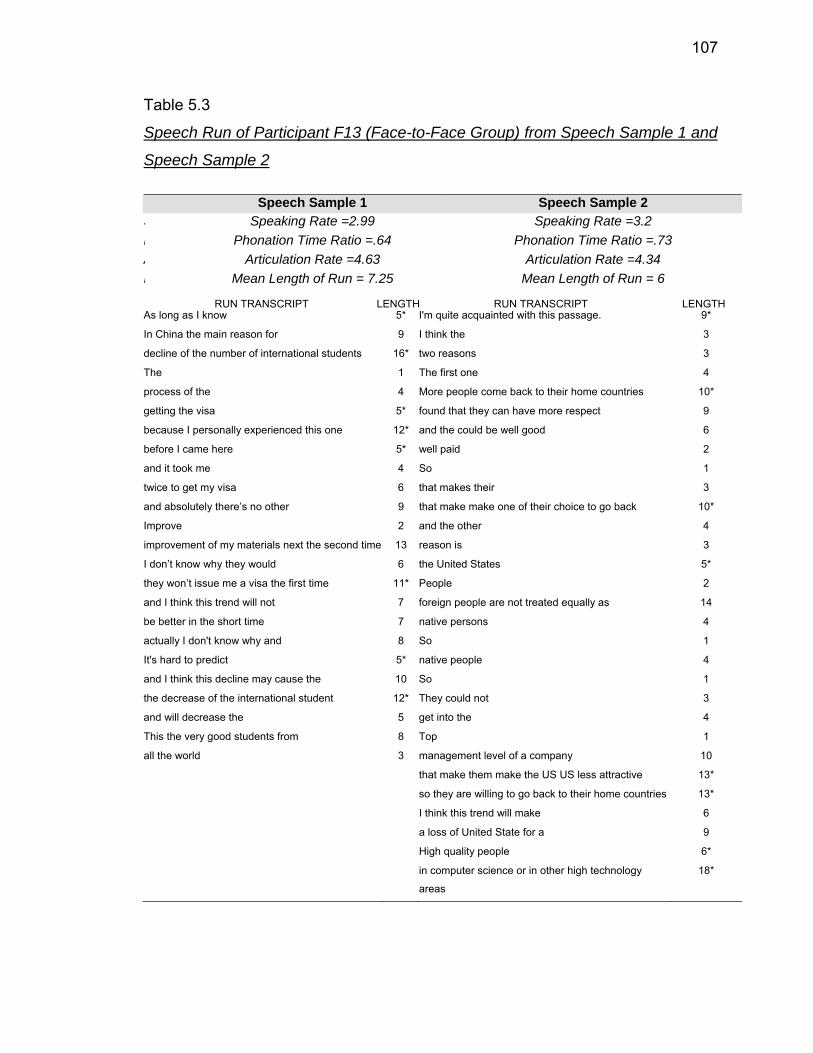
107
Table 5.3
Speech Run of Participant F13 (Face-to-Face Group) from Speech Sample 1 and
Speech Sample 2
S Speech Sample 1 Speech Sample 2 S Speaking Rate =2.99 Speaking Rate =3.2 P Phonation Time Ratio =.64 Phonation Time Ratio =.73 A Articulation Rate =4.63 Articulation Rate =4.34 M Mean Length of Run = 7.25 Mean Length of Run = 6
RUN TRANSCRIPT LENGTH RUN TRANSCRIPT LENGTH As long as I know 5* I'm quite acquainted with this passage. 9*
In China the main reason for 9 I think the 3
decline of the number of international students 16* two reasons 3
The 1 The first one 4
process of the 4 More people come back to their home countries 10*
getting the visa 5* found that they can have more respect 9
because I personally experienced this one 12* and the could be well good 6
before I came here 5* well paid 2
and it took me 4 So 1
twice to get my visa 6 that makes their 3
and absolutely there’s no other 9 that make make one of their choice to go back 10*
Improve 2 and the other 4
improvement of my materials next the second time 13 reason is 3
I don’t know why they would 6 the United States 5*
they won’t issue me a visa the first time 11* People 2
and I think this trend will not 7 foreign people are not treated equally as 14
be better in the short time 7 native persons 4
actually I don't know why and 8 So 1
It's hard to predict 5* native people 4
and I think this decline may cause the 10 So 1
the decrease of the international student 12* They could not 3
and will decrease the 5 get into the 4
This the very good students from 8 Top 1
all the world 3 management level of a company 10
that make them make the US US less attractive 13*
so they are willing to go back to their home countries 13*
I think this trend will make 6
a loss of United State for a 9
High quality people 6*
in computer science or in other high technology
areas
18*
108
Although the participant in Table 5.3 spoke at a faster rate and uttered
more total syllables in the second speech sample (181 vs 174), a higher
percentage of the speech run were five syllables or fewer in length (57% in
Sample 2 vs 42% in Sample 1) and a smaller percentage of run were 12
syllables or longer (13% in Sample 1 vs 17% in Sample 2). It should also be
noted that fewer of the pauses in the second speech sample occurred at phrasal
boundaries (26% in Sample 2 vs 33% in Sample 1). In summary, although this
speaker improved her speaking rate from the first to second speech sample, the
speech run that were uttered tended to be shorter in length and were more
frequently interrupted by pauses that did not fall at grammatical boundaries. This
information, together with the information about mean length of run presented in
the previous section, point to the advantages of using mean length of run in
future studies on fluency.
5.5. Discussion of Exit-Survey Results
The exit surveys were important in that they provided insight into the
impressions that each participant had toward the learning environment to which
she or he had been assigned. As discussed in Chapter 2, considerable research
has been already been done on the attitudes of learners regarding various types
of distance learning environments. Such research has immediate application for
course designers and instructors who can use this information to make their
distance courses more appealing to the learners. Several observations from the
current study may enhance this body of knowledge.
First, data from the exit surveys suggest that learner impressions of a
distance learning course do not necessarily match the measurable learning
outcomes. Although the participants in the Internet Chat group made
significantly stronger gains in fluency than the participants in the Face-to-Face
group, the exit surveys show that participants in the Face-to-Face group were
more confident that they had made gains in fluency. Participants in the Face-to-
109
Face group were also more confident that they had developed their listening
ability during the course, although these and the other learning outcomes
mentioned on the survey were not measured over the six-week period. A
plausible explanation for the discrepancy between the survey results and the
actual measured fluency outcomes is that second language students have a bias
against distance learning environments that claim to improve oral language
ability. This would not be surprisingly considering the fact that nearly all of the
current approaches to building second language oral proficiency are based on a
face-to-face classroom model. As stated in the opening of this dissertation, few
studies up to this point have examined the potential of distance learning
environments for improving second language oral fluency, and until such
approaches are developed and positive learning outcomes reported, it seems
unlikely that the bias of learners will change.
A second observation is that although the Internet Chat group participants
were less confident about the development of their fluency (and listening) abilities
during the course, their opinions about the course were as positive or more
positive than those in the Face-to-Face group. The one exception is that slightly
fewer participants in the Internet Chat group strongly agreed that they had felt
connected to other students in the course. These results suggest that while
language learners may be biased against on-line chat environments for
improving fluency, they may nevertheless be receptive to the idea that such
environments are useful in the language learning process. An additional
question that should have been included in the survey is one that measures the
extent to which the participant had participated in on-line chat technology prior to
the study. One may speculate that learners with greater exposure to such
technology would feel more comfortable with and thereby have better overall
impressions of an on-line such as the one in this study.
Results from the exit survey also suggest that interaction is an important
factor for the success of an on-line language learning course. Although
participants in the Control group completed similar on-line activities as those in
110
the Face-to-Face and Internet Chat groups, they did not engage in any regular
form of learner-learner or even learner-instructor interaction during the six week
period. This was the critical difference in the design of the Control and Internet
Chat group courses—both of which were taught entirely on-line and it is the most
plausible explanation for overall more negative feedback from the Control group
participants. The one question to which the Control group gave more positive
responses than the Internet Chat group was the question regarding the
development of listening skills during the course. The positive responses from
the Control group on this item may reflect the fact that almost the entire Control
group curriculum was based on activities related to the news item listening
passages. These results appear to bode well for the many listening websites
that are currently available to ESL learners on the Internet.
5.6. Pedagogical Implications
As already discussed, the study provides strong support for the notion that
second language learners can improve their oral fluency in an on-line text-based
chat environment. However, the research does not suggest that any type of chat
environment will be useful for developing fluency. The interaction that took place
in this experimental course was constantly guided by the instructor. With the
exception of the first and last five minutes, each class was highly structured and
required that participants stay focused on the discussion or vocabulary activities
at hand. In contrast, it has been the researcher’s observation that the text-based
chat rooms on ESL learning websites are very unstructured with little guidance
from the instructor. In these environments, participants come and go at will and
generally are not pushed to use English. In such environments, it seems unlikely
that any real gains in fluency could be made.
On-line language learning has been heralded as a possible solution to the
growing demand for ESL instruction—especially overseas. While the high
fluency gains score of the Internet Chat group seem to support this, another
111
aspect of the study raises additional questions. When teaching the course, the
researcher observed that four to six participants was the ideal size for a text-
based chat room. On the days when the number of participants was higher than
six, it was difficult to involve all of the participants in the discussion. On the class
periods when the number of participants was three or less, the environment
because much less formal and it was more difficult to direct the session like a
class. Although ideal for the learners, the low student-teacher ratio requirement
raises the concern that such ESL environments may not be economically or
logistically feasible
Perhaps a more viable application of on-line chats is in a hybrid
environment in which students meet together in a chat room at scheduled times
between the regular face-to-face sessions. This would give students the
opportunity to use the vocabulary and language structures they are learning in
the traditional classroom environment and thus provide an extension of the
formal classroom experience. Such chat rooms could be lead or monitored by a
teaching assistant or graduate student who is looking for experience in such a
setting. As already discussed, one advantage of the text based chat
environment is that it allows the language leaner to see the grammatical
structures and vocabulary items that are being used by the other language users.
For visual learners, the supplemental chat room sessions could prove to be a
very useful way of grasping the material that has been taught in class.
5.7. Limitations of the Study
An obvious limitation of the study is the small sample size of 34
participants. Although the design of the study called for 48 participants (16 in
each group), attrition during the first week left the study with far fewer. It is
fortunate, however, that the rate of attrition was relatively equal across groups,
so that no one group had fewer than 10 or more than 14 participants. Due to a
concern that accepting replacement participants might effect the results of the
112
study (e.g. latecomers would have less classroom time and thus less opportunity
to improve fluency), a decision was made not replace any drop-outs after the
third day of the study. In hindsight, a better approach to this problem would be to
extend the length of the course and allow the first week to be a period of
orientation. This would allow time for participants to dropout and be replaced
without concern over the effect it might have on fluency development.
Another limitation was the relatively short duration of the study. It could be
argued that the findings would have been more meaningful—and perhaps more
statistically significant—had the three courses been longer than six weeks. This
was expressed by a number of participants in the exit survey who expressed
disappointment that the course was so short. It is indeed interesting to speculate
how lengthening the course might have affected the final results. One possibility
is that the participants in each group would have continued to improve in fluency
at the same rate—leading to higher overall gain scores across all three groups
but with the same degree of difference between groups. An alternative possibility
is that the rate of improvement would perhaps decrease with the Internet Chat
group and increase with the Face-to-Face group as the length of the course is
extended, thus decreasing the difference between groups in the end. But such a
scenario would only seem likely if the learning environment in either group were
to change over the course period. The researcher observed that it was more
difficult to keep the Internet Chat group participants engaged in the course
material over the final week (perhaps because the participants were tiring of
some aspect of the on-line environment) and so it is possible that this would have
led to the above scenario had the course length been extended.
A third limitation of the study is related to the fluency variables that were
employed. Although previous research has indicated that MLR and SR are two
reliable temporal variables for measuring fluency, the research decided to include
5 fluency variables in the study. This decision was not based on the desire to
engage in a fishing expedition (e.g. looking for a fluency gain on one variable) but
rather on an interest to explore the relationship between fluency variables and
113
see first-hand which variables performed the best. At the time, the researcher
had not considered the fact that doing so would lessen the chanced of finding
statistical significance on any one variable due to the need to perform the
Bonferroni adjustment and account for experiment-wise error rates. In future
studies of this kind, the researcher will employ only the MLR variable to measure
development of fluency.
5.8. Direction for Future Research
Having established that the Internet Chat participants in the current study
made greater gains in fluency than the participants in the Face-to-Face and
Control groups, a first question that arises is would similar results be found if the
study were to be replicated. Similar findings in a future study would lend
additional support to Levelt’s model of language production and continue to raise
interesting possibilities for implementing text-based chat rooms in language
learning environments. Beyond replication, future research should examine
variables that could affect fluency acquisition in an Internet chat environment.
For example, to what degree is fluency acquisition shaped by factors such as
language and cultural background, age, and experience with chat room
conventions? Or, is fluency acquisition enhanced when the chat room learners
vocalize the sentences that they are typing in the computer?
Beyond the chat room variables, future research should also examine
whether the measurable outcomes are transferred to other communication
environments. While the findings from this study clearly indicate that the Internet
Chat group participants made greater pretest to posttest fluency gains than their
counterparts, it remains unclear whether the gains in fluency would also be
detected by a group of trained raters or by other students or instructors who
interact with the participants on a regular basis. The fact that one of the Control
group participants reported that her TESOL score jumped to passing level after
she took this fluency course provides some initial evidence that there may have
114
been some learning transfer even among he Control group participants in this
study.
A study such as this one provides a rich repository of language data that
could be analyzed in a number of ways. For example, the chat logs could be
analyzed to understand whether there is a correlation between on-line
participation and pretest to posttest gains in fluency. Recorded and transcribed
conversations from the face-to-face classroom would provide similar data for
those participants. The language data collected via the pretests and posttests
could also be analyzed to determine the qualitative changes that occur when
speakers become more fluent. For example, to what degree do the pauses in
the more fluent speech samples fall at phrasal boundaries? Do run of speech
include more prefabricated expressions when fluency increases? Is there a
correlation between the types of expressions that are taught in class and the
expressions that are produced in the posttest speech samples—e.g. does the
classroom material directly transfer to the test environment? These and other
questions could be better understood through the qualitative analysis of data
from a study like this.
5.9. Conclusion
This study is one of the first to explore whether oral fluency can be
improved through a text-based on-line chat environment. The finding that
participants in the Internet chat environment demonstrated greater fluency gains
than participants in the face-to-face environment has been explained by Levelt’s ,
model of language production and Towel, et al’s interpretation of this model.
This model provides support for the notion that fluency is developed at the level
of the Formulator, prior to articulation. Thus, no matter whether a person is
speaking, typing, or signing a language, the critical factor is not the means by
which the language is used but that it is used. The strong performance of the
Internet Chat group can be further explained by the unique dynamics of the chat
115
room environment that allowed the learners to make simultaneous and thus more
frequent contributions to the classroom discussion. In contrast, the conventions
of turn-taking in the face-to-face classroom limited the amount of opportunity for
learners to use the target language.
In addition to being one of the first studies to explore whether text based
chats can be used to improve oral fluency, as such, it is also one of the first
studies to employ temporal measures to examine this question. The five
temporal measures selected for this study have been used in other studies with
varying degrees of success. This study confirmed that mean length of run is the
most salient of the five variables. Although speaking rate is most strongly
correlated with the other variables, it appears that it may be not be as meaningful
a measure as mean length of run. It is suggested that future studies of this type
use only the mean length of run measure.

LIST OF REFERENCES
116
LIST OF REFERENCES
Albrechsten, D., Henriksen, Birgit, and Clause Faerch. (1980). Native speaker reactions to learners' spoken interlanguage. Language Learning, 30, 365-396.
Allodi, A., Dokter, D., & Kuipers, E. (1997). WELLS: Web-Enhanced Language Learning. In S. Jager, J. Nerbonne & A. Van Essen (Eds.), Language teaching and language technology (pp. 123-135). Lisse, The Netherlands: Swets and Zeitlinger B.V.
Anderson, J. R. (1983). The architecture of cognition. Cambridge, MA: Harvard University Press.
Baigent, M. (1999). Teaching in chunks: integrating a lexical approach. Modern English Journal, 8(2), 51-54.
Banitz, B., & Hendrickx, J. (2003). Real-Time Internet Chats: An Alternative for Teaching an EFL Speaking Class? Modern Studies in English Language and Literature, 47(3), 173-196.
Berns, M. (1990). Contexts of Competence: Social and Cultural Considerations in Communicative Language Teaching. NewYork: Plenum.
Bialystok, E. (1982). On the relationship between knowing and using linguistic forms. Applied Linguistics, 3, 181-206.
Blau, E. (1990). The effect of syntax, speed, and pauses on listening comprehension. TESOL Quarterly, 24, 746-753.
Bloch, J. (2002). Student/teacher interaction via email: the social context of Internet discourse. Journal of Second Language Writing, 11(2), 117-134.
Brown, S. (2000). Slow Down! The Importance of Repetition, Planning, and Recycling in Language Teaching. Paper presented at the Conference Name|. Retrieved Access Date|. from URL|.
117
Brumfit, C. J. (1979). Communicative language teaching: an educational perspective. In C. J. Brumfit & K. Johnson (Eds.), The Communicative Approach to Language Teaching. Oxford: Oxford University Press.
Brumfit, C. J. (1984). Commuicative Methodology in Language Teaching: The Roles of Fluency and Accuracy. Cambridge: Cambridge University Press.
Bush, M. D., & Terry, R. M. (Eds.). (1997). Technology Enhanced Language Learning. Lincolnwood, Illinois: National Textbook Company.
Canale, M. (1983). From communicative competence to communicative language pedagogy. In J. Richards & R. Schmidt (Eds.), Language and Communication. London: Longman.
Canale, M., & Swain, M. (1980). Theoretical bases of communicative approaches to second language teaching and testing. Applied Linguistics, 1, 1-47.
Cenoz, J. (1998). Pauses and Communication Strategies in Second Language Speech: University of the Basque Country.
Chambers, F. (1997). What do we mean by fluency? System, 25(4), 535-544.
Chaudron, C. (1988). Second language classrooms. Cambridge: Cambridge University Press.
Cheng, P. W. (1985). Restrucuturing versus automaticity: Alternative accounts of skill acquisition. Psychological Review, 92, 414-423.
Chenoweth, N. A., & Murday, K. (2003). Measuring Student Learning in an Online French Course. CALICO Journal, 20(2), 285-314.
Chun, D. M. (1998). Using Computer-Assisted Class Discussion to Facilitate the Acquisition of Interactive Competence. In J. Swaffar, S. Romano, P. Markley & K. Arens (Eds.), Language Learning Online: Theory and Practice in the ESL and L2 Computer Classroom (pp. 57-80). Austin, Texas: Labyrinth Publications.
Clausen, H. (1987). Natural Language Development: Acquisitional Processes Leading to Fluency in Speech Production. In H. W. Dechert & M. Raupach (Eds.), Psycholinguistic Models of Production. Norwood, NJ: Ablex.
Cole, R. A. (Ed.). (1980). Perception and Production of Fluent Speech. Hillsdale, NJ: Lawrence Erlbaum Associates.
118
Cucchiarini, C., Helmer, S., & Boves, L. (2000). Quantitative assessment of second language learners' fluency by means of automatic speech recognition technology. Journal of Acoustical Society of America, 107(2), 989-999.
Darhower, M. (2002). Interactional Features of Synchronous Computer-Mediated Communication in the Intermediate L2 Class: A Sociocultural Case Study. CALICO Journal, 19(2), 249-275.
de Bot, K. (1992). A bilingual production model: Levelt's speaking model adapted. Applied Linguistics, 13, 1-24.
Dechert, H. W. (1984). Individual Variation in Language. In H. W. Dechert, D. Mohle & M. Raupach (Eds.), Second Language Productions. Tubingen, Germany: Gunter Narr Verlag.
Dechert, H. W., Mohle, D., & Raupach, M. (Eds.). (1984). Second Language Production. Tubingen, Germany: Gunter Narr Verlag.
Dechert, H. W., & Raupach, M. (Eds.). (1980). Towards a Cross-Linguistic Assessment of Speech Production. Frankfurt: Lang.
Dechert, H. W., & Raupach, M. (Eds.). (1987). Psycholinguistic models of production. Tubingen: Guner Narr Verlag.
Derwing, T. M. (1990). Speech Rate is No Simple Matter: Rate Adjustment and NS-NNS Communicative Success. Studies in Second Language Acquisition, 12, 303-313.
Drommel, R. H. (1980). Towards a subcategorization of speech pauses. In H. W. Dechert & M. Raupach (Eds.), Temporal Variables in Speech. The Hague: Mouton Publishers.
Dudeney, G. (2000). The Internet and the Language Classroom. Cambridge: Cambridge University Press.
Ellis, R. (2003). Task-based Language Learning and Teaching. Oxford: Oxford University Press.
Faerch, K., Haastrup, K., & Phillipson, R. (1984). Learner Language and Language Learning. Copenhagen: Multilingual Matters.
Fillmore, C. (1979). On fluency. In C. Filllmore, D. Kempler & W. Wang (Eds.), Individual differences in langauge ability and language behavior. New York: Academic Press.

119
Flaherty, E. (1979). Rate-controlled speech in foreign language instruction. Foreign Language Annals, 12, 275-280.
Freed, B. F. (1995). What makes us think that students who study abroad become fluent? In B. F. Freed (Ed.), Second Language Acquisition in a Study Abroad Context (pp. 123-148). Amsterdam: John Benjamin.
Giardini, F., & Vergaro, C. (1998). Learning Itineraries: Getting Students to Use CALL software optimally. In S. Jager, J. Nerbonne & A. Van Essen (Eds.), Language teaching and language technology. Lisse, The Netherlands: Swets and Zeitlinger B.V.
Gitsaki, C., & Taylor, R. P. (1999). Internet English: WWW-Based Communication Activities. Oxford: Oxford University Press.
Goldman-Eisler, F. (1958). Speech production and the predictablity of words in context. Quarterly Journal of Experimental Psychology, 10, 96-106.
Goldman-Eisler, F. (1968). Psycholinguistics: Experiments in spontaneous speech. New York: Academic Press.
Goodfellow, R., & Lamy, M.-N. (1998). Learning to Learn a Language-At Home and on the Web. ReCALL, 10(1), 68-78.
Griffiths, R. (1990). Temporal Variables in L2 Classroom Input: A Descriptive and Experimental Study. University of Southhampton.
Griffiths, R. (1991). Pausological Research in an L2 Context: A Rationale and Review of Selected Studies. Applied Linguistics, 12(4), 345-364.
Grosjean, F. (1980). Temporal variables within and between languages. In H. W. Dechert & M. Raupach (Eds.), Towards a Cross-Linguistic Assessment of Speech Production. Frankfurt: Lang.
Grosjean, F., & Deschamps, A. (1975). Analyse contrastive des variables temporelles de l'anglais et du francais: vitesse de parole et variables composantes, phenomenes d'hesitation. Phonetica, 31, 144-184.
Hamilton, S. (1998). RECALL--Some Implications of Learner as User in CALL. In S. Jager, J. Nerbonne & A. Van Essen (Eds.), Langauge teaching and language technology (pp. 200-208). Lisse, The Netherlands: Swets and Zeitlinger B.V.
Harvey, T. E. (1984). Rate-alteration technology and its place in the L2 comprehension curriculum. System, 12, 31-41.
120
Harwood, N. (2002). Taking a lexical approach to teaching: principles and problems. International Journal of Applied Linguistics, 12(2), 139-155.
Hegelheimer, V., & Tower, D. (2004). Using CALL in the classroom: Analyzing student interactions in an authentic classroom. System, 32, 185-205.
Hieke, A. E. (1981). A content-processing view of hesitation phenomena. Language and Speech, 24(2), 147-160.
Hieke, A. E. (1985). A Componential Approach to Fluency Evaluation. The Modern Language Journal, 69(2), 135-142.
Holliday, L. (1997). The Grammar of Second Language Learners of English EMAIL Messages. In S. Jager, J. Nerbonne & A. Van Essen (Eds.), Language teaching and language learning. Lisse, The Netherlands: Swets and Zeitlinger B.V.
House, J. (1996). Developing pragmatic fluency in English as a foreign language: routines and metapragmatic awareness. Applied Linguistics, 9(1), 225-252.
Hymes, D. (1971). Competence and Performance in Linguistic Theory. In R. Huxley & E. Ingram (Eds.), Language Acquisition: Models and Methods (pp. 3-28). London: Academic Press.
Johnson, K. (1979). Communicative approaches and communicative processes. In C. J. Brumfit & K. Johnson (Eds.), The Communicative Approach to Language Teaching. Oxford: Oxford University Press.
Kelm, O. R. (1992). The use of synchrounous computer networks in second language instruction: A preliminary report. Foreign Language Annals, 25, 441-454.
Kemper, S., Othick, M., Gerhing, H., Gubarchuk, J., & Billington, C. (1998). The effects of practicing speech accomodations to older adults. Applied Psycholinguistics, 19(2), 175-192.
Kormos, J., & Denes, M. (2004). Exploring measures and perceptions of fluecy in the speech of second language learners System, 32, 145-164.
Kowal, S., & O'Connell, D. (1980). Pausological research at Saint Louis University. In H. W. Dechert & M. Raupach (Eds.), Temporal Variables in Speech: Studies in Honour of Frieda Goldman-Eisler. The Hague: Mouton Publishers.
121
Leeson, R. (1975). Fluency and Language Teaching. London: Longman.
Lehtonen, J. (1981). Problems of Measuring Fluency and Normal Rate of Speech.
Lennon, P. (1984). Retelling a Story in English. Second Language Productions, 50-68.
Lennon, P. (1990). Investigating Fluency in EFL: A Quantitative Approach. Language Learning, 40(3), 387-417.
Levelt, W. (1989). Speaking: From Intention to Articulation. Cambridge, MA: MIT Press.
Lewis, M. (1993). The lexical approach: The state of ELT and the way forward. Hove, UK: Language Teaching Publications.
Lewis, M. (1997a). Implementing the Lexical Approach: Putting Theory into Practice. Hove, UK: Language Teaching Publications.
Lewis, M. (1997b). Pedagogical implications of the lexical approach. In J. Coady & T. Huckin (Eds.), Second language vocabulary acquisition: A rationale for pedagogy (pp. 255-270). Cambridge: Cambridge University Press.
Lewis, M. (Ed.). (2000). Teaching Collocation: Further Development in the Lexical Approach. Boston: Heinle.
Logan, G. D. (1988). Toward an instance theory of automatization. Psychological Review, 95, 492-527.
MacKay, D. G. (1982). The problems of flexibility, fluency, and speed-accuracy tradeoff in skilled behavior. Psychological Review, 89, 483-506.
Markley, P. (1998). Empowering Students: The Diverse Roles of Asians adn Women in the ESL Computer Classroom. Language Learning Online: Theory and Practice in the ESL and L2 Computer Classroom, 81-96.
McLaughlin, B. (1980). Towards a theory of speech processing: Some methodological considerations. In H. W. Dechert & M. Raupach (Eds.), Temporal Variables in Speech: Studies in Honour of Frieda Goldman-Eisler. The Hague: Mouton Publishers.
McLaughlin, B. (1990). Restructuring. Applied Linguistics, 11, 113-128.
McLaughlin, B., Rossman , T., & McLeod, B. (1983). Second language learning: An information processing perspective. Language Learning, 33, 135-157.
122
Mohle, D. (1984). A comparison of the second languge speech production of different native speakers. In H. W. Dechert, D. Mohle & M. Raupach (Eds.), Second Language Production (pp. 26-49). Tubingen, Germany: Guner Narr Verlag.
Munro, M. J., & Derwing, T. M. (2001). Modeling Perceptions of the Accentedness and Comprehensibility of L2 Speech, The Role of Speaking Rate. SSLA, 23, 451-468.
Nation, P. (1989). Improving Speaking Fluency. System, 17(3), 377-384.
Nattinger, J. R., & DeCarrico, J. S. (1992). Lexical Phrases and Language Teaching. Oxford: Oxford University Press.
Newell, A. (1990). Unified theories of cognition. Cambridge, MA: Harvard University Press.
O'Connell, D. (1980). Cross-linguistic investigation of some temporal dimensions of speech. In H. W. Dechert & M. Raupach (Eds.), Towards a Cross-Linguistic Assessment of Speech Production. Frankfurt: Lang.
Olynyk, M., D'Anglejan, A., & Sankoff, D. (1987). A Quantitative and qualitative analysis of speech markers in the native and second language speech of bilinguals. Applied Psycholinguistics, 8(121-136).
Opp-Beckman, L. (2002). Africa Online: A Web- and Content-Based English Language Teaching Course. TESOL Journal, 11(3), 4-8.
Pawley, A., & Syder, F. H. (1983). Two puzzles for linguistic theory: nativelike selection and nativelike fluency. In J. C. Richards & R. W. Schmidt (Eds.), Language and Communication (pp. 191-226). London: Longman.
Payne, S. J., & Whitney, P. J. (2002). Developing L2 Oral Proficiency through Synchronous CMC: Output, Working Memory, and Interlanguage Development CALICO Journal, 20(1), 7-32.
Pica, T. (1988). Interlanguage adjustments as an outcome of NS/NNS negotiated interaction. Language Learning, 38, 45-73.
123
Raupach, M. (1980a). Cross-linguistic descriptions of speech performance as a contribution to contrastive psycholinguistics In H. W. Dechert & M. Raupach (Eds.), Towards a Cross-Linguistic Assessment of Speech Production. Frankfurt: Verlag Peter D. Lang.
Raupach, M. (1980b). Temporal variables in first and second language speech production. In H. W. Dechert & M. Raupach (Eds.), Termporal variables in speech: Studies in honour of Frieda Goldman-Eisler. The Hague: Mouton.
Raupach, M. (1980). Temporal variables in first and second language speech production. In M. Raupach & H. W. Dechert (Eds.), Temporal Variables in Speech: Studies in Honour of Frieda Goldman-Eisler (pp. 263-270). The Hague: Mouton Publishers.
Raupach, M. (1984). Formulae in Second Language Speech Production. In H. W. Dechert, D. Mohle & M. Raupach (Eds.), Second Language Productions. Tubingen, Germany: Gunter Narr Verlag.
Raupach, M. (1987). Procedural learning in advanced learners of a foreign language. In J. A. Coleman & R. Towell (Eds.), The Advanced Language Learner (pp. 123-155). London: CILT.
Rehbein, J. (1987). On fluency in second language speech. In H. W. Dechert & M. Raupach (Eds.), Psycholoinguistic models of production. Tubingen, Germany: Guner Narr Verlag.
Rekart, D., & Dunkel, P. (1992). The utility of objective (computer) measures of the fluency of speakers of English as a second language. . Applied Language Learning, 3, 65-85.
Reynard, R. (2003). Internet-Based ESL for Distance Adult Students-A Framework for Dynamic Language Learning. The Canadian Modern Language Review/La Revue canadienne des langues vivantes, 60(2), 123-142.
Riazantseva, A. (2001). Second Language Proficiency and Pausing. A Study of Russian Speakers of English. Studies in Second Language Acquisition, 23, 497-526.
Richards, J. C. (2002). Accuracy and Fluency Revisited. In E. Hinkel & S. Fotos (Eds.), New Perspectives on Grammar Teaching in Second Language Classrooms. Mahwah, N.J. : L. Erlbaum Associates, 2002.
Richards, J. C., & Rodgers, T. S. (1986). Approaches & Methods in Language Teaching: A Description and Analysis. Cambridge: Cambridge University Press.
124
Riggenbach, H. (1991). Toward an Understanding of Fluency: A Microanalysis of Nonnative Speaker Conversations. Discourse Processes, 14, 423-441.
Rohde, L. (1985). Compensatory fluency: A study of spoken English produced by four Danish learners. In E. Glahn & A. Holmen (Eds.), Learner discourse: Anglica et Americana. Copenhagen: University of Copenhagen.
Sajavaara, K. (1987). Second language speech production: Factors affecting fluency. In H. W. Dechert & M. Raupach (Eds.), Psychololinguistic models of production. Norwood, NJ: Ablex.
Sajavaara, K., & Lehtonen, J. (1978). Spoken Language and the Concept of Fluency. Language Centre News, 1, 23-57.
Savignon, S. (1997). Communicative Competence: Theory and Classroom Practice. New York: McGraw-Hill.
Scarcella, R., Anderson, E. S., & Krashen, S. D. (1990). A Quantitative and Qualitative Analysis of Speech Markers in the Native and Second Language Speech of Bilinguals. In R. Scarcella, E. S. Anderson & S. D. Krashen (Eds.), Developing Communicative Competence in a Second Language (pp. 139-157). New York: Newbury House Publishers.
Schachter, S., Christenfeld, N., Ravina, B., & Bilous, F. (1991). Speech disfluency and the structure of knowledge. Journal of Personality and Social Psychology, 60(3), 362-367.
Schmidt, R. (1992). Psychological Mechanisms Underlying Second Language Fluency. Studies in Second Language Acquisition, 14(4), 357-385.
Schmitt-Gevers, H. (1993). La Notion d'aisance dans la production et la reception orales en langue etrangere. Melanges - Centre de Recherches et d'Applications pedagogiques en Langues, 21, 129-148.
Schmitt, N. (2000). Key Concepts in ELT: Lexical Chunks. ELT Journal, 54(4), 400.
Servan-Schreiber, E., & Anderson, J. R. (1990). Learning artificial grammars with competitive chunking. Journal of Experimental Psychology: Learning, Memory and Cognition, 16, 592-608.
Shiffrin, R. M., & Schneider, W. (1977a). Controlled and automatic human information processing II: Perceptual learning, automatic attending, and a general theory. Psychological Review, 84, 127-190.
125
Shiffrin, R. M., & Schneider, W. (1977b). Controlled and automatic human information processing II: Perceptual learning, automatic attending, and a general theory. Psychological Review, 84, 127-190.
Skehan, P. (1996). A Framework for the Implementation of Task-Based Instruction. Applied Linguistics, 17(1), 38-62.
Skehan, P., & Foster, P. (1997). Task Type and Task Processing Conditions as Influences on Foreign Language Performance. Language Teaching Research, 1(3), 185-211.
Sotillo, S. M. (2000). Discourse Functions and Syntactic Complexity in Synchronous and Asynchronous Communication. Language Learning & Technology, 4(1), 82-119.
Stockwell, G., & Harrington, M. (2003). The Incidental Development of L2 Proficiency in NS-NNS Email Interactions. CALICO Journal, 20(2), 337-359.
Sullivan, N. (1998). Developing Critical Reading and Writing Skills: Empowering Minority Students in a Networked Computer Classroom. In J. Swaffar, S. Romano, P. Markley & K. Arens (Eds.), Language Learning Online: Theory and Practice in the ESL and L2 Computer Classroom (pp. 41-55). Austin, Texas: Labyrinth Publications.
Swaffar, J., Romano, S., Markley, P., & Arens, K. (Eds.). (1998). Language Learning Online. Austin, TX: Labyrinth Publications.
Swan, M. (2005). Legislation by Hypothesis: The Case of Task-Based Instruction Oxford: Oxford University Press.
Temple, L. (1992). Disfluencies in Learner Speech. Australian Review of Applied Linguistics, 15(1), 29-44.
Temple, L. (1994). Ameliorer l'oral (Improving the Oral). Francais dans le Monde(269), 58-61.
Thornbury, S. (1998). The lexical approach: a journey without maps? Modern English Journal, 7(4), 7-13.
Towell, R. (1987). Approaches to the analysis of the oral development of the advanced learner. In J. A. Coleman & R. Towell (Eds.), The Advanced Language Learner (pp. 157-181). London: CILT.
Towell, R., Hawkins, R., & Bazergui, N. (1996). The development of fluency in advanced learners of French. Applied Linguistics, 17, 84-119.
126
Ur, P. (1981). Discussion that Work: Task-centered Fluency Practice Cambridge: Cambridge University Press.
van Gelderen, A. (1994). Prediction of global ratings of fluency and delivery in narrative discourse by linguistic and phonetic measures--oral performances Language Testing 11, 291-319.
Vanderplank, R. (1993). Pacing and spacing as predictors of difficulty in speaking and understanding English. English Language Teaching Journal, 47, 117-125.
Vitanova, G. (2000). Computer Technology in the ESL Classroom: An Outline of Three Major Applications. College Esl, 9(1-2), 53-66.
Wang, Y., & Sun, C. (2001). Internet-Based Real Time Language Education: Towards a Fourth Generation Distance Education. CALICO Journal, 18(3), 539-561.
Warschauer, M. (1997). Comparing face-to-face and electronic discussion in the second language classroom. CALICO Journal, 13(2&3), 7-25.
Warschauer, M., Turbee, L., & Roberts, B. (1996). Computer Learning Networks and Student Empowerment.
Warschauer, M., & Whittake, P. F. (1997). The Internet for English Teaching: Guidelines for Teachers. TESL Reporter, 30(1), 27-33.
Wat-Aksorn, P. (2000). Pedagogical Factors and Considerations That Should Be Included in the Decision-Making Process for Delivery of an EFL/ESL Program through Distance Education in Thailand: A Delphi Study. Univeristy of Michigan, Ann Arbor.
Wesche, M. B., & Ready, D. (1985). Foreigner talk in the university classroom. In S. M. Gass & C. G. Madden (Eds.), Input and second language acquisition (pp. 89-114). Rowley, MA: Newbury House.
Wiese, R. (1984). Language Production in Foreign and Native Languages; Same or Different? In H. W. Dechert & D. Mohle (Eds.), Second Language Productions (pp. 10-25). Tubingen: Gunter Narr Verlag.
Willis, D. (1990). The Lexical Syllabus: A new approach to language teaching. London: Collins COBUILD.
Woolard, G. (Summer 2004). Keyword for Fluency - Upper Intermediate. Boston: Heinle.

127
Ypsilandis, G. S. (2002). Feedback in Distance Education. Computer Assisted Language Learning, 15(2), 167-181.
Zhou, Y. (1997). The effects of listeners' control of speech rate on second language comprehension. Applied Linguistics, 18, 49-68.

APPENDICES
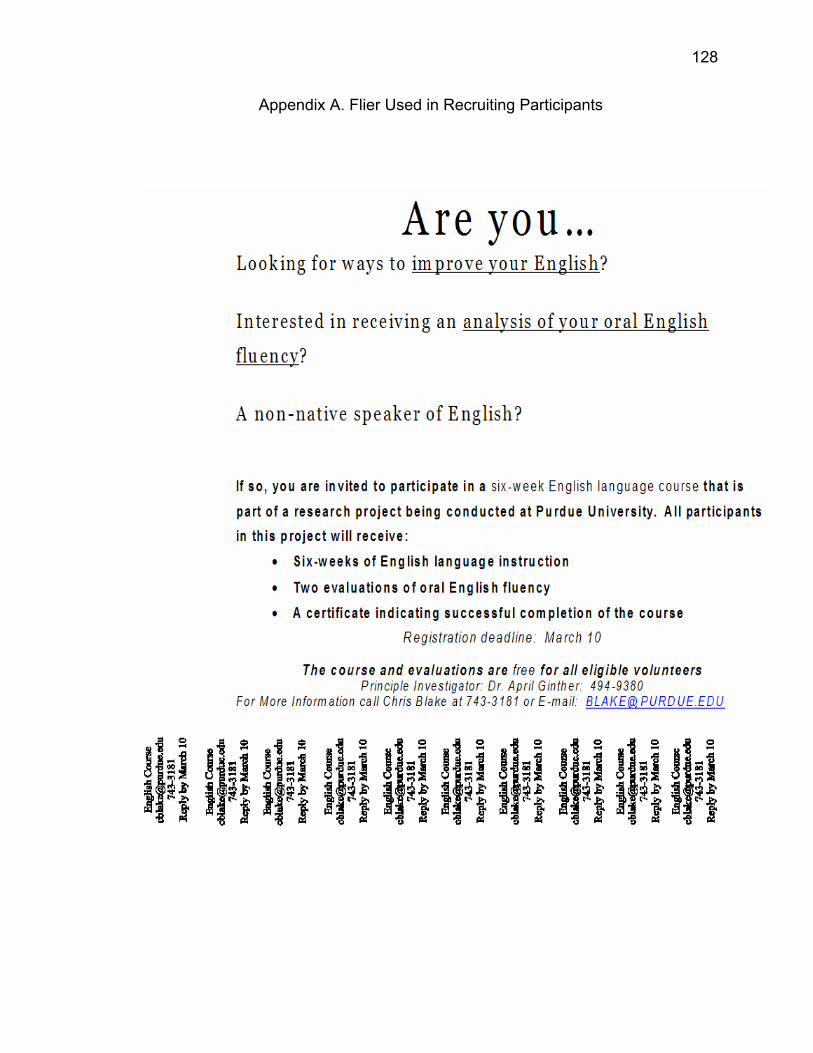
128
Appendix A. Flier Used in Recruiting Participants
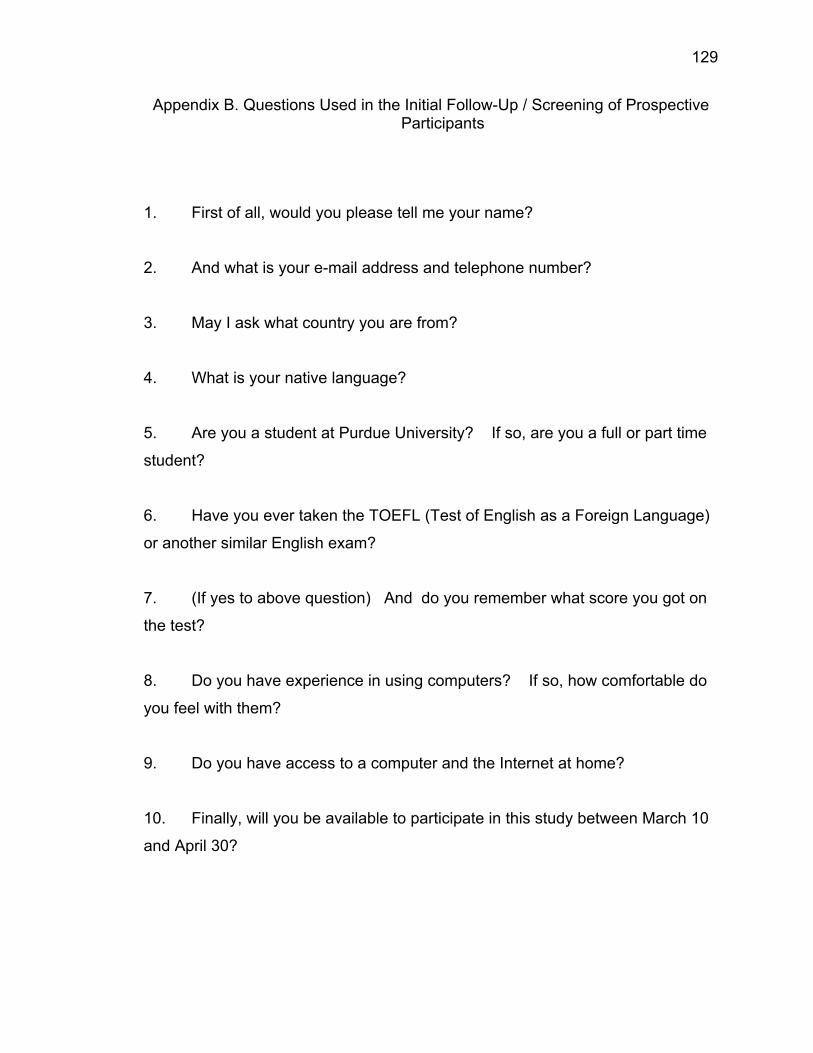
129
Appendix B. Questions Used in the Initial Follow-Up / Screening of Prospective Participants
1. First of all, would you please tell me your name?
2. And what is your e-mail address and telephone number?
3. May I ask what country you are from?
4. What is your native language?
5. Are you a student at Purdue University? If so, are you a full or part time
student?
6. Have you ever taken the TOEFL (Test of English as a Foreign Language)
or another similar English exam?
7. (If yes to above question) And do you remember what score you got on
the test?
8. Do you have experience in using computers? If so, how comfortable do
you feel with them?
9. Do you have access to a computer and the Internet at home?
10. Finally, will you be available to participate in this study between March 10
and April 30?

130
Appendix C. Course Information Packet Distributed to the Control Group Participants
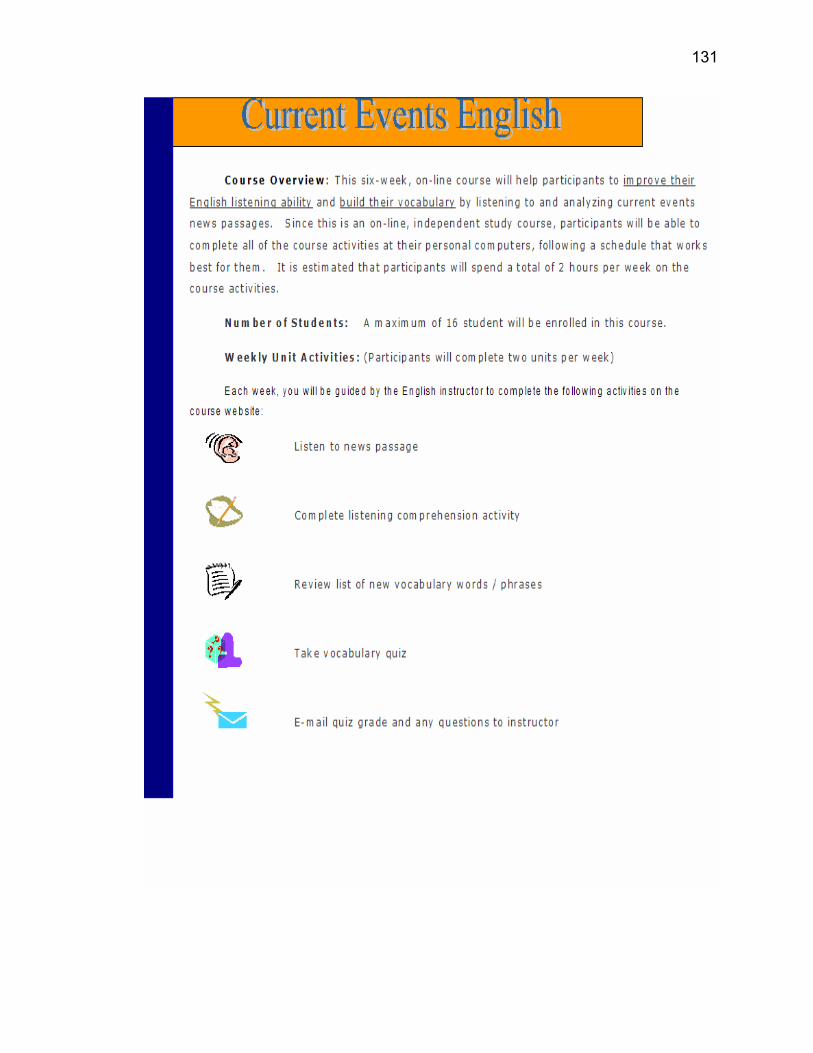
131
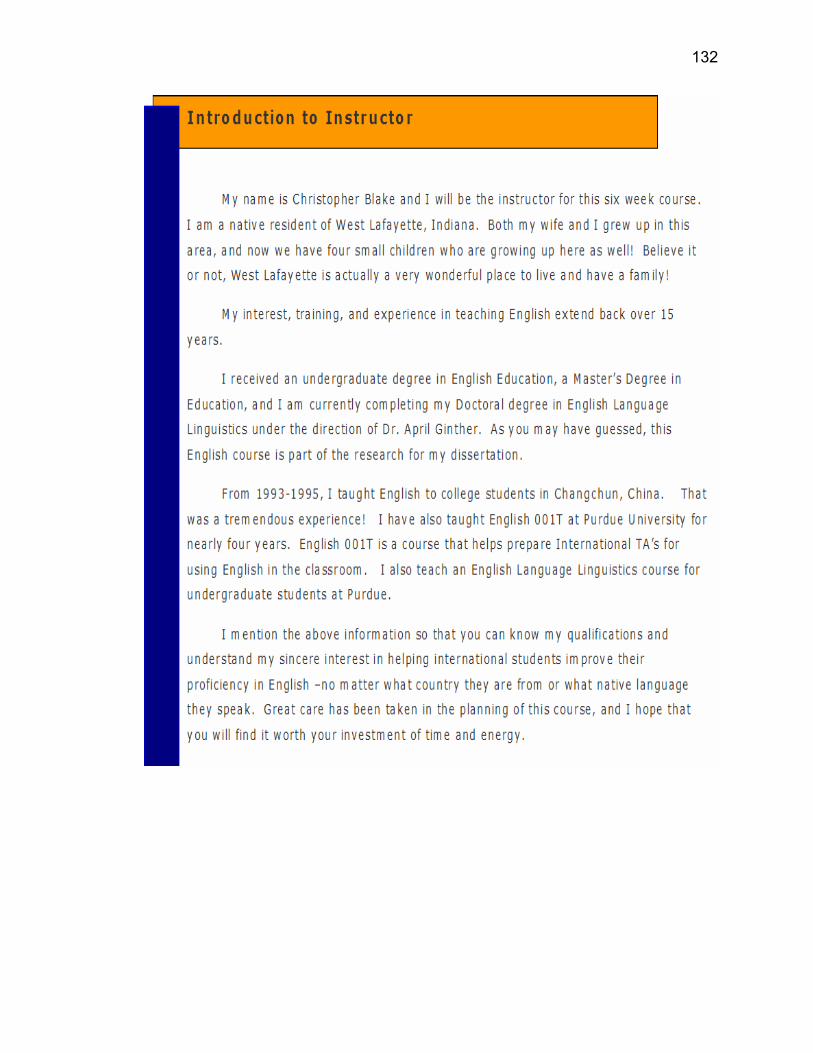
132
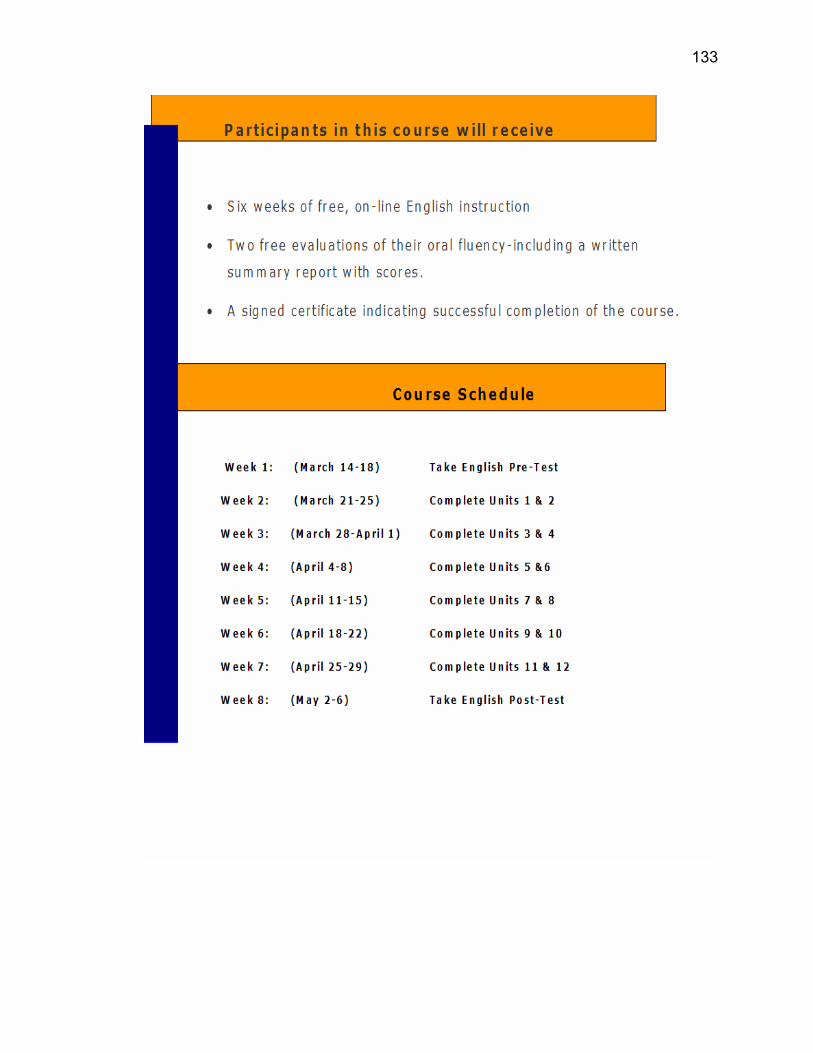
133
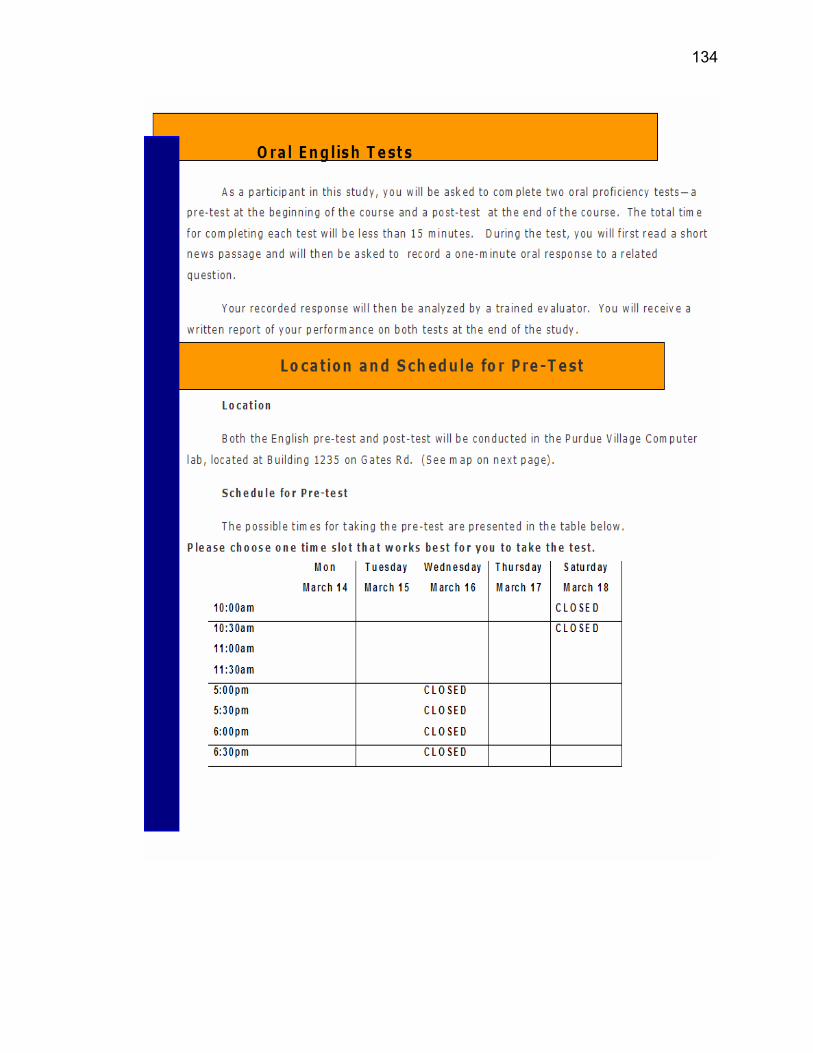
134
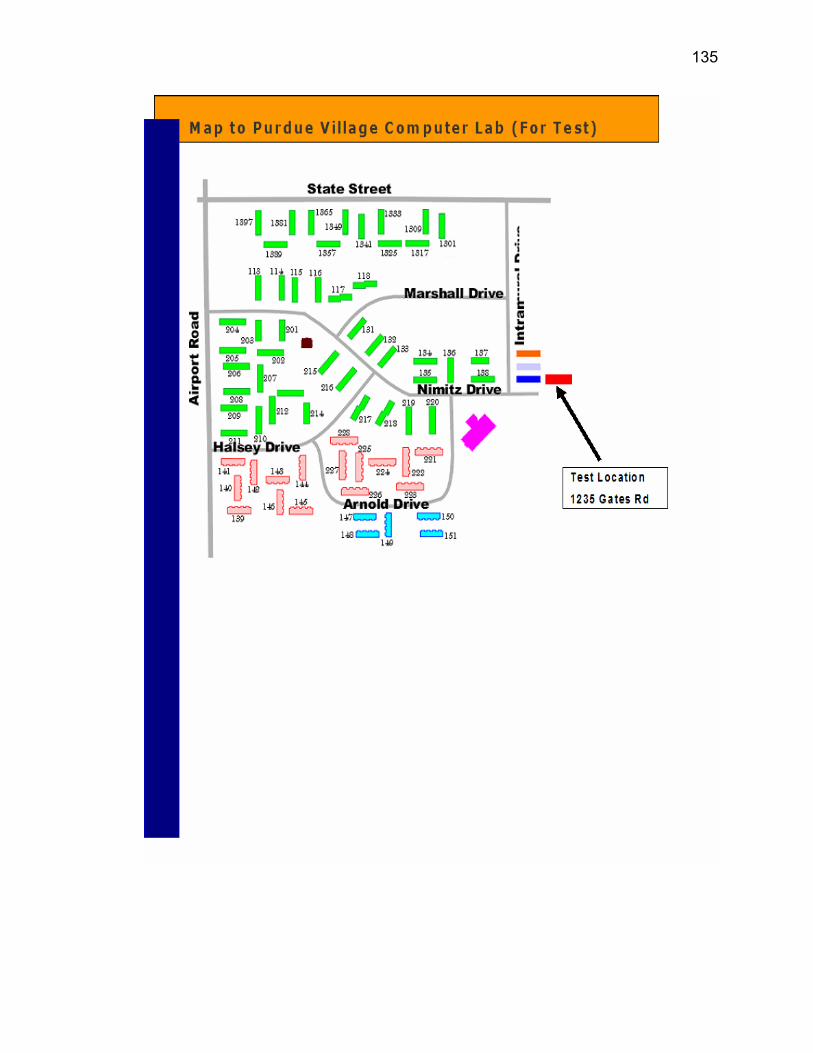
135
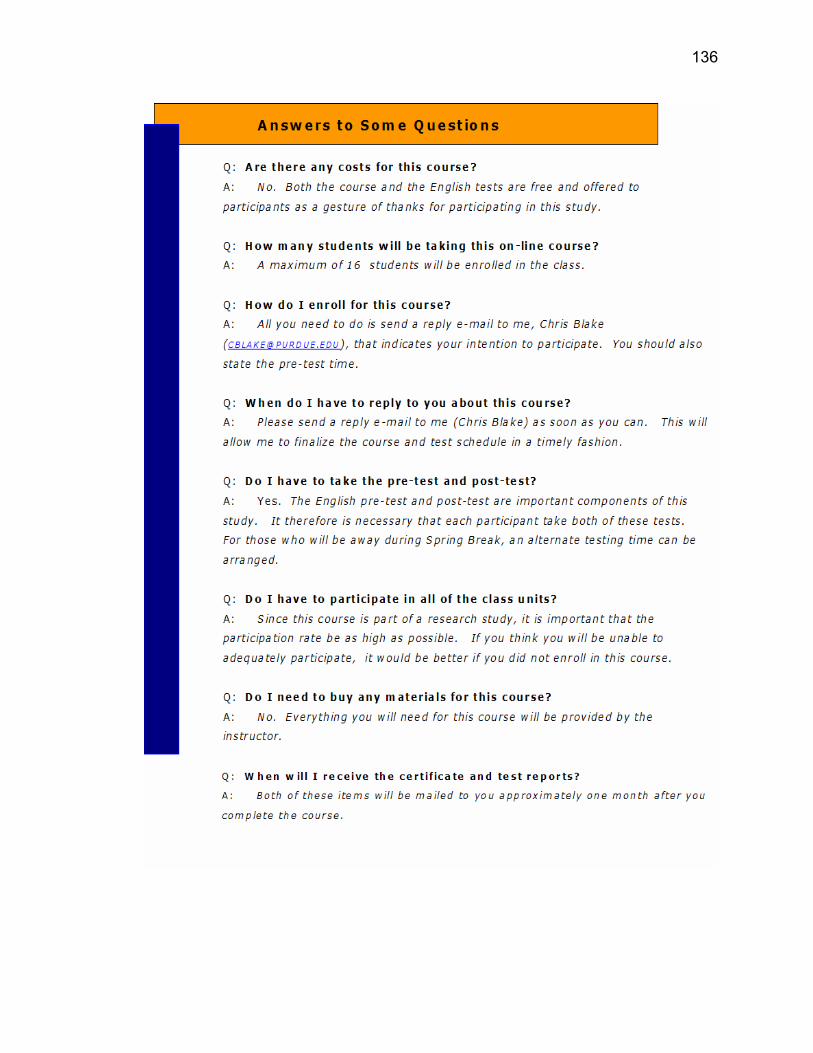
136

137
Appendix D. Course Information Packet Distributed to the On-Line Internet Chat group Participants
138
139

140
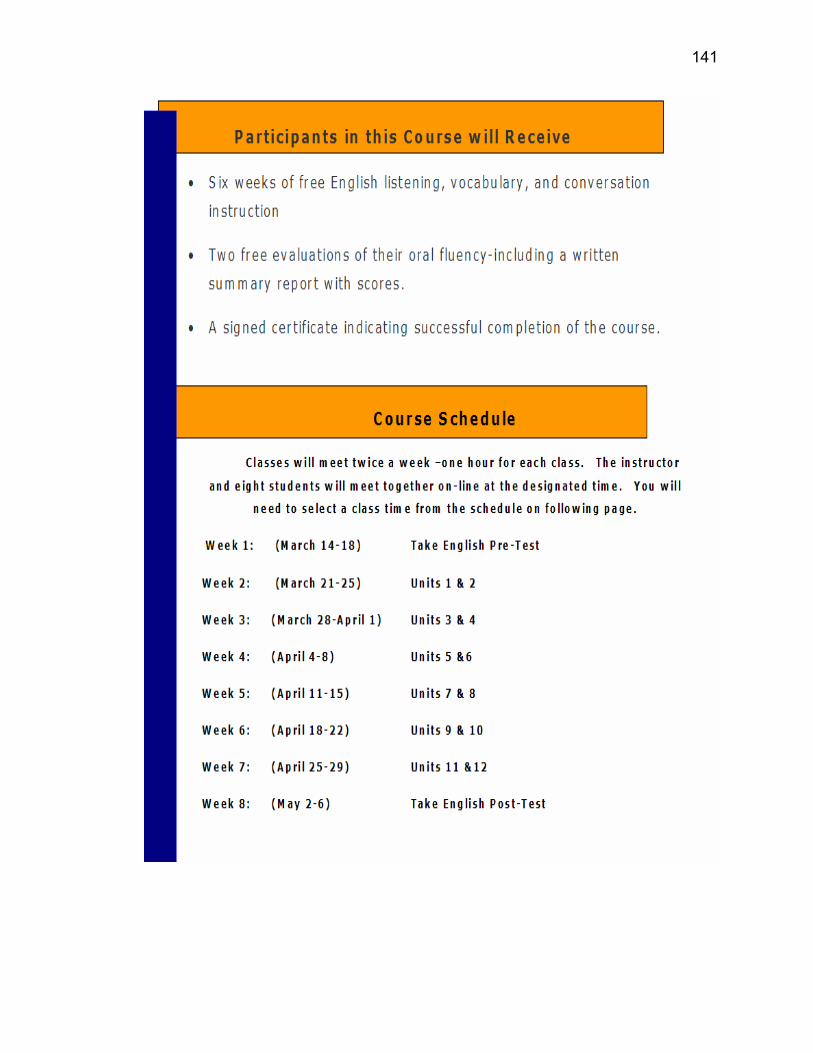
141
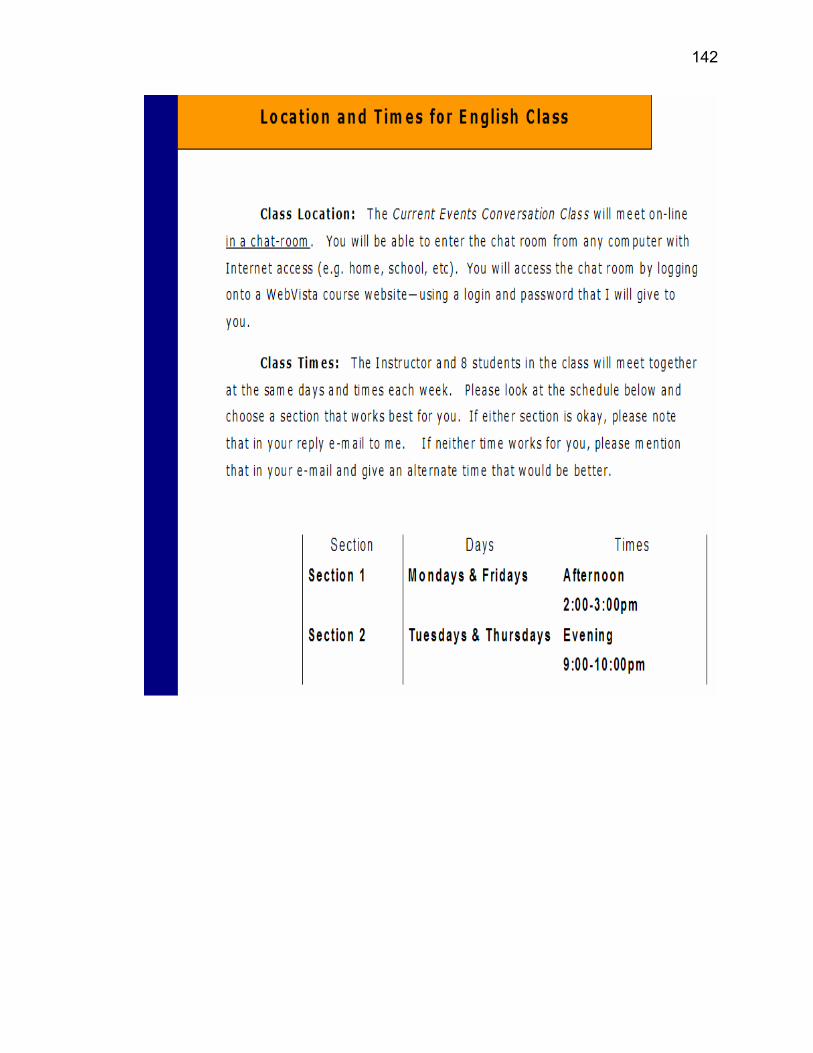
142
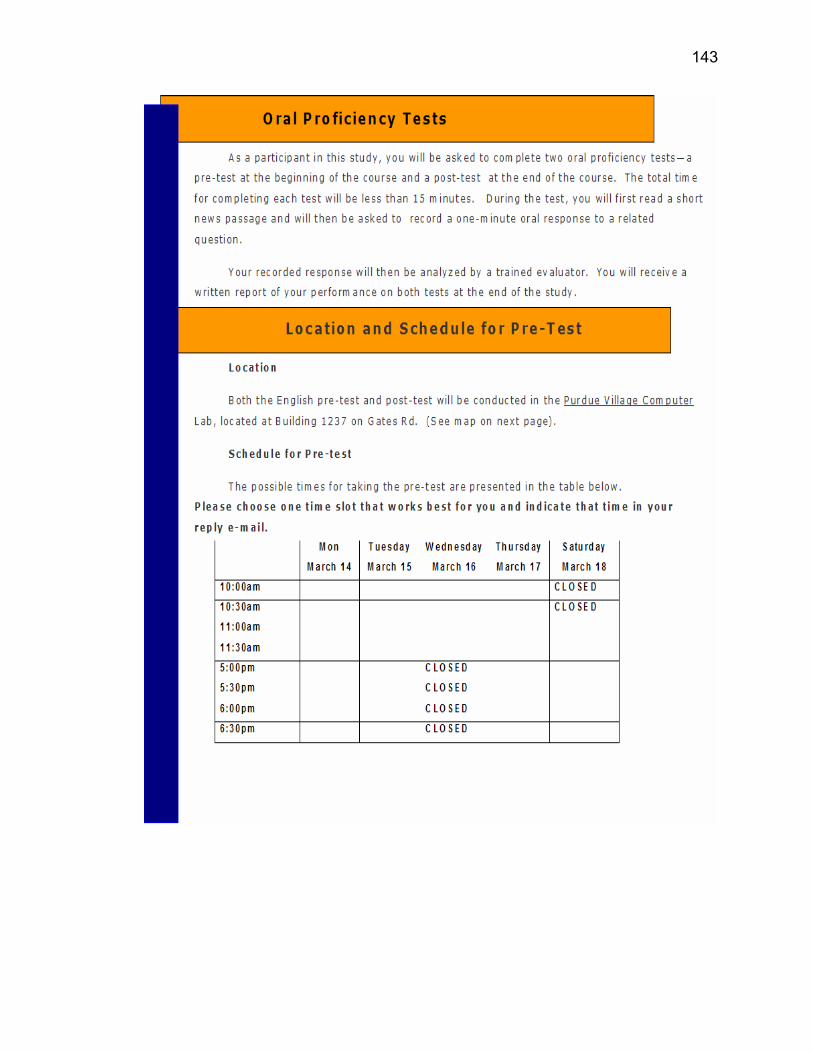
143

144

145

146
Appendix E. Course Information Packet Distributed to the Face-to-Face Group Participants

147
148

149
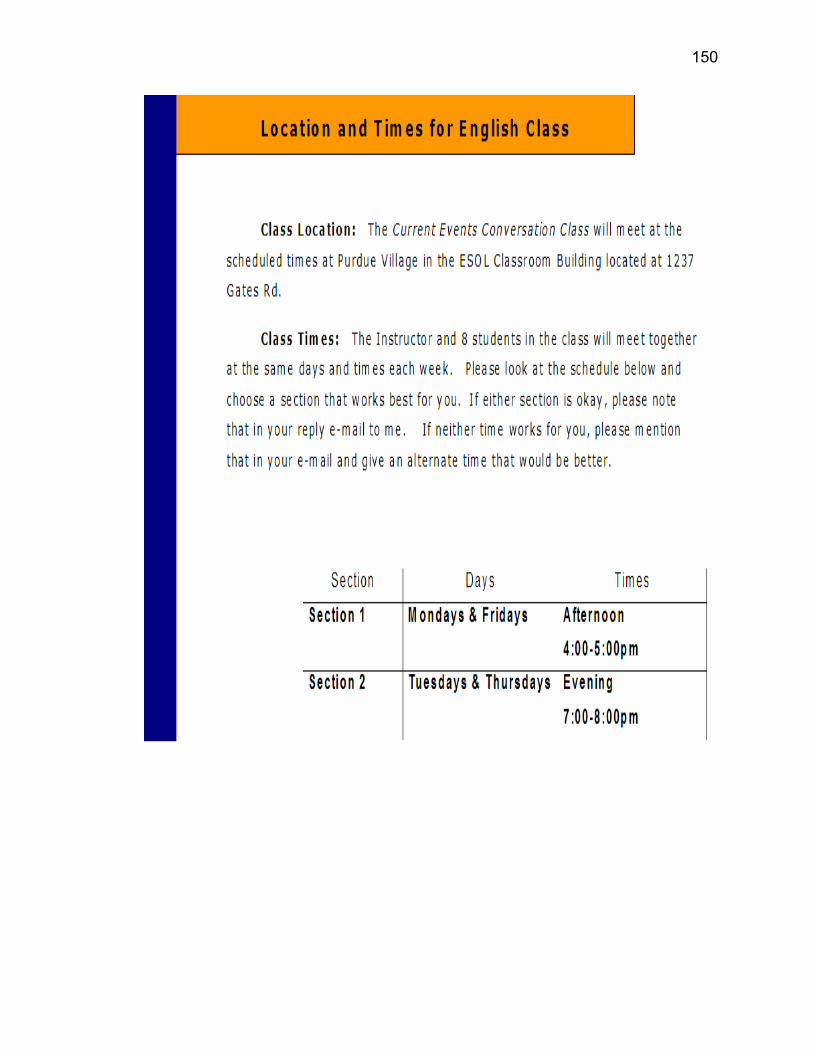
150

151

152
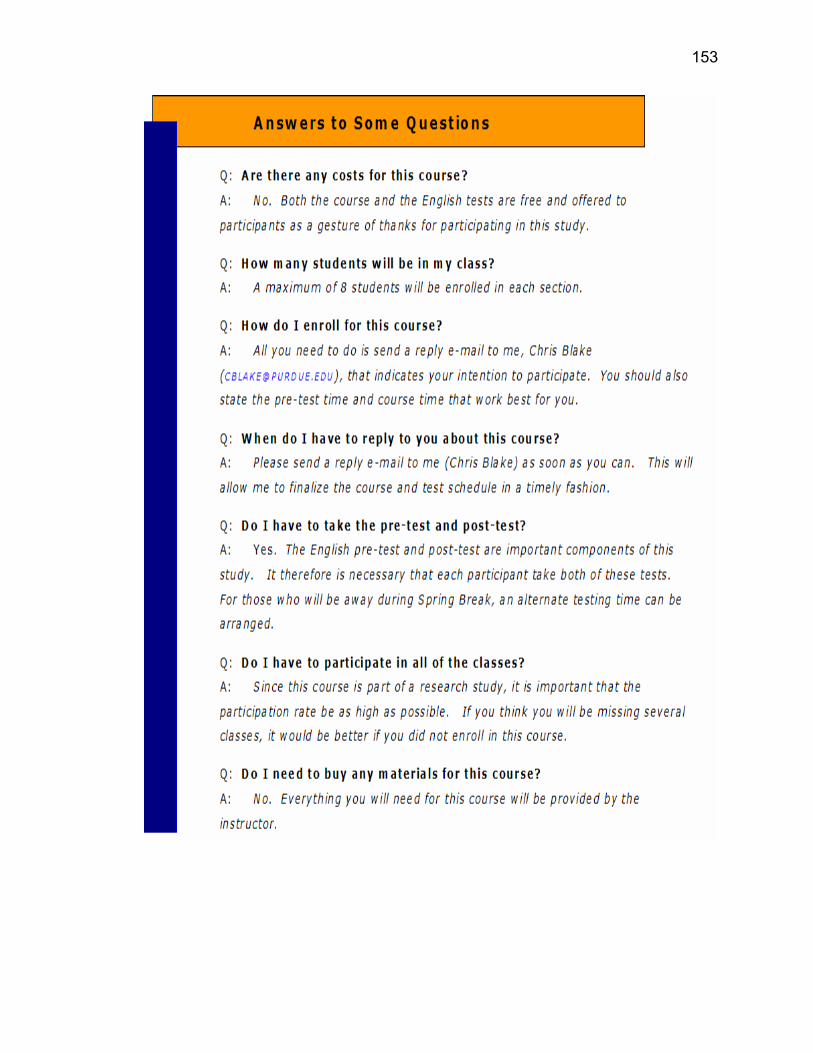
153
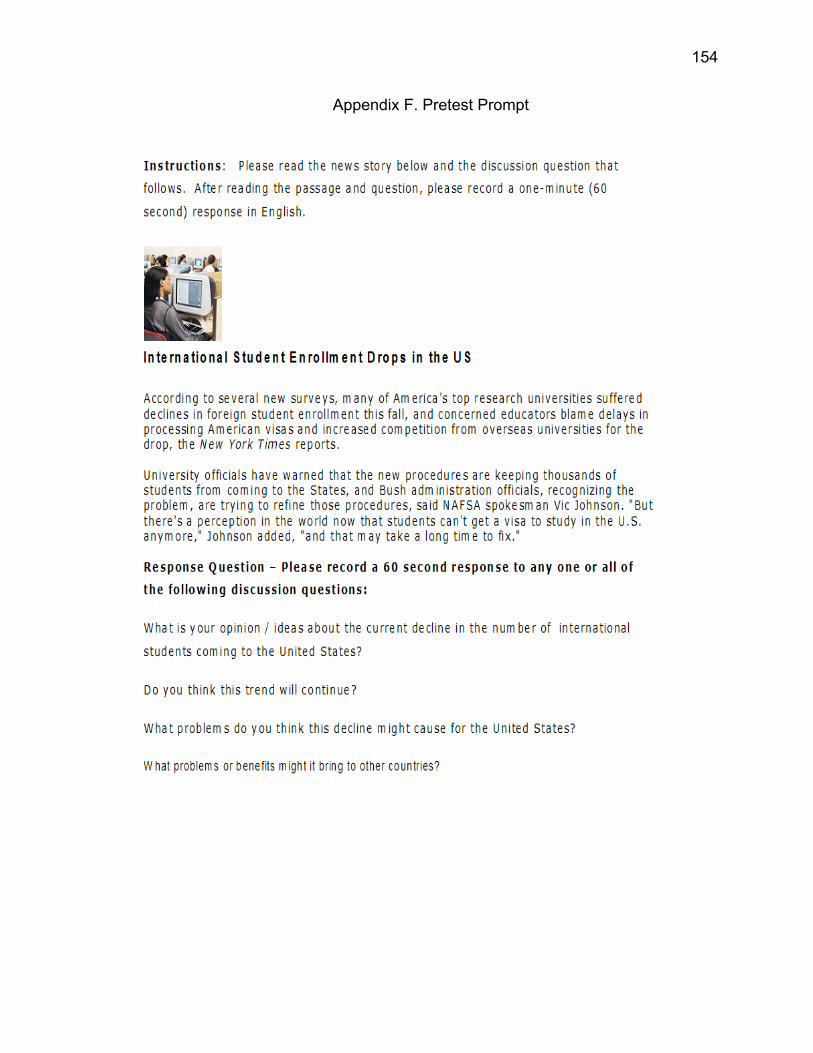
154
Appendix F. Pretest Prompt
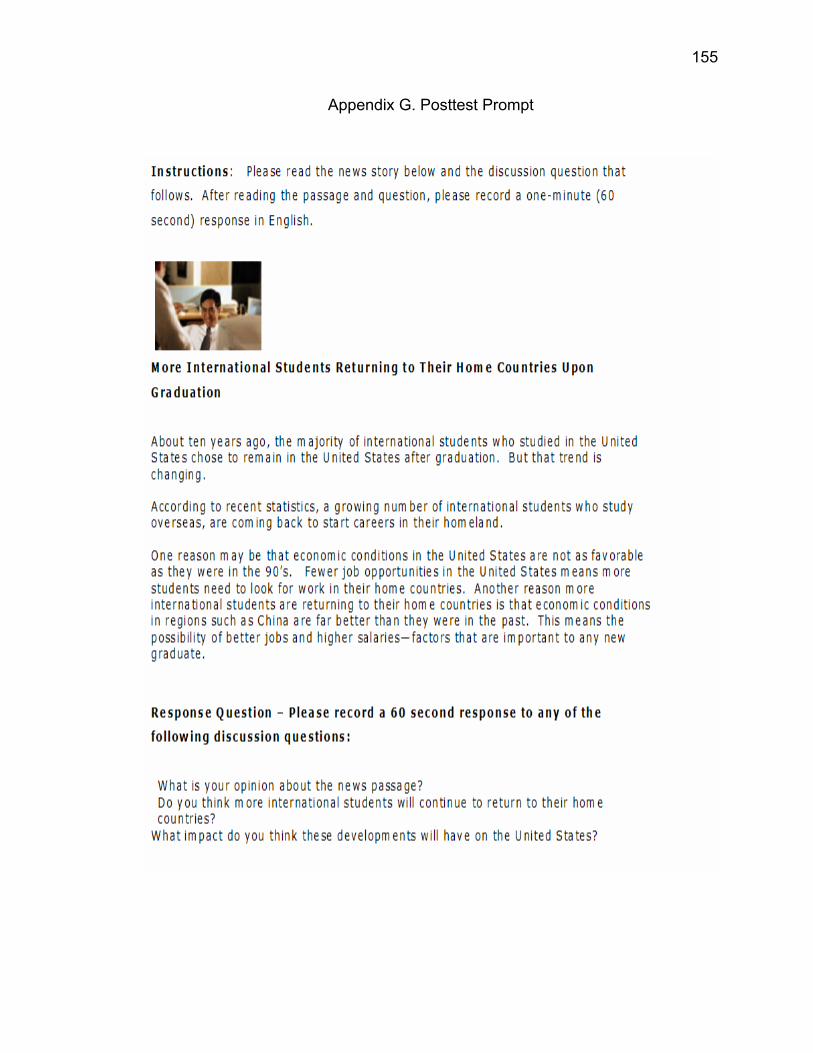
155
Appendix G. Posttest Prompt
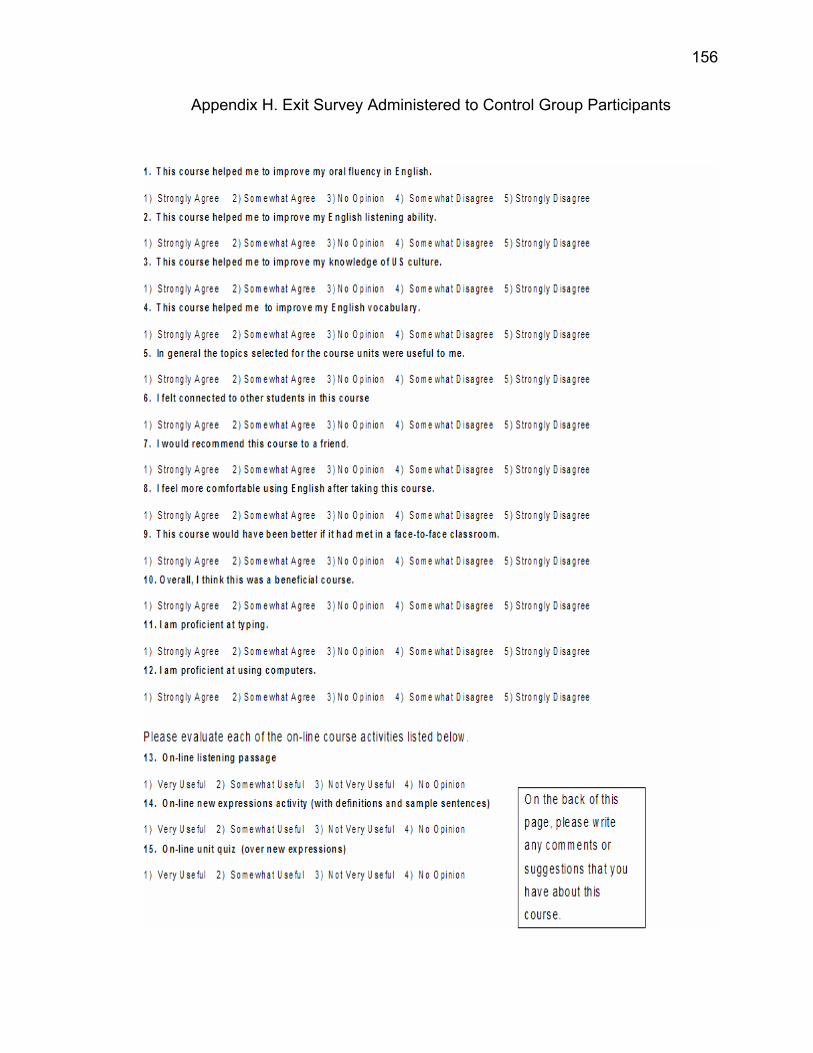
156
Appendix H. Exit Survey Administered to Control Group Participants
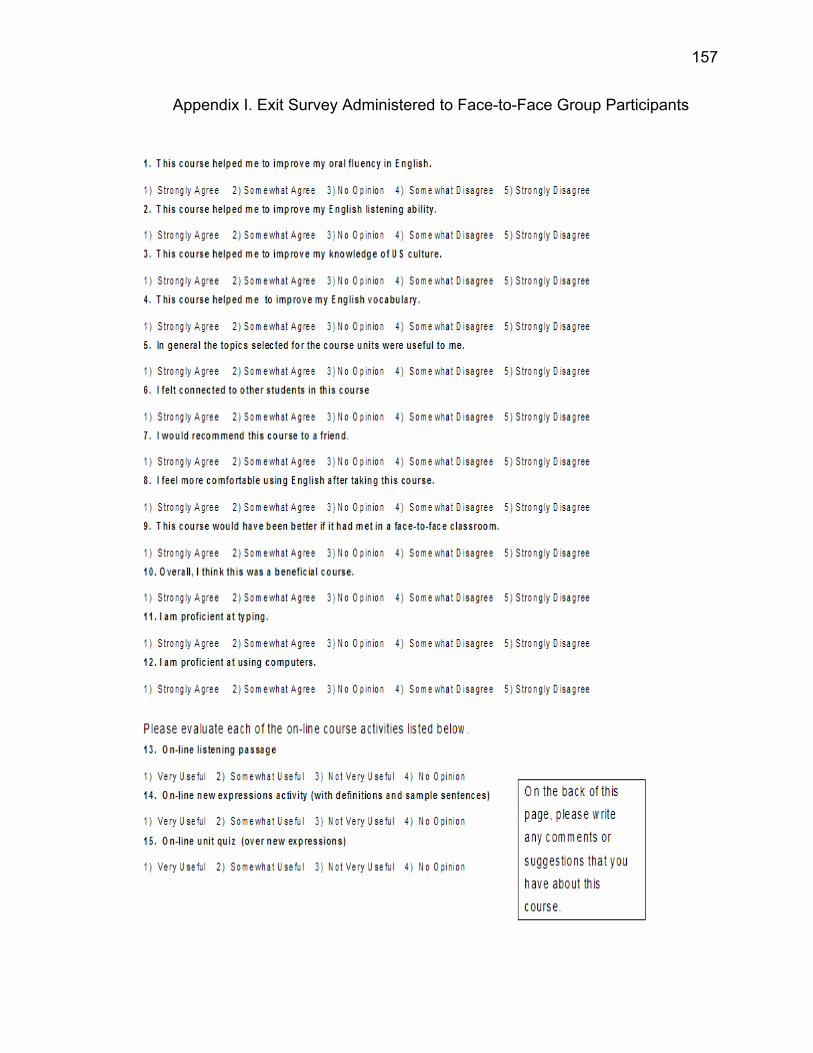
157
Appendix I. Exit Survey Administered to Face-to-Face Group Participants

158
Appendix J. Exit Survey Administered to Internet Chat group Participants

159
Appendix K. Face-to-Face group Responses to Open Ended Question on Exit Survey
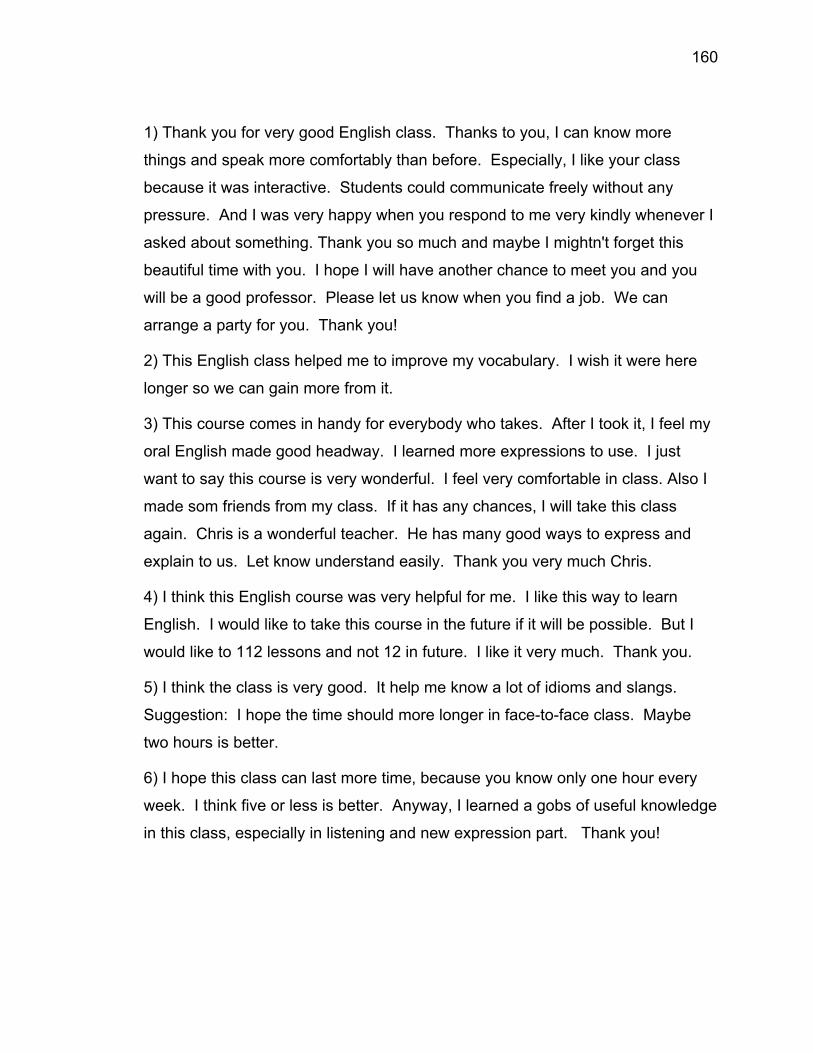
160
1) Thank you for very good English class. Thanks to you, I can know more
things and speak more comfortably than before. Especially, I like your class
because it was interactive. Students could communicate freely without any
pressure. And I was very happy when you respond to me very kindly whenever I
asked about something. Thank you so much and maybe I mightn't forget this
beautiful time with you. I hope I will have another chance to meet you and you
will be a good professor. Please let us know when you find a job. We can
arrange a party for you. Thank you!
2) This English class helped me to improve my vocabulary. I wish it were here
longer so we can gain more from it.
3) This course comes in handy for everybody who takes. After I took it, I feel my
oral English made good headway. I learned more expressions to use. I just
want to say this course is very wonderful. I feel very comfortable in class. Also I
made som friends from my class. If it has any chances, I will take this class
again. Chris is a wonderful teacher. He has many good ways to express and
explain to us. Let know understand easily. Thank you very much Chris.
4) I think this English course was very helpful for me. I like this way to learn
English. I would like to take this course in the future if it will be possible. But I
would like to 112 lessons and not 12 in future. I like it very much. Thank you.
5) I think the class is very good. It help me know a lot of idioms and slangs.
Suggestion: I hope the time should more longer in face-to-face class. Maybe
two hours is better.
6) I hope this class can last more time, because you know only one hour every
week. I think five or less is better. Anyway, I learned a gobs of useful knowledge
in this class, especially in listening and new expression part. Thank you!
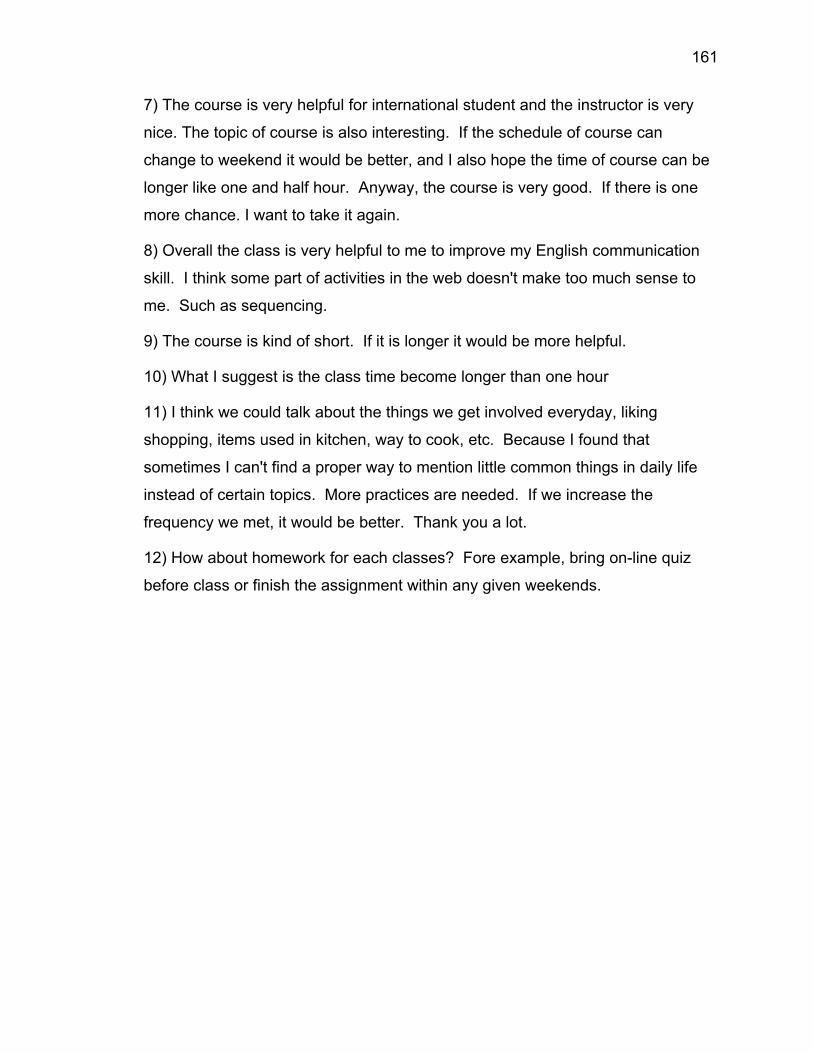
161
7) The course is very helpful for international student and the instructor is very
nice. The topic of course is also interesting. If the schedule of course can
change to weekend it would be better, and I also hope the time of course can be
longer like one and half hour. Anyway, the course is very good. If there is one
more chance. I want to take it again.
8) Overall the class is very helpful to me to improve my English communication
skill. I think some part of activities in the web doesn't make too much sense to
me. Such as sequencing.
9) The course is kind of short. If it is longer it would be more helpful.
10) What I suggest is the class time become longer than one hour
11) I think we could talk about the things we get involved everyday, liking
shopping, items used in kitchen, way to cook, etc. Because I found that
sometimes I can't find a proper way to mention little common things in daily life
instead of certain topics. More practices are needed. If we increase the
frequency we met, it would be better. Thank you a lot.
12) How about homework for each classes? Fore example, bring on-line quiz
before class or finish the assignment within any given weekends.

162
Appendix L. Internet Chat group Responses to Open Ended Question on Exit Survey
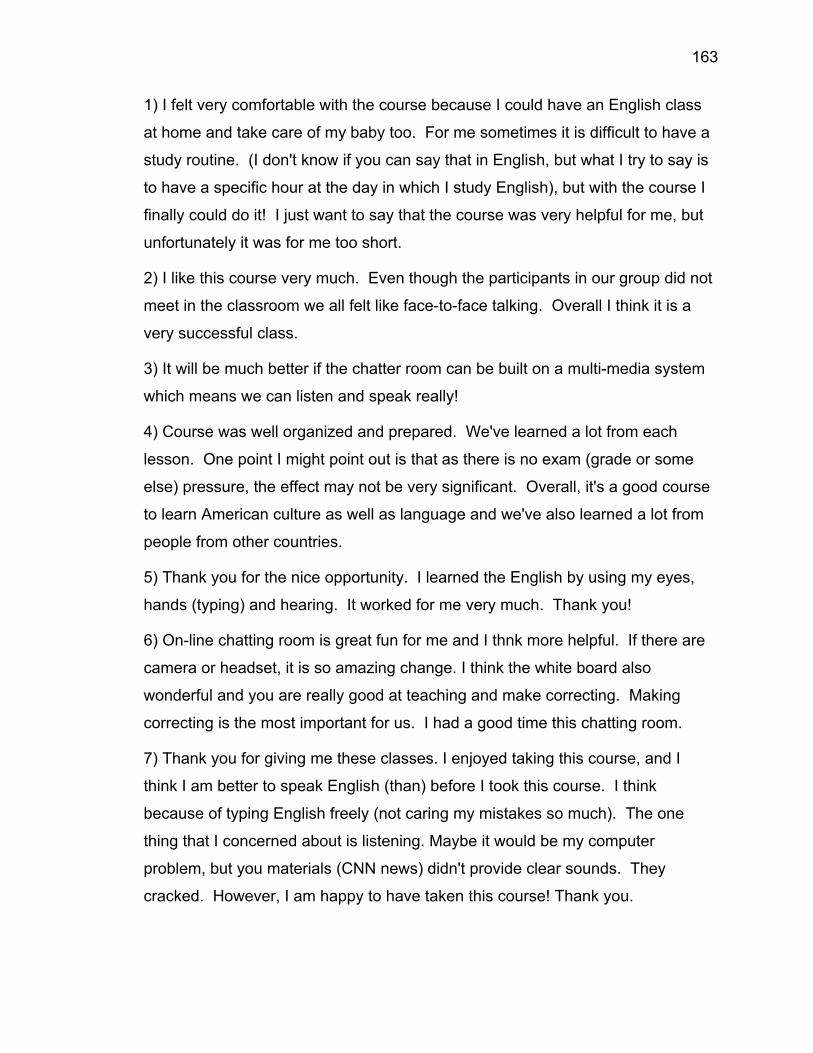
163
1) I felt very comfortable with the course because I could have an English class
at home and take care of my baby too. For me sometimes it is difficult to have a
study routine. (I don't know if you can say that in English, but what I try to say is
to have a specific hour at the day in which I study English), but with the course I
finally could do it! I just want to say that the course was very helpful for me, but
unfortunately it was for me too short.
2) I like this course very much. Even though the participants in our group did not
meet in the classroom we all felt like face-to-face talking. Overall I think it is a
very successful class.
3) It will be much better if the chatter room can be built on a multi-media system
which means we can listen and speak really!
4) Course was well organized and prepared. We've learned a lot from each
lesson. One point I might point out is that as there is no exam (grade or some
else) pressure, the effect may not be very significant. Overall, it's a good course
to learn American culture as well as language and we've also learned a lot from
people from other countries.
5) Thank you for the nice opportunity. I learned the English by using my eyes,
hands (typing) and hearing. It worked for me very much. Thank you!
6) On-line chatting room is great fun for me and I thnk more helpful. If there are
camera or headset, it is so amazing change. I think the white board also
wonderful and you are really good at teaching and make correcting. Making
correcting is the most important for us. I had a good time this chatting room.
7) Thank you for giving me these classes. I enjoyed taking this course, and I
think I am better to speak English (than) before I took this course. I think
because of typing English freely (not caring my mistakes so much). The one
thing that I concerned about is listening. Maybe it would be my computer
problem, but you materials (CNN news) didn't provide clear sounds. They
cracked. However, I am happy to have taken this course! Thank you.

164
Appendix M. Control group Responses to Open Ended Question on Exit Survey
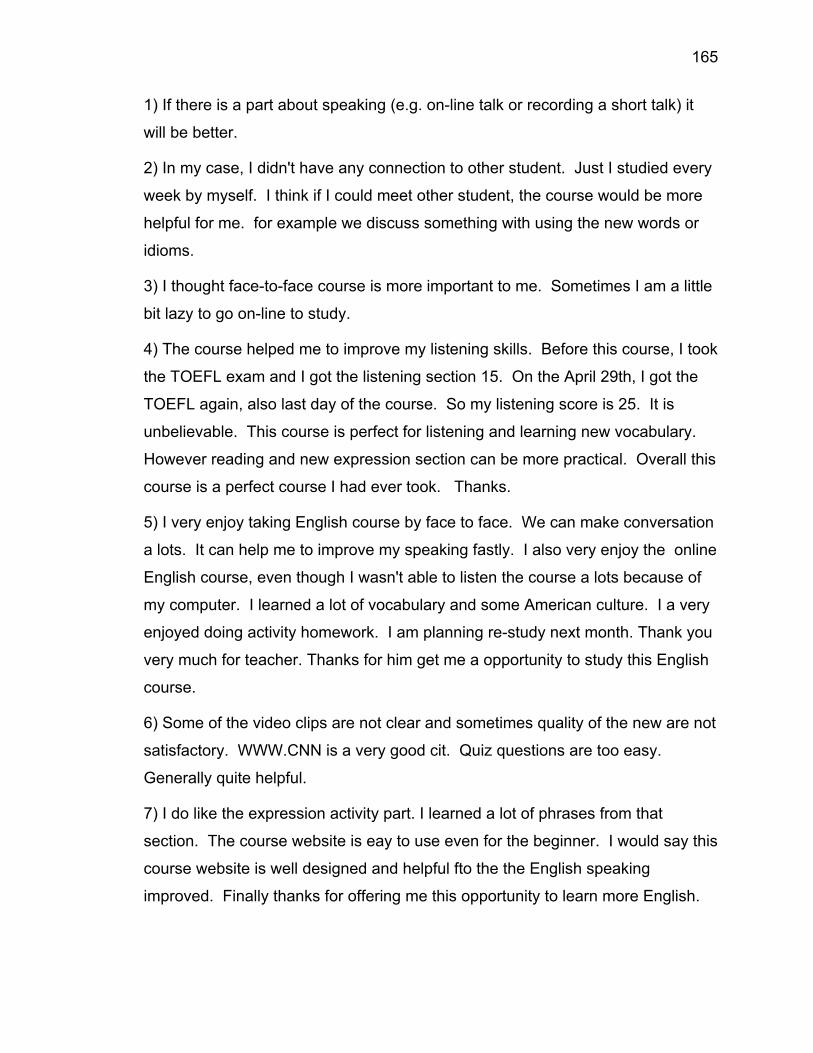
165
1) If there is a part about speaking (e.g. on-line talk or recording a short talk) it
will be better.
2) In my case, I didn't have any connection to other student. Just I studied every
week by myself. I think if I could meet other student, the course would be more
helpful for me. for example we discuss something with using the new words or
idioms.
3) I thought face-to-face course is more important to me. Sometimes I am a little
bit lazy to go on-line to study.
4) The course helped me to improve my listening skills. Before this course, I took
the TOEFL exam and I got the listening section 15. On the April 29th, I got the
TOEFL again, also last day of the course. So my listening score is 25. It is
unbelievable. This course is perfect for listening and learning new vocabulary.
However reading and new expression section can be more practical. Overall this
course is a perfect course I had ever took. Thanks.
5) I very enjoy taking English course by face to face. We can make conversation
a lots. It can help me to improve my speaking fastly. I also very enjoy the online
English course, even though I wasn't able to listen the course a lots because of
my computer. I learned a lot of vocabulary and some American culture. I a very
enjoyed doing activity homework. I am planning re-study next month. Thank you
very much for teacher. Thanks for him get me a opportunity to study this English
course.
6) Some of the video clips are not clear and sometimes quality of the new are not
satisfactory. WWW.CNN is a very good cit. Quiz questions are too easy.
Generally quite helpful.
7) I do like the expression activity part. I learned a lot of phrases from that
section. The course website is eay to use even for the beginner. I would say this
course website is well designed and helpful fto the the English speaking
improved. Finally thanks for offering me this opportunity to learn more English.
166
8) I would have liked exercises that force me to write my opinions down. So the
exercises were very easy except the sequencing thing. I did not like this exercise
because I was always wrong.
10 ) The best method to imoprove a foreigners English level, I think, is
conversation face by face. Since language is just a tool for us to communicate
with each other. So I strongly advised that a chat room class is a very good form
of studying English in real classroom or online chat room through microphone.

VITA
167
VITA
Christopher Grant Blake Department of English
Purdue University 500 Oval Drive, West Lafayette, IN 47907
________________________________________________________________
Education
Doctorate of Philosophy, English Language Linguistics, August 2006 Purdue University, West Lafayette, IN Secondary Area: Education Technology Advisor: April J. Ginther Master of Science in Education, Educational Studies, May 1999 Purdue University, West Lafayette, IN Bachelor of Arts, Secondary English Education, May 1993 Purdue University, West Lafayette, IN Summa Cum Laude
Conference Presentations
Blake, C.G., (2005, July) “Revision of an ITA Curriculum: A Case Study.” In A. J. Ginther (Chair), Toward an Ecological Approach to International Teaching Assistant Preparation, Symposium conducted at the 14th World Conference of Applied Linguistics, Madison, Wisconsin. Blake. C.G. (2005, July) “Now she’s fluent – Now she’s not: Issues in defining and measuring fluency from a World Englishes perspective.” Paper presented at the 11th Annual International Association for World Englishes Conference, Purdue University. Blake, C.G, & Zhen, Z. (2003, March) “The Potential of CALL in China.” Paper presented at TESOL 2003, Baltimore, Maryland. Blake, C.G. (2002, October) “A Sociolinguistic Profile of English in China.” Paper presented at the 9th Annual International Association for World Englishes Conference, University of Illinois at Urbana-Champaig
168
Graduate Coursework Linguistics Introduction to English and General Linguistics Sociolinguistics World Englishes English Syntax and Syntactic Theory Phonology English Second Language Second Language Writing English Second Language Theory and Foundations English Second Language Principles and Practice Education International Education Comparative Education Administration in Education Systems The American College and University Personal Dynamics in the Classroom Counseling Multicultural and Diverse Populations Testing Language Testing Research Methodology Introduction to Education Research Methodology Higher Education Law Methods in Social Research Qualitative Research Methods in Education Research Design in Language and Linguistics Education Technology Foundations of Distance Education Strategic Evaluation of On-Line Learning Issues and Methods in Education Technology Research
169
Teaching
Domestic Higher Education English 002: Written Communication for International Graduate Students Purdue University, Fall 2005 English 227: Elements of Linguistics Purdue University, Spring 2005 English 001T: Classroom Communication for International Teaching Assistants Purdue University, Fall 2001 - Fall 2004 English Composition Tutor Purdue University Writing Lab, 1991- 1993 Dean of Students Tutor Horizons Program, Purdue University, 1991- 1992 Overseas Teaching Advanced College Composition Changchun, P.R.China. College of Optics and Fine Mechanics, Fall 1993 - Spring 1995 Business English for College Seniors Changchun, P.R.China. College of Optics and Fine Mechanics, Fall 1993 - Spring 1995 Band-4 ESL Prep Course Changchun, P.R.China. College of Optics and Fine Mechanics, Fall 1993 – Spring 1995
Academic Employment ESL Program Assistant Director Purdue University June 1999-August 2001 Advisor & Summer Programs Coordinator Purdue Programs for Study Abroad September 1996 - June 1999
170
Coordinator, Purdue International Friendship Program Purdue International Students & Scholars Office July 1998 - June 1999 Immigration Clerk Purdue International Students & Scholars Office August 1995 - July 1996 Instructor of English College of Optics and Fine Mechanics, Changchun, P.R. China August 1993 – May 1995
Academic Service
Local Committee Member International Association for World Englishes Conference July 2005 Guest Speaker – Technology Workshop for Teachers Purdue Village ESL Program Spring 2003 Assistant to the Chief Editor Books One-Four, New Practical English (Comprehensive Course), Beijing: China Higher Education Press, 2003
Community and International Service Children’s Ministry Coordinator Upper Room Christian Fellowship, West Lafayette, IN July 2000 – May 2006 Boy Scout’s of America West Lafayette, IN August 2005 – May New Chauncey Neighborhood Association West Lafayette, IN July 2000-May 2006 Y.W.A.M (Youth With a Mission) Singapore and Bangkok, Thailand September 1988-February 1989 International Students and Scholars Office Purdue University 1989-1993
171
Honors, Awards and Affiliations Honors Phi Beta Kappa Phi Kappa Phi Dean’s List, Purdue University Awards First Prize: Kneale Literary Award, Papers in ESL Category, 2002 First Prize: Kneale Literary Award, Shakespeare Category, 1993 Outstanding Senior Award, Purdue University English Department, 1993 Affiliations Teachers of English to Speakers of Other Languages (TESOL) American Association for Applied Linguistics (AAAL) International Association for World Englishes (IAWE)
References
April Ginther, Associate Professor of English Director of Oral English Proficiency Program (OEPP) Oral English Proficiency Program 302 Wood Street 810 Young Hall West Lafayette, IN 47907-2108 Tel: (765) 494-9380 E-mail: [email protected] Margie Berns, Professor of English Director of Graduate Program in English as a Second Language (ESL) Department of English, Purdue University 500 Oval Drive, West Lafayette, IN 47907 Tel: (765) 494-3769 E-mail: [email protected] Tony Silva, Professor of English Director of ESL Writing Program Department of English, Purdue University 500 Oval Drive, West Lafayette, IN 47907 Tel: (765) 494-3769 E-mail: [email protected]
Related Documents