Copyright © 2009 IEEE. Citation for the published paper: Title: Test Bench for Self-healing Functionalities applied on Distribution Network with Distributed Generators Authors: L. Le-Thanh, Member, IEEE, R. Caire, Member, IEEE, B.Raison, Member, IEEE S. Bacha, Member, IEEE, F. Blache, G.Valla Conference: Powertech, Bucharest, March 2009 This material is posted here with the permission of IEEE. Such permission of the IEEE does not in any way imply IEEE endorsement of any of INTEGRAL partners’ products or services Internal or personal use of this material is permitted. However, permission to reprint/public this material for advertising or promotional purposes or for creating new collective works for resale or redistribution must be obtained from the IEEE by sending a blank email message to [email protected] By choosing to view this document, you agree to all provisions of the copyright laws protecting it.

Welcome message from author
This document is posted to help you gain knowledge. Please leave a comment to let me know what you think about it! Share it to your friends and learn new things together.
Transcript

Copyright © 2009 IEEE.
Citation for the published paper:
Title: Test Bench for Self-healing Functionalities applied on Distribution Network
with Distributed Generators
Authors: L. Le-Thanh, Member, IEEE, R. Caire, Member, IEEE, B.Raison, Member,
IEEE S. Bacha, Member, IEEE, F. Blache, G.Valla
Conference: Powertech, Bucharest, March 2009
This material is posted here with the permission of IEEE. Such permission of the IEEE does
not in any way imply IEEE endorsement of any of INTEGRAL partners’ products or services
Internal or personal use of this material is permitted. However, permission to reprint/public
this material for advertising or promotional purposes or for creating new collective works for
resale or redistribution must be obtained from the IEEE by sending a blank email message to
By choosing to view this document, you agree to all provisions of the copyright laws
protecting it.

1
Abstract—Increasing complexity of interconnected electr icity
gr ids with a high integration level of dispersed generators leads that “ business as usual” operating modes and regular devices in distr ibution networks are not efficient enough to ensure the centralized management of a large amount of information and high-level functionalities (Advanced Distr ibution Automation-ADA) for future electr icity distr ibution networks. This weakness could be solved by distr ibuting the management system locally and by smartly using advanced Information and Communication Technology (ICT) Systems. This paper is based on the work per formed within the European research project INTEGRAL. I t presents a new research path to investigate the validation of an active distr ibution system, with high integration of ICTs, through an reduced scale analogical demonstration network. The analogical (µGr id) construction, which relies on a real French distr ibution network, is introduced and detailed. Then, the high level ICT systems enabling self-healing functionalities will be presented to explain how Remote Terminal Units (RTUs) and ICT hardware will be coordinated in this µGr id. Finally, the µGr id reduction procedures will be validated in this paper through both static and dynamic simulations.
Index Terms—Hardware in the Loop Simulator , RTUs testing,
ICTs sizing, Agent Based Systems evaluation, Distr ibution Network, Distr ibuted DMS, Restoration process, Distr ibuted Generators, Normally open switches, Protection devices.
I. INTRODUCTION
he large scale integration of Distributed Energy Resources (DER), sources plus controllable load, locally into the
electricity grid gives new challenges. Indeed, the distribution networks must progress to optimally exploit these new components. These evolutions differ from one country to another, depending on their development strategies as well as their technologies capacity. Such evolutions could be accomplished into three main steps: Automated Grids, Intelligent Grids, and Smart Grids. In Automated Grids, which
Manuscript received October 31st, 2008; revised March 1st, 2009. L. Le-Thanh is with IDEA, a joint research center between EDF, Schneider
Electric and Grenoble Institute of Technology, S. Bacha, F. Blache, G. Valla B. Raison and R. Caire are with Grenoble Institute of Technology – G2Elab (Grenoble Electrical Engineering laboratory ), France (phone: 033-476826200; e-mail: [email protected]). This work was funded partially by the European Commission under the 6th framework program number FP6-038576 call FP6-2005-TREN-4.
have been common for quite some time now, manually operated functions are substituted with automated components. The next step is Intelligent Grids which are equipped with ICT to achieve a common optimization goal between several grid components. The new paradigm "Smart Grid" is an electricity network that can smartly integrate the actions of all users connected to it - both generators and loads - in order to efficiently deliver sustainable, economic and secured electricity supplies. Besides, facing important technical and economical challenges for every distribution network, operator and customer have to follow (separately or together) this evolution. It opens also an excellent opportunity to progress toward a flexibility and efficiency of distribution network operation. In order to gradually attain this ultimate objective, and among other recent European Projects, CRISP [1] and MICROGRID [2-3] had developed and tested various new control concepts for grid management and Distributed Energy Resource and/or Renewable Energy Source (DER/RES) coordination. They built core algorithms and functionalities to integrate advanced ICT technologies (such as agents) into active distribution network. On the same ambitious research direction, the INTEGRAL project (Integrated ICT- platform based Distributed Control (IIDC) in electricity grids with large share of Distributed Energy Resources and Renewable Energy Sources), will push the investigations further. The practical validations of INTEGRAL project rely on three field tests which will cover a large range of different conditions including: normal, cr itical and emergency operations. All these demonstrations will show the advantages and the robustness of agent based coordination for network devices and DER/RES sharing, in a common framework, a cost effective and reliable ICT architecture. This architecture is philosophically a bottom-up process and the sizing of such concept has to be assessed. Various actors, such as grid operator and DER owners, will get benefits of such common ICT infrastructure.
The emergency demonstration will take place in Grenoble Institute of Technology (Grenoble-INP). The setup of the analogical micro distribution network at Grenoble Electrical Engineering laboratory (G2Elab) for the emergency operation investigation will be firstly introduced with its electro-
Test Bench for Self-healing Functionalities applied on Distribution Network with
Distributed Generators L. Le-Thanh, Member, IEEE, R. Caire, Member, IEEE, B.Raison, Member, IEEE
S. Bacha, Member, IEEE, F. Blache, G.Valla
Th

2
technical scale reduction. This reduction keeps not only the similarity of the power flow through the network conductors but also the dynamic behavior of the distributed resources. Some self-healing concepts and ICT system associated to overcome the operations as a fault occurs and fast up the restoration process are then presented. Then, the specific ICTs infrastructure which includes the measurement, collection and control of the automation devices as well the communication system between components and between each component and the intelligent agent is described. The paper will conclude with preliminary results on the sizing of the reduced scale distribution network (power flow and dynamic simulation).
II. ANALOGICAL µGRID CONSTRUCTION
This demonstration facility of emergency operation is included in a wider research platform called PREDIS (Smart Networks for Energy) which aims to demonstrate, among others subjects, the energy management of DER/RES. Some analogical micro networks are installed. The RDPREDIS (PREDIS Distribution network) has been replicated from a real French distribution network with minor changes. It will be used, among other things, to illustrate the self-healing functionalities and restoration process. These investigations rely on the outcomes of the CRISP demo B project [4]. The difference with the previous demo project is that all of the concepts and algorithms developed within CRISP project such as Cell Level concept and Help Tool Fault Diagnosis (HTFD, the self-healing process) software will not be applied on data resulting from real-time simulations of a power system but on data measured directly from the analogical micro grid. The analogical micro distribution network (figure 1) is built by aggregating some feeders of a real distribution network having 30 MVA rated power at 20 kV. In order to best represent the behavior of a real network, and satisfy economical conditions,
the network of test bench of 30kVA, 0.4kV was adopted. The topology of real network and µGrid are presented in
figure 1 and 2. The architecture is entirely a looped system operated as a radial system. The system could be fed by three different injection points which make possible the self-healing ability. In case of a fault occurring in a part of the network, the operator can act on the tie switches to supply again the unsupplied loads from another feeder.
The scale reduction of the µGrid components is carried out by relying on the power and voltage reduction ratios to assure the similarity between real network and µGrid. The impedances of line and transformer are reduced from the real network as shown in equation 1:
)( .²
)( z Ω=Ω Zλµ
Eq.1
where
rid
Real Grid
S
SGµλ = : is the power reduction ratio
Grid
Real Grid
U
Uµµ = : is the voltage reduction ratio.
The reduction values of line impedance and the power of corresponding load and generator for µGrid are given in Figure 2.
The dynamic components in the network are mainly synchronous generators and their control command systems, because every DERs are represented as micro synchronous generators for self-healing testing.
The magnetic and mechanical similarities are taken into account. The choice of the dedicated machine for the µGrid should be determined carefully so that all the similarity conditions are satisfied.
Fig 1. Topology of the EDF distribution feeders 20kV

3
M
M
M
M M
M
M
G∼∼∼∼
G∼∼∼∼G∼∼∼∼ G∼∼∼∼
G∼∼∼∼MM RD2
RD2
RD2
N1
N2 N3
N4
N11 N12 N13
N14
N5N6 N9
N7N10 N8
LO61kW
LO22kW DG3
2kW
DG35.5kW
LO52kW
DG12kW
LO71kW
LO91kW
DG35.5kW
LO16kW
LO34kW
LO101kW
DG21kW
G∼∼∼∼
DG630kW
ZL14
ZL5ZL6
ZL7
ZL8
ZL16
ZL1ZL2 j 2.56
j1.28 (Ohm)
0.4+j0.35 (Ohm)2.13+j0.94 (Ohm)
1.23+j0.70 (Ohm)0.09+j0.14 (Ohm)
0.63+j0.26 (Ohm)
2.68++j4.2 (Ohm)
0.89+j1.4 (Ohm)ZL4
ZL17
0.89+j1.4 (Ohm)
ZL3 j2.56(Ohm)
2.68++j4.2 (Ohm)
ZL15
ZL9 0.98+j0.56 (Ohm)
0.98+j0.56 (Ohm)
ZL8
ZL11
ZL13 0.06+j0.03 (Ohm)
EDF supply 410 V
MM
MM
MM
MM MM
MM
MM
G∼∼∼∼G∼∼∼∼
G∼∼∼∼G∼∼∼∼
G∼∼∼∼G∼∼∼∼ G∼∼∼∼
G∼∼∼∼
G∼∼∼∼G∼∼∼∼
MMMM RD2
RD2
RD2
N1
N2 N3
N4
N11 N12 N13
N14
N5N6 N9
N7N10 N8
LO61kW
LO22kW DG3
2kW
DG35.5kW
LO52kW
DG12kW
LO71kW
LO91kW
DG35.5kW
LO16kW
LO34kW
LO101kW
DG21kW
G∼∼∼∼G∼∼∼∼
DG630kW
ZL14
ZL5ZL6
ZL7
ZL8
ZL16
ZL1ZL2 j 2.56
j1.28 (Ohm)
0.4+j0.35 (Ohm)2.13+j0.94 (Ohm)
1.23+j0.70 (Ohm)0.09+j0.14 (Ohm)
0.63+j0.26 (Ohm)
2.68++j4.2 (Ohm)
0.89+j1.4 (Ohm)ZL4
ZL17
0.89+j1.4 (Ohm)
ZL3 j2.56(Ohm)
2.68++j4.2 (Ohm)
ZL15
ZL9 0.98+j0.56 (Ohm)
0.98+j0.56 (Ohm)
ZL8
ZL11
ZL13 0.06+j0.03 (Ohm)
EDF supply 410 V
Fig 2. Topology of the analogical distribution µGrid
The magnetic similarity, that means the synchronous
reactance, transient and sub-transient reactance in reduced per unit value must be equal to the ones of the machine being represented. Meanwhile, for small size generators, the reactance values are much lower, in reduced value, than for large size generators. For a given synchronous generator from a manufacturer, the synchronous reactance and the magnetizing curve are predefined, but it is possible to vary within a certain limit the transient and sub-transient reactance without significantly modifying the others by adding a series reactance. This additional reactance sensibly increases the transient and sub-transient reactance without causing any modification on the others reduced characteristics.
Mechanic similarity condition is expressed by the equality of launch time of the rotor. That means that the following equation must be satisfied:
2 2
n n
i I
p P
ω Ω= (Eq.2)
where: i ω and pn is inertia moment, rotation speed and nominal power respectively of micro generator.
I, Ω, Pn is inertia moment, rotation speed and nominal power respectively of real generator. From an energy point of view, equation 2 can be expressed as:
2
2
121
2
n
n
i p
PI
ω=
Ω (Eq.3)
_
_
kinetic
real kinetic
W
Wµ λ= (Eq.4)
That means that the inertia moment of micro generator should be assembled so that the kinetic energy stored at the nominal speed in the masses of micro and real generator must be
proportional to power reduction ratio of two machines. This condition could be done by adding to the moving part of micromachine a flywheel which gives to the generation system the correct reduced inertia [5]. Before using the analogical µGrid, simulations of this grid are required to validate every reduction formula. The simulation is carried out with the dynamic simulation software Eurostag [6].
To simulate the generator, a simplified model is used. The model has only a single excitation winding on rotor that makes it possible to take into account the effect of excitation system on the dynamic behavior of generator. Because of the small size of synchronous generators, the Var/Power factor regulation which maintains reactive power and power factor constant has been chosen for the excitation system. The prime mover and speed governor are modeled as a PI type with a feedback loop. The control law is design to keep the active power constant (a power limiter is used). The regulator, control actuator and the thermodynamic process part is equivalent to a 1st order function [7].
III. ICT SYSTEMS ENABLING SELF HEALING FUNCTIONALITIES
The self-healing functionalities used within demonstration C of INTEGRAL project relies on outcome of CRISP project and the modern fault detection and location algorithm developed in G2Elab for distribution system in presence of DERs. The algorithm bases on the broad use of telemetry and telecontrol systems. Once a fault (short circuit mainly) is cleared by protective devices in MV networks, the smallest faulty part should be quickly located and isolated by gathering, coordinating and processing the information resulted from communicating devices/sensors. The aim at this stage is to be as efficient as possible and as quickly as possible: the faulty zone must be the tiniest. Depending on the remotely controlled switch locations, the possible congestions on the lines and the dispatchability of DER/RES, the restoration process will be assured by an Intelligent Agent to ensure the safety of the whole process.
4
During these operations, to boost the fault location, fault distance computations with an impedance based approach indicate an estimated distance of fault from the substation. This estimation does not ensure the precise location of fault due to many bifurcations in the network. In order to determine exactly the faulty section, it is often necessary to get further information from communicating Fault Indicators (FI) and to cross them with the computed distance. Let us note that the fault distance computations could be performed with measurements taken elsewhere in the feeder.
A method using combination of FIs states and fault distance computations from substation or other locations was previously developed during CRISP Project. The advantages of this method consist of its high autonomous level for fault location with a dedicated ICT infrastructure. This method has been proved to be very fruitful when many branches and ramifications are present in the distribution network. Today and once the fault is located, the operators have to execute several pre-planed operations to reenergize the sane portions of network and to reduce as much as possible the number of customers affected by the fault. That is called Service Restoration.
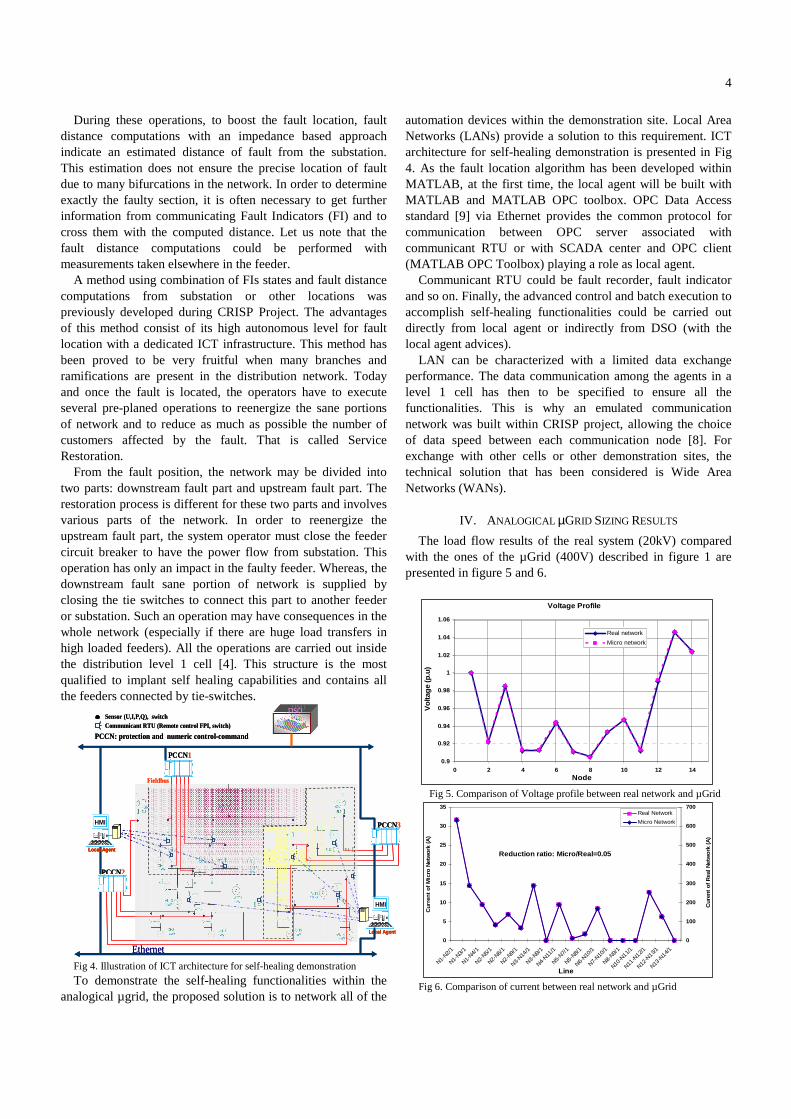
From the fault position, the network may be divided into two parts: downstream fault part and upstream fault part. The restoration process is different for these two parts and involves various parts of the network. In order to reenergize the upstream fault part, the system operator must close the feeder circuit breaker to have the power flow from substation. This operation has only an impact in the faulty feeder. Whereas, the downstream fault sane portion of network is supplied by closing the tie switches to connect this part to another feeder or substation. Such an operation may have consequences in the whole network (especially if there are huge load transfers in high loaded feeders). All the operations are carried out inside the distribution level 1 cell [4]. This structure is the most qualified to implant self healing capabilities and contains all the feeders connected by tie-switches.
PCCN1
PCCN3
PCCN2
HMI
Local Agent
HMI
Local Agent
DSODSO
Fieldbus
Ethernet
Sensor (U,I ,P,Q), switchCommunicant RTU (Remote control FPI, switch)
PCCN: protection and numeric control-command
PCCN1
PCCN3
PCCN2
HMI
Local Agent
HMI
Local Agent
HMI
Local Agent
HMI
Local Agent
HMI
Local Agent
DSODSO
Fieldbus
Ethernet
Sensor (U,I ,P,Q), switchCommunicant RTU (Remote control FPI, switch)
PCCN: protection and numeric control-command
Fig 4. Illustration of ICT architecture for self-healing demonstration
To demonstrate the self-healing functionalities within the analogical µgrid, the proposed solution is to network all of the
automation devices within the demonstration site. Local Area Networks (LANs) provide a solution to this requirement. ICT architecture for self-healing demonstration is presented in Fig 4. As the fault location algorithm has been developed within MATLAB, at the first time, the local agent will be built with MATLAB and MATLAB OPC toolbox. OPC Data Access standard [9] via Ethernet provides the common protocol for communication between OPC server associated with communicant RTU or with SCADA center and OPC client (MATLAB OPC Toolbox) playing a role as local agent.
Communicant RTU could be fault recorder, fault indicator and so on. Finally, the advanced control and batch execution to accomplish self-healing functionalities could be carried out directly from local agent or indirectly from DSO (with the local agent advices).
LAN can be characterized with a limited data exchange performance. The data communication among the agents in a level 1 cell has then to be specified to ensure all the functionalities. This is why an emulated communication network was built within CRISP project, allowing the choice of data speed between each communication node [8]. For exchange with other cells or other demonstration sites, the technical solution that has been considered is Wide Area Networks (WANs).
IV. ANALOGICAL µGRID SIZING RESULTS
The load flow results of the real system (20kV) compared with the ones of the µGrid (400V) described in figure 1 are presented in figure 5 and 6.
Voltage Profile
0.9
0.92
0.94
0.96
0.98
1
1.02
1.04
1.06
0 2 4 6 8 10 12 14Node
Vo
ltag
e (p
.u)
Real network
Micro network
Fig 5. Comparison of Voltage profile between real network and µGrid
Reduction ratio: Micro/Real=0.05
0
5
10
15
20
25
30
35
N1-N2/
1
N1-N3/
1
N1-N4/
1
N2-N5/
1
N2-N6/
1
N2-N9/
1
N3-N14
/1
N3-N9/
1
N4-N11
/1
N5-N7/
1
N5-N8/
1
N6-N10
/1
N7-N10
/1
N8-N9/
1
N10-N
11/1
N11-N
12/1
N12-N
13/1
N13-N
14/1
Line
Cu
rren
t o
f M
icro
Net
wo
rk (
A)
0
100
200
300
400
500
600
700
Cu
ren
t o
f R
eal
Net
wo
rk (
A)
Real Network
Micro Network
Fig 6. Comparison of current between real network and µGrid

5
The first one shows the coincidence about voltage profile
between the two grids. The second one is the current flowed into the electrical conductor in normal operation.
The values of current are similar once integrated the reduction ratio of the current µGrid / RealGrid = 0.05. The parameters of µGrid components are adapted to ensure the similarity principals presented above.
In order to consider the dynamic effect of the generator after reduction, a three phase short circuit in a line with the fault resistance Rfault=4Ω (corresponding to a Rfault=10Ω in the real grid) during 200 ms is considered. Figure 7 and 8 show the dynamic behavior (Machine speed and internal angle respectively) of this generator in comparison between the three cases: the ones of the real grid, the ones of the µgrid without adaptation and the ones of the µgrid with adaptation (additional inertia and serial impedance). A good coherence of the adapted machine to the real machine is observed.
48.0
48.5
49.0
49.5
50.0
50.5
51.0
51.5
52.0
52.5
99.90 100.30 100.70 101.10 101.50 101.90
Time (s)
Mac
hin
e S
pee
d (H
z)
Real Grid
Microgrid without adaptation
Microgrid with adaptation
Fig 7. Comparison of machine speed behavior
-40
-20
0
20
40
60
80
100
99.90 100.30 100.70 101.10 101.50 101.90
Time (s)
Inte
rnal
angle
(deg
res)
Real Grid
Microgrid without adaptation
Microgrid with adaptation
Fig 8. Comparison of internal angle behavior
V. CONCLUSIONS
The analogical micro network setup in Grenoble Institute of Technology is ready to demonstrate the proposed functionalities described above. The active distribution network will prove the ability of high level functionalities based on agent. Among them, the self-healing ability should be demonstrated. The study presented in this paper gives guidelines to build an integrated demonstrator for distributed DMS function validation. This step is mandatory to size correctly the needs in term of communication and computation performances. The self-healing study based on this µgrid will be carried out in the next step of the project.
VI. REFERENCES
[1] G.J. Schaeffer, H. Akkermand, et Al. “Final Summary Report” , Deliverable D5.3, 2006, http://crisp.ecn.nl/deliverables/D5.3.pdf
[2] A. Dimeas, N. Hatziargyriou, “Agent based Control for Microgrids” Power Engineering Society General Meeting, 2007. IEEE 24-28 June 2007 Page(s):1 – 5
[3] A. Dimeas, N. Hatziargyriou, “A multiagent system for microgrids” Power Engineering Society General Meeting, 2004. IEEE, 6-10 June 2004 Page(s):55 - 58 Vol.1
[4] Ch. Andrieu et. Al. "Fault detection, analysis and diagnostics in high DG distribution systems" Deliverable D1.4, 2006. http://www.ecn.nl/crisp/deliverables/D1.4.pdf
[5] Electricité de France, " Le Micro Réseau : 30 ans d'activité" Direction des Etudes et Recherches, Departement FCR, 1986
[6] P. Bornard, B. Meyer, M. Stubbe, J.P. Antoine, “EUROSTAG, a major step in power systems simulation” IERE, Rio de Janeiro meeting, 1991, Brazil
[7] L. Le-Thanh et al, "Dynamic behaviors of Distributed Generators and Proposed Solutions to avoid loss of Critical Generator", IEEE Power Engineering Society General Meeting, Tampa, Florida, USA, 2007.
[8] B. Tornqvist, M.Fontela, P. Mellstrand, R. Gustavsson, C. Andrieu, S, Bacha, N. Hadjsaid, Y.Besanger “Overview of ICT components and its application in electric power systems” , IEEE CRIS conference, Securing Critical Infrastructures, Grenoble, October 2004
[9] The MatWorks, MATLAB OPC Toollbox 2008 http://www.mathworks.com/products/opc/
VII. BIOGRAPHIES
Luong Le-Thanh (M’08) received his Diplôme d’Etudes Approfondies (DEA) and Doctorat de l’ INPG degrees from the Institut National Polytechnique de Grenoble (INPG) in 2004 and 2008, respectively. He is now working as a postdoctoral fellow researcher in the GIE-IDEA (FRANCE). His research interests are the power systems equivalent, power system stability and distributed generators' impacts in electrical distribution system.
Raphael Caire (M’04) received his Diplôme d’Etudes Approfondies (DEA) and Doctorat de l’ INPG degrees from the Institut National Polytechnique de Grenoble (INPG) in 2000 and 2004. He had been working in Power Electronic field, in USA at the Center of Power Electronic System (CPES) in 2000 and within several EDF research centers in Germany and in France from 2004 to 2006. He is now associate professor at Grenoble Institute of Technology (Grenoble-InP) at the Ecole d'ingénieurs en énergie eau et environnement (ENSE3) in the Grenoble Electrical Engineering laboratory (G2Elab). His research is centered on the impacts, production control of dispersed generation on distribution system and critical infrastructures.
Bertrand Raison (M’03) was born in Béthune, France in 1972. He received his M.S., Ph.D. and “Habilitation à Diriger des Recherches” degrees in electrical engineering from the INPG, France, in 1996, 2000 and 2007, respectively. He has joined since 2001 the Grenoble Electrical Engineering laboratory (G2Elab) and the Ecole d'ingénieurs en énergie, eau et environnement (ENSE3) as an associate professor. His general research interests are fault detection and localization in electrical systems.

6
Seddik Bacha received his Engineer and Master from National Polytechnic Institute of Algiers respectively in 1982 and 1990. He joined the Laboratory of Electrical Engineering of Grenoble (LEG) and received his PhD and HDR respectively in 1993 and 1998. He is presently manager of Power System Group of LEG and Professor at the University Joseph Fourier of Grenoble. His main fields of interest are power electronics systems, modeling and control, power quality, renewable energy integration
François Blache received his Ph-D in Electrical Engineering from « Institut National Polytechnique de Grenoble » (France) in 1995. He joined this institute in 2000, to work as Research Engineer in the Power System Group of the « Grenoble Electrical Engineering laboratory » (G2Elab). At present, he is in charge of Real-time hybrid simulation projects.
Related Documents