PROGRAMA OFICIAL DE POSGRADO INGENIERÍA Y PRODUCCIÓN INDUSTRIAL DOCTORAL THESIS Study of the transport of heavy metal ions through cation-exchange membranes applied to the treatment of industrial effluents Manuel César Martí Calatayud Directed by: Dr. D. Valentín Pérez Herranz Dra. Dª Montserrat García Gabaldón València, November 2014

Welcome message from author
This document is posted to help you gain knowledge. Please leave a comment to let me know what you think about it! Share it to your friends and learn new things together.
Transcript
PROGRAMA OFICIAL DE POSGRADO
INGENIERÍA Y PRODUCCIÓN INDUSTRIAL
DOCTORAL THESIS
Study of the transport of heavy metal ions
through cation-exchange membranes
applied to the treatment of industrial effluents
Manuel César Martí Calatayud
Directed by:
Dr. D. Valentín Pérez Herranz
Dra. Dª Montserrat García Gabaldón
València, November 2014

Acknowledgements / Agradecimientos / Agraïments
En primer lugar quisiera agradecer a Valentín y a Montse por haberme dado la
oportunidad de investigar con ellos, por introducirme en un mundo que me ha fascinado,
por haberme dirigido, por haberme ayudado en momentos de desasosiego; porque, en
definitiva, creo que hemos formado un gran equipo.
Quisiera agradecer a la Universitat Politècnica de València la financiación recibida para
realizar la tesis. En general, he de agradecer al sistema de educación pública que ha
permitido que un hijo de trabajadores como yo haya podido llegar hasta aquí. Además,
quiero aprovechar para exigir un sistema de educación público, de calidad, e igualitario,
que forme a personas con espíritu crítico y libre; puesto que sólo así se conseguirá que
progresemos como sociedad.
I would also like to thank to all the people from the group of Chemical Process
Engineering of the RWTH Aachen University, especially to Matthias Wessling and Said
Abdu, for accepting me in their research group. They have been very kind to me and I
have learnt a lot from them and from this fruitful and unforgettable experience in Aachen.
También quisiera agradecer a Daniella Buzzi por haberme dejado ser su “chefinho”, por
tantos momentos buenos y algún que otro momento crítico vividos juntos, porque es
bonito saber que tengo una gran amiga al otro lado del charco.
Gracias al Grupo IEC, en especial a mis compañeros, con los que he pasado más
momentos juntos. Ellos han sido mi familia investigadora. Gracias a Isaac y Carlos, porque
han sido para mí un referente, a Jordi y Ramón, porque han estado desde el principio, han
sido como mis hermanos, y a Vir y Tepe, ellas han contribuido a que haya un ambiente de
trabajo inmejorable! Quiero también dar las gracias al resto de componentes del grupo
por su ayuda, en especial a Emma Ortega, a José Luis Guiñón por su ayuda con los
equilibrios, y a Anna Igual porque con su energía consigue contagiar su pasión por la
investigación.
El fruto del trabajo de todos estos años tampoco sería posible sin los momentos vividos
junto a mis amigos, el “Kanchy”. Ellos son “los de toda la vida”, los que siempre han
estado, están y estarán ahí. Quisiera hacer mención especial a Lidia por su ayuda con la
Tesis, y cómo no, a Sergio, porque juntos hemos arreglado el mundo un millón de veces…
¡para volverlo a destrozar otras tantas!
No quiero olvidarme de ninguna de las personas con las que he coincidido y he pasado
buenos momentos tanto en Valencia, como en Berlín o en Aachen… Maite, Laura,

Guillaume… es imposible nombrarlos a todos… pero quiero agradecer en especial a Tania,
porque con ella no existe el tiempo ni la distancia, sé que siempre está ahí a mi lado.
Ha arribat el moment d’agrair a les quimixiques els grans moments viscuts. Amb elles
hem format una gran família. Em sent molt afortunat d’haver caigut en un grup tan de
“puça mare”: gràcies a les Silvies, Elena, Gabriel·la, Angeleta, Rosa de Xeraco, Alicia, i en
especial a Susana, la meua companya de batalles, i a Ingrid, una gran amiga.
Per últim voldria donar-li les gràcies a “Enrique Barsello” de Llanera de Ranes i “Tere la
Pacaleta” de l’Alcúdia de Crespins, mon pare i ma mare, perquè ells sempre m’han
recolzat, i han tingut que suportar els meus moments d’estrès. Sempre recordaré amb un
somriure quan vaig sentir a mon pare dir-li a algú: “El millor llegat que li puc deixar als
meus fills, és una bona educació”. També vull agrair-li a Maria José “la retruc”, per eixes
vesprades d’evasió jugant al truc. Ella em va ensenyar això de “si jugar i perdre és bonico,
què serà jugar i guanyar?”. Per últim, em queda agrair-li a la meua germana Maite, per tot
el seu amor i per ser un pilar fonamental en la meua vida, i a Mario i a Marc, el meu
gamberret! A tots vosaltres, VOS VULL MOLT, MOLTÍSSIMES GRÀCIES!
“I woke up with a loved one's eyes upon me loved one's arms around me
Oh...she's my one and only
I grew up in the bosom of my family eight strong arms around me
Oh...from the seed they've grown me
And I thank those, those who kept me company.
They are a wall of arms around me Oh...it is they who are my army
Oh… it is they who are my army
Through these eyes there's no god above me
no devil below me no purgatory, no pearly gates. The worms are what await me
It’s only me that can forgive me and I have faith, oh...I have faith I have faith, oh...I have faith
In those who put up with me”
Wall of arms, The Maccabees.

ABSTRACT
The development of sustainable technologies applied to the valorization of waste
effluents deserves an increasing attention due to the growing demand of the Earth’s
resources. In this context, electromembrane processes are an emerging alternative for
the treatment of metal containing effluents, since they allow the recovery of valuable
metals and clean water for reuse, hence implying important benefits for the environment.
Industrial effluents that contain multivalent metals can be very diverse and complex, and
usually form weak electrolytes. Consequently, the energy consumption and the efficiency
of the mass transfer in electromembrane processes are strongly affected by the type of
ions that cross the membranes. For this reason, it is important to achieve a better
understanding of the mass transfer phenomena involved in these processes in order to
make them economically competitive with other less sustainable processes.
Ion sorption properties, chronopotentiometric and current-voltage curves have been
obtained in order to characterize the ion uptake equilibrium and the ion transport taking
place in systems formed by a Nafion 117 cation-exchange membrane and various metallic
solutions. The results obtained with systems of single salt solutions of Na(I), Ni(II), Cr(III)
and Fe(III) have proven that the type of species transported through the membranes
strongly depends on the initial electrolyte concentration and the applied current density.
In systems with trivalent metals, apart from free cations (Cr3+
and Fe3+
), other charged
complex species can cross the membrane (CrSO4+, FeSO4
+…). In systems of multivalent
metals and under the application of high current densities, the initial equilibrium
conditions at the depleting diffusion boundary layer can be altered, thus inducing the
formation of hydroxilated complexes and the formation of precipitates (Ni(OH)2 and
Fe(OH)3) at the depleting membrane surface, which increase the electrical resistance of
the membrane systems.
The competitive ion transport through the membranes has been investigated using two
different mixtures that resemble the composition of industrial wastewaters. In systems of
NiSO4 and CrO3 (spent rinse waters of the metal finishing industry), a decrease in the
[Ni2+
]/[H+] ratio in the equilibrating solution reduced significantly the transport of Ni
2+
ions through the membranes, but increased the limiting current density and decreased
the electrical resistance of the membrane system. In mixtures of Fe2(SO4)3 and Na2SO4
(acid mine drainage), the transport of Na+ ions occurs preferentially at low current
densities and the transport of Fe3+
ions at high underlimiting currents. Moreover, the
dissociation of FeSO4+ ions into Fe
3+ and SO4
2- ions at high underlimiting currents

promotes a reduction in the electrical resistance of the membrane systems due to the
higher conductivity of the free ions with respect to that of complex ionic species.
The overlimiting mechanisms of ion transport have been also investigated. An increase in
the concentration of multivalent metals can promote the development of coupled
convection (gravitational convection and electroconvection) for lower membrane voltage
drops, thus reducing the energy cost of using overlimiting current densities. On the
contrary, high concentrations of H+ ions hamper coupled convection phenomena and
increase the membrane voltage drops necessary to reach the overlimiting range of
current densities. These results were also corroborated in long-term galvanostatic tests.
RESUMEN
El desarrollo de tecnologías sostenibles aplicadas a la valorización de residuos está
recibiendo una atención creciente debido a la demanda intensiva de los recursos del
planeta. En este contexto, los procesos electroquímicos de membrana se sitúan como una
alternativa emergente para el tratamiento de efluentes industriales que contienen
metales, puesto que permiten la recuperación de metales valiosos y de agua limpia para
su reutilización, implicando con ello importantes beneficios para el medio ambiente. Los
efluentes industriales que contienen metales multivalentes pueden ser muy diversos y
complejos, y normalmente se encuentran formando electrolitos débiles. En consecuencia,
el consumo energético y la eficiencia en la transferencia de materia en los procesos
electroquímicos de membrana dependen de forma significativa del tipo de iones
transportados a través de las membranas. Por este motivo, es importante lograr un
mayor conocimiento acerca de los fenómenos de transporte implicados en dichos
procesos, con el fin de situarlos como una alternativa económicamente competitiva
frente a otras tecnologías menos sostenibles.
En la presente Tesis Doctoral se han estudiado los fenómenos de polarización por
concentración en sistemas formados por una membrana de intercambio catiónico Nafion
117 y varias disoluciones metálicas mediante la obtención de las propiedades de
intercambio iónico y de las curvas cronopotenciométricas y de polarización. Los
resultados obtenidos con sistemas unicomponentes de sales de Na(I), Ni(II), Cr(III) y Fe(III)
indican que el tipo de especies transportadas a través de las membranas depende de la
concentración inicial del electrolito y de la densidad de corriente aplicada. En sistemas
con metales trivalentes, además del los iones libres (Cr3+
y Fe3+
), diferentes especies
complejas cargadas también pasan a través de la membrana (CrSO4+, FeSO4
+,…). En
disoluciones con metales multivalentes y bajo la aplicación de elevadas densidades de
corriente, las condiciones de equilibrio iniciales pueden cambiar, implicando con ello la
formación de complejos hidroxilados y de precipitados metálicos en la superficie de la
membrana en el compartimento diluido (Ni(OH)2 y Fe(OH)3), lo cual conlleva un aumento
de la resistencia eléctrica del sistema de membrana.
El transporte competitivo de iones a través de las membranas se ha investigado
utilizando dos mezclas multicomponentes diferentes que simulan la composición de
aguas industriales. En mezclas de NiSO4 y CrO3 (baños de lavado agotados de la industria
de recubrimiento de superficies metálicas), un descenso del ratio [Ni2+
]/[H+] en la
disolución conlleva una importante disminución del transporte de iones Ni2+
a través de la

membrana, pero también implica un incremento de la densidad de corriente límite y un
descenso en la resistencia eléctrica del sistema membrana/electrolito. En mezclas de
Fe2(SO4)3 y Na2SO4 (drenaje ácido de minas), el transporte de iones Na+ tiene lugar
preferentemente a bajas densidades de corriente, mientras que el transporte de iones
Fe3+
es más importante a densidades de corriente elevadas pero inferiores a la límite.
Además, la disociación de los iones FeSO4+ en Fe
3+ y SO4
2- implica una reducción en la
resistencia eléctrica del sistema de membrana debido a la mayor conductividad de los
iones libres con respecto a la de especies iónicas complejas.
Los mecanismos de transporte iónico a densidades de corriente superiores a la límite
también se han investigado. Un incremento en la concentración de metales multivalentes
conlleva el desarrollo de fenómenos convectivos (convección gravitacional y
electroconvección) para caídas de voltaje a través de la membrana reducidas,
disminuyendo con ello el coste energético asociado con el uso de densidades de corriente
superiores a la límite. Por el contrario, elevadas concentraciones de iones H+ dificultan los
fenómenos convectivos y aumentan la caída de voltaje transmembranal que es necesario
superar para alcanzar el rango de densidades de corriente superiores a la límite. Estos
resultados también se corroboraron mediante ensayos galvanostáticos de larga duración.
RESUM
El desenvolupament de tecnologies sostenibles aplicades a la valorització de residus està
rebent una atenció creixent degut a la demanda intensiva dels recursos del planeta. En
aquest context, els processos electroquímics de membrana es posicionen com una
alternativa emergent per al tractament d’efluents industrials que contenen metalls, atès
que permeten la recuperació de metalls valuosos i d’aigua neta per a la seua reutilització,
implicant així importants beneficis per al medi ambient. Els efluents industrials que
contenen metalls multivalents poden ser molt diversos i complexes, i normalment es
troben en forma d’electròlits febles. En conseqüència, el consum energètic i l’eficiència en
la transferència de matèria en els processos electroquímics de membrana depenen en
gran mesura del tipus d’ions transportats a través de les membranes. Per aquest motiu, és
important abastir un major coneixement dels fenòmens de transport implicats en dits
processos, amb la finalitat de situar-los com una alternativa econòmicament competitiva
amb altres tecnologies menys sostenibles.
En la present Tesi Doctoral s’han estudiat els fenòmens de polarització per concentració
en sistemes formats per una membrana d’intercanvi catiònic Nafion 117 i diverses
dissolucions metàl·liques mitjançant l’obtenció de les propietats d’intercanvi iònic i de les
corbes cronopotenciomètriques i de polarització. Els resultats obtinguts amb sistemes
unicomponents de sals de Na(I), Ni(II), Cr(III) i Fe(III) indiquen que el tipus d’espècies
transportades a través de les membranes depèn de la concentració inicial de l’electròlit i
de la densitat de corrent aplicada. En sistemes amb metalls trivalents, a més dels ions
lliures (Cr3+
i Fe3+
), també passen a través de la membrana espècies complexes carregades
(CrSO4+, FeSO4
+,...). En dissolucions amb metalls multivalents sotmesos a l’aplicació
d’elevades densitats de corrent, les condicions d’equilibri inicials poden canviar, implicant
amb això la formació de complexos hidroxilats i de precipitats metàl·lics en la superfície
de la membrana situada en el compartiment de dilució (Ni(OH)2 i Fe(OH)3), augmentant
així la resistència elèctrica del sistema de membrana.
El transport competitiu d’ions a través de les membranes s’ha investigat utilitzant dos
mescles multicomponent diferents que simulen la composició d’aigües industrials. En
mescles de NiSO4 i CrO3 (banys de llavat esgotats de la indústria de recobriment de peces
metàl·liques), un descens del ràtio [Ni2+
]/[H+] en la dissolució comporta una important
disminució del transport d’ions Ni2+
a través de la membrana, però també implica un
increment de la densitat de corrent límit i un descens de la resistència elèctrica del

sistema membrana/electròlit. En mescles de Fe2(SO4)3 i Na2SO4 (drenatge àcid de mines),
el transport d’ions Na+ ocorre preferentment a baixes densitats de corrent, mentre que el
transport d’ions Fe3+
és més important a densitats de corrent elevades però inferiors a la
límit. A més a més, la dissociació dels ions FeSO4+ en Fe
3+ i SO4
2- implica una reducció de
la resistència elèctrica del sistema de membrana degut a la major conductivitat dels ions
lliures, comparada amb la d’espècies iòniques complexes.
En la present Tesi Doctoral també s’han investigat els mecanismes de transport iònic a
densitats de corrent superiors a la límit. Un increment en la concentració de metalls
multivalents comporta el desenvolupament de fenòmens convectius (convecció
gravitacional i electroconvecció) per a caigudes de voltatge a través de la membrana
reduïdes, disminuint tanmateix el cost energètic associat a l’ús de densitats de corrent
superiors a la límit. Pel contrari, elevades concentracions d’ions H+ dificulten els fenòmens
convectius i augmenten la caiguda de voltatge transmembranal que és necessari superar
per a abastar el rang de densitats de corrent superiors a la límit. Aquests resultats també
es van corroborar mitjançant assaigs galvanostàtics de llarga duració.

PUBLICATIONS RELATED TO THE DOCTORAL THESIS
ARTICLES IN INTERNATIONAL JOURNALS
Determination of transport properties of Ni(II) through a Nafion cation-exchange
membrane in chromic acid solutions.
M.C. Martí-Calatayud, M. García-Gabaldón, V. Pérez-Herranz, E. Ortega.
Journal of Membrane Science, 379 (2011) 449-458.
Study of the effects of the applied current regime and the concentration of chromic
acid on the transport of Ni2+
ions through Nafion 117 membranes.
M.C. Martí-Calatayud, M. García-Gabaldón, V. Pérez-Herranz.
Journal of Membrane Science, 392-393 (2012) 137-149.
Effect of the equilibria of multivalent metal sulfates on the transport through
cation-exchange membranes at different current regimes.
M.C. Martí-Calatayud, M. García-Gabaldón, V. Pérez-Herranz
Journal of Membrane Science, 443 (2013) 181-192.
Ion transport through homogeneous and heterogeneous ion-exchange membranes
in single salt and multicomponent electrolyte solutions.
M.C. Martí-Calatayud, D.C. Buzzi, M. García-Gabaldón, A.M. Bernardes, J.A.S.
Tenório, V. Pérez-Herranz
Journal of Membrane Science, 466 (2014) 45-57.
PREDOCTORAL RESEARCH STAY IN A FOREIGN INSTITUTE
A predoctoral research stay was carried out from October 2012 to March 2013 at the
Chemical Process Engineering Department of the RWTH-Aachen University (Aachen,
Nordrhein-Westfalen, Germany). The work was supervised by Prof. Dr.-Eng. Matthias
Wessling, head of the Institute of Membrane Technology, and was conducted in close
cooperation with Said Abdu. The main topic of this research stay was to modify the
surface of cation-exchange membranes in order to induce properties of monovalent ion
selectivity. As a result of this research stay, the following article was published:

Layer-by-layer modification of cation exchange membranes controls ion selectivity
and water splitting.
S. Abdu, M.C. Martí-Calatayud, J.E. Wong, M. García-Gabaldón, M. Wessling
ACS Applied Materials & Interfaces, 6 (2014) 1843-1854.
RESEARCH COLLABORATIONS WITH OTHER RESEARCH INSTITUTES
In addition to the research stay, we have conducted other collaborative research studies
with the Instituto de Tecnología Cerámica de la Universitat Jaume I de Castelló (Spain).
These studies consisted on the development of ion-exchange membranes from ceramic
materials. The innovative aspect of this research was to synthesize durable membranes
that could resist oxidizing and radioactive conditions of industrial effluents, thus making
feasible their treatment by means of electromembrane processes. These studies have
been materialized in the publication of the following articles:
Synthesis and electrochemical behaviour of ceramic cation-exchange membranes
based on zirconium phosphate.
M.C. Martí-Calatayud, M. García-Gabaldón, V. Pérez-Herranz, S. Sales, S.
Mestre.
Ceramics International, 39 (2013) 4045-4054.
Chronopotentiometric study of ceramic cation-exchange membranes base don
zirconium phosphate in contact with nickel sulfate solutions.
M.C. Martí-Calatayud, M. García-Gabaldón, V. Pérez-Herranz, S. Sales, S.
Mestre.
Desalination and Water Treatment, 51 (2013) 597-605.
We carried out a research study in cooperation with Andrea Moura Bernardes and
Daniella Cardoso Buzzi, from the Department of Materials Engineering of the
Universidade Federal do Rio Grande do Sul (UFGRS) (Porto Alegre, Rio Grande do Sul,
Brazil). The main purpose of this study was to evaluate the treatment of acid mine
drainage solutions by means of electrodialysis. The following article was published as a
result of this work:
Sulfuric acid recovery from acid mine drainage by means of electrodialysis.
M.C. Martí-Calatayud, D.C. Buzzi, M. García-Gabaldón, E. Ortega, A.M.
Bernardes, J.A.S. Tenório, V. Pérez-Herranz
Desalination, 343 (2014) 120-127.
CONGRESS PRESENTATIONS
Development of electrodialysis membranes from ceramic materials for
environmental applications, M.C. Martí-Calatayud, M. García-Gabaldón, V. Pérez-
Herranz, S. Sales, S. Mestre, 10th
European Symposium on Electrochemical
Engineering, Sardinia (Italy), September 2014.
Role of electrolytes on the overlimiting ion conductance of cation-exchange
membranes, M.C. Martí-Calatayud, M. García-Gabaldón, E. Ortega, V. Pérez-
Herranz, 65th
Annual Meeting of the International Society of
Electrochemistry, Lausanne (Switzerland), September 2014.
Synthesis of ceramic ion-exchange membranes with bipolar behaviour for
electrodialytic water splitting, M.C. Martí-Calatayud, M. García-Gabaldón, V.
Pérez-Herranz, S. Sales, S. Mestre, IX Ibero-american Congress on Membrane
Science and Technology, Santander (Spain), May 2014.
Layer-by-layer assembly of polyelectrolytes applied to obtain cation exchange
membranes with monovalent ion selectivity, M.C. Martí-Calatayud, S. Abdu, J.E.
Wong, M. García-Gabaldón, V. Pérez-Herranz, M. Wessling, IX Ibero-American
Congress on Membrane Science and Technology, Santander (Spain), May
2014.
Treatment of industrial wastewaters containing multivalent metals by means of
electrodialytic techniques. M.C. Martí-Calatayud, M. García-Gabaldón, E. Ortega,
V. Pérez-Herranz, 13th
International Conference on Environmental Science
and Technology, Athens (Greece), September 2013.
Evaluation of two cation-exchange membranes for the separation of Fe(III) from
acid mine drainage solutions, M.C. Martí-Calatayud, M. García-Gabaldón, V.
Pérez-Herranz, D.C. Buzzi, A.M. Bernardes, J.A.S. Tenório, XXXIV Reunión
Bienal de la Sociedad Española de Química, Santander (Spain), September
2013.
Enhancement of the monovalent ion selectivity of cation-exchange membranes
modified with the layer-by-layer deposition of polyelectrolyte multilayers thin film,
M.C. Martí-Calatayud, S. Abdu, J.E. Wong, M. García-Gabaldón, E. Ortega, V.
Pérez-Herranz, M. Wessling, XXXIV Reunión de Electroquímica de la Real
Sociedad Española de Química, Valencia (Spain), July 2013.

Novel ceramic anion-exchange membranes based on hydrous zirconium oxide for
the treatment of industrial wastewaters, M.C. Martí-Calatayud, M. García-
Gabaldón, V. Pérez-Herranz, S. Sales, S. Mestre, Membrane Processes for
Industrial Pollution Control with Water and Products Recovery, Lisboa
(Portugal), July 2013.
Sulfuric acid recovery from acid mine drainage by means of electrodialysis, M.C.
Martí-Calatayud, M. García-Gabaldón, V. Pérez-Herranz, D.C. Buzzi, A.M.
Bernardes, J.A.S. Tenório, 1st
International Conference on Desalination using
Membrane Technology, Sitges (Spain), April 2013.
Transport of Fe3+
ions through homogeneous and heterogeneous cation-exchange
membranes, M.C. Martí-Calatayud, M. García-Gabaldón, E. Ortega, V. Pérez-
Herranz, D.C. Buzzi, A.M. Bernardes, J.A.S. Tenório, 63rd
Annual Meeting of the
International Society of Electrochemistry, Prague (Czech Republic), August
2012.
Chronopotentiometric study of ion-exchange membranes with sodium and iron(III)
sulfate solutions, D.C. Buzzi, M.C. Martí-Calatayud, M. García-Gabaldón, A.M.
Bernardes, J.A.S. Tenório, V. Pérez-Herranz, VIII Simposio Internacional de
Qualidade Ambiental, Porto Alegre (Brazil), June 2012.
Chronopotentiometric study of ceramic cation-exchange membranes based on
zirconium phosphate with nickel sulfate solutions, M.C. Martí-Calatayud, M.
García-Gabaldón, V. Pérez-Herranz, S. Sales, S. Mestre, Conference on
Desalination for the Environment, Clean Water and Energy, Barcelona
(Spain), April 2012.
Evaluation of the transport of Cr3+
ions present in chromium plating solutions
through a cation-exchange membrane, M.C. Martí-Calatayud, M. García-
Gabaldón, V. Pérez-Herranz, 13 Network of Young Membrains, Enschede (The
Netherlands), July 2011.
Influence of the initial NiSO4 and CrO3 concentration on the transport number of
Ni2+
ions through a cation-exchange membrane, M.C. Martí-Calatayud, M. García-
Gabaldón, E. Ortega, V. Pérez-Herranz, 9th
European Symposium on
Electrochemical Engineering, Chania (Greece), June 2011.

Chronopotentiometric study of the transport of Fe3+
through cation-exchange
membranes for the regeneration of chromium plating baths, M.C. Martí-Calatayud,
M. García-Gabaldón, E. Ortega-Navarro, V. Pérez-Herranz, 2nd
Regional
Symposium on Electrochemistry, Belgrade (Serbia), July 2011.

CONTENTS
i
TABLE OF CONTENTS
Chapter 1. Introduction
1.1 Current socioeconomic situation 1 1.1.1 Resources of metals in the world 1
1.1.2 Environmental and health effects of heavy metals 8
1.2 The potential of electrodialysis for the recovery of
heavy metals 11
1.2.1 Principle of electrodialysis 11 1.2.2 Advantages and challenges of electrodialysis applied to the
treatment of metal containing effluents 15
1.3 Ion-exchange membranes 18 1.3.1 Structure and properties of ion-exchange membranes 18
1.3.2 Ion transport and concentration polarization 22
1.3.3 The potential of the overlimiting current regimes 29
1.3.4 Transport of heavy metal ions 30
1.4 References 34
Chapter 2. Objectives and scope
2.1 Objectives and scope 41
2.2 Structure of this Thesis 42
Chapter 3. Experimental techniques
3.1 Introduction 47
3.2 Ion-exchange membranes used in the Thesis 48
3.3 Visualization and characterization of the structure of
ion-exchange membranes 50

ii
3.3.1 Scanning electron microscopy 50
3.3.2 Raman spectroscopy 50 3.4 Ion uptake experiments 51
3.5 Electrochemical characterization of the ion transport
through the membranes 55 3.5.1 Experimental setup and procedure 56
3.5.2 Chronopotentiometry 57
3.5.3 Calculation of the transport number 61
3.5.4 Current-voltage curves 64
3.6 Galvanostatic electrodialysis experiments 67 3.6.1 Experimental setup and procedure 67
3.6.2 Atomic absorption spectrometry 70
3.6.3 Figures of merit of an electromembrane reactor 71 3.7 References 73
Chapter 4. Results and discussion
4.1 Transport of metal ions present in single salt solutions
through cation-exchange membranes 75 4.1.1 Introduction 75
4.1.2 Structure and ion exchange equilibrium properties of Nafion
membranes 76
4.1.2.1 Characterization of the membrane structure 76
4.1.2.2 Ion sorption equilibrium properties 78
4.1.3 Transport of monovalent ions 81 4.1.3.1 Chronopotentiometric response 81
4.1.3.2 Calculation of the transport number of Na+ ions through Nafion
117 membranes 88
4.1.3.3 Current-voltage characteristics 91
4.1.4 Transport of divalent ions 94
4.1.4.1 Chronopotentiometric response 95
4.1.4.2 Calculation of the transport number of Ni2+ ions through Nafion
117 membranes 100
4.1.4.3 Current-voltage characteristics 102
4.1.5 Transport of ions of trivalent metals 105
4.1.5.1 Chronopotentiometric response 106
CONTENTS
iii
4.1.5.2 Current-voltage characteristics 116
4.1.6 Conclusions 123
4.2 Competitive transport of metal ions present in
multicomponent mixture solutions through cation-
exchange membranes 127 4.2.1 Introduction 127
4.2.2 Competitive ion transport between protons and metal cations.
Case of study: H+ vs. Ni2+ 129
4.2.2.1 Introduction and applicability 129
4.2.2.2 Ion sorption experiments 131
4.2.2.3 Chronopotentiometric response 134
4.2.2.4 Current-voltage characteristics 141
4.2.2.5 Calculation of the transport number of Ni2+ ions through Nafion
117 membranes 146
4.2.3 Competitive ion transport between metal ions of different
valence. Case of study: Na(I) vs. Fe(III) 150
4.2.3.1 Introduction and applicability 150
4.2.3.2 Ion sorption experiments 152
4.2.3.3 Chronopotentiometric response 155
4.2.3.4 Current-voltage characteristics 162
4.2.4 Conclusions 167
4.3 Investigation of the mechanisms of overlimiting mass
transfer 171 4.3.1 Introduction 171
4.3.2 Mechanisms of overlimiting mass transfer 174
4.3.2.1 Water splitting 174
4.3.2.2 Exaltation effect 176
4.3.2.3 Gravitational convection 177
4.3.2.4 Electroconvection 178
4.3.3 Study of the overlimiting currents by means of
chronopotentiometry and current-voltage curves 181
4.3.3.1 Dynamics of ion transport in membrane systems operated at
overlimiting currents 181
4.3.3.2 Steady state of membrane systems operating at overlimiting
currents 184
4.3.4 Overlimiting currents originated by water splitting products 185
iv
4.3.5 Overlimiting currents originated by enhanced convective
phenomena 196
4.3.5.1 Electroconvection and gravitational convection 196
4.3.5.2 Role of M+n ions on coupled convection 205
4.3.5.3 Role of H+ ions on coupled convection 210
4.3.6 Conclusions 215
4.4 Effects of the electrolyte composition and the current
regime on the performance of electrodialysis 218 4.4.1 Introduction 218
4.4.2 Effect of the electrolyte composition on the membrane
behavior at underlimiting currents 221
4.4.2.1 Electrodialysis performance with different compositions at a
constant current 221
4.4.2.2 Electrodialysis performance at 75% ilim for each solution
composition 228
4.4.3 Effect of the current regime 232
4.4.4 Assessment of the convenience of applying overlimiting
currents 239
4.4.5 Conclusions 244
4.5 References 246
Chapter 5. Conclusions
5.1 Conclusions 259 5.1.1 Transport of single salt solutions 259
5.1.2 Transport of multicomponent mixtures 261
5.1.3 Mechanisms of overlimiting currents 263
5.1.4 Galvanostatic electrodialysis experiments 264

1
Chapter 1
INTRODUCTION
1.1 Current socioeconomic situation
1.1.1 Resources of metals in the world
In the recent years the concerns of modern societies for protecting the environment has
increased notoriously, which has coincided with the industrial development of southern
countries and the steady increase of the Earth’s population. In addition, inhabitants of
developing countries are having a greater access to technology, such as electronic devices
or automobiles. As a result, the demand for natural resources such as fossil fuels, metals,
biomass, water and the like provided by the Earth is rapidly increasing and, consequently,
they are being intensively exploited.
Fig. 1.1 shows the evolution of the global resources extraction classified by major groups
of resources. This plot includes model previsions until 2020 foreseen by the “MOSUS”
project (Modelling opportunities and limits for restructuring Europe towards
sustainability), which is funded by the European Commission [1]. The figure shows that

Chapter 1.
2
metal ores and minerals are the categories with the highest growth rates, which indicates
the importance of metals for industrial development. The basis for this important growth
is related to the increasing contribution of the world emerging economies, such as the
BRIC countries (Brazil, Russia, India, and China), to resource extraction [2].
Figure 1.1. Worldwide used materials extraction, classified by groups of resources.
(Reproduced from [1]).
Traditionally, metals have been intensively used as engineering materials in buildings and
infrastructures, as well as in the automotive industry. However, the rapid growth of
technology in the 20th century has led to an increasing use of metals in the field of
electronics and energy. Today, a wide variety of metals is used to produce electronic
devices such as mobile phones or computers. For example, rare earth metals (Nd, Pr, Dy,
Tb, Eu…) are indispensable for the manufacture of hard disk drives, flat panel display
screens or portable electronics. They are also very important in the health and medical
applications sector. Moreover, the use of metals is becoming more relevant in the energy
industry. Metals are used as energy carriers (redox flow batteries), in energy storage
systems (lithium, cadmium and nickel based batteries) or as a direct source of energy
(uranium and thorium in nuclear energy).
As a consequence of this rapid increase in the demand of metal resources, the exhaustion
of metal reserves has been pointed out as a great concern as it could limit the future
economic growth [2]. To provide an indication of the relative risk to the supply of
elements, the British Geological Survey (BGS) published a list of elements needed to
Introduction
3
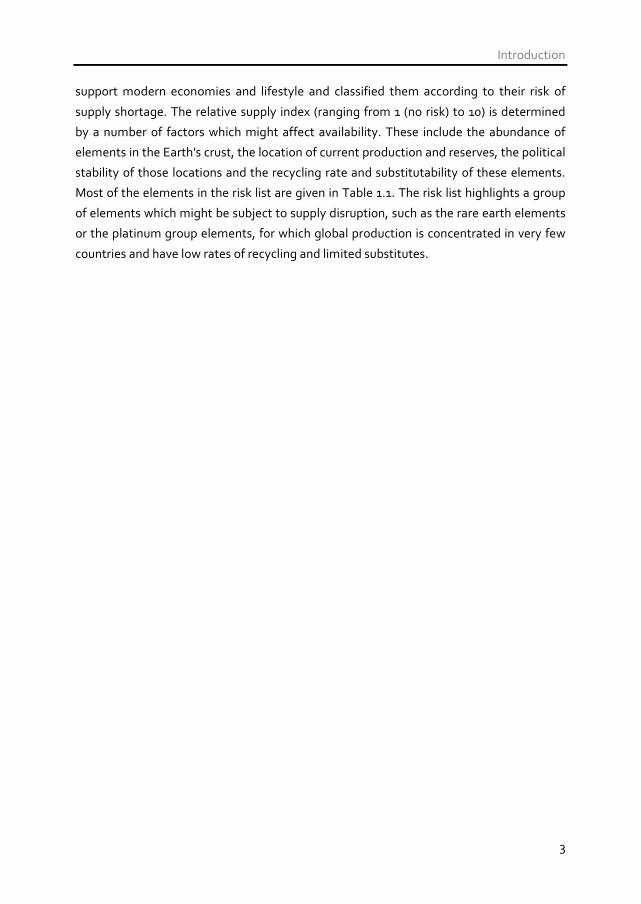
support modern economies and lifestyle and classified them according to their risk of
supply shortage. The relative supply index (ranging from 1 (no risk) to 10) is determined
by a number of factors which might affect availability. These include the abundance of
elements in the Earth's crust, the location of current production and reserves, the political
stability of those locations and the recycling rate and substitutability of these elements.
Most of the elements in the risk list are given in Table 1.1. The risk list highlights a group
of elements which might be subject to supply disruption, such as the rare earth elements
or the platinum group elements, for which global production is concentrated in very few
countries and have low rates of recycling and limited substitutes.
Chapter 1.
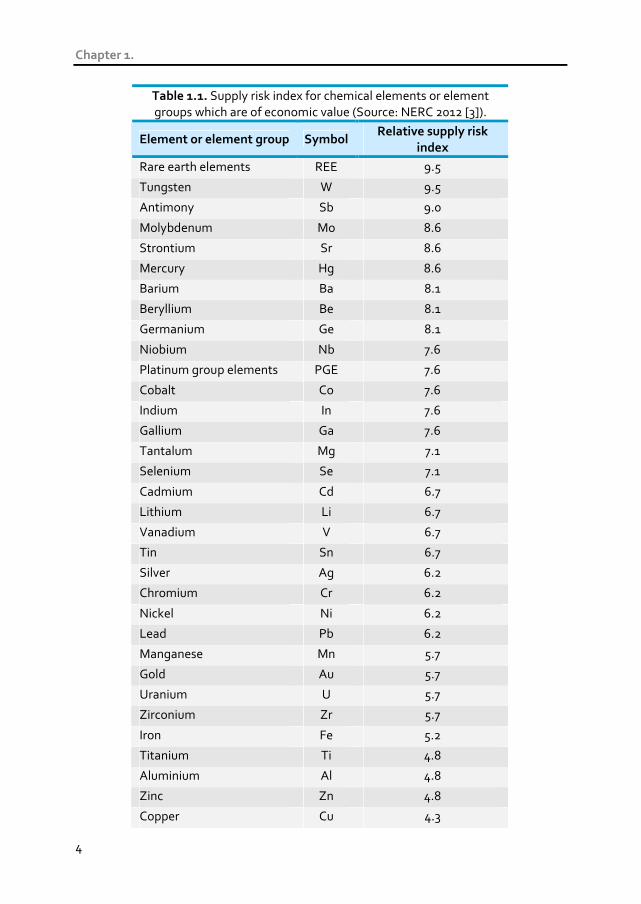
4
Table 1.1. Supply risk index for chemical elements or element groups which are of economic value (Source: NERC 2012 [3]).
Element or element group Symbol Relative supply risk
index
Rare earth elements REE 9.5
Tungsten W 9.5
Antimony Sb 9.0
Molybdenum Mo 8.6
Strontium Sr 8.6
Mercury Hg 8.6
Barium Ba 8.1
Beryllium Be 8.1
Germanium Ge 8.1
Niobium Nb 7.6
Platinum group elements PGE 7.6
Cobalt Co 7.6
Indium In 7.6
Gallium Ga 7.6
Tantalum Mg 7.1
Selenium Se 7.1
Cadmium Cd 6.7
Lithium Li 6.7
Vanadium V 6.7
Tin Sn 6.7
Silver Ag 6.2
Chromium Cr 6.2
Nickel Ni 6.2
Lead Pb 6.2
Manganese Mn 5.7
Gold Au 5.7
Uranium U 5.7
Zirconium Zr 5.7
Iron Fe 5.2
Titanium Ti 4.8
Aluminium Al 4.8
Zinc Zn 4.8
Copper Cu 4.3

Introduction
5
In order to make compatible the current levels of growth with sustainability and reduce
the risk of supply shortages, it is crucial to develop new technologies that make feasible
the recycling and reuse of metals. For example, in the risk list presented in Table 1.1,
copper has a low supply risk index, which is closely related to the feasibility of its
recycling. In 2008, copper consumption was about 24 million tones, 8 million of which
came from recycling operations, and the remaining 16 million from primary production
[4]. However, to be economically competitive with the direct extraction and processing
from the earth crust, metal recycling technologies need to be significantly improved.
Along with the constant technologic progress, the increasing prices of mineral raw
materials will undoubtedly stimulate the introduction and development of recycling
processes in the industry. In this regard, it is important to note that the majority of metals
are not mined for themselves but as recovered by-products in parent ores. Fig. 1.2 shows
a scheme of the typical host-companion relationships in ore deposits. As the richest
mines become exhausted, more low-quality ores are mined, leading to an overall
decrease in ore grades [5]. The mining of lower-grade ore causes an increase in energy
use, even with improved extraction methods [6]. The extraction of metals would also
require more complicated purifying operations, thus increasing water use, pollution and
the cost of extraction, which would contribute to increase the interest in recycling the
metals present in wastes.

Chapter 1.
6
Figure 1.2. Typical occurrences of companion metals within host metal ore bodies. REE: rare earth elements; HRE: heavy rare earths; PGM: platinum group metals. (Reproduced
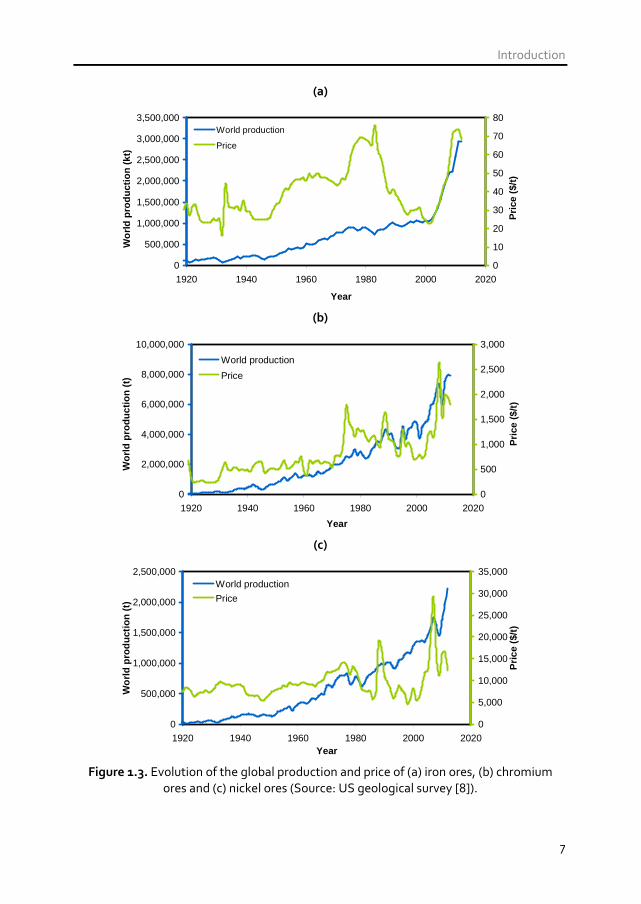
from [7]). By way of example, the historical evolution of prices and consumption of three different
metals are illustrated in Fig. 1.3 [8]. We selected the data corresponding to iron,
chromium and nickel due to different reasons. Iron is important due to its high volume of
production, chromium due to its harmful effects on the environment, and nickel due to its
comparatively high price. Moreover, as it will be discussed below, all of them are used in
different industries and can be found as components of industrial aqueous effluents,
which is the focus of the present Thesis. In general, Fig. 1.3 illustrates an increasing trend
in the world production of the three metals. As mentioned previously, this trend is
associated with global industrial growth. With regard to the prices, a general increase is
also observed. However, prices are more volatile and highly susceptible to changes in
supply and demand. For example, nickel has been considered as a “strategic” metal, as
corroborated by the sharp price increases occurred in the late 1960’s and in 2007. The
former price increase was due to prolonged strikes at the Sudbury Mine (one of the
largest global producers), whereas the latter was apparently caused by the increased
demand for nickel in the production of stainless steel [9]. Therefore, the unstable and
oscillating prices are an additional incentive for boosting the recovery and recycling of
metals in industrial processes, as well as from waste effluents.
Introduction
7
(a)
0
500,000
1,000,000
1,500,000
2,000,000
2,500,000
3,000,000
3,500,000
1920 1940 1960 1980 2000 2020
Year
Wor
ld p
rodu
ctio
n (k
t)
0
10
20
30
40
50
60
70
80
Pric
e ($
/t)
World production
Price
(b)
0
2,000,000
4,000,000
6,000,000
8,000,000
10,000,000
1920 1940 1960 1980 2000 2020
Year
Wor
ld p
rodu
ctio
n (t
)
0
500
1,000
1,500
2,000
2,500
3,000
Pric
e ($
/t)
World production
Price
(c)
0
500,000
1,000,000
1,500,000
2,000,000
2,500,000
1920 1940 1960 1980 2000 2020Year
Wor
ld p
rodu
ctio
n (t
)
0
5,000
10,000
15,000
20,000
25,000
30,000
35,000
Pric
e ($
/t)
World production
Price
Figure 1.3. Evolution of the global production and price of (a) iron ores, (b) chromium
ores and (c) nickel ores (Source: US geological survey [8]).
Chapter 1.
8
In addition to the economic, geopolitical and sustainability-related arguments the
environmental and health hazards associated with the discharge of metals into natural
watercourses also justifies the development of clean technologies for the recovery and
recycling of metals. Accordingly, the importance of treating metal-containing effluents
will be discussed in the following section from a perspective based on environmental
aspects.
1.1.2 Environmental and health effects of heavy metals
Although metals have multitude of important applications and some of them are
essential for human life (in trace amounts); they can also imply important environmental
and health hazards. Specially, heavy metals are of greater concern because they are
persistent and toxic even at low concentrations. Heavy metals are elements with
relatively high atomic weights and a specific gravity greater than 5.0 [10]. Some examples
of heavy metals are the following: antimony, arsenic, bismuth, calcium, chromium,
cobalt, copper, iron, lead, mercury, nickel, tin, uranium and zinc.
Heavy metals may be incorporated into the human body through food, water, air or
absorption through the skin. However, the major concern is focused on the intake of
heavy metals through the food chain, which is mainly caused by their discharge into
natural watercourses and aquatic ecosystems. They get into fresh and salt water when
industrial wastes are added to the water bodies. Once discharged, heavy metals can bind
to the surface of microorganisms, which are then eaten by bigger fish. Heavy metals are
difficult to be excreted and are accumulated in the fatty tissues of animals. Consequently,
as bigger organisms eat the smaller ones, the heavy metals build-up in concentration in
the larger living beings. This increase in concentration of substances over time and in
bigger living organisms is classified into two different phenomena, which are
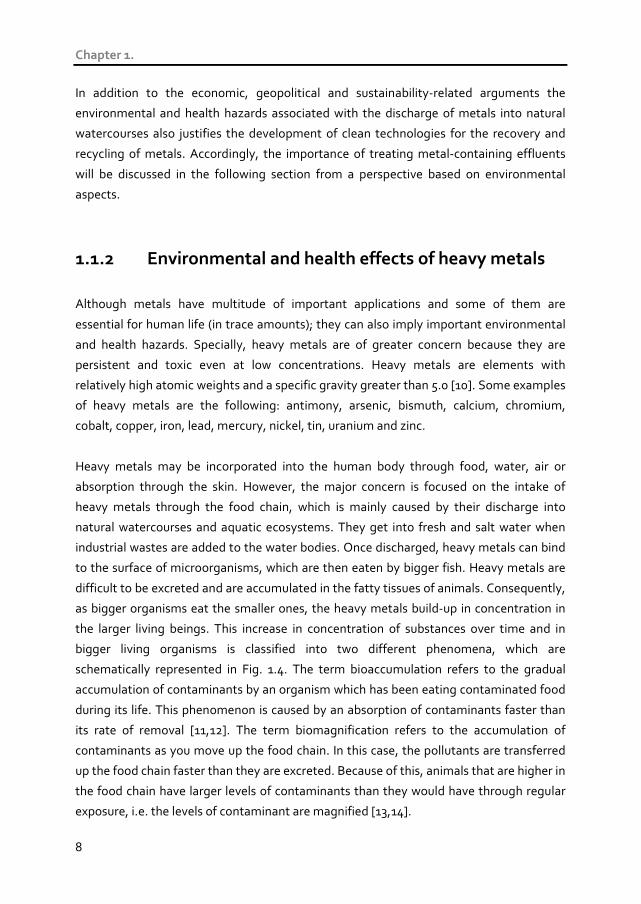
schematically represented in Fig. 1.4. The term bioaccumulation refers to the gradual
accumulation of contaminants by an organism which has been eating contaminated food
during its life. This phenomenon is caused by an absorption of contaminants faster than
its rate of removal [11,12]. The term biomagnification refers to the accumulation of
contaminants as you move up the food chain. In this case, the pollutants are transferred
up the food chain faster than they are excreted. Because of this, animals that are higher in
the food chain have larger levels of contaminants than they would have through regular
exposure, i.e. the levels of contaminant are magnified [13,14].
Introduction
9
Figure 1.4. Schematic representation of the phenomena of bioaccumulation and
biomagnification of persistent contaminants through the food chain.
The effects of the accumulation of heavy metals on the human body have been largely
studied. In general, most of them cause skin irritation and problems in the digestive
system. However, the toxic dose and the resulting effects can vary for different heavy
metals. Toxic heavy metals of particular concern in the treatment of industrial
wastewaters include zinc, nickel, mercury, cadmium, lead and chromium [10].
Particularly, nickel exceeding critical levels might result in serious lung and kidney
problems. Moreover nickel and hexavalent chromium have been classified as
carcinogenic to humans by the International Agency for Research on Cancer (IARC)
[15,16]. Mercury and lead are also of great concern because they are neurotoxins and can
cause damage to the central nervous system [17].
As mentioned above, the main problem associated with heavy metals is their persistence
in the environment. Therefore, it is important to avoid their discharge into natural
watercourses or remediate it before it becoming dispersed and accumulated through the
food chain. The release of heavy metals into rivers starts during their extraction and
transformation in mining sites. Moreover, it is usually accompanied by the generation of
acidic effluents as a consequence of the increased exposed area of sulfur-bearing rocks
during mining. This phenomenon allows for an excess of acid generation beyond the
natural buffering capabilities found in host rock and water resources, thus aggravating
the impacts of mining on aquatic ecosystems [18]. Among those impacts are included the
Chapter 1.
10
mortality of fauna and flora and the subsequent decrease of biodiversity in important
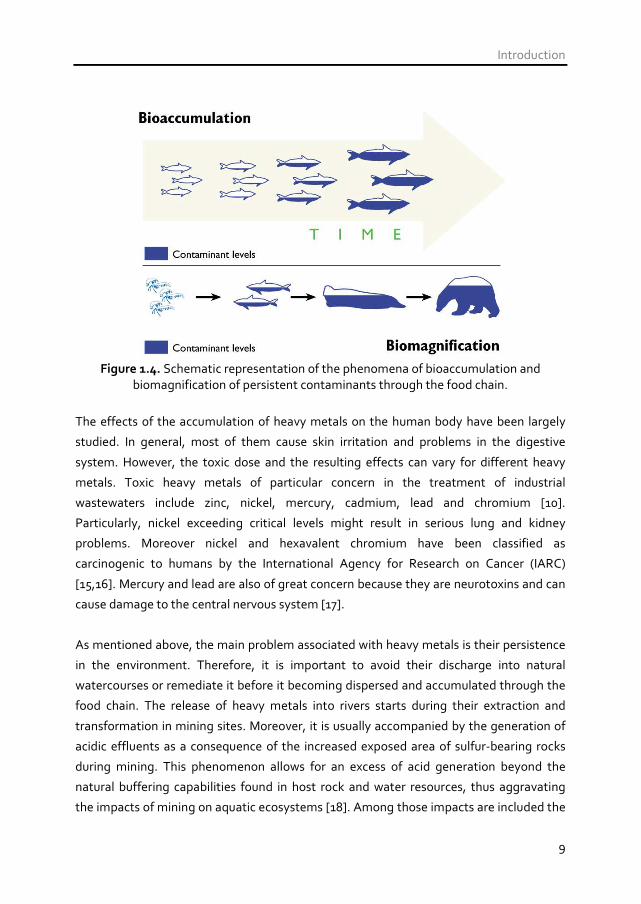
natural reserves, hence also affecting the related human activities. Fig. 1.5 shows a
picture of a wetland contaminated as a consequence of the mining activities carried out in
the surrounding areas. The treatment of acid mine drainage in the exploitation sites
before it could contaminate rivers and lakes could be a solution in order to remediate the
impacts of mining on the human health and the environment.
Figure 1.5. Wetlands close to a coal extracting site contaminated by acid mine drainage
(Criciúma/SC, Brazil).
Apart from the impacts of mining, there are also many industries which generate metal-
containing effluents, such as metal finishing industries, petroleum refining industries,
textile industries or leather tanneries. In order to diminish the consequences of these
industrial activities on the human health and the environment, the law restrictions are
becoming more severe. This favors the introduction of clean alternative techniques in
industrial processes that allow a better use of the metal resources, diminish the discharge
of metals into the environment and allow the reclamation of large volumes of water.
Among them, the use of electromembrane processes stands out because they offer
several advantages with respect to other techniques. They have the potential to recover
valuable metals for reuse in industrial processes without the addition of reagents, and
minimize the amount of residual waste destined to disposal. Electrodialysis is classified
among the “Best Available Techniques” recommended by the European Commission for
various industrial activities [19,20]. Moreover, it is considered as a clean and sustainable
technique that has the potential to aid in the development of zero discharge processes in
the industry [21-24]. However, in order to be competitive with cheaper, simpler but less
Introduction
11
sustainable techniques, it is crucial to make some efforts to improve electromembrane
processes and optimize their operating conditions. To this end, it is important to achieve
a better understanding of the different mass transfer phenomena involved in
electromembrane processes.
1.2 The potential of electrodialysis for the recovery
of heavy metals
1.2.1 Principle of electrodialysis
Electrodialysis is an electromembrane separation process which is applied to remove
ionic contaminants from aqueous solutions. Normally, the feed stream in electrodialysis
units is a saline solution that is converted into two product streams: a desalted and a
concentrated solution. The driving force for the ion transfer is a difference in the electric
potential and the mass transfer takes place through ion-exchange membranes, which
have two different functions: to separate the different aqueous streams and to facilitate
the transport of ions from the diluate compartments toward the concentrated ones.
Ion-exchange membranes consist of polymeric films with ionic groups attached to their
structure, which make them permeable to ions of the opposite charge sign. More
specifically, anion-exchange membranes bear positive fixed charges (e.g. –N+(CH3)3) and
allow the passage of anions, whereas cation-exchange membranes bear negative fixed
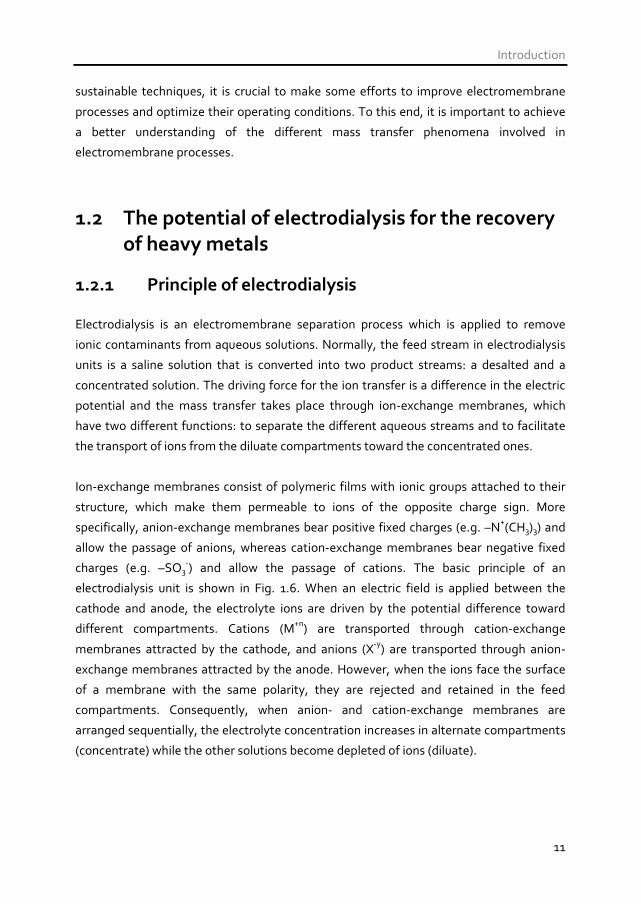
charges (e.g. –SO3-) and allow the passage of cations. The basic principle of an
electrodialysis unit is shown in Fig. 1.6. When an electric field is applied between the
cathode and anode, the electrolyte ions are driven by the potential difference toward
different compartments. Cations (M+n) are transported through cation-exchange
membranes attracted by the cathode, and anions (X-y) are transported through anion-
exchange membranes attracted by the anode. However, when the ions face the surface
of a membrane with the same polarity, they are rejected and retained in the feed
compartments. Consequently, when anion- and cation-exchange membranes are
arranged sequentially, the electrolyte concentration increases in alternate compartments
(concentrate) while the other solutions become depleted of ions (diluate).

Chapter 1.
12
-
-
-
-
-
+
+
+
+
+
+ -M+n
X-y
M+n
X-y
X-y
M+n
AEM CEM
Figure 1.6. Schematic illustration of the principle of electrodialysis systems.
The most basic part of an electrodialysis system consists of a single unit cell or cell pair. A
cell pair consists of an anion- and a cation-exchange membrane, which separate different
electrolyte compartments, as shown schematically in Fig. 1.6. Moreover, an
electrodialysis unit has two electrodes, the cathode and the anode. An electrodialysis unit
can be operated at constant current (galvanostatic) or at constant voltage difference
between cathode and anode, and the flux of ions through the membranes can be
incremented by increasing the strength of the applied electric field. However, the flux of
ions is usually limited by the increase in the electrical resistance of the system, especially
due to the decrease of conductivity in the depleting compartments. In order to obtain a
more efficient use of the current, the number of cell pairs installed between the two
electrodes can be increased, as shown in Fig. 1.7. These configurations are called stacks
and can be composed of more than one hundred cell pairs. The feed solution is divided
into different desalted and concentrated solutions which flow through alternating
compartments and are then collected separately.

Introduction
13
Anode
Cathode
Figure 1.7. Schematic diagram of the arrangement of an electrodialysis stack with several
cell pairs. (AEM: anion-exchange membrane, CEM: cation-exchange membrane, :
cation, : anion).
The progress in electrodialysis has been associated with the development of ion-
exchange membranes with improved mechanical and chemical properties. The advances
in polymer chemistry during the 1950’s allowed the production of ion-exchange
membranes with enhanced selectivity and positioned electrodialysis as a practical
process [25]. The first successful electrodialysis plant to desalinate water was installed in
1952 by Ionics [26]. So far, significant advances have been performed in terms of stack
design, optimization of operating parameters and ion-exchange membranes; to such an
extent that today electrodialysis is considered a mature technology. Some of the most
established applications of electrodialysis are summarized as follows:
Desalination of brackish water. There are several plants operating in the world.
Despite that electrodialysis is competing directly with reverse osmosis, in a
certain range of feed water concentrations electrodialysis has an economic
advantage over other desalination processes. Moreover, for certain locations
where high water recoveries are desired electrodialysis is preferred [26].
Concentration of seawater to produce table salt. This is a very important
technology confined to Japan, which has no domestic salt sources [25].
Removal of specific contaminants. Certain ionic contaminants cannot be
effectively removed in reverse osmosis (RO) plants. In such cases the installation
of electrodialysis reversal (EDR) plants allows the production of high quality

Chapter 1.
14
drinking water with minimum presence of contaminants. An example of this is
the EDR plant installed in the area of Barcelona to provide drinking water with
low risk of trihalomethane formation [27].
Membrane chlor-alkali industry. The development of perfluorosulfonic Nafion
membranes by DuPont® allowed the use of ion-exchange membranes to
produce NaOH and Cl2 in chlor-alkali processes. These membranes are
characterized by having high ionic conductivities and excellent chemical
stability. Moreover, these membranes have found multitude of applications in
fuel cells.
Several applications in the food industry. Electrodialysis is applied to remove
salt from cheese whey so that the other components of whey can be used as
food for humans and animals; and also to concentrate salts of organic acids
produced by fermentation [28].
The above mentioned processes are used on large industrial scale and can be considered
as state-of-the-art technology [29]. However, electromembrane processes are growing
rapidly again as a number of new applications related to energy and industrial processes
have been identified [29]. These new applications are raising the interest in basic
fundamental research on the mass transport phenomena through ion-exchange
membranes as well as in the development of new types of membranes. Some of the most
emerging applications of electromembrane processes are summarized as follows:
Bipolar electrodialysis. These processes are applied to obtain acids and bases
from concentrated salts. They have found application in the valorization of
effluents such as reverse osmosis brines, as well as in the recovery of organic
acids from fermentation processes [28].
Microbial fuel cells. This technology makes possible to degrade organic matter
and generate electricity simultaneously [30].
Reverse electrodialysis. This process is based on the mixing of sea water with
river water through ion-exchange membranes to produce electricity. The
electrochemical potential gradient associated to the process of mixture
generates an electrical current between the cathode and anode [31].

Introduction
15
Electrodeionization. This process is applied to remove contaminants to the ppb
level from diluted streams. The principle is the same as in electrodialysis, but in
this case the diluted compartments are filled with ion exchange beds in order to
reduce the electrical resistance of the cell [25].
In addition to the listed processes, one of the most promising applications of
electrodialysis is the treatment of metal containing wastewaters. In this sense,
electrodialysis can be considered as an environmentally friendly technology, since it not
only allows for the removal of heavy metals from industrial effluents, but also facilitates
their recovery and reuse as added value resources. Compared to other existing
technologies, which are focused on the removal of heavy metals from aqueous streams
but imply the generation of sludge or wastes destined to disposal, electrodialysis is a
more sustainable technology. However, the industrial processes in which metal
containing effluents are produced can vary significantly, thus complicating the
electrodialysis operations. Therefore, it is important to identify the main challenges of
electromembrane processes applied to the treatment of solutions containing heavy
metals in order to make them more economically competitive. The advantages and
challenges of electrodialysis are indicated in more detail in the following section.
1.2.2 Advantages and challenges of electrodialysis
applied to the treatment of metal containing
effluents
The best available technologies used to treat industrial effluents containing heavy metals
include reverse osmosis, the chemical precipitation of metals by means of adding
hydroxides, the use of ion exchange resins and evaporative techniques [19].
Electrodialytic techniques imply some advantages in relation to these technologies,
which are summarized as follows:
Electrodialysis does not involve changes of phase to promote the chemical
separation. Consequently the energetic costs are significantly lower than those
of evaporative techniques.

Chapter 1.
16
In contrast to pressure-driven membrane processes, electrodialysis implies the
separation of species in different compartments based on their ionic charge. This
type of separation allows the conversion of the wastewaters in profitable
streams. For example, the metallic impurities built-up in the chromium plating
baths (Ni2+, Fe3+, Zn2+, etc.) and the Cr(VI) present in the form of anions (Cr2O72-,
CrO42-, HCrO4
-) can be concentrated in different compartments, so that the
regenerated chromium can be reused in the plating process. On the contrary, in
reverse osmosis the separation of anions and cations is not possible and the
presence of impurities in the concentrates makes unviable their reuse in the
industry.
Electrodialysis can be operated in continuous mode, hence making feasible its
integration as a part of industrial processes. The adaptability and flexibility of
electrodialysis is relatively high due to the modularity and easy monitoring of the
operating parameters. In this regard, other technologies such as the use of ion
exchange beds or the chemical precipitation are batch processes, which imply
the frequent replacement of the ion exchange resins and additional steps for the
removal of sludge.
In contrast with the chemical precipitation or the use of ion exchange beds, in
electrodialysis, the electric current is used as reagent and the addition of
chemicals is in principle not required. Moreover, the use of photovoltaic energy
to power electrodialysis systems could increase the sustainability of
electrodialysis and extend its applicability to developing countries [32]. In reverse
osmosis, chemicals are also added in order to clean the fouled membranes.
However, in the case of electrodialysis membranes, the fouling can be easily
prevented by changing periodically the polarity of the electrodes together with
the concentrated and diluted streams by using automatic switchable valves. This
type of electrodialysis is known as electrodialysis reversal and does not require
the addition of reagents to clean the membranes.
The generation of wastes is minimized in electrodialysis. The desalted streams
can be reused as a source of clean water, whereas the concentrated streams can
be usually used in industrial processes as valuable resources. This advantage
increases the sustainability of electromembrane processes.

Introduction
17
In spite of the advantages of electrodialysis to treat metal containing effluents, the
complexity of industrial effluents can be very diverse, so that the control of electrodialysis
systems could be complex and imply certain limitations. The main focus of this Thesis is
to study the mass transfer mechanisms taking place in electromembrane processes in
order to minimize these limitations and optimize the function of ion-exchange
membranes. Among the most relevant challenges of electrodialysis we highlight the
following ones:
The flux of ions through ion-exchange membranes is not unlimited. Due to the
facilitated ion transport occurring through the membranes, concentration
gradients develop near the membrane/solution interfaces. When a certain
current density known as the limiting current density (ilim) is reached, the
concentration of ions near the membrane depleting surface drops practically to
zero and the supply of ions to the membrane becomes limited by diffusion.
The energy consumption of electrodialysis systems varies during the treatment
process. This is caused by the gradual depletion of ions in the diluting
compartments and the concomitant decrease of conductivity. The dissipation of
energy in the membrane/solution interfaces accounts for an important part of
the energy losses. Therefore it is important to operate at optimum current
densities that minimize these energetic losses. Other approaches such as the
design of electrodialysis stacks with improved hydrodynamic conditions are also
beneficial in order to decrease the energy losses.
Ion-exchange membranes are not completely semipermeable and some leakage
of electrolyte ions of the same charge as the membrane can occur, especially at
high electrolyte concentrations. This can significantly reduce the quality of the
recovered products.
Membrane fouling could occur and decrease the performance of electrodialysis
processes. In the case of solutions containing heavy metals, the formation of
precipitates can be very problematic since it can completely block the ion
transport through the membranes and increase the energy consumption. In this
regard, it is important to determine the best operating conditions in order to
avoid the membrane fouling. The selection of underlimiting currents or the use
of specific modes of operation, such as electrodialysis reversal or pulsed electric
currents, could contribute to avoid these problems.
Chapter 1.
18
Metal containing wastewaters could be composed of mixtures of several ions.
Therefore, the competitive transport of ions with the same charge through the
membranes could diminish the purity and the added value of the recovered
solutions. To avoid such problems, operating conditions that favor the transport
of specific ions could be applied. Moreover, the development of membranes with
selectivity for certain ions (i.e. monovalent-ion-selective membranes) can imply
a significant advance in this respect.
Industrial effluents are usually characterized by having extreme pH values and
high oxidizing strengths. These conditions imply the requirement for
membranes with higher chemical stabilities. Nafion is a reference for such
applications, however, they are expensive and so far they have not found
competitive alternative membranes.
The transport phenomena and the energy consumption in electromembrane processes
depend strongly upon the characteristics of the ion-exchange membranes. Accordingly,
the mass transfer processes occurring in systems of ion-exchange membranes are
explained below in more detail.
1.3 Ion-exchange membranes
1.3.1 Structure and properties of ion-exchange
membranes Ion-exchange membranes are the key components of electrodialysis cells. They are
polymers bearing fixed charges in their structure. These charges show electrostatic
affinity toward ions with opposite charge (electrolyte counterions) and repulsive forces
against those ions having the same charge sign (electrolyte coions). Ion-exchange
membranes can be divided into two types: cation-exchange membranes and anion-
exchange membranes. Cation-exchange membranes possess negative fixed ionic groups
(e.g.: -SO3-, -COO-, -PO3
2-, -PO3H-, -C6H4O-, etc.) and are selective for cations; whereas
anion-exchange membranes possess positive fixed ionic groups (e.g.: -NH3+, -NRH2
+, -
NR2H+, -NR3+, -PR3
+, -SR2+, etc.) and are selective for anions [33]. The principle of the
selectivity of ion-exchange membranes is shown schematically in Fig. 1.8. The applied
Introduction
19
electric field determines the direction of ion movement, whereas the charge of the
membranes determines if a specific ion can be transferred from one compartment to
another: i.e. only the membrane counterions are able to cross the membranes, whereas
coions are rejected and retained in the feed compartments.
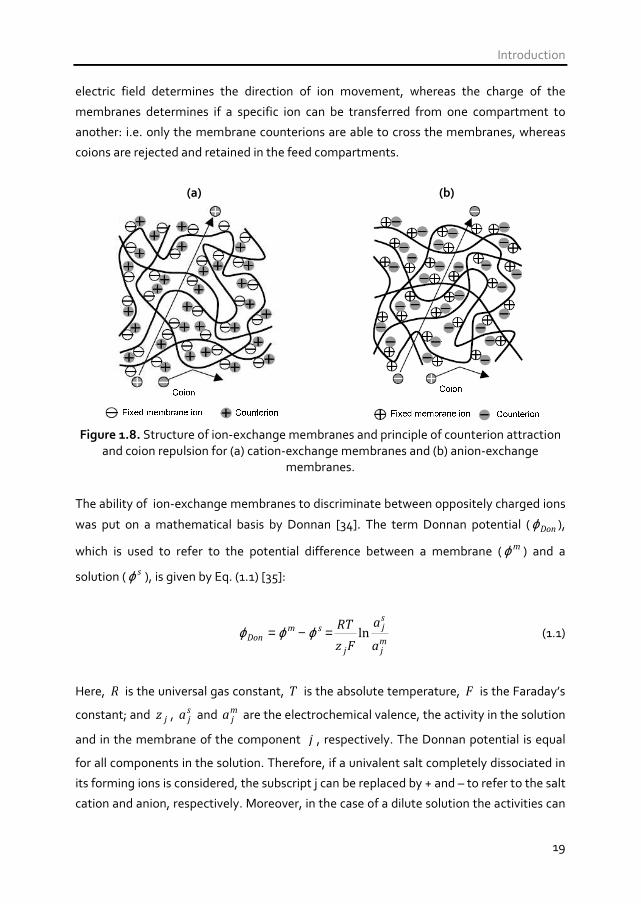
(a) (b)
Figure 1.8. Structure of ion-exchange membranes and principle of counterion attraction
and coion repulsion for (a) cation-exchange membranes and (b) anion-exchange membranes.
The ability of ion-exchange membranes to discriminate between oppositely charged ions
was put on a mathematical basis by Donnan [34]. The term Donnan potential ( Donϕ ),
which is used to refer to the potential difference between a membrane ( mϕ ) and a
solution ( sϕ ), is given by Eq. (1.1) [35]:
mj
sj
j
smDon
a
a
Fz
RTln=−= ϕϕϕ (1.1)
Here, R is the universal gas constant, T is the absolute temperature, F is the Faraday’s
constant; and jz , sja and m
ja are the electrochemical valence, the activity in the solution
and in the membrane of the component j , respectively. The Donnan potential is equal
for all components in the solution. Therefore, if a univalent salt completely dissociated in
its forming ions is considered, the subscript j can be replaced by + and – to refer to the salt
cation and anion, respectively. Moreover, in the case of a dilute solution the activities can
Chapter 1.
20
be replaced by concentrations. Accordingly, Eq. (1.1) can be transformed into the
following expression:
m
s
m
s
Donc
c
F
RT
c
c
F
RT
−
−
+
+ −== lnlnϕ (1.2)
Which can be simplified to obtain Eq. (1.3):
s
m
m
s
c
c
c
c
−
−
+
+ = (1.3)
If it is assumed that the electroneutrality is accomplished in the cation-exchange
membrane, the concentration of counterions in the membrane ( mc+ ) is equal to the sum
of the concentration of coions in the membrane ( mc− ) and the density of fixed charges of
the membrane ( X ):
Xcc mm += −+ (1.4)
Whereas in the solution the concentration of counterions and coions is the same as the
electrolyte concentration ( 0c ) for a univalent salt:
0ccc ss == −+ (1.5)
Therefore, the concentration of coions in the membrane phase can be obtained by
substituting Eqs. (1.5) and (1.4) into (1.3), which results in the following expression:
m
m
cX
cc
−−
+=
20 (1.6)
If it is assumed that the concentration of coions in the membrane phase is much lower
than the fixed charge density ( Xcm <<<− ), Eq. (1.6) can be simplified according to Eq.
(1.7):
Introduction
21
X
ccm
20=− (1.7)
It can be deduced from Eq. (1.7) that the Donnan exclusion, i.e. the exclusion of coions, is
most effective when the membrane contains a high concentration of fixed charges and
the electrolyte concentration is low. Since commercial cation-exchange membranes have
a high concentration of fixed charges, when salt concentrations are lower than the
membrane ion exchange capacity, anions are almost completely excluded. This range of
concentrations is commonly referred as the Donnan coion exclusion domain. However, at
higher salt concentrations, the cation-exchange membranes become measurably
permeable to anions [25].
The fraction of current carried by the anions and cations is usually known as the transport
number. In the case of a 1:1 strong electrolyte composed of a single salt solution (i.e.:
NaCl), the transport number in the membrane phase for the cations is +T and the
transport number for the anions is −T . Since the current is transported through an ion-
exchange membrane either by anions or cations, it is assumed that:
1=+ −+ TT (1.8)
For a multicomponent electrolyte, where several cations and anions could pass through
the membrane, Eq. (1.8) is converted into:
1=∑+∑ −+jj
TT (1.9)
Where the subscript j accounts for the different cations and anions present in the
solution. In single salt solutions and concentrations lower than the concentration of fixed
charges in the membrane (i.e.: in the Donnan coion exclusion domain) the coions are
mainly excluded from the membrane and their transport number is very small, normally
between 0 and 0.05. On the contrary, the membrane counterions carry almost all the
current, having transport numbers between 0.95 and 1.0.
Chapter 1.
22
In addition to the high selectivity for membrane counterions, membranes should posses
other important features. The main characteristics that ion-exchange membranes should
have can be summarized as follows [36]:
High permselectivity. Membranes should allow the transport of a high fraction of
counterions and avoid the permeation of coions.
Low electrical resistance. The low electrical resistances in membrane systems
are required in order to achieve the desired desalination rates with lower energy
consumptions.
Good mechanical strength and dimensional stability.
Good chemical and radiation stability, durability.
Reasonable cost.
The membrane properties determine to a great extent the efficiency of the separation
process through the electrodialysis cells, i.e. the rate of removal of contaminants and the
electrical consumption of the treatment process. In addition, the preparation of durable
membranes also affects the economic viability of electromembrane processes, since the
frequent replacement of damaged ion-exchange membranes raises the investment costs.
1.3.2 Ion transport and concentration polarization
The transport of ions in electrodialysis cells is significantly affected by the selectivity of
the ion-exchange membranes. Due to the membrane selectivity the electric current is
carried through the membranes predominantly by counterions (cations in a cation-
exchange membrane and anions in an anion-exchange membrane), which have transport
numbers close to 1. On the contrary, in the bulk solution the current is transported by
both counterions and coions, which have similar transport numbers (~0.5). This difference
in the transport numbers implies that the transport of counterions occurs faster in the
membrane than in the bulk solution and, as a result, concentration changes take place in
the solution close to the membrane surface. According to the IUPAC nomenclature, these
concentration gradients are called concentration polarization [37].
Introduction
23
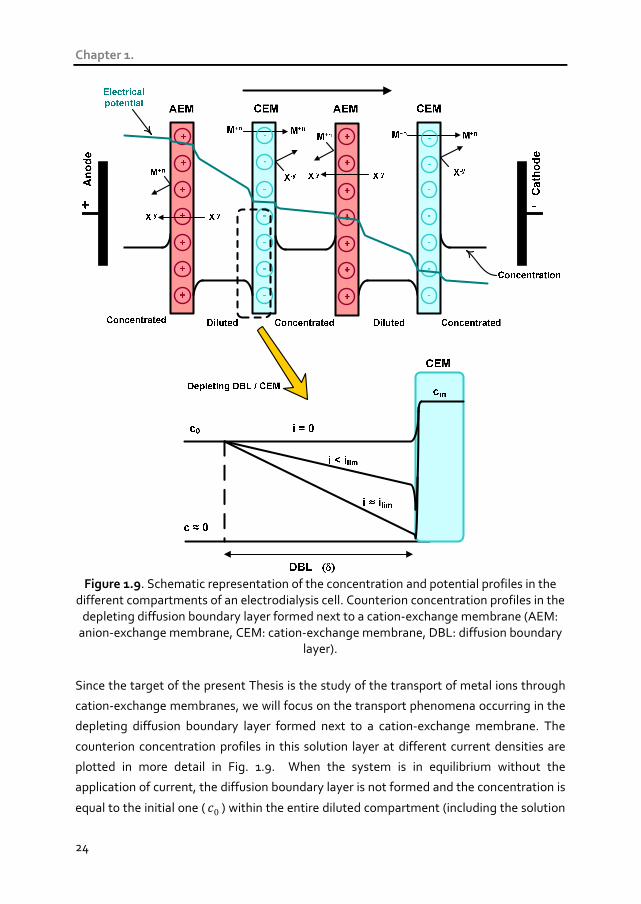
Fig. 1.9 shows a schematic representation of the concentration and potential gradients
formed in an electrodialysis cell. As can be seen, the gradients in the electrical potential
between each compartment due to the applied electric field act as a driving force for the
movement of ions through the membranes, which act as a selective barrier only allowing
the transport of counterions. The effects of concentration polarization are also
schematically depicted in each membrane/electrolyte interface. At the surface of the
membranes facing the diluted compartments the concentration decreases. On the other
hand, there is an accumulation of counterions at the surface of the membranes in the
concentrated compartments. The solution layers where the concentration gradients are
formed are denominated diffusion boundary layers. The diffusion boundary layers in the
concentrated compartments do not affect significantly the performance of the cell.
However, the decrease in concentration at the depleting diffusion boundary layers
implies a limitation in the ion transport as well as a reduction in the ionic conductance of
these layers, which leads to an increased electrical resistance of the entire cell.
Chapter 1.
24
Figure 1.9. Schematic representation of the concentration and potential profiles in the
different compartments of an electrodialysis cell. Counterion concentration profiles in the depleting diffusion boundary layer formed next to a cation-exchange membrane (AEM:
anion-exchange membrane, CEM: cation-exchange membrane, DBL: diffusion boundary layer).
Since the target of the present Thesis is the study of the transport of metal ions through
cation-exchange membranes, we will focus on the transport phenomena occurring in the
depleting diffusion boundary layer formed next to a cation-exchange membrane. The
counterion concentration profiles in this solution layer at different current densities are
plotted in more detail in Fig. 1.9. When the system is in equilibrium without the
application of current, the diffusion boundary layer is not formed and the concentration is
equal to the initial one ( 0c ) within the entire diluted compartment (including the solution

Introduction
25
layer next to the membrane). The concentration of counterions in the membrane phase
( mc ) may be higher, close to the ion exchange capacity of the membrane.
However, when a current is applied, the ions tend to move due to the influence of the
electric field. In the membrane phase we can assume that the transport of counterions
takes place predominantly by migration (i.e. movement caused by an electric field), and
the flux of counterions through the membrane ( mJ+ ) can be expressed by means of Eq.
(1.10) [38]:
Fz
iTJm
+
++ = (1.10)
Where i is the applied current density and +z is the valence of the membrane
counterion. In the solution layer next to the membrane the flux of counterions ( sJ+ ) is due
to migration and diffusion (i.e. driven by differences of concentration), and can be thus
described by Eq. (1.11) [38]:
x
s
x
cD
Fz
itJ
∂
∂+= +
+
++ (1.11)
Where D is the diffusion coefficient of the salt, x is the coordinate in the direction
perpendicular to the membrane surface, +t is the transport number of the cation in the
solution and +c is the concentration of the cation. Therefore, when a current is imposed
to an ion-exchange membrane system, the material balance at the membrane/solution
interface ( 0=x ) may be expressed through the equality of ingoing and outgoing ion flux
densities:
Fz
iT
x
cD
Fz
it
x +
+
=+
+ =
∂+∂
+0
(1.12)
The difference in transport numbers ( ++ > tT ) implies that the migration flux of
counterions from the bulk solution to the membrane surface is lower than the migration
flux from the surface toward the membrane bulk. This difference leads to a decrease of
the electrolyte concentration in the solution layer next to the membrane surface and to

Chapter 1.
26
the formation of the diffusion boundary layer, as indicated in the detailed profiles of Fig.
1.9. When the magnitude of the current is not too high (i<ilim), the diffusion and
convection contribution into the ionic flux in the solution compensate for the difference in
the migration fluxes in the solution and the membrane [39]. However, as the current is
increased, the equilibrium concentration at the membrane surface becomes lower. When
the current is increased up to the extent that the concentration at the membrane surface
approaches zero; the supply of ions to the membrane becomes limited by diffusion. This
current density is usually known as the limiting current density, ilim, and can be calculated
by using the following expression, known as the Peers’ equation [40]:
)(
lim
++
+
−=
tT
FDczi
δ0 (1.13)
In Eq. (1.13) δ refers to the thickness of the diffusion boundary layer and 0c to the initial
salt concentration. When the ilim is reached, the current density becomes saturated and
the voltage drop measured through the membrane increases considerably. Therefore, the
excess in current density beyond the ilim is consumed in parasitic processes and
contributes to increase the electrical resistance of the membrane region (membrane and
adjacent solution layers).
In an electrodialysis system, the increase in resistance associated with the attainment of
the ilim is usually detected by representing the Cowan-Brown plot [41,42]. In such
graphics, the electrical resistance across the membrane stack is represented against the
reciprocal of the electric current. Fig. 1.10 shows an example of a Cowan-Brown plot of an
electrodialysis unit. At current densities lower than the ilim the electrical resistance of the
system is very low. However, when the ilim is surpassed, the current is not used to
transport counterions and the resistance increases abruptly.
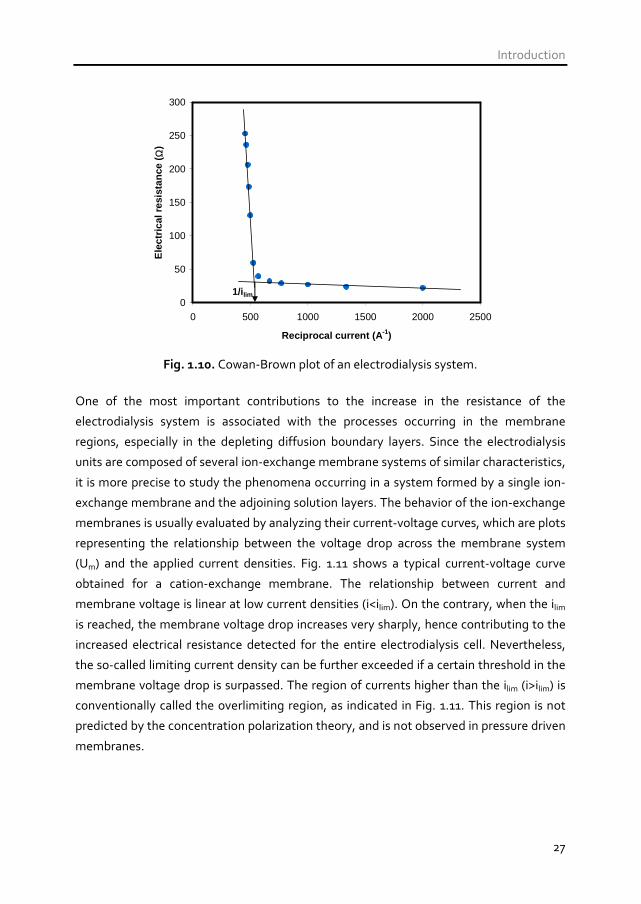
Introduction
27
0
50
100
150
200
250
300
0 500 1000 1500 2000 2500
Reciprocal current (A -1)
Ele
ctric
al r
esis
tanc
e (
Ω)
1/i lim
Fig. 1.10. Cowan-Brown plot of an electrodialysis system.
One of the most important contributions to the increase in the resistance of the
electrodialysis system is associated with the processes occurring in the membrane
regions, especially in the depleting diffusion boundary layers. Since the electrodialysis
units are composed of several ion-exchange membrane systems of similar characteristics,
it is more precise to study the phenomena occurring in a system formed by a single ion-
exchange membrane and the adjoining solution layers. The behavior of the ion-exchange
membranes is usually evaluated by analyzing their current-voltage curves, which are plots
representing the relationship between the voltage drop across the membrane system
(Um) and the applied current densities. Fig. 1.11 shows a typical current-voltage curve
obtained for a cation-exchange membrane. The relationship between current and
membrane voltage is linear at low current densities (i<ilim). On the contrary, when the ilim
is reached, the membrane voltage drop increases very sharply, hence contributing to the
increased electrical resistance detected for the entire electrodialysis cell. Nevertheless,
the so-called limiting current density can be further exceeded if a certain threshold in the
membrane voltage drop is surpassed. The region of currents higher than the ilim (i>ilim) is
conventionally called the overlimiting region, as indicated in Fig. 1.11. This region is not
predicted by the concentration polarization theory, and is not observed in pressure driven
membranes.
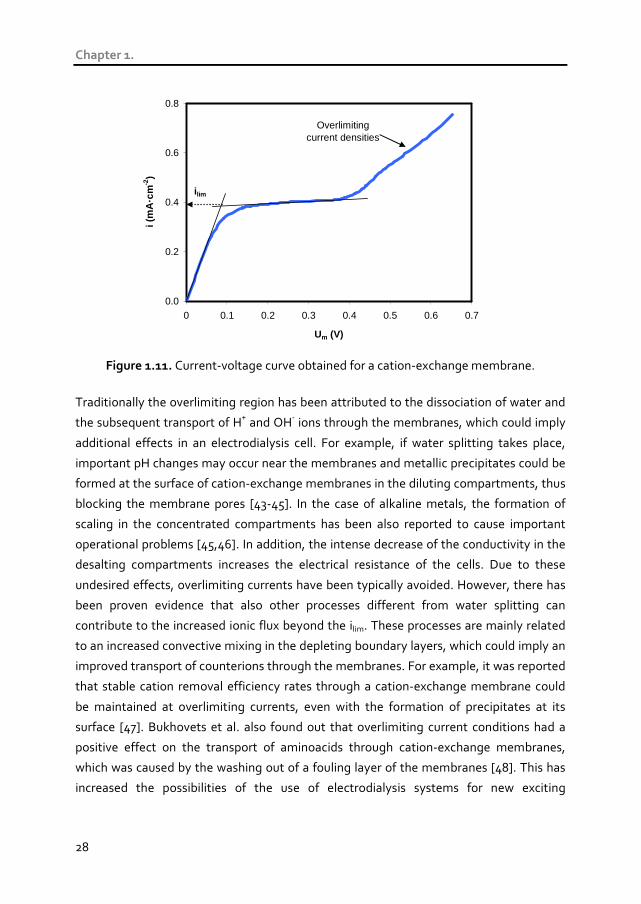
Chapter 1.
28
0.0
0.2
0.4
0.6
0.8
0 0.1 0.2 0.3 0.4 0.5 0.6 0.7
Um (V)
i (m
A·c
m-2
)
i lim
Overlimiting current densities
Figure 1.11. Current-voltage curve obtained for a cation-exchange membrane.
Traditionally the overlimiting region has been attributed to the dissociation of water and
the subsequent transport of H+ and OH- ions through the membranes, which could imply
additional effects in an electrodialysis cell. For example, if water splitting takes place,
important pH changes may occur near the membranes and metallic precipitates could be
formed at the surface of cation-exchange membranes in the diluting compartments, thus
blocking the membrane pores [43-45]. In the case of alkaline metals, the formation of
scaling in the concentrated compartments has been also reported to cause important
operational problems [45,46]. In addition, the intense decrease of the conductivity in the
desalting compartments increases the electrical resistance of the cells. Due to these
undesired effects, overlimiting currents have been typically avoided. However, there has
been proven evidence that also other processes different from water splitting can
contribute to the increased ionic flux beyond the ilim. These processes are mainly related
to an increased convective mixing in the depleting boundary layers, which could imply an
improved transport of counterions through the membranes. For example, it was reported
that stable cation removal efficiency rates through a cation-exchange membrane could
be maintained at overlimiting currents, even with the formation of precipitates at its
surface [47]. Bukhovets et al. also found out that overlimiting current conditions had a
positive effect on the transport of aminoacids through cation-exchange membranes,
which was caused by the washing out of a fouling layer of the membranes [48]. This has
increased the possibilities of the use of electrodialysis systems for new exciting

Introduction
29
applications in industrial processes. The potential of the application of electromembrane
processes at overlimiting currents is discussed in more detail in the following section.
1.3.3 The potential of the overlimiting current regimes
In general, in electrodialysis systems it is desired to achieve fast desalination rates (high
current densities) with the lowest energy consumption (operating costs) and membrane
area (investment costs). However, the current density is usually selected according to
criteria of energy efficiency. This implies that, in practice, the use of underlimiting
currents was traditionally prescribed because the overlimiting currents were attributed to
the generation of unwanted species (dissociation of water into H+ and OH- ions), to the
counterion current exaltation due to the dissociation of water, and to a loss of
permselectivity of the membranes. Nevertheless, this conception has changed today as
the origin of the overlimiting membrane conductance has been more precisely
investigated, and the use of overlimiting current regimes is being considered for some
applications.
A variety of investigations have evidenced that the water splitting is a phenomenon more
likely to occur in anion-exchange membranes due to the catalytic activity of tertiary
amines present in their structures, whereas it was nearly absent in cation-exchange
membranes [49-52]. Moreover, it has been proven that overlimiting currents can also be
related to an increased transport of electrolyte counterions [53,54]. This increased supply
of electrolyte counterions from the bulk solution to the membrane depleting surface is
mainly caused by convective phenomena that are induced at an advanced stage of
concentration polarization and under the effect of strong electric fields. Gravitational
convection and electroconvection are the most important mechanisms of current-
induced convection.
Therefore, the proper utilization of overlimiting current modes can signify an important
improvement of electromembrane processes, since it may permit obtaining fast
desalination rates, thus implying a reduction in the necessary area of ion-exchange
membranes. For this reason, several works have been conducted in order to promote the
overlimiting currents. For example, it has been proven that the presence of surface and
electrical inhomogeneities in the membranes could enhance electroconvection, and
according to this, the surface modification of ion-exchange membranes has been widely
studied [53,55-57]. With regard to the modes of operation of electrodialysis units, also
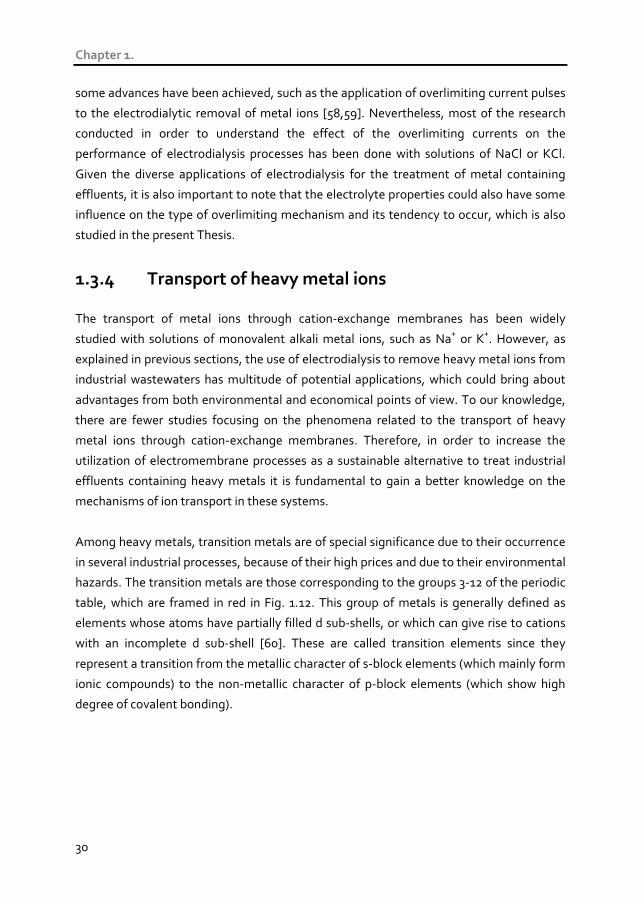
Chapter 1.
30
some advances have been achieved, such as the application of overlimiting current pulses
to the electrodialytic removal of metal ions [58,59]. Nevertheless, most of the research
conducted in order to understand the effect of the overlimiting currents on the
performance of electrodialysis processes has been done with solutions of NaCl or KCl.
Given the diverse applications of electrodialysis for the treatment of metal containing
effluents, it is also important to note that the electrolyte properties could also have some
influence on the type of overlimiting mechanism and its tendency to occur, which is also
studied in the present Thesis.
1.3.4 Transport of heavy metal ions
The transport of metal ions through cation-exchange membranes has been widely
studied with solutions of monovalent alkali metal ions, such as Na+ or K+. However, as
explained in previous sections, the use of electrodialysis to remove heavy metal ions from
industrial wastewaters has multitude of potential applications, which could bring about
advantages from both environmental and economical points of view. To our knowledge,
there are fewer studies focusing on the phenomena related to the transport of heavy
metal ions through cation-exchange membranes. Therefore, in order to increase the
utilization of electromembrane processes as a sustainable alternative to treat industrial
effluents containing heavy metals it is fundamental to gain a better knowledge on the
mechanisms of ion transport in these systems.
Among heavy metals, transition metals are of special significance due to their occurrence
in several industrial processes, because of their high prices and due to their environmental
hazards. The transition metals are those corresponding to the groups 3-12 of the periodic
table, which are framed in red in Fig. 1.12. This group of metals is generally defined as
elements whose atoms have partially filled d sub-shells, or which can give rise to cations
with an incomplete d sub-shell [60]. These are called transition elements since they
represent a transition from the metallic character of s-block elements (which mainly form
ionic compounds) to the non-metallic character of p-block elements (which show high
degree of covalent bonding).

Introduction
31
1 2 3 4 5 6 7 8 9 10 11 12 13 14 15 16 17 18
H He
Li Be B C N O F Ne
Na Mg Transition metals Al Si P S Cl Ar
K Ca Sc Ti V Cr Mn Fe Co Ni Cu Zn Ga Ge As Se Br Kr
Rb Sr Y Zr Nb Mo Tc Ru Rh Pd Ag Cd In Sn Sb Te I Xe
Cs Ba La Hf Ta W Re Os Ir Pt Au Hg Tl Pb Bi Po At Rn
Fr Ra Ac
Fig. 1.12. Position of the transition metals in the periodic table of the elements.
One of the main characteristics of transition metal ions is the wide range of oxidation
states in which they could occur. Transition metals have 5 d-orbitals and most of them
have multiple oxidation states, since it is relatively easy to lose electrons for transition
metals compared to the alkali and alkaline earth metals. Table 1.2 shows the common
oxidation states of the first-row of transition metals. They can be stable in various
multivalent ionic forms, showing all of them (except Sc) oxidation state +2 due to the loss
of two 4s electrons. Their metal ions in oxidation state +2 and +3 are quite stable, but
many of them can also form multivalent ions of higher oxidation state, such as Mn or Cr.

Chapter 1.
32
Table 1.2. Common oxidation states of the first-row transition metals (:
common oxidation states, : possible but unlikely oxidation states).
Sc Ti V Cr Mn Fe Co Ni Cu Zn
s2 d1 s2 d2 s2 d3 s1 d5 s2 d5 s2 d6 s2 d7 s1 d8 s1 d10 s2 d10
7
6
5
4
3
2
1
Ox
ida
tio
n s
tate
0
21 22 23 24 25 26 27 28 29 30
Atomic number
The different oxidation states and the relatively low reactivity of the unpaired d electrons
impart specific properties to transition metals. These metals have the ability to form
several charged compounds in many oxidation states, which are commonly known as
complex ions. A complex ion has a metal ion at its centre with a number of other ligands
surrounding it, which can be attached to the central ion by coordination bonds. Some of
the ligands include water molecules, hydroxyl ions, chloride ions or sulfate ions. This
characteristic feature makes transition heavy metals especially different from alkali and
alkaline earth metals, since they can form several ions of different shapes and
characteristics and, thus, of different conductive and transport properties. For example,
the structure of the hexaaquo complex formed by Fe3+ ions with water is shown in Fig.
1.13. As a consequence of the bigger size of the complex ions with respect to the free
ions, the ionic mobilities of the complex species should be lower in relation to the free
metal ion.

Introduction
33
Figure 1.13. Structure of the hexaaquo complex of Fe3+ ions, [Fe(H2O)6]3+.
In addition to the size effects, the different combination possibilities of concentration and
pH in heavy metal containing solutions could lead to the formation of several complex
ions with different ligands, variable coordination numbers and ionic charge. For example,
the ions resulting from dissolving Fe2(SO4)3 salts in water could give rise to the
coexistence of the following species: Fe3+, FeSO4+, Fe(SO4)2
-, FeOH2+, Fe(OH)2+, Fe(OH)3
or Fe(OH)4-. The salts which give rise to this type of speciation are usually termed as weak
electrolytes, because they are forming several complex species instead of staying as free
ions in solution (i.e. Fe3+ and SO42- ions). This characteristic makes solutions of heavy
metal ions different from solutions of alkali ions such as NaCl, which are fully dissociated
in their forming ions (Na+ and Cl-). Moreover, the changes of pH and concentration taking
place in the diffusion boundary layers and in the membrane phase could alter the
speciation of weak electrolytes, thus implying changes in the species that are transported
through the membranes.
The formation of the diffusion boundary layers may also be altered by the presence of
ionic species with different properties. In addition to this, the transport through the
membrane and the membrane conductivity can also change due to the uptake of
different types of ions inside the membrane phase. Some authors reported different
affinities of the membrane fixed charges for ions of varying valence. Okada et al.
observed that cation-exchange membranes had a higher affinity for trivalent cations than
for divalent ones [61]. These characteristics are especially important in the case of
industrial wastewaters, which are usually composed of mixtures of several ions. For
example, in those cases where the recovery of the most valuable ions is preferred over
that of other ions, the different mobilities in the solution and the different affinities for
the membrane fixed charges would determine the quality of the recovered product and,
therefore, would affect the economic viability of electrodialysis systems. Other important
aspects related to the transport of heavy metal ions through ion-exchange membranes
Chapter 1.
34
include the possibility of fouling of the membranes due to the formation of precipitates or
the role that heavy metal ions could have on the overlimiting current mechanisms [62].
1.4 References
[1] S. Giljum, A. Behrens, F. Hinterberger, C. Lutz, B. Meyer, Modelling scenarios
towards a sustainable use of natural resources in Europe, Environmental Science &
Policy, 11 (2008) 204-216.
[2] K. Halada, M. Shimada, K. Ijima, Forecasting of the consumption of metals up to
2050, Materials Transactions, 49 (2008) 402-410.
[3] Risk list 2012. British Geological Survey (BGS), 2012.
[4] T. J. Brown, N. E. Idoine, E. R. Raycraft, R. A. Shaw, E. A. Deady, J. Rippingale, T.
Bide, C. E. Wrighton, H. Holbrook, World mineral production 2008-2012, British
Geological Survey (BGS), Keyworth, Nottingham, 2014.
[5] T. E. Norgate, W. J. Rankin, The role of metals in sustainable development, Green
Processing, 1 (2002) 49-55.
[6] M.A. Reuter, C. Hudson, A. van Schaik, K. Heiskanen, C. Meskers, C. Hagelüken,
Metal recycling: opportunities, limits, infrastructure. A report of the working group
on the global metal flows to the international resource panel, United Nations
Environment Programme, 2013.
[7] T. E. Gradel, R. Barr, D. Cordier, M. Enriquez, C. Hagelüken, N. Q. Hammond, S.
Kesler, G. Mudd, N. Nassar, J. Peacey, B. K. Reck, L. Robb, B. Skinner, I. Turnbull,
R. Ventura Santos, F. Wall, D. Wittmer, Estimating long-run geological stocks of
metals., UNEP International Panel on Sustainable Resource Management, Working
Group on Geological Stocks of Metals, 2011.
[8] T.D. Kelly, G.R. Matos, Historical statistics for mineral and material commodities in
the United States, 2014.
[9] Mineral profile: Nickel, Natural Environment Research Council, British Geological
Survey (BGS), 2008.
Introduction
35
[10] F. Fu, Q. Wang, Removal of heavy metal ions from wastewaters: A review, Journal
of Environmental Management, 92 (2011) 407-418.
[11] A. Maceda-Veiga, M. Monroy, A. de Sostoa, Metal bioaccumulation in the
Mediterranean barbel (Barbus meridionalis) in a Mediterranean river receiving
effluents from urban and industrial wastewater treatment plants, Ecotoxicology
and Environmental Safety, 76 (2012) 93-101.
[12] I. Riba, J. Blasco, N. Jiménez-Tenorio, M.L. González de Canales, T. Ángel DelValls,
Heavy metal bioavailability and effects: II. Histopathology-bioaccumulation
relationships caused by mining activities in the Gulf of Cádiz (SW, Spain),
Chemosphere, 58 (2005) 671-682.
[13] B. Cui, Q. Zhang, K. Zhang, X. Liu, H. Zhang, Analyzing trophic transfer of heavy
metals for food webs in the newly-formed wetlands of the Yellow River Delta,
China, Environmental Pollution, 159 (2011) 1297-1306.
[14] M. Barwick, W. Maher, Biotransference and biomagnification of selenium copper,
cadmium, zinc, arsenic and lead in a temperate seagrass ecosystem from Lake
Macquarie Estuary, NSW, Australia, Marine Environmental Research, 56 (2003)
471-502.
[15] International Agency for research on cancer. Nickel and nickel compounds. IARC
monographs on the evaluation of carcinogenic risks to humans, 169, 1990.
[16] International Agency for research on cancer. Chromium(VI) compounds. IARC
monographs on the evaluation of carcinogenic risks to humans, 147, 1990.
[17] Heavy metals in waste. Final report of the European Commission, 2002.
[18] S.R. Jennings, D.R. Neuman, P.S. Blicker, Acid mine drainage and effects on fish
health and ecology: a review, Reclamation Research Group Publication, Bozeman,
MT, 2008.
[19] Reference document on best available techniques for the surface treatment of
metals and plastics. Integrated Pollution Prevention and Control, European
Commission, 2006.

Chapter 1.
36
[20] Reference document on best available techniques in the food, drink and milk
industries. Integrated Pollution Prevention and Control, European Commission,
2006.
[21] Y. Oren, E. Korngold, N. Daltrophe, R. Messalem, Y. Volkman, L. Aronov, M.
Weismann, N. Bouriakov, P. Glueckstern, J. Gilron, Pilot studies on high recovery
BWRO-EDR for near zero liquid discharge approach, Desalination, 261 (2010) 321-
330.
[22] S. Casas, C. Aladjem, J. L. Cortina, E. Larrotcha, F. Valero, C. Miguel, Concentration
of Seawater Reverse Osmosis Brines using Electrodialysis for a Zero Discharge
System, Procedia Engineering, 44 (2012) 1749-1750.
[23] J. Shen, J. Huang, L. Liu, W. Ye, J. Lin, B. Van der Bruggen, The use of BMED for
glyphosate recovery from glyphosate neutralization liquor in view of zero
discharge, Journal of Hazardous Materials, 260 (2013) 660-667.
[24] J.X. Zhuang, Q. Chen, S. Wang, W.M. Zhang, W.G. Song, L.J. Wan, K.S. Ma, C.N.
Zhang, Zero discharge process for foil industry waste acid reclamation: Coupling of
diffusion dialysis and electrodialysis with bipolar membranes, Journal of
Membrane Science, 432 (2013) 90-96.
[25] R. Baker, Membrane technology and applications, John Wiley & Sons, Ltd., Menlo
Park, California, 2004.
[26] E.R. Reahl, Half a century of desalination with electrodialysis. GE Water & Process
Technologies, 2006.
[27] F. Valero, R. Arbós, Desalination of brackish river water using Electrodialysis
Reversal (EDR): Control of the THMs formation in the Barcelona (NE Spain) area,
Desalination, 253 (2010) 170-174.
[28] Membrane Technology in the Chemical Industry, Wiley-VCH, 2001.
[29] H. Strathmann, Electrodialysis, a mature technology with a multitude of new
applications, Desalination, 264 (2010) 268-288.
[30] B.E. Logan, K. Rabaey, Conversion of wastes into bioelectricity and chemicals by
using microbial electrochemical technologies, Science, 337 (2012) 686-690.

Introduction
37
[31] S. Pawlowski, J.G. Crespo, S. Velizarov, Pressure drop in reverse electrodialysis:
Experimental and modeling studies for stacks with variable number of cell pairs,
Journal of Membrane Science, 462 (2014) 96-111.
[32] J.M. Ortiz, E. Expósito, F. Gallud, V. García-García, V. Montiel, A. Aldaz,
Desalination of underground brackish waters using an electrodialysis system
powered directly by photovoltaic energy, Solar Energy Materials and Solar Cells,
92 (2008) 1677-1688.
[33] T. Xu, Ion exchange membranes: State of their development and perspective,
Journal of Membrane Science, 263 (2005) 1-29.
[34] F.G. Donnan, Theory of membrane equilibria and membrane potentials in the
presence of non-dialysing electrolytes. A contribution to physical-chemical
physiology, Journal of Membrane Science, 100 (1995) 45-55.
[35] J.J. Krol, Doctoral thesis: Monopolar and bipolar ion exchange membranes. Mass
transport limitations, University of Twente, Enschede, The Netherlands, 1997.
[36] Y. Mizutani, Structure of ion exchange membranes, Journal of Membrane Science,
49 (1990) 121-144.
[37] Terminology for membranes and membrane processes (IUPAC Recommendation
1996), Journal of Membrane Science, 120 (1996) 149-159.
[38] R. Audinos, G. Pichelin, Characterization of electrodialysis membranes by
chronopotentiometry, Desalination, 68 (1988) 251-263.
[39] V.V. Nikonenko, N.D. Pismenskaya, E.I. Belova, P. Sistat, P. Huguet, G. Pourcelly,
C. Larchet, Intensive current transfer in membrane systems: Modelling,
mechanisms and application in electrodialysis, Advances in Colloid and Interface
Science, 160 (2010) 101-123.
[40] A.M. Peers, Membrane phenomena, Discussions of the Faraday Society, 24 (1956)
124-125.
[41] D.A. Cowan, J.H. Brown, Effect of turbulence on limiting current in electrodialysis
cells, Industrial & Engineering Chemistry, 51 (1959) 1445-1448.
Chapter 1.
38
[42] A. Alcaraz, F.G. Wilhelm, M. Wessling, P. Ramírez, The role of the salt electrolyte
on the electrical conductive properties of a polymeric bipolar membrane, Journal of
Electroanalytical Chemistry, 513 (2001) 36-44.
[43] M.S. Kang, Y.J. Choi, H.J. Lee, S.H. Moon, Effects of inorganic substances on water
splitting in ion-exchange membranes: I. Electrochemical characteristics of ion-
exchange membranes coated with iron hydroxide/oxide and silica sol, Journal of
Colloid and Interface Science, 273 (2004) 523-532.
[44] Y. Tanaka, M. Seno, Concentration polarization and water dissociation in ion-
exchange membrane electrodialysis. Mechanism of water dissociation, Journal of
the Chemical Society, Faraday Transactions 1, 82 (1986) 2065-2077.
[45] J. Balster, O. Krupenko, I. Pünt, D.F. Stamatialis, M. Wessling, Preparation and
characterisation of monovalent ion selective cation exchange membranes based
on sulphonated poly(ether ether ketone), Journal of Membrane Science, 263 (2005)
137-145.
[46] G. Saracco, Transport properties of monovalent-ion-permselective membranes,
Chemical Engineering Science, 52 (1997) 3019-3031.
[47] J.H. Chang, A.V. Ellis, C.H. Tung, W.C. Huang, Copper cation transport and scaling
of ionic exchange membranes using electrodialysis under electroconvection
conditions, Journal of Membrane Science, 361 (2010) 56-62.
[48] A. Bukhovets, T. Eliseeva, N. Dalthrope, Y. Oren, The influence of current density
on the electrochemical properties of anion-exchange membranes in electrodialysis
of phenylalanine solution, Electrochimica Acta, 56 (2011) 10283-10287.
[49] I. Rubinstein, B. Zaltzman, O. Kedem, Electric fields in and around ion-exchange
membranes, Journal of Membrane Science, 125 (1997) 17-21.
[50] Y. Tanaka, Water dissociation in ion-exchange membrane electrodialysis, Journal
of Membrane Science, 203 (2002) 227-244.
[51] I. Rubinstein, L. Shtilman, Voltage against current curves of cation exchange
membranes, Journal of the Chemical Society , Faraday Transactions 2, 75 (1979)
231-246.
Introduction
39
[52] V.I. Vasil’eva, A.V. Zhil’tsova, M.D. Malykhin, V.I. Zabolotskii, K.A. Lebedev, R.K.
Chermit, M.V. Sharafan, Effect of the chemical nature of the ionogenic groups of
ion-exchange membranes on the size of the electroconvective instability region in
high-current modes, Russian Journal of Electrochemistry, 50 (2014) 120-128.
[53] J. Balster, M.H. Yildirim, D.F. Stamatialis, R. Ibanez, R.G.H. Lammertink, V. Jordan,
M. Wessling, Morphology and microtopology of cation-exchange polymers and the
origin of the overlimiting current, Journal of Physical Chemistry B, 111 (2007) 2152-
2165.
[54] I. Rubinstein, B. Zaltzman, Electro-osmotically induced convection at a
permselective membrane, Physical Review E, 62 (2000) 2238-2251.
[55] M. Wessling, L.G. Morcillo, S. Abdu, Nanometer-thick lateral polyelectrolyte
micropatterns induce macrosopic electro-osmotic chaotic fluid instabilities,
Scientific Reports, 4 (2014).
[56] E.D. Belashova, N.A. Melnik, N.D. Pismenskaya, K.A. Shevtsova, A.V. Nebavsky,
K.A. Lebedev, V.V. Nikonenko, Overlimiting mass transfer through cation-
exchange membranes modified by Nafion film and carbon nanotubes,
Electrochimica Acta, 59 (2012) 412-423.
[57] N.P. Berezina, N.A. Kononenko, A.A.R. Sytcheva, N.V. Loza, S.A. Shkirskaya, N.
Hegman, A. Pungor, Perfluorinated nanocomposite membranes modified by
polyaniline: Electrotransport phenomena and morphology, Electrochimica Acta, 54
(2009) 2342-2352.
[58] T.R. Sun, L.M. Ottosen, P.E. Jensen, G.M. Kirkelund, Effect of pulse current on
acidification and removal of Cu, Cd, and As during suspended electrodialytic soil
remediation, Electrochimica Acta, 107 (2013) 187-193.
[59] N. Cifuentes-Araya, G. Pourcelly, L. Bazinet, Multistep mineral fouling growth on a
cation-exchange membrane ruled by gradual sieving effects of magnesium and
carbonate ions and its delay by pulsed modes of electrodialysis, Journal of Colloid
and Interface Science, 372 (2012) 217-230.
[60] IUPAC, Compendium of Chemical Terminology. Gold book, 2014.
Chapter 1.
40
[61] T. Okada, Y. Ayato, M. Yuasa, I. Sekine, The effect of impurity cations on the
transport characteristics of perfluorosulfonated ionomer membranes, Journal of
Physical Chemistry B, 103 (1999) 3315-3322.
[62] L. Marder, E.M. Ortega Navarro, V. Pérez-Herranz, A.M. Bernardes, J.Z. Ferreira,
Evaluation of transition metals transport properties through a cation-exchange
membrane by chronopotentiometry, Journal of Membrane Science, 284 (2006)
267-275.
41
Chapter 2
OBJECTIVES AND SCOPE
2.1 Objectives and scope
The concerns about the harmful effects of heavy metals on the environment and the
human health, as well as the need for a more sustainable management of the Earth’s
natural resources, have promoted the introduction of clean technologies in industrial
processes. Among them, electrodialyis is in a good position because it can be easily
coupled into productive processes to reclaim large volumes of water and recover valuable
by-products.
Nevertheless, electrodialysis presents certain limitations when it is used to treat solutions
containing heavy metal ions. These limitations are related to complex mass transfer
processes occurring when multivalent ions cross ion-exchange membranes. Therefore,
identifying and understanding these processes would be the first step in order to improve
electrodialysis and transform it into a competitive technology for the treatment of metal
containing effluents. Accordingly, the principal aim of the present Thesis is:
Chapter 2.
42
“To identify and investigate the main mass transfer phenomena implied in
electrodialysis processes in order to optimize the treatment of industrial effluents
containing heavy metals”.
The main goal of the Thesis will be accomplished by means of completing several
experimental studies, which are planned in order to achieve more specific objectives.
These are as follows:
To identify the main limitations related to the transport of heavy metal ions
through cation-exchange membranes and their effects on the performance of
electrodialysis units.
To determine the effects of the electrolyte concentration and composition on
the limiting current densities (ilim) and electrical resistances of membrane
systems (R1).
To evaluate the influence of the speciation of metal containing solutions on the
transport of ions and ion complexes through cation-exchange membranes.
To evaluate the influence of the ion sorption, the development of concentration
polarization, and the current regime on the membrane selectivity for ions of
different valence present in mixture solutions.
To identify the predominant mechanisms of overlimiting membrane
conductance and evaluate the role of heavy metals on the overlimiting current
mechanisms.
To assess the effect of applying overlimiting currents on the membrane
performance during long-term galvanostatic experiments.
2.2 Structure of this Thesis
This Thesis is divided into five different chapters. The structure is schematically presented
in Fig. 2.1. The content of each chapter is explained as follows:
Objectives and scope
43
Chapter 1 introduces the problematic of the discharge of heavy metals into the
environment and the interest in developing clean techniques in order to allow a
sustainable use of the Earth’s resources. Then, electrodialysis is presented as a
sustainable treatment technique and their basic principles are explained. Once the main
challenges of electrodialysis applied to the treatment of effluents containing heavy
metals are identified, the main objectives of the Thesis are presented in Chapter 2.
Chapter 3 describes the procedures and techniques employed to carry out the
experimental part of the Thesis and to achieve the proposed objectives.
The experimental results are presented and discussed in Chapter 4, which is divided in
four different subchapters. Chapter 4.1 is focused on the study of the transport of heavy
metals through cation-exchange membranes in systems of single salt solutions. Different
parameters such as the sorption of ions, the electrical resistance of the membranes and
the limiting currents are obtained for single salt solutions of monovalent (Na+) and
multivalent ions (Ni2+
, Cr3+
and Fe3+
). The speciation of the different solutions is used in
order to compare the behavior of the membranes with solutions of multivalent ions in
relation to their behavior with monovalent ones.
Chapter 4.2 is focused on the investigation of the membrane behavior in systems of
multicomponent mixture solutions. For this study, two different cases have been
considered: the competitive ion transport between multivalent metals and protons (Ni2+
vs. H+); and the competitive ion transport between monovalent and multivalent metals
(Na+ vs. Fe(III) species). As in Chapter 4.1, the ion sorption, the electrical resistance and
the limiting current densities are evaluated for the different systems. The behavior of the
membranes in multicomponent mixtures is also compared with the results obtained in
Chapter 4.1 for single salt solutions.
Chapter 4.3 aims to evaluate the predominance of the mechanisms of overlimiting mass
transfer for different electrolyte compositions. Both the dynamic response
(chronopotentiometry) and the steady state behavior of the membranes (current-voltage
curves) obtained in Chapter 4.1 and 4.2 are evaluated in order to identify the main
mechanisms of overlimiting mass transfer. The role of the electrolyte composition on the
overlimiting mechanisms is also investigated.

Chapter 2.
44
In Chapter 4.4 the main results obtained from Chapter 4.2 and 4.3 are contrasted and
corroborated by means of performing galvanostatic experiments of longer duration (6h).
These would allow us to evaluate the effect of the CrO3 concentration on the transport of
Ni2+
ions through the membrane, and to assess the viability of applying overlimiting
currents by taking into account the influence of other processes occurring in
electrodialysis cells. The effects of the electrolyte composition and the current regime on
the current efficiency and the energy consumption of each experiment are also
investigated.
Finally, Chapter 5 summarizes the main conclusions of the present Thesis.

Objectives and scope
45
Fig
ure
2.1
. S
che
me
sh
ow
ing
th
e s
tru
ctu
re o
f th
e D
oct
ora
l Th
esi
s d
ivid
ed
in d
iffe
ren
t ch
ap
ters
.

47
Chapter 3
EXPERIMENTAL TECHNIQUES
3.1 Introduction
The different experimental techniques employed in the present Thesis are explained in
this Chapter. The principles, the materials and the experimental setup used in the
experiments are described with the aim to show how these experimental techniques can
provide useful information about the properties of the cation-exchange membranes and
the mass transfer phenomena taking place in electrodialysis cells.
This Chapter has been divided in different sections according to the purpose for which
each technique is employed. First, the membranes used to study the transport of metal
ions are described and the surface analysis techniques used to characterize their structure
and visualize their morphology are explained. Second, the experiments carried out to
determine the membrane affinity for the solution counterions in equilibrium conditions
(without the application of an external electric field) are described. Subsequently, a
description of the principles of chronopotentiometry, which is applied to characterize the
dynamic response of the membranes under the application of an electric field, is

Chapter 3.
48
provided. The chronopotentiometric results are also useful to obtain the current-voltage
curves of the membrane systems and calculate the transport number of counterions
through the membranes. Finally, the conditions of the galvanostatic electrodialysis
experiments used to evaluate the performance of electromembrane reactors are also
described.
3.2 Ion-exchange membranes used in the Thesis
As it has been emphasized in Chapter 1, the treatment of industrial effluents by means of
electromembrane processes requires the utilization of ion-exchange membranes with
good properties in terms of chemical resistance and durability. Industrial wastewaters are
typically characterized by having extreme pH values (very acidic or very basic) which
accelerate the degradation of polymeric membranes. Moreover, many industrial effluents
are composed of chemicals with high oxidizing strength, thus limiting the lifetime of the
membranes. Therefore, for practical applications it is important to characterize the ion
transport through commercial membranes which have good properties in terms of
chemical resistance.
Nafion 117 (Du Pont®) was selected as the cation-exchange membrane to carry out the
experimental part of this Thesis, since it is considered as a reference due to its high
conductivity and excellent chemical resistance. Nafion is a perfluorosulfonic
homogeneous membrane, i.e.: it is composed of a hydrophobic fluorinated polymer
backbone to which short side chains terminated in sulfonate groups (-SO3-) are attached.
The chemical structure of the Nafion membranes is shown in Fig. 3.1. The high
conductivity of Nafion has been attributed to the conformation of the membrane in wet
conditions [1,2]. When the membrane is hydrated, it swells and the fixed sulfonate groups
form ionic aggregates, which are called ionic clusters. These clusters are connected by
short and narrow channels through which the counterions are transported. The
morphology of hydrated Nafion is also shown in Fig. 3.1, where the ionic clusters of about
40 Å connected by channels of 10 Å are indicated. Note that the fixed charges of the
membranes are balanced with the solution counterions (H+ in the case of membranes
equilibrated in water).
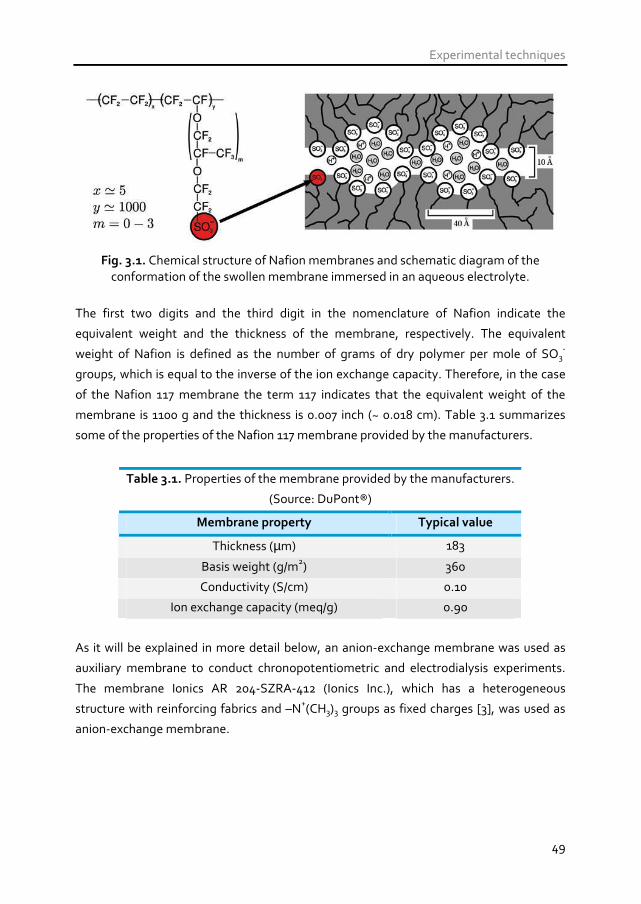
Experimental techniques
49
Fig. 3.1. Chemical structure of Nafion membranes and schematic diagram of the
conformation of the swollen membrane immersed in an aqueous electrolyte.
The first two digits and the third digit in the nomenclature of Nafion indicate the
equivalent weight and the thickness of the membrane, respectively. The equivalent
weight of Nafion is defined as the number of grams of dry polymer per mole of SO3-
groups, which is equal to the inverse of the ion exchange capacity. Therefore, in the case
of the Nafion 117 membrane the term 117 indicates that the equivalent weight of the
membrane is 1100 g and the thickness is 0.007 inch (~ 0.018 cm). Table 3.1 summarizes
some of the properties of the Nafion 117 membrane provided by the manufacturers.
Table 3.1. Properties of the membrane provided by the manufacturers.
(Source: DuPont®)
Membrane property Typical value
Thickness (µm) 183
Basis weight (g/m2) 360
Conductivity (S/cm) 0.10
Ion exchange capacity (meq/g) 0.90
As it will be explained in more detail below, an anion-exchange membrane was used as
auxiliary membrane to conduct chronopotentiometric and electrodialysis experiments.
The membrane Ionics AR 204-SZRA-412 (Ionics Inc.), which has a heterogeneous
structure with reinforcing fabrics and –N+(CH3)3 groups as fixed charges [3], was used as
anion-exchange membrane.
Chapter 3.
50
3.3 Visualization and characterization of the
structure of ion-exchange membranes The visualization and characterization of the surface and structure of ion-exchange
membranes is important because the membrane morphology is strongly correlated with
their properties, such as the electrical resistance or the selectivity.
3.3.1 Scanning Electron Microscopy
The scanning electron microscope (SEM) is an instrument used to characterize the
surface and structure of organic and inorganic materials. Its working principle is based on
the scanning of the surface of a sample with a beam of accelerated electrons. The
electrons-sample interactions derive in other signals, which are collected in different
sensors in order to generate an image that reveals the surface topology and the
morphology of the samples. More specifically, SEM is used in the field of ion-exchange
membranes to detect the presence of different components in the membrane structure,
such as ion exchange resins, polymer binder or reinforcing fibers. It is also useful to
observe the topology of the surfaces and detect geometrical surface heterogeneities
which are reported to affect the development of concentration polarization phenomena
near ion-exchange membranes.
SEM techniques are considered non-invasive; however, organic samples, such as ion-
exchange membranes, must be submitted to a specific pretreatment which could imply a
loss of their properties. In the present study, samples of Nafion 117 were prepared by
sputtering their surface with an ultrathin layer of conducting material (i.e.: gold) under
vacuum conditions. Both surface and cross sections of the membranes were obtained.
The samples used to obtain an image of the membrane cross section were frozen in liquid
nitrogen and then broken in order to produce a natural cross section. The SEM equipment
used to visualize the membrane morphology was a JEOL JSM-3600 and 15 kV were
applied to generate the electron beam.
3.3.2 Raman spectroscopy
Raman spectroscopy is a fundamental form of molecular spectroscopy which is used to
obtain information about the structure of molecules from their vibrational transitions.
Raman scattering is a two-photon event, where the property involved is the change in the

Experimental techniques
51
polarizability of the molecule with respect to its vibrational motion. The interaction of the
polarizability with the incoming radiation creates an induced dipole moment in the
molecule, and the radiation emitted by this induced dipole moment contains the
observed Raman scattering [4]. In the field of ion-exchange membranes, Raman
spectroscopy is very useful because it is a non-invasive and non-destructive technique
that can be employed to obtain the ionic composition of the membrane material
immersed in aqueous solutions and to detect the nature and stoichiometry of membrane
poisoning ions [5,6].
Raman spectroscopy requires minimal sample preparation. In the present case,
membrane samples immersed in water were kept flat between two optical glass plates.
Then, Raman spectra were excited with a 632.75 nm radiation from a He-Ne ion laser
operated at about 25 mW. For the registration of the Raman spectra we used a Witec
300R+ Raman microscope.
3.4 Ion uptake experiments The static properties of ion-exchange membranes provide information about the
interactions existing under no-current conditions between the fixed sites of the
membranes and the electrolyte ions. These properties depend on thermodynamic
concepts and attracting/repulsing forces acting between the mobile ionic species present
in the electrolyte solution and the membrane fixed charges.
Ion-exchange experiments were performed in order to determine the affinity of the
membrane fixed charges toward the counterions present in the different electrolyte
solutions. The ion uptake of ion-exchange membranes can be determined by means of
successive equilibration steps in which the ions balancing the membrane fixed charges
are replaced by other ions present in an equilibrating solution. The procedure followed is
schematically represented in Fig. 3.2 and detailed below:
1. Membrane stripes of 3x3 cm2 were cut and equilibrated in 250 ml of the desired
salt solution for 24 h at room temperature (25ºC) and under stirring conditions to
reach the equilibrium.
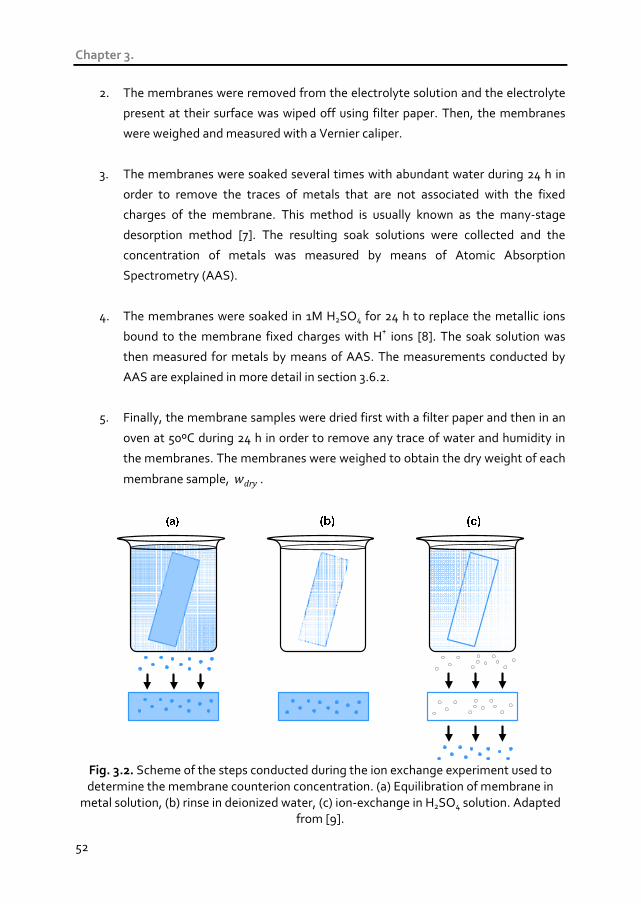
Chapter 3.
52
2. The membranes were removed from the electrolyte solution and the electrolyte
present at their surface was wiped off using filter paper. Then, the membranes
were weighed and measured with a Vernier caliper.
3. The membranes were soaked several times with abundant water during 24 h in
order to remove the traces of metals that are not associated with the fixed
charges of the membrane. This method is usually known as the many-stage
desorption method [7]. The resulting soak solutions were collected and the
concentration of metals was measured by means of Atomic Absorption
Spectrometry (AAS).
4. The membranes were soaked in 1M H2SO4 for 24 h to replace the metallic ions
bound to the membrane fixed charges with H+ ions [8]. The soak solution was
then measured for metals by means of AAS. The measurements conducted by
AAS are explained in more detail in section 3.6.2.
5. Finally, the membrane samples were dried first with a filter paper and then in an
oven at 50ºC during 24 h in order to remove any trace of water and humidity in
the membranes. The membranes were weighed to obtain the dry weight of each
membrane sample, dryw .
Fig. 3.2. Scheme of the steps conducted during the ion exchange experiment used to determine the membrane counterion concentration. (a) Equilibration of membrane in
metal solution, (b) rinse in deionized water, (c) ion-exchange in H2SO4 solution. Adapted from [9].

Experimental techniques
53
From the determination of the concentration of metals in each soak solution, different
membrane properties can be obtained. The concentration of metal counterions
exchanged per gram of dry membrane ( mc ) is given by Eq. (3.1):
dry
soaksoakm
w
Vcc
⋅= (3.1)
Where soakc and soakV represent the metal ion concentration and the volume of the
sulfuric acid desorbing solution, respectively. The concentration of counterions present in
the membrane phase ( mc , expressed in mmol per volume of membrane) can be
determined by using Eq. (3.2):
m
soaksoakm
V
Vcc
⋅= (3.2)
Where mV is the volume of the membrane measured in wet conditions. Finally, the
partition coefficient of counterions in the membrane phase (K ) can be calculated from
the ratio between the concentration of counterions in the membrane phase and the
concentration of counterions in the equilibrating solution ( ec ) with Eq. (3.3):
e
m
c
cK = (3.3)
Solutions of different salts of metal sulfates; Na2SO4, NiSO4, Cr2(SO4)3 and Fe2(SO4)3
(Panreac®, analytical grade); were used to carry out the ion sorption experiments. The
range of metal concentrations used for the single salt experiments (corresponding to
Chapter 4.1) varied from 10-3M to 2·10-2M, as summarized in Table 3.2.
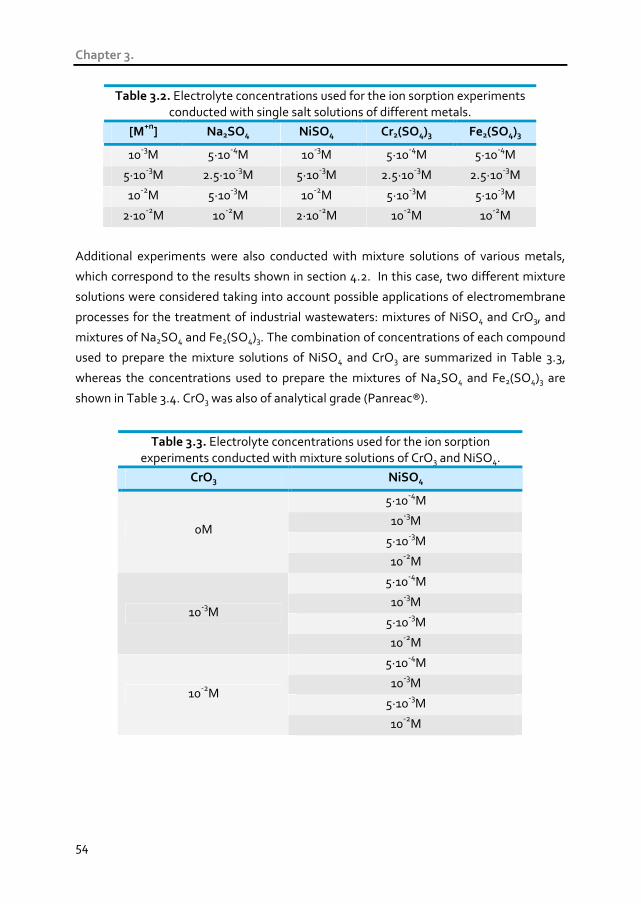
Chapter 3.
54
Table 3.2. Electrolyte concentrations used for the ion sorption experiments conducted with single salt solutions of different metals.
[M+n
] Na2SO4 NiSO4 Cr2(SO4)3 Fe2(SO4)3
10-3M 5·10-4M 10-3M 5·10-4M 5·10-4M
5·10-3M 2.5·10-3M 5·10-3M 2.5·10-3M 2.5·10-3M
10-2M 5·10-3M 10-2M 5·10-3M 5·10-3M
2·10-2M 10-2M 2·10-2M 10-2M 10-2M
Additional experiments were also conducted with mixture solutions of various metals,
which correspond to the results shown in section 4.2. In this case, two different mixture
solutions were considered taking into account possible applications of electromembrane
processes for the treatment of industrial wastewaters: mixtures of NiSO4 and CrO3, and
mixtures of Na2SO4 and Fe2(SO4)3. The combination of concentrations of each compound
used to prepare the mixture solutions of NiSO4 and CrO3 are summarized in Table 3.3,
whereas the concentrations used to prepare the mixtures of Na2SO4 and Fe2(SO4)3 are
shown in Table 3.4. CrO3 was also of analytical grade (Panreac®).
Table 3.3. Electrolyte concentrations used for the ion sorption experiments conducted with mixture solutions of CrO3 and NiSO4.
CrO3 NiSO4
5·10-4M
10-3M
5·10-3M 0M
10-2M
5·10-4M
10-3M
5·10-3M 10-3M
10-2M
5·10-4M
10-3M
5·10-3M 10-2M
10-2M
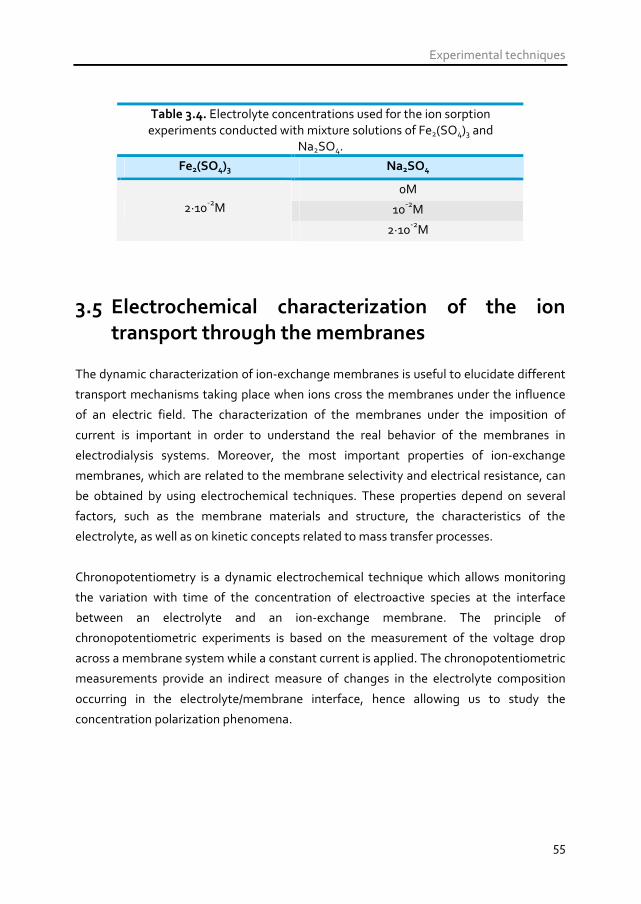
Experimental techniques
55
Table 3.4. Electrolyte concentrations used for the ion sorption experiments conducted with mixture solutions of Fe2(SO4)3 and
Na2SO4.
Fe2(SO4)3 Na2SO4
0M
10-2M 2·10-2M
2·10-2M
3.5 Electrochemical characterization of the ion
transport through the membranes
The dynamic characterization of ion-exchange membranes is useful to elucidate different
transport mechanisms taking place when ions cross the membranes under the influence
of an electric field. The characterization of the membranes under the imposition of
current is important in order to understand the real behavior of the membranes in
electrodialysis systems. Moreover, the most important properties of ion-exchange
membranes, which are related to the membrane selectivity and electrical resistance, can
be obtained by using electrochemical techniques. These properties depend on several
factors, such as the membrane materials and structure, the characteristics of the
electrolyte, as well as on kinetic concepts related to mass transfer processes.
Chronopotentiometry is a dynamic electrochemical technique which allows monitoring
the variation with time of the concentration of electroactive species at the interface
between an electrolyte and an ion-exchange membrane. The principle of
chronopotentiometric experiments is based on the measurement of the voltage drop
across a membrane system while a constant current is applied. The chronopotentiometric
measurements provide an indirect measure of changes in the electrolyte composition
occurring in the electrolyte/membrane interface, hence allowing us to study the
concentration polarization phenomena.
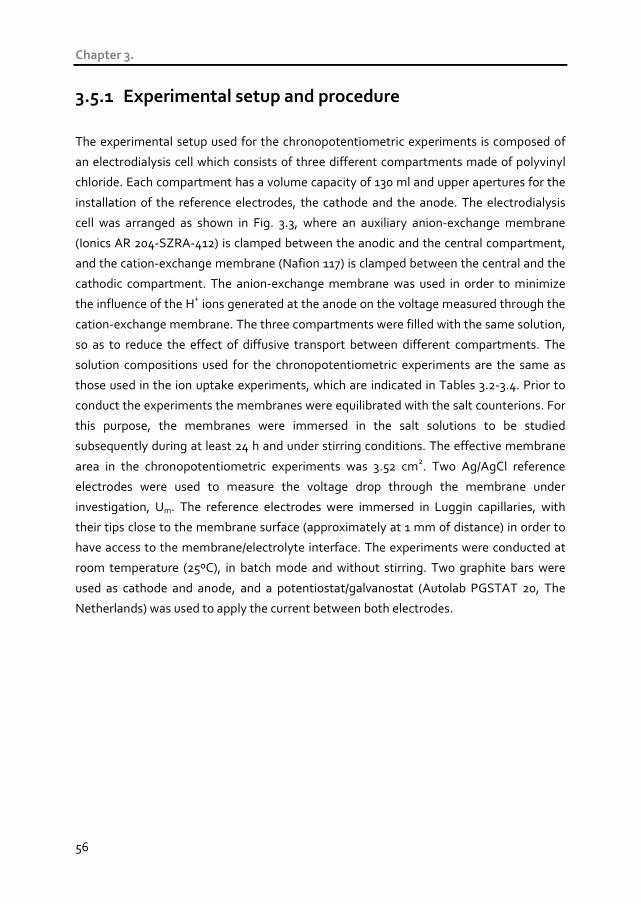
Chapter 3.
56
3.5.1 Experimental setup and procedure
The experimental setup used for the chronopotentiometric experiments is composed of
an electrodialysis cell which consists of three different compartments made of polyvinyl
chloride. Each compartment has a volume capacity of 130 ml and upper apertures for the
installation of the reference electrodes, the cathode and the anode. The electrodialysis
cell was arranged as shown in Fig. 3.3, where an auxiliary anion-exchange membrane
(Ionics AR 204-SZRA-412) is clamped between the anodic and the central compartment,
and the cation-exchange membrane (Nafion 117) is clamped between the central and the
cathodic compartment. The anion-exchange membrane was used in order to minimize
the influence of the H+ ions generated at the anode on the voltage measured through the
cation-exchange membrane. The three compartments were filled with the same solution,
so as to reduce the effect of diffusive transport between different compartments. The
solution compositions used for the chronopotentiometric experiments are the same as
those used in the ion uptake experiments, which are indicated in Tables 3.2-3.4. Prior to
conduct the experiments the membranes were equilibrated with the salt counterions. For
this purpose, the membranes were immersed in the salt solutions to be studied
subsequently during at least 24 h and under stirring conditions. The effective membrane
area in the chronopotentiometric experiments was 3.52 cm2. Two Ag/AgCl reference
electrodes were used to measure the voltage drop through the membrane under
investigation, Um. The reference electrodes were immersed in Luggin capillaries, with
their tips close to the membrane surface (approximately at 1 mm of distance) in order to
have access to the membrane/electrolyte interface. The experiments were conducted at
room temperature (25ºC), in batch mode and without stirring. Two graphite bars were
used as cathode and anode, and a potentiostat/galvanostat (Autolab PGSTAT 20, The
Netherlands) was used to apply the current between both electrodes.
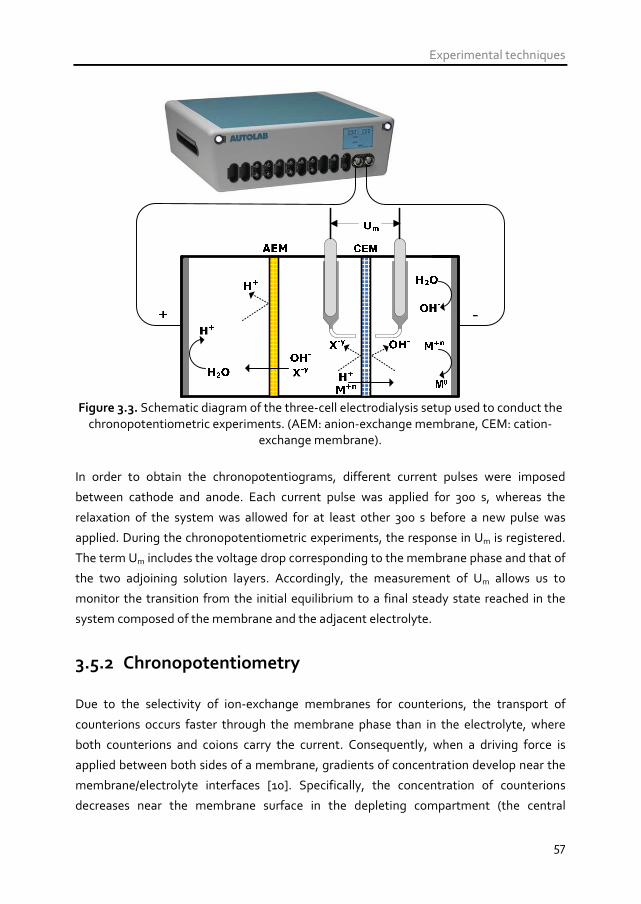
Experimental techniques
57
Figure 3.3. Schematic diagram of the three-cell electrodialysis setup used to conduct the
chronopotentiometric experiments. (AEM: anion-exchange membrane, CEM: cation-exchange membrane).
In order to obtain the chronopotentiograms, different current pulses were imposed
between cathode and anode. Each current pulse was applied for 300 s, whereas the
relaxation of the system was allowed for at least other 300 s before a new pulse was
applied. During the chronopotentiometric experiments, the response in Um is registered.
The term Um includes the voltage drop corresponding to the membrane phase and that of
the two adjoining solution layers. Accordingly, the measurement of Um allows us to
monitor the transition from the initial equilibrium to a final steady state reached in the
system composed of the membrane and the adjacent electrolyte.
3.5.2 Chronopotentiometry
Due to the selectivity of ion-exchange membranes for counterions, the transport of
counterions occurs faster through the membrane phase than in the electrolyte, where
both counterions and coions carry the current. Consequently, when a driving force is
applied between both sides of a membrane, gradients of concentration develop near the
membrane/electrolyte interfaces [10]. Specifically, the concentration of counterions
decreases near the membrane surface in the depleting compartment (the central
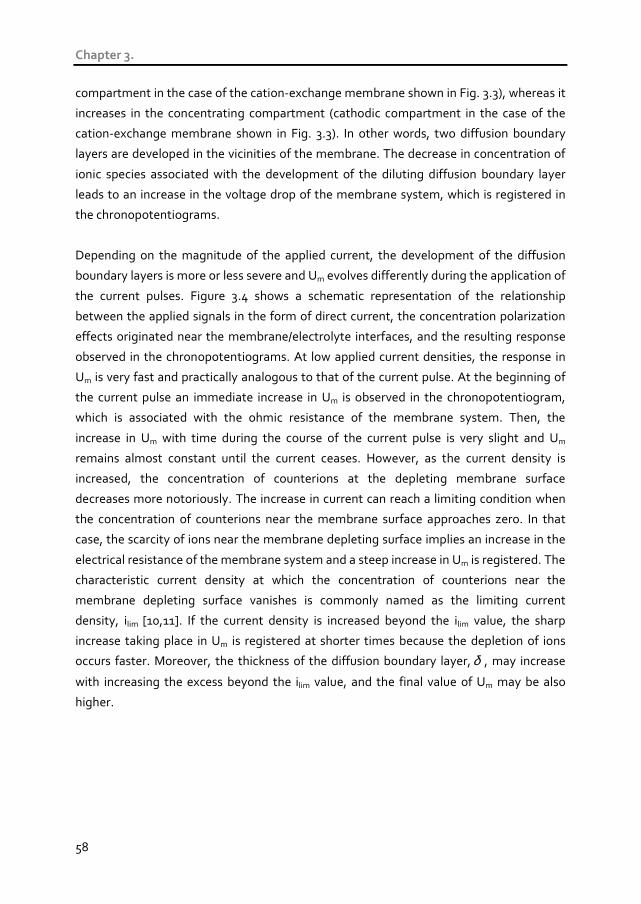
Chapter 3.
58
compartment in the case of the cation-exchange membrane shown in Fig. 3.3), whereas it
increases in the concentrating compartment (cathodic compartment in the case of the
cation-exchange membrane shown in Fig. 3.3). In other words, two diffusion boundary
layers are developed in the vicinities of the membrane. The decrease in concentration of
ionic species associated with the development of the diluting diffusion boundary layer
leads to an increase in the voltage drop of the membrane system, which is registered in
the chronopotentiograms.
Depending on the magnitude of the applied current, the development of the diffusion
boundary layers is more or less severe and Um evolves differently during the application of
the current pulses. Figure 3.4 shows a schematic representation of the relationship
between the applied signals in the form of direct current, the concentration polarization
effects originated near the membrane/electrolyte interfaces, and the resulting response
observed in the chronopotentiograms. At low applied current densities, the response in
Um is very fast and practically analogous to that of the current pulse. At the beginning of
the current pulse an immediate increase in Um is observed in the chronopotentiogram,
which is associated with the ohmic resistance of the membrane system. Then, the
increase in Um with time during the course of the current pulse is very slight and Um
remains almost constant until the current ceases. However, as the current density is
increased, the concentration of counterions at the depleting membrane surface
decreases more notoriously. The increase in current can reach a limiting condition when
the concentration of counterions near the membrane surface approaches zero. In that
case, the scarcity of ions near the membrane depleting surface implies an increase in the
electrical resistance of the membrane system and a steep increase in Um is registered. The
characteristic current density at which the concentration of counterions near the
membrane depleting surface vanishes is commonly named as the limiting current
density, ilim [10,11]. If the current density is increased beyond the ilim value, the sharp
increase taking place in Um is registered at shorter times because the depletion of ions
occurs faster. Moreover, the thickness of the diffusion boundary layer, δ , may increase
with increasing the excess beyond the ilim value, and the final value of Um may be also
higher.
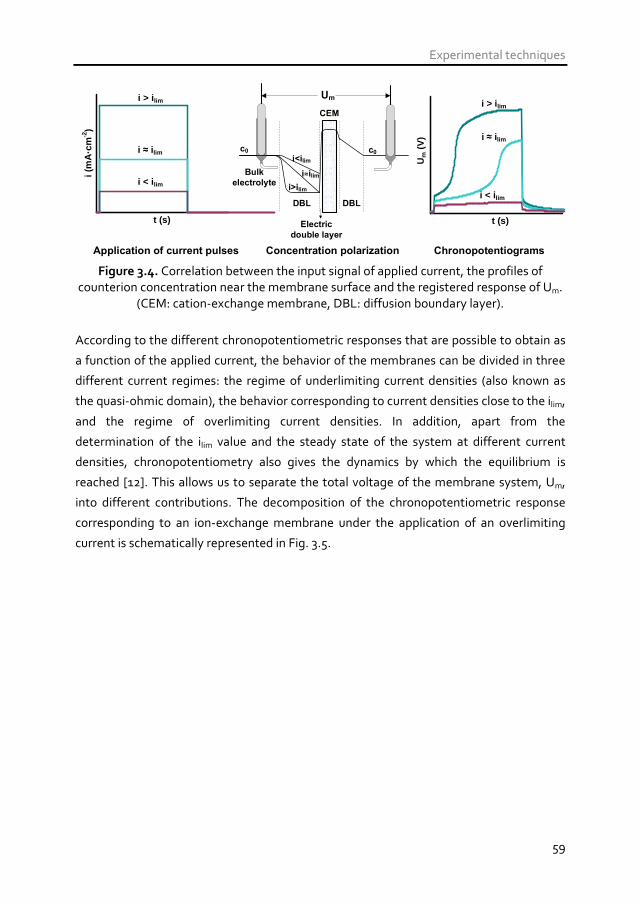
Experimental techniques
59
Application of current pulses Concentration polarization Chronopotentiograms
CEM
Um
i<ilim
i>ilim
i≈ilim
Electric
double layer
DBL
Bulk
electrolyte
c0 c0
t (s)
Um
(V
) i ≈ i lim
i < i lim
i > i lim
t (s)
i (m
A·c
m-2
)
i ≈ i lim
i < i lim
i > i lim
DBL
Figure 3.4. Correlation between the input signal of applied current, the profiles of
counterion concentration near the membrane surface and the registered response of Um. (CEM: cation-exchange membrane, DBL: diffusion boundary layer).
According to the different chronopotentiometric responses that are possible to obtain as
a function of the applied current, the behavior of the membranes can be divided in three
different current regimes: the regime of underlimiting current densities (also known as
the quasi-ohmic domain), the behavior corresponding to current densities close to the ilim,
and the regime of overlimiting current densities. In addition, apart from the
determination of the ilim value and the steady state of the system at different current
densities, chronopotentiometry also gives the dynamics by which the equilibrium is
reached [12]. This allows us to separate the total voltage of the membrane system, Um,
into different contributions. The decomposition of the chronopotentiometric response
corresponding to an ion-exchange membrane under the application of an overlimiting
current is schematically represented in Fig. 3.5.
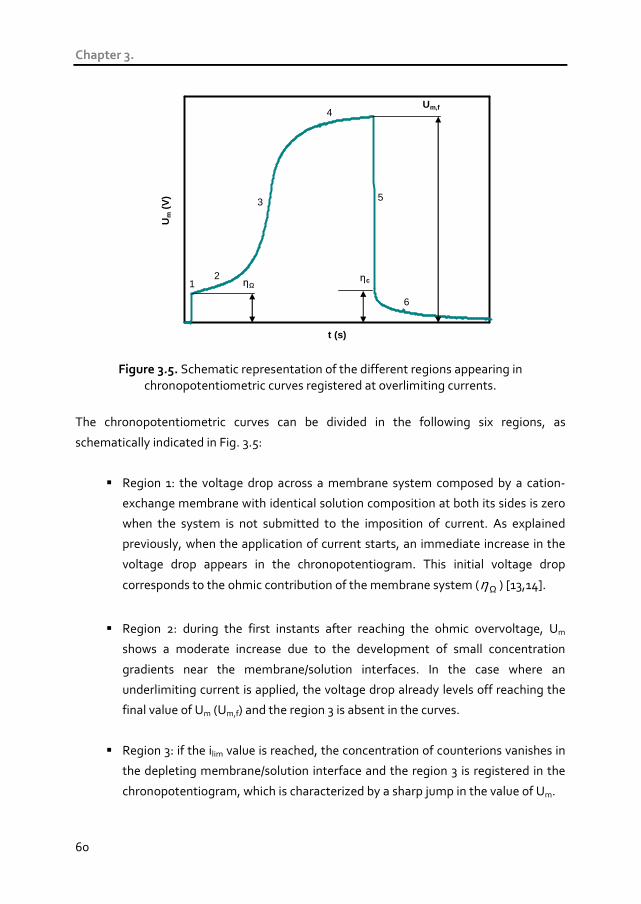
Chapter 3.
60
t (s)
Um
(V
)
ηΩ
Um,f
ηc12
3
4
5
6
Figure 3.5. Schematic representation of the different regions appearing in
chronopotentiometric curves registered at overlimiting currents.
The chronopotentiometric curves can be divided in the following six regions, as
schematically indicated in Fig. 3.5:
Region 1: the voltage drop across a membrane system composed by a cation-
exchange membrane with identical solution composition at both its sides is zero
when the system is not submitted to the imposition of current. As explained
previously, when the application of current starts, an immediate increase in the
voltage drop appears in the chronopotentiogram. This initial voltage drop
corresponds to the ohmic contribution of the membrane system ( Ωη ) [13,14].
Region 2: during the first instants after reaching the ohmic overvoltage, Um
shows a moderate increase due to the development of small concentration
gradients near the membrane/solution interfaces. In the case where an
underlimiting current is applied, the voltage drop already levels off reaching the
final value of Um (Um,f) and the region 3 is absent in the curves.
Region 3: if the ilim value is reached, the concentration of counterions vanishes in
the depleting membrane/solution interface and the region 3 is registered in the
chronopotentiogram, which is characterized by a sharp jump in the value of Um.

Experimental techniques
61
Region 4: after the acute increase in Um, the voltage drop levels off and reaches
the final steady state, thus remaining practically constant until the current ceases
(Um,f).
Region 5: when the application of current ceases, Um decreases abruptly reaching
a certain voltage value different from zero. The voltage difference across the
membrane system remaining immediately after the current is switched off
represents the concentration overvoltage ( cη ), which results from the different
concentration profiles created at both sides of the membranes during the
imposition of current [14,15].
Region 6: the relaxation of the concentration profiles near the membrane system
occurs in the last region of the curves, during which the voltage value of zero is
restored in the system.
It must be noted that under the imposition of current densities far beyond the ilim value,
important information about the overlimiting mass transfer mechanisms can be obtained
from the chronopotentiometric curves. However, these responses are very specific of
each membrane/electrolyte systems and will be discussed in more detail in Chapter 4.3.
3.5.3 Calculation of the transport number In addition to the information obtainable from the shape and voltage contributions of the
chronopotentiograms, chronopotentiometry can also be used to determine the
counterion transport number in the membrane phase. For this purpose, a characteristic
parameter of the chronopotentiograms called the transition time has to be determined.
The transition time (τ ) indicates the moment at which the depletion of counterions at
the depleting surface of the ion-exchange membrane takes place. This value can be
obtained from the sharp increase observed in Um when the ilim values are surpassed. In the
present Thesis the transition times were obtained by means of calculating the time
corresponding to the maximum in the derivative of Um with time, which corresponds to
the instant when the steepest variation in Um occurs. Fig. 3.6 shows an example of the
determination of the transition time from a chronopotentiometric curve.

Chapter 3.
62
t (s)
Um
(V
)
∆Um
/ ∆t
τ
Figure 3.6. Determination of the transition time from the chronopotentiograms by
means of the calculation of the maximum of the derivative of Um with time.
The equations used to calculate the counterion transport number in the membrane phase
are deduced as follows. First, let us consider a system composed of a flat cation-exchange
membrane in vertical position and surrounded by a binary electrolyte in the absence of
supporting electrolyte and without stirring, which is submitted to the application of a
direct current. The variation of the concentration of counterions with time as a function of
the distance from the surface of the membrane ( x ) can be described by Eq. (3.4):
x
J
t
c s
∂∂−=
∂∂ ++ (3.4)
Where sJ+ represents the flux of cations in the solution layer next to the membrane. The
convective transport of electroactive species from the bulk solution toward the
membrane surface can be neglected and we can assume that the transport of counterions
(in this case cations) occurs perpendicularly to the membrane surface and is principally
due to diffusion and migration. Under these assumptions, sJ+ is described by Eq. (1.11),
given in Chapter 1. In addition, the transport of counterions through the membrane phase
( mJ+ ) occurs principally by means of migration, and is described by Eq. (1.10).
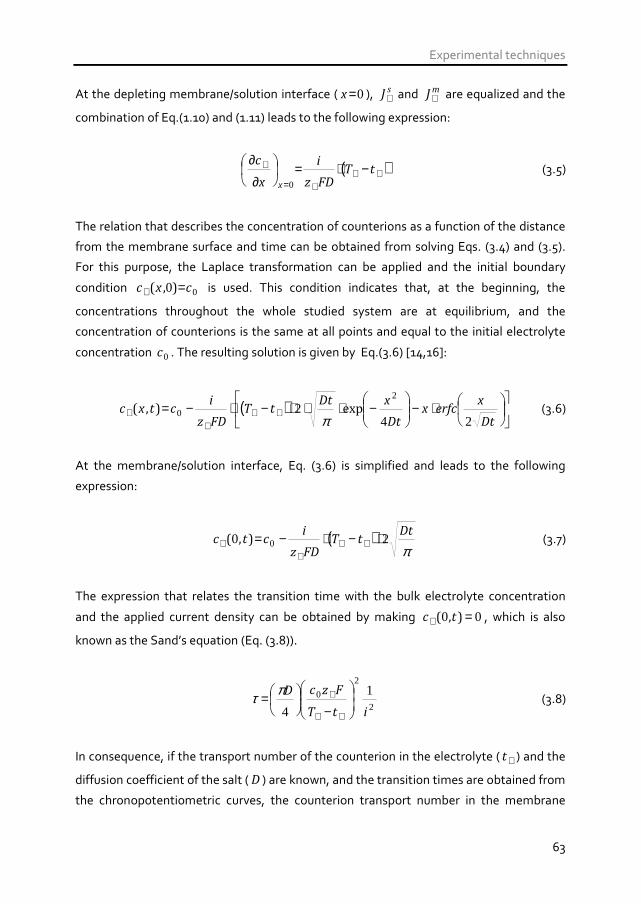
Experimental techniques
63
At the depleting membrane/solution interface ( 0=x ), sJ+ and mJ+ are equalized and the
combination of Eq.(1.10) and (1.11) leads to the following expression:
( )+++=
+ −⋅=
∂
∂tT
FDz
i
x
c
x 0
(3.5)
The relation that describes the concentration of counterions as a function of the distance
from the membrane surface and time can be obtained from solving Eqs. (3.4) and (3.5).
For this purpose, the Laplace transformation can be applied and the initial boundary
condition 00 cxc =+ ),( is used. This condition indicates that, at the beginning, the
concentrations throughout the whole studied system are at equilibrium, and the
concentration of counterions is the same at all points and equal to the initial electrolyte
concentration 0c . The resulting solution is given by Eq.(3.6) [14,16]:
( )
⋅−
−⋅⋅⋅−⋅−= ++
++
Dt
xerfcx
Dt
xDttT
FDz
ictxc
242
2
0 exp),(π
(3.6)
At the membrane/solution interface, Eq. (3.6) is simplified and leads to the following
expression:
( )πDt
tTFDz
ictc 20 0 ⋅−⋅−= ++
++ ),( (3.7)
The expression that relates the transition time with the bulk electrolyte concentration
and the applied current density can be obtained by making 00 =+ ),( tc , which is also
known as the Sand’s equation (Eq. (3.8)).
2
2
0 1
4 itT
FzcD
−
=++
+πτ (3.8)
In consequence, if the transport number of the counterion in the electrolyte ( +t ) and the
diffusion coefficient of the salt (D ) are known, and the transition times are obtained from
the chronopotentiometric curves, the counterion transport number in the membrane
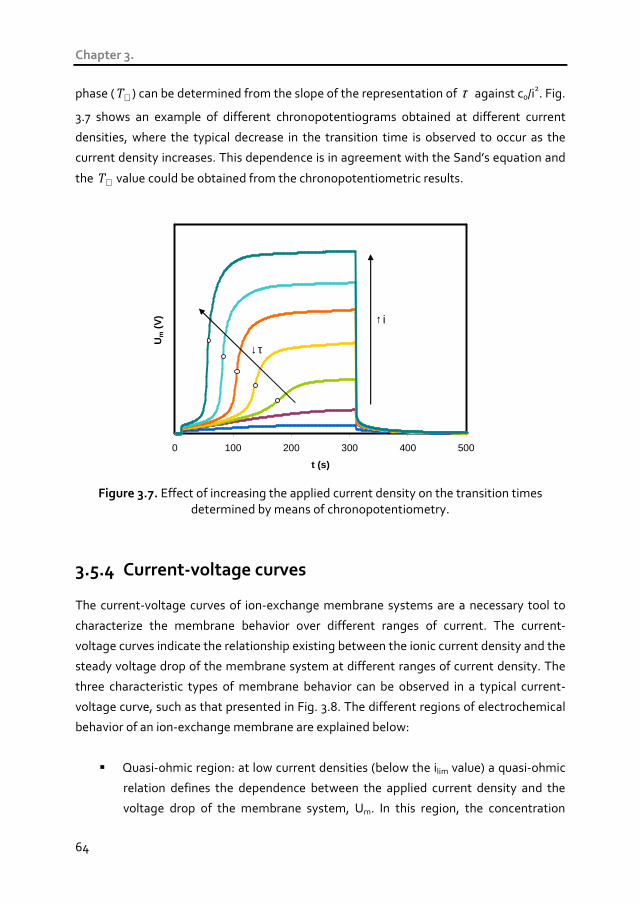
Chapter 3.
64
phase ( +T ) can be determined from the slope of the representation of τ against c0/i2. Fig.
3.7 shows an example of different chronopotentiograms obtained at different current
densities, where the typical decrease in the transition time is observed to occur as the
current density increases. This dependence is in agreement with the Sand’s equation and
the +T value could be obtained from the chronopotentiometric results.
0 100 200 300 400 500
t (s)
Um
(V
)
↓τ
↑i
Figure 3.7. Effect of increasing the applied current density on the transition times
determined by means of chronopotentiometry.
3.5.4 Current-voltage curves The current-voltage curves of ion-exchange membrane systems are a necessary tool to
characterize the membrane behavior over different ranges of current. The current-
voltage curves indicate the relationship existing between the ionic current density and the
steady voltage drop of the membrane system at different ranges of current density. The
three characteristic types of membrane behavior can be observed in a typical current-
voltage curve, such as that presented in Fig. 3.8. The different regions of electrochemical
behavior of an ion-exchange membrane are explained below:
Quasi-ohmic region: at low current densities (below the ilim value) a quasi-ohmic
relation defines the dependence between the applied current density and the
voltage drop of the membrane system, Um. In this region, the concentration

Experimental techniques
65
gradients generated at the depleting side of the membrane are not limiting for
the ion transfer through the membrane, and the electrical resistance of the
membrane system (R1) can be calculated from the inverse of the slope of this
region, as shown in Fig. 3.8.
Plateau region: this region appears in the curves as the current density reaches
the ilim of the membrane system. When this occurs, the concentration gradients
become more severe and the concentration of counterions at the depleting
membrane/solution interface approaches zero. Consequently, the supply of
counterions from the bulk solution toward the membrane surface is practically
suppressed. In this region, the curve bends leading to a characteristic plateau.
The electrical resistance of the membrane system increases considerably and,
very small increments in the current density lead to drastic increases in the
voltage drop of the membrane system. The ilim value can be determined from the
intersection between the tangents drawn for the quasi-ohmic and the plateau
region, as shown schematically in Fig. 3.8.
Overlimiting region: this region appears at an advanced stage of concentration
polarization. When the voltage drop of the membrane/electrolyte system
reaches a certain threshold, the system becomes unstable because of the strong
electric field and the low ionic concentration at the depleting
membrane/electrolyte interface. Under these circumstances, the ionic transfer
through the membrane can be again enhanced due to the involvement of new
mechanisms of ionic transfer. Among them, the most important are the
formation of water dissociation products, the exaltation effect caused by OH-
and H+ ions, gravitational convection and electroconvection [10]. These
phenomena result in an additional supply of counterions to the membrane
surface. As a consequence, the current rises again with the increase in the
membrane voltage. The resistance of the membrane system in this region can be
also approximated from the inverse of the slope of this region, which is usually
known as the resistance of the third region (R3).
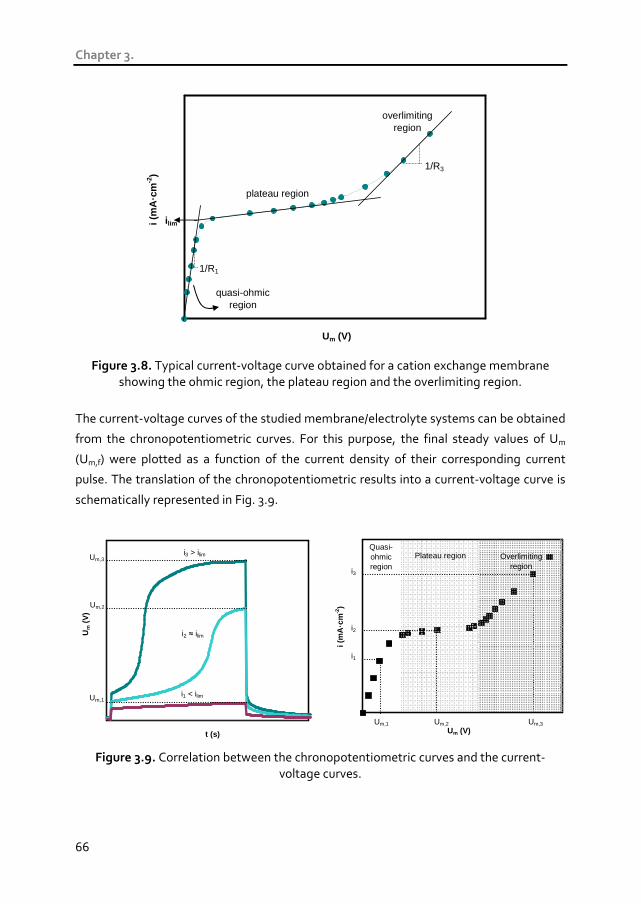
Chapter 3.
66
Um (V)
i (m
A·c
m-2
)
quasi-ohmic region
plateau region
overlimiting region
i lim
1/R1
1/R3
Figure 3.8. Typical current-voltage curve obtained for a cation exchange membrane
showing the ohmic region, the plateau region and the overlimiting region.
The current-voltage curves of the studied membrane/electrolyte systems can be obtained
from the chronopotentiometric curves. For this purpose, the final steady values of Um
(Um,f) were plotted as a function of the current density of their corresponding current
pulse. The translation of the chronopotentiometric results into a current-voltage curve is
schematically represented in Fig. 3.9.
t (s)
Um
(V
)
i2 ≈ ilim
i1 < ilim
i3 > ilim
Um,1
Um,2
Um,3
Um (V)
i (m
A·c
m-2
)
Plateau region
i3
i2
Overlimiting region
i1
Um,1
Quasi-ohmicregion
Um,2 Um,3
Figure 3.9. Correlation between the chronopotentiometric curves and the current-voltage curves.
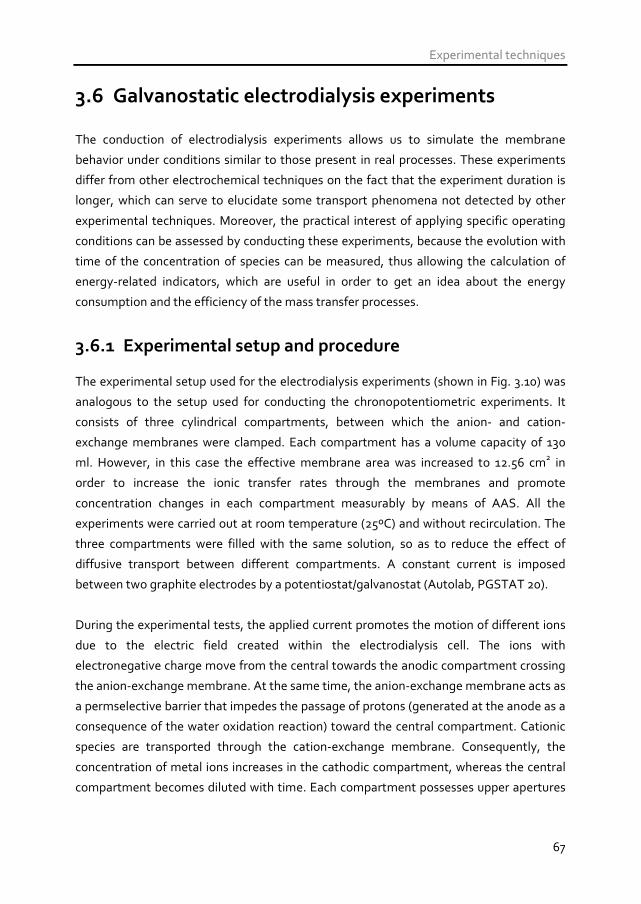
Experimental techniques
67
3.6 Galvanostatic electrodialysis experiments The conduction of electrodialysis experiments allows us to simulate the membrane
behavior under conditions similar to those present in real processes. These experiments
differ from other electrochemical techniques on the fact that the experiment duration is
longer, which can serve to elucidate some transport phenomena not detected by other
experimental techniques. Moreover, the practical interest of applying specific operating
conditions can be assessed by conducting these experiments, because the evolution with
time of the concentration of species can be measured, thus allowing the calculation of
energy-related indicators, which are useful in order to get an idea about the energy
consumption and the efficiency of the mass transfer processes.
3.6.1 Experimental setup and procedure The experimental setup used for the electrodialysis experiments (shown in Fig. 3.10) was
analogous to the setup used for conducting the chronopotentiometric experiments. It
consists of three cylindrical compartments, between which the anion- and cation-
exchange membranes were clamped. Each compartment has a volume capacity of 130
ml. However, in this case the effective membrane area was increased to 12.56 cm2 in
order to increase the ionic transfer rates through the membranes and promote
concentration changes in each compartment measurably by means of AAS. All the
experiments were carried out at room temperature (25ºC) and without recirculation. The
three compartments were filled with the same solution, so as to reduce the effect of
diffusive transport between different compartments. A constant current is imposed
between two graphite electrodes by a potentiostat/galvanostat (Autolab, PGSTAT 20).
During the experimental tests, the applied current promotes the motion of different ions
due to the electric field created within the electrodialysis cell. The ions with
electronegative charge move from the central towards the anodic compartment crossing
the anion-exchange membrane. At the same time, the anion-exchange membrane acts as
a permselective barrier that impedes the passage of protons (generated at the anode as a
consequence of the water oxidation reaction) toward the central compartment. Cationic
species are transported through the cation-exchange membrane. Consequently, the
concentration of metal ions increases in the cathodic compartment, whereas the central
compartment becomes diluted with time. Each compartment possesses upper apertures
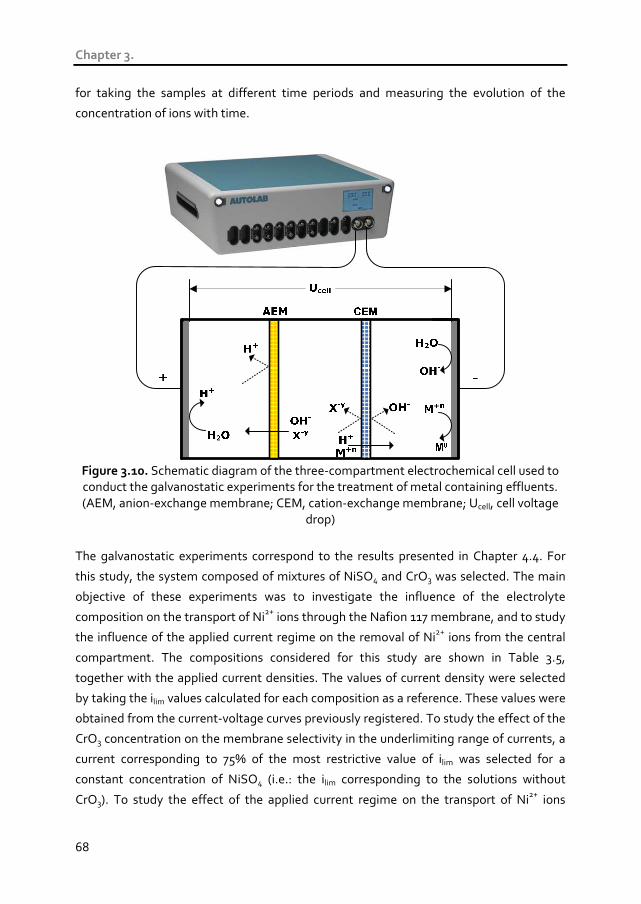
Chapter 3.
68
for taking the samples at different time periods and measuring the evolution of the
concentration of ions with time.
Figure 3.10. Schematic diagram of the three-compartment electrochemical cell used to conduct the galvanostatic experiments for the treatment of metal containing effluents. (AEM, anion-exchange membrane; CEM, cation-exchange membrane; Ucell, cell voltage
drop)
The galvanostatic experiments correspond to the results presented in Chapter 4.4. For
this study, the system composed of mixtures of NiSO4 and CrO3 was selected. The main
objective of these experiments was to investigate the influence of the electrolyte
composition on the transport of Ni2+ ions through the Nafion 117 membrane, and to study
the influence of the applied current regime on the removal of Ni2+ ions from the central
compartment. The compositions considered for this study are shown in Table 3.5,
together with the applied current densities. The values of current density were selected
by taking the ilim values calculated for each composition as a reference. These values were
obtained from the current-voltage curves previously registered. To study the effect of the
CrO3 concentration on the membrane selectivity in the underlimiting range of currents, a
current corresponding to 75% of the most restrictive value of ilim was selected for a
constant concentration of NiSO4 (i.e.: the ilim corresponding to the solutions without
CrO3). To study the effect of the applied current regime on the transport of Ni2+ ions
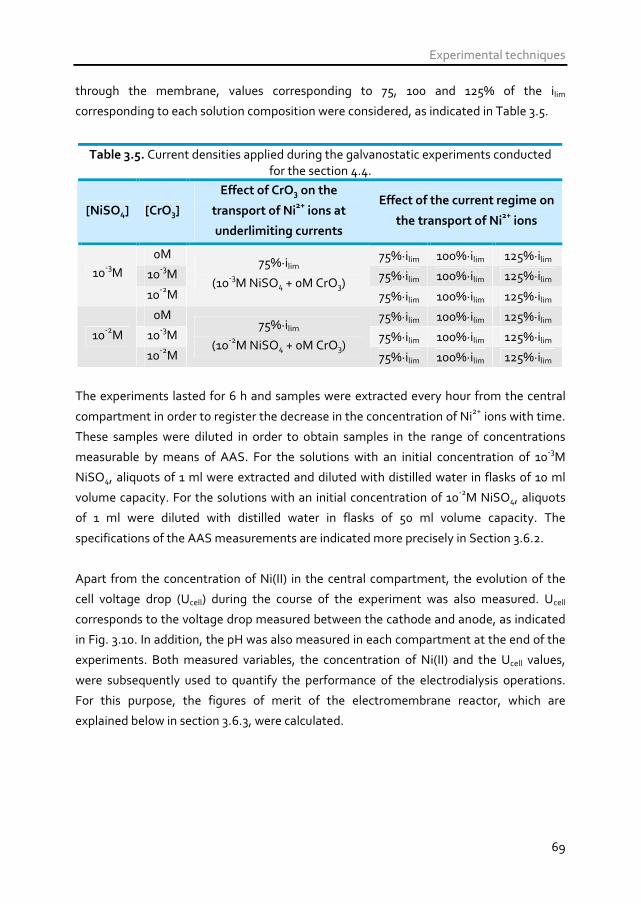
Experimental techniques
69
through the membrane, values corresponding to 75, 100 and 125% of the ilim
corresponding to each solution composition were considered, as indicated in Table 3.5.
Table 3.5. Current densities applied during the galvanostatic experiments conducted for the section 4.4.
[NiSO4] [CrO3]
Effect of CrO3 on the
transport of Ni2+
ions at
underlimiting currents
Effect of the current regime on
the transport of Ni2+
ions
0M 75%·ilim 100%·ilim 125%·ilim 10-3M 75%·ilim 100%·ilim 125%·ilim 10-3M
10-2M
75%·ilim
(10-3M NiSO4 + 0M CrO3) 75%·ilim 100%·ilim 125%·ilim
0M 75%·ilim 100%·ilim 125%·ilim 10-3M 75%·ilim 100%·ilim 125%·ilim 10-2M
10-2M
75%·ilim
(10-2M NiSO4 + 0M CrO3) 75%·ilim 100%·ilim 125%·ilim
The experiments lasted for 6 h and samples were extracted every hour from the central
compartment in order to register the decrease in the concentration of Ni2+ ions with time.
These samples were diluted in order to obtain samples in the range of concentrations
measurable by means of AAS. For the solutions with an initial concentration of 10-3M
NiSO4, aliquots of 1 ml were extracted and diluted with distilled water in flasks of 10 ml
volume capacity. For the solutions with an initial concentration of 10-2M NiSO4, aliquots
of 1 ml were diluted with distilled water in flasks of 50 ml volume capacity. The
specifications of the AAS measurements are indicated more precisely in Section 3.6.2.
Apart from the concentration of Ni(II) in the central compartment, the evolution of the
cell voltage drop (Ucell) during the course of the experiment was also measured. Ucell
corresponds to the voltage drop measured between the cathode and anode, as indicated
in Fig. 3.10. In addition, the pH was also measured in each compartment at the end of the
experiments. Both measured variables, the concentration of Ni(II) and the Ucell values,
were subsequently used to quantify the performance of the electrodialysis operations.
For this purpose, the figures of merit of the electromembrane reactor, which are
explained below in section 3.6.3, were calculated.
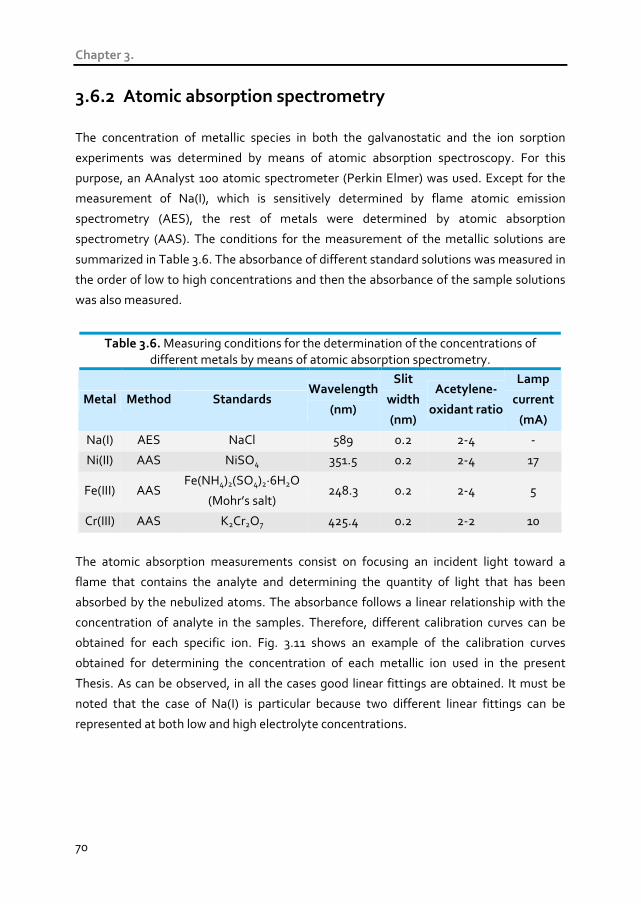
Chapter 3.
70
3.6.2 Atomic absorption spectrometry
The concentration of metallic species in both the galvanostatic and the ion sorption
experiments was determined by means of atomic absorption spectroscopy. For this
purpose, an AAnalyst 100 atomic spectrometer (Perkin Elmer) was used. Except for the
measurement of Na(I), which is sensitively determined by flame atomic emission
spectrometry (AES), the rest of metals were determined by atomic absorption
spectrometry (AAS). The conditions for the measurement of the metallic solutions are
summarized in Table 3.6. The absorbance of different standard solutions was measured in
the order of low to high concentrations and then the absorbance of the sample solutions
was also measured.
Table 3.6. Measuring conditions for the determination of the concentrations of different metals by means of atomic absorption spectrometry.
Metal Method Standards Wavelength
(nm)
Slit
width
(nm)
Acetylene-
oxidant ratio
Lamp
current
(mA)
Na(I) AES NaCl 589 0.2 2-4 -
Ni(II) AAS NiSO4 351.5 0.2 2-4 17
Fe(III) AAS Fe(NH4)2(SO4)2·6H2O
(Mohr’s salt) 248.3 0.2 2-4 5
Cr(III) AAS K2Cr2O7 425.4 0.2 2-2 10
The atomic absorption measurements consist on focusing an incident light toward a
flame that contains the analyte and determining the quantity of light that has been
absorbed by the nebulized atoms. The absorbance follows a linear relationship with the
concentration of analyte in the samples. Therefore, different calibration curves can be
obtained for each specific ion. Fig. 3.11 shows an example of the calibration curves
obtained for determining the concentration of each metallic ion used in the present
Thesis. As can be observed, in all the cases good linear fittings are obtained. It must be
noted that the case of Na(I) is particular because two different linear fittings can be
represented at both low and high electrolyte concentrations.
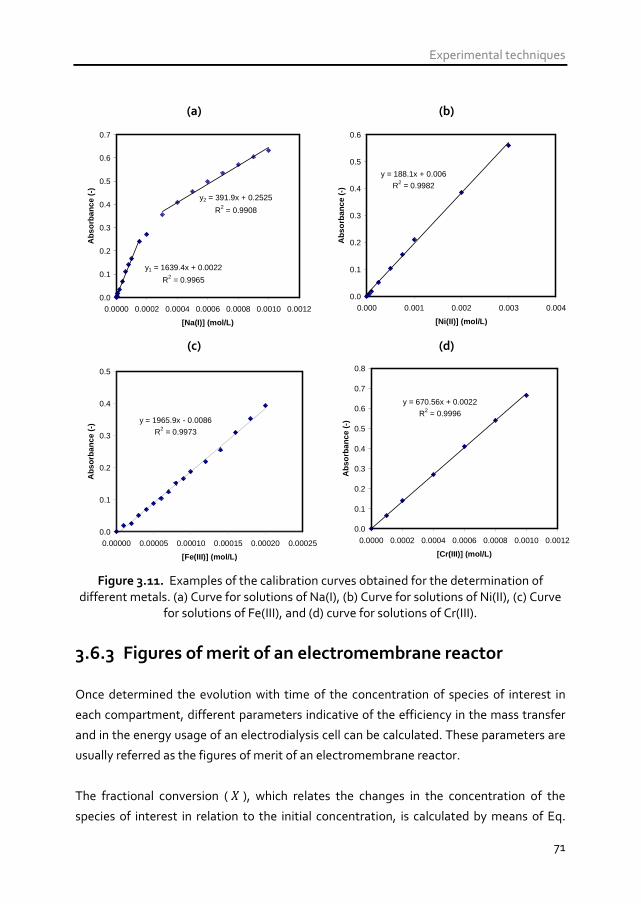
Experimental techniques
71
(a) (b)
y1 = 1639.4x + 0.0022
R2 = 0.9965
y2 = 391.9x + 0.2525
R2 = 0.9908
0.0
0.1
0.2
0.3
0.4
0.5
0.6
0.7
0.0000 0.0002 0.0004 0.0006 0.0008 0.0010 0.0012
[Na(I)] (mol/L)
Abs
orba
nce
(-)
y = 188.1x + 0.006
R2 = 0.9982
0.0
0.1
0.2
0.3
0.4
0.5
0.6
0.000 0.001 0.002 0.003 0.004
[Ni(II)] (mol/L)
Abs
orba
nce
(-)
(c) (d)
y = 1965.9x - 0.0086
R2 = 0.9973
0.0
0.1
0.2
0.3
0.4
0.5
0.00000 0.00005 0.00010 0.00015 0.00020 0.00025
[Fe(III)] (mol/L)
Abs
orba
nce
(-)
y = 670.56x + 0.0022
R2 = 0.9996
0.0
0.1
0.2
0.3
0.4
0.5
0.6
0.7
0.8
0.0000 0.0002 0.0004 0.0006 0.0008 0.0010 0.0012
[Cr(III)] (mol/L)
Abs
orba
nce
(-)
Figure 3.11. Examples of the calibration curves obtained for the determination of different metals. (a) Curve for solutions of Na(I), (b) Curve for solutions of Ni(II), (c) Curve
for solutions of Fe(III), and (d) curve for solutions of Cr(III).
3.6.3 Figures of merit of an electromembrane reactor
Once determined the evolution with time of the concentration of species of interest in
each compartment, different parameters indicative of the efficiency in the mass transfer
and in the energy usage of an electrodialysis cell can be calculated. These parameters are
usually referred as the figures of merit of an electromembrane reactor.
The fractional conversion ( X ), which relates the changes in the concentration of the
species of interest in relation to the initial concentration, is calculated by means of Eq.
Chapter 3.
72
(3.9). The fractional conversion can also be known as the removal rate when it is
calculated from the concentration variations occurring in the depleting compartment.
1000
0 ×−
=c
cctX t)( (%) (3.9)
In Eq. (3.9) 0c is the initial concentration in the solution and tc corresponds to the
concentration of this species at a given time. Furthermore, the current efficiency ( φ ),
which is an indicative of the mass transfer efficiency of the process and relates the current
used to transfer the ions towards the cathodic compartment (in a cation-exchange
membrane) with the total current input, was calculated by using the Eq. (3.10) [17]:
( )
100
0
0 ×∫
−=
t
t
dtI
ccnFVt
))(φ (%) (3.10)
Where n is the number of equivalents exchanged per mole, V is the volume of the
solution in the central compartment and I is the applied current. The space-time yield
(η ) is another parameter related to the achieved productivity that indicates the mass of
ions removed per unit of volume and time and is defined by Eq. (3.11):
( )t
ccMt t−= 0)(η (g·l-1·h-1) (3.11)
where M represents the molecular weight of the species of interest. Finally, the specific
energy consumption ( sE ) was also calculated using the following equation:
XcVM
dtIUtE
tcell
s⋅⋅⋅⋅
⋅∫=0
0
3600)( (kW·h·kg-1) (3.12)
Where Ucell is the cell voltage registered between the anode and cathode of the
electrodialysis cell.
Experimental techniques
73
3.7 References
[1] K.A. Mauritz, R.B. Moore, State of understanding of Nafion, Chemical Reviews, 104
(2004) 4535-4586.
[2] K. Schmidt-Rohr, Q. Chen, Parallel cylindrical water nanochannels in Nafion fuel-
cell membranes, Nature Materials, 7 (2008) 75-83.
[3] N.P. Berezina, N.A. Kononenko, O.A. Dyomina, N.P. Gnusin, Characterization of
ion-exchange membrane materials: Properties vs structure, Advances in Colloid
and Interface Science, 139 (2008) 3-28.
[4] Handbook of Raman Spectroscopy. From the research laboratory to the process
line, CRC Press, 2001.
[5] C. Thibault, P. Huguet, P. Sistat, G. Pourcelly, Confocal Raman micro-spectroscopy
and electrochemical investigation of anion transport through ion-exchange
membranes, Desalination, 149 (2002) 429-433.
[6] S. Deabate, R. Fatnassi, P. Sistat, P. Huguet, In situ confocal-Raman measurement
of water and methanol concentration profiles in Nafion® membrane under cross-
transport conditions, Journal of Power Sources, 176 (2008) 39-45.
[7] X.T. Le, Contribution to the study of properties of Selemion AMV anion exchange
membranes in acidic media, Electrochimica Acta, 108 (2013) 232-240.
[8] K.L. Huang, T.M. Holsen, J.R. Selman, Impurity partitioning in Nafion and ceramic
separators used for purification of spent chromium plating solutions, Journal of
Membrane Science, 210 (2002) 137-145.
[9] A.H. Galama, J.W. Post, M.A. Cohen Stuart, P.M. Biesheuvel, Validity of the
Boltzmann equation to describe Donnan equilibrium at the membrane-solution
interface, Journal of Membrane Science, 442 (2013) 131-139.
[10] V.V. Nikonenko, N.D. Pismenskaya, E.I. Belova, P. Sistat, P. Huguet, G. Pourcelly,
C. Larchet, Intensive current transfer in membrane systems: Modelling,
mechanisms and application in electrodialysis, Advances in Colloid and Interface
Science, 160 (2010) 101-123.
Chapter 3.
74
[11] A.M. Peers, Membrane phenomena, Discussions of the Faraday Society, 24 (1956)
124-125.
[12] R. Ibanez, D.F. Stamatialis, M. Wessling, Role of membrane surface in
concentration polarization at cation exchange membranes, Journal of Membrane
Science, 239 (2004) 119-128.
[13] M. Taky, G. Pourcelly, A. Elmidaoui, Transport properties of a commercial cation-
exchange membrane in contact with divalent cations or proton-divalent cation
solutions during electrodialysis, Hydrometallurgy, 43 (1996) 63-78.
[14] A. Nicoara, L. Oniciu, Polarization at ion exchange membrane/electrolyte solution
interface. V- Square wave chronopotentiometry, Revue Roumaine de Chimie, 44
(1999) 963-970.
[15] M. Taky, G. Pourcelly, F. Lebon, C. Gavach, Polarization phenomena at the
interfaces between an electrolyte solution and an ion exchange membrane: Part I.
Ion transfer with a cation exchange membrane, Journal of Electroanalytical
Chemistry, 336 (1992) 171-194.
[16] R. Audinos, G. Pichelin, Characterization of electrodialysis membranes by
chronopotentiometry, Desalination, 68 (1988) 251-263.
[17] S. Koter, A. Narebska, Current Efficiency and Transport Phenomena in Systems
with Charged Membranes, Separation Science and Technology, 24 (1989) 1337-
1354.
75
Chapter 4
RESULTS AND DISCUSSION
4.1 Transport of metal ions present in single salt
solutions through cation-exchange membranes
4.1.1 Introduction
In this section of the results (4.1), the transport of multivalent metal ions through cation-
exchange membranes is investigated. Multivalent heavy metals are both precious and
hazardous. Therefore, the interest of this study is justified by the benefits that the
treatment of metal containing wastewaters by means of electromembrane processes
could imply for a variety of industries and, in general, for the environment.
First, we characterize the morphology and structure of the Nafion perfluorosulfonic
membrane used in the Thesis. For this purpose, the chemical structure of Nafion is
investigated by Raman microscopy, and the morphology of the membrane is visualized

Chapter 4.
76
using SEM. The sorption of different metal ions in equilibrium conditions by the
membrane fixed charges is also measured.
Then, the transport of sulfate salts of different metals through the membranes is studied
systematically by means of chronopotentiometry. The behavior of the Nafion membrane
is first evaluated using solutions of monovalent metals (Na+ ions). Subsequently, the
transport of salts of divalent, Ni(II), and trivalent metals, Cr(III) and Fe(III), is studied and
compared to that of monovalent sodium ions. For this purpose, the specific
characteristics of multivalent metals (ion size, charge, equilibria of formation of complex
species) are considered in order to identify the different phenomena that could take part
in the process of formation of concentration polarization layers at the membrane/solution
interface.
4.1.2 Structure and ion exchange equilibrium properties
of Nafion membranes
4.1.2.1 Characterization of the membrane structure The information about the morphology and internal structure of ion-exchange
membranes is crucial in order to understand the manner in which the ionic transfer occurs
through the membranes. In this section, the morphology of the membrane is visualized
and characterized. The Raman spectrum of a sample of Nafion 117 immersed in water was
obtained (see Fig. 4.1). In this figure we can see the characteristic peaks of the bonds
present at both the polymer backbone and the charged groups of the Nafion membrane,
which are tabulated in the literature [1]. For example, the twist and in plane bending
vibration of the CF2 bonds are associated to the peaks observed at 292 and 385 cm-1,
whereas the peak observed at 731 cm-1 is assigned to the symmetric stretching vibration
of these groups. The vibrations associated with the membrane fixed charges are
attributed to the bands appearing at higher Raman shifts: the stretching vibration of the
C-S bond and the SO3- groups correspond to the peaks observed at 805 and 1060 cm-1,
respectively. The absence of additional characteristic peaks stems from the
homogeneous structure of this membrane, which does not have polymer binder,
impurities or reinforcements in their chemical composition.
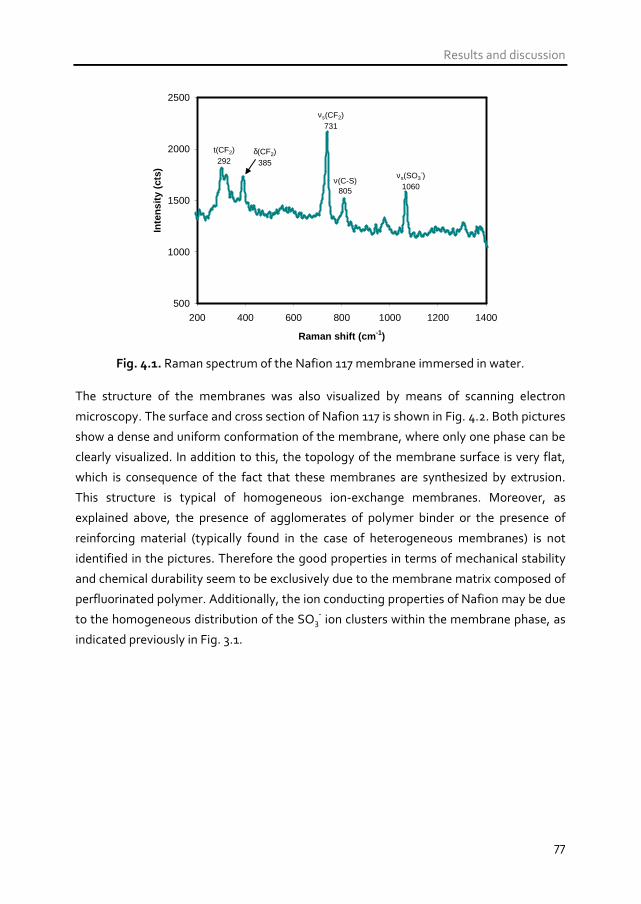
Results and discussion
77
500
1000
1500
2000
2500
200 400 600 800 1000 1200 1400
Raman shift (cm -1)
Inte
nsity
(ct
s)t(CF2)292
δ(CF2)385
νs(CF2)731
ν(C-S)805
νs(SO3-)
1060
Fig. 4.1. Raman spectrum of the Nafion 117 membrane immersed in water.
The structure of the membranes was also visualized by means of scanning electron
microscopy. The surface and cross section of Nafion 117 is shown in Fig. 4.2. Both pictures
show a dense and uniform conformation of the membrane, where only one phase can be
clearly visualized. In addition to this, the topology of the membrane surface is very flat,
which is consequence of the fact that these membranes are synthesized by extrusion.
This structure is typical of homogeneous ion-exchange membranes. Moreover, as
explained above, the presence of agglomerates of polymer binder or the presence of
reinforcing material (typically found in the case of heterogeneous membranes) is not
identified in the pictures. Therefore the good properties in terms of mechanical stability
and chemical durability seem to be exclusively due to the membrane matrix composed of
perfluorinated polymer. Additionally, the ion conducting properties of Nafion may be due
to the homogeneous distribution of the SO3- ion clusters within the membrane phase, as
indicated previously in Fig. 3.1.
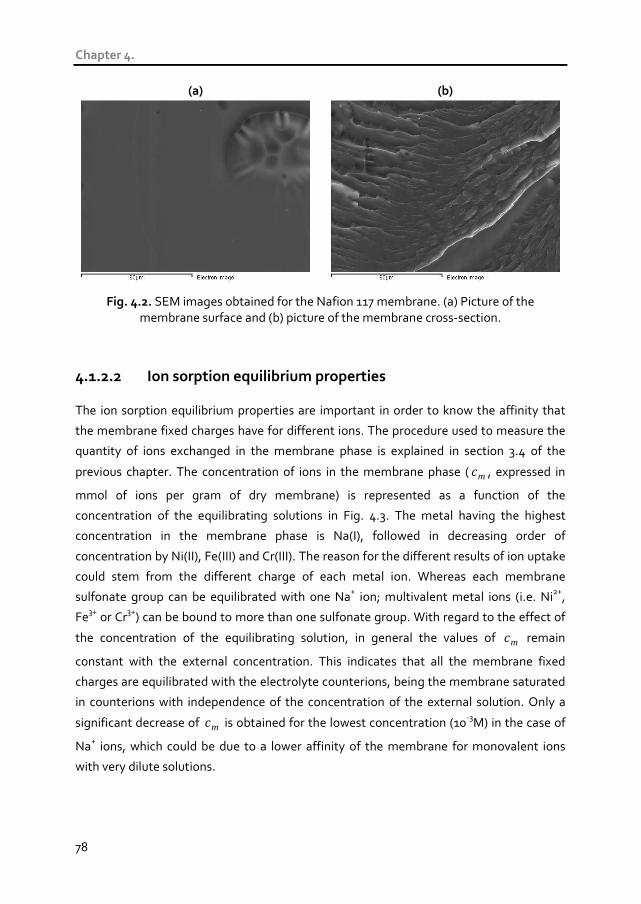
Chapter 4.
78
(a) (b)
Fig. 4.2. SEM images obtained for the Nafion 117 membrane. (a) Picture of the
membrane surface and (b) picture of the membrane cross-section.
4.1.2.2 Ion sorption equilibrium properties The ion sorption equilibrium properties are important in order to know the affinity that
the membrane fixed charges have for different ions. The procedure used to measure the
quantity of ions exchanged in the membrane phase is explained in section 3.4 of the
previous chapter. The concentration of ions in the membrane phase ( mc , expressed in
mmol of ions per gram of dry membrane) is represented as a function of the
concentration of the equilibrating solutions in Fig. 4.3. The metal having the highest
concentration in the membrane phase is Na(I), followed in decreasing order of
concentration by Ni(II), Fe(III) and Cr(III). The reason for the different results of ion uptake
could stem from the different charge of each metal ion. Whereas each membrane
sulfonate group can be equilibrated with one Na+ ion; multivalent metal ions (i.e. Ni2+,
Fe3+ or Cr3+) can be bound to more than one sulfonate group. With regard to the effect of
the concentration of the equilibrating solution, in general the values of mc remain
constant with the external concentration. This indicates that all the membrane fixed
charges are equilibrated with the electrolyte counterions, being the membrane saturated
in counterions with independence of the concentration of the external solution. Only a
significant decrease of mc is obtained for the lowest concentration (10-3M) in the case of
Na+ ions, which could be due to a lower affinity of the membrane for monovalent ions
with very dilute solutions.
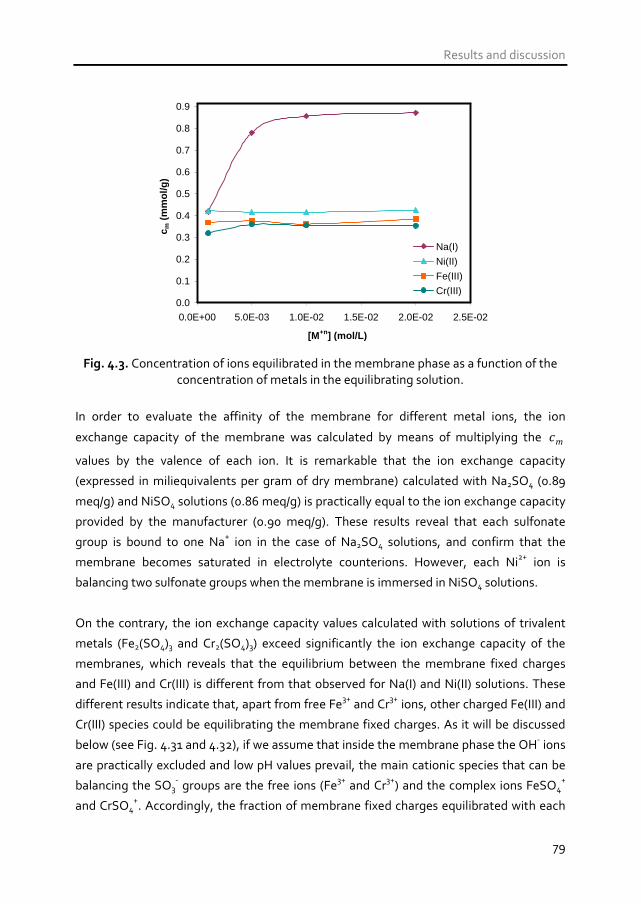
Results and discussion
79
0.0
0.1
0.2
0.3
0.4
0.5
0.6
0.7
0.8
0.9
0.0E+00 5.0E-03 1.0E-02 1.5E-02 2.0E-02 2.5E-02
[M+n] (mol/L)
c m (
mm
ol/g
)
Na(I)
Ni(II)
Fe(III)
Cr(III)
Fig. 4.3. Concentration of ions equilibrated in the membrane phase as a function of the
concentration of metals in the equilibrating solution.
In order to evaluate the affinity of the membrane for different metal ions, the ion
exchange capacity of the membrane was calculated by means of multiplying the mc
values by the valence of each ion. It is remarkable that the ion exchange capacity
(expressed in miliequivalents per gram of dry membrane) calculated with Na2SO4 (0.89
meq/g) and NiSO4 solutions (0.86 meq/g) is practically equal to the ion exchange capacity
provided by the manufacturer (0.90 meq/g). These results reveal that each sulfonate
group is bound to one Na+ ion in the case of Na2SO4 solutions, and confirm that the
membrane becomes saturated in electrolyte counterions. However, each Ni2+ ion is
balancing two sulfonate groups when the membrane is immersed in NiSO4 solutions.
On the contrary, the ion exchange capacity values calculated with solutions of trivalent
metals (Fe2(SO4)3 and Cr2(SO4)3) exceed significantly the ion exchange capacity of the
membranes, which reveals that the equilibrium between the membrane fixed charges
and Fe(III) and Cr(III) is different from that observed for Na(I) and Ni(II) solutions. These
different results indicate that, apart from free Fe3+ and Cr3+ ions, other charged Fe(III) and
Cr(III) species could be equilibrating the membrane fixed charges. As it will be discussed
below (see Fig. 4.31 and 4.32), if we assume that inside the membrane phase the OH- ions
are practically excluded and low pH values prevail, the main cationic species that can be
balancing the SO3- groups are the free ions (Fe3+ and Cr3+) and the complex ions FeSO4
+
and CrSO4+. Accordingly, the fraction of membrane fixed charges equilibrated with each
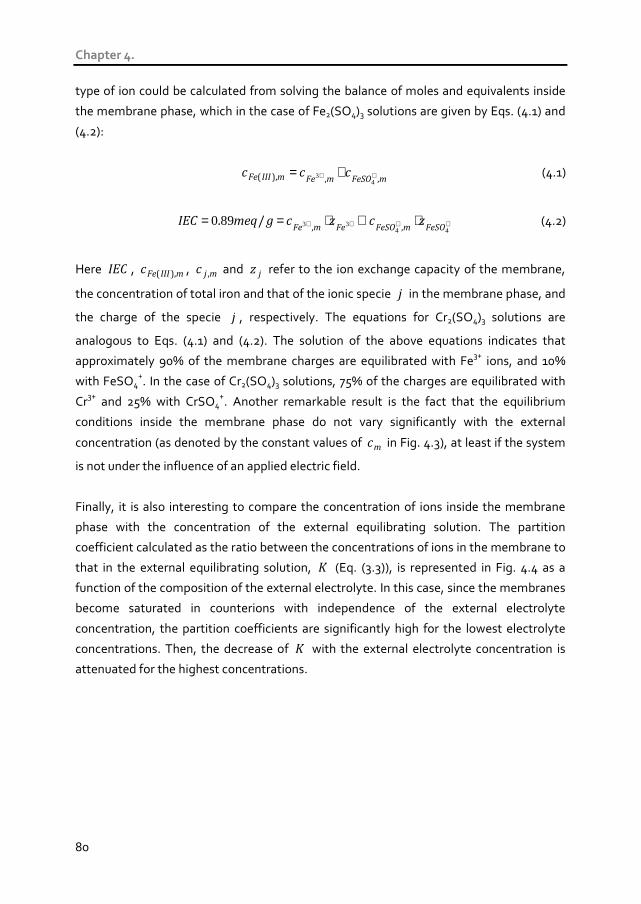
Chapter 4.
80
type of ion could be calculated from solving the balance of moles and equivalents inside
the membrane phase, which in the case of Fe2(SO4)3 solutions are given by Eqs. (4.1) and
(4.2):
mFeSOmFemIIIFe ccc,,),( ++ +=
43 (4.1)
++++ ⋅+⋅==44
33890FeSOmFeSOFemFezczcgmeqIEC
,,/. (4.2)
Here IEC , mIIIFec ),( , mjc , and jz refer to the ion exchange capacity of the membrane,
the concentration of total iron and that of the ionic specie j in the membrane phase, and
the charge of the specie j , respectively. The equations for Cr2(SO4)3 solutions are
analogous to Eqs. (4.1) and (4.2). The solution of the above equations indicates that
approximately 90% of the membrane charges are equilibrated with Fe3+ ions, and 10%
with FeSO4+. In the case of Cr2(SO4)3 solutions, 75% of the charges are equilibrated with
Cr3+ and 25% with CrSO4+. Another remarkable result is the fact that the equilibrium
conditions inside the membrane phase do not vary significantly with the external
concentration (as denoted by the constant values of mc in Fig. 4.3), at least if the system
is not under the influence of an applied electric field.
Finally, it is also interesting to compare the concentration of ions inside the membrane
phase with the concentration of the external equilibrating solution. The partition
coefficient calculated as the ratio between the concentrations of ions in the membrane to
that in the external equilibrating solution, K (Eq. (3.3)), is represented in Fig. 4.4 as a
function of the composition of the external electrolyte. In this case, since the membranes
become saturated in counterions with independence of the external electrolyte
concentration, the partition coefficients are significantly high for the lowest electrolyte
concentrations. Then, the decrease of K with the external electrolyte concentration is
attenuated for the highest concentrations.
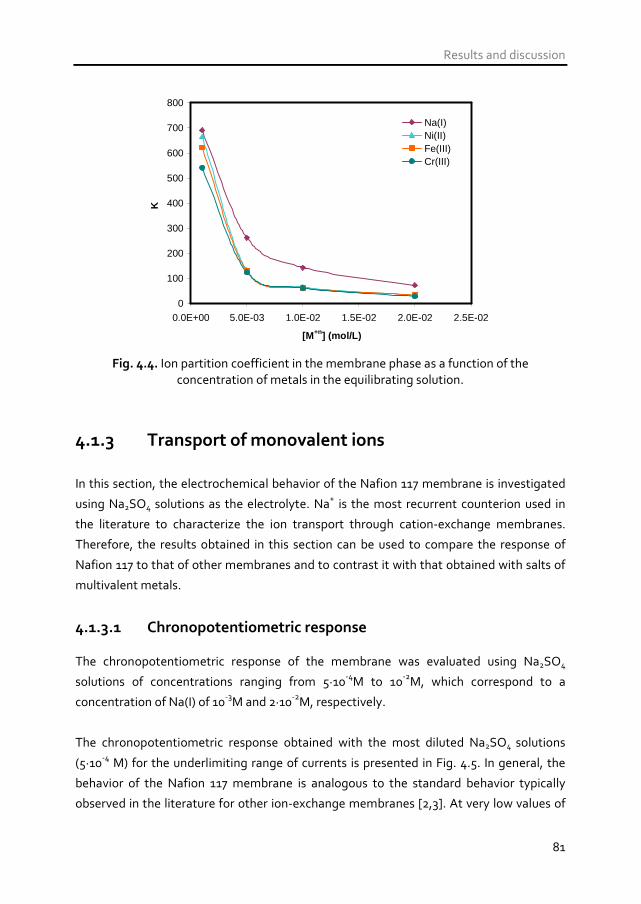
Results and discussion
81
0
100
200
300
400
500
600
700
800
0.0E+00 5.0E-03 1.0E-02 1.5E-02 2.0E-02 2.5E-02
[M+n] (mol/L)
K
Na(I)Ni(II)Fe(III)Cr(III)
Fig. 4.4. Ion partition coefficient in the membrane phase as a function of the
concentration of metals in the equilibrating solution.
4.1.3 Transport of monovalent ions
In this section, the electrochemical behavior of the Nafion 117 membrane is investigated
using Na2SO4 solutions as the electrolyte. Na+ is the most recurrent counterion used in
the literature to characterize the ion transport through cation-exchange membranes.
Therefore, the results obtained in this section can be used to compare the response of
Nafion 117 to that of other membranes and to contrast it with that obtained with salts of
multivalent metals.
4.1.3.1 Chronopotentiometric response The chronopotentiometric response of the membrane was evaluated using Na2SO4
solutions of concentrations ranging from 5·10-4M to 10-2M, which correspond to a
concentration of Na(I) of 10-3M and 2·10-2M, respectively.
The chronopotentiometric response obtained with the most diluted Na2SO4 solutions
(5·10-4 M) for the underlimiting range of currents is presented in Fig. 4.5. In general, the
behavior of the Nafion 117 membrane is analogous to the standard behavior typically
observed in the literature for other ion-exchange membranes [2,3]. At very low values of
Chapter 4.
82
current density (i.e. 0.014 and 0.028 mA·cm-2), an almost plane response is observed in
the chronopotentiograms and the increase of Um with time is very slight. However, as
pulses of higher current density are applied, Um increases with time more notoriously.
Since the membrane fixed charges induce selectivity for cations, the transport of Na+ ions
occurs faster in the membrane phase than in the bulk solution, where the current is
carried by both cations and anions. As a consequence, the concentration of Na+ ions
decreases in the solution layer next to the membrane surface in the central compartment.
This phenomenon results in an increase of the electrical resistance of the membrane
system. If the current density is further increased, the concentration of Na+ ions at the
membrane surface can approach zero. In that case, the increase registered in Um becomes
very sharp, as can be seen in the curve obtained for 0.054 mA·cm-2.
The response of Um once the current ceases was also registered during the experiments.
When the current is switched off, the concentration of ionic species at the
membrane/electrolyte interfaces is restored and the difference of potential measured
across the membrane system diminishes asymptotically toward the initial value of zero.
The time required for the Um value to reach zero also increases with the applied current
density. This fact is indicative of the effect of the current density on the concentration
polarization phenomenon. As the current density increases, the concentration gradients
developed near the membrane/electrolyte interfaces become stronger. Consequently,
the first value of Um registered immediately after the current has stopped increases with
the current density and the back diffusion of species occurring thereafter takes place
more slowly.
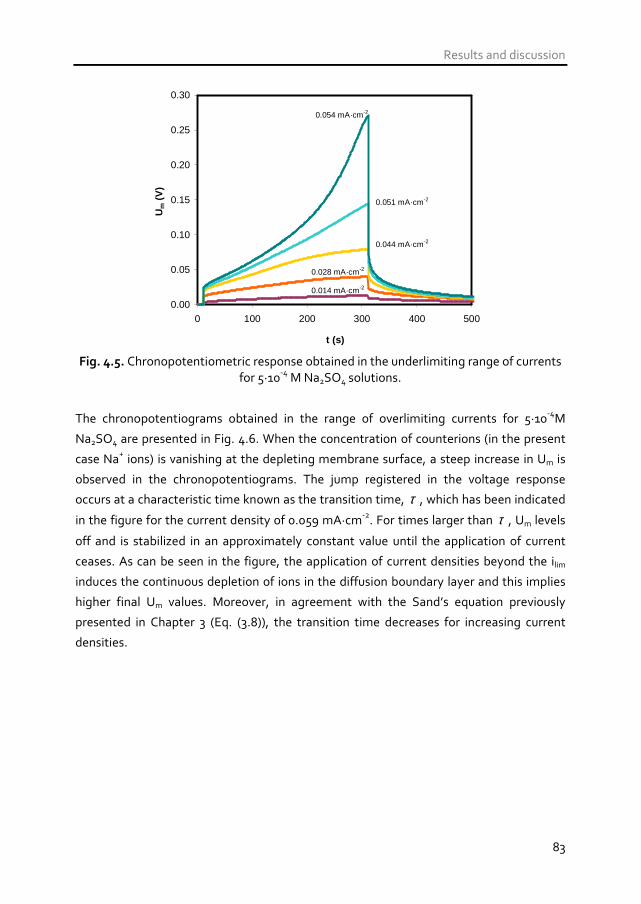
Results and discussion
83
0.00
0.05
0.10
0.15
0.20
0.25
0.30
0 100 200 300 400 500
t (s)
Um
(V
)
0.054 mA·cm-2
0.051 mA·cm-2
0.044 mA·cm-2
0.028 mA·cm-2
0.014 mA·cm-2
Fig. 4.5. Chronopotentiometric response obtained in the underlimiting range of currents
for 5·10-4 M Na2SO4 solutions.
The chronopotentiograms obtained in the range of overlimiting currents for 5·10-4M
Na2SO4 are presented in Fig. 4.6. When the concentration of counterions (in the present
case Na+ ions) is vanishing at the depleting membrane surface, a steep increase in Um is
observed in the chronopotentiograms. The jump registered in the voltage response
occurs at a characteristic time known as the transition time, τ , which has been indicated
in the figure for the current density of 0.059 mA·cm-2. For times larger than τ , Um levels
off and is stabilized in an approximately constant value until the application of current
ceases. As can be seen in the figure, the application of current densities beyond the ilim
induces the continuous depletion of ions in the diffusion boundary layer and this implies
higher final Um values. Moreover, in agreement with the Sand’s equation previously
presented in Chapter 3 (Eq. (3.8)), the transition time decreases for increasing current
densities.
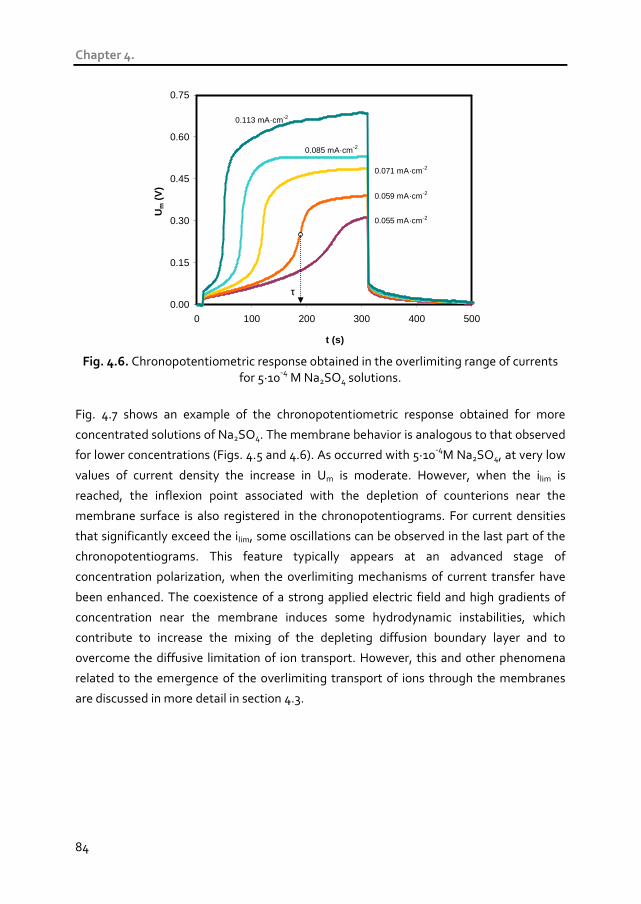
Chapter 4.
84
0.00
0.15
0.30
0.45
0.60
0.75
0 100 200 300 400 500
t (s)
Um
(V
)
0.113 mA·cm-2
0.085 mA·cm-2
0.071 mA·cm-2
0.059 mA·cm-2
0.055 mA·cm-2
τ
Fig. 4.6. Chronopotentiometric response obtained in the overlimiting range of currents
for 5·10-4 M Na2SO4 solutions.
Fig. 4.7 shows an example of the chronopotentiometric response obtained for more
concentrated solutions of Na2SO4. The membrane behavior is analogous to that observed
for lower concentrations (Figs. 4.5 and 4.6). As occurred with 5·10-4M Na2SO4, at very low
values of current density the increase in Um is moderate. However, when the ilim is
reached, the inflexion point associated with the depletion of counterions near the
membrane surface is also registered in the chronopotentiograms. For current densities
that significantly exceed the ilim, some oscillations can be observed in the last part of the
chronopotentiograms. This feature typically appears at an advanced stage of
concentration polarization, when the overlimiting mechanisms of current transfer have
been enhanced. The coexistence of a strong applied electric field and high gradients of
concentration near the membrane induces some hydrodynamic instabilities, which
contribute to increase the mixing of the depleting diffusion boundary layer and to
overcome the diffusive limitation of ion transport. However, this and other phenomena
related to the emergence of the overlimiting transport of ions through the membranes
are discussed in more detail in section 4.3.

Results and discussion
85
0.00
0.15
0.30
0.45
0.60
0.75
0 100 200 300 400 500
t (s)
Um
(V
)
1.98 mA·cm-2
1.49 mA·cm-2
1.25 mA·cm-2
1.13 mA·cm-2
0.85 mA·cm-2
Oscillations in Um
Fig. 4.7. Chronopotentiometric response obtained for 10-2 M Na2SO4 solutions.
The effect of the current density on the chronopotentiometric response obtained with
solutions of different concentrations has been analyzed from Figs. 4.5 - 4.7. However,
another interesting approach is to analyze the effect of the initial salt concentration on
the response obtained for a constant value of current density, as shown in Fig. 4.8. From
the almost plane response observed for 10-2M Na2SO4 it is induced that the applied
current density (0.71 mA·cm-2) is below the ilim of this membrane/electrolyte system. On
the contrary, for lower electrolyte concentrations the same current density exceeds the
ilim, since Um exhibits the inflexion point indicative that the concentration of counterions
at the membrane depleting surface is vanishing. Nevertheless, once the voltage jump has
occurred, the evolution of Um with time is different in both cases. In the case of 5·10-3M
Na2SO4 solutions, after a sharp increase, Um reaches a certain voltage value that remains
stable and almost constant during the rest of the current pulse, whereas for the most
diluted solutions of 2.5·10-3M Na2SO4 the evolution of Um with time shows the oscillations
characteristic of overlimiting currents. These oscillations limit the increase of the
membrane voltage drop, thus implying that the final value of Um is practically the same
for this concentration and for 5·10-3M Na2SO4. Hence, these results illustrate how the
overlimiting currents can reduce the electrical resistance of the membrane system and
enhance the ion transport through the membrane.
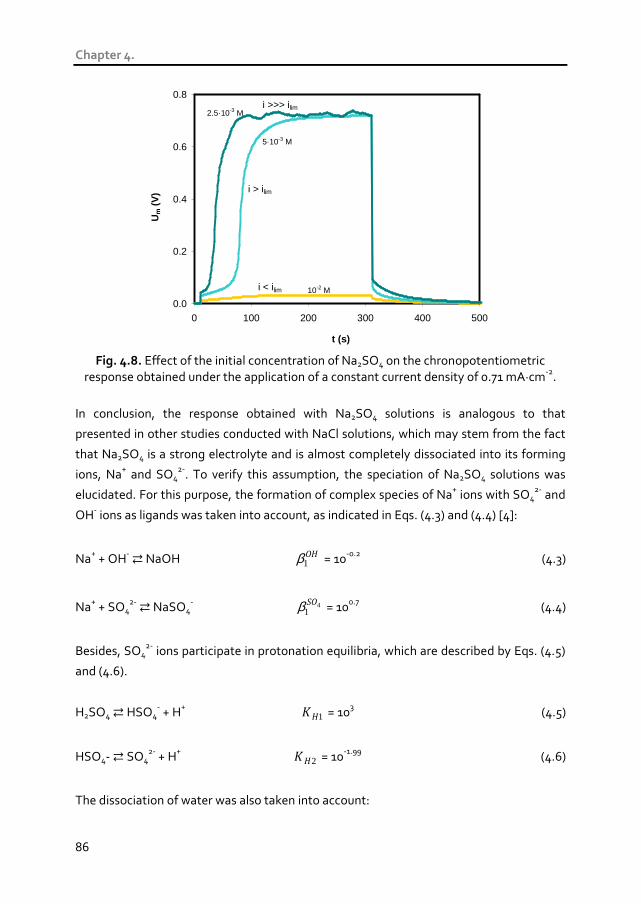
Chapter 4.
86
0.0
0.2
0.4
0.6
0.8
0 100 200 300 400 500
t (s)
Um
(V
)
2.5·10-3 M
5·10-3 M
10-2 Mi < ilim
i > ilim
i >>> ilim
Fig. 4.8. Effect of the initial concentration of Na2SO4 on the chronopotentiometric
response obtained under the application of a constant current density of 0.71 mA·cm-2.
In conclusion, the response obtained with Na2SO4 solutions is analogous to that
presented in other studies conducted with NaCl solutions, which may stem from the fact
that Na2SO4 is a strong electrolyte and is almost completely dissociated into its forming
ions, Na+ and SO42-. To verify this assumption, the speciation of Na2SO4 solutions was
elucidated. For this purpose, the formation of complex species of Na+ ions with SO42- and
OH- ions as ligands was taken into account, as indicated in Eqs. (4.3) and (4.4) [4]:
Na+ + OH- NaOH OH1β = 10-0.2 (4.3)
Na+ + SO42- NaSO4
- 41SOβ = 100.7 (4.4)
Besides, SO42- ions participate in protonation equilibria, which are described by Eqs. (4.5)
and (4.6).
H2SO4 HSO4- + H+ 1HK = 103 (4.5)
HSO4- SO42- + H+ 2HK = 10-1.99 (4.6)
The dissociation of water was also taken into account:
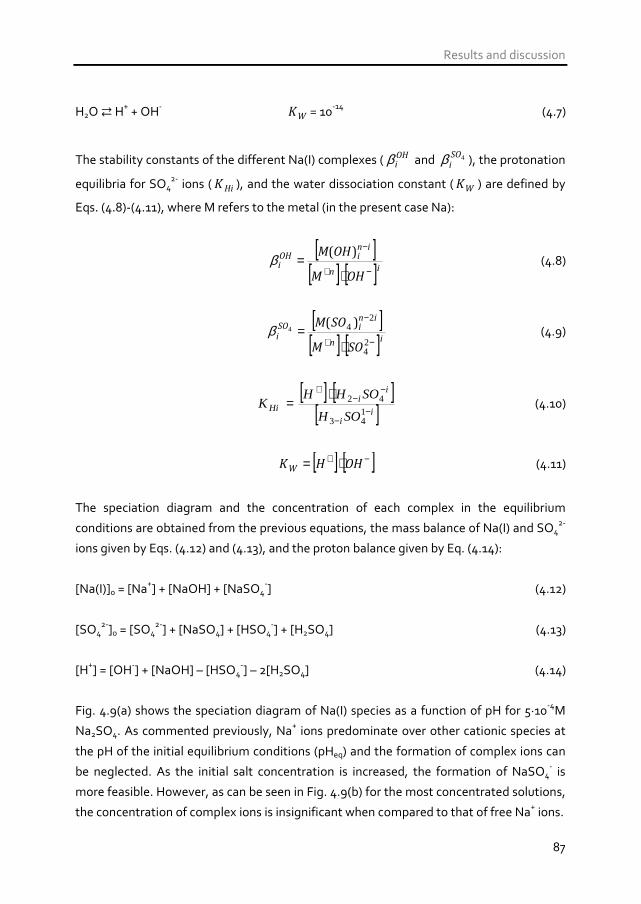
Results and discussion
87
H2O H+ + OH- WK = 10-14 (4.7)
The stability constants of the different Na(I) complexes ( OHiβ and 4SO
iβ ), the protonation
equilibria for SO42- ions ( HiK ), and the water dissociation constant ( WK ) are defined by
Eqs. (4.8)-(4.11), where M refers to the metal (in the present case Na):
[ ]
[ ] [ ]in
iniOH
i
OHM
OHM
−+
−
⋅=
)(β (4.8)
[ ][ ] [ ]in
iniSO
i
SOM
SOM
−+
−
⋅=
24
244
)(β (4.9)
[ ] [ ]
[ ]ii
ii
HiSOH
SOHHK
−−
−−
+ ⋅=
143
42 (4.10)
[ ] [ ]−+ ⋅= OHHKW (4.11)
The speciation diagram and the concentration of each complex in the equilibrium
conditions are obtained from the previous equations, the mass balance of Na(I) and SO42-
ions given by Eqs. (4.12) and (4.13), and the proton balance given by Eq. (4.14):
[Na(I)]0 = [Na+] + [NaOH] + [NaSO4-] (4.12)
[SO42-]0 = [SO4
2-] + [NaSO4] + [HSO4-] + [H2SO4] (4.13)
[H+] = [OH-] + [NaOH] – [HSO4-] – 2[H2SO4] (4.14)
Fig. 4.9(a) shows the speciation diagram of Na(I) species as a function of pH for 5·10-4M
Na2SO4. As commented previously, Na+ ions predominate over other cationic species at
the pH of the initial equilibrium conditions (pHeq) and the formation of complex ions can
be neglected. As the initial salt concentration is increased, the formation of NaSO4- is
more feasible. However, as can be seen in Fig. 4.9(b) for the most concentrated solutions,
the concentration of complex ions is insignificant when compared to that of free Na+ ions.

Chapter 4.
88
(a) (b)
0.0
0.2
0.4
0.6
0.8
1.0
0 2 4 6 8 10 12 14
pH
α i
NaOH
Na+
pHeq
0.0
0.2
0.4
0.6
0.8
1.0
0 2 4 6 8 10 12 14
pH
α i
NaOH
Na+
NaSO4-
pHeq
Fig. 4.9. Speciation diagram of (a) 5·10-4M Na2SO4 solutions and (b) 10-2M Na2SO4 solutions.
4.1.3.2 Calculation of the transport number of Na+ ions through
Nafion 117 membranes As commented previously, chronopotentiometry allows us not only to obtain a qualitative
notion about the ion transport phenomena taking place in a membrane/electrolyte
system, but also the quantification of the transport of counterions by means of the
calculation of the counterion transport number. This parameter is a measure of the
membrane selectivity toward counterions. The transport number of Na+ ions through the
membrane phase (TNa+) indicates which part of the total charge transported through the
membrane is carried by Na+ ions. It can be calculated by using the Sand’s equation (Eq.
3.8). For this purpose, the transition times, which indicate the time at which the steepest
increase in Um is registered, were obtained from the maximum in the derivative of Um
with time, as indicated in Fig. 4.10.
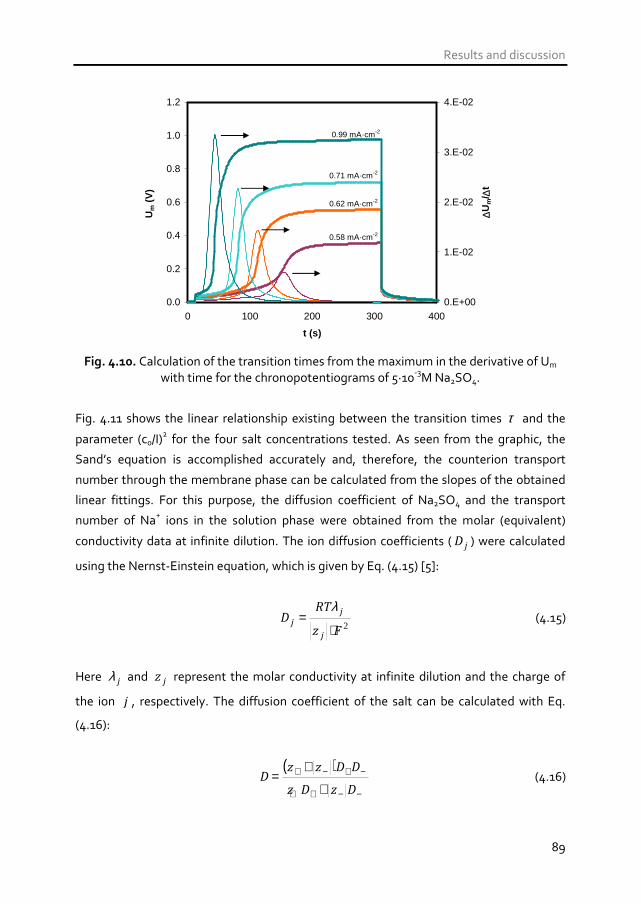
Results and discussion
89
0.0
0.2
0.4
0.6
0.8
1.0
1.2
0 100 200 300 400
t (s)
Um
(V
)
0.E+00
1.E-02
2.E-02
3.E-02
4.E-02
∆Um
/ ∆t
0.99 mA·cm-2
0.71 mA·cm-2
0.62 mA·cm-2
0.58 mA·cm-2
Fig. 4.10. Calculation of the transition times from the maximum in the derivative of Um
with time for the chronopotentiograms of 5·10-3M Na2SO4.
Fig. 4.11 shows the linear relationship existing between the transition times τ and the
parameter (c0/I)2 for the four salt concentrations tested. As seen from the graphic, the
Sand’s equation is accomplished accurately and, therefore, the counterion transport
number through the membrane phase can be calculated from the slopes of the obtained
linear fittings. For this purpose, the diffusion coefficient of Na2SO4 and the transport
number of Na+ ions in the solution phase were obtained from the molar (equivalent)
conductivity data at infinite dilution. The ion diffusion coefficients ( jD ) were calculated
using the Nernst-Einstein equation, which is given by Eq. (4.15) [5]:
2Fz
RTD
j
j
j⋅
=λ
(4.15)
Here jλ and jz represent the molar conductivity at infinite dilution and the charge of
the ion j , respectively. The diffusion coefficient of the salt can be calculated with Eq.
(4.16):
( )
−−++
−+−+
+
+=
DzDz
DDzzD (4.16)

Chapter 4.
90
Finally, the transport number of the counterions in the solution is calculated by means of
Eq. (4.17):
−+
++
+=
λλλ
t (4.17)
y1 = 7.252x - 7.405
R2 = 0.999y2 = 5.132x + 3.209
R2 = 0.994
y3 = 4.717x - 5.445
R2 = 0.995
y4 = 3.058x - 0.815
R2 = 0.990
0
20
40
60
80
100
120
0 5 10 15 20 25
(c0/I)2 (mol/L·A) 2
τ (s
)
10-2M Na2SO4
5·10-3M Na2SO4
2.5·10-3M Na2SO4
5·10-4M Na2SO4
Fig. 4.11. Transition time, τ , as a function of (c0/I)2 for Na2SO4 solutions of varying
concentration.
The membrane transport number of Na+ ions calculated from the chronopotentiometric
experiments is represented in Fig. 4.12 as a function of the initial Na(I) concentration. The
results show that the TNa+ values increase with the increase in the initial salt concentration
and reach a maximum value of 0.99 for 2·10-2M Na(I) solutions. This trend is in
contradiction with the Donnan theory, which predicts a decrease in the counterion
transport number with the increase in the salt concentration because of a weaker
repulsion of the membrane fixed charges toward the solution coions (SO42- ions).
However, similar results were also obtained by Dlugolecki et al. with NaCl solutions, and
the deviation from the expected behavior was attributed to the hydrodynamic
instabilities in the diffusion boundary layer occurring specially at lower salt
concentrations [6]. The formation of hydrodynamic instabilities in the overlimiting range
of currents can imply higher experimental values for the transition time, which results in
the lower TNa+ values. The discrepancy between the expected and the obtained trend of
the TNa+ values with the electrolyte concentration could be also attributed to the dilution

Results and discussion
91
effect taking place at very low concentrations, where the transport of water through the
membrane could probably diminish the counterion transport number.
0.0
0.2
0.4
0.6
0.8
1.0
0.0E+00 5.0E-03 1.0E-02 1.5E-02 2.0E-02 2.5E-02
[Na(I)] (mol/L)
TN
a+
Fig. 4.12. Counterion transport number calculated from the experimental transition time
as a function of the Na(I) concentration.
4.1.3.3 Current-voltage characteristics
The current-voltage curves obtained for Na2SO4 solutions are represented in Fig. 4.13 and
4.14 for diluted and concentrated solutions, respectively. The curves exhibit the shape
typically found in the literature for NaCl solutions, where three regions of different
membrane behavior can be clearly distinguished:
1. At very low current densities (i<ilim), a linear dependence describes the relationship
between current density and Um. The behavior of the membrane system in this
region responds to a quasi-ohmic pattern.
2. As the ilim value is reached (i≈ilim), the transport of counterions in the depleting
boundary layer is limited by diffusion. As a consequence, the concentration of
counterions near the membrane surface is vanishing and the resistance of the
membrane system increases, thus leading to a plateau in the current-voltage curves.

Chapter 4.
92
3. In the so-called overlimiting region (i>ilim), the supply of ions to the membrane
surface is again enhanced and the current density increases again with Um.
0.0
0.2
0.4
0.6
0.8
0.0 0.2 0.4 0.6 0.8 1.0
Um (V)
i (m
A·c
m-2
)
2.5·10-3M Na2SO4
5·10-4M Na2SO4
1/R1
ilim
Quasi-ohmic region
Plateau
Overlimiting region
Fig. 4.13. Current-voltage curves obtained for diluted solutions of Na2SO4.
0.0
0.5
1.0
1.5
2.0
0.0 0.2 0.4 0.6 0.8 1.0
Um (V)
i (m
A·c
m-2
)
10-2M Na2SO4
5·10-3M Na2SO4
Fig. 4.14. Current-voltage curves obtained for concentrated solutions of Na2SO4.
One important current-voltage characteristic that can be obtained from the curves is the
electrical resistance of the membrane system in the ohmic region (R1), which is calculated
from the inverse of the slope of this part of the curves. This parameter is related to the
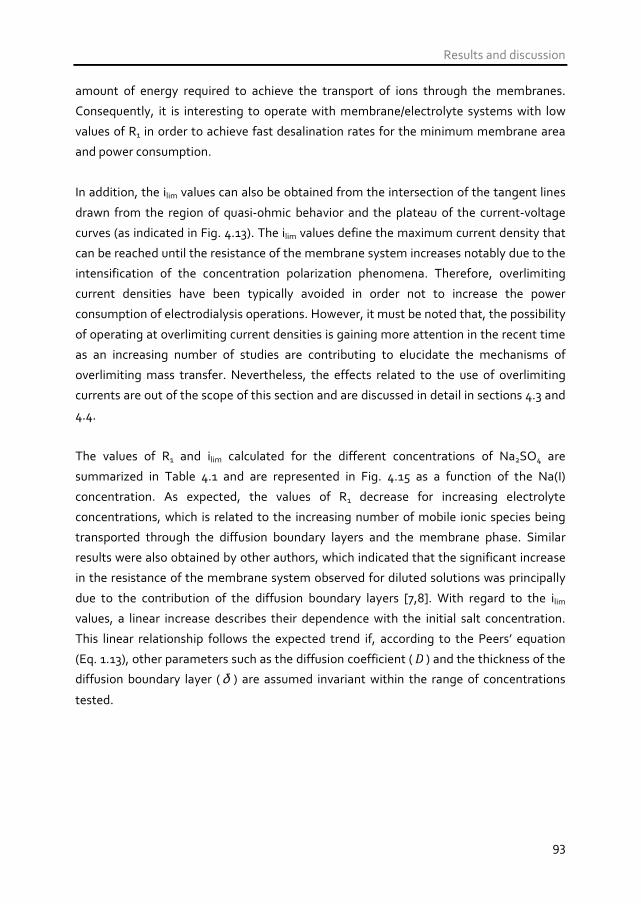
Results and discussion
93
amount of energy required to achieve the transport of ions through the membranes.
Consequently, it is interesting to operate with membrane/electrolyte systems with low
values of R1 in order to achieve fast desalination rates for the minimum membrane area
and power consumption.
In addition, the ilim values can also be obtained from the intersection of the tangent lines
drawn from the region of quasi-ohmic behavior and the plateau of the current-voltage
curves (as indicated in Fig. 4.13). The ilim values define the maximum current density that
can be reached until the resistance of the membrane system increases notably due to the
intensification of the concentration polarization phenomena. Therefore, overlimiting
current densities have been typically avoided in order not to increase the power
consumption of electrodialysis operations. However, it must be noted that, the possibility
of operating at overlimiting current densities is gaining more attention in the recent time
as an increasing number of studies are contributing to elucidate the mechanisms of
overlimiting mass transfer. Nevertheless, the effects related to the use of overlimiting
currents are out of the scope of this section and are discussed in detail in sections 4.3 and
4.4.
The values of R1 and ilim calculated for the different concentrations of Na2SO4 are
summarized in Table 4.1 and are represented in Fig. 4.15 as a function of the Na(I)
concentration. As expected, the values of R1 decrease for increasing electrolyte
concentrations, which is related to the increasing number of mobile ionic species being
transported through the diffusion boundary layers and the membrane phase. Similar
results were also obtained by other authors, which indicated that the significant increase
in the resistance of the membrane system observed for diluted solutions was principally
due to the contribution of the diffusion boundary layers [7,8]. With regard to the ilim
values, a linear increase describes their dependence with the initial salt concentration.
This linear relationship follows the expected trend if, according to the Peers’ equation
(Eq. 1.13), other parameters such as the diffusion coefficient (D ) and the thickness of the
diffusion boundary layer ( δ ) are assumed invariant within the range of concentrations
tested.
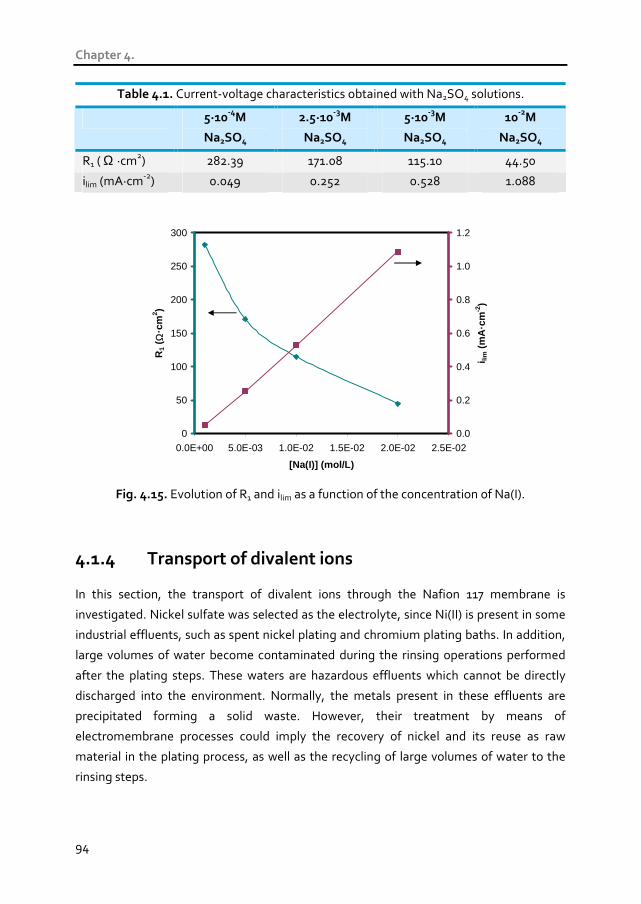
Chapter 4.
94
Table 4.1. Current-voltage characteristics obtained with Na2SO4 solutions.
5·10-4
M
Na2SO4
2.5·10-3
M
Na2SO4
5·10-3
M
Na2SO4
10-2
M
Na2SO4
R1 ( Ω ·cm2) 282.39 171.08 115.10 44.50
ilim (mA·cm-2) 0.049 0.252 0.528 1.088
0
50
100
150
200
250
300
0.0E+00 5.0E-03 1.0E-02 1.5E-02 2.0E-02 2.5E-02
[Na(I)] (mol/L)
R1
( Ω·c
m2 )
0.0
0.2
0.4
0.6
0.8
1.0
1.2
i lim (
mA
·cm
-2)
Fig. 4.15. Evolution of R1 and ilim as a function of the concentration of Na(I).
4.1.4 Transport of divalent ions In this section, the transport of divalent ions through the Nafion 117 membrane is
investigated. Nickel sulfate was selected as the electrolyte, since Ni(II) is present in some
industrial effluents, such as spent nickel plating and chromium plating baths. In addition,
large volumes of water become contaminated during the rinsing operations performed
after the plating steps. These waters are hazardous effluents which cannot be directly
discharged into the environment. Normally, the metals present in these effluents are
precipitated forming a solid waste. However, their treatment by means of
electromembrane processes could imply the recovery of nickel and its reuse as raw
material in the plating process, as well as the recycling of large volumes of water to the
rinsing steps.

Results and discussion
95
4.1.4.1 Chronopotentiometric response Different chronopotentiometric experiments were performed using NiSO4 solutions
having a concentration of metallic Ni(II) analogous to the concentrations of Na(I)
considered previously. The chronopotentiometric response obtained for 10-3M NiSO4
solutions is presented in Fig. 4.16. The curves corresponding to underlimiting current
densities are similar to those described previously for Na2SO4 solutions. As the ilim is
reached the sharp increase in Um and the inflexion point associated with the depletion of
counterions (in this case Ni2+ ions) near the membrane surface is also observed. However,
as the current is increased beyond the ilim values, other additional features that were not
observed in the case of Na2SO4 solutions are detected in the chronopotentiograms. For
the current densities that significantly exceed the ilim value (i.e. 0.17, 0.23 and 0.25
mA·cm-2 in Fig. 4.16), a second increase in Um takes place immediately after the
registration of the first inflexion point. This second increase in Um appears due to a further
intensification of the concentration polarization phenomena, which is confirmed by the
slower relaxation profile of the membrane potential once the current is stopped.
0.0
0.2
0.4
0.6
0.8
1.0
0 100 200 300 400 500
t (s)
Um
(V
)
0.25 mA·cm-2
0.23 mA·cm-2
0.17 mA·cm-2
0.09 mA·cm-2
0.07 mA·cm-2
0.06 mA·cm-2
Relaxation of the membrane potential
2nd inflexion point in Um
Fig. 4.16. Chronopotentiometric response obtained for 10-3M NiSO4 solutions.
Fig. 4.17 shows the chronopotentiometric response obtained for 10-2M NiSO4. These
curves are significantly different from those obtained for more diluted solutions.
Specifically, when the ilim is surpassed Um shows a second increase which is different from
those observed in Fig. 4.16 for the highest applied currents. Whereas for the most diluted

Chapter 4.
96
solutions the second increase of Um showed a clear inflexion point, in this case the
increase of Um takes place gradually. Moreover, the profile of the relaxation of Um once
the application of current ceases presents some peculiarities which were not obtained for
underlimiting currents. At the first instants after the current is switched off Um decreases
very fast and reaches a plateau value considerably higher than zero. This plateau value is
maintained almost constant during a few seconds and then Um is restored slowly to zero.
On the contrary, for lower current densities, the plateau in the relaxation of the
membrane potential is not observed and Um decreases asymptotically to zero more
rapidly.
The voltage value remaining after switching off the current and the slow restoration of
the membrane potential is a phenomenon characteristic of bipolar membranes and has
been attributed in previous studies to the formation of water dissociation products [9,10].
Moreover, this behavior has been observed also in the case of monopolar cation-
exchange membranes when a layer of metallic precipitates is formed at the anodic side of
the membranes once the ilim is surpassed [11,12]. In our case, it must be noted that the
formation of precipitates at the anodic side of the membrane was verified at the end of
these experiments. The inset photograph of Fig. 4.17 shows the nickel precipitates
formed at the membrane surface, which have the characteristic green color of Ni(II)
compounds. Therefore, the gradual increase of Um and the plateau in the relaxation of the
membrane potential registered for high overlimiting currents may be attributed to the
formation of precipitates. The formation of precipitates and the features associated with
this phenomenon were also observed in the chronopotentiograms obtained for 2·10-2M
NiSO4. However, these results are not shown for the sake of clarity.
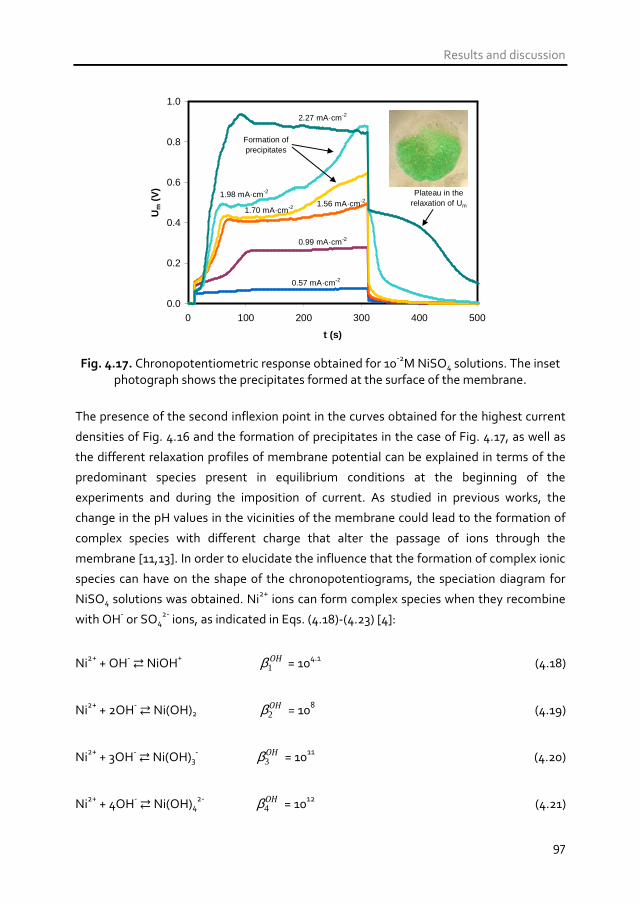
Results and discussion
97
0.0
0.2
0.4
0.6
0.8
1.0
0 100 200 300 400 500
t (s)
Um
(V
)
2.27 mA·cm-2
1.98 mA·cm-2
0.99 mA·cm-2
0.57 mA·cm-2
1.56 mA·cm-2
1.70 mA·cm-2
Formation of precipitates
Plateau in the relaxation of Um
Fig. 4.17. Chronopotentiometric response obtained for 10-2M NiSO4 solutions. The inset
photograph shows the precipitates formed at the surface of the membrane.
The presence of the second inflexion point in the curves obtained for the highest current
densities of Fig. 4.16 and the formation of precipitates in the case of Fig. 4.17, as well as
the different relaxation profiles of membrane potential can be explained in terms of the
predominant species present in equilibrium conditions at the beginning of the
experiments and during the imposition of current. As studied in previous works, the
change in the pH values in the vicinities of the membrane could lead to the formation of
complex species with different charge that alter the passage of ions through the
membrane [11,13]. In order to elucidate the influence that the formation of complex ionic
species can have on the shape of the chronopotentiograms, the speciation diagram for
NiSO4 solutions was obtained. Ni2+ ions can form complex species when they recombine
with OH- or SO42- ions, as indicated in Eqs. (4.18)-(4.23) [4]:
Ni2+ + OH- NiOH+ OH1β = 104.1 (4.18)
Ni2+ + 2OH- Ni(OH)2 OH
2β = 108 (4.19)
Ni2+ + 3OH- Ni(OH)3- OH
3β = 1011 (4.20)
Ni2+ + 4OH- Ni(OH)42- OH
4β = 1012 (4.21)
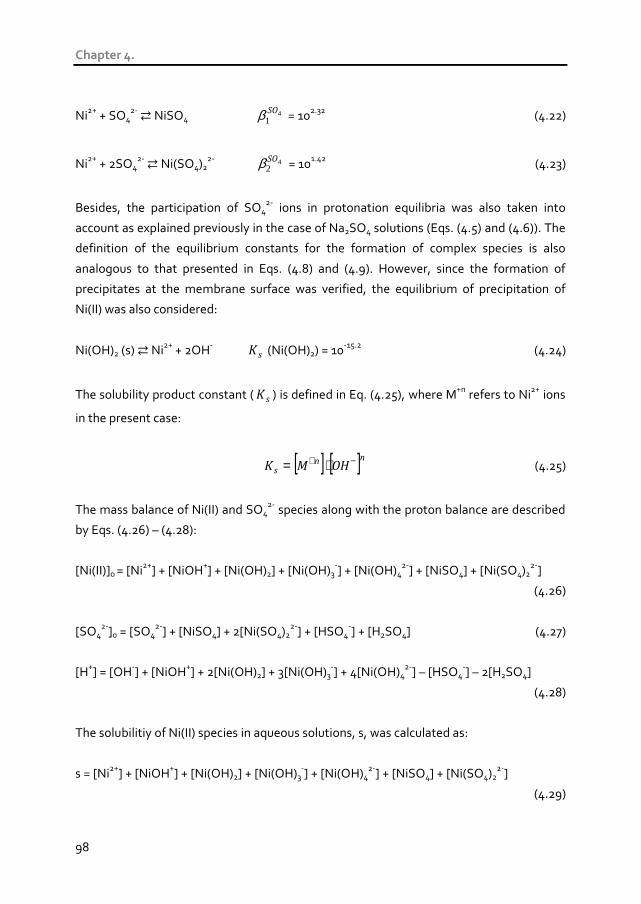
Chapter 4.
98
Ni2+ + SO42- NiSO4 4
1SOβ = 102.32 (4.22)
Ni2+ + 2SO42- Ni(SO4)2
2- 42SOβ = 101.42 (4.23)
Besides, the participation of SO42- ions in protonation equilibria was also taken into
account as explained previously in the case of Na2SO4 solutions (Eqs. (4.5) and (4.6)). The
definition of the equilibrium constants for the formation of complex species is also
analogous to that presented in Eqs. (4.8) and (4.9). However, since the formation of
precipitates at the membrane surface was verified, the equilibrium of precipitation of
Ni(II) was also considered:
Ni(OH)2 (s) Ni2+ + 2OH- sK (Ni(OH)2) = 10-15.2 (4.24)
The solubility product constant ( sK ) is defined in Eq. (4.25), where M+n refers to Ni2+ ions
in the present case:
[ ] [ ]nns OHMK −+ ⋅= (4.25)
The mass balance of Ni(II) and SO42- species along with the proton balance are described
by Eqs. (4.26) – (4.28):
[Ni(II)]0 = [Ni2+] + [NiOH+] + [Ni(OH)2] + [Ni(OH)3-] + [Ni(OH)4
2-] + [NiSO4] + [Ni(SO4)22-]
(4.26)
[SO42-]0 = [SO4
2-] + [NiSO4] + 2[Ni(SO4)22-] + [HSO4
-] + [H2SO4] (4.27)
[H+] = [OH-] + [NiOH+] + 2[Ni(OH)2] + 3[Ni(OH)3-] + 4[Ni(OH)4
2-] – [HSO4-] – 2[H2SO4]
(4.28)
The solubilitiy of Ni(II) species in aqueous solutions, s, was calculated as:
s = [Ni2+] + [NiOH+] + [Ni(OH)2] + [Ni(OH)3-] + [Ni(OH)4
2-] + [NiSO4] + [Ni(SO4)22-]
(4.29)

Results and discussion
99
The speciation diagram of 10-3M NiSO4 solutions is presented in Fig. 4.18 as a function of
the pH, where the pH corresponding to the initial equilibrium conditions (pHeq) is
represented by a vertical dashed line. At the initial equilibrium conditions Ni2+ ions are the
main cationic species present in the electrolyte. Therefore, the current transfer through
the membrane may be mainly associated with the transport of Ni2+ ions and the first
inflexion points appearing in the chronopotentiograms should correspond to their
depletion from the membrane diluting surface. In addition, the second inflexion point
observed in Fig. 4.16 for the highest applied currents could be associated with the
depletion of other ionic species. Specifically, the concentration of the complex specie
NiSO4 is significant at the initial conditions of the experiments. Moreover, once the Ni2+
ions are depleted from the membrane surface, an important amount of protons can be
transferred to the cathodic compartment. This phenomenon may promote the increase
of the local pH at the anodic side of the membrane, thus shifting the initial pH value
(pHeq) to pH values at which the formation of hydroxilated species of nickel is favored.
The dissociation of the complex specie NiSO4 and the formation of NiOH+ ions originated
by changes in the pH near the membrane surface would imply the transport through the
membrane of the generated cationic species. Therefore, the second inflexion point
appeared in the chronopotentiograms for the highest applied currents can be attributed
to the depletion of these ions.
0.0
0.2
0.4
0.6
0.8
1.0
0 2 4 6 8 10 12 14
pH
α i
Ni2+
NiSO4
Ni(OH)42-
Ni(OH)3-
Ni(OH)2
NiOH+
pHeq
Fig. 4.18. Speciation diagram of 10-3M NiSO4 solutions.

Chapter 4.
100
In regard to the formation of precipitates verified for the most concentrated solutions of
NiSO4, the solubility plot of NiSO4 solutions at different salt concentrations are presented
in Fig. 4.19. It can be seen from the figure that the formation of Ni(OH)2 precipitates
starts when the pH reaches a value of 7.5 in the case of 10-2M NiSO4 solutions, while in the
case of 10-3M NiSO4 solutions a pH value of 7.9 has to be reached. This difference
together with the fact that the overlimiting currents are much higher for concentrated
electrolytes may be the reason that explains the higher tendency toward the formation of
precipitates observed for the highest concentrations of NiSO4.
1.0E-07
1.0E-06
1.0E-05
1.0E-04
1.0E-03
1.0E-02
1.0E-01
1.0E+00
0 2 4 6 8 10 12 14pH
s (m
ol/L
)
10-2 M NiSO4
5·10-3 M NiSO4
10-3 M NiSO4
The formation of precipitates starts
pHeq
Fig. 4.19. Solubility plot of NiSO4 solutions as a function of the salt concentration.
4.1.4.2 Calculation of the transport number of Ni2+ ions through
Nafion 117 membranes
The membrane transport number of Ni2+ ions was also calculated from the transition
times obtained from the chronopotentiometric curves. In this case, the transition times
also followed a linear trend with the square of the inverse of the applied current, as can be
seen in Fig. 4.20. Therefore, the Sand’s equation is accomplished and the Ni2+ transport
numbers can be calculated by means of chronopotentiometry, following the same
procedure as that used for the Na2SO4 solutions.

Results and discussion
101
y1 = 14.019x + 3.3967
R2 = 0.996
y2 = 10.895x + 5.2548
R2 = 0.997
y3 = 14.401x - 33.568
R2 = 0.997
0
20
40
60
80
100
120
140
160
180
0 2 4 6 8 10 12
(c0/I)2
τ (s
)
2·10-2M NiSO4
10-3M NiSO4
5·10-4M NiSO4
Fig. 4.20. Transition time, τ , as a function of (c0/I)2 for NiSO4 solutions of varying
concentration.
The evolution of the membrane transport number of Ni2+ ions (TNi2+) as a function of the
initial concentration is presented in Fig. 4.21. In this case, the TNi2+ value decreases for the
lowest concentration, as occurred in the case of Na+ ions (Fig. 4.12). Then, a maximum is
reached for 10-3M NiSO4 solutions and TNi2+ decreases again with the increase in the
concentration of Ni(II). Contrary to the trend observed for Na+ ions, the decrease of the
membrane selectivity with increasing the salt concentration is in agreement with the
Donnan coion exclusion theory [14], which predicts a lowered coion exclusion (SO42- ions
in the present study) as a consequence of their invasion in the membrane phase at higher
electrolyte concentrations. Analogous results were also obtained by other researchers
with different electrolytes [2,15]. In addition, for the same metal ion concentration, the
concentration of SO42- ions in the case of a 1:1 electrolyte is twofold that of a 2:1
electrolyte, which could explain the different trends observed for Na2SO4 and NiSO4.

Chapter 4.
102
0.0
0.2
0.4
0.6
0.8
1.0
0.0E+00 5.0E-03 1.0E-02 1.5E-02 2.0E-02 2.5E-02
[Ni(II)] (mol/L)
TN
i2+
Fig. 4.21. Counterion transport number calculated from the experimental transition time
as a function of the Ni(II) concentration.
4.1.4.3 Current-voltage characteristics The current-voltage curves obtained for NiSO4 solutions are presented in Fig. 4.22 and
4.23. The curves obtained for the more diluted solutions (Fig. 4.22) show the typical shape
already explained for Na2SO4 solutions, where the region of quasi-ohmic behavior, the
plateau and the overlimiting region can be clearly distinguished. Moreover the expected
increase of the ilim values with the electrolyte concentration can be clearly seen in the
figure.

Results and discussion
103
0.00
0.05
0.10
0.15
0.20
0.0 0.2 0.4 0.6 0.8
Um (V)
i (m
A·c
m-2
)
10-3M NiSO4
5·10-4M NiSO4
Fig. 4.22. Current-voltage curves obtained for diluted solutions of NiSO4.
On the contrary, the shape of the curves obtained for more concentrated NiSO4 solutions
(Fig. 4.23) changes as the initial salt concentration is increased. Whereas the current-
voltage curve obtained for 5·10-3M NiSO4 also exhibits the three characteristic regions of
membrane behavior, the curve obtained for 10-2M NiSO4 exhibits some peculiarities. This
curve shows two different plateaus and two limiting current densities (ilim1 and ilim2). The
first plateau corresponds to the current densities at which only one inflexion point was
observed in the chronopotentiograms (e.g. 0.99 mA·cm-2 in Fig. 4.17). Therefore, this
plateau is originated by the increase in the resistance of the membrane system caused by
the depletion of Ni2+ ions near the membrane surface. The subsequent increase of current
following the first plateau could be caused by overlimiting mass transfer phenomena.
However, if the current is further increased, a second plateau is formed, which is much
more prolonged and corresponds to the chronopotentiograms where the gradual
increase in Um was registered (e.g. 1.98 mA·cm-2 in Fig. 4.17). Therefore, the second
plateau is formed due to the high electrical resistance of the precipitates deposited at the
anodic side of the membrane. Finally, the last overlimiting region of this curve presents
some scattering and is almost vertical. In this region the current increase is very acute and
implies almost no increase in the membrane resistance. This membrane behavior could
be attributed to the catalytic dissociation of water occurring at the interface between the
precipitates and the membrane [11,12,16]. However, this phenomenon is analyzed in
more detail in section 4.3.
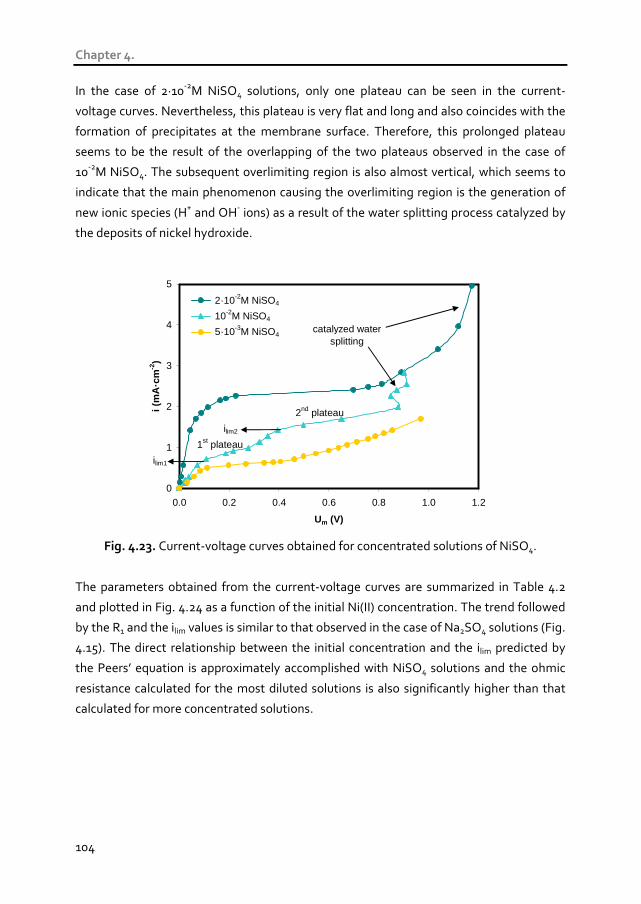
Chapter 4.
104
In the case of 2·10-2M NiSO4 solutions, only one plateau can be seen in the current-
voltage curves. Nevertheless, this plateau is very flat and long and also coincides with the
formation of precipitates at the membrane surface. Therefore, this prolonged plateau
seems to be the result of the overlapping of the two plateaus observed in the case of
10-2M NiSO4. The subsequent overlimiting region is also almost vertical, which seems to
indicate that the main phenomenon causing the overlimiting region is the generation of
new ionic species (H+ and OH- ions) as a result of the water splitting process catalyzed by
the deposits of nickel hydroxide.
0
1
2
3
4
5
0.0 0.2 0.4 0.6 0.8 1.0 1.2
Um (V)
i (m
A·c
m-2
)
2·10-2M NiSO4
10-2M NiSO4
5·10-3M NiSO4
1st plateau
2nd plateau
catalyzed water splitting
ilim1
ilim2
Fig. 4.23. Current-voltage curves obtained for concentrated solutions of NiSO4.
The parameters obtained from the current-voltage curves are summarized in Table 4.2
and plotted in Fig. 4.24 as a function of the initial Ni(II) concentration. The trend followed
by the R1 and the ilim values is similar to that observed in the case of Na2SO4 solutions (Fig.
4.15). The direct relationship between the initial concentration and the ilim predicted by
the Peers’ equation is approximately accomplished with NiSO4 solutions and the ohmic
resistance calculated for the most diluted solutions is also significantly higher than that
calculated for more concentrated solutions.
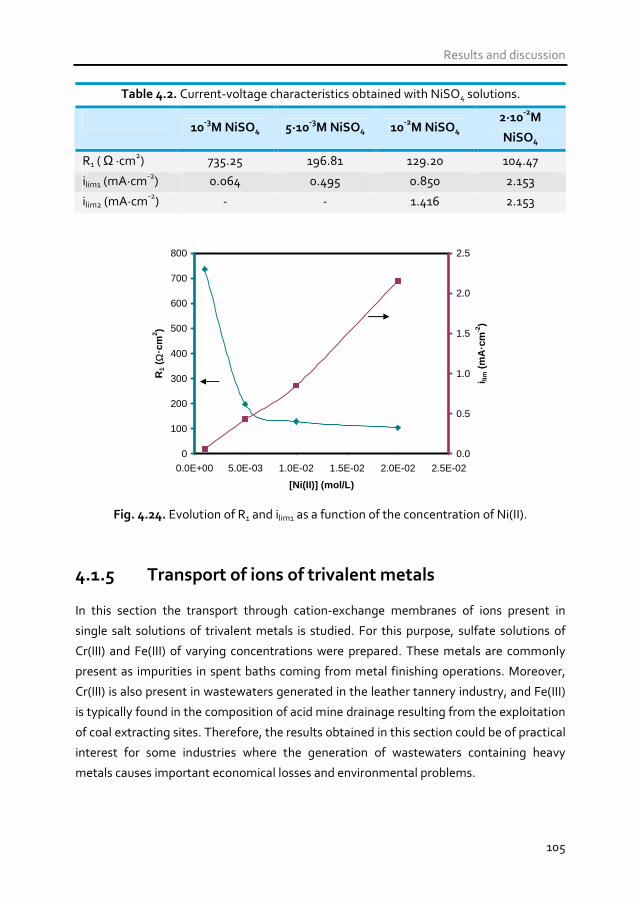
Results and discussion
105
Table 4.2. Current-voltage characteristics obtained with NiSO4 solutions.
10
-3M NiSO4 5·10
-3M NiSO4 10
-2M NiSO4
2·10-2
M
NiSO4
R1 ( Ω ·cm2) 735.25 196.81 129.20 104.47
ilim1 (mA·cm-2) 0.064 0.495 0.850 2.153
ilim2 (mA·cm-2) - - 1.416 2.153
0
100
200
300
400
500
600
700
800
0.0E+00 5.0E-03 1.0E-02 1.5E-02 2.0E-02 2.5E-02
[Ni(II)] (mol/L)
R1
( Ω·c
m2 )
0.0
0.5
1.0
1.5
2.0
2.5
i lim (
mA
·cm
-2)
Fig. 4.24. Evolution of R1 and ilim1 as a function of the concentration of Ni(II).
4.1.5 Transport of ions of trivalent metals
In this section the transport through cation-exchange membranes of ions present in
single salt solutions of trivalent metals is studied. For this purpose, sulfate solutions of
Cr(III) and Fe(III) of varying concentrations were prepared. These metals are commonly
present as impurities in spent baths coming from metal finishing operations. Moreover,
Cr(III) is also present in wastewaters generated in the leather tannery industry, and Fe(III)
is typically found in the composition of acid mine drainage resulting from the exploitation
of coal extracting sites. Therefore, the results obtained in this section could be of practical
interest for some industries where the generation of wastewaters containing heavy
metals causes important economical losses and environmental problems.
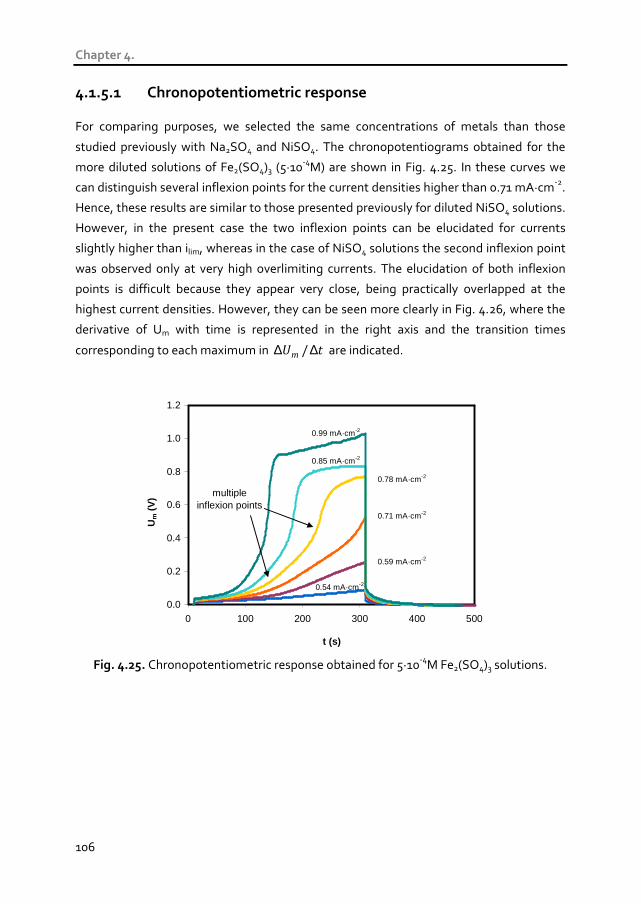
Chapter 4.
106
4.1.5.1 Chronopotentiometric response
For comparing purposes, we selected the same concentrations of metals than those
studied previously with Na2SO4 and NiSO4. The chronopotentiograms obtained for the
more diluted solutions of Fe2(SO4)3 (5·10-4M) are shown in Fig. 4.25. In these curves we
can distinguish several inflexion points for the current densities higher than 0.71 mA·cm-2.
Hence, these results are similar to those presented previously for diluted NiSO4 solutions.
However, in the present case the two inflexion points can be elucidated for currents
slightly higher than ilim, whereas in the case of NiSO4 solutions the second inflexion point
was observed only at very high overlimiting currents. The elucidation of both inflexion
points is difficult because they appear very close, being practically overlapped at the
highest current densities. However, they can be seen more clearly in Fig. 4.26, where the
derivative of Um with time is represented in the right axis and the transition times
corresponding to each maximum in tUm ∆∆ / are indicated.
0.0
0.2
0.4
0.6
0.8
1.0
1.2
0 100 200 300 400 500
t (s)
Um
(V
)
0.99 mA·cm-2
0.85 mA·cm-2
0.78 mA·cm-2
0.71 mA·cm-2
0.59 mA·cm-2
0.54 mA·cm-2
multiple inflexion points
Fig. 4.25. Chronopotentiometric response obtained for 5·10-4M Fe2(SO4)3 solutions.
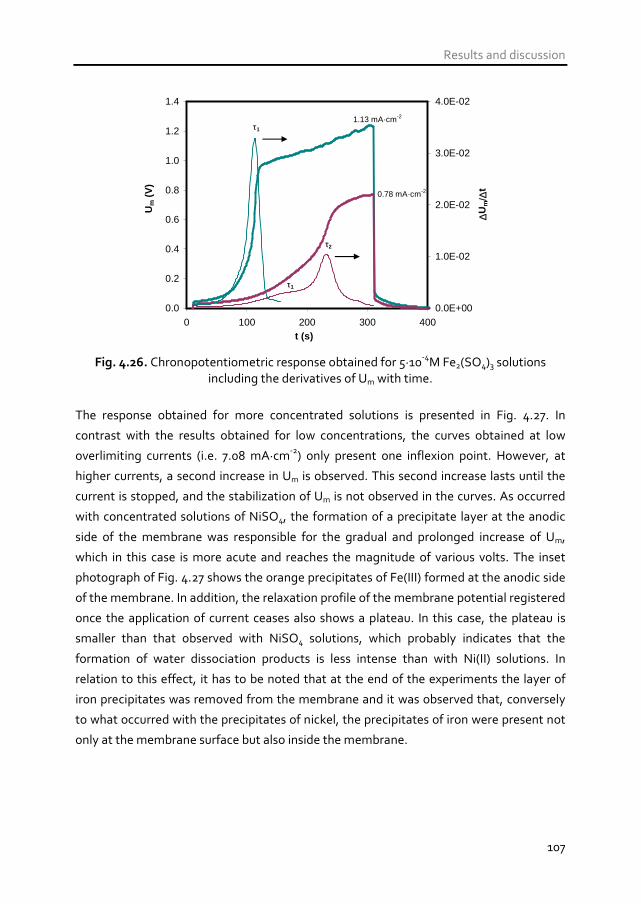
Results and discussion
107
0.0
0.2
0.4
0.6
0.8
1.0
1.2
1.4
0 100 200 300 400t (s)
Um
(V
)
0.0E+00
1.0E-02
2.0E-02
3.0E-02
4.0E-02
∆Um
/∆t
τ1
τ1
τ2
1.13 mA·cm-2
0.78 mA·cm-2
Fig. 4.26. Chronopotentiometric response obtained for 5·10-4M Fe2(SO4)3 solutions
including the derivatives of Um with time.
The response obtained for more concentrated solutions is presented in Fig. 4.27. In
contrast with the results obtained for low concentrations, the curves obtained at low
overlimiting currents (i.e. 7.08 mA·cm-2) only present one inflexion point. However, at
higher currents, a second increase in Um is observed. This second increase lasts until the
current is stopped, and the stabilization of Um is not observed in the curves. As occurred
with concentrated solutions of NiSO4, the formation of a precipitate layer at the anodic
side of the membrane was responsible for the gradual and prolonged increase of Um,
which in this case is more acute and reaches the magnitude of various volts. The inset
photograph of Fig. 4.27 shows the orange precipitates of Fe(III) formed at the anodic side
of the membrane. In addition, the relaxation profile of the membrane potential registered
once the application of current ceases also shows a plateau. In this case, the plateau is
smaller than that observed with NiSO4 solutions, which probably indicates that the
formation of water dissociation products is less intense than with Ni(II) solutions. In
relation to this effect, it has to be noted that at the end of the experiments the layer of
iron precipitates was removed from the membrane and it was observed that, conversely
to what occurred with the precipitates of nickel, the precipitates of iron were present not
only at the membrane surface but also inside the membrane.
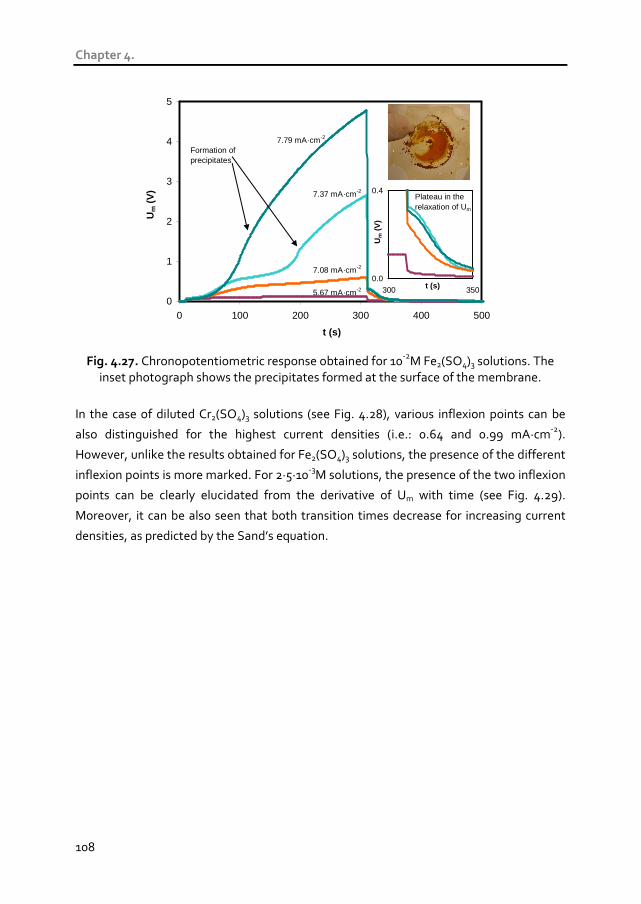
Chapter 4.
108
0
1
2
3
4
5
0 100 200 300 400 500
t (s)
Um
(V
)7.79 mA·cm-2
7.37 mA·cm-2
7.08 mA·cm-2
5.67 mA·cm-2
0.0
0.4
300 350t (s)
Um
(V
)
Plateau in the relaxation of Um
Formation of precipitates
Fig. 4.27. Chronopotentiometric response obtained for 10-2M Fe2(SO4)3 solutions. The
inset photograph shows the precipitates formed at the surface of the membrane.
In the case of diluted Cr2(SO4)3 solutions (see Fig. 4.28), various inflexion points can be
also distinguished for the highest current densities (i.e.: 0.64 and 0.99 mA·cm-2).
However, unlike the results obtained for Fe2(SO4)3 solutions, the presence of the different
inflexion points is more marked. For 2·5·10-3M solutions, the presence of the two inflexion
points can be clearly elucidated from the derivative of Um with time (see Fig. 4.29).
Moreover, it can be also seen that both transition times decrease for increasing current
densities, as predicted by the Sand’s equation.
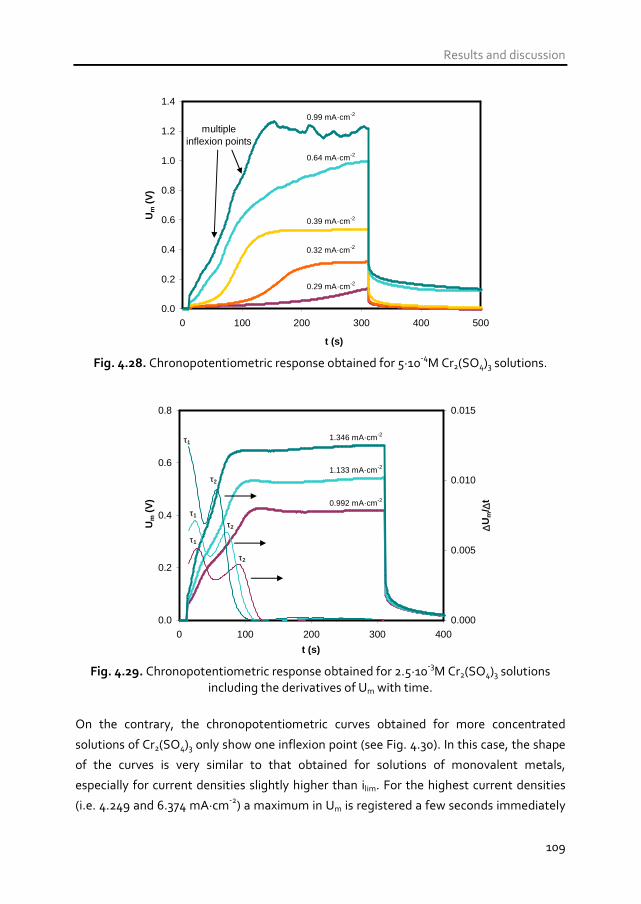
Results and discussion
109
0.0
0.2
0.4
0.6
0.8
1.0
1.2
1.4
0 100 200 300 400 500
t (s)
Um
(V
)
0.99 mA·cm-2
0.64 mA·cm-2
0.39 mA·cm-2
0.32 mA·cm-2
0.29 mA·cm-2
multiple inflexion points
Fig. 4.28. Chronopotentiometric response obtained for 5·10-4M Cr2(SO4)3 solutions.
0.0
0.2
0.4
0.6
0.8
0 100 200 300 400
t (s)
Um
(V
)
0.000
0.005
0.010
0.015
∆Um
/ ∆t
1.346 mA·cm-2
1.133 mA·cm-2
0.992 mA·cm-2
τ1
τ1
τ1
τ2
τ2
τ2
Fig. 4.29. Chronopotentiometric response obtained for 2.5·10-3M Cr2(SO4)3 solutions
including the derivatives of Um with time.
On the contrary, the chronopotentiometric curves obtained for more concentrated
solutions of Cr2(SO4)3 only show one inflexion point (see Fig. 4.30). In this case, the shape
of the curves is very similar to that obtained for solutions of monovalent metals,
especially for current densities slightly higher than ilim. For the highest current densities
(i.e. 4.249 and 6.374 mA·cm-2) a maximum in Um is registered a few seconds immediately
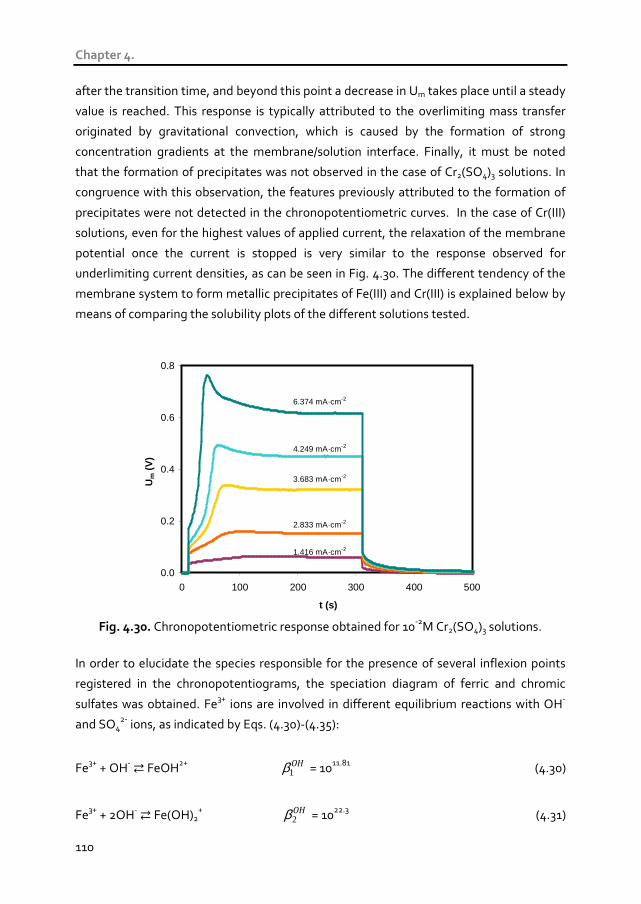
Chapter 4.
110
after the transition time, and beyond this point a decrease in Um takes place until a steady
value is reached. This response is typically attributed to the overlimiting mass transfer
originated by gravitational convection, which is caused by the formation of strong
concentration gradients at the membrane/solution interface. Finally, it must be noted
that the formation of precipitates was not observed in the case of Cr2(SO4)3 solutions. In
congruence with this observation, the features previously attributed to the formation of
precipitates were not detected in the chronopotentiometric curves. In the case of Cr(III)
solutions, even for the highest values of applied current, the relaxation of the membrane
potential once the current is stopped is very similar to the response observed for
underlimiting current densities, as can be seen in Fig. 4.30. The different tendency of the
membrane system to form metallic precipitates of Fe(III) and Cr(III) is explained below by
means of comparing the solubility plots of the different solutions tested.
0.0
0.2
0.4
0.6
0.8
0 100 200 300 400 500
t (s)
Um
(V
)
6.374 mA·cm-2
4.249 mA·cm-2
3.683 mA·cm-2
2.833 mA·cm-2
1.416 mA·cm-2
Fig. 4.30. Chronopotentiometric response obtained for 10-2M Cr2(SO4)3 solutions.
In order to elucidate the species responsible for the presence of several inflexion points
registered in the chronopotentiograms, the speciation diagram of ferric and chromic
sulfates was obtained. Fe3+ ions are involved in different equilibrium reactions with OH-
and SO42- ions, as indicated by Eqs. (4.30)-(4.35):
Fe3+ + OH- FeOH2+ OH1β = 1011.81 (4.30)
Fe3+ + 2OH- Fe(OH)2+ OH
2β = 1022.3 (4.31)
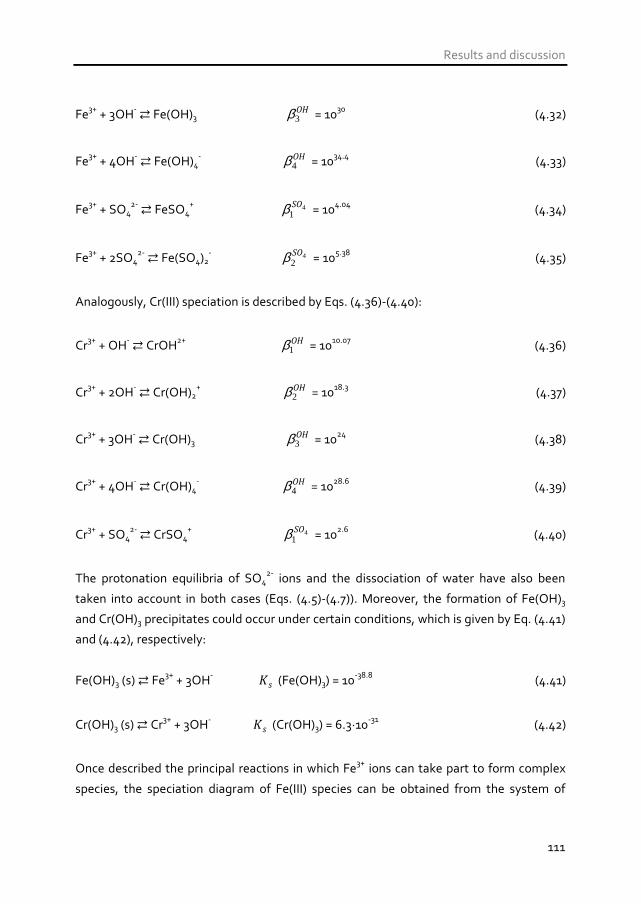
Results and discussion
111
Fe3+ + 3OH- Fe(OH)3 OH3β = 1030 (4.32)
Fe3+ + 4OH- Fe(OH)4- OH
4β = 1034.4 (4.33)
Fe3+ + SO42- FeSO4
+ 41SOβ = 104.04 (4.34)
Fe3+ + 2SO42- Fe(SO4)2
- 42SOβ = 105.38 (4.35)
Analogously, Cr(III) speciation is described by Eqs. (4.36)-(4.40):
Cr3+ + OH- CrOH2+ OH1β = 1010.07 (4.36)
Cr3+ + 2OH- Cr(OH)2+ OH
2β = 1018.3 (4.37)
Cr3+ + 3OH- Cr(OH)3 OH3β = 1024 (4.38)
Cr3+ + 4OH- Cr(OH)4- OH
4β = 1028.6 (4.39)
Cr3+ + SO42- CrSO4
+ 41SOβ = 102.6 (4.40)
The protonation equilibria of SO42- ions and the dissociation of water have also been
taken into account in both cases (Eqs. (4.5)-(4.7)). Moreover, the formation of Fe(OH)3
and Cr(OH)3 precipitates could occur under certain conditions, which is given by Eq. (4.41)
and (4.42), respectively:
Fe(OH)3 (s) Fe3+ + 3OH- sK (Fe(OH)3) = 10-38.8 (4.41)
Cr(OH)3 (s) Cr3+ + 3OH- sK (Cr(OH)3) = 6.3·10-31 (4.42)
Once described the principal reactions in which Fe3+ ions can take part to form complex
species, the speciation diagram of Fe(III) species can be obtained from the system of

Chapter 4.
112
equations formed by the mass balance of Fe(III), the mass balance of sulfates and the
proton balance indicated by Eqs. (4.43)-(4.45), respectively:
[Fe(III)]0 = [Fe3+] + [FeOH2+] + [Fe(OH)2+] + [Fe(OH)3] + [Fe(OH)4
-] + [FeSO4+] + [Fe(SO4)2
-]
(4.43)
[SO42-]0 = [SO4
2-] + [FeSO4+] + 2[Fe(SO4)2
-] + [HSO4-] + [H2SO4] (4.44)
[H+] = [OH-] + [FeOH2+] + 2[Fe(OH)2+] + 3[Fe(OH)3] + 4[Fe(OH)4
-] – [HSO4-] – 2[H2SO4]
(4.45)
Analogously, the speciation diagrams of Cr(III) species can be obtained from the system
formed by Eqs. (4.46)-(4.48):
[Cr(III)]0 = [Cr3+] + [CrOH2+] + [Cr(OH)2+] + [Cr(OH)3] + [Cr(OH)4
-] + [CrSO4+] (4.46)
[SO42-]0 = [SO4
2-] + [CrSO4+] + [HSO4
-] + [H2SO4] (4.47)
[H+] = [OH-] + [CrOH2+] + 2[Cr(OH)2+] + 3[Cr(OH)3] + 4[Cr(OH)4
-] – [HSO4-] – 2[H2SO4]
(4.48)
The speciation diagram of 5·10-4M Fe2(SO4)3 solutions is presented in Fig. 4.31(a) as a
function of pH. At the initial equilibrium conditions (indicated in the diagram by the
vertical dashed line of pHeq), at least three cationic species coexist in the electrolyte. The
ion with the highest concentration is FeSO4+, but the concentrations of Fe3+ and FeOH2+
ions are also significant. Therefore, the multiple inflexion points registered in the
chronopotentiograms of Fig. 4.25 should be due to the depletion of the different cationic
species coexisting in the electrolyte. This situation is remarkably different from the
speciation of Na2SO4 and NiSO4 solutions. In the case of Na2SO4 solutions, the complex
ion NaSO4- is negatively charged and does not compete with the Na+ ions for the
transport through the membrane. Regarding the NiSO4 solutions, only the uncharged
complex specie NiSO4 coexists with the Ni2+ ions at the initial equilibrium conditions. This
explains the fact that the elucidation of two inflection points in the chronopotentiograms
obtained for NiSO4 solutions was only observed at very high overlimiting currents, when
the change from the initial equilibrium conditions favored the formation of hydroxilated
species or the dissociation of NiSO4. On the contrary, in the case of diluted Fe2(SO4)3
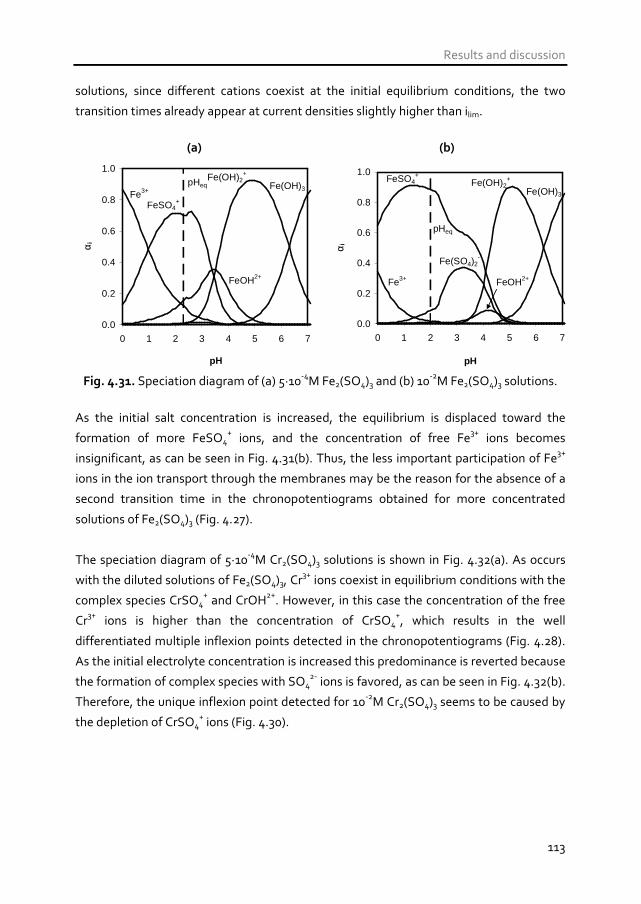
Results and discussion
113
solutions, since different cations coexist at the initial equilibrium conditions, the two
transition times already appear at current densities slightly higher than ilim.
(a) (b)
0.0
0.2
0.4
0.6
0.8
1.0
0 1 2 3 4 5 6 7
pH
α i
Fe3+
FeSO4+
Fe(OH)3
Fe(OH)2+
FeOH2+
pHeq
0.0
0.2
0.4
0.6
0.8
1.0
0 1 2 3 4 5 6 7
pH
α i
FeSO4+
Fe(OH)3
Fe(OH)2+
FeOH2+
Fe(SO4)2-
Fe3+
pHeq
Fig. 4.31. Speciation diagram of (a) 5·10-4M Fe2(SO4)3 and (b) 10-2M Fe2(SO4)3 solutions.
As the initial salt concentration is increased, the equilibrium is displaced toward the
formation of more FeSO4+ ions, and the concentration of free Fe3+ ions becomes
insignificant, as can be seen in Fig. 4.31(b). Thus, the less important participation of Fe3+
ions in the ion transport through the membranes may be the reason for the absence of a
second transition time in the chronopotentiograms obtained for more concentrated
solutions of Fe2(SO4)3 (Fig. 4.27).
The speciation diagram of 5·10-4M Cr2(SO4)3 solutions is shown in Fig. 4.32(a). As occurs
with the diluted solutions of Fe2(SO4)3, Cr3+ ions coexist in equilibrium conditions with the
complex species CrSO4+ and CrOH2+. However, in this case the concentration of the free
Cr3+ ions is higher than the concentration of CrSO4+, which results in the well
differentiated multiple inflexion points detected in the chronopotentiograms (Fig. 4.28).
As the initial electrolyte concentration is increased this predominance is reverted because
the formation of complex species with SO42- ions is favored, as can be seen in Fig. 4.32(b).
Therefore, the unique inflexion point detected for 10-2M Cr2(SO4)3 seems to be caused by
the depletion of CrSO4+ ions (Fig. 4.30).
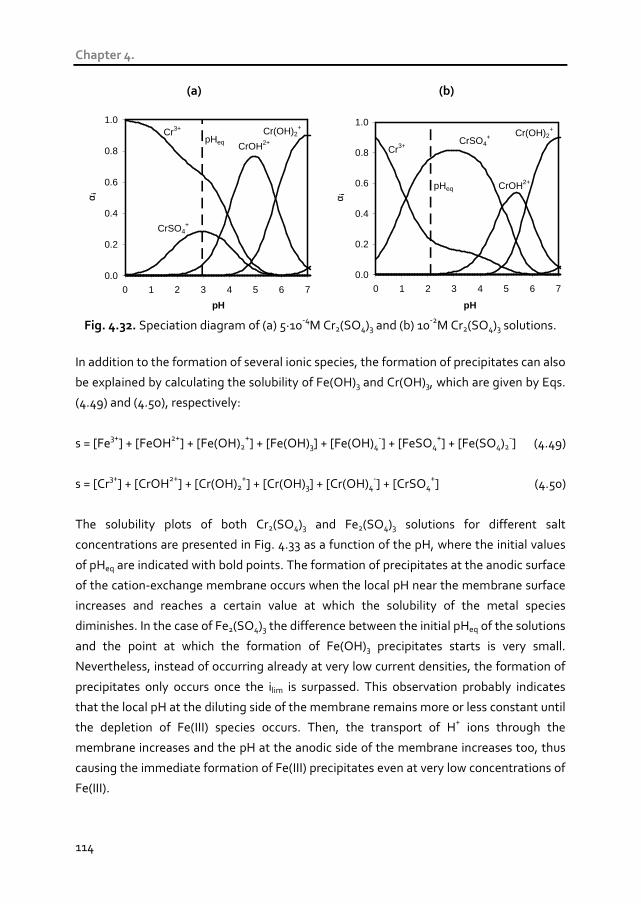
Chapter 4.
114
(a) (b)
0.0
0.2
0.4
0.6
0.8
1.0
0 1 2 3 4 5 6 7
pH
α i
CrSO4+
Cr(OH)2+
CrOH2+
Cr3+
pHeq
0.0
0.2
0.4
0.6
0.8
1.0
0 1 2 3 4 5 6 7
pH
α i
CrSO4+ Cr(OH)2
+
CrOH2+
Cr3+
pHeq
Fig. 4.32. Speciation diagram of (a) 5·10-4M Cr2(SO4)3 and (b) 10-2M Cr2(SO4)3 solutions.
In addition to the formation of several ionic species, the formation of precipitates can also
be explained by calculating the solubility of Fe(OH)3 and Cr(OH)3, which are given by Eqs.
(4.49) and (4.50), respectively:
s = [Fe3+] + [FeOH2+] + [Fe(OH)2+] + [Fe(OH)3] + [Fe(OH)4
-] + [FeSO4+] + [Fe(SO4)2
-] (4.49)
s = [Cr3+] + [CrOH2+] + [Cr(OH)2+] + [Cr(OH)3] + [Cr(OH)4
-] + [CrSO4+] (4.50)
The solubility plots of both Cr2(SO4)3 and Fe2(SO4)3 solutions for different salt
concentrations are presented in Fig. 4.33 as a function of the pH, where the initial values
of pHeq are indicated with bold points. The formation of precipitates at the anodic surface
of the cation-exchange membrane occurs when the local pH near the membrane surface
increases and reaches a certain value at which the solubility of the metal species
diminishes. In the case of Fe2(SO4)3 the difference between the initial pHeq of the solutions
and the point at which the formation of Fe(OH)3 precipitates starts is very small.
Nevertheless, instead of occurring already at very low current densities, the formation of
precipitates only occurs once the ilim is surpassed. This observation probably indicates
that the local pH at the diluting side of the membrane remains more or less constant until
the depletion of Fe(III) species occurs. Then, the transport of H+ ions through the
membrane increases and the pH at the anodic side of the membrane increases too, thus
causing the immediate formation of Fe(III) precipitates even at very low concentrations of
Fe(III).

Results and discussion
115
With regard to the formation of precipitates with the Cr2(SO4)3 solutions, Cr3+ ions also
have an important tendency to hydrolyze and the initial pHeq values of these solutions are
also acidic. However, the pH at which the solubility of Cr(III) species decreases and the
precipitation of Cr(OH)3 starts is higher than 5. This significant difference with respect to
the initial pHeq values would explain the absence of precipitates at the membrane surface
verified at the end of the experiments. Therefore, the chronopotentiometric results
obtained with Cr2(SO4)3 solutions confirm that the local pH at the anodic side of the
membrane did not increase above a pH value of 5 for all the current densities tested. In
this sense, it must be noted that the final pH was measured after all the experiments and,
in both cases (Fe2(SO4)3 and Cr2(SO4)3 solutions) it was confirmed that the pH in the
central compartment remained almost constant and very similar to the initial pHeq values.
On the contrary, we could not measure the local pH in the vicinities of the membrane due
to the characteristics of the electrochemical cell. The local pH in the vicinities of the
membrane could vary significantly with respect to the pH measured in the bulk solution,
which would be the reason for the formation of Fe(OH)3 precipitates.
1.E-09
1.E-08
1.E-07
1.E-06
1.E-05
1.E-04
1.E-03
1.E-02
1.E-01
1.E+00
0 2 4 6 8 10 12 14
pH
s (m
ol/L
)
Cr2(SO4)3 10-2 M
Cr2(SO4)3 5·10-4 M
Fe2(SO4)3 10-2 M
Fe2(SO4)3 5·10-4 M
pHeq
Fig. 4.33. Solubility plot for Cr2(SO4)3 and Fe2(SO4)3 solutions.
Finally, it must be noted that, in the case of Cr(III) and Fe(III) solutions, the speciation
diagrams indicate a higher tendency of the electrolyte solutions to form positively
charged complex species. These species compete for the ion transport through the
membranes and, unfortunately entail more inaccuracies in the calculation of the Cr3+ and

Chapter 4.
116
Fe3+ ion transport numbers by means of chronopotentiometry. Consequently, this part
has been neglected in the present section.
4.1.5.2 Current-voltage characteristics
In agreement with the chronopotentiometric results, the current-voltage curves obtained
for solutions of trivalent metals also exhibit different features depending on the type of
metal and the initial salt concentrations. The current-voltage curves obtained for diluted
solutions of Fe2(SO4)3 are presented in Fig. 4.34. The shape of the curves is analogous to
that of Na2SO4 solutions, with the presence of the three characteristic regions: the region
of quasi-ohmic behavior, the plateau, and the overlimiting region.
0.0
0.5
1.0
1.5
2.0
2.5
3.0
0.0 0.5 1.0 1.5Um (V)
i (m
A·c
m-2
)
2.5·10-3M Fe2(SO4)3
10-3M Fe2(SO4)3
5·10-4M Fe2(SO4)3
Fig. 4.34. Current-voltage curves obtained for diluted solutions of Fe2(SO4)3
However, as observed previously in the chronopotentiometric curves, the increase of the
initial concentration favors the formation of precipitates. The formation of precipitates
gives rise to extended plateaus in the current-voltage curves obtained for concentrated
solutions of Fe2(SO4)3, which are shown in Fig. 4.35. This behavior is similar to the
response obtained for concentrated solutions of NiSO4, where the formation of
precipitates also leads to long plateaus in the current-voltage curves. However, in this
case the effect is much more drastic, since the plateau tends to very high values of Um,
even implying the suppression of the overlimiting region. These results indicate that the
iron precipitates block the ionic transport through the membranes and limit the increase
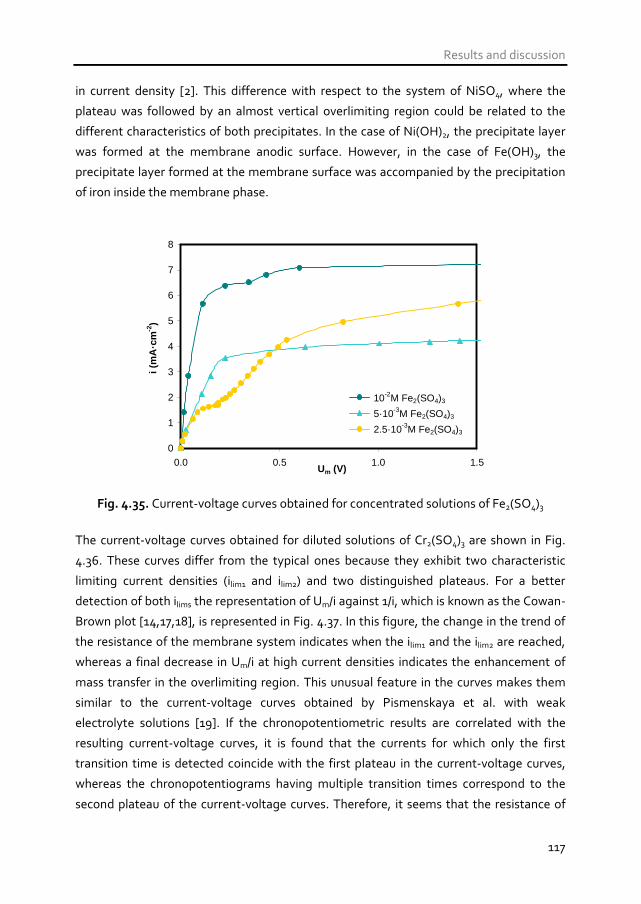
Results and discussion
117
in current density [2]. This difference with respect to the system of NiSO4, where the
plateau was followed by an almost vertical overlimiting region could be related to the
different characteristics of both precipitates. In the case of Ni(OH)2, the precipitate layer
was formed at the membrane anodic surface. However, in the case of Fe(OH)3, the
precipitate layer formed at the membrane surface was accompanied by the precipitation
of iron inside the membrane phase.
0
1
2
3
4
5
6
7
8
0.0 0.5 1.0 1.5Um (V)
i (m
A·c
m-2
)
10-2M Fe2(SO4)3
5·10-3M Fe2(SO4)3
2.5·10-3M Fe2(SO4)3
Fig. 4.35. Current-voltage curves obtained for concentrated solutions of Fe2(SO4)3
The current-voltage curves obtained for diluted solutions of Cr2(SO4)3 are shown in Fig.
4.36. These curves differ from the typical ones because they exhibit two characteristic
limiting current densities (ilim1 and ilim2) and two distinguished plateaus. For a better
detection of both ilims the representation of Um/i against 1/i, which is known as the Cowan-
Brown plot [14,17,18], is represented in Fig. 4.37. In this figure, the change in the trend of
the resistance of the membrane system indicates when the ilim1 and the ilim2 are reached,
whereas a final decrease in Um/i at high current densities indicates the enhancement of
mass transfer in the overlimiting region. This unusual feature in the curves makes them
similar to the current-voltage curves obtained by Pismenskaya et al. with weak
electrolyte solutions [19]. If the chronopotentiometric results are correlated with the
resulting current-voltage curves, it is found that the currents for which only the first
transition time is detected coincide with the first plateau in the current-voltage curves,
whereas the chronopotentiograms having multiple transition times correspond to the
second plateau of the current-voltage curves. Therefore, it seems that the resistance of
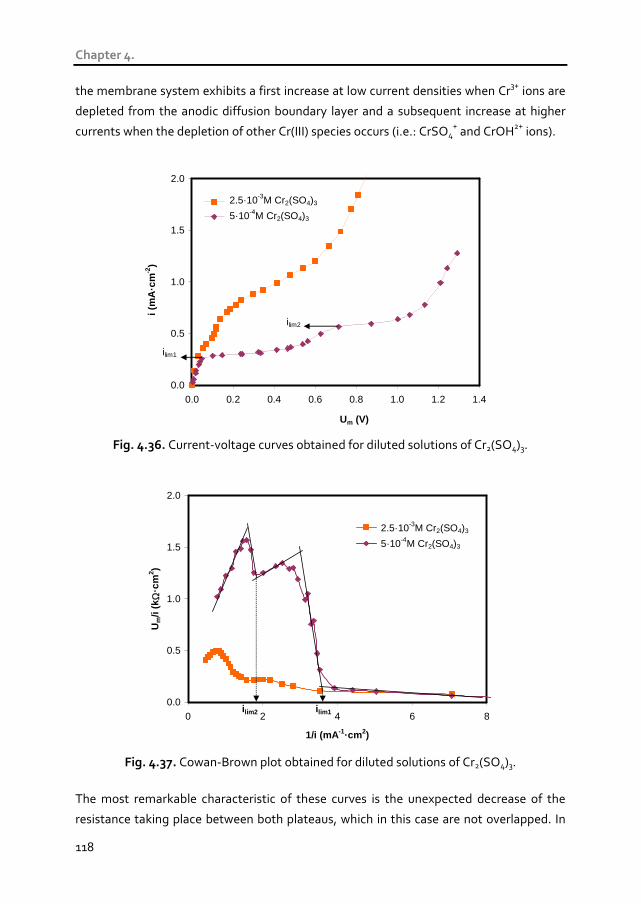
Chapter 4.
118
the membrane system exhibits a first increase at low current densities when Cr3+ ions are
depleted from the anodic diffusion boundary layer and a subsequent increase at higher
currents when the depletion of other Cr(III) species occurs (i.e.: CrSO4+ and CrOH2+ ions).
0.0
0.5
1.0
1.5
2.0
0.0 0.2 0.4 0.6 0.8 1.0 1.2 1.4
Um (V)
i (m
A·c
m-2
)
ilim1
2.5·10-3M Cr2(SO4)3
5·10-4M Cr2(SO4)3
ilim2
Fig. 4.36. Current-voltage curves obtained for diluted solutions of Cr2(SO4)3.
0.0
0.5
1.0
1.5
2.0
0 2 4 6 8
1/i (mA -1·cm2)
Um
/i (k
Ω·c
m2 )
2.5·10-3M Cr2(SO4)3
5·10-4M Cr2(SO4)3
i lim2 i lim1
Fig. 4.37. Cowan-Brown plot obtained for diluted solutions of Cr2(SO4)3.
The most remarkable characteristic of these curves is the unexpected decrease of the
resistance taking place between both plateaus, which in this case are not overlapped. In
Results and discussion
119
order to explain the membrane behavior for this range of currents where the current rises
again with Um, other processes different from the depletion of ions should be considered.
In this regard, Pismenskaya et al. also reported an anomalous increase in the electrical
conductivity of ion-exchange membranes equilibrated in ampholyte solutions with the
dilution of the membrane external solution [20,21]. This behavior was attributed to an
enrichment of the membrane pore solution in multicharged ions occurring due to the
displacement of the equilibrium conditions inside the membrane phase.
In the systems considered in the present investigation, the main charge carrier inside the
membrane phase can also change as the current is increased and the equilibrium
conditions are altered in the depleting diffusion boundary layer. At low current densities,
the membrane fixed charges should be preferentially equilibrated with Cr3+ ions
(approximately 75% of the fixed charges are associated with Cr3+ ions), as deduced from
the ion uptake equilibrium calculated in section 4.1.2.2. As the depletion of Cr3+ ions
occurs in the diffusion boundary layer, the resistance of the membrane system increases
(1st plateau) and the membrane phase becomes enriched in CrSO4+ ions. However, the
fraction of coions inside the membrane phase changes when the dilution of the diffusion
boundary layer is intensified. Due to the Donnan exclusion of coions, SO42- and OH- ions
are more effectively expelled from the membrane phase in diluted solutions. As a
consequence, the pH inside the membrane phase can be significantly lower than that of
the external solution whereas the pSO4 (-log[SO42-]) should be higher, thus promoting the
dissociation of complex species inside the membrane and leading to the enrichment of
the membrane phase in multicharged cations. In the system formed by Cr2(SO4)3
solutions, the reaction shown in Eq. (4.51) would be displaced toward the formation of
Cr3+ ions inside the membrane:
CrSO4+ Cr3+ + SO4
2- (4.51)
According to previous studies, the electrical conductivity of ion-exchange membranes
increases as the internal pore solution is enriched in multicharged ions [21]. Therefore,
the increase in the equivalent fraction of Cr3+ ions in the membrane phase would explain
the decrease of the resistance occurring between the two plateaus of the current-voltage
curves. The Cr3+ ions resulting from the reaction (4.51) would be transferred to the
cathodic compartment, whereas the sulfate anions return to the depleted diffusion
boundary layer due to the coion excluding mechanism inside the membrane. If additional
increments in the current density are applied, mass transfer limitations appear again and
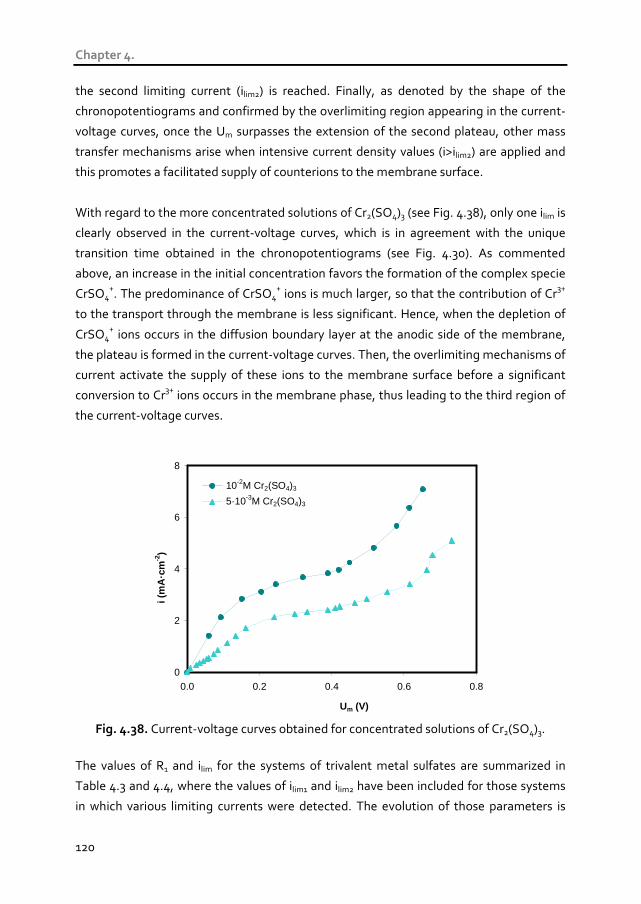
Chapter 4.
120
the second limiting current (ilim2) is reached. Finally, as denoted by the shape of the
chronopotentiograms and confirmed by the overlimiting region appearing in the current-
voltage curves, once the Um surpasses the extension of the second plateau, other mass
transfer mechanisms arise when intensive current density values (i>ilim2) are applied and
this promotes a facilitated supply of counterions to the membrane surface.
With regard to the more concentrated solutions of Cr2(SO4)3 (see Fig. 4.38), only one ilim is
clearly observed in the current-voltage curves, which is in agreement with the unique
transition time obtained in the chronopotentiograms (see Fig. 4.30). As commented
above, an increase in the initial concentration favors the formation of the complex specie
CrSO4+. The predominance of CrSO4
+ ions is much larger, so that the contribution of Cr3+
to the transport through the membrane is less significant. Hence, when the depletion of
CrSO4+ ions occurs in the diffusion boundary layer at the anodic side of the membrane,
the plateau is formed in the current-voltage curves. Then, the overlimiting mechanisms of
current activate the supply of these ions to the membrane surface before a significant
conversion to Cr3+ ions occurs in the membrane phase, thus leading to the third region of
the current-voltage curves.
0
2
4
6
8
0.0 0.2 0.4 0.6 0.8
Um (V)
i (m
A·c
m-2
)
10-2M Cr2(SO4)3
5·10-3M Cr2(SO4)3
Fig. 4.38. Current-voltage curves obtained for concentrated solutions of Cr2(SO4)3.
The values of R1 and ilim for the systems of trivalent metal sulfates are summarized in
Table 4.3 and 4.4, where the values of ilim1 and ilim2 have been included for those systems
in which various limiting currents were detected. The evolution of those parameters is
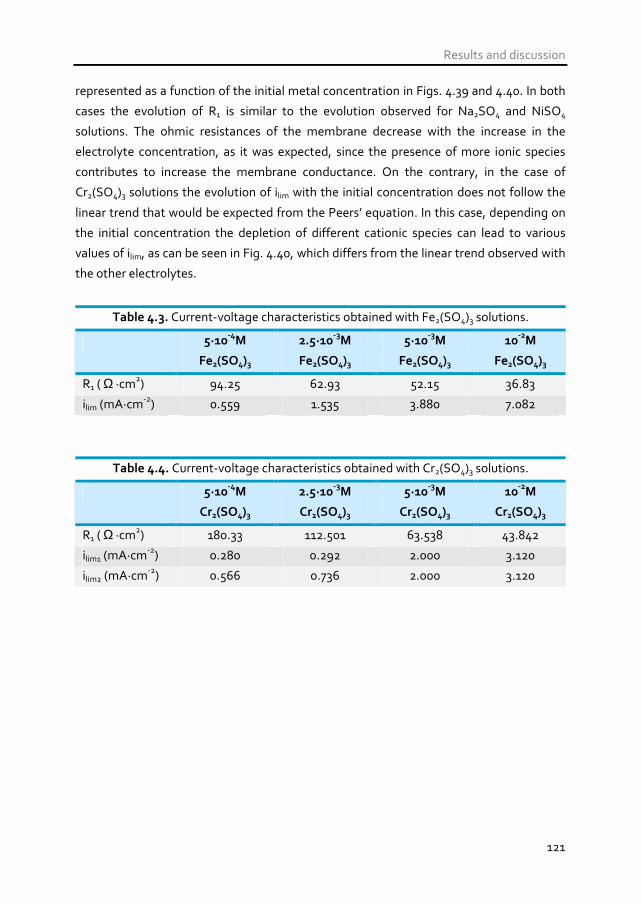
Results and discussion
121
represented as a function of the initial metal concentration in Figs. 4.39 and 4.40. In both
cases the evolution of R1 is similar to the evolution observed for Na2SO4 and NiSO4
solutions. The ohmic resistances of the membrane decrease with the increase in the
electrolyte concentration, as it was expected, since the presence of more ionic species
contributes to increase the membrane conductance. On the contrary, in the case of
Cr2(SO4)3 solutions the evolution of ilim with the initial concentration does not follow the
linear trend that would be expected from the Peers’ equation. In this case, depending on
the initial concentration the depletion of different cationic species can lead to various
values of ilim, as can be seen in Fig. 4.40, which differs from the linear trend observed with
the other electrolytes.
Table 4.3. Current-voltage characteristics obtained with Fe2(SO4)3 solutions.
5·10-4
M
Fe2(SO4)3
2.5·10-3
M
Fe2(SO4)3
5·10-3
M
Fe2(SO4)3
10-2
M
Fe2(SO4)3
R1 ( Ω ·cm2) 94.25 62.93 52.15 36.83
ilim (mA·cm-2) 0.559 1.535 3.880 7.082
Table 4.4. Current-voltage characteristics obtained with Cr2(SO4)3 solutions.
5·10-4
M
Cr2(SO4)3
2.5·10-3
M
Cr2(SO4)3
5·10-3
M
Cr2(SO4)3
10-2
M
Cr2(SO4)3
R1 ( Ω ·cm2) 180.33 112.501 63.538 43.842
ilim1 (mA·cm-2) 0.280 0.292 2.000 3.120
ilim2 (mA·cm-2) 0.566 0.736 2.000 3.120
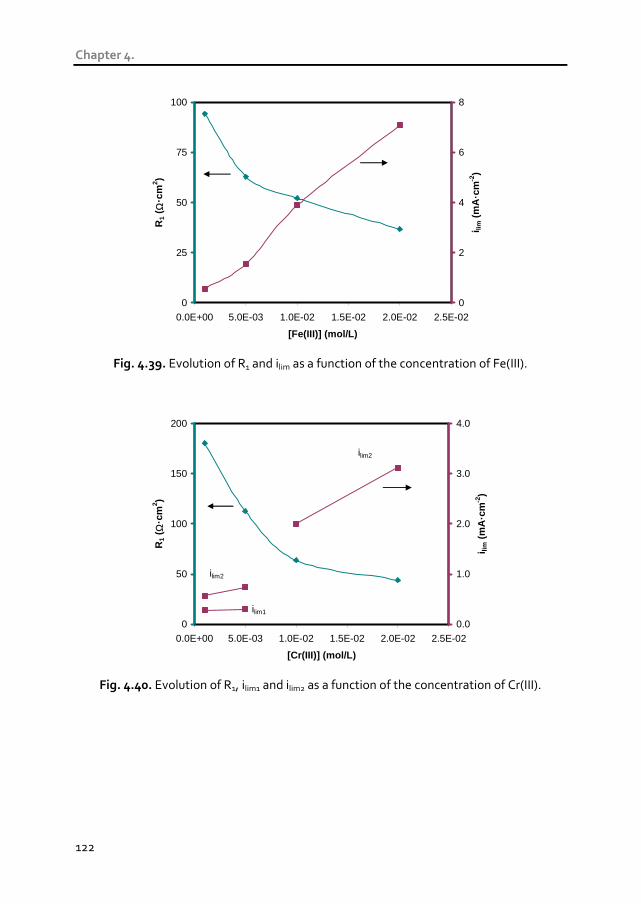
Chapter 4.
122
0
25
50
75
100
0.0E+00 5.0E-03 1.0E-02 1.5E-02 2.0E-02 2.5E-02
[Fe(III)] (mol/L)
R1
( Ω·c
m2 )
0
2
4
6
8
i lim (
mA
·cm
-2)
Fig. 4.39. Evolution of R1 and ilim as a function of the concentration of Fe(III).
0
50
100
150
200
0.0E+00 5.0E-03 1.0E-02 1.5E-02 2.0E-02 2.5E-02
[Cr(III)] (mol/L)
R1
( Ω·c
m2 )
0.0
1.0
2.0
3.0
4.0
i lim (
mA
·cm
-2)
ilim1
ilim2
ilim2
Fig. 4.40. Evolution of R1, ilim1 and ilim2 as a function of the concentration of Cr(III).
Results and discussion
123
4.1.6 Conclusions
In this chapter the transport of different metal ions through the Nafion 117 membrane has
been investigated. Since the membrane transport properties are strongly correlated with
their morphology and structural characteristics, the physical characterization of Nafion
was conducted previously. The main conclusion from the membrane morphological
characterization is described as follows:
The SEM images showed that the Nafion 117 membrane has a dense and
uniform conformation. Moreover, the fluorocarbon structure and the hydrophilic
SO3- fixed charges characteristic of the Nafion membranes have been clearly
identified in the Raman spectrum of the membrane, where the absence of other
important peaks confirms that this membrane does not possess inert binder or
polymer fillers in its structure.
After the structural characterization of Nafion, ion uptake experiments were conducted
with single salt solutions of Na2SO4, NiSO4, Fe2(SO4)3 and Cr2(SO4)3. The main conclusions
obtained from these experiments are summarized below:
The membrane absorbs a higher quantity of Na+ ions in relation to other metals
in equilibrium conditions (under the absence of an applied electric field). The
higher amount of Na+ ions inside the membrane phase with respect to other ions
can be explained by the fact that each Na+ ion is balancing the charge of one
membrane fixed ionic group, whereas the multivalent ions could be bound to
more than one membrane fixed charges.
The comparison between the theoretical ion exchange capacity of the
membranes and the concentration of ions equilibrating the membrane charges
reveal that free Na+ and Ni2+ ions are bound to the membrane fixed charges,
when the membrane is immersed in Na2SO4 and NiSO4 solutions, respectively.
On the contrary, when the membrane is immersed in Fe2(SO4)3 and Cr2(SO4)3
solutions, the concentration of multivalent metals inside the membrane phase
indicates that the membrane fixed charges are not exclusively balanced with free
Fe3+ or Cr3+ ions. In these cases, the multivalent metals could be present inside
the membrane phase also in the form of positively charged complex species,
such as FeSO4+ or CrSO4
+ ions.

Chapter 4.
124
The membrane becomes generally saturated with solution counterions, since the
concentration of metals in the membrane is independent of the equilibrating
electrolyte concentration. These results lead to very high partition coefficients at
low electrolyte concentrations.
The dynamics of the ion transport taking place through the membrane and the current-
voltage curves were also obtained for the systems formed by the Nafion 117 membrane
and different single salt solutions. The main conclusions obtained from these experiments
are summarized as follows:
The chronopotentiometric and current-voltage curves obtained for solutions of
Na2SO4 are the typical ones obtained in previous studies with monovalent ions.
The speciation diagrams of Na2SO4 solutions revealed that Na+ ions are the
predominant cationic species in the solutions, since Na2SO4 is a strong
electrolyte. The current-voltage curves showed the three characteristic regions
of membrane behavior: the quasi-ohmic region, the plateau formed when the
concentration of Na+ ions vanishes at the membrane depleting surface, and the
overlimiting region with enhanced supply of ions to the membrane. As
expected, the R1 values decrease with an increase of the electrolyte
concentration, since a higher amount of mobile ionic species are present in the
diffusion boundary layers. On the contrary, the ilim values increased linearly with
the salt concentration, as predicted by the Peers’ equation. The TNa+ values also
indicate that the cationic selectivity of the membrane immersed in single salt
solutions is high, since TNa+ values close to 0.9 were obtained.
The chronopotentiometric curves obtained for NiSO4 solutions are different
from the typical ones obtained with Na2SO4. At low concentrations of NiSO4
(10-3M), the chronopotentiometric response obtained at high overlimiting
currents shows two different increments in Um with their related inflexion
points. The first inflexion point is attributed to the depletion of Ni2+ ions from
the anodic membrane surface when the ilim is reached and the supply of
counterions to the membrane is set under diffusion control. Once the ilim is
surpassed, the transport of H+ ions through the membrane contributes to
increase the local pH of the diffusion boundary layer, thus promoting the
formation of NiOH+ ions. Moreover, the dissociation of the complex species
NiSO4 could also take place. Therefore, the second inflexion point can be related

Results and discussion
125
to the subsequent depletion of the cationic species generated at higher current
densities (NiOH+ and Ni2+ ions).
In the case of concentrated solutions of NiSO4 (10-2M and 2·10-2M), the
formation of a precipitate layer of Ni(OH)2 at the anodic membrane surface
takes place when the ilim is surpassed. This phenomenon was visualized at the
end of the experiments and was also related to the observation of different
chronopotentiometric features. A gradual increase in the membrane resistance
takes place when the precipitates are formed and also a slower relaxation of the
membrane potential occurs when the current is stopped. The formation of
precipitates is promoted by the increase in the pH at the depleting diffusion
boundary layer as a consequence of the application of high overlimiting
currents. Once the precipitates are formed, the development of a quasi-bipolar
membrane structure by the precipitate/membrane system favors the
dissociation of water. The slower relaxation of Um with time once the current is
switched off, which is a feature typical of bipolar membranes, seems to be
caused by the hindered recombination of the water dissociation products.
The selectivity of the membrane is also high in the case of single salt solutions of
NiSO4, since the TNi2+ values are higher than 0.85 for all the salt concentrations.
The slight decrease of TNi2+ observed for the highest concentrations of NiSO4
could be attributed to a weaker Donnan exclusion for coions occurring at high
concentrations.
The current-voltage curves obtained with diluted NiSO4 solutions have the three
typical regions of membrane behavior. On the contrary, the curves obtained for
those concentrations at which the formation of precipitates occurs show an
extended plateau. Moreover, at overlimiting currents, the dissociation of water
catalyzed by the Ni(OH)2 precipitates implies an almost vertical increase of the
current density. The trend of R1 and ilim with the initial electrolyte concentration
is analogous to that observed in the case of Na2SO4 solutions.
The speciation diagrams of diluted Fe2(SO4)3 and Cr2(SO4)3 solutions reveal the
coexistence at the initial equilibrium conditions of various positively charged
species. The successive depletion of each of these species at increasing current
densities is elucidated from the observation of several transition times in the
Chapter 4.
126
chronopotentiometric curves. In the case of Cr2(SO4)3 this phenomenon is more
clear, since two different ilim values were detected in the current-voltage curves
(ilim1 and ilim2). Moreover, in this case an unexpected decrease of the resistance of
the membrane system is observed between ilim1 and ilim2, which is probably
caused by the dissociation of CrSO4+ ions and the subsequent enrichment of the
membrane phase in multicharged ions (Cr3+ ions).
Analogously to what occurred with concentrated NiSO4 solutions, the formation
of Fe(OH)3 precipitates at the anodic side of the membranes also occurred with
concentrations of Fe2(SO4)3 higher than 2.5·10-3M. However, these precipitates
were formed not only at the membrane surface but also inside the inner
membrane phase, which leads to the subsequent blockage of the ionic transport
through the membrane and to extended plateaus in the current-voltage curves.
Results and discussion
127
4.2 Competitive transport of metal ions present in
multicomponent mixture solutions through
cation-exchange membranes
4.2.1 Introduction
In traditional applications of ion-exchange membranes, such as the desalination of
brackish water or the chlor-alkali industry, the electrolyte solutions usually contain one
cation with a predominant concentration over that of other counterions [14,22].
Moreover, the utilization of membranes with binary cation systems is of major
importance in emerging applications of electromembrane processes, such as the
treatment of metal containing wastewaters. In this regard, the behavior of ion-exchange
membranes can be severely affected by the electrolyte composition. For example, Okada
et al. found out that the contamination of fuel cell membranes by impurity cations
resulted in a decrease of their ionic conductivity [23]. In other cases it is important to
avoid the permeation of specific ions through the membranes; as occurs with the
vanadium redox flow batteries, where the transport of H+ ions is desired but the
vanadium crossover leads to a decrease of the coulombic efficiency of the batteries [24].
The competitive ion transport through ion-exchange membranes is also a fundamental
aspect in the treatment of industrial effluents by electrodialysis. In certain situations it is
interesting to promote the transport of the most valuable metal in order to obtain a
product of high purity that could result in an added-value resource [13,25]. In other cases,
the recovery of spent acids is the main objective of the treatment process and the
transport of H+ ions is desired over that of other metallic cations [26-29]. On the contrary,
the general desalination of the effluent is preferred when the reclamation of large
volumes of water is wanted [30,31]. However, in all these cases the competitive ion
transport is accompanied by the formation of concentration gradients at the
membrane/electrolyte interfaces. The concentration polarization phenomena can
significantly affect both the selectivity and the electrical resistance of the membranes,
thus determining also the energy consumption of the electrodialysis operations.
Therefore, achieving a better understanding of the mass transport processes that
determine the behavior of ion-exchange membranes in multicomponent mixtures is
fundamental in order to develop electromembrane processes with optimal performances.
Chapter 4.
128
In this section (4.2), the competitive ion transport through the Nafion 117 cation-
exchange membrane is investigated. Given the diversity of industrial wastewaters that
can be treated by means of electrodialysis, two different practical cases have been
considered:
The first practical case considered is the treatment of spent rinse waters of nickel
and chromium plating industries. These waters contain Ni(II) in the form of
cationic impurities, which is considered a toxic pollutant, and may cause several
health and environmental problems when discharged into natural watercourses
[32]. Moreover, the spent rinse waters of the chromium electroplating industry
contain important concentrations of Cr(VI), which has toxic and carcinogenic
effects on different organs of the human body [33]. Basically, the composition of
these effluents is characterized by the presence of metallic impurities in acidic
solutions. As investigated in the previous chapter, the transport of multivalent
Ni2+ ions through cation-exchange membranes presents some peculiar
characteristics. Besides, H+ ions are also reported to have special transport
properties, since they can be transported via the successive proton exchange
between neighboring water molecules (Grotthuss mechanism [34]) and their
mobility is 5-8 times larger than that of other ions [35]. Therefore, the study of
the competitive ion transport between H+ and Ni2+ is interesting due to its
potential application to the treatment of industrial wastewaters, and also as a
fundamental aspect in the field of the membrane science.
The second practical case considered is the treatment of acid mine drainage
generated in coal mining sites. These solutions are composed of a mixture of
several metallic cations in sulfuric acid media. Sometimes the recovery of
precious metals is interesting from an economical point of view [36]. But in
general, the treatment of acid mine drainage solutions is beneficial for the
environment because these effluents imply potential hazards for natural
watercourses. For this study we have selected an acid mine drainage generated
in a coal extracting site, which contains Fe(III) and Na(I) as the main cationic
contaminants. This study allows us to investigate the competitive ion transport
between metal ions with different characteristics. On the one hand, Na+ is an
alkali monovalent ion and has large diffusion coefficients and a small size. On the
other hand, Fe3+ is a multivalent heavy metal ion and can give rise to the
formation of several complex species of varying transport properties.
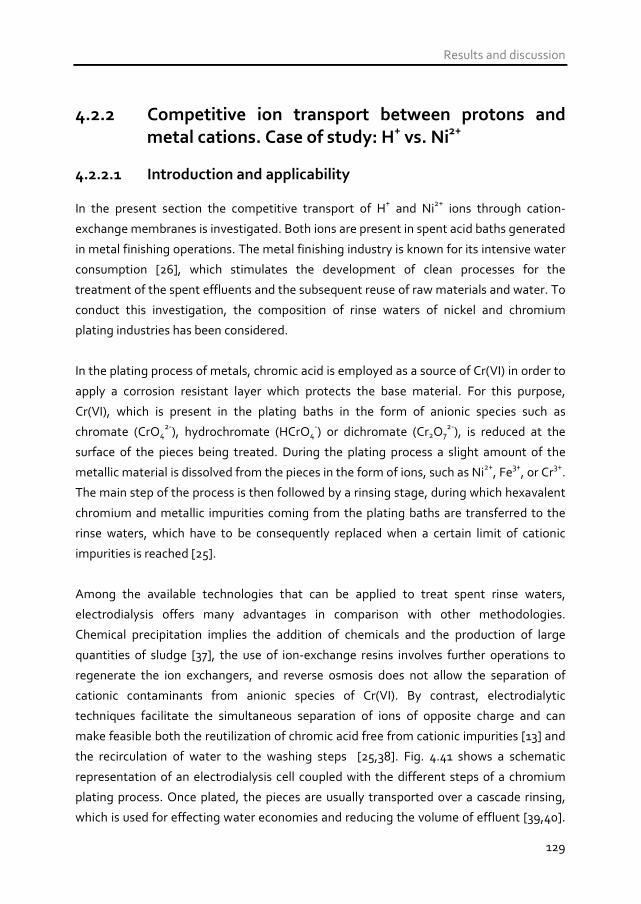
Results and discussion
129
4.2.2 Competitive ion transport between protons and
metal cations. Case of study: H+ vs. Ni2+
4.2.2.1 Introduction and applicability In the present section the competitive transport of H+ and Ni2+ ions through cation-
exchange membranes is investigated. Both ions are present in spent acid baths generated
in metal finishing operations. The metal finishing industry is known for its intensive water
consumption [26], which stimulates the development of clean processes for the
treatment of the spent effluents and the subsequent reuse of raw materials and water. To
conduct this investigation, the composition of rinse waters of nickel and chromium
plating industries has been considered.
In the plating process of metals, chromic acid is employed as a source of Cr(VI) in order to
apply a corrosion resistant layer which protects the base material. For this purpose,
Cr(VI), which is present in the plating baths in the form of anionic species such as
chromate (CrO42-), hydrochromate (HCrO4
-) or dichromate (Cr2O72-), is reduced at the
surface of the pieces being treated. During the plating process a slight amount of the
metallic material is dissolved from the pieces in the form of ions, such as Ni2+, Fe3+, or Cr3+.
The main step of the process is then followed by a rinsing stage, during which hexavalent
chromium and metallic impurities coming from the plating baths are transferred to the
rinse waters, which have to be consequently replaced when a certain limit of cationic
impurities is reached [25].
Among the available technologies that can be applied to treat spent rinse waters,
electrodialysis offers many advantages in comparison with other methodologies.
Chemical precipitation implies the addition of chemicals and the production of large
quantities of sludge [37], the use of ion-exchange resins involves further operations to
regenerate the ion exchangers, and reverse osmosis does not allow the separation of
cationic contaminants from anionic species of Cr(VI). By contrast, electrodialytic
techniques facilitate the simultaneous separation of ions of opposite charge and can
make feasible both the reutilization of chromic acid free from cationic impurities [13] and
the recirculation of water to the washing steps [25,38]. Fig. 4.41 shows a schematic
representation of an electrodialysis cell coupled with the different steps of a chromium
plating process. Once plated, the pieces are usually transported over a cascade rinsing,
which is used for effecting water economies and reducing the volume of effluent [39,40].
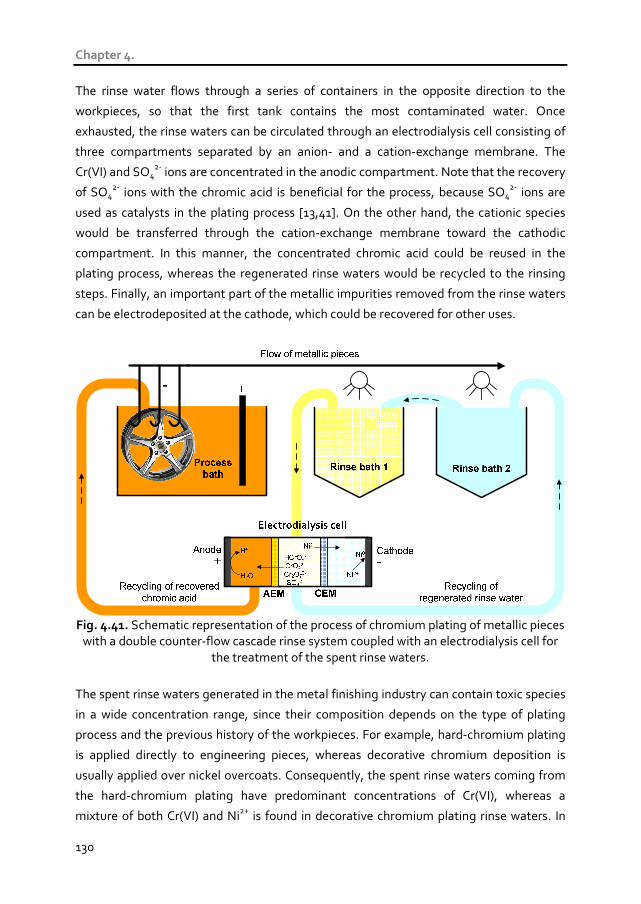
Chapter 4.
130
The rinse water flows through a series of containers in the opposite direction to the
workpieces, so that the first tank contains the most contaminated water. Once
exhausted, the rinse waters can be circulated through an electrodialysis cell consisting of
three compartments separated by an anion- and a cation-exchange membrane. The
Cr(VI) and SO42- ions are concentrated in the anodic compartment. Note that the recovery
of SO42- ions with the chromic acid is beneficial for the process, because SO4
2- ions are
used as catalysts in the plating process [13,41]. On the other hand, the cationic species
would be transferred through the cation-exchange membrane toward the cathodic
compartment. In this manner, the concentrated chromic acid could be reused in the
plating process, whereas the regenerated rinse waters would be recycled to the rinsing
steps. Finally, an important part of the metallic impurities removed from the rinse waters
can be electrodeposited at the cathode, which could be recovered for other uses.
Fig. 4.41. Schematic representation of the process of chromium plating of metallic pieces
with a double counter-flow cascade rinse system coupled with an electrodialysis cell for the treatment of the spent rinse waters.
The spent rinse waters generated in the metal finishing industry can contain toxic species
in a wide concentration range, since their composition depends on the type of plating
process and the previous history of the workpieces. For example, hard-chromium plating
is applied directly to engineering pieces, whereas decorative chromium deposition is
usually applied over nickel overcoats. Consequently, the spent rinse waters coming from
the hard-chromium plating have predominant concentrations of Cr(VI), whereas a
mixture of both Cr(VI) and Ni2+ is found in decorative chromium plating rinse waters. In

Results and discussion
131
the case of nickel electroless plating, the presence of Ni2+ ions is much more significant. In
Table 4.5 typical concentrations of spent rinse waters obtained from the literature are
summarized.
Table 4.5. Typical concentrations of Cr(VI) and Ni(II) of spent rinse waters of chromium and nickel plating industries.
Cr(VI) Ni(II) pH Finishing process Reference
10-1M 10-2M 1.2 Chromium plating rinsing solution
(synthetic) [42]
1.26·10-2M 7.32·10-4M - Chromium plating rinsing solution
(industrial effluent) [43]
4.81·10-3 –
9.62·10-3M - -
Chromium plating rinsing solution
(reference values coming from
multiple cascade rinse system)
[40]
- 3.41·10-2M 2-6 Nickel plating rinsing solution
(synthetic) [44]
- 6.89·10-4M 5.2 Nickel plating rinsing solution
(synthetic) [45]
- 1.70·10-3 –
3.41·10-3M -
Nickel plating rinsing solution
(reference values coming from
multiple cascade rinse system)
[40]
As commented above, the range of concentrations of both Ni(II) and Cr(VI) is wide and
depends on the type of management of rinsing waters applied in each industry.
Accordingly, we aim at performing a study covering a broad range of concentrations in
order to evaluate the effect of the electrolyte composition on the competing transport of
Ni2+ and H+ ions through cation-exchange membranes. Mixtures with concentrations of
NiSO4 ranging from 5·10-4M to 10-2M and concentrations of CrO3 ranging from 0M to
10-2M were considered for the present study. The combination of concentrations was
indicated previously in more detail in Table 3.3 of the previous chapter.
4.2.2.2 Ion sorption experiments As already performed with the single salt solutions (section 4.1), ion sorption experiments
were also conducted with the mixtures of NiSO4 and CrO3. Fig. 4.42 shows the
concentration of Ni2+ ions in the membrane phase in equilibrium conditions ( mc ,
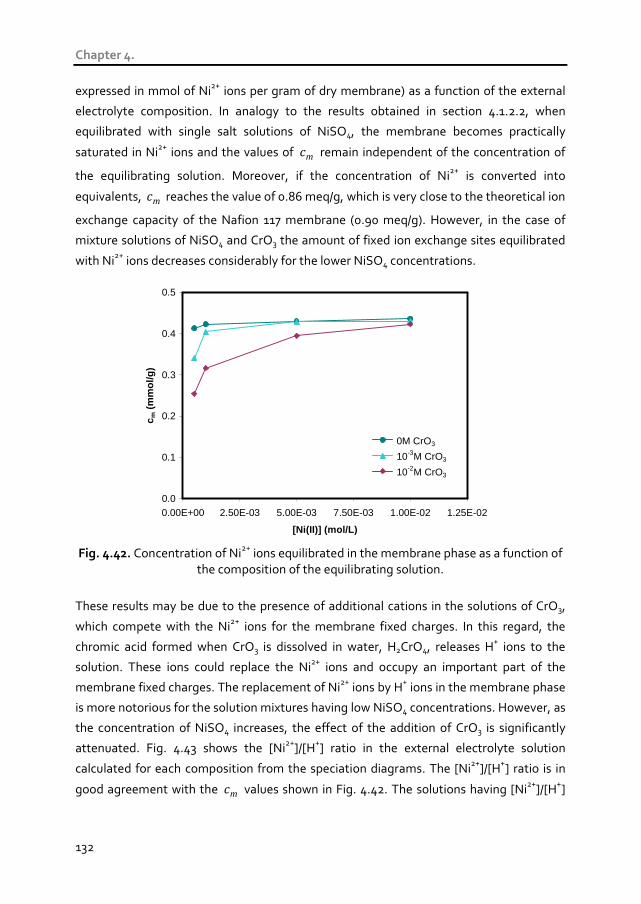
Chapter 4.
132
expressed in mmol of Ni2+ ions per gram of dry membrane) as a function of the external
electrolyte composition. In analogy to the results obtained in section 4.1.2.2, when
equilibrated with single salt solutions of NiSO4, the membrane becomes practically
saturated in Ni2+ ions and the values of mc remain independent of the concentration of
the equilibrating solution. Moreover, if the concentration of Ni2+ is converted into
equivalents, mc reaches the value of 0.86 meq/g, which is very close to the theoretical ion
exchange capacity of the Nafion 117 membrane (0.90 meq/g). However, in the case of
mixture solutions of NiSO4 and CrO3 the amount of fixed ion exchange sites equilibrated
with Ni2+ ions decreases considerably for the lower NiSO4 concentrations.
0.0
0.1
0.2
0.3
0.4
0.5
0.00E+00 2.50E-03 5.00E-03 7.50E-03 1.00E-02 1.25E-02
[Ni(II)] (mol/L)
c m (
mm
ol/g
)
0M CrO3
10-3M CrO3
10-2M CrO3
Fig. 4.42. Concentration of Ni2+ ions equilibrated in the membrane phase as a function of
the composition of the equilibrating solution.
These results may be due to the presence of additional cations in the solutions of CrO3,
which compete with the Ni2+ ions for the membrane fixed charges. In this regard, the
chromic acid formed when CrO3 is dissolved in water, H2CrO4, releases H+ ions to the
solution. These ions could replace the Ni2+ ions and occupy an important part of the
membrane fixed charges. The replacement of Ni2+ ions by H+ ions in the membrane phase
is more notorious for the solution mixtures having low NiSO4 concentrations. However, as
the concentration of NiSO4 increases, the effect of the addition of CrO3 is significantly
attenuated. Fig. 4.43 shows the [Ni2+]/[H+] ratio in the external electrolyte solution
calculated for each composition from the speciation diagrams. The [Ni2+]/[H+] ratio is in
good agreement with the mc values shown in Fig. 4.42. The solutions having [Ni2+]/[H+]

Results and discussion
133
values below 1 correspond approximately to the mc values that are below 0.4
mmol Ni(II)/g in Fig. 4.42.
0.01
0.10
1.00
10.00
100.00
1000.00
10000.00
0.00E+00 2.50E-03 5.00E-03 7.50E-03 1.00E-02 1.25E-02
[Ni(II)] (mol/L)
[Ni2+
]/[H
+ ]
0M CrO3
10-3M CrO3
10-2M CrO3
Fig. 4.43. Values of the [Ni2+]/[H+] ratio in the electrolyte solution as a function of the
composition of the mixtures of NiSO4 and CrO3.
Since the ion exchange capacity of the Nafion membrane is directly associated with the
number of fixed sulfonate groups attached to the polymer backbone, we can assume that
it remains invariable and independent of the composition of the external electrolyte.
Based on this assumption, the fixed charges of the membrane can be bound either to Ni2+
or to H+ ions, as these are the main counterions present in the mixtures of NiSO4 and
CrO3. Therefore, we can estimate the number of fixed ion exchange sites equilibrated
with H+ ions from the difference between the ion exchange capacity of the membranes
and the values of mc obtained for the Ni2+ ions. By using this approach, the proportion of
membrane fixed charges occupied by Ni2+ and H+ ions was obtained for each electrolyte
composition (see Fig. 4.44). As already discussed, for the solutions without CrO3 the
membrane practically becomes saturated in Ni2+ ions, and the fraction of fixed charges
bound to H+ ions increases gradually with the content of CrO3. However, it must be
pointed out, that in all cases the membrane absorbs preferentially Ni2+ ions, even for
concentrations of CrO3 exceeding that of NiSO4. These results are in agreement with
previous studies dealing with the absorption equilibrium of cation-exchange membranes
in mixtures of acids and metals [46-48]. More specifically, several authors obtained
similar results in different cation-exchange membranes equilibrated in electrolyte

Chapter 4.
134
systems of H+/Ni2+ ions [23,49]. The higher preference of cation-exchange membranes for
multivalent ions has been usually attributed to the larger electrostatic attraction between
multivalent ions and the fixed ion exchange sites of opposite polarity [46,47].
0%
25%
50%
75%
100%
Electrolyte composition
Fra
ctio
n of
mem
bran
efix
ed c
harg
es
10-3M CrO3 10-2M CrO30M CrO3
5·10
-4M
NiS
O4
5·10
-4M
NiS
O4
5·10
-4M
NiS
O4
5·10
-3M
NiS
O4
5·10
-3M
NiS
O4
5·10
-3M
NiS
O4
H+
Ni2+
10-3
M N
iSO
4
10-3
M N
iSO
4
10-3
M N
iSO
4
10-2
M N
iSO
4
10-2
M N
iSO
4
10-2
M N
iSO
4
Fig. 4.44. Fraction of membrane fixed charges equilibrated with each ion (Ni2+ or H+)
present in the different electrolyte compositions tested.
4.2.2.3 Chronopotentiometric response
The effect of the addition of CrO3 to the NiSO4 solutions on the ion transport through the
Nafion 117 membrane can be analyzed from the comparison of the chronopotentiograms
obtained for mixture solutions and those obtained for single salt solutions of NiSO4
(presented in section 4.1). The chronopotentiometric response obtained for the mixtures
of 10-3M NiSO4 and 10-3M CrO3 is shown in Fig. 4.45. The curves present a shape similar to
that obtained for 10-3M NiSO4. At low values of current density (i.e.: 0.21 mA·cm-2) the
increase of Um with time is moderate but, when the ilim is surpassed (i ≥ 0.27 mA·cm-2) the
chronopotentiograms exhibit the steep increase of Um associated with the depletion of
Ni2+ ions. Then, the subsequent evolution of Um until the steady state is reached is
different depending on the current density. As observed for the single salt solutions of
NiSO4, at current densities moderately higher than the ilim the evolution of Um for times
larger than the transition time is almost flat; whereas at very high current densities, the

Results and discussion
135
curves present fluctuations related to the destabilizing effect of electroconvection on the
diffusion boundary layers.
Despite the similarities observed between the curves obtained for the mixtures with
10-3M CrO3 and the curves corresponding to single salt solutions of NiSO4, it must be said
that the current densities at which each chronopotentiometric feature is detected is
significantly higher for the mixture solutions. For example, the curve obtained at 0.21
mA·cm-2 in Fig. 4.45 clearly corresponds to the quasi-ohmic regime of currents, whereas
the same current density would belong to the overlimiting regime of currents for 10-3M
NiSO4 (see Fig. 4.16). Therefore, the addition of CrO3 promotes a delay in the
development of the concentration polarization phenomena related to the depletion of
Ni2+ ions. This influence may be due to the presence of H+ ions released by the chromic
acid, which act as additional charge carriers and compete with the Ni2+ ions for the
transport through the membranes. Specifically, the pH values measured for 10-3M CrO3
solutions are approximately 3, which confirms that the H+ ions may be the main cationic
species competing with the Ni2+ ions for the transport through the membrane.
Nevertheless, the formation of other ionic species due to the addition of CrO3 is also
considered and discussed below.
0.0
0.2
0.4
0.6
0.8
1.0
1.2
0 100 200 300 400 500
t (s)
Um
(V
)
0.99 mA·cm-2
0.64 mA·cm-2
0.34 mA·cm-2
0.30 mA·cm-2
0.27 mA·cm-2
0.21 mA·cm-2
Electroconvective vortices
Fig. 4.45. Chronopotentiometric response obtained for mixtures of 10-3M NiSO4 and
10-3M CrO3.

Chapter 4.
136
Fig. 4.46 shows the curves obtained for the mixtures of 10-2M NiSO4 and 10-3M CrO3. For a
constant CrO3 concentration of 10-3M, the effect of increasing the concentration of NiSO4
is also similar to that observed for the single salt solutions. The chronopotentiograms
corresponding to high overlimiting currents present a second increase in Um at times
higher than the transition time. Moreover, these curves also exhibit a slow restoration of
the membrane potential once the current ceases. As occurred with the 10-2M NiSO4
solutions, the formation of precipitates at the depleting membrane surface induces an
increase in the electrical resistance of the membrane system, which is responsible for the
continuous increase in Um observed in the curves. The inset photograph of Fig. 4.46
shows the precipitate formed at the membrane surface. The texture of this precipitate is
the same as that of Ni(OH)2 (Fig. 4.17), however, it has the characteristic color of chromic
acid solutions. Since the metallic hydroxides catalyze the dissociation of water, the
hindered transport of H+ and OH- ions through the precipitate layer and their slower
recombination in the diffusion boundary layers originates the plateau observed in the
relaxation of Um.
With regard to the magnitude of currents at which the different chronopotentiometric
characteristics are registered, in this case the effect of the addition of chromic acid is not
as important as with more diluted solutions of NiSO4. For 10-2M NiSO4 solutions, the
addition of 10-3M CrO3 increases very slightly the values of current density at which the
transition times and the formation of precipitates were detected. This could be caused by
the fact that in this case the concentration of NiSO4 is higher than the concentration of
CrO3.

Results and discussion
137
0.0
0.2
0.4
0.6
0.8
1.0
1.2
0 100 200 300 400 500
t (s)
Um
(V
)
3.12 mA·cm-2
2.83 mA·cm-2
2.55 mA·cm-2
2.27 mA·cm-2
1.35 mA·cm-2
1.16 mA·cm-2
Formation of precipitates
Plateau in the relaxation of Um
Fig. 4.46. Chronopotentiometric response obtained for mixtures of 10-2M NiSO4 and 10-3M CrO3. The inset photograph shows the precipitates formed at the surface of the
membrane.
A further increase in the concentration of CrO3 has similar effects at both low and high
concentrations of NiSO4, as can be seen in Figs. 4.47 and 4.48. The current densities at
which the depletion of ions and the overlimiting features appear are significantly higher
for the mixture solutions than for the single salt solutions of NiSO4. The competence
between H+ and Ni2+ ions in 10-2M CrO3 solutions is stronger, because the pH is more
acidic (pH ≈ 2). Moreover, in this case the formation of precipitates was not observed
during the experiments and neither detected in the chronopotentiometric curves, since,
as shown in Fig. 4.47 and 4.48, the curves do not exhibit the continuous increase in Um
and the slow restoration of the membrane potential related to this phenomenon.

Chapter 4.
138
0.0
0.2
0.4
0.6
0.8
1.0
1.2
0 100 200 300 400 500
t (s)
Um
(V
)
8.50 mA·cm-2
5.38 mA·cm-2
4.25 mA·cm-2
3.82 mA·cm-2
3.54 mA·cm-2
2.83 mA·cm-2
Relaxation of the membrane potential
Electroconvective vortices
Fig. 4.47. Chronopotentiometric response obtained for mixtures of 10-3M NiSO4 and
10-2M CrO3.
0.0
0.2
0.4
0.6
0.8
1.0
1.2
0 100 200 300 400 500
t (s)
Um
(V
)
12.75 mA·cm-2
8.50 mA·cm-2
7.08 mA·cm-2
5.38 mA·cm-2
4.67 mA·cm-2
3.82 mA·cm-2
Fig. 4.48. Chronopotentiometric response obtained for mixtures of 10-2M NiSO4 and
10-2M CrO3.
In order to correlate the different chronopotentiometric responses with the ionic
composition of the mixtures of CrO3 and NiSO4, the concentrations in equilibrium
conditions of each ionic species were calculated. The reactions of formation of Ni(II)
complex species are the same as those used in section 4.1 (Eqs. (4.18)-(4.24)). However,
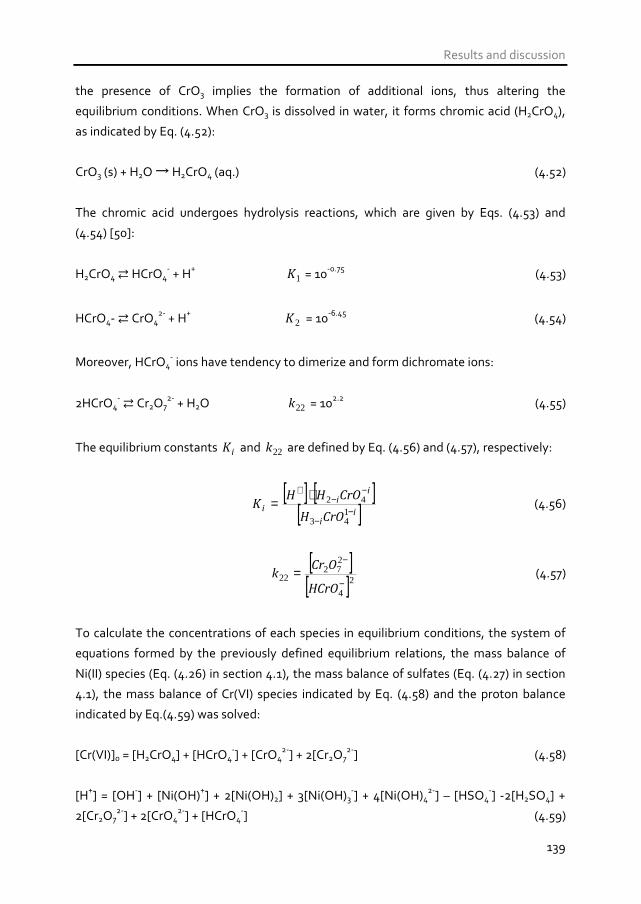
Results and discussion
139
the presence of CrO3 implies the formation of additional ions, thus altering the
equilibrium conditions. When CrO3 is dissolved in water, it forms chromic acid (H2CrO4),
as indicated by Eq. (4.52):
CrO3 (s) + H2O → H2CrO4 (aq.) (4.52)
The chromic acid undergoes hydrolysis reactions, which are given by Eqs. (4.53) and
(4.54) [50]:
H2CrO4 HCrO4- + H+ 1K = 10-0.75 (4.53)
HCrO4- CrO42- + H+ 2K = 10-6.45 (4.54)
Moreover, HCrO4- ions have tendency to dimerize and form dichromate ions:
2HCrO4- Cr2O7
2- + H2O 22k = 102.2 (4.55)
The equilibrium constants iK and 22k are defined by Eq. (4.56) and (4.57), respectively:
[ ] [ ]
[ ]ii
ii
iCrOH
CrOHHK
−−
−−
+ ⋅=143
42 (4.56)
[ ]
[ ]24
272
22 −
−=
HCrO
OCrk (4.57)
To calculate the concentrations of each species in equilibrium conditions, the system of
equations formed by the previously defined equilibrium relations, the mass balance of
Ni(II) species (Eq. (4.26) in section 4.1), the mass balance of sulfates (Eq. (4.27) in section
4.1), the mass balance of Cr(VI) species indicated by Eq. (4.58) and the proton balance
indicated by Eq.(4.59) was solved:
[Cr(VI)]0 = [H2CrO4] + [HCrO4-] + [CrO4
2-] + 2[Cr2O72-] (4.58)
[H+] = [OH-] + [Ni(OH)+] + 2[Ni(OH)2] + 3[Ni(OH)3-] + 4[Ni(OH)4
2-] – [HSO4-] -2[H2SO4] +
2[Cr2O72-] + 2[CrO4
2-] + [HCrO4-] (4.59)

Chapter 4.
140
The speciation of Cr(VI) species is presented in Fig. 4.49. We can see that the addition of
CrO3 implies an acidification of the electrolyte (pHeq≈2-3). For an initial concentration of
10-3M CrO3 the predominant species are HCrO4- ions, whereas an increase in the
concentration of CrO3 favors the formation of Cr2O72- ions. However, all the ionic species
of Cr(VI) are anionic and, therefore, do not compete with the Ni2+ ions for the transport
through the cation-exchange membrane. Hence, the main effect of CrO3 on the transport
of ions through the membranes is caused by the increased concentration of H+ ions in the
electrolyte.
(a) (b)
0.0
0.2
0.4
0.6
0.8
1.0
0 1 2 3 4 5 6 7pH
α i
H2CrO4
HCrO4-
Cr2O72-
CrO42-
pHeq
0.0
0.2
0.4
0.6
0.8
1.0
0 1 2 3 4 5 6 7
pH
α i
H2CrO4HCrO4
-
Cr2O72-
CrO42-pHeq
Fig. 4.49. Speciation diagram of CrO3 solutions (a) with an initial concentration of 10-3M, and (b) with an initial concentration of 10-2M.
The speciation diagram of Ni(II) for 10-3M NiSO4 and varying concentrations of CrO3 is
shown in Fig. 4.50. As commented above, the speciation of Ni(II) is not significantly
altered due to the addition of CrO3. The main Ni(II) species are Ni2+ ions and the complex
species NiSO4. However, the pHeq values decrease gradually as the concentration of CrO3
is increased. Therefore, the transport of H+ ions through the membrane may be the
principal reason for the delayed depletion of Ni2+ ions observed for the mixture solutions.
Since H+ ions compete with Ni2+ ions for the transport through the membranes, the
current densities at which the concentration polarization phenomena develop increase
notoriously. In addition to this effect, the acidic pH values of chromic acid solutions also
contribute to prevent the formation of metallic precipitates at the membrane surface,
since the local pH near the membrane/electrolyte interface does not reach the values at
which the formation of precipitates starts (pH≈7.9).
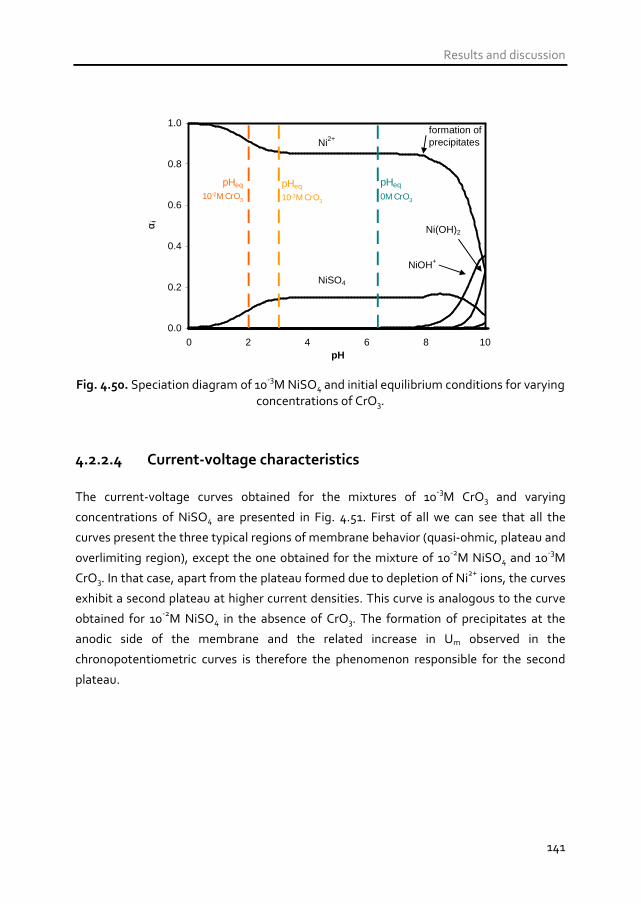
Results and discussion
141
0.0
0.2
0.4
0.6
0.8
1.0
0 2 4 6 8 10pH
α iNi2+
NiSO4
Ni(OH)2
NiOH+
formation of precipitates
pHeq
10-2M CrO3
pHeq
10-3M CrO3
pHeq
0M CrO3
Fig. 4.50. Speciation diagram of 10-3M NiSO4 and initial equilibrium conditions for varying
concentrations of CrO3.
4.2.2.4 Current-voltage characteristics
The current-voltage curves obtained for the mixtures of 10-3M CrO3 and varying
concentrations of NiSO4 are presented in Fig. 4.51. First of all we can see that all the
curves present the three typical regions of membrane behavior (quasi-ohmic, plateau and
overlimiting region), except the one obtained for the mixture of 10-2M NiSO4 and 10-3M
CrO3. In that case, apart from the plateau formed due to depletion of Ni2+ ions, the curves
exhibit a second plateau at higher current densities. This curve is analogous to the curve
obtained for 10-2M NiSO4 in the absence of CrO3. The formation of precipitates at the
anodic side of the membrane and the related increase in Um observed in the
chronopotentiometric curves is therefore the phenomenon responsible for the second
plateau.
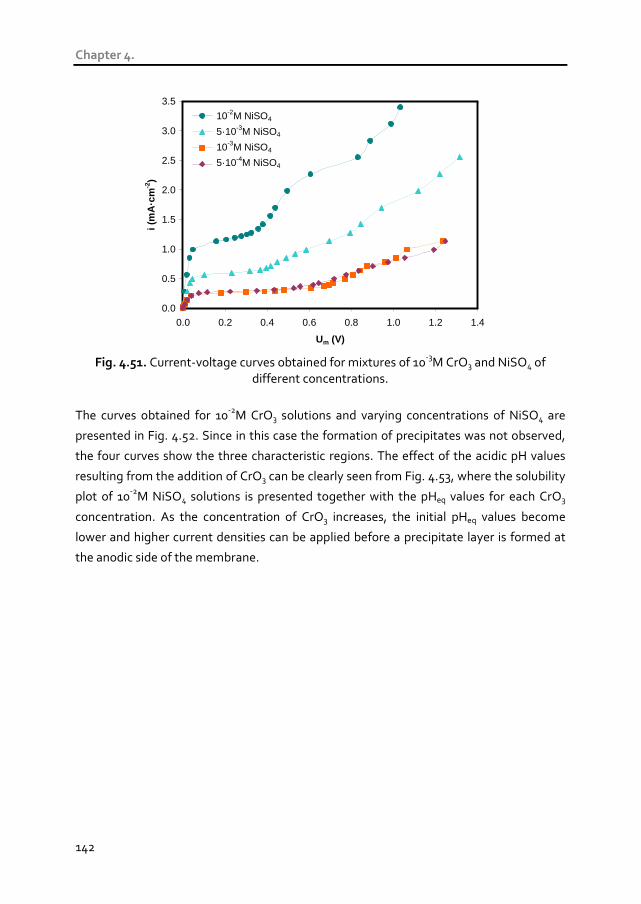
Chapter 4.
142
0.0
0.5
1.0
1.5
2.0
2.5
3.0
3.5
0.0 0.2 0.4 0.6 0.8 1.0 1.2 1.4
Um (V)
i (m
A·c
m-2
)
10-2M NiSO4
5·10-3M NiSO4
10-3M NiSO4
5·10-4M NiSO4
Fig. 4.51. Current-voltage curves obtained for mixtures of 10-3M CrO3 and NiSO4 of
different concentrations.
The curves obtained for 10-2M CrO3 solutions and varying concentrations of NiSO4 are
presented in Fig. 4.52. Since in this case the formation of precipitates was not observed,
the four curves show the three characteristic regions. The effect of the acidic pH values
resulting from the addition of CrO3 can be clearly seen from Fig. 4.53, where the solubility
plot of 10-2M NiSO4 solutions is presented together with the pHeq values for each CrO3
concentration. As the concentration of CrO3 increases, the initial pHeq values become
lower and higher current densities can be applied before a precipitate layer is formed at
the anodic side of the membrane.

Results and discussion
143
0
2
4
6
8
10
12
14
16
0.0 0.2 0.4 0.6 0.8 1.0 1.2 1.4
Um (V)
i (m
A·c
m-2
)
10-2M NiSO4
5·10-3M NiSO4
10-3M NiSO4
5·10-4M NiSO4
Fig. 4.52. Current-voltage curves obtained for mixtures of 10-2M CrO3 and NiSO4 of
different concentrations.
1.0E-07
1.0E-06
1.0E-05
1.0E-04
1.0E-03
1.0E-02
1.0E-01
1.0E+00
0 2 4 6 8 10 12 14pH
s (m
ol/L
)
The formation of precipitates starts
pHeq
10-2M CrO3pHeq
10-3M CrO3
pHeq
0M CrO3
Increasing current densities
Fig. 4.53. Solubility plot for 10-2M NiSO4 solutions and initial pHeq values for varying
concentrations of CrO3.
The current-voltage characteristics obtained from each curve are indicated in Table 4.6.
Despite the fact that almost all the curves are similar in shape, we can observe some
differences depending on the electrolyte composition. The first difference with respect to
the single salt solutions is the evolution of the ilim values with the electrolyte composition.
Although in general the ilim values increase with the NiSO4 concentration, this increase is
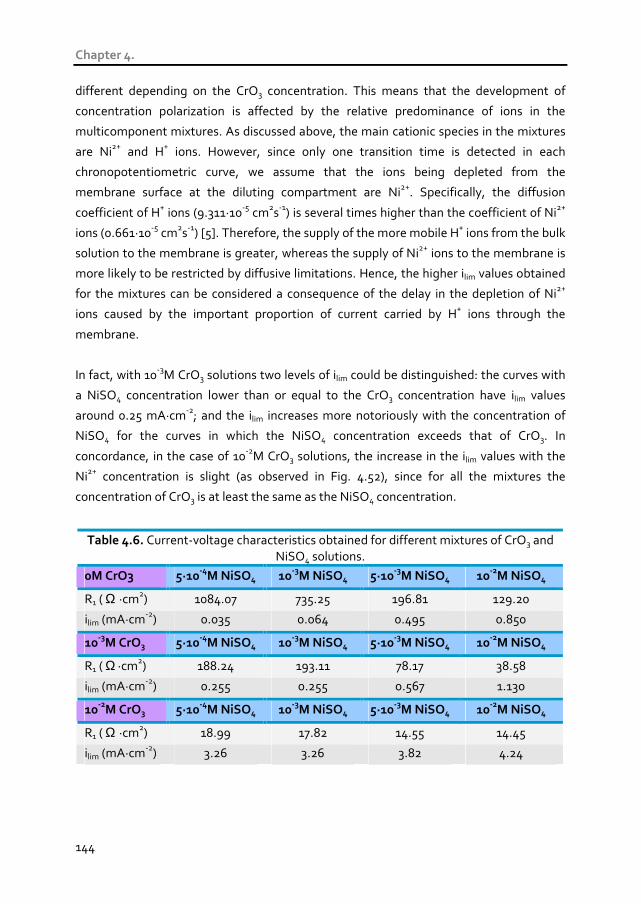
Chapter 4.
144
different depending on the CrO3 concentration. This means that the development of
concentration polarization is affected by the relative predominance of ions in the
multicomponent mixtures. As discussed above, the main cationic species in the mixtures
are Ni2+ and H+ ions. However, since only one transition time is detected in each
chronopotentiometric curve, we assume that the ions being depleted from the
membrane surface at the diluting compartment are Ni2+. Specifically, the diffusion
coefficient of H+ ions (9.311·10-5 cm2s-1) is several times higher than the coefficient of Ni2+
ions (0.661·10-5 cm2s-1) [5]. Therefore, the supply of the more mobile H+ ions from the bulk
solution to the membrane is greater, whereas the supply of Ni2+ ions to the membrane is
more likely to be restricted by diffusive limitations. Hence, the higher ilim values obtained
for the mixtures can be considered a consequence of the delay in the depletion of Ni2+
ions caused by the important proportion of current carried by H+ ions through the
membrane.
In fact, with 10-3M CrO3 solutions two levels of ilim could be distinguished: the curves with
a NiSO4 concentration lower than or equal to the CrO3 concentration have ilim values
around 0.25 mA·cm-2; and the ilim increases more notoriously with the concentration of
NiSO4 for the curves in which the NiSO4 concentration exceeds that of CrO3. In
concordance, in the case of 10-2M CrO3 solutions, the increase in the ilim values with the
Ni2+ concentration is slight (as observed in Fig. 4.52), since for all the mixtures the
concentration of CrO3 is at least the same as the NiSO4 concentration.
Table 4.6. Current-voltage characteristics obtained for different mixtures of CrO3 and NiSO4 solutions.
0M CrO3 5·10-4
M NiSO4 10-3
M NiSO4 5·10-3
M NiSO4 10-2
M NiSO4
R1 ( Ω ·cm2) 1084.07 735.25 196.81 129.20
ilim (mA·cm-2) 0.035 0.064 0.495 0.850
10-3
M CrO3 5·10-4
M NiSO4 10-3
M NiSO4 5·10-3
M NiSO4 10-2
M NiSO4
R1 ( Ω ·cm2) 188.24 193.11 78.17 38.58
ilim (mA·cm-2) 0.255 0.255 0.567 1.130
10-2
M CrO3 5·10-4
M NiSO4 10-3
M NiSO4 5·10-3
M NiSO4 10-2
M NiSO4
R1 ( Ω ·cm2) 18.99 17.82 14.55 14.45
ilim (mA·cm-2) 3.26 3.26 3.82 4.24

Results and discussion
145
With regard to the influence of the electrolyte composition on the ohmic resistance (R1), a
general decrease in the R1 values is produced with the increase of both the NiSO4 and
CrO3 concentration. Fig. 4.54 shows the relation between the ohmic resistance of each
system and the equivalent cationic charge in equilibrium conditions ( +Q ), which is
defined in Eq. (4.60) as follows:
∑ ⋅=+j
jj czQ (4.60)
where jz and jc are the electrochemical valence and the concentration in equilibrium
conditions of each cation, respectively. From the Fig. 4.54 it is seen that the values of R1
decrease abruptly with +Q when the equivalent cationic charge is lower than 0.01. Above
this value, the decrease of R1 with +Q is slighter, with values of R1 close to 10 Ω ·cm2.
Similar results were also obtained in previous studies [6,11,51]. Sang et al. explained this
trend of the R1 values with the electrolyte concentration on the basis that at higher
electrolyte concentrations, the amount of cations in the medium rises and they can easily
escape from the fixed charges of the membrane, thus contributing to a higher
conductivity in the diffusion boundary layer [51]. The important contribution of the
diffusion boundary layer to the ohmic resistances measured at low electrolyte
concentrations was also suggested as the main reason for the increased R1 values
obtained in previous studies [8]. In the present case, the R1 values measured in the
absence of CrO3 increase significantly also due to the absence of the more mobile H+ ions
in solution.
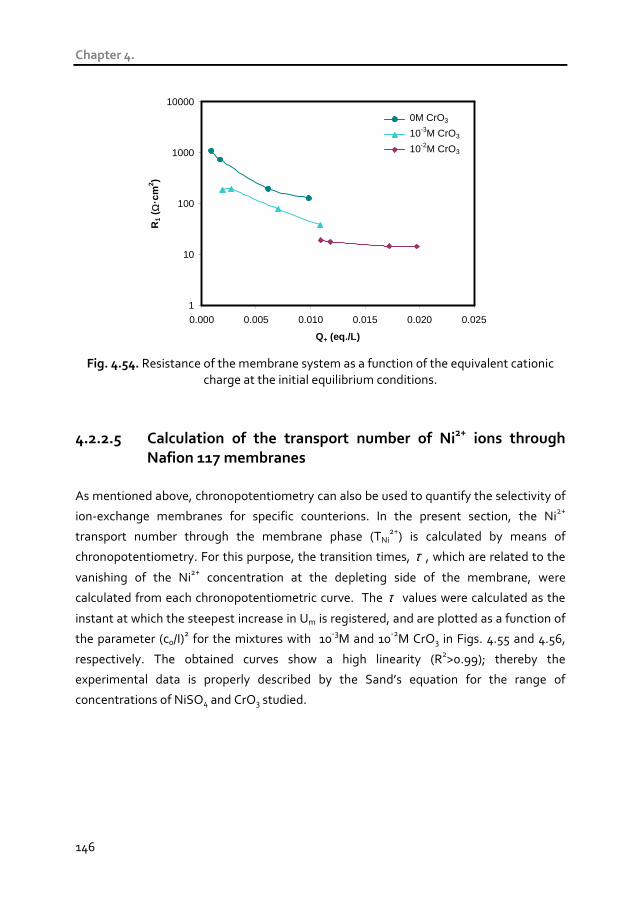
Chapter 4.
146
1
10
100
1000
10000
0.000 0.005 0.010 0.015 0.020 0.025
Q+ (eq./L)
R1
( Ω·c
m2 )
0M CrO3
10-3M CrO3
10-2M CrO3
Fig. 4.54. Resistance of the membrane system as a function of the equivalent cationic
charge at the initial equilibrium conditions.
4.2.2.5 Calculation of the transport number of Ni2+ ions through
Nafion 117 membranes
As mentioned above, chronopotentiometry can also be used to quantify the selectivity of
ion-exchange membranes for specific counterions. In the present section, the Ni2+
transport number through the membrane phase (TNi2+) is calculated by means of
chronopotentiometry. For this purpose, the transition times, τ , which are related to the
vanishing of the Ni2+ concentration at the depleting side of the membrane, were
calculated from each chronopotentiometric curve. The τ values were calculated as the
instant at which the steepest increase in Um is registered, and are plotted as a function of
the parameter (c0/I)2 for the mixtures with 10-3M and 10-2M CrO3 in Figs. 4.55 and 4.56,
respectively. The obtained curves show a high linearity (R2>0.99); thereby the
experimental data is properly described by the Sand’s equation for the range of
concentrations of NiSO4 and CrO3 studied.
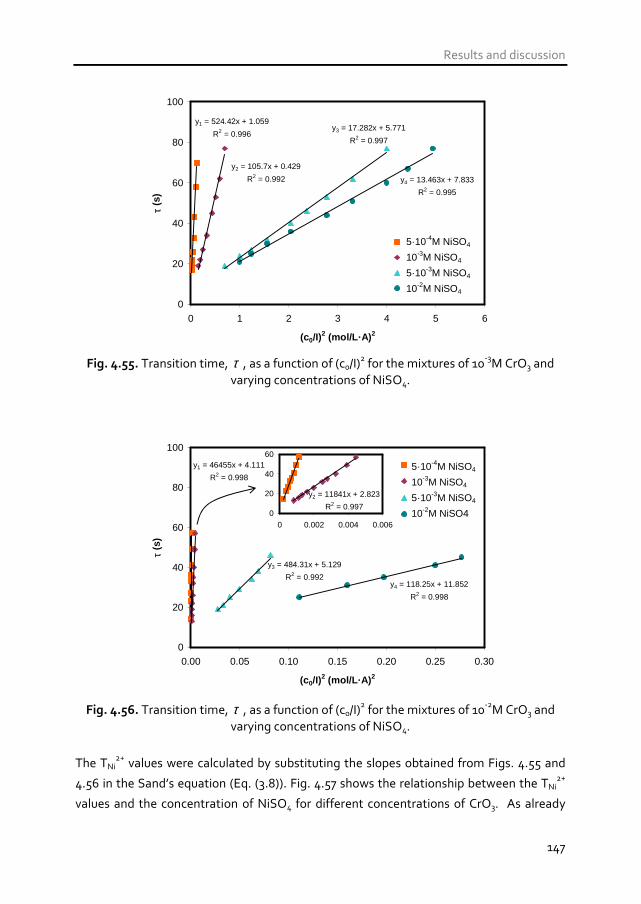
Results and discussion
147
y1 = 524.42x + 1.059
R2 = 0.996
y2 = 105.7x + 0.429
R2 = 0.992
y3 = 17.282x + 5.771
R2 = 0.997
y4 = 13.463x + 7.833
R2 = 0.995
0
20
40
60
80
100
0 1 2 3 4 5 6
(c0/I)2 (mol/L·A) 2
τ (s
)
5·10-4M NiSO4
10-3M NiSO4
5·10-3M NiSO4
10-2M NiSO4
Fig. 4.55. Transition time, τ , as a function of (c0/I)2 for the mixtures of 10-3M CrO3 and
varying concentrations of NiSO4.
y1 = 46455x + 4.111
R2 = 0.998
y3 = 484.31x + 5.129
R2 = 0.992y4 = 118.25x + 11.852
R2 = 0.998
0
20
40
60
80
100
0.00 0.05 0.10 0.15 0.20 0.25 0.30
(c0/I)2 (mol/L·A) 2
τ (s
)
y2 = 11841x + 2.823
R2 = 0.9970
20
40
60
0 0.002 0.004 0.006
5·10-4M NiSO4
10-3M NiSO4
5·10-3M NiSO4
10-2M NiSO4
Fig. 4.56. Transition time, τ , as a function of (c0/I)2 for the mixtures of 10-2M CrO3 and
varying concentrations of NiSO4.
The TNi2+ values were calculated by substituting the slopes obtained from Figs. 4.55 and
4.56 in the Sand’s equation (Eq. (3.8)). Fig. 4.57 shows the relationship between the TNi2+
values and the concentration of NiSO4 for different concentrations of CrO3. As already
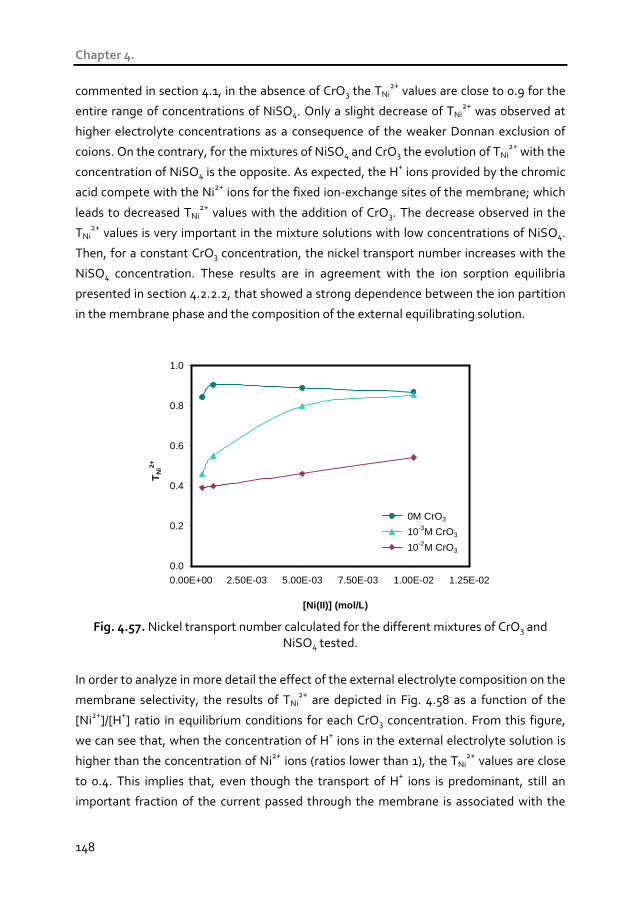
Chapter 4.
148
commented in section 4.1, in the absence of CrO3 the TNi2+ values are close to 0.9 for the
entire range of concentrations of NiSO4. Only a slight decrease of TNi2+ was observed at
higher electrolyte concentrations as a consequence of the weaker Donnan exclusion of
coions. On the contrary, for the mixtures of NiSO4 and CrO3 the evolution of TNi2+ with the
concentration of NiSO4 is the opposite. As expected, the H+ ions provided by the chromic
acid compete with the Ni2+ ions for the fixed ion-exchange sites of the membrane; which
leads to decreased TNi2+ values with the addition of CrO3. The decrease observed in the
TNi2+ values is very important in the mixture solutions with low concentrations of NiSO4.
Then, for a constant CrO3 concentration, the nickel transport number increases with the
NiSO4 concentration. These results are in agreement with the ion sorption equilibria
presented in section 4.2.2.2, that showed a strong dependence between the ion partition
in the membrane phase and the composition of the external equilibrating solution.
0.0
0.2
0.4
0.6
0.8
1.0
0.00E+00 2.50E-03 5.00E-03 7.50E-03 1.00E-02 1.25E-02
[Ni(II)] (mol/L)
TN
i2+
0M CrO3
10-3M CrO3
10-2M CrO3
Fig. 4.57. Nickel transport number calculated for the different mixtures of CrO3 and
NiSO4 tested.
In order to analyze in more detail the effect of the external electrolyte composition on the
membrane selectivity, the results of TNi2+ are depicted in Fig. 4.58 as a function of the
[Ni2+]/[H+] ratio in equilibrium conditions for each CrO3 concentration. From this figure,
we can see that, when the concentration of H+ ions in the external electrolyte solution is
higher than the concentration of Ni2+ ions (ratios lower than 1), the TNi2+ values are close
to 0.4. This implies that, even though the transport of H+ ions is predominant, still an
important fraction of the current passed through the membrane is associated with the
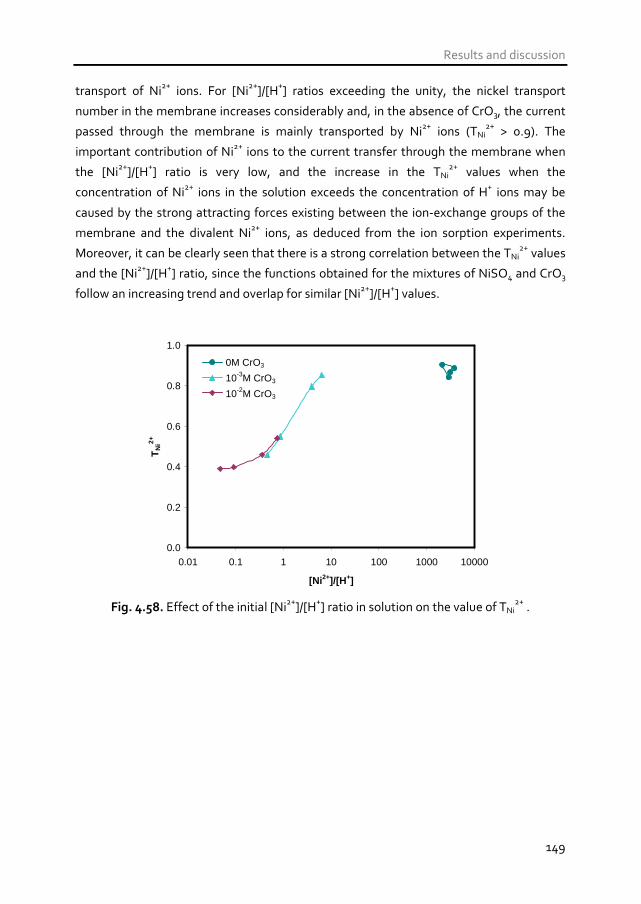
Results and discussion
149
transport of Ni2+ ions. For [Ni2+]/[H+] ratios exceeding the unity, the nickel transport
number in the membrane increases considerably and, in the absence of CrO3, the current
passed through the membrane is mainly transported by Ni2+ ions (TNi2+ > 0.9). The
important contribution of Ni2+ ions to the current transfer through the membrane when
the [Ni2+]/[H+] ratio is very low, and the increase in the TNi2+ values when the
concentration of Ni2+ ions in the solution exceeds the concentration of H+ ions may be
caused by the strong attracting forces existing between the ion-exchange groups of the
membrane and the divalent Ni2+ ions, as deduced from the ion sorption experiments.
Moreover, it can be clearly seen that there is a strong correlation between the TNi2+ values
and the [Ni2+]/[H+] ratio, since the functions obtained for the mixtures of NiSO4 and CrO3
follow an increasing trend and overlap for similar [Ni2+]/[H+] values.
0.0
0.2
0.4
0.6
0.8
1.0
0.01 0.1 1 10 100 1000 10000
[Ni2+]/[H+]
TN
i2+
0M CrO3
10-3M CrO3
10-2M CrO3
Fig. 4.58. Effect of the initial [Ni2+]/[H+] ratio in solution on the value of TNi
2+ .
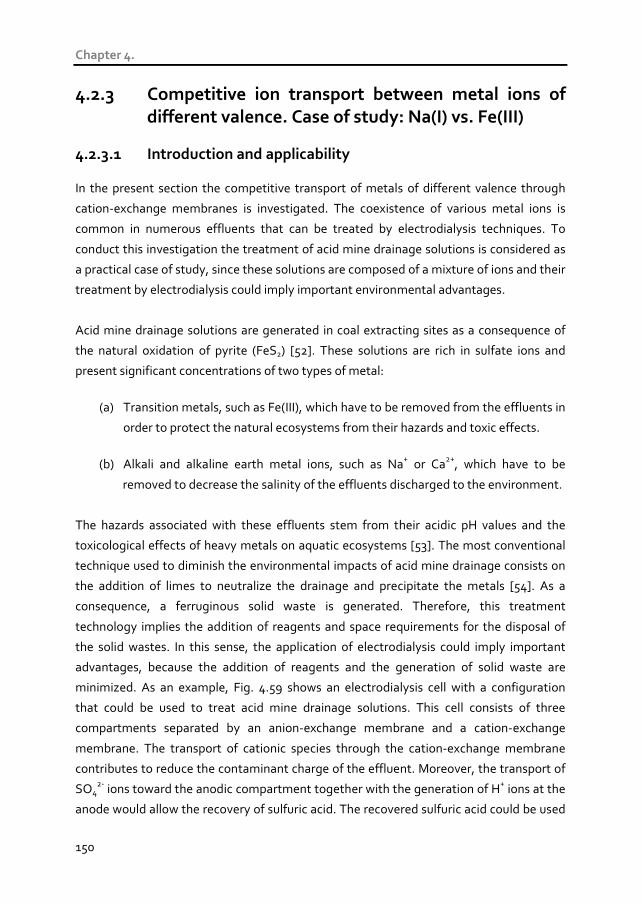
Chapter 4.
150
4.2.3 Competitive ion transport between metal ions of
different valence. Case of study: Na(I) vs. Fe(III)
4.2.3.1 Introduction and applicability In the present section the competitive transport of metals of different valence through
cation-exchange membranes is investigated. The coexistence of various metal ions is
common in numerous effluents that can be treated by electrodialysis techniques. To
conduct this investigation the treatment of acid mine drainage solutions is considered as
a practical case of study, since these solutions are composed of a mixture of ions and their
treatment by electrodialysis could imply important environmental advantages.
Acid mine drainage solutions are generated in coal extracting sites as a consequence of
the natural oxidation of pyrite (FeS2) [52]. These solutions are rich in sulfate ions and
present significant concentrations of two types of metal:
(a) Transition metals, such as Fe(III), which have to be removed from the effluents in
order to protect the natural ecosystems from their hazards and toxic effects.
(b) Alkali and alkaline earth metal ions, such as Na+ or Ca2+, which have to be
removed to decrease the salinity of the effluents discharged to the environment.
The hazards associated with these effluents stem from their acidic pH values and the
toxicological effects of heavy metals on aquatic ecosystems [53]. The most conventional
technique used to diminish the environmental impacts of acid mine drainage consists on
the addition of limes to neutralize the drainage and precipitate the metals [54]. As a
consequence, a ferruginous solid waste is generated. Therefore, this treatment
technology implies the addition of reagents and space requirements for the disposal of
the solid wastes. In this sense, the application of electrodialysis could imply important
advantages, because the addition of reagents and the generation of solid waste are
minimized. As an example, Fig. 4.59 shows an electrodialysis cell with a configuration
that could be used to treat acid mine drainage solutions. This cell consists of three
compartments separated by an anion-exchange membrane and a cation-exchange
membrane. The transport of cationic species through the cation-exchange membrane
contributes to reduce the contaminant charge of the effluent. Moreover, the transport of
SO42- ions toward the anodic compartment together with the generation of H+ ions at the
anode would allow the recovery of sulfuric acid. The recovered sulfuric acid could be used
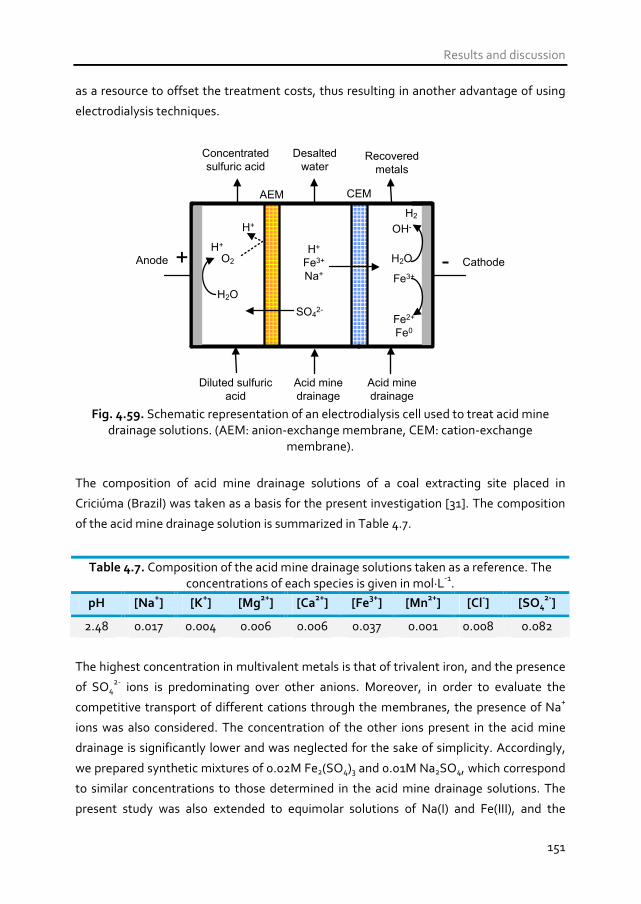
Results and discussion
151
as a resource to offset the treatment costs, thus resulting in another advantage of using
electrodialysis techniques.
AEM CEM
+ -H+
SO42-
H+
Fe3+
Na+
H+
Fe3+
Fe2+
Fe0
OH-
H2
O2
Diluted sulfuric
acid
Concentrated
sulfuric acidRecovered
metals
Acid mine
drainage
Acid mine
drainage
Desalted
water
CathodeAnode
H2O
H2O
Fig. 4.59. Schematic representation of an electrodialysis cell used to treat acid mine
drainage solutions. (AEM: anion-exchange membrane, CEM: cation-exchange membrane).
The composition of acid mine drainage solutions of a coal extracting site placed in
Criciúma (Brazil) was taken as a basis for the present investigation [31]. The composition
of the acid mine drainage solution is summarized in Table 4.7.
Table 4.7. Composition of the acid mine drainage solutions taken as a reference. The concentrations of each species is given in mol·L-1.
pH [Na+] [K
+] [Mg
2+] [Ca
2+] [Fe
3+] [Mn
2+] [Cl
-] [SO4
2-]
2.48 0.017 0.004 0.006 0.006 0.037 0.001 0.008 0.082
The highest concentration in multivalent metals is that of trivalent iron, and the presence
of SO42- ions is predominating over other anions. Moreover, in order to evaluate the
competitive transport of different cations through the membranes, the presence of Na+
ions was also considered. The concentration of the other ions present in the acid mine
drainage is significantly lower and was neglected for the sake of simplicity. Accordingly,
we prepared synthetic mixtures of 0.02M Fe2(SO4)3 and 0.01M Na2SO4, which correspond
to similar concentrations to those determined in the acid mine drainage solutions. The
present study was also extended to equimolar solutions of Na(I) and Fe(III), and the
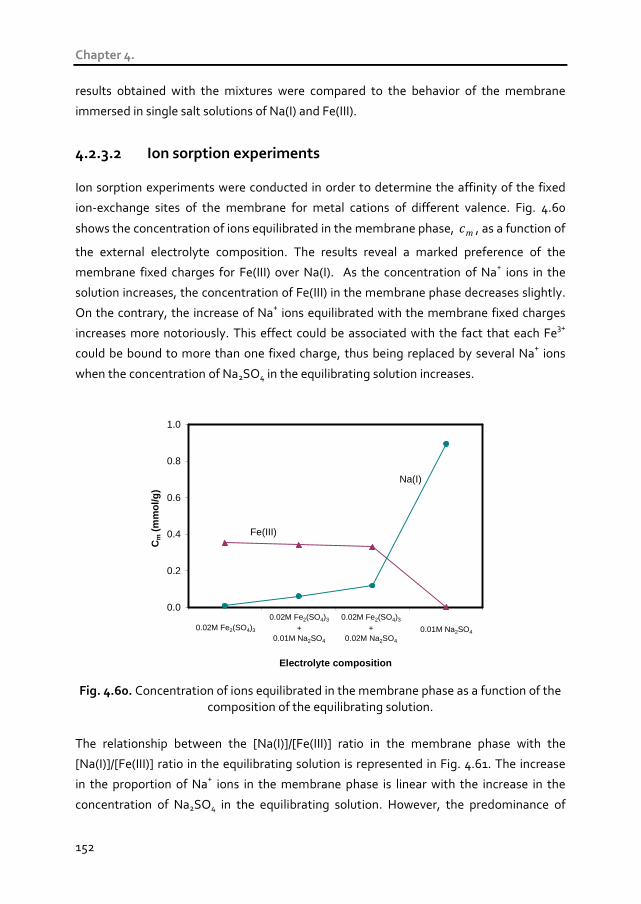
Chapter 4.
152
results obtained with the mixtures were compared to the behavior of the membrane
immersed in single salt solutions of Na(I) and Fe(III).
4.2.3.2 Ion sorption experiments Ion sorption experiments were conducted in order to determine the affinity of the fixed
ion-exchange sites of the membrane for metal cations of different valence. Fig. 4.60
shows the concentration of ions equilibrated in the membrane phase, mc , as a function of
the external electrolyte composition. The results reveal a marked preference of the
membrane fixed charges for Fe(III) over Na(I). As the concentration of Na+ ions in the
solution increases, the concentration of Fe(III) in the membrane phase decreases slightly.
On the contrary, the increase of Na+ ions equilibrated with the membrane fixed charges
increases more notoriously. This effect could be associated with the fact that each Fe3+
could be bound to more than one fixed charge, thus being replaced by several Na+ ions
when the concentration of Na2SO4 in the equilibrating solution increases.
0.0
0.2
0.4
0.6
0.8
1.0
0.02MFe2(SO4)3
0.02MFe2(SO4)3 +
0.01M Na2SO4
0.02MFe2(SO4)3 +
0.02M Na2SO4
0.01M Na2SO4
Electrolyte composition
Cm
(m
mol
/g)
0.02M Fe2(SO4)3 0.01M Na2SO4
0.02M Fe2(SO4)3
+0.01M Na2SO4
0.02M Fe2(SO4)3
+0.02M Na2SO4
Fe(III)
Na(I)
Fig. 4.60. Concentration of ions equilibrated in the membrane phase as a function of the
composition of the equilibrating solution.
The relationship between the [Na(I)]/[Fe(III)] ratio in the membrane phase with the
[Na(I)]/[Fe(III)] ratio in the equilibrating solution is represented in Fig. 4.61. The increase
in the proportion of Na+ ions in the membrane phase is linear with the increase in the
concentration of Na2SO4 in the equilibrating solution. However, the predominance of
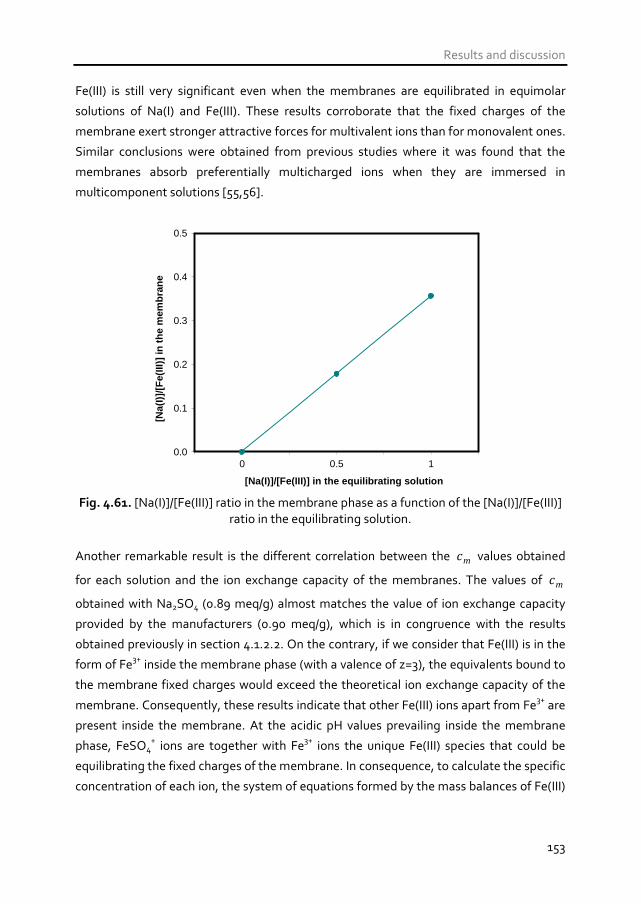
Results and discussion
153
Fe(III) is still very significant even when the membranes are equilibrated in equimolar
solutions of Na(I) and Fe(III). These results corroborate that the fixed charges of the
membrane exert stronger attractive forces for multivalent ions than for monovalent ones.
Similar conclusions were obtained from previous studies where it was found that the
membranes absorb preferentially multicharged ions when they are immersed in
multicomponent solutions [55,56].
0.0
0.1
0.2
0.3
0.4
0.5
0 0.5 1
[Na(I)]/[Fe(III)] in the equilibrating solution
[Na(
I)]/[
Fe(
III)]
in th
e m
embr
ane
Fig. 4.61. [Na(I)]/[Fe(III)] ratio in the membrane phase as a function of the [Na(I)]/[Fe(III)]
ratio in the equilibrating solution.
Another remarkable result is the different correlation between the mc values obtained
for each solution and the ion exchange capacity of the membranes. The values of mc
obtained with Na2SO4 (0.89 meq/g) almost matches the value of ion exchange capacity
provided by the manufacturers (0.90 meq/g), which is in congruence with the results
obtained previously in section 4.1.2.2. On the contrary, if we consider that Fe(III) is in the
form of Fe3+ inside the membrane phase (with a valence of z=3), the equivalents bound to
the membrane fixed charges would exceed the theoretical ion exchange capacity of the
membrane. Consequently, these results indicate that other Fe(III) ions apart from Fe3+ are
present inside the membrane. At the acidic pH values prevailing inside the membrane
phase, FeSO4+ ions are together with Fe3+ ions the unique Fe(III) species that could be
equilibrating the fixed charges of the membrane. In consequence, to calculate the specific
concentration of each ion, the system of equations formed by the mass balances of Fe(III)

Chapter 4.
154
species inside the membrane and the balance of the equivalents equilibrating the
membrane fixed sites (Eqs. (4.61) and (4.62) was solved:
mFeSOmFemIIIFe ccc
,,),( ++ +=4
3 (4.61)
++++++ ⋅+⋅+⋅== 3344
890FemFeFeSOmFeSONamNazczczcgmeqIEC
,,,/. (4.62)
Where mIIIFec ),( , mjc , and mjz , refer to the concentration of total iron in the membrane
phase, and the concentration in the membrane and the valence of the ionic specie j ,
respectively. The results obtained are plotted in Fig. 4.62, where the percentage of
membrane fixed charges bound to each ion (Fe3+, FeSO4+ or Na+) is represented as a
function of the composition of the equilibrating solution. From this graphic we can see
that the addition of Na2SO4 to the solutions containing Fe2(SO4)3 reduces the amount of
fixed ion exchange sites occupied by Fe(III) species. However, the increasing
concentrations of Na2SO4 in the equilibrating solution also alters the speciation of Fe(III)
inside the membrane phase, since it decreases the proportion of Fe3+ ions, but increases
the amount of fixed charges bound to FeSO4+ ions. This effect could be due to the
displacement of the equilibrium in the equilibrating electrolyte, because the increase in
the concentration of Na2SO4 also implies an increase in the amount of SO42- ions in the
solution, hence displacing the equilibrium toward the formation of more FeSO4+ ions. In
addition, as the concentration of SO42- ions in solution increases, the Donnan coion
exclusion is less effective, and more FeSO4+ ions occupy the membrane fixed charges.
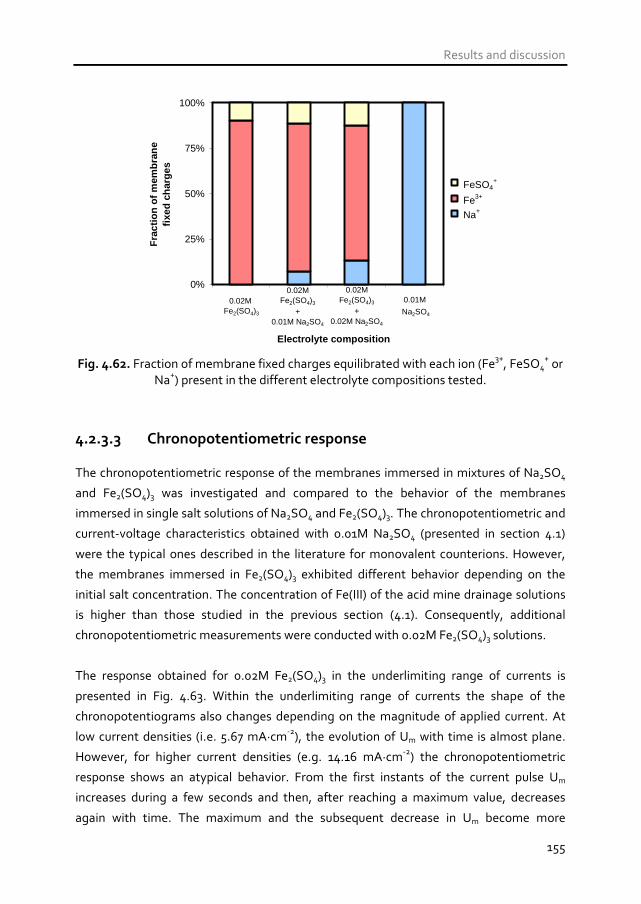
Results and discussion
155
0%
25%
50%
75%
100%
Electrolyte composition
Fra
ctio
n of
mem
bran
e fix
ed c
harg
es
0.02M Fe2(SO4)3
0.02M Fe2(SO4)3
+0.01M Na2SO4
0.02M Fe2(SO4)3
+0.02M Na2SO4
0.01M
Na2SO4
FeSO4+
Fe3+
Na+
Fig. 4.62. Fraction of membrane fixed charges equilibrated with each ion (Fe3+, FeSO4
+ or Na+) present in the different electrolyte compositions tested.
4.2.3.3 Chronopotentiometric response The chronopotentiometric response of the membranes immersed in mixtures of Na2SO4
and Fe2(SO4)3 was investigated and compared to the behavior of the membranes
immersed in single salt solutions of Na2SO4 and Fe2(SO4)3. The chronopotentiometric and
current-voltage characteristics obtained with 0.01M Na2SO4 (presented in section 4.1)
were the typical ones described in the literature for monovalent counterions. However,
the membranes immersed in Fe2(SO4)3 exhibited different behavior depending on the
initial salt concentration. The concentration of Fe(III) of the acid mine drainage solutions
is higher than those studied in the previous section (4.1). Consequently, additional
chronopotentiometric measurements were conducted with 0.02M Fe2(SO4)3 solutions.
The response obtained for 0.02M Fe2(SO4)3 in the underlimiting range of currents is
presented in Fig. 4.63. Within the underlimiting range of currents the shape of the
chronopotentiograms also changes depending on the magnitude of applied current. At
low current densities (i.e. 5.67 mA·cm-2), the evolution of Um with time is almost plane.
However, for higher current densities (e.g. 14.16 mA·cm-2) the chronopotentiometric
response shows an atypical behavior. From the first instants of the current pulse Um
increases during a few seconds and then, after reaching a maximum value, decreases
again with time. The maximum and the subsequent decrease in Um become more

Chapter 4.
156
pronounced as the current is increased, which implies a reduction in the electrical
resistance of the membrane system for high underlimiting currents. This membrane
behavior is markedly different from that observed with monovalent cations, where the
continuous depletion of counterions near the membranes leads to a gradual increase of
the electrical resistance with current density. Finally, when the ilim value is approached
(i.e. 17.00 mA·cm-2), the depletion of counterions at the anodic side of the membrane is
intensified and a sharp increase in Um is registered.
0.00
0.05
0.10
0.15
0 100 200 300 400 500t (s)
Um
(V
)
17.00 mA·cm-2
14.16 mA·cm-2
11.33 mA·cm-2
8.50 mA·cm-2
5.67 mA·cm-2
maximum in Um
Fig. 4.63. Chronopotentiometric response obtained in the underlimiting range of currents
for 0.02M Fe2(SO4)3.
The response obtained in the overlimiting range of currents is shown in Fig. 4.64. For
current densities slightly exceeding the ilim (e.g. 17.14 and 17.28 mA·cm-2), Um increases at
the transition time due to the vanishing of Fe(III) species near the membrane depleting
surface. Subsequently, Um levels off and reaches a steady value which remains
approximately constant until the end of the current pulse. However, at the current
density of 17.56 mA·cm-2 an important increase in Um was registered at times larger than
the transition time. In analogy with the results obtained in section 4.1 for 0.01M Fe2(SO4)3
solutions, this increase is continued and reaches the magnitude of various volts, hence
being also related to the formation of a precipitate layer at the anodic side of the
membrane. The continued growth of the precipitate layer taking place while the current
is applied is the main contribution to the increased electrical resistance of the membrane.

Results and discussion
157
0.0
1.0
2.0
3.0
0 100 200 300 400 500t (s)
Um
(V
)
17.56 mA·cm-2
17.28 mA·cm-2
17.14 mA·cm-2
depletion of
Fe3+ ions
τ τ
formation of Fe(OH)3
precipitates
Fig. 4.64. Chronopotentiometric response obtained in the overlimiting range of currents
for 0.02M Fe2(SO4)3 solutions.
As explained above, the dynamics of the ionic transport taking place within the
underlimiting regime of currents with 0.02M Fe2(SO4)3 solutions is markedly different
from the results obtained for more diluted solutions. A similar chronopotentiometric
response showing the maximum and subsequent decrease in Um was also observed by
Taky et al. when they studied the transport of Cr(III) through cation-exchange
membranes [57]. In that case, a change in the species being transported through the
membranes was suggested as the reason for this atypical response. Therefore, in order to
clarify the different behavior observed for high and low electrolyte concentrations, the
speciation diagrams of 0.001M and 0.02M Fe2(SO4)3 solutions are compared in Figs. 4.65
and 4.66, respectively. For 0.001M Fe2(SO4)3 three different cationic species coexist at
the initial equilibrium conditions: FeSO4+, Fe3+ and FeOH2+. In consequence, when the
cation-exchange membrane immersed in diluted solutions of Fe2(SO4)3 is submitted to an
electric field, the more mobile Fe3+ ions, which have larger diffusion coefficients than
FeSO4+ ions (see Table 4.8), are more likely to carry the ionic current through the
membranes within the range of underlimiting currents. On the contrary, in the case of
0.02M Fe2(SO4)3 solutions (Fig. 4.66) FeSO4+ ions are the main cationic species at the
initial equilibrium conditions and the concentration of Fe3+ ions is practically negligible.
Therefore, at low polarization levels, the contribution of Fe3+ ions to the ionic transfer
through the membranes may be insignificant.

Chapter 4.
158
However, when the concentration polarization is intensified, the equilibrium conditions in
the diffusion boundary layer can be altered, thus changing the ions being supplied to the
membrane surface. In the present case, the maximum in Um appearing immediately after
starting the current pulses of Fig. 4.63 may be induced by the overlapping of two different
effects. First, as the FeSO4+ ions are transported through the membrane, they would
replace the Fe3+ ions that are initially balancing the fixed charges of the membrane (see
Fig. 4.62). On the other hand, as the diffusion boundary layer becomes more diluted, the
FeSO4+ ions present in the membrane region tend to dissociate and form Fe3+ and SO4
2-
ions, as indicated in Eq. (4.63):
FeSO4+ Fe3+ + SO4
2- (4.63)
The displacement of the above reaction toward the dissociation of FeSO4+ would thus
imply a change from FeSO4+ to Fe3+ ions as the main charge carriers through the
membrane.
(a) (b)
0.0
0.2
0.4
0.6
0.8
1.0
0 1 2 3 4 5 6 7
pH
α i
Fe3+
FeSO4+
FeOH2+
Fe(OH)2+
Fe(OH)3
Fe(SO4)2-
pHeq
0.0
0.2
0.4
0.6
0.8
1.0
0 2 4 6 8 10
pSO4
α i
Fe(SO4)2-
FeSO4+
Fe3+
FeOH2+
pSO4,eq
Fig. 4.65. Speciation diagram of Fe(III) species present in 0.001M Fe2(SO4)3 solutions. (a) Speciation diagram as a function of pH and (b) as a function of pSO4.
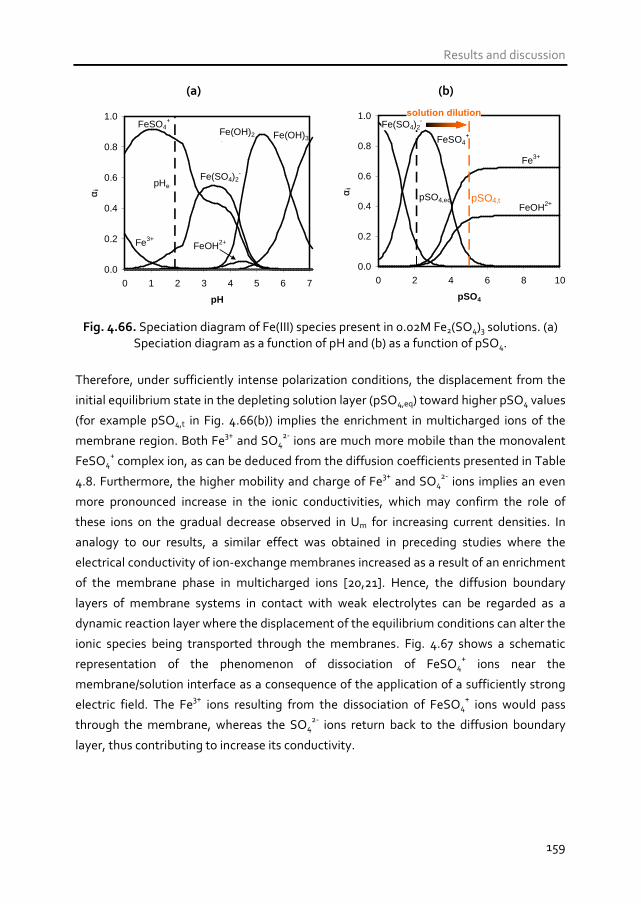
Results and discussion
159
(a) (b)
0.0
0.2
0.4
0.6
0.8
1.0
0 1 2 3 4 5 6 7
pH
α i
Fe3+
FeSO4+
Fe(SO4)2-
FeOH2+
Fe(OH)2+
Fe(OH)3
pHe
q
0.0
0.2
0.4
0.6
0.8
1.0
0 2 4 6 8 10
pSO4
α i
Fe(SO4)2-
FeSO4+
Fe3+
FeOH2+pSO4,eq
solution dilution
pSO4,t
Fig. 4.66. Speciation diagram of Fe(III) species present in 0.02M Fe2(SO4)3 solutions. (a) Speciation diagram as a function of pH and (b) as a function of pSO4.
Therefore, under sufficiently intense polarization conditions, the displacement from the
initial equilibrium state in the depleting solution layer (pSO4,eq) toward higher pSO4 values
(for example pSO4,t in Fig. 4.66(b)) implies the enrichment in multicharged ions of the
membrane region. Both Fe3+ and SO42- ions are much more mobile than the monovalent
FeSO4+ complex ion, as can be deduced from the diffusion coefficients presented in Table
4.8. Furthermore, the higher mobility and charge of Fe3+ and SO42- ions implies an even
more pronounced increase in the ionic conductivities, which may confirm the role of
these ions on the gradual decrease observed in Um for increasing current densities. In
analogy to our results, a similar effect was obtained in preceding studies where the
electrical conductivity of ion-exchange membranes increased as a result of an enrichment
of the membrane phase in multicharged ions [20,21]. Hence, the diffusion boundary
layers of membrane systems in contact with weak electrolytes can be regarded as a
dynamic reaction layer where the displacement of the equilibrium conditions can alter the
ionic species being transported through the membranes. Fig. 4.67 shows a schematic
representation of the phenomenon of dissociation of FeSO4+ ions near the
membrane/solution interface as a consequence of the application of a sufficiently strong
electric field. The Fe3+ ions resulting from the dissociation of FeSO4+ ions would pass
through the membrane, whereas the SO42- ions return back to the diffusion boundary
layer, thus contributing to increase its conductivity.
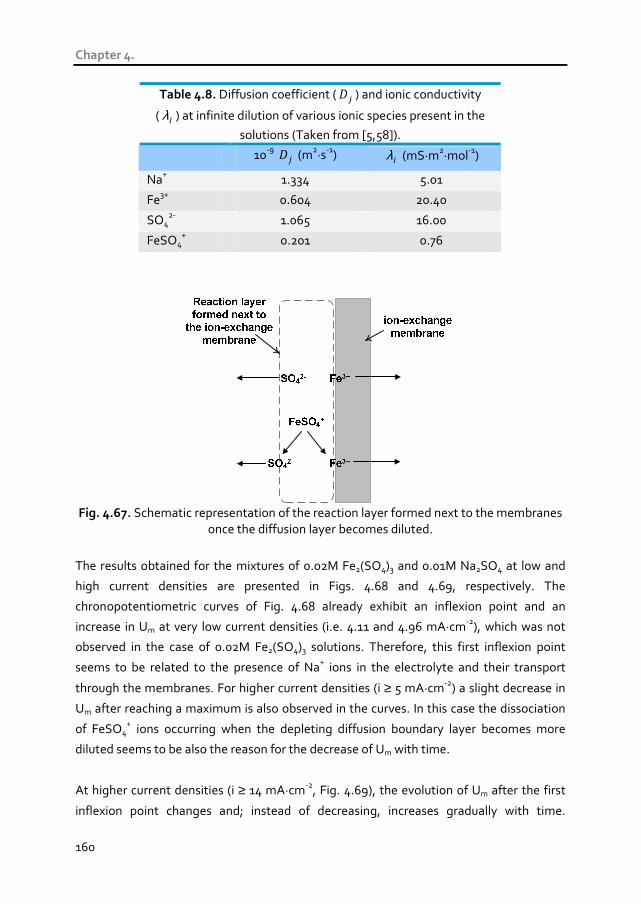
Chapter 4.
160
Table 4.8. Diffusion coefficient ( jD ) and ionic conductivity
( iλ ) at infinite dilution of various ionic species present in the
solutions (Taken from [5,58]).
10-9 jD (m2·s-1) iλ (mS·m2·mol-1)
Na+ 1.334 5.01
Fe3+ 0.604 20.40
SO42- 1.065 16.00
FeSO4+ 0.201 0.76
Fig. 4.67. Schematic representation of the reaction layer formed next to the membranes
once the diffusion layer becomes diluted.
The results obtained for the mixtures of 0.02M Fe2(SO4)3 and 0.01M Na2SO4 at low and
high current densities are presented in Figs. 4.68 and 4.69, respectively. The
chronopotentiometric curves of Fig. 4.68 already exhibit an inflexion point and an
increase in Um at very low current densities (i.e. 4.11 and 4.96 mA·cm-2), which was not
observed in the case of 0.02M Fe2(SO4)3 solutions. Therefore, this first inflexion point
seems to be related to the presence of Na+ ions in the electrolyte and their transport
through the membranes. For higher current densities (i ≥ 5 mA·cm-2) a slight decrease in
Um after reaching a maximum is also observed in the curves. In this case the dissociation
of FeSO4+ ions occurring when the depleting diffusion boundary layer becomes more
diluted seems to be also the reason for the decrease of Um with time.
At higher current densities (i ≥ 14 mA·cm-2, Fig. 4.69), the evolution of Um after the first
inflexion point changes and; instead of decreasing, increases gradually with time.

Results and discussion
161
Moreover, the restoration of Um to zero during the relaxation of the membrane system is
also slower, as can be seen in the magnified view included in Fig. 4.69. Therefore, the
increase in Um occurring at higher current densities could be associated with the
formation of precipitates, which were observed at the end of the experiment. However,
the presence of Na+ ions in the mixture solutions seems to attenuate the magnitude of
the increase in Um. The results obtained with equimolar mixtures of sodium and iron
(0.02M Fe2(SO4)3 and 0.02M Na2SO4) were analogous to those presented in Figs. 4.68 and
4.69. Accordingly, the chronopotentiograms are not presented and the effect of
increasing the concentration of Na+ ions on the membrane behavior will be analyzed in
detail from the differences observed in the current-voltage curves.
0.0
0.5
1.0
1.5
0 100 200 300 400 500t (s)
Um
(V
)
4.96 mA·cm-2
7.08 mA·cm-2
9.92 mA·cm-2
3.54 mA·cm-2
4.11 mA·cm-2
Fig. 4.68. Chronopotentiometric response obtained in the underlimiting range of
currents for mixtures of 0.02M Fe2(SO4)3 and 0.01M Na2SO4.
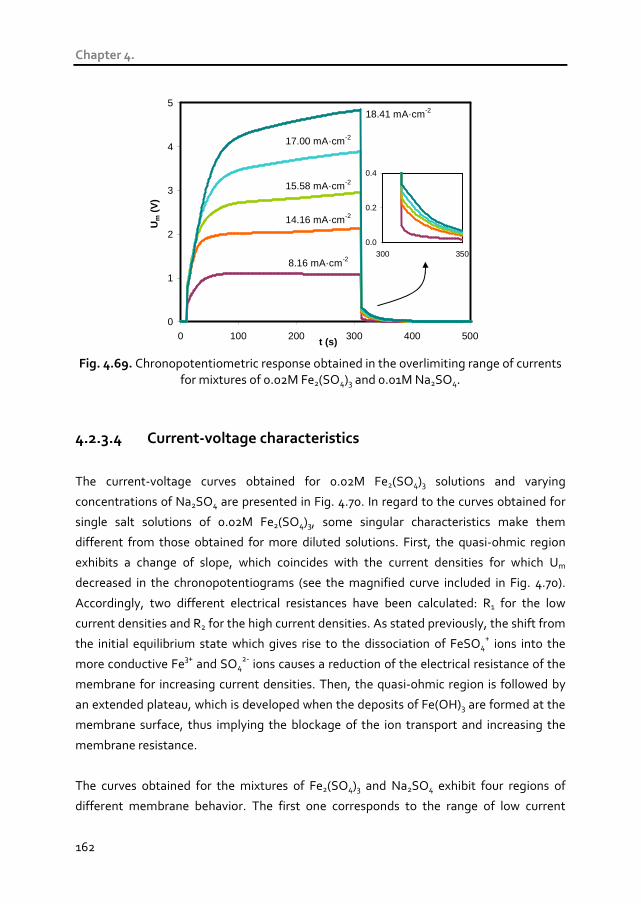
Chapter 4.
162
0
1
2
3
4
5
0 100 200 300 400 500t (s)
Um
(V
)
14.16 mA·cm-2
15.58 mA·cm-2
17.00 mA·cm-2
18.41 mA·cm-2
8.16 mA·cm-2
0.0
0.2
0.4
300 350
Fig. 4.69. Chronopotentiometric response obtained in the overlimiting range of currents
for mixtures of 0.02M Fe2(SO4)3 and 0.01M Na2SO4.
4.2.3.4 Current-voltage characteristics
The current-voltage curves obtained for 0.02M Fe2(SO4)3 solutions and varying
concentrations of Na2SO4 are presented in Fig. 4.70. In regard to the curves obtained for
single salt solutions of 0.02M Fe2(SO4)3, some singular characteristics make them
different from those obtained for more diluted solutions. First, the quasi-ohmic region
exhibits a change of slope, which coincides with the current densities for which Um
decreased in the chronopotentiograms (see the magnified curve included in Fig. 4.70).
Accordingly, two different electrical resistances have been calculated: R1 for the low
current densities and R2 for the high current densities. As stated previously, the shift from
the initial equilibrium state which gives rise to the dissociation of FeSO4+ ions into the
more conductive Fe3+ and SO42- ions causes a reduction of the electrical resistance of the
membrane for increasing current densities. Then, the quasi-ohmic region is followed by
an extended plateau, which is developed when the deposits of Fe(OH)3 are formed at the
membrane surface, thus implying the blockage of the ion transport and increasing the
membrane resistance.
The curves obtained for the mixtures of Fe2(SO4)3 and Na2SO4 exhibit four regions of
different membrane behavior. The first one corresponds to the range of low current
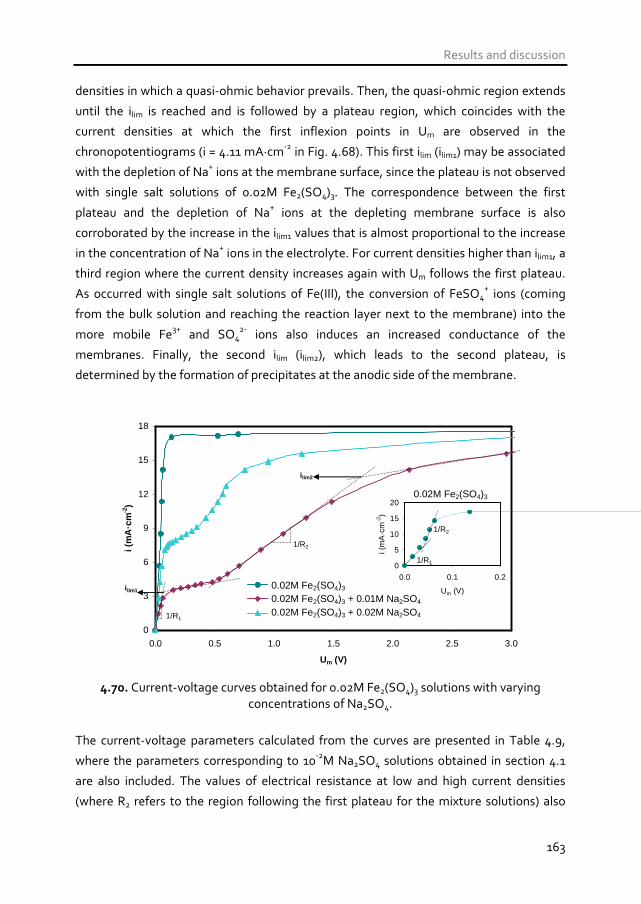
Results and discussion
163
densities in which a quasi-ohmic behavior prevails. Then, the quasi-ohmic region extends
until the ilim is reached and is followed by a plateau region, which coincides with the
current densities at which the first inflexion points in Um are observed in the
chronopotentiograms (i = 4.11 mA·cm-2 in Fig. 4.68). This first ilim (ilim1) may be associated
with the depletion of Na+ ions at the membrane surface, since the plateau is not observed
with single salt solutions of 0.02M Fe2(SO4)3. The correspondence between the first
plateau and the depletion of Na+ ions at the depleting membrane surface is also
corroborated by the increase in the ilim1 values that is almost proportional to the increase
in the concentration of Na+ ions in the electrolyte. For current densities higher than ilim1, a
third region where the current density increases again with Um follows the first plateau.
As occurred with single salt solutions of Fe(III), the conversion of FeSO4+ ions (coming
from the bulk solution and reaching the reaction layer next to the membrane) into the
more mobile Fe3+ and SO42- ions also induces an increased conductance of the
membranes. Finally, the second ilim (ilim2), which leads to the second plateau, is
determined by the formation of precipitates at the anodic side of the membrane.
0
3
6
9
12
15
18
0.0 0.5 1.0 1.5 2.0 2.5 3.0
Um (V)
i (m
A·c
m-2
)
0.02M Fe2(SO4)3
0.02M Fe2(SO4)3 + 0.01M Na2SO4
0.02M Fe2(SO4)3 + 0.02M Na2SO4
0
5
10
15
20
0.0 0.1 0.2
Um (V)
i (m
A·c
m-2
)
1/R1
1/R2
1/R1
1/R2
0.02M Fe2(SO4)3
i lim1
i lim2
4.70. Current-voltage curves obtained for 0.02M Fe2(SO4)3 solutions with varying
concentrations of Na2SO4.
The current-voltage parameters calculated from the curves are presented in Table 4.9,
where the parameters corresponding to 10-2M Na2SO4 solutions obtained in section 4.1
are also included. The values of electrical resistance at low and high current densities
(where R2 refers to the region following the first plateau for the mixture solutions) also
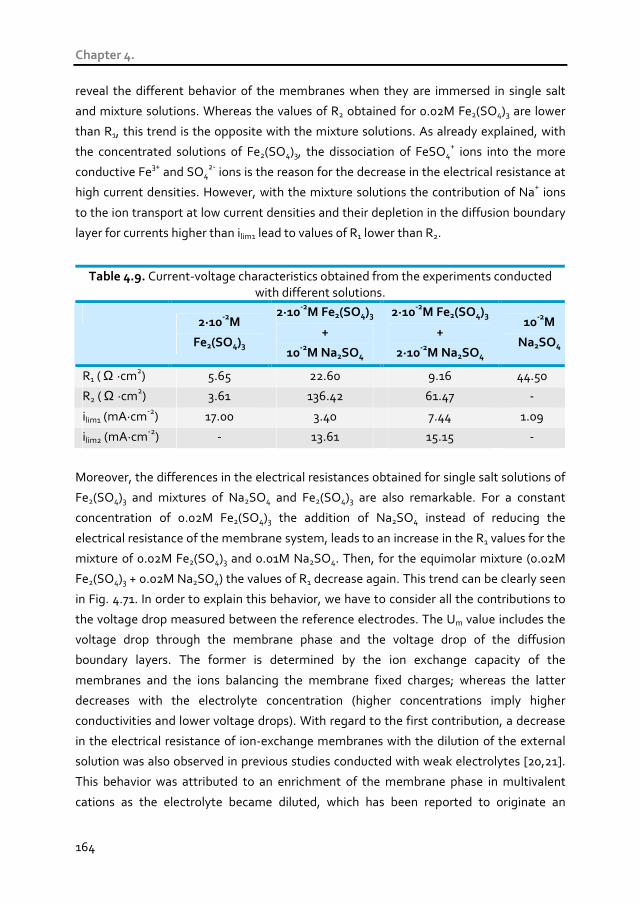
Chapter 4.
164
reveal the different behavior of the membranes when they are immersed in single salt
and mixture solutions. Whereas the values of R2 obtained for 0.02M Fe2(SO4)3 are lower
than R1, this trend is the opposite with the mixture solutions. As already explained, with
the concentrated solutions of Fe2(SO4)3, the dissociation of FeSO4+ ions into the more
conductive Fe3+ and SO42- ions is the reason for the decrease in the electrical resistance at
high current densities. However, with the mixture solutions the contribution of Na+ ions
to the ion transport at low current densities and their depletion in the diffusion boundary
layer for currents higher than ilim1 lead to values of R1 lower than R2.
Table 4.9. Current-voltage characteristics obtained from the experiments conducted with different solutions.
2·10
-2M
Fe2(SO4)3
2·10-2
M Fe2(SO4)3
+
10-2
M Na2SO4
2·10-2
M Fe2(SO4)3
+
2·10-2
M Na2SO4
10-2
M
Na2SO4
R1 ( Ω ·cm2) 5.65 22.60 9.16 44.50
R2 ( Ω ·cm2) 3.61 136.42 61.47 -
ilim1 (mA·cm-2) 17.00 3.40 7.44 1.09
ilim2 (mA·cm-2) - 13.61 15.15 -
Moreover, the differences in the electrical resistances obtained for single salt solutions of
Fe2(SO4)3 and mixtures of Na2SO4 and Fe2(SO4)3 are also remarkable. For a constant
concentration of 0.02M Fe2(SO4)3 the addition of Na2SO4 instead of reducing the
electrical resistance of the membrane system, leads to an increase in the R1 values for the
mixture of 0.02M Fe2(SO4)3 and 0.01M Na2SO4. Then, for the equimolar mixture (0.02M
Fe2(SO4)3 + 0.02M Na2SO4) the values of R1 decrease again. This trend can be clearly seen
in Fig. 4.71. In order to explain this behavior, we have to consider all the contributions to
the voltage drop measured between the reference electrodes. The Um value includes the
voltage drop through the membrane phase and the voltage drop of the diffusion
boundary layers. The former is determined by the ion exchange capacity of the
membranes and the ions balancing the membrane fixed charges; whereas the latter
decreases with the electrolyte concentration (higher concentrations imply higher
conductivities and lower voltage drops). With regard to the first contribution, a decrease
in the electrical resistance of ion-exchange membranes with the dilution of the external
solution was also observed in previous studies conducted with weak electrolytes [20,21].
This behavior was attributed to an enrichment of the membrane phase in multivalent
cations as the electrolyte became diluted, which has been reported to originate an

Results and discussion
165
increased membrane electrical conductivity [20]. In the present study, an increase in the
concentration of Na2SO4 involves the addition of more SO42- ions, which displace the
equilibrium toward the formation of FeSO4+ and Fe(SO4)2
- ions and decrease the
concentration of free Fe3+ ions (as can be seen from the concentration of species obtained
for 0.02M Fe2(SO4)3 solutions and varying concentrations of Na2SO4 shown in Table 4.10).
Moreover, as already seen from the ion uptake equilibrium (Fig. 4.62), the number of
membrane fixed charges bound to Fe3+ ions decreases as the concentration of Na2SO4
increases. Therefore, this seems to be the reason for the high values of R1 observed for
the mixtures of 0.02M Fe2(SO4)3 and 0.01M Na2SO4. The decrease in R1 obtained for a
further increase in the concentration of Na2SO4 can be explained by the more important
contribution of the conductivity of the diffusion boundary layers, which in this case may
compensate the decrease in the amount of membrane fixed charges bound to multivalent
ions.
0
5
10
15
20
25
Concentration of Na 2SO4
R1
( Ω·c
m2 )
0M Na2SO4 0.01M Na2SO4 0.02M Na2SO4
Fig. 4.71. Evolution of the electrical resistance of the membrane systems composed of
the Nafion 117 membrane and 0.02M Fe2(SO4)3 solutions with varying concentrations of Na2SO4.

Chapter 4.
166
Table 4.10. Concentration of ionic species present in single salt solutions of Na2SO4, Fe2(SO4)3 and multicomponent mixtures of both salts. The concentrations are given in
mol·L-1.
[Fe3+
] [FeSO4+] [Fe(SO4)2
-] [FeOH
2+] [Na
+] [NaSO4
-] [SO4
2-] [HSO4
2-]
0.01M Na2SO4 - - - - 1.91·10-2 8.76·10-4 9.14·10-3 1.82·10-11
0.02M Fe2(SO4)3 4.84·10-4 3.41·10-2 5.19·10-3 2.30·10-4 - - 6.95·10-3 8.55·10-3
0.02M Fe2(SO4)3
+ 0.01M Na2SO4
2.95·10-4 3.24·10-2 7.11·10-3 1.51·10-4 1.90·10-2 9.56·10-4 1.00·10-2 1.23·10-2
0.02M Fe2(SO4)3 +
0.02M Na2SO4 2.16·10-4 3.09·10-2 8.81·10-3 1.11·10-4 3.75·10-2 2.46·10-3 1.31·10-2 1.61·10-2
With respect to the values of ilim, they can be also compared in order to analyze the
selectivity of the membrane at different current densities. As commented above, when
the ilim1 is reached the supply of Na+ ions to the surface of the membrane is limited by
diffusion and their contribution to the membrane conductance diminishes at current
densities higher than ilim1. This hypothesis is supported by the fact that a twofold increase
in the concentration of Na2SO4 also implies an almost twofold increase in the ilim1 values.
Therefore, it seems that Na+ and Fe(III) species are transported simultaneously at currents
lower than ilim1, but the transport of Na+ ions occurs faster due to their higher diffusion
coefficients (see Table 4.8). Once the supply of Na+ ions to the membrane surface is set
under diffusion control, the transport of Fe3+ ions through the membrane is greater and,
in consequence, Fe3+ ions become the main charge carriers at high current densities (i >
ilim1). Fig. 4.72 shows a scheme of the concentration profiles of both species in the
depleting diffusion boundary layer when current densities higher than ilim1 are applied to
the membrane system.
The ability of the Nafion 117 membrane to separate ions of different valence depending
on the applied current density could have practical implications for certain processes
where the recovery of a specific valuable metal and its separation from other cations of
different valence is desired. Moreover, the effect of the current density on the
permselectivity of these membranes could be used in combination with other existing
strategies in order to achieve a highly effective separation between different cations
present in multicomponent industrial effluents [59,60].

Results and discussion
167
Fig. 4.72. Schematic representation of the diffusion boundary layer next to a Nafion 117
membrane at current densities higher than ilim1.
4.2.4 Conclusions
The competitive cation uptake and transport through the Nafion 117 membrane has been
investigated in the present section. The main conclusions regarding the competitive ion
transport between H+ and Ni2+ ions, which are present in the rinse waters generated in
various metal finishing industries, are summarized as follows:
The ion uptake experiments have shown that the membrane fixed charges have
an important preference for Ni2+ ions over H+ ions. When the membranes are
equilibrated with single salt solutions of NiSO4 they become saturated in Ni2+
ions. If the concentration of CrO3 is higher than that of NiSO4, the amount of
fixed charges bound to H+ ions becomes more significant but; even for the
highest content of CrO3 in the equilibrating solution, the fraction of membrane
fixed charges balanced with Ni2+ ions is predominant. These results stem from
the stronger attractive forces existing between the membrane fixed charges and
multivalent ions.
The addition of CrO3 to NiSO4 solutions implies an important increase in the
concentration of H+ ions. The transport competition between H+ and Ni2+ ions
delays the depletion of Ni2+ ions, which occurs for higher current densities in the
mixture solutions. Moreover, the acidic pH values of the 10-2M CrO3 solutions
prevent the formation of Ni(OH)2 precipitates at the anodic side of the
membrane.

Chapter 4.
168
The ilim values increase with both the concentration of NiSO4 and CrO3; however,
when the concentration of NiSO4 is higher than that of CrO3, the ilim increases
more notoriously with the concentration of NiSO4. Although two cationic species
coexist in the electrolyte (Ni2+ and H+ ions), only one ilim was observed in the
current-voltage curves. This result can be explained by the fact that the
depletion of H+ ions is less likely to occur, since H+ ions have higher mobility and
their supply from the bulk solution to the diffusion boundary layer occurs faster
in relation to the supply of Ni2+ ions.
The ohmic resistance of the membrane systems, R1, exhibits a sharp decrease
with the equivalent cationic charge ( +Q ) for the most diluted solutions. This
decreasing trend is somewhat attenuated as the concentration of CrO3 increases.
These results denote an important contribution of the resistance of the diffusion
boundary layers to the total ohmic resistance at low electrolyte concentrations.
The selectivity of the membranes for Ni2+ ions is very high in single salt solutions
of NiSO4. For the mixture solutions with low [Ni2+]/[H+] ratios the TNi2+ values
decrease considerably; however, the contribution of Ni2+ as current carriers is still
important. For [Ni2+]/[H+] ratios exceeding the unity, the current passed through
the membrane is mainly transported by Ni2+ ions, with TNi2+ values approaching
0.9.
With regard to the competitive ion transport between Fe(III) species and Na+ ions, which
are typically found in acid mine drainage solutions, the main conclusions are outlined
below:
The membrane uptake of Fe(III) was higher than that of Na+ ions, which is also in
congruence with the hypothesis that the membrane fixed charges have stronger
electrostatic interactions with multicharged ions. The majority of Fe(III) balanced
with the membrane fixed charges is in the form of Fe3+ ions; however, FeSO4+
ions are also involved in the equilibrium uptake of the membranes. The addition
of Na2SO4 to the Fe2(SO4)3 solutions implies an increase in the concentration of
SO42- ions and displaces the equilibrium toward the formation of more FeSO4
+
ions, whose concentration inside the membrane phase increases too with the
concentration of Na2SO4.

Results and discussion
169
The chronopotentiometric curves obtained for both 0.02M Fe2(SO4)3 and
mixtures of Fe2(SO4)3 and Na2SO4 showed a decrease in Um with time for the
range of high underlimiting currents. This change is originated by a shift in the
equilibrium conditions in the diffusion boundary layers as the polarization of the
membrane system is intensified and the external solution becomes diluted. The
dissociation of FeSO4+ ions into the more conductive and mobile Fe3+ and SO4
2-
ions is favored at higher current densities, which leads to a reduction of the
electrical resistance of the membrane system.
At high current densities the formation of Fe(OH)3 precipitates occurs for both
Fe2(SO4)3 solutions and mixtures of Fe2(SO4)3 and Na2SO4. This phenomenon can
be detected from a sharp increase in Um with time in the chronopotentiometric
curves. The precipitate layer was also visually confirmed at the anodic side of the
membranes. The only difference between the single salt solutions and the
mixtures is the attenuated increase of Um when the precipitates are formed due
to the presence of the more mobile Na+ ions.
The current-voltage curves obtained for the mixtures of Fe2(SO4)3 and Na2SO4
show two ilim values and their corresponding plateaus. The first ilim (ilim1) is
approximately proportional to the concentration of Na+ ions, so that it is
associated with the depletion of Na+ ions at low current densities. When the
second ilim (ilim2) is reached, the precipitation of Fe(OH)3 starts and leads to an
extended plateau. The presence of two ilim values defines two regions of
predominant transport of different ions. At currents lower than ilim1 the transport
of Na+ and FeSO4+ ions occurs simultaneously. However, the transport of Na+
ions may be faster, since their concentration is vanishing from the depleting
membrane surface when the ilim1 is reached. At currents higher than ilim1, once
Na+ ions are depleted from the membrane surface, Fe3+ ions are the main charge
carriers through the membrane. These results indicate that the faster diffusion
of Na+ ions plays a more important role than the higher ion uptake of Fe(III)
species by the membrane.
The comparison between the values of R1 obtained for each membrane system
reveal a strong relationship between the membrane conductivity and the type of
ions bound to the membrane fixed charges. For a constant concentration of
0.02M Fe2(SO4)3, the R1 values show a maximum with the addition of Na2SO4.
These results indicate that the membrane conductance is higher when the fixed
Chapter 4.
170
charges are balanced with multivalent ions (Fe3+). On the contrary, for the
mixtures of 0.02M Fe2(SO4)3 and 0.02M Na2SO4, the R1 values decrease due to
the more important increase in the conductivity of the diffusion boundary layers.
Results and discussion
171
4.3 Investigation of the mechanisms of overlimiting
mass transfer
4.3.1 Introduction The mass transfer through ion-exchange membranes tends to be the governing step in
electrodialysis. As commented in previous sections, the fixed charges attached to the
structure of the membranes favor the transport of counterions in detriment of that of
coions, which leads to the development of concentration gradients at the
membrane/solution interfaces. When the ion concentration approaches zero at the
membrane depleting surface, the transmembrane ion flux does not increase even if the
applied electric field is further intensified. At this stage the ilim has been reached and the
supply of ions to the membrane is set under diffusion control.
The phenomenon of concentration polarization is common to all membrane processes:
electro- as well as pressure-driven ones [61]. In both cases, the concentration polarization
leads to the saturation of the transmembrane flux for increasing driving forces, as can be
schematically seen in Fig. 4.73. However, electrodialysis membranes differ from other
types of membranes in the fact that they allow a further increase of the current density
beyond the ilim if a certain threshold in the voltage drop is surpassed, as indicated in Fig.
4.73(b) [62]. This peculiarity of ion-exchange membranes is still not well understood and
has engaged the interest for ion-exchange membranes of multiple research groups.

Chapter 4.
172
(a) (b)
Transmembrane pressure, ∆P
Per
mea
te fl
ux, J
Jlim
Transmembrane voltage drop, U m
Cur
rent
den
sity
, i
ilim
Overlimiting current
densities
Fig. 4.73. Comparison between the characteristic curves ion flux vs. driving force for (a) pressure-driven membrane and (b) electrodialysis membranes.
Since the overlimiting currents cannot be explained by the concentration polarization
theory, they were initially attributed to the generation of water splitting products due to
the polarization of water molecules occurring near the membrane fixed charges under the
influence of strong electric fields [63]. Besides, the presence of OH- and H+ ions in the
diffusion boundary layer could also imply an attraction of the salt ions to the membrane
surface and contribute to increase the current, which is known as the exaltation effect
[61]. The hypothesis of increased water splitting was also consistent with the pH
variations experimentally observed in some electrodialysis experiments. Accordingly, the
water splitting was assumed as common to all electrodialysis systems and the
overlimiting currents were considered detrimental for the transport of salt counterions
through the membranes. In consequence, the use of overlimiting currents has been
traditionally avoided because it was considered to imply a waste of energy and a decrease
in the current efficiency [64].
Nevertheless, more recent studies have proven that the increase in current above the ilim
values cannot be entirely attributed to the water dissociation products [65]. Whereas an
important catalytic activity toward the dissociation of water has been proven in strong
ionizable groups present in anion-exchange membranes (e.g. tertiary amines) [66,67]; a
nearly absent dissociation of water was verified in cation-exchange membranes with
sulfonate groups [68]. This has implied the formulation of additional interpretations in
order to explain the origin of the overlimiting currents in electrodialysis, such as the
implication of convective phenomena. In this regard, the non-uniform distribution of the
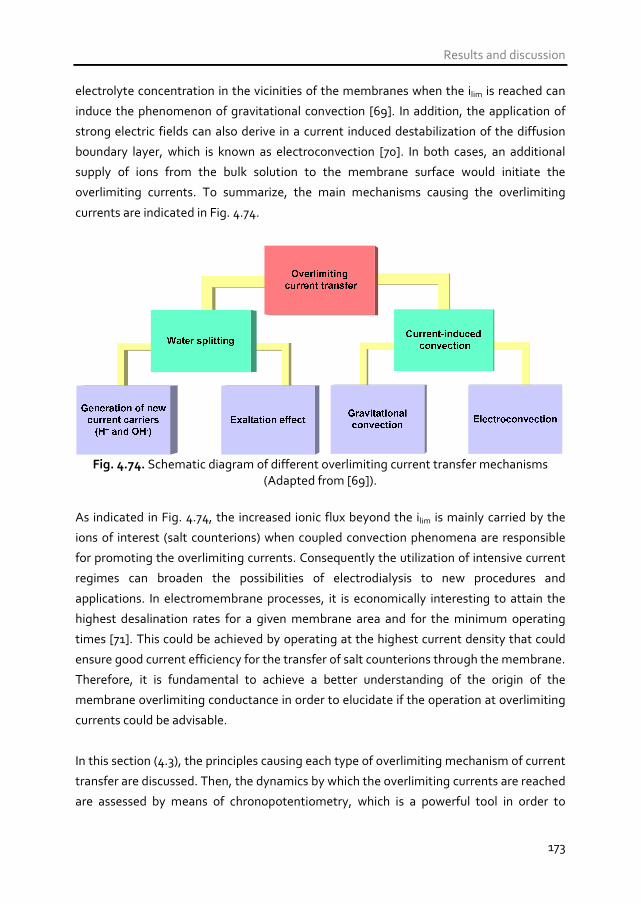
Results and discussion
173
electrolyte concentration in the vicinities of the membranes when the ilim is reached can
induce the phenomenon of gravitational convection [69]. In addition, the application of
strong electric fields can also derive in a current induced destabilization of the diffusion
boundary layer, which is known as electroconvection [70]. In both cases, an additional
supply of ions from the bulk solution to the membrane surface would initiate the
overlimiting currents. To summarize, the main mechanisms causing the overlimiting
currents are indicated in Fig. 4.74.
Fig. 4.74. Schematic diagram of different overlimiting current transfer mechanisms
(Adapted from [69]).
As indicated in Fig. 4.74, the increased ionic flux beyond the ilim is mainly carried by the
ions of interest (salt counterions) when coupled convection phenomena are responsible
for promoting the overlimiting currents. Consequently the utilization of intensive current
regimes can broaden the possibilities of electrodialysis to new procedures and
applications. In electromembrane processes, it is economically interesting to attain the
highest desalination rates for a given membrane area and for the minimum operating
times [71]. This could be achieved by operating at the highest current density that could
ensure good current efficiency for the transfer of salt counterions through the membrane.
Therefore, it is fundamental to achieve a better understanding of the origin of the
membrane overlimiting conductance in order to elucidate if the operation at overlimiting
currents could be advisable.
In this section (4.3), the principles causing each type of overlimiting mechanism of current
transfer are discussed. Then, the dynamics by which the overlimiting currents are reached
are assessed by means of chronopotentiometry, which is a powerful tool in order to
Chapter 4.
174
distinguish which overlimiting mass transfer mechanism predominates over the rest.
Finally, the effect of the overlimiting phenomena on the steady state behavior of the
membranes and the effect of the electrolyte on the type of overlimiting mechanism are
analyzed. This could be used in order to evaluate the convenience of applying
overlimiting currents, which could extend the use of electrodialysis to new modes of
operation that could be promising for the treatment of metal containing effluents.
4.3.2 Mechanisms of overlimiting mass transfer
4.3.2.1 Water splitting The splitting of water molecules in protons and hydroxide ions was the first phenomenon
used to explain the overlimiting currents in electrodialysis, owing to the experimental
detection of pH changes in electrodialysis cells. The reaction of dissociation of water
occurs in aqueous solutions, as described by the following equation:
H2O H+ + OH- (4.64)
However, the rate of dissociation of water in aqueous solutions can be significantly
incremented in the presence of ion-exchange membranes. Simons suggested that the
dissociation of water can occur due to protonation and deprotonation reactions of the
membrane fixed charges [72]. These reactions are obviously favored when an intense
electric field is applied, the concentration polarization becomes very severe and the
concentration of salt counterions almost vanishes at the depleting membrane surface,
hence leaving the membrane fixed charges uncompensated [71]. Under these
circumstances the water molecules are attracted and polarized by the membrane fixed
charges and initiate the dissociation of water. In the case of a cation-exchange membrane
having fixed anionic groups, A, the dissociation of water would occur according to the
following reactions:
AH + H2O1
1
k
k−
↔ A- + H3O+ (4.65)
A- + H2O2
2
k
k−
↔ AH + OH- (4.66)

Results and discussion
175
These chain reactions take place in a very thin reaction layer (10-100 Å) called the space
charge region [71]. The water splitting products are then transported in opposite
directions owing to the applied electric field. The protons would be transported through
the cation-exchange membrane whereas the OH- ions migrate back across the depleting
diffusion boundary layer.
The rate of dissociation at different ion-exchange membranes would therefore depend on
the values of their corresponding reaction constants. The backward reactions of
recombination ( 1−k and 2−k ) are normally rapid, whereas the direct reactions of
dissociation depend on the nature of the membrane fixed charges, which can be
expressed as a function of the aK (acid-dissociation equilibrium constant) according to:
aKkk ⋅= −11 (4.67)
a
w
K
Kkk ⋅= −22 (4.68)
where wK is the constant of the water dissociation reaction, which was previously
defined in Eqs. (4.7) and (4.11). Therefore, the limiting reaction that determines the
extent of the water dissociation depends on the aK of the membrane functional groups.
Accordingly, several authors have ordered different membrane fixed charges in order of
increasing tendency for the water splitting reaction by comparing their rate limiting
constants ( limk ), which are presented in Table 4.11. For example, according to Table 4.11,
the catalytic dissociation of water should be much higher in phosphonic acid groups than
in sulfonic acid groups:
Table 4.11. Series of catalytic activity of functional groups of different ion-exchange membranes in order of increasing rate constants for the dissociation of water [73].
-N+(CH3)3 -SO3
- PO3H
- =NH -NH2
+ ≡ NH≡ -COO
- -PO3
2-
limk
(s-1) 0 3·10-3 3·10-2 10-1 10-1 1 10 102
Finally, it must be also noted that the dissociation of water can be incremented by the
specific conditions of each electrodialysis cell. For example, it has been suggested that
the strength of the electric field accelerates the rotation of water molecules and increases
Chapter 4.
176
the mobility of the H+ and OH- ions, hence boosting the chain reactions of (4.65) and
(4.66) [68]. Moreover, it has been proven that the formation of deposits of metal
hydroxides at the surface of cation-exchange membranes can also increase the strength
of the electric field in the reaction layer formed near the depleting surface of the
membranes [74]. Therefore, in order to ascertain if the dissociation of water accounts for
the major part of the current density exceeding the ilim, all the above factors should be
specifically evaluated for each membrane/electrolyte system.
4.3.2.2 Exaltation effect The term “exaltation effect” is attributed to an increase in the migration of salt
counterions occurring as a result of the modification of the electric field due to the
presence of new ionic species, which are the product of reactions taking place next to a
liquid/solid interface (ion-exchange membrane or electrode). This effect was first
reported in the form of an increase of the limiting current density related to the reduction
of metals in electrodes, which is associated with the OH- ions produced by the reduction
of water [75,76]. It is assumed that the OH- ions generated attract salt counterions from
the bulk solution, thus causing the increase of limiting currents.
In the case of ion-exchange membranes, the dissociation of water molecules occurring via
protonation/deprotonation reactions of the membrane fixed sites can also imply an
increase in the current migration of salt counterions. In the specific case of a cation-
exchange membrane, the OH- ions released to the depleting diffusion boundary layer
would exert attractive forces on the cations present in the solution bulk [61,77]. When this
occurs, the exalted current density of counterions is given by an equation different from
the Peers’ equation (Eq. (1.13)), which takes into account the transport of counterions
attracted by the water splitting products. The limiting current density for the salt
counterions is predicted by Eq. (4.69), which was proposed by Kharkats [75,77-80]:
w
w
jjj i
D
DcDi +=
δ02
lim (4.69)
Where jD is the diffusion coefficient of the salt counterion j , wD and wi are the
diffusion coefficient and the current density of the water splitting product (OH- ion in the
case of a cation-exchange membrane). As can be seen in Eq. (4.69) the current associated
with the transport of the salt counterion increases due to the generation of water splitting
Results and discussion
177
products, which attract positively charged salt cations from the solution bulk towards the
interface [81]. However, due to the comparatively higher mobility of OH- ions in relation
to that of metal ions, the contribution of the exaltation effect is rather small (low values
of wj DD / ) [78]. Moreover, it has to be taken into account that this effect is restricted to
those cases where intense water splitting exists [69].
4.3.2.3 Gravitational convection
Gravitational convection is a type of natural convection caused by volume forces that
arise when a non-uniform distribution of solution density is present at the
membrane/solution interface. In the specific case of ion-exchange membranes being
exposed to the influence of an electric field, when concentration polarization develops,
substantial density differences are created between the solution in the bulk and next to
the membrane. This non-uniform distribution of solution density causes an Archimedean
volume force which brings the solution in motion, thus implying the distortion and mixing
of the diffusion boundary layers. The volume force displaces the heavier solution (bulk
solution) towards the lighter solution (depleted boundary layer), thus implying an
additional supply of salt counterions to the membrane depleting surface and allowing an
increase in the current density above the ilim.
The distortion of the diffusion boundary layer by gravitational convection was
investigated by Larchet et al. [82]. It has been found that the thickness of the diffusion
boundary layer decreases significantly when the gravitational convection is activated.
However, the emergence of gravitational convection is promoted under certain
circumstances. Gravitational convection is more likely and important in electrolyte
systems with higher concentrations, since the density gradients formed between the
solution bulk and the membrane depleting surface are larger. In addition, the onset of
gravitational convection also depends on the properties of the electrolyte and the
dimensional characteristics of the electrodialysis unit. Gravitational convection is favored
by high intermembrane distances, electrolytes of low viscosity and strong electric fields.
The orientation of the membrane/solution interface in the gravitational earth field has
been also reported to affect the development of gravitational convection. In systems with
the membranes placed in horizontal position, gravitational convection is unfeasible as the
lighter solution is placed below the membrane. On the contrary, when the lighter solution
is placed above the membrane, the tendency of gravitational convection to emerge is
Chapter 4.
178
evaluated by calculating the dimensionless Rayleigh number, which is given by Eq. (4.70)
[78,80,83]:
D
gXRa
νρρ 3∆= (4.70)
In Eq. (4.70) ρ∆ is the change in the solution density ρ , which occurs between the upper
and lower portions of a layer of thickness X , in which the change in the solution density
occurs; g is the gravitational acceleration; ν is the kinematic solution viscosity; and D is
the diffusion coefficient of the electrolyte. If the Ra number exceeds a critical threshold
( crRa of 1708), the volume with a negative density gradient floats up with acceleration
[78]. On the contrary, if the crRa is not exceeded, the system is stable and no
gravitational convection develops.
Nevertheless, ion-exchange membranes are usually installed in vertical position in
electrodialysis cells and, therefore, the solution density gradient is horizontal. In that
case, the gravitational convection generally emerges without threshold, i.e.: it develops
always and increases gradually with the current [78]. This phenomenon has been widely
studied with NaCl or KCl solutions, but to our knowledge, there are not many studies
regarding the development of gravitational convection with systems of heavy metal ions.
In this regard, the relative importance of gravitational convection on the overlimiting
conductance of the membranes could be greater with solutions containing multivalent
metals, since the density gradients formed at the solution/membrane interfaces are
larger for lower molar electrolyte concentrations. The solutions used in our study have
concentrations relatively lower than those for which gravitational convection is significant
in systems of NaCl [61,80]. Therefore, it is also interesting to investigate if this type of
coupled convection has an important role in diluted solutions of heavy metal ions.
4.3.2.4 Electroconvection Electroconvection is a type of current induced convection which develops at an advanced
stage of concentration polarization as a consequence of the interaction between a strong
electric field and the electrical non-uniformities present at the depleting diffusion layer of
a membrane/electrolyte system. This phenomenon has been considered the main
transport mechanism originating the overlimiting currents in electrodialysis systems. The
role of electroconvection seems to be comparatively large in diluted systems where the
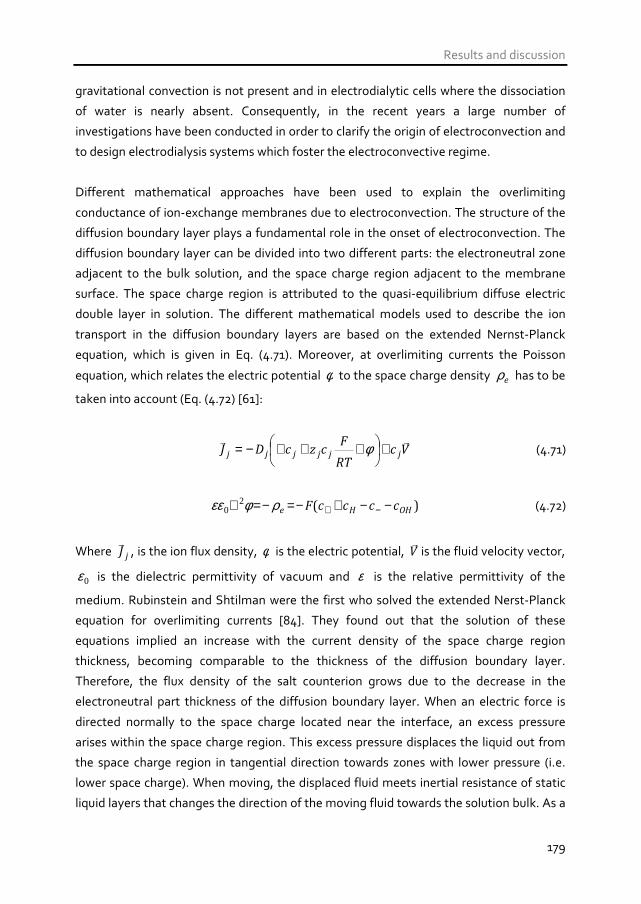
Results and discussion
179
gravitational convection is not present and in electrodialytic cells where the dissociation
of water is nearly absent. Consequently, in the recent years a large number of
investigations have been conducted in order to clarify the origin of electroconvection and
to design electrodialysis systems which foster the electroconvective regime.
Different mathematical approaches have been used to explain the overlimiting
conductance of ion-exchange membranes due to electroconvection. The structure of the
diffusion boundary layer plays a fundamental role in the onset of electroconvection. The
diffusion boundary layer can be divided into two different parts: the electroneutral zone
adjacent to the bulk solution, and the space charge region adjacent to the membrane
surface. The space charge region is attributed to the quasi-equilibrium diffuse electric
double layer in solution. The different mathematical models used to describe the ion
transport in the diffusion boundary layers are based on the extended Nernst-Planck
equation, which is given in Eq. (4.71). Moreover, at overlimiting currents the Poisson
equation, which relates the electric potential φ to the space charge density eρ has to be
taken into account (Eq. (4.72) [61]:
VcRT
FczcDJ jjjjjj
rr+
∇+∇−= φ (4.71)
)( OHHe ccccF −−+−=−=∇ −+ρφεε 20 (4.72)
Where jJr
, is the ion flux density, φ is the electric potential, Vr
is the fluid velocity vector,
0ε is the dielectric permittivity of vacuum and ε is the relative permittivity of the
medium. Rubinstein and Shtilman were the first who solved the extended Nerst-Planck
equation for overlimiting currents [84]. They found out that the solution of these
equations implied an increase with the current density of the space charge region
thickness, becoming comparable to the thickness of the diffusion boundary layer.
Therefore, the flux density of the salt counterion grows due to the decrease in the
electroneutral part thickness of the diffusion boundary layer. When an electric force is
directed normally to the space charge located near the interface, an excess pressure
arises within the space charge region. This excess pressure displaces the liquid out from
the space charge region in tangential direction towards zones with lower pressure (i.e.
lower space charge). When moving, the displaced fluid meets inertial resistance of static
liquid layers that changes the direction of the moving fluid towards the solution bulk. As a
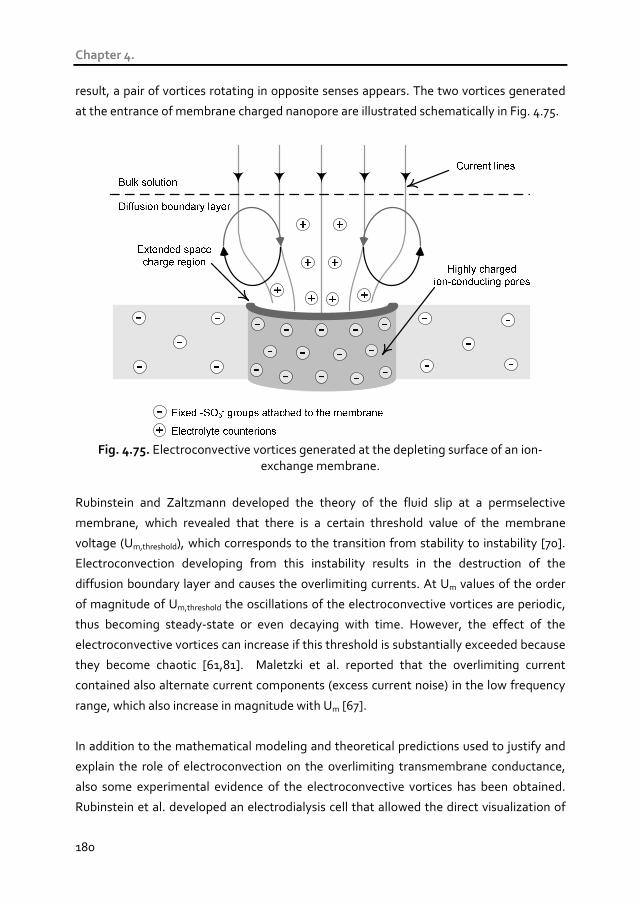
Chapter 4.
180
result, a pair of vortices rotating in opposite senses appears. The two vortices generated
at the entrance of membrane charged nanopore are illustrated schematically in Fig. 4.75.
Fig. 4.75. Electroconvective vortices generated at the depleting surface of an ion-
exchange membrane.
Rubinstein and Zaltzmann developed the theory of the fluid slip at a permselective
membrane, which revealed that there is a certain threshold value of the membrane
voltage (Um,threshold), which corresponds to the transition from stability to instability [70].
Electroconvection developing from this instability results in the destruction of the
diffusion boundary layer and causes the overlimiting currents. At Um values of the order
of magnitude of Um,threshold the oscillations of the electroconvective vortices are periodic,
thus becoming steady-state or even decaying with time. However, the effect of the
electroconvective vortices can increase if this threshold is substantially exceeded because
they become chaotic [61,81]. Maletzki et al. reported that the overlimiting current
contained also alternate current components (excess current noise) in the low frequency
range, which also increase in magnitude with Um [67].
In addition to the mathematical modeling and theoretical predictions used to justify and
explain the role of electroconvection on the overlimiting transmembrane conductance,
also some experimental evidence of the electroconvective vortices has been obtained.
Rubinstein et al. developed an electrodialysis cell that allowed the direct visualization of
Results and discussion
181
the electroconvective vortices [85]. Kwak et al. also developed a microscale
electrodialysis cell incorporating a microscopic fluorescence imaging device to allow the
visualization of the electroconvective vortices [86]. Chronopotentiometry has been also
utilized as a useful tool to identify the onset of electroconvection, since the registration of
some membrane voltage oscillations with time have been attributed to the emergence of
electroconvective vortices [62,80,87].
Due to the obvious advantages and improvements that electroconvection could imply for
electromembrane separation processes, different approaches have been used to increase
the ability of ion-exchange membranes to initiate electroconvection. These include the
surface modification of membranes in order to vary the hydrophobicity of the membrane
surface and the increase of the degree of heterogeneity of the membranes [88]. Both
surface and conductive heterogeneities have been introduced into ion-exchange
membranes in order to enhance electroconvection [62,89]. However, it has been also
reported that the electrolyte properties can also trigger the onset of the overlimiting
currents by shifting it to lower voltages. It has been reported that solvents of greater
permittivity or higher bulk ionic concentrations could imply a more rapid growth of
overlimiting currents [90]. Also the size of the counterions has been reported to affect the
intensity of electroconvection [91]. Therefore, the present study could be useful to
identify the role of multivalent heavy metal ions on the formation and development of
electroconvective instabilities. The principle of electroconvection to transform electrical
energy in mechanical energy has also increased the scope of utilization of overlimiting
current regimes in the field of micro- and nanofluidics [61,92-94].
4.3.3 Study of the overlimiting currents by means of
chronopotentiometry and current-voltage curves
4.3.3.1 Dynamics of ion transport in membrane systems operated at
overlimiting currents In order to evaluate the viability and the technical feasibility of applying overlimiting
currents in electrodialysis systems, it is crucial to know which overlimiting mass transfer
mechanism predominates in each situation. For this purpose, an exhaustive analysis of
the chronopotentiometric response of each membrane system can be of major utility.
Chronopotentiometry is a powerful tool which allows us not only to obtain the final
steady state of a membrane system, but also the dynamics by which this steady state is

Chapter 4.
182
reached [87]. Therefore, a qualitative interpretation of the chronopotentiograms
obtained in the previous sections (4.1 and 4.2) would allow us to identify the main
mechanisms of overlimiting current transfer predominating in each system.
There are some chronopotentiometric features that can be directly attributed to specific
overlimiting mass transfer mechanisms. Fig. 4.76 shows different examples of
chronopotentiometric curves obtained at overlimiting currents, which are explained as
follows:
Fig. 4.76(a) shows the curves typically obtained when the formation of
precipitates takes place at the surface of a cation-exchange membrane. The
formation of precipitates implies the increase of the electrical resistance of the
membrane system due to the hindered transport of ions through the precipitate
layer. The increase in the electrical resistance is manifested in the form of an
increase of Um with time as the precipitate layer thickness grows.
Fig. 4.76(b) shows a curve typical of bipolar membranes, which is also registered
after the formation of a layer of precipitates at the surface of the membranes.
The plateau formed in the curves is attributed to the hindered recombination
reaction of OH- and H+ ions formed at the bipolar junction composed of the
membrane and the precipitate layer.
The curve shown in Fig. 4.76(c) is usually formed when gravitational convection
is the main overlimiting mass transfer mechanism. These curves show a
maximum in Um which is formed initially when a current density higher than ilim is
applied and intense concentration gradients are developed near the membrane.
Subsequently, the differences in density between the depleted layers and the
bulk solution activate the gravitational convection and lead to a decrease in the
thickness of the boundary layers. This phenomenon is registered in the
chronopotentiograms as a gradual decrease of Um with time.
The curves shown in Fig. 4.76(d) are typical of systems where electroconvection
is the main mechanism of overlimiting mass transfer. The formation of
electroconvective vortices produces a distortion of the diffusion boundary layer,
which leads to chaotic fluctuations in the voltage drop through the membrane.
Therefore, the oscillations in Um with time registered in the
chronopotentiograms reveal the predominance of electroconvection.

Results and discussion
183
(a) (b)
0 100 200 300 400
t (s)
Um
(V
)
formation of precipitates
200 300 400 500 600
t (s)U
m (
V)
slow recombination of water dissociation
products
(c) (d)
0 100 200 300t (s)
Um
(V
)
Decrease of the thickness of the
diffusion boundary layer
Maximum in Um
0 100 200 300t (s)
Um
(V
)
Electroconvective vortices
Fig. 4.76. Chronopotentiometric features caused by different overlimiting mass transfer phenomena: (a) Sharp increase of Um due to the formation of precipitates, (b) relaxation
profile of Um as a consequence of the accelerated water splitting originated at the bipolar junction formed between a cation-exchange membrane and the deposits of metal hydroxide precipitates, (c) maximum and subsequent decrease in Um caused by a
decrease of the thickness of the diffusion boundary layer due to the emergence of gravitational convection, (d) oscillations in Um due to the electroconvective vortices.

Chapter 4.
184
4.3.3.2 Steady state of membrane systems operating at overlimiting
currents The current-voltage curves of ion-exchange membranes represent the steady state
relationship between the current and the membrane voltage drop. They can also be very
useful to identify the differences between the mechanisms of overlimiting mass transfer
and to estimate if the application of overlimiting currents could be beneficial for the mass
transfer and the energy consumption in an electrodialysis cell.
Fig. 4.77 shows different current-voltage curves typical of membrane systems where
different overlimiting mass transfer mechanisms predominate. The curves are normalized
by dividing the current density by their corresponding ilim. In the case of the membranes
where the formation of precipitates occurs (curves (a) and (b)), very long plateaus are
developed. However, curves (a) and (b) represent two different types of behavior: curves
showing a rapid increase in current in the overlimiting region and curves with extended
plateaus (without overlimiting region). The former case is typical of membrane systems
where the precipitate layer formed at the membrane surface does not entirely block the
ionic transport and can catalyze the water dissociation at the bipolar interface formed by
the precipitate and the membrane. The rapid increase in current and the very low
electrical resistance of the overlimiting region is indicative of an increased amount of
ionic species present in the membrane region, which is not only due to ion transport, but
also due to the catalytic generation of new species; in this case H+ and OH- ions. On the
contrary, the latter case occurs when the precipitate layer does not have high catalytic
activity for the dissociation of water or blocks the pores of the membrane. In this case,
the electrical resistance of the membrane system grows without threshold.
The other two curves presented in Fig. 4.77 (curves (c) and (d)) are typical of systems in
which the overlimiting conductance is propitiated principally by coupled convection.
However both curves differ significantly in the length of their plateaus. This different
behavior is due to a different tendency for the initiation of the overlimiting currents. In
this regard, the length of the plateau region has been typically used as a parameter to
assess the propensity with which an electrolyte/membrane system reaches the
overlimiting regime of currents. In this sense, the plateau length can be regarded as a
measure of the energy input that has to be supplied to a membrane system in order to
onset the generation of electroconvective vortices or the gravitational convection.
Obviously, in systems with shorter plateaus the application of overlimiting currents would
improve more importantly the performance of electrodialysis systems, since increased
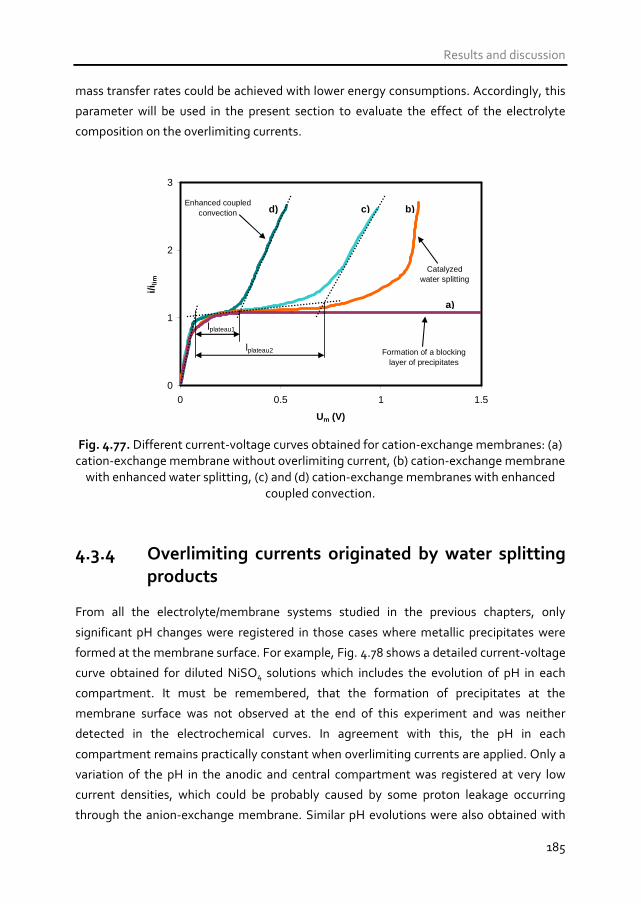
Results and discussion
185
mass transfer rates could be achieved with lower energy consumptions. Accordingly, this
parameter will be used in the present section to evaluate the effect of the electrolyte
composition on the overlimiting currents.
0
1
2
3
0 0.5 1 1.5
Um (V)
i/ilim
lplateau1
lplateau2
Enhanced coupled convection
Catalyzed water splitting
Formation of a blocking layer of precipitates
d) c) b)
a)
Fig. 4.77. Different current-voltage curves obtained for cation-exchange membranes: (a)
cation-exchange membrane without overlimiting current, (b) cation-exchange membrane with enhanced water splitting, (c) and (d) cation-exchange membranes with enhanced
coupled convection.
4.3.4 Overlimiting currents originated by water splitting
products From all the electrolyte/membrane systems studied in the previous chapters, only
significant pH changes were registered in those cases where metallic precipitates were
formed at the membrane surface. For example, Fig. 4.78 shows a detailed current-voltage
curve obtained for diluted NiSO4 solutions which includes the evolution of pH in each
compartment. It must be remembered, that the formation of precipitates at the
membrane surface was not observed at the end of this experiment and was neither
detected in the electrochemical curves. In agreement with this, the pH in each
compartment remains practically constant when overlimiting currents are applied. Only a
variation of the pH in the anodic and central compartment was registered at very low
current densities, which could be probably caused by some proton leakage occurring
through the anion-exchange membrane. Similar pH evolutions were also obtained with
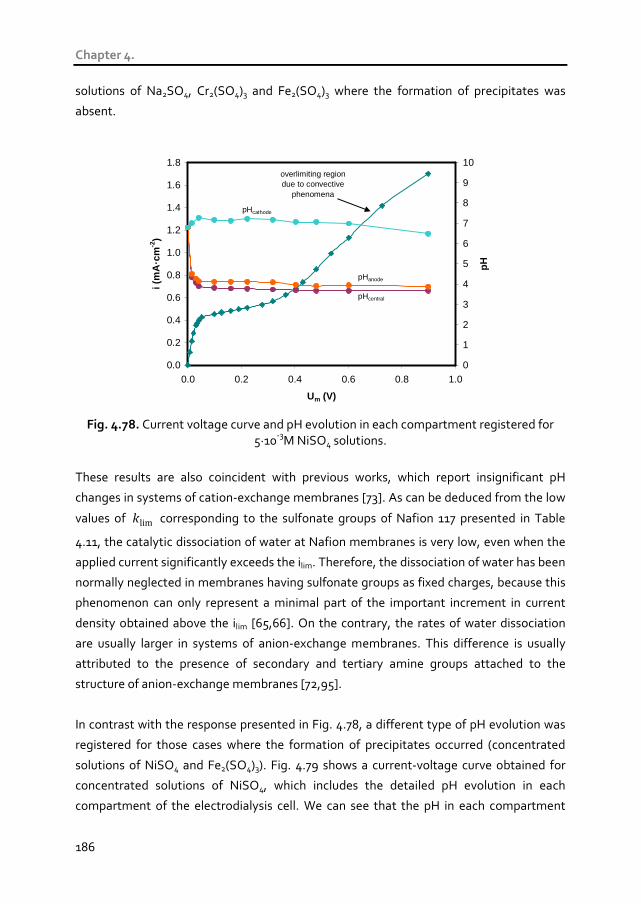
Chapter 4.
186
solutions of Na2SO4, Cr2(SO4)3 and Fe2(SO4)3 where the formation of precipitates was
absent.
0.0
0.2
0.4
0.6
0.8
1.0
1.2
1.4
1.6
1.8
0.0 0.2 0.4 0.6 0.8 1.0
Um (V)
i (m
A·c
m-2
)
0
1
2
3
4
5
6
7
8
9
10
pH
pHcathode
pHanode
pHcentral
overlimiting region due to convective
phenomena
Fig. 4.78. Current voltage curve and pH evolution in each compartment registered for
5·10-3M NiSO4 solutions.
These results are also coincident with previous works, which report insignificant pH
changes in systems of cation-exchange membranes [73]. As can be deduced from the low
values of limk corresponding to the sulfonate groups of Nafion 117 presented in Table
4.11, the catalytic dissociation of water at Nafion membranes is very low, even when the
applied current significantly exceeds the ilim. Therefore, the dissociation of water has been
normally neglected in membranes having sulfonate groups as fixed charges, because this
phenomenon can only represent a minimal part of the important increment in current
density obtained above the ilim [65,66]. On the contrary, the rates of water dissociation
are usually larger in systems of anion-exchange membranes. This difference is usually
attributed to the presence of secondary and tertiary amine groups attached to the
structure of anion-exchange membranes [72,95].
In contrast with the response presented in Fig. 4.78, a different type of pH evolution was
registered for those cases where the formation of precipitates occurred (concentrated
solutions of NiSO4 and Fe2(SO4)3). Fig. 4.79 shows a current-voltage curve obtained for
concentrated solutions of NiSO4, which includes the detailed pH evolution in each
compartment of the electrodialysis cell. We can see that the pH in each compartment
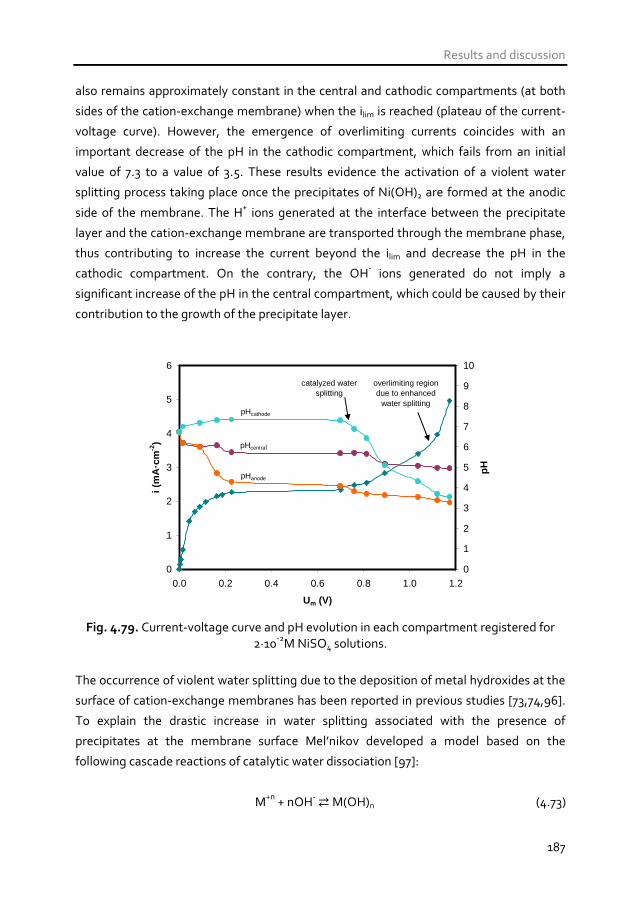
Results and discussion
187
also remains approximately constant in the central and cathodic compartments (at both
sides of the cation-exchange membrane) when the ilim is reached (plateau of the current-
voltage curve). However, the emergence of overlimiting currents coincides with an
important decrease of the pH in the cathodic compartment, which fails from an initial
value of 7.3 to a value of 3.5. These results evidence the activation of a violent water
splitting process taking place once the precipitates of Ni(OH)2 are formed at the anodic
side of the membrane. The H+ ions generated at the interface between the precipitate
layer and the cation-exchange membrane are transported through the membrane phase,
thus contributing to increase the current beyond the ilim and decrease the pH in the
cathodic compartment. On the contrary, the OH- ions generated do not imply a
significant increase of the pH in the central compartment, which could be caused by their
contribution to the growth of the precipitate layer.
0
1
2
3
4
5
6
0.0 0.2 0.4 0.6 0.8 1.0 1.2
Um (V)
i (m
A·c
m-2
)
0
1
2
3
4
5
6
7
8
9
10
pH
pHcathode
pHanode
pHcentral
catalyzed water splitting
overlimiting region due to enhanced
water splitting
Fig. 4.79. Current-voltage curve and pH evolution in each compartment registered for
2·10-2M NiSO4 solutions.
The occurrence of violent water splitting due to the deposition of metal hydroxides at the
surface of cation-exchange membranes has been reported in previous studies [73,74,96].
To explain the drastic increase in water splitting associated with the presence of
precipitates at the membrane surface Mel’nikov developed a model based on the
following cascade reactions of catalytic water dissociation [97]:
M+n + nOH- M(OH)n (4.73)

Chapter 4.
188
M(OH)n + 2H2O 1
1
k
k−
↔ M(OH)n-1+ + OH- (4.74)
M(OH)n-1+ + 2H2O
2
2
k
k−
↔ M(OH)n + H3O+ (4.75)
Based on these reactions, the series of catalytic activity for the water dissociation of
Table 4.11 was completed in Table 4.12 with the inclusion of the catalytic activity of
transition metal compounds, which includes the precipitates of Ni(OH)2 and Fe(OH)3
formed during our chronopotentiometric experiments [97].
Table 4.12. Series of catalytic activity of functional groups of different ion-exchange membranes and metal hydroxides in order of increasing rate constants for the
dissociation of water [73]. N
+(CH3)3 SO3
- Ni(OH)2 PO3H
- =NH NH2
+ ≡ NH≡ COO
- PO3
2- Fe(OH)3
limk
(s-1) 0 3·10-3 5.6·10-3 3·10-2 10-1 10-1 1 10 102 1.1·103
As can be seen from Table 4.12, the limk of Ni(OH)2 is only moderately higher than that
of the membrane sulfonate groups. Therefore, it seems that the significantly different
water splitting behavior observed in the presence of Ni(OH)2 precipitates cannot be only
attributed to their normal catalytic activity, and may be somehow incremented due to the
electric field effects. In this sense, some researchers have related the enhanced water
splitting capability of membranes having deposits of metallic hydroxides to the formation
of a quasi-bipolar structure at the junction between the membrane and the metal
hydroxides [16,74]. The bipolar junction constitutes a space charge region (depleted
double layer) where the electric fields are very strong, thus contributing to the
exponential increase of the water splitting rates with the applied current density [74,98].
Fig. 4.80 shows a schematic representation of the electric fields generated at the
interface between the immobilized metal hydroxides and the membrane. In addition to
the increased electric fields prevailing at the bipolar junction, the tendency for
dissociating water is also enhanced by the simultaneous polarization of water molecules
by the positively charged precipitate layer and by the negatively charged membrane
sulfonate groups. As a consequence, the water molecules present around the membrane
fixed charges must be strongly oriented so that the water structure may be more easily
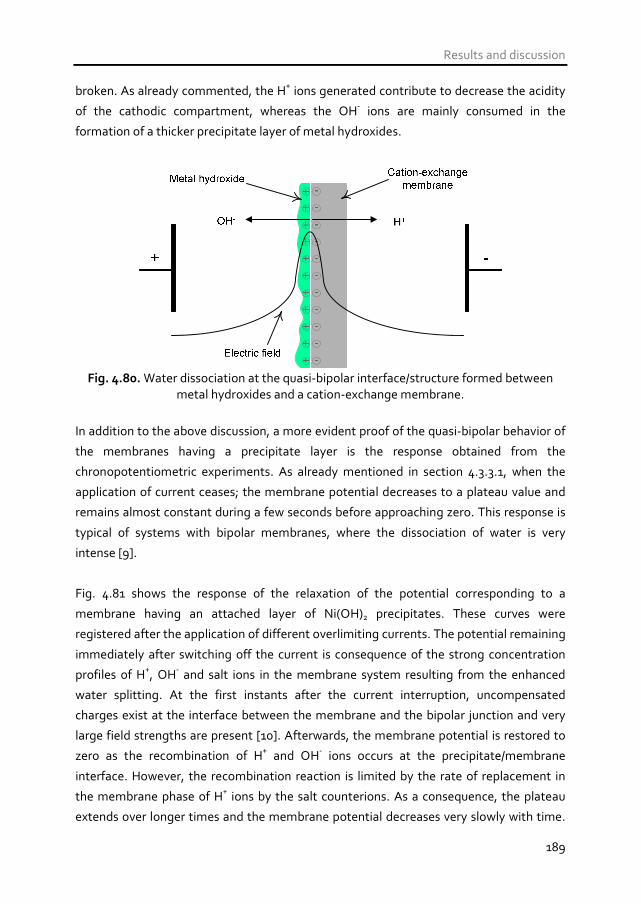
Results and discussion
189
broken. As already commented, the H+ ions generated contribute to decrease the acidity
of the cathodic compartment, whereas the OH- ions are mainly consumed in the
formation of a thicker precipitate layer of metal hydroxides.
Fig. 4.80. Water dissociation at the quasi-bipolar interface/structure formed between
metal hydroxides and a cation-exchange membrane.
In addition to the above discussion, a more evident proof of the quasi-bipolar behavior of
the membranes having a precipitate layer is the response obtained from the
chronopotentiometric experiments. As already mentioned in section 4.3.3.1, when the
application of current ceases; the membrane potential decreases to a plateau value and
remains almost constant during a few seconds before approaching zero. This response is
typical of systems with bipolar membranes, where the dissociation of water is very
intense [9].
Fig. 4.81 shows the response of the relaxation of the potential corresponding to a
membrane having an attached layer of Ni(OH)2 precipitates. These curves were
registered after the application of different overlimiting currents. The potential remaining
immediately after switching off the current is consequence of the strong concentration
profiles of H+, OH- and salt ions in the membrane system resulting from the enhanced
water splitting. At the first instants after the current interruption, uncompensated
charges exist at the interface between the membrane and the bipolar junction and very
large field strengths are present [10]. Afterwards, the membrane potential is restored to
zero as the recombination of H+ and OH- ions occurs at the precipitate/membrane
interface. However, the recombination reaction is limited by the rate of replacement in
the membrane phase of H+ ions by the salt counterions. As a consequence, the plateau
extends over longer times and the membrane potential decreases very slowly with time.
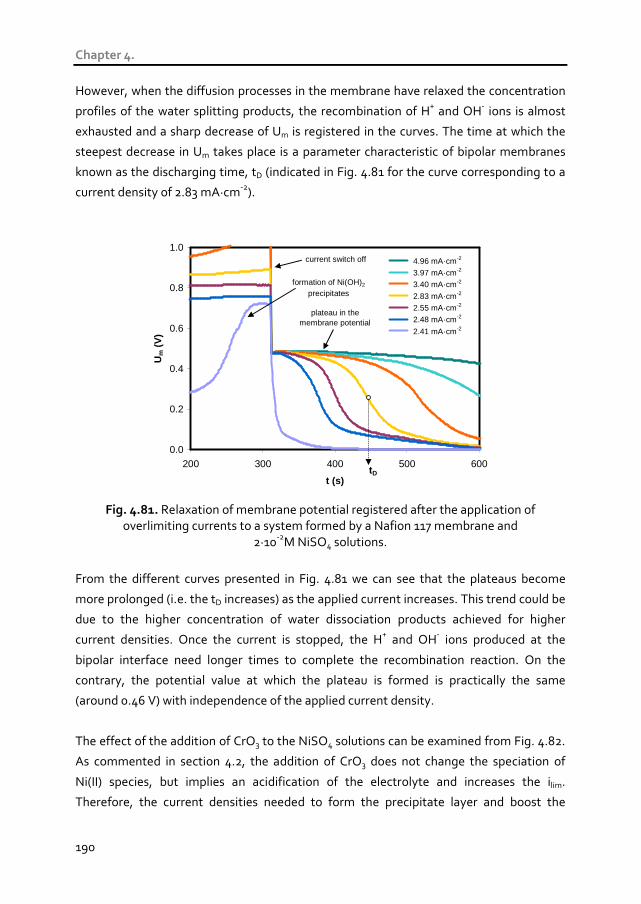
Chapter 4.
190
However, when the diffusion processes in the membrane have relaxed the concentration
profiles of the water splitting products, the recombination of H+ and OH- ions is almost
exhausted and a sharp decrease of Um is registered in the curves. The time at which the
steepest decrease in Um takes place is a parameter characteristic of bipolar membranes
known as the discharging time, tD (indicated in Fig. 4.81 for the curve corresponding to a
current density of 2.83 mA·cm-2).
0.0
0.2
0.4
0.6
0.8
1.0
200 300 400 500 600
t (s)
Um
(V
)
4.96 mA·cm-2
3.97 mA·cm-2
3.40 mA·cm-2
2.83 mA·cm-2
2.55 mA·cm-2
2.48 mA·cm-2
2.41 mA·cm-2
tD
formation of Ni(OH)2
precipitates
plateau in the membrane potential
current switch off
Fig. 4.81. Relaxation of membrane potential registered after the application of
overlimiting currents to a system formed by a Nafion 117 membrane and 2·10-2M NiSO4 solutions.
From the different curves presented in Fig. 4.81 we can see that the plateaus become
more prolonged (i.e. the tD increases) as the applied current increases. This trend could be
due to the higher concentration of water dissociation products achieved for higher
current densities. Once the current is stopped, the H+ and OH- ions produced at the
bipolar interface need longer times to complete the recombination reaction. On the
contrary, the potential value at which the plateau is formed is practically the same
(around 0.46 V) with independence of the applied current density.
The effect of the addition of CrO3 to the NiSO4 solutions can be examined from Fig. 4.82.
As commented in section 4.2, the addition of CrO3 does not change the speciation of
Ni(II) species, but implies an acidification of the electrolyte and increases the ilim.
Therefore, the current densities needed to form the precipitate layer and boost the
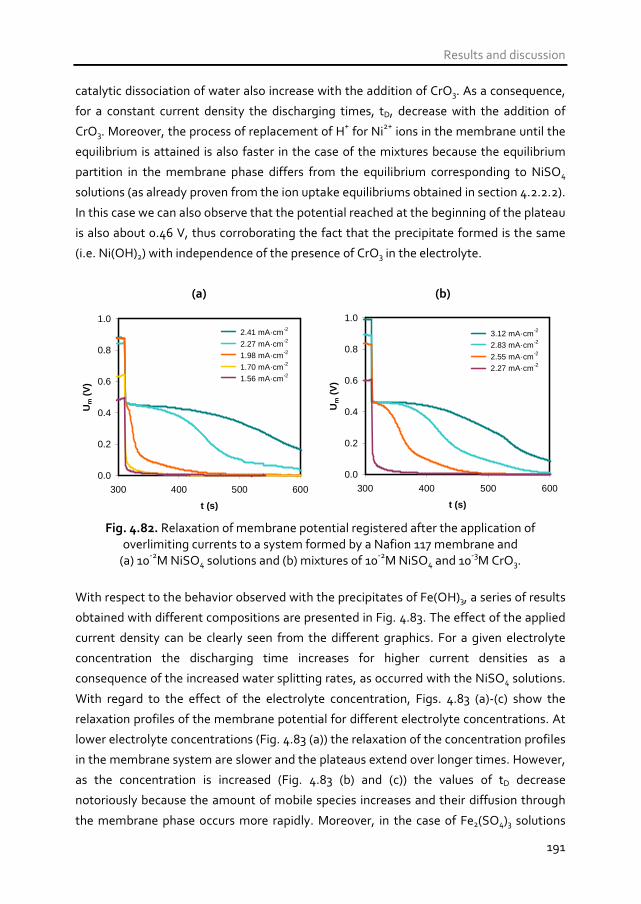
Results and discussion
191
catalytic dissociation of water also increase with the addition of CrO3. As a consequence,
for a constant current density the discharging times, tD, decrease with the addition of
CrO3. Moreover, the process of replacement of H+ for Ni2+ ions in the membrane until the
equilibrium is attained is also faster in the case of the mixtures because the equilibrium
partition in the membrane phase differs from the equilibrium corresponding to NiSO4
solutions (as already proven from the ion uptake equilibriums obtained in section 4.2.2.2).
In this case we can also observe that the potential reached at the beginning of the plateau
is also about 0.46 V, thus corroborating the fact that the precipitate formed is the same
(i.e. Ni(OH)2) with independence of the presence of CrO3 in the electrolyte.
(a) (b)
0.0
0.2
0.4
0.6
0.8
1.0
300 400 500 600
t (s)
Um
(V
)
2.41 mA·cm-2
2.27 mA·cm-2
1.98 mA·cm-2
1.70 mA·cm-2
1.56 mA·cm-2
0.0
0.2
0.4
0.6
0.8
1.0
300 400 500 600
t (s)
Um
(V
)3.12 mA·cm-2
2.83 mA·cm-2
2.55 mA·cm-2
2.27 mA·cm-2
Fig. 4.82. Relaxation of membrane potential registered after the application of overlimiting currents to a system formed by a Nafion 117 membrane and
(a) 10-2M NiSO4 solutions and (b) mixtures of 10-2M NiSO4 and 10-3M CrO3.
With respect to the behavior observed with the precipitates of Fe(OH)3, a series of results
obtained with different compositions are presented in Fig. 4.83. The effect of the applied
current density can be clearly seen from the different graphics. For a given electrolyte
concentration the discharging time increases for higher current densities as a
consequence of the increased water splitting rates, as occurred with the NiSO4 solutions.
With regard to the effect of the electrolyte concentration, Figs. 4.83 (a)-(c) show the
relaxation profiles of the membrane potential for different electrolyte concentrations. At
lower electrolyte concentrations (Fig. 4.83 (a)) the relaxation of the concentration profiles
in the membrane system are slower and the plateaus extend over longer times. However,
as the concentration is increased (Fig. 4.83 (b) and (c)) the values of tD decrease
notoriously because the amount of mobile species increases and their diffusion through
the membrane phase occurs more rapidly. Moreover, in the case of Fe2(SO4)3 solutions

Chapter 4.
192
the initial potential value registered when the current is switched off also changes with
the initial salt concentration. For diluted solutions (Fig. 4.83 (a) and (b)) the potential
takes a value of approximately 0.27 V, whereas it increases to values higher than 0.3 for
more concentrated solutions (Figs. 4.83 (c) and (d)). The conformation of a more dense
and compact precipitate layer with the most concentration solutions could be the
phenomenon responsible for this difference. Finally, there is also an effect of the addition
of Na2SO4 to the Fe2(SO4)3 solutions because the plateaus formed are shorter in this case
(Fig. 4.83 (d)). Since Na+ ions are also involved in the relaxation of the concentration
profiles, it seems that their higher mobility leads to a faster replacement of the H+ ions
bound to the membrane fixed charges, hence allowing a faster recombination between
H+ and OH- ions at the bipolar junction and anticipating the restoration of Um to zero.
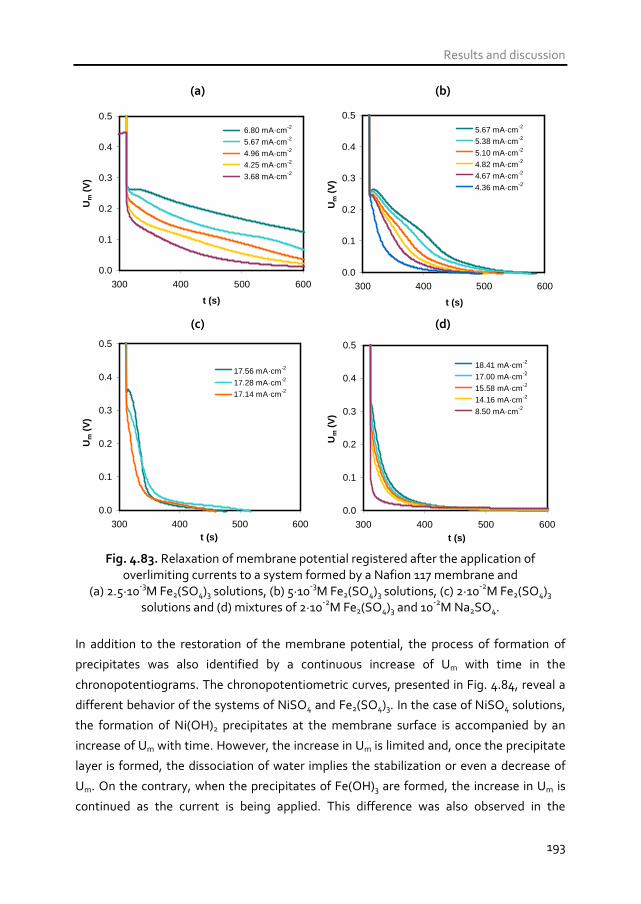
Results and discussion
193
(a) (b)
0.0
0.1
0.2
0.3
0.4
0.5
300 400 500 600
t (s)
Um
(V
)
6.80 mA·cm-2
5.67 mA·cm-2
4.96 mA·cm-2
4.25 mA·cm-2
3.68 mA·cm-2
0.0
0.1
0.2
0.3
0.4
0.5
300 400 500 600
t (s)
Um
(V
)
5.67 mA·cm-2
5.38 mA·cm-2
5.10 mA·cm-2
4.82 mA·cm-2
4.67 mA·cm-2
4.36 mA·cm-2
(c) (d)
0.0
0.1
0.2
0.3
0.4
0.5
300 400 500 600t (s)
Um
(V
)
17.56 mA·cm-2
17.28 mA·cm-2
17.14 mA·cm-2
0.0
0.1
0.2
0.3
0.4
0.5
300 400 500 600t (s)
Um
(V
)
18.41 mA·cm-2
17.00 mA·cm-2
15.58 mA·cm-2
14.16 mA·cm-2
8.50 mA·cm-2
Fig. 4.83. Relaxation of membrane potential registered after the application of overlimiting currents to a system formed by a Nafion 117 membrane and
(a) 2.5·10-3M Fe2(SO4)3 solutions, (b) 5·10-3M Fe2(SO4)3 solutions, (c) 2·10-2M Fe2(SO4)3 solutions and (d) mixtures of 2·10-2M Fe2(SO4)3 and 10-2M Na2SO4.
In addition to the restoration of the membrane potential, the process of formation of
precipitates was also identified by a continuous increase of Um with time in the
chronopotentiograms. The chronopotentiometric curves, presented in Fig. 4.84, reveal a
different behavior of the systems of NiSO4 and Fe2(SO4)3. In the case of NiSO4 solutions,
the formation of Ni(OH)2 precipitates at the membrane surface is accompanied by an
increase of Um with time. However, the increase in Um is limited and, once the precipitate
layer is formed, the dissociation of water implies the stabilization or even a decrease of
Um. On the contrary, when the precipitates of Fe(OH)3 are formed, the increase in Um is
continued as the current is being applied. This difference was also observed in the
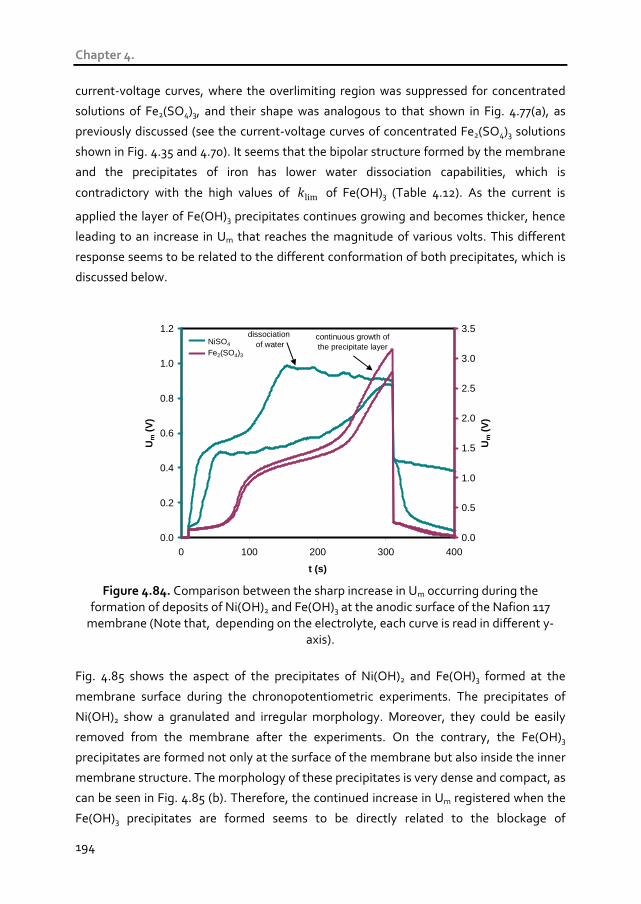
Chapter 4.
194
current-voltage curves, where the overlimiting region was suppressed for concentrated
solutions of Fe2(SO4)3, and their shape was analogous to that shown in Fig. 4.77(a), as
previously discussed (see the current-voltage curves of concentrated Fe2(SO4)3 solutions
shown in Fig. 4.35 and 4.70). It seems that the bipolar structure formed by the membrane
and the precipitates of iron has lower water dissociation capabilities, which is
contradictory with the high values of limk of Fe(OH)3 (Table 4.12). As the current is
applied the layer of Fe(OH)3 precipitates continues growing and becomes thicker, hence
leading to an increase in Um that reaches the magnitude of various volts. This different
response seems to be related to the different conformation of both precipitates, which is
discussed below.
0.0
0.2
0.4
0.6
0.8
1.0
1.2
0 100 200 300 400
t (s)
Um
(V
)
0.0
0.5
1.0
1.5
2.0
2.5
3.0
3.5
Um
(V
)
NiSO4
Fe2(SO4)3
dissociation of water
continuous growth of the precipitate layer
Figure 4.84. Comparison between the sharp increase in Um occurring during the
formation of deposits of Ni(OH)2 and Fe(OH)3 at the anodic surface of the Nafion 117 membrane (Note that, depending on the electrolyte, each curve is read in different y-
axis).
Fig. 4.85 shows the aspect of the precipitates of Ni(OH)2 and Fe(OH)3 formed at the
membrane surface during the chronopotentiometric experiments. The precipitates of
Ni(OH)2 show a granulated and irregular morphology. Moreover, they could be easily
removed from the membrane after the experiments. On the contrary, the Fe(OH)3
precipitates are formed not only at the surface of the membrane but also inside the inner
membrane structure. The morphology of these precipitates is very dense and compact, as
can be seen in Fig. 4.85 (b). Therefore, the continued increase in Um registered when the
Fe(OH)3 precipitates are formed seems to be directly related to the blockage of

Results and discussion
195
membrane pores by the hydroxide deposits, which reduce the water splitting rates and
lead to a notorious increase of the membrane resistance.
As a concluding remark, we would like to note that the formation of precipitates is a
phenomenon that should be avoided in electrodialysis units operated with the purpose of
desalinating effluents, owing to the decrease in the salt counterion transport through the
membrane and to the related increase of the energy consumption. However, the water
splitting capabilities of the metallic deposits formed at the surface of ion-exchange
membranes has found application in other uses of electrodialysis. For example, this
phenomenon has been used as a strategy to optimize the water splitting behavior of
bipolar membranes, which are specially designed for the recovery of acids and bases from
aqueous effluents [74,99]. In addition, the phenomena related to the membrane potential
remaining after ceasing the application of current has been also investigated in order to
use bipolar membranes in alternative energy storage systems [100].
(a) (b)
Figure 4.85. Pictures showing the precipitates formed at the surface of the Nafion 117
membrane: (a) Ni(OH)2 precipitates and (b) Fe(OH)3 precipitates.

Chapter 4.
196
4.3.5 Overlimiting currents originated by enhanced
convective phenomena
4.3.5.1 Electroconvection and gravitational convection The inducement of overlimiting currents by enhanced convective phenomena is one of
the most topical research subjects in the field of electrodialysis. Since it has been
conclusively proven that the overlimiting currents in cation-exchange membranes are
mainly caused by other phenomena different from water splitting, many investigations
have been carried out in order to clarify the origin of the overlimiting currents. Several
indications suggest that the emergence of the overlimiting currents is mainly related to
the destabilization of the diffusion boundary layers by convective processes occurring at
an advanced stage of concentration polarization [81]. Both gravitational convection and
electroconvection represent the main mechanisms of current-induced convection in ion-
exchange membranes. Since both mechanisms involve an increase in the transport of salt
counterions, different strategies are being investigated in order to induce their use in
advanced modes of electrodialysis.
Despite the fact that gravitational convection and electroconvection predominate at
specific conditions of the electrodialysis cells, in many occasions they are coupled and it is
difficult to evaluate them separately. Consequently, in this section both phenomena are
investigated together. The results obtained with Cr2(SO4)3 solutions are appropriate to
study the effect of the electrolyte concentration on the emergence of coupled
convection, since for these solutions the formation of precipitates was absent in all cases.
Fig. 4.86 shows various chronopotentiometric curves registered for diluted solutions of
Cr2(SO4)3 (5·10-4M) at overlimiting currents. For current densities slightly higher than the
ilim (i.e.: 0.32 and 0.40 mA·cm-2) the evolution of Um at times larger than the transition
time is almost plane. However, when the excess beyond the ilim is more important (0.60
and 0.64 mA·cm-2), a further increase in Um takes place. This response is associated with
an intensification of the concentration polarization, which promotes the emergence of
hydrodynamic instabilities at higher current densities. In the present case the onset of
electroconvection is the phenomenon causing hydrodynamic instabilities, which are
manifested in the form of chaotic oscillations in Um. Furthermore, the magnitude of the
oscillations becomes larger with the increase in the current density, even reaching the
magnitude of 0.2 V for the current density of 1.28 mA·cm-2. The slower relaxation of the
membrane potential registered for the highest currents also confirms the relationship
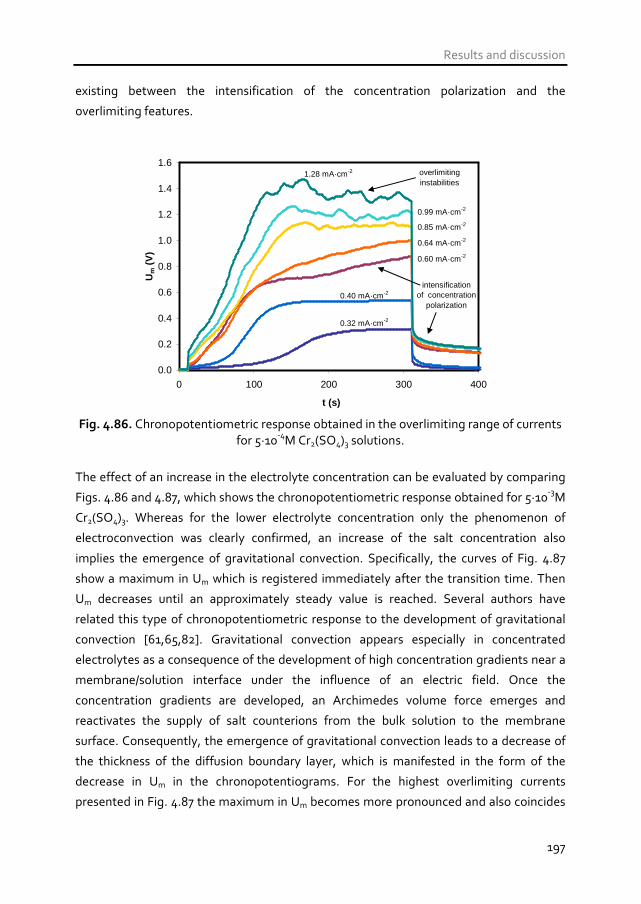
Results and discussion
197
existing between the intensification of the concentration polarization and the
overlimiting features.
0.0
0.2
0.4
0.6
0.8
1.0
1.2
1.4
1.6
0 100 200 300 400
t (s)
Um
(V
)
0.32 mA·cm-2
0.40 mA·cm-2
0.85 mA·cm-2
0.99 mA·cm-2
1.28 mA·cm-2
0.64 mA·cm-2
0.60 mA·cm-2
overlimiting instabilities
intensification of concentration
polarization
Fig. 4.86. Chronopotentiometric response obtained in the overlimiting range of currents
for 5·10-4M Cr2(SO4)3 solutions.
The effect of an increase in the electrolyte concentration can be evaluated by comparing
Figs. 4.86 and 4.87, which shows the chronopotentiometric response obtained for 5·10-3M
Cr2(SO4)3. Whereas for the lower electrolyte concentration only the phenomenon of
electroconvection was clearly confirmed, an increase of the salt concentration also
implies the emergence of gravitational convection. Specifically, the curves of Fig. 4.87
show a maximum in Um which is registered immediately after the transition time. Then
Um decreases until an approximately steady value is reached. Several authors have
related this type of chronopotentiometric response to the development of gravitational
convection [61,65,82]. Gravitational convection appears especially in concentrated
electrolytes as a consequence of the development of high concentration gradients near a
membrane/solution interface under the influence of an electric field. Once the
concentration gradients are developed, an Archimedes volume force emerges and
reactivates the supply of salt counterions from the bulk solution to the membrane
surface. Consequently, the emergence of gravitational convection leads to a decrease of
the thickness of the diffusion boundary layer, which is manifested in the form of the
decrease in Um in the chronopotentiograms. For the highest overlimiting currents
presented in Fig. 4.87 the maximum in Um becomes more pronounced and also coincides

Chapter 4.
198
with the oscillations related to electroconvection. This kind of response evidences the
coexistence of both types of convective mechanisms of overlimiting mass transfer [78].
0.0
0.2
0.4
0.6
0.8
1.0
0 100 200 300 400
t (s)
Um
(V
)
5.10 mA·cm-2
4.53 mA·cm-2
3.12 mA·cm-2
2.69 mA·cm-2
2.34 mA·cm-2
2.13 mA·cm-2
coupled gravitational convection and electroconvection
Fig. 4.87. Chronopotentiometric response obtained in the overlimiting range of currents
for 5·10-3M Cr2(SO4)3 solutions.
The results obtained for 10-2M Cr2(SO4)3 are shown in Fig. 4.88. An additional increase of
the electrolyte concentration leads to the intensification of gravitational convection. In
this case the maximum is very marked because the density gradients created near the
membrane are higher than those developed for lower concentrations. Moreover, the
oscillations in the voltage drop originated by the electroconvective vortices are not
present in the curves. It seems that for increasing electrolyte concentrations, the
necessary condition for the emergence of gravitational convection is already achieved for
moderate current densities. However, an additional intensification of the applied electric
field is required for the development of electroconvective vortices.
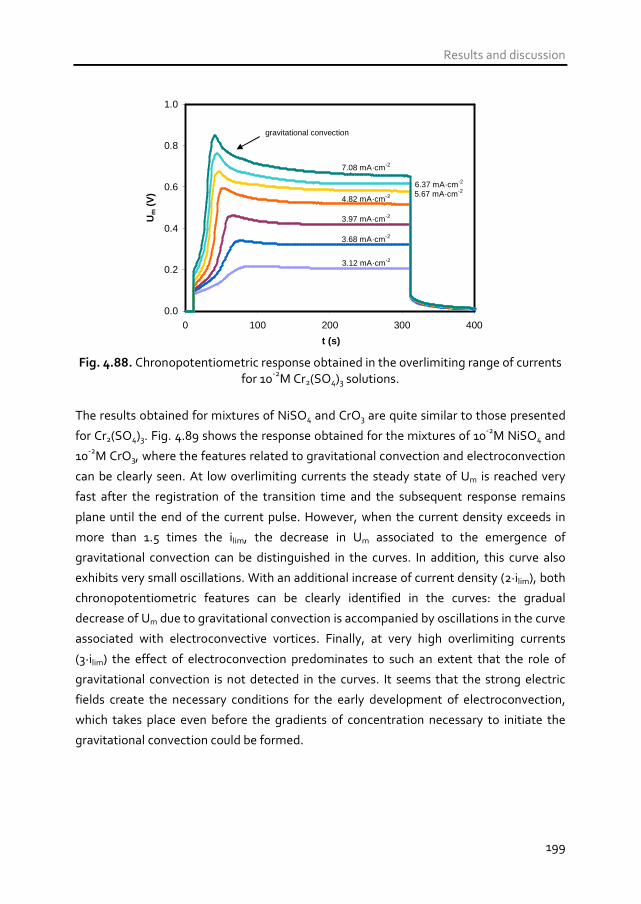
Results and discussion
199
0.0
0.2
0.4
0.6
0.8
1.0
0 100 200 300 400
t (s)
Um
(V
)
6.37 mA·cm-2
4.82 mA·cm-2
3.97 mA·cm-2
3.68 mA·cm-2
3.12 mA·cm-2
5.67 mA·cm-2
7.08 mA·cm-2
gravitational convection
Fig. 4.88. Chronopotentiometric response obtained in the overlimiting range of currents
for 10-2M Cr2(SO4)3 solutions.
The results obtained for mixtures of NiSO4 and CrO3 are quite similar to those presented
for Cr2(SO4)3. Fig. 4.89 shows the response obtained for the mixtures of 10-2M NiSO4 and
10-2M CrO3, where the features related to gravitational convection and electroconvection
can be clearly seen. At low overlimiting currents the steady state of Um is reached very
fast after the registration of the transition time and the subsequent response remains
plane until the end of the current pulse. However, when the current density exceeds in
more than 1.5 times the ilim, the decrease in Um associated to the emergence of
gravitational convection can be distinguished in the curves. In addition, this curve also
exhibits very small oscillations. With an additional increase of current density (2·ilim), both
chronopotentiometric features can be clearly identified in the curves: the gradual
decrease of Um due to gravitational convection is accompanied by oscillations in the curve
associated with electroconvective vortices. Finally, at very high overlimiting currents
(3·ilim) the effect of electroconvection predominates to such an extent that the role of
gravitational convection is not detected in the curves. It seems that the strong electric
fields create the necessary conditions for the early development of electroconvection,
which takes place even before the gradients of concentration necessary to initiate the
gravitational convection could be formed.
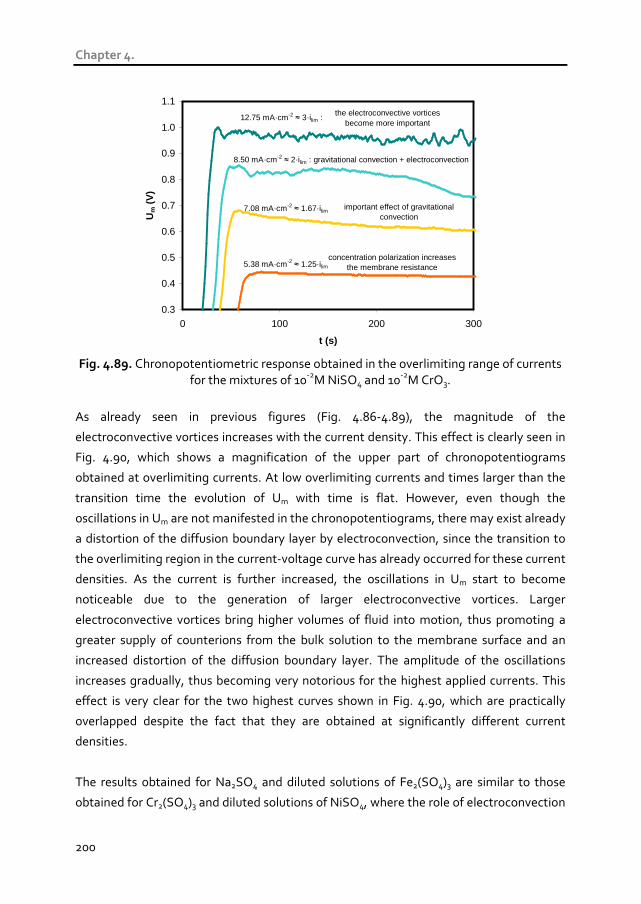
Chapter 4.
200
0.3
0.4
0.5
0.6
0.7
0.8
0.9
1.0
1.1
0 100 200 300
t (s)
Um
(V
)
5.38 mA·cm-2 ≈ 1.25·ilim
:
concentration polarization increases the membrane resistance
7.08 mA·cm-2 ≈ 1.67·ilim
:
important effect of gravitational convection
8.50 mA·cm-2 ≈ 2·ilim : gravitational convection + electroconvection
12.75 mA·cm-2 ≈ 3·ilim : the electroconvective vortices become more important
Fig. 4.89. Chronopotentiometric response obtained in the overlimiting range of currents
for the mixtures of 10-2M NiSO4 and 10-2M CrO3.
As already seen in previous figures (Fig. 4.86-4.89), the magnitude of the
electroconvective vortices increases with the current density. This effect is clearly seen in
Fig. 4.90, which shows a magnification of the upper part of chronopotentiograms
obtained at overlimiting currents. At low overlimiting currents and times larger than the
transition time the evolution of Um with time is flat. However, even though the
oscillations in Um are not manifested in the chronopotentiograms, there may exist already
a distortion of the diffusion boundary layer by electroconvection, since the transition to
the overlimiting region in the current-voltage curve has already occurred for these current
densities. As the current is further increased, the oscillations in Um start to become
noticeable due to the generation of larger electroconvective vortices. Larger
electroconvective vortices bring higher volumes of fluid into motion, thus promoting a
greater supply of counterions from the bulk solution to the membrane surface and an
increased distortion of the diffusion boundary layer. The amplitude of the oscillations
increases gradually, thus becoming very notorious for the highest applied currents. This
effect is very clear for the two highest curves shown in Fig. 4.90, which are practically
overlapped despite the fact that they are obtained at significantly different current
densities.
The results obtained for Na2SO4 and diluted solutions of Fe2(SO4)3 are similar to those
obtained for Cr2(SO4)3 and diluted solutions of NiSO4, where the role of electroconvection

Results and discussion
201
was clearly seen, but the maximum in Um formed due to gravitational convection was not
detected. Consequently, these results have been omitted for the sake of conciseness. On
the contrary, the overlimiting behavior obtained for concentrated solutions of Fe2(SO4)3 is
the characteristic one related to the formation of precipitates, as has been discussed
above.
0.2
0.4
0.6
0.8
1.0
1.2
1.4
0 100 200 300
t (s)
Um
(V
)
increasing current densities
Fig. 4.90. Chronopotentiometric response obtained in the range of overlimiting currents
for the mixtures of 5·10-4M NiSO4 and 10-3M CrO3.
Although the chronopotentiometric features characteristic of electroconvection and
gravitational convection were registered for both Cr2(SO4)3 and NiSO4 solutions, there are
some differences between the overlimiting behavior of both electrolytes. The decrease in
Um due to gravitational convection was more important in the case of Cr2(SO4)3 solutions,
whereas the relative importance of the electroconvective vortices is greater in the
presence of NiSO4. This different behavior could stem from the different density of both
electrolytes. In the case of Cr2(SO4)3 solutions, the amount of sulfates is higher than for
NiSO4 solutions and the magnitude of the density gradients generated at the diffusion
boundary layer should be also greater, hence implying a more important role of
gravitational convection. On the contrary, gravitational convection becomes significantly
attenuated with NiSO4 solutions as the current density increases. In NiSO4 solutions the
earlier onset of electroconvective vortices may destroy the diffusion boundary layer and
impede the development of higher density gradients, which is the necessary condition to
initiate the gravitational convection.

Chapter 4.
202
The relative predominance of each type of current-induced convection can also be
analyzed by plotting the difference between the maximum value reached in the
chronopotentiograms, Um,max, and the final value registered, Um,f, as a function of the
ratio of the applied current density to the limiting one (i/ilim), as shown in Figs. 4.91 and
4.92. The synergic effect of both types of convective supply of ions to the membrane
surface is evident for the Cr2(SO4)3 solutions (Fig. 4.91). At current densities below the
limiting value the decrease in the voltage drop during the chronopotentiometric
measurements were already registered (positive values of (Um.max – Um,f)). This is caused
by the emergence of important density gradients causing gravitational convection, which
is in agreement with previous studies that report the initiation of gravitational convection
even at current densities below the ilim [78]. If current densities around 1.5·ilim are applied,
an important increase in (Um,max – Um,f) is observed. This increase does not follow a clear
pattern and the values of (Um,max – Um,f) show a significant scatter. On the contrary, for
i/ilim values higher than 2 the decrease in Um obeys again a linear dependence with the
applied current, which coincides with the increase of the magnitude of the
electroconvective vortices. The obtained results may be explained as follows: at currents
below or slightly higher than ilim the contribution of gravitational convection is the main
mechanism causing a decrease in both the diffusion boundary layer thickness and the
membrane voltage drop; for 1<i/ilim<2 the observed scatter seems to indicate the
initiation of steady electroconvective vortices and gravitational convection is intensified,
whereas for i/ilim>2 the vortices due to electroconvection become chaotic and its
contribution to the decrease in Um is summed to that of gravitational convection.

Results and discussion
203
0.00
0.05
0.10
0.15
0.20
0.25
0.0 0.5 1.0 1.5 2.0 2.5 3.0 3.5
i/i lim
Um
,max
- U
m,f (
V)
combined effect of gravitational convection and electroconvection
gravitational convection
5·10-3M Cr2(SO4)3
10-2M Cr2(SO4)3
Fig. 4.91. Plot of the difference (Um,max – Um,f) obtained from the chronopotentiometric
curves as a function of the i/ilim parameter for different concentrations of Cr2(SO4)3.
The relationship between the parameters (Um,max – Um,f) and i/ilim obtained for NiSO4
solutions (shown in Fig. 4.92) is different from that obtained for Cr2(SO4)3. In this case, the
maximum in Um related to gravitational convection is not detected until the ilim is
surpassed, which may be due to the lower density gradients generated with NiSO4
solutions. Moreover, the role of electroconvection becomes more important as the
concentration polarization is intensified. As commented previously, the application of
high overlimiting currents anticipates the development of electroconvection and
increases the magnitude of the vortices to such an extent that the gravitational
convection becomes attenuated. As a result, the maximum in Um is not registered in the
chronopotentiograms for current densities higher than 1.5·ilim, and the values of (Um,max –
Um,f) become lower and scattered.
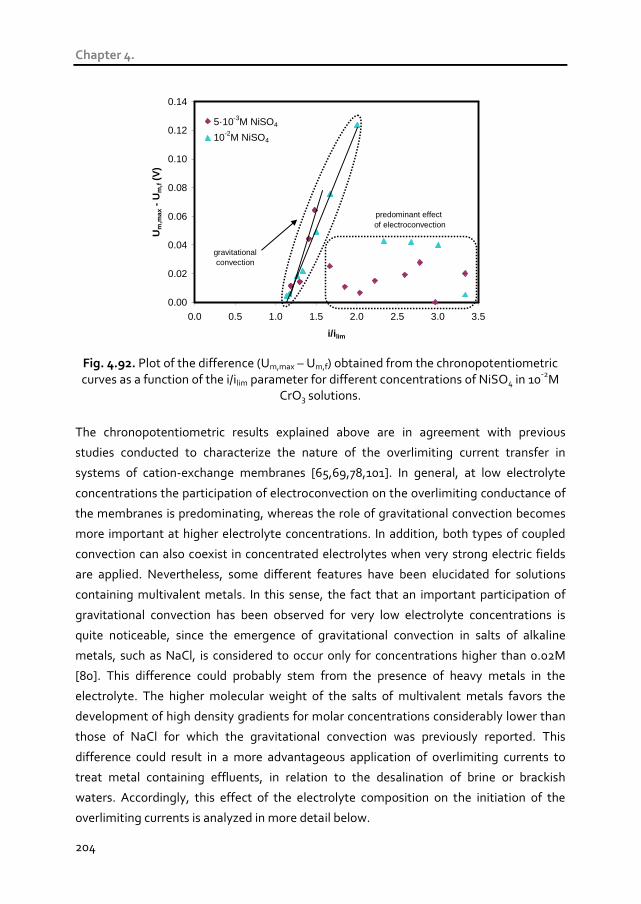
Chapter 4.
204
0.00
0.02
0.04
0.06
0.08
0.10
0.12
0.14
0.0 0.5 1.0 1.5 2.0 2.5 3.0 3.5
i/i lim
Um
,max
- U
m,f (
V)
predominant effect of electroconvection
gravitationalconvection
5·10-3M NiSO4
10-2M NiSO4
Fig. 4.92. Plot of the difference (Um,max – Um,f) obtained from the chronopotentiometric curves as a function of the i/ilim parameter for different concentrations of NiSO4 in 10-2M
CrO3 solutions.
The chronopotentiometric results explained above are in agreement with previous
studies conducted to characterize the nature of the overlimiting current transfer in
systems of cation-exchange membranes [65,69,78,101]. In general, at low electrolyte
concentrations the participation of electroconvection on the overlimiting conductance of
the membranes is predominating, whereas the role of gravitational convection becomes
more important at higher electrolyte concentrations. In addition, both types of coupled
convection can also coexist in concentrated electrolytes when very strong electric fields
are applied. Nevertheless, some different features have been elucidated for solutions
containing multivalent metals. In this sense, the fact that an important participation of
gravitational convection has been observed for very low electrolyte concentrations is
quite noticeable, since the emergence of gravitational convection in salts of alkaline
metals, such as NaCl, is considered to occur only for concentrations higher than 0.02M
[80]. This difference could probably stem from the presence of heavy metals in the
electrolyte. The higher molecular weight of the salts of multivalent metals favors the
development of high density gradients for molar concentrations considerably lower than
those of NaCl for which the gravitational convection was previously reported. This
difference could result in a more advantageous application of overlimiting currents to
treat metal containing effluents, in relation to the desalination of brine or brackish
waters. Accordingly, this effect of the electrolyte composition on the initiation of the
overlimiting currents is analyzed in more detail below.
Results and discussion
205
4.3.5.2 Role of M+n ions on coupled convection
The effects of operating electrodialysis units at overlimiting currents depend not only on
which mechanisms promote the overlimiting conductance but also on the threshold in
the membrane voltage drop that has to be surpassed to reach the overlimiting regime. If
the increase in the mass transfer occurs at the expense of considerable higher energy
consumptions, the application of overlimiting currents is not advisable. On the contrary, if
the increased mass transfer rates are achieved without implying an excessive dissipation
of energy in the membrane region, the operation at overlimiting currents could be
beneficial for the desalination process. Related to this, the length of the plateau region of
the current-voltage curves (lplateau) can be regarded as a measure of the energy needed in
order to change the mass transfer mechanism in the solution layer adjacent to the
membrane from diffusion to coupled convection. Therefore, we can evaluate the
convenience of applying overlimiting currents by investigating the influence of the
electrolyte composition on the lplateau values.
Fig. 4.93 shows two current-voltage curves obtained for different concentrations of
Cr2(SO4)3 with the values of current density normalized by the corresponding values of ilim
(i/ilim). As can be seen from the graphic, increasing electrolyte concentrations lead to
shorter plateaus in the current-voltage curves. This effect in the case of Cr2(SO4)3
solutions could derive from the fact that the density gradients needed to initiate the
gravitational convection are formed at lower membrane voltage drops for higher
electrolyte concentrations. The results obtained for mixtures of CrO3 and NiSO4 solutions
show a similar trend (Fig. 4.94), with decreasing values of lplateau as the electrolyte
concentration increases. However, in this case the overlimiting region of the current-
voltage curves is different for lower and higher electrolyte concentrations. The curve
obtained for 10-2M NiSO4 shows two differentiated slopes in the overlimiting region: the
slope is lower at low overlimiting currents; whereas at higher overlimiting currents the
electrical resistance of the membrane system decreases notoriously. It also seems that
the facilitated initiation of gravitational convection in concentrated electrolytes
contributes to decrease the lplateau. However, the increase in the current density is not as
important as that promoted by the electroconvective vortices of higher amplitude
generated at high overlimiting currents.
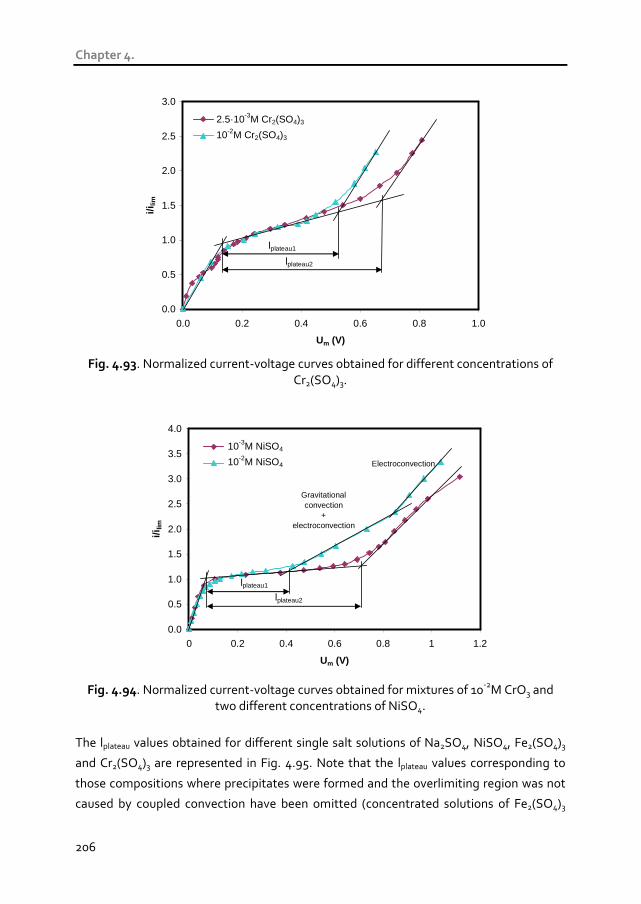
Chapter 4.
206
0.0
0.5
1.0
1.5
2.0
2.5
3.0
0.0 0.2 0.4 0.6 0.8 1.0
Um (V)
i/ilim
lplateau1
lplateau2
2.5·10-3M Cr2(SO4)3
10-2M Cr2(SO4)3
Fig. 4.93. Normalized current-voltage curves obtained for different concentrations of
Cr2(SO4)3.
0.0
0.5
1.0
1.5
2.0
2.5
3.0
3.5
4.0
0 0.2 0.4 0.6 0.8 1 1.2
Um (V)
i/ilim
lplateau1
lplateau2
Gravitational convection
+electroconvection
Electroconvection
10-3M NiSO4
10-2M NiSO4
Fig. 4.94. Normalized current-voltage curves obtained for mixtures of 10-2M CrO3 and
two different concentrations of NiSO4.
The lplateau values obtained for different single salt solutions of Na2SO4, NiSO4, Fe2(SO4)3
and Cr2(SO4)3 are represented in Fig. 4.95. Note that the lplateau values corresponding to
those compositions where precipitates were formed and the overlimiting region was not
caused by coupled convection have been omitted (concentrated solutions of Fe2(SO4)3

Results and discussion
207
and NiSO4). The results show that the lplateau values obtained for Cr2(SO4)3 solutions are
higher than those obtained for Fe2(SO4)3 and NiSO4. As reported in previous studies, the
plateau length can be significantly affected by the size of the counterions that are
involved in the emergence of the overlimiting conductance [91,102]. The Stokes radius of
the membrane counterions is usually used for comparison purposes. The Stokes radius
( d ) represents the radius of a hard sphere that diffuses at the same rate as the molecule,
which includes hydration and shape effects; and is calculated according to Eq. (4.76).
j
B
D
Tkd
πη6= (4.76)
Where Bk , T , η and jD are the Boltzmann’s constant, the temperature, the solution
viscosity and the diffusion coefficient of the ion j . The Stokes radius of each ion has been
included in Table 4.13. It is remarkable that Ni2+ ions, although having lower charge, have
larger Stokes radius than Cr3+ ions. This is caused by the different hydration shells of both
ions. The difference in Stokes radius is in congruence with the shorter lplateau values
obtained for NiSO4 solutions. Since the electroconvection is promoted by the motion of
counterions propitiated by strong electric fields, those ions having larger Stokes radius
would involve the motion of larger volumes of fluid. As a result, the destabilization of the
diffusion boundary layer occurs earlier in the case of cations of larger size.
0.0
0.1
0.2
0.3
0.4
0.5
0.6
0.7
0.8
0.9
0.000 0.005 0.010 0.015 0.020 0.025
[M+n] (mol/L)
l pla
teau
(V
)
Na(I)Ni(II)Fe(III)Cr(III)
Fig. 4.95. Effect of the electrolyte concentration on the lplateau values obtained for
solutions of Na2SO4, NiSO4, Fe2(SO4)3 and Cr2(SO4)3.

Chapter 4.
208
Table 4.13. Stokes radius calculated for the different metal ions investigated.
Cation Stokes radius (nm)
Na+ 0.184
Ni2+ 0.371
Fe3+ 0.406
Cr3+ 0.309
In regard to the effect of the electrolyte concentration, in general, the lplateau values follow
a decreasing trend with the electrolyte concentration. Nevertheless this trend is more
marked in the case of trivalent metals (Cr(III) and Fe(III)). These results indicate that
higher concentration of metal ions also favor an early onset of the overlimiting currents
for lower membrane voltage drops. In the case of Cr2(SO4)3 the increasing role of
gravitational convection could contribute to the decreasing lplateau values. However, as
commented previously, the decrease of lplateu values may not be entirely associated to
gravitational convection, since electroconvection can also develop for concentrated
electrolytes even without being manifested in the form of oscillations of Um in the
chronopotentiograms. Note that the oscillations in Um may not be detected by the tips of
the reference electrodes when the electroconvective vortices are small. Therefore, the
decreasing trend of the lplateau with the electrolyte concentration could be caused by both
types of convection. The tendency of coupled convection to appear, and analogously, the
decrease of the length of the plateau region, have been compared for different
electrolytes in the literature by means of the calculation of the Péclet dimensionless
number (Pe), which quantifies the contribution of convection to the transport related to
diffusion [102]. The Pe number is calculated by means of Eq. (4.77)
= 3
206
λπ dr
Pe (4.77)
where 0r , d and λ account for the Debye length, the Stokes radius and the mean
interionic distance, respectively [102,103]. The Debye length is given by Eq. (4.78), where
rε , 0ε and Bk stand for the relative static permittivity, the electric constant and the
Boltzmann constant respectively [104,105]. T , AN , e , jc and jz represent the
temperature, the Avogadro’s number, the electronic charge, the concentration and
charge of the ion j , respectively:

Results and discussion
209
2
1
220
0
∑=
i iiA
Br
zcNe
Tkr
εε (4.78)
Finally, the mean interionic distance can be calculated by means of Eq. (4.79), where c
refers to the ionic concentration of the electrolyte.
3
1
1
=
cNA
λ (4.79)
The decrease of the plateau length with the salt concentration observed in our results
differs from the observations of other authors in the literature, which found that there
was no influence of the electrolyte concentration on the plateau length and the Péclet
number [70,102]. This might stem from the fact that the binary salts considered in those
studies dissociate completely in their respective anions and cations, and therefore the
terms corresponding to the electrolyte concentration in 0r (Eq. (4.78) and λ (Eq. (4.79)
are cancelled when applying Eq.(4.77). On the contrary, in systems composed of sulfate
salts of multivalent cations, the chemical equilibria induce the formation of various
complex species with different ionic charge. As a consequence, both concentration terms
may change differently with the changes in the initial salt concentration. The Pe number
was calculated for each electrolyte solution and concentration and is presented in Fig.
4.96. The Pe number remains almost independent of the concentration for nickel and
sodium sulfates because they are almost completely dissociated in their free anions and
cations for the range of concentrations considered. On the contrary, a significant increase
is observed for Cr(III) and Fe(III) solutions with the electrolyte concentration. This
observation would in part justify the results of plateau length observed in the current-
voltage curves for the sulfate salts of trivalent metals (Fig. 4.95). Moreover, similar
decreasing trends of the lplateau values with the electrolyte concentration were also found
in previous studies [106,107]. Kim and Lawler attributed the effect of the electrolyte
concentration to an increase in the amount of ionic charge created in the space charge
region [90].

Chapter 4.
210
0.0
0.1
0.2
0.3
0.4
0.5
0.0001 0.001 0.01 0.1Metal concentration (mol/L)
Pe
Na(I)
Ni(II)
Cr(III)
Fe(III)
Fig. 4.96. Evolution of the Pe number for different electrolytes as a function of the metal
concentration.
4.3.5.3 Role of H+ ions on coupled convection
Apart from the role of heavy metal ions on the initiation of convective phenomena at
overlimiting currents, the participation of H+ ions in the overlimiting currents can also be
studied by comparing the current-voltage curves obtained for the mixtures of NiSO4 and
CrO3. It must be remembered that CrO3 forms chromic acid when dissolved in water
(H2CrO4). As a result, the concentration of H+ ions is approximately the same as that of
CrO3 (i.e.: solutions of 10-3M and 10-2M CrO3 have pH values of 3 and 2, respectively). Fig.
4.97 shows the normalized current-voltage curves obtained for solutions with a constant
concentration of NiSO4 (10-3M) and varying concentrations of CrO3. The effect of
increasing the concentration of H+ ions in the electrolyte is the contrary to that observed
for the concentration of heavy metal ions, since the plateaus of the current-voltage
curves become larger as the concentration of H+ ions increases.

Results and discussion
211
0.0
0.5
1.0
1.5
2.0
2.5
3.0
0 0.2 0.4 0.6 0.8 1 1.2
Um (V)
i/ilim
0M CrO3
10-3M CrO3
10-2M CrO3
lplateau1lplateau2
lplateau3
Fig. 4.97. Normalized current-voltage curves obtained for mixtures of 10-3M NiSO4 and
different concentrations of CrO3.
Fig. 4.98 shows the relationship between the lplateau values and the concentration of Ni(II)
for different CrO3 concentrations. As reported previously, the values of lplateau decrease
with the concentration of NiSO4. Moreover, this decrease becomes more notorious for
the mixtures with CrO3 than for single salt solutions of NiSO4. This increased effect of the
concentration of Ni2+ probably stems from the competitive ion transport between H+ and
Ni2+ ions. On the contrary, the largest lplateau values were obtained for the solutions with
the highest concentration of CrO3. This behavior reveals an unfavorable effect of the
concentration of H+ ions on the onset of coupled convection.
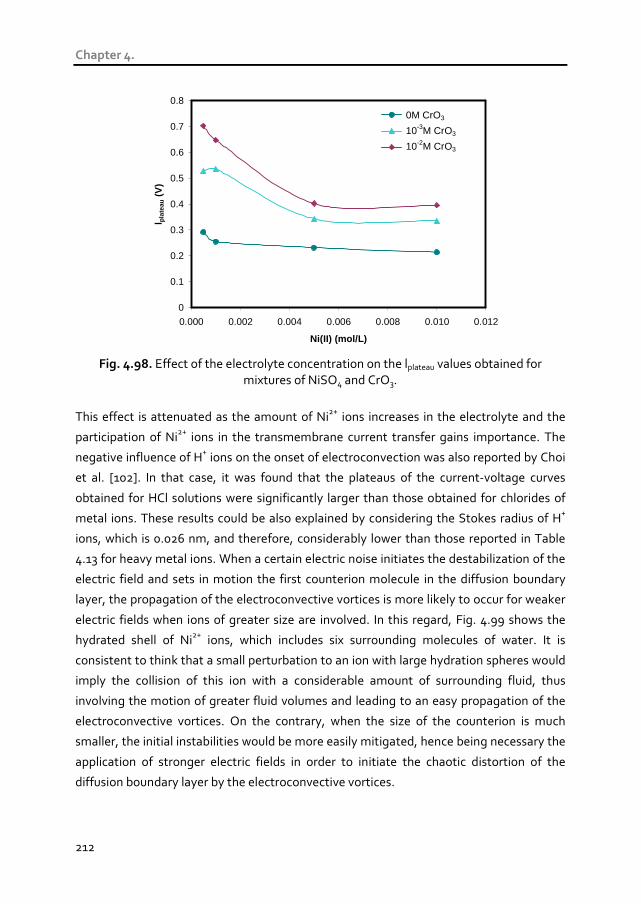
Chapter 4.
212
0
0.1
0.2
0.3
0.4
0.5
0.6
0.7
0.8
0.000 0.002 0.004 0.006 0.008 0.010 0.012
Ni(II) (mol/L)
l pla
teau
(V
)
0M CrO3
10-3M CrO3
10-2M CrO3
Fig. 4.98. Effect of the electrolyte concentration on the lplateau values obtained for
mixtures of NiSO4 and CrO3.
This effect is attenuated as the amount of Ni2+ ions increases in the electrolyte and the
participation of Ni2+ ions in the transmembrane current transfer gains importance. The
negative influence of H+ ions on the onset of electroconvection was also reported by Choi
et al. [102]. In that case, it was found that the plateaus of the current-voltage curves
obtained for HCl solutions were significantly larger than those obtained for chlorides of
metal ions. These results could be also explained by considering the Stokes radius of H+
ions, which is 0.026 nm, and therefore, considerably lower than those reported in Table
4.13 for heavy metal ions. When a certain electric noise initiates the destabilization of the
electric field and sets in motion the first counterion molecule in the diffusion boundary
layer, the propagation of the electroconvective vortices is more likely to occur for weaker
electric fields when ions of greater size are involved. In this regard, Fig. 4.99 shows the
hydrated shell of Ni2+ ions, which includes six surrounding molecules of water. It is
consistent to think that a small perturbation to an ion with large hydration spheres would
imply the collision of this ion with a considerable amount of surrounding fluid, thus
involving the motion of greater fluid volumes and leading to an easy propagation of the
electroconvective vortices. On the contrary, when the size of the counterion is much
smaller, the initial instabilities would be more easily mitigated, hence being necessary the
application of stronger electric fields in order to initiate the chaotic distortion of the
diffusion boundary layer by the electroconvective vortices.
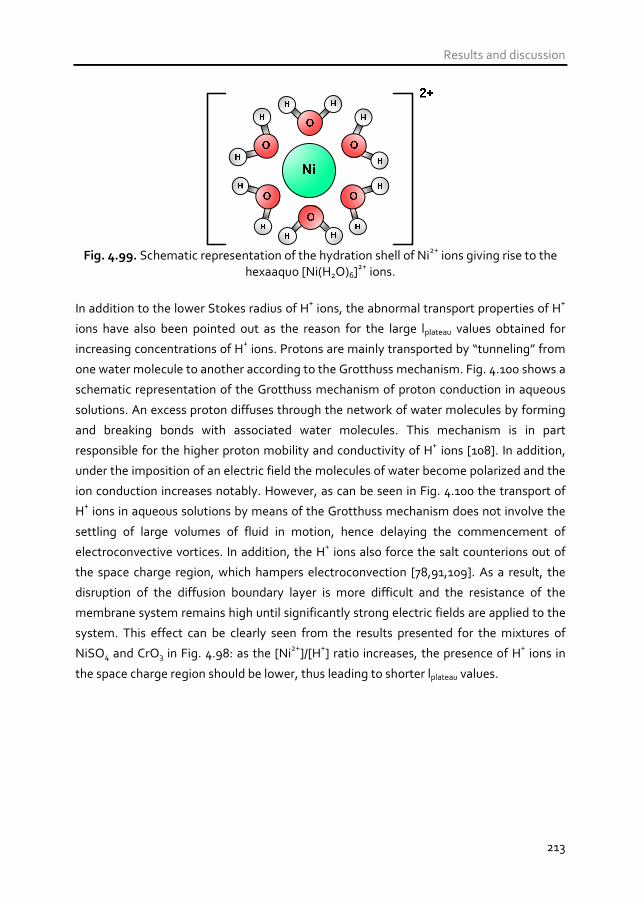
Results and discussion
213
Fig. 4.99. Schematic representation of the hydration shell of Ni2+ ions giving rise to the
hexaaquo [Ni(H2O)6]2+ ions.
In addition to the lower Stokes radius of H+ ions, the abnormal transport properties of H+
ions have also been pointed out as the reason for the large lplateau values obtained for
increasing concentrations of H+ ions. Protons are mainly transported by “tunneling” from
one water molecule to another according to the Grotthuss mechanism. Fig. 4.100 shows a
schematic representation of the Grotthuss mechanism of proton conduction in aqueous
solutions. An excess proton diffuses through the network of water molecules by forming
and breaking bonds with associated water molecules. This mechanism is in part
responsible for the higher proton mobility and conductivity of H+ ions [108]. In addition,
under the imposition of an electric field the molecules of water become polarized and the
ion conduction increases notably. However, as can be seen in Fig. 4.100 the transport of
H+ ions in aqueous solutions by means of the Grotthuss mechanism does not involve the
settling of large volumes of fluid in motion, hence delaying the commencement of
electroconvective vortices. In addition, the H+ ions also force the salt counterions out of
the space charge region, which hampers electroconvection [78,91,109]. As a result, the
disruption of the diffusion boundary layer is more difficult and the resistance of the
membrane system remains high until significantly strong electric fields are applied to the
system. This effect can be clearly seen from the results presented for the mixtures of
NiSO4 and CrO3 in Fig. 4.98: as the [Ni2+]/[H+] ratio increases, the presence of H+ ions in
the space charge region should be lower, thus leading to shorter lplateau values.
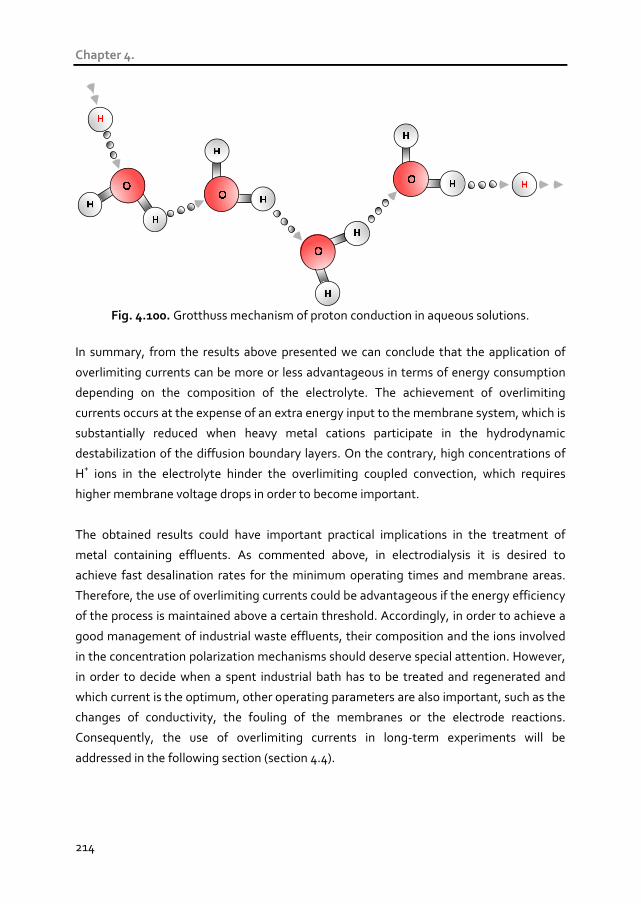
Chapter 4.
214
Fig. 4.100. Grotthuss mechanism of proton conduction in aqueous solutions.
In summary, from the results above presented we can conclude that the application of
overlimiting currents can be more or less advantageous in terms of energy consumption
depending on the composition of the electrolyte. The achievement of overlimiting
currents occurs at the expense of an extra energy input to the membrane system, which is
substantially reduced when heavy metal cations participate in the hydrodynamic
destabilization of the diffusion boundary layers. On the contrary, high concentrations of
H+ ions in the electrolyte hinder the overlimiting coupled convection, which requires
higher membrane voltage drops in order to become important.
The obtained results could have important practical implications in the treatment of
metal containing effluents. As commented above, in electrodialysis it is desired to
achieve fast desalination rates for the minimum operating times and membrane areas.
Therefore, the use of overlimiting currents could be advantageous if the energy efficiency
of the process is maintained above a certain threshold. Accordingly, in order to achieve a
good management of industrial waste effluents, their composition and the ions involved
in the concentration polarization mechanisms should deserve special attention. However,
in order to decide when a spent industrial bath has to be treated and regenerated and
which current is the optimum, other operating parameters are also important, such as the
changes of conductivity, the fouling of the membranes or the electrode reactions.
Consequently, the use of overlimiting currents in long-term experiments will be
addressed in the following section (section 4.4).

Results and discussion
215
4.3.6 Conclusions
In this Chapter, the mechanisms of overlimiting current transfer through ion-exchange
membranes have been investigated by comparing the different chronopotentiometric
responses and current-voltage curves obtained in sections 4.1 and 4.2. The predominance
of each mechanism of overlimiting conductance has been evaluated as a function of the
electrolyte composition. The main conclusions related to the dissociation of water in
membrane systems are summarized below:
The dissociation of water is in general insignificant for the systems formed by
Nafion 117 membranes with different metallic solutions, unless the formation of
precipitates at the membrane surface occurs. This behavior has been contrasted
by measuring the pH variations in the compartments of the electrodialysis cell
and by contrasting the chronopotentiometric features detected in the curves.
The formation of metal hydroxides occurred with concentrated solutions of
NiSO4 and Fe2(SO4)3.
The formation of precipitates is associated with a gradual increase of Um with
time in the chronopotentiometric curves. The precipitate layers increase the
resistance of the membrane, which leads to current-voltage curves with
extended plateaus.
The relaxation of the membrane after the application of current gives a hint
about the catalytic dissociation of water occurred at the bipolar interface
between the precipitate layers and the membranes. When catalytic water
splitting occurs, a plateau is formed in the relaxation profile of the membranes
due to the hindered recombination of H+ and OH- ions. Longer plateaus,
associated with higher water splitting rates, were obtained with more diluted
solutions and at higher current densities.
The conformation and morphology of the precipitates affects the ion transport
trough the membranes. Fe(OH)3 precipitates were very compact and were also
formed in the internal membrane matrix, thus causing a blockage of pores and
leading to current-voltage curves without overlimiting region. On the other
hand, Ni(OH)2 precipitates were granulated and did not imply the blockage of
Chapter 4.
216
the membrane pores. The current-voltage curves obtained for the membranes
with Ni(OH)2 precipitates showed flat extended plateaus followed by an
overlimiting region of rapid current growth, which was attributed to the
accelerated water splitting.
The main conclusions related to coupled convective phenomena are the following:
Both gravitational convection and electroconvection are responsible for the
overlimiting conductance of the membrane/electrolyte systems investigated.
Whereas electroconvection is more significant in diluted solutions, gravitational
convection predominates in concentrated ones. Furthermore, both types of
convection can coexist at high electrolyte concentrations and current densities.
The relative effect of both gravitational convection and electroconvection can
be evaluated by representing the values of (Um,max – Um,f) against the i/ilim ratio.
In Cr2(SO4)3 solutions, the decrease of the thickness of the boundary layer due to
gravitational convection already occurs at i/ilim values close to 1. However, the
role of electroconvection predominates for values of i/ilim higher than 2. In the
case of NiSO4, electroconvection is more important in relation to gravitational
convection, and the values of (Um,max – Um,f) become scattered at values of i/ilim
higher than 2.
Increasing concentrations of metal ions led to shorter lplateau values. This trend
proves the enhancement of overlimiting currents by heavy metal ions having
large Stokes radius. The emergence of gravitational convection for low lplateau
values could stem from the fact that the density gradients generated in
electrodialysis cells are higher in the case of heavy metal ions. With regard to
the anticipated onset of electroconvective vortices, the larger Stokes radius of
heavy metal ions involves the motion of larger fluid volumes, hence contributing
to the initiation of chaotic electroconvective vortices for lower lplateau values.
An increase in the concentration of H+ ions has the opposite effect of an increase
in the concentration of heavy metal ions, since the lplateau values increase
notoriously with the concentration of CrO3. The Grotthuss mechanism of proton
conduction in aqueous systems seems to be the reason for these results. This

Results and discussion
217
mechanism consists on the proton hopping between neighboring molecules of
water, hence not involving the motion of large fluid volumes.

Chapter 4.
218
4.4 Effects of the electrolyte composition and the
current regime on the performance of
electrodialysis
4.4.1 Introduction In the previous sections (4.1, 4.2 and 4.3) the fundaments of the transport mechanisms of
metal ions through cation-exchange membranes have been investigated by means of ion
sorption and electrochemical techniques. Nevertheless, despite the useful information
that can be easily obtained from the chronopotentiometric results, these experiments
have relatively short time duration. For that reason, some important phenomena that
could be associated with long-term effects were not taken into account. Therefore, the
experiments of the present section (section 4.4), which consist on galvanostatic
electrodialysis experiments of 6 h duration, are focused on the corroboration of the
previous results and also on elucidating possible long-term effects arising in an
electrodialysis cell. Some of these effects could be the gradual change in the electrolyte
conductivity as the desalting compartments become more diluted, or the possible
formation of precipitates. Moreover, these experiments would serve as a tool to assess
the practical viability of applying overlimiting currents, since the rates of transport of
electrolyte counterions will be measured experimentally.
The system composed of mixture solutions of NiSO4 and CrO3 has been selected for
conducting this study because it allows us to simultaneously investigate the competitive
ion transport through the membrane in mixture solutions and the effects of the current
regime on the electrodialysis performance. With regard to the membrane selectivity, the
study conducted in section 4.2.2 with mixtures of NiSO4 and CrO3 showed that the
transport number of Ni2+ ions through the membrane decreases as the concentration of
CrO3 increases in relation to that of NiSO4. With the galvanostatic experiments of longer
duration we want to confirm the previous results about the membrane selectivity,
evaluate possible changes in the membrane selectivity with time as the diluted
compartment becomes depleted and investigate any long-term effects that could arise
during the course of electrodialysis operations.
With regard to the mechanisms of overlimiting current transfer, the
chronopotentiometric study performed in section 4.3 showed that electroconvection was
the mechanism of overlimiting mass transfer that predominates with mixtures of NiSO4
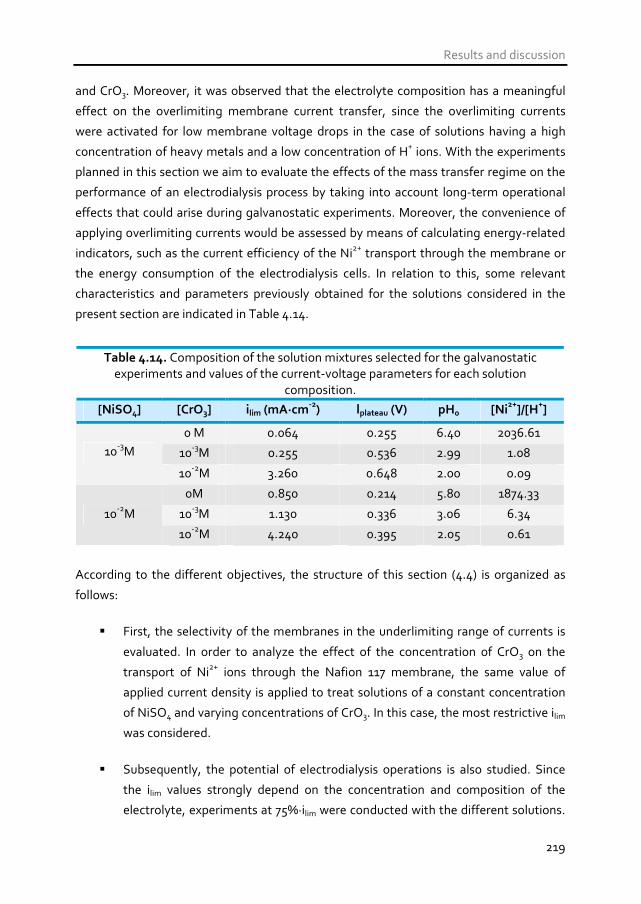
Results and discussion
219
and CrO3. Moreover, it was observed that the electrolyte composition has a meaningful
effect on the overlimiting membrane current transfer, since the overlimiting currents
were activated for low membrane voltage drops in the case of solutions having a high
concentration of heavy metals and a low concentration of H+ ions. With the experiments
planned in this section we aim to evaluate the effects of the mass transfer regime on the
performance of an electrodialysis process by taking into account long-term operational
effects that could arise during galvanostatic experiments. Moreover, the convenience of
applying overlimiting currents would be assessed by means of calculating energy-related
indicators, such as the current efficiency of the Ni2+ transport through the membrane or
the energy consumption of the electrodialysis cells. In relation to this, some relevant
characteristics and parameters previously obtained for the solutions considered in the
present section are indicated in Table 4.14.
Table 4.14. Composition of the solution mixtures selected for the galvanostatic experiments and values of the current-voltage parameters for each solution
composition.
[NiSO4] [CrO3] ilim (mA·cm-2
) lplateau (V) pH0 [Ni2+
]/[H+]
0 M 0.064 0.255 6.40 2036.61
10-3M 0.255 0.536 2.99 1.08 10-3M
10-2M 3.260 0.648 2.00 0.09
0M 0.850 0.214 5.80 1874.33
10-3M 1.130 0.336 3.06 6.34 10-2M
10-2M 4.240 0.395 2.05 0.61
According to the different objectives, the structure of this section (4.4) is organized as
follows:
First, the selectivity of the membranes in the underlimiting range of currents is
evaluated. In order to analyze the effect of the concentration of CrO3 on the
transport of Ni2+ ions through the Nafion 117 membrane, the same value of
applied current density is applied to treat solutions of a constant concentration
of NiSO4 and varying concentrations of CrO3. In this case, the most restrictive ilim
was considered.
Subsequently, the potential of electrodialysis operations is also studied. Since
the ilim values strongly depend on the concentration and composition of the
electrolyte, experiments at 75%·ilim were conducted with the different solutions.

Chapter 4.
220
These results would allow us to investigate the mass transfer rates that could be
achieved in mixture solutions of NiSO4 and CrO3 within the underlimiting range
of currents.
Finally, the effect of applying overlimiting currents was investigated. For this
purpose, several experiments were carried out at current densities
corresponding to 75%, 100% and 125% of the ilim value of each solution
composition. The transfer of Ni2+ ions through the cation-exchange membrane is
measured in order to ascertain if the application of currents above the ilim implies
an increase of the mass transfer rates of electrolyte counterions through the
membranes. Finally, the convenience of applying overlimiting currents would be
evaluated taking into account energy-related indicators such as the current
efficiency for the transport of Ni2+ ions through the membranes, or the specific
energy consumed in the transport of Ni2+ ions.
The experimental conditions and the setup used to conduct the galvanostatic
experiments were schematically shown in section 3.6 of Chapter 3 (Fig. 3.10). In order to
evaluate the energy consumption of the process, the cell voltage (Ucell) measured
between the anode and cathode was registered. According to the values of ilim obtained
for each solution composition (Table 4.14), and the range of applied current densities that
were planned for this section (Table 3.5), the values of current density applied in the
experiments are summarized in Table 4.15.

Results and discussion
221
Table 4.15. Values of current densities applied during the galvanostatic experiments of 6 h duration.
[NiSO4] [CrO3]
Effect of CrO3 on the
transport of Ni2+
ions at
underlimiting currents
Effect of the current regime on the
transport of Ni2+
ions
0M 0.048 mA·cm-2
0.064 mA·cm-2
0.080 mA·cm-2
10-3M 0.191 mA·cm-2
0.255
mA·cm-2 0.319
mA·cm-2 10-3M
10-2M
0.048 mA·cm-2
2.445 mA·cm-2
3.260
mA·cm-2 4.075
mA·cm-2
0M 0.638 mA·cm-2
0.850 mA·cm-2
1.063 mA·cm-2
10-3M 0.848
mA·cm-2
1.130
mA·cm-2
1.413
mA·cm-2 10-2M
10-2M
0.638 mA·cm-2
3.180
mA·cm-2
4.240
mA·cm-2
5.300
mA·cm-2
4.4.2 Effect of the electrolyte composition on the
membrane behavior at underlimiting currents
4.4.2.1 Electrodialysis performance with different compositions at a
constant current
First, the applied current was selected in order not to exceed the ilim value and minimize
possible parasitic processes which could reduce the current efficiency for the nickel
removal. In this manner, the competing transport through the cation-exchange
membrane between Ni2+ and H+ ions can be studied for varying concentrations of NiSO4
and CrO3. For the experiments carried out with 10-2 M NiSO4 solutions and different CrO3
concentrations the current density was set to 75% of the ilim obtained with the single salt
solutions of 10-2 M NiSO4 (0.85 mA·cm-2), as this was the most restrictive value of ilim
calculated for this group of compositions. Thus, the effect of CrO3 on the nickel removal is
studied under a constant value of applied current density. The same criterion was used for
the experiments carried out with 10-3 M NiSO4 solutions and different CrO3
concentrations (in this case the most restrictive ilim was 0.064 mA·cm-2).

Chapter 4.
222
Fig. 4.101 shows the evolution with time of the parameters measured during the
experiments conducted with 10-2M NiSO4 solutions and varying CrO3 concentrations. As
expected, the concentration of Ni2+ ions in the central compartment of the electrodialysis
cell decreases with time (Fig. 4.101(a)). However, for a constant concentration of NiSO4,
the increase in the initial CrO3 concentration leads to a decrease of the transport of Ni2+
ions through the membrane. On the contrary, the values of cell voltage (Ucell) decrease
with the increase of the CrO3 concentration (Fig. 4.101(b)), which is mainly caused by the
higher conductivity of the electrolyte. The values of Ucell show a slightly increasing
evolution with time, which stems from the decrease of conductivity in the central
compartment, where the concentration of cations (H+ and Ni2+) and anions (Cr2O72-,
CrO42-, HCrO4
-, SO42-) decreases as they are transported through the cation- and anion-
exchange membrane, respectively. The results corresponding to 10-3M NiSO4 solutions
and varying concentrations of CrO3 are presented in Fig. 4.102. In this case, the
parameters show similar trends than those observed for 10-2M NiSO4 solutions.
(a) (b)
0.000
0.002
0.004
0.006
0.008
0.010
0.012
0 1 2 3 4 5 6 7
t (h)
[Ni2+
] (m
ol·L
-1)
0M CrO3
10-3M CrO3
10-2M CrO3
0
2
4
6
8
10
12
14
0 1 2 3 4 5 6
t (h)
Uce
ll (
V)
0M CrO3
10-3M CrO3
10-2M CrO3
Figure 4.101. Results obtained with 10-2M NiSO4 solutions and varying concentrations of CrO3 under the application of a current density of 0.638 mA·cm-2. (a) Evolution of the
concentration of Ni2+ ions in the central compartment and (b) evolution of the cell voltage.
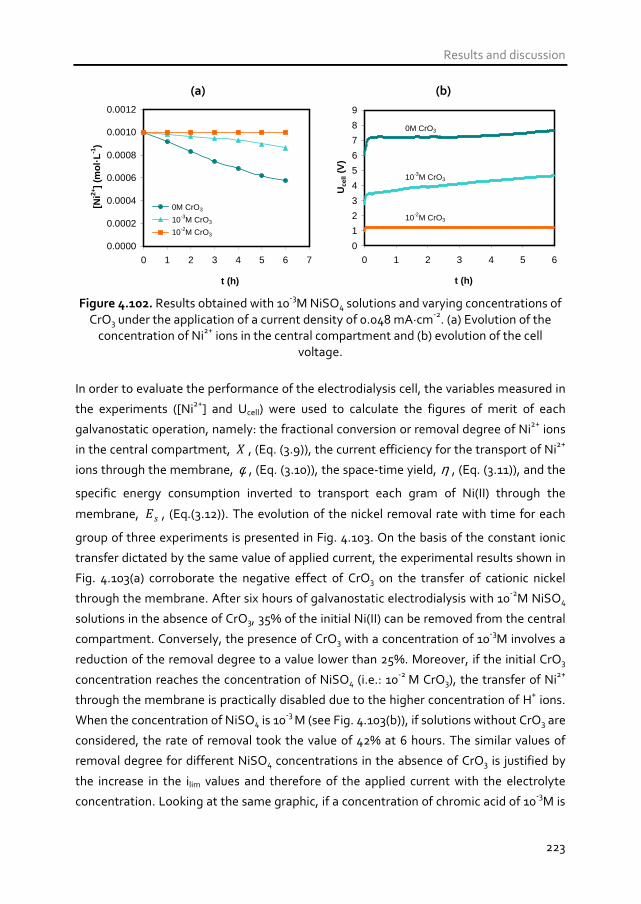
Results and discussion
223
(a) (b)
0.0000
0.0002
0.0004
0.0006
0.0008
0.0010
0.0012
0 1 2 3 4 5 6 7
t (h)
[Ni2+
] (m
ol·L
-1)
0M CrO3
10-3M CrO3
10-2M CrO3
0
1
2
3
4
5
6
7
8
9
0 1 2 3 4 5 6
t (h)
Uce
ll (
V)
0M CrO3
10-3M CrO3
10-2M CrO3
Figure 4.102. Results obtained with 10-3M NiSO4 solutions and varying concentrations of CrO3 under the application of a current density of 0.048 mA·cm-2. (a) Evolution of the
concentration of Ni2+ ions in the central compartment and (b) evolution of the cell voltage.
In order to evaluate the performance of the electrodialysis cell, the variables measured in
the experiments ([Ni2+] and Ucell) were used to calculate the figures of merit of each
galvanostatic operation, namely: the fractional conversion or removal degree of Ni2+ ions
in the central compartment, X , (Eq. (3.9)), the current efficiency for the transport of Ni2+
ions through the membrane, φ , (Eq. (3.10)), the space-time yield, η , (Eq. (3.11)), and the
specific energy consumption inverted to transport each gram of Ni(II) through the
membrane, sE , (Eq.(3.12)). The evolution of the nickel removal rate with time for each
group of three experiments is presented in Fig. 4.103. On the basis of the constant ionic
transfer dictated by the same value of applied current, the experimental results shown in
Fig. 4.103(a) corroborate the negative effect of CrO3 on the transfer of cationic nickel
through the membrane. After six hours of galvanostatic electrodialysis with 10-2M NiSO4
solutions in the absence of CrO3, 35% of the initial Ni(II) can be removed from the central
compartment. Conversely, the presence of CrO3 with a concentration of 10-3M involves a
reduction of the removal degree to a value lower than 25%. Moreover, if the initial CrO3
concentration reaches the concentration of NiSO4 (i.e.: 10-2 M CrO3), the transfer of Ni2+
through the membrane is practically disabled due to the higher concentration of H+ ions.
When the concentration of NiSO4 is 10-3 M (see Fig. 4.103(b)), if solutions without CrO3 are
considered, the rate of removal took the value of 42% at 6 hours. The similar values of
removal degree for different NiSO4 concentrations in the absence of CrO3 is justified by
the increase in the ilim values and therefore of the applied current with the electrolyte
concentration. Looking at the same graphic, if a concentration of chromic acid of 10-3M is

Chapter 4.
224
reached, the nickel removal rate decreases to 14%. Finally, with an increase of the
concentration of chromic acid to 10-2M, the removal rate is reduced practically to zero, as
occurred with 10-2M NiSO4 solutions. Nevertheless, the effect of the chromic acid
concentration on the evolution of the nickel removal rate is more notorious in the case of
10-3M NiSO4 solutions. This difference is due to the competition of H+ with Ni2+ ions,
which is more meaningful when the content of protons reaches or exceeds that of the Ni2+
ions.
(a) (b)
0
10
20
30
40
50
0 1 2 3 4 5 6 7
t (h)
X (
%)
0M CrO3
10-3M CrO3
10-2M CrO3
0
10
20
30
40
50
0 1 2 3 4 5 6 7
t (h)
X (
%)
0M CrO3
10-3M CrO3
10-2M CrO3
Figure 4.103. Nickel renoval rate ( X ) vs. time for different CrO3 concentrations in (a) 10-2M NiSO4 solutions (i = 0.638 mA·cm-2) and (b) 10-3M NiSO4 solutions (i = 0.048
mA·cm-2)
The results of current efficiency calculated from the previous experiments are shown in
Fig. 4.104. With 10-2M NiSO4 solutions, the values of current efficiency decrease gradually
with the increase of the chromic acid concentration (Fig. 4.104(a)). The values of φ
obtained with 10-3M NiSO4 solutions follow the same dependence with the chromic acid
concentration (Fig. 4.104(b)). For this nickel sulfate concentration the current efficiency
abruptly decreases with the concentration of chromic acid: it decreases from a value of
80% in the absence of CrO3 to values around 20% with 10-3M CrO3 solutions and reaches
zero with a concentration of CrO3 of 10-2M. The reduction in the φ values with increasing
concentrations of CrO3 is consequence of the reduced transport of Ni2+ ions as more
protons are transferred through the membrane. Apart from this, if solutions without CrO3
are compared, the change of NiSO4 concentration from 10-2M to 10-3M implies an
increase in the current efficiency from 40% to 80%. The reduction in the current efficiency
with the nickel sulfate concentration could be explained in terms of a reduction of the
passage of the ions of interest through the membrane due to a diminished exclusion of

Results and discussion
225
SO42- ions. In fact, it is reported that the repulsion of coions by the membrane fixed
charges decreases with the electrolyte concentration and implies a decreased transport
of counterions [2,15,110]. Moreover, these results are in congruence with the decreasing
trend of +2NiT with the increase in the electrolyte concentration calculated in section 4.2
(see Fig. 4.57). In addition to the weakened coion exclusion occurring at increasing
electrolyte concentrations, in the case of nickel sulfate solutions, the recombination of
Ni2+ ions with SO42- ions to form the complex specie NiSO4 is enhanced at high electrolyte
concentrations. This complex specie, without a net charge, could be also responsible for
the reduction of the transport of Ni2+ ions through the membrane. Besides this, the
increasing evolution of φ values with time in most of the cases reveals a reduction of the
hindrance of the transport of Ni2+ ions originated by the decrease in the concentration of
SO42- ions with time in the central compartment. As more SO4
2- ions are transported to
the anodic compartment, the complex specie NiSO4 dissociates in the central
compartment to give Ni2+ and SO42- ions. Therefore, the higher supply of Ni2+ to the
depleting surface of the cation-exchange membrane would cause the increasing values of
φ with time obtained in Fig. 4.104(a).
(a) (b)
0
10
20
30
40
50
0 1 2 3 4 5 6 7
t (h)
φ (%
)
0 M CrO3
10-3 M CrO3
10-2 M CrO3
0
20
40
60
80
100
0 1 2 3 4 5 6 7
t (h)
φ (%
)
0 M CrO3
10-3 M CrO3
10-2 M CrO3
Figure 4.104. Current efficiency of nickel ( φ ) vs. time for different CrO3 concentrations in
(a) 10-2M NiSO4 solutions (i = 0.638 mA·cm-2) and (b) 10-3M NiSO4 solutions (i = 0.048 mA·cm-2)
The values of space-time yield and specific energy consumption are depicted in Figs.
4.105 and 4.106, respectively. The space-time yield is generally higher in the case of 10-2M
NiSO4 solutions, as expected since the values of applied current are higher because the ilim
increases with the electrolyte concentration. Furthermore, in Fig. 4.105 an increasing
trend of η with time shown in some curves confirms the major importance of the

Chapter 4.
226
presence of the complex specie NiSO4 and SO42- ions in the case of solutions in which the
concentration of NiSO4 is higher. In these cases, the reduction with time of the SO42- ion
concentration in the central compartment allows for a higher selectivity of the membrane
for Ni2+ ions with the course of the experiment.
(a) (b)
0.00
0.01
0.02
0.03
0.04
0 1 2 3 4 5 6 7
t (h)
η (g
·l-1
·h-1
)
0 M CrO3
10-3 M CrO3
10-2 M CrO3
0.000
0.001
0.002
0.003
0.004
0.005
0 1 2 3 4 5 6 7
t (h)
η (g
·l-1
·h-1
) 0M CrO3
10-3M CrO3
10-2M CrO3
Figure 4.105. Space-time yield of nickel (η ) vs. time for different CrO3 concentrations in
(a) 10-2M NiSO4 solutions (i = 0.638 mA·cm-2) and (b) 10-3M NiSO4 solutions (i = 0.048 mA·cm-2)
With regard to the specific energy consumption, from Fig. 4.106 it is seen that the
removal of nickel requires less energy in the case of low NiSO4 concentrations, which is in
concordance with the lower values of current that have to be applied for these solutions
to work in the underlimiting range. This is also a consequence of the lower Ucell values
registered for 10-3M NiSO4 with respect to the values registered for 10-2M NiSO4 solutions.
With 10-2M NiSO4 solutions, around 30 kW·h/kg are consumed when the chromic acid
concentration is below 10-3M. For an increase in the concentration of CrO3 to 10-2M the
specific energy grows abruptly until values higher than 150 Kw·h/kg. With this parameter
it is also observed that 10-3M NiSO4 solutions are much more sensitive to the
concentration of CrO3 in the electrolyte, as the energy becomes almost twofold when
changing from 0M to 10-3M CrO3 solutions and cannot be calculated for a CrO3
concentration of 10-2M because the transport of Ni2+ was insignificant. From the results
shown in Fig. 4.106 it is also possible to ascertain which effect is more significant from the
dependence of sE with time, that of the presence of SO42- ions or that due to CrO3. When
the influence of the complex NiSO4 in the solution together with the reduced repulsion of
SO42- ions by the membrane is more meaningful, a descending trend is observed in the
curves, since the transport of Ni2+ ions increases as the SO42- concentration diminishes

Results and discussion
227
with time in the central compartment. However, when the concentration of CrO3 is
higher, the competence of H+ with Ni2+ ions hides the positive effect of a diminishing
SO42- ion concentration and implies an increasing evolution of the specific energy
consumption with time.
(a) (b)
0
50
100
150
200
0 1 2 3 4 5 6 7
t (h)
Es
(kW
·h·k
g-1
)
0M CrO3
10-3M CrO3
10-2M CrO3
0
5
10
15
20
0 1 2 3 4 5 6 7
t (h)
Es
(kW
·h·k
g-1
)
0M CrO3
10-3M CrO3
Figure 4.106. Specific energy consumption ( sE ) vs. time for different CrO3
concentrations in (a) 10-2M NiSO4 solutions (i = 0.638 mA·cm-2) and (b) 10-3M NiSO4 solutions (i = 0.048 mA·cm-2)
To summarize, it can be concluded that the trends observed in the galvanostatic
experiments of 6-hour duration confirm the results of TNi2+ obtained in section 4.2.2.5.
The competitive ion transport between Ni2+ and H+ ions determines the efficiency of the
removal of Ni2+ ions from the central compartment of the electrodialysis cell. This
competition takes place in the solution layers next to the membrane due to the higher
mobility of H+ ions ( 125103119 −−⋅=+ scmDH
. ) in relation to that of Ni2+ ions
( 1251066102−−⋅=+ scmD
Ni. ), which would imply a comparatively higher supply of H+ ions
to the membrane surface when the concentration of both ions in the bulk solution is
similar [5]. However, the competing ion transport also takes place inside the membrane
phase. As reported in previous studies, the affinity of the fixed charges of Nafion 117 and
other cation-exchange membranes for cations increases with their valence, which is
known as the valence effect [23,46,47,49]. However, as described in the literature and
also reported in the ion uptake experiments presented in section 4.2.2.2 (Figs. 4.42 and
4.43), changes in the pH of the electrolyte also affect the partitioning of Ni2+ ions in the
membrane [55]. In this respect, the initial pH of the solutions, which is specified in Table
4.14, took values around 3 when the concentration of CrO3 is 10-3M and values of 2 when

Chapter 4.
228
the concentration of CrO3 increased to 10-2M. Moreover, the decreased partition of Ni2+
ions in the membrane phase as a consequence of the increased concentration of H+ ions
could be aggravated as the rate of supply of ions to the membrane is altered due to the
development of concentration polarization resulting from the application of current.
4.4.2.2 Electrodialysis performance at 75%·ilim for each solution
composition In order to contrast the potential of the electrodialytic treatment of metal containing
effluents of different compositions, additional galvanostatic experiments of 6 h were
performed with an imposed current density of 75% of the ilim obtained for each
electrolyte. By comparing the obtained results it is possible to elucidate which
composition leads to better electrodialytic performance within its corresponding
underlimiting range of currents. It must be noted that the experiments with the mixtures
of 10-3M NiSO4 and 10-2M CrO3 could not be performed because the high electrical
resistance of the cell at the corresponding applied current implied very high Ucell values,
which exceeded the bearable conditions of the galvanostat.
In Fig. 1.107 the evolution of the removal degree of Ni2+ with time is depicted for each
experiment. The results show that applying a constant current equal to 75% of the ilim
corresponding to each solution makes possible an increase of the passage of Ni2+ ions
through the membrane with respect to the experiments of the previous section.
Especially significant are the cases of 10-2M CrO3 solutions, where the passage of Ni2+
through the membrane was inappreciable when the applied current was 75% of the ilim
corresponding to the single salt solutions without CrO3. The removal degree increases
with the presence of CrO3 in the composition of the solutions because the range of
limiting currents increases with the presence of this species. In this respect, removal rates
close to 80% were obtained with solutions having the same concentration of NiSO4 and
CrO3.

Results and discussion
229
(a) (b)
0
20
40
60
80
100
0 1 2 3 4 5 6 7t (h)
X (
%)
0M CrO3
10-3M CrO3
10-2M CrO3
0
20
40
60
80
100
0 1 2 3 4 5 6 7t (h)
X (
%)
0M CrO3
10-3M CrO3
Figure 4.107. Nickel removal rate ( X ) vs. time for different CrO3 concentrations in (a) 10-2M NiSO4 solutions and (b) 10-3M NiSO4 solutions. (The applied current corresponds
to 0.75·ilim en each case)
The rest of figures of merit obtained from these experiments are shown in Figs. 4.108-
4.110. As the concentration of CrO3 increases, φ values decrease because an important
portion of current is employed to transfer H+ ions through the membrane. This decrease
is less important in the case of 10-2M NiSO4 solutions (Fig. 4.105(a)), because Ni2+ ions are
the predominant specie both in the solution and inside the membrane. As expected, the
increase of the removal rates resulting from applying higher currents with solutions
containing CrO3 is achieved at the expense of lower values of φ . Nevertheless, the values
of current efficiency are very similar to those obtained previously in the section 4.4.2.1, as
it was expected, since in both cases underlimiting currents were imposed. Furthermore, in
most cases the current efficiency increases with time due to the decrease of the
concentration of coions in the central compartment and also due to the faster passage of
H+ ions compared to that of Ni2+ ions. Since protons are more mobile than Ni2+ ions, their
passage takes place at shorter times. Therefore, at increasing times the transport of Ni2+
ions to the membrane surface would predominate, thus causing the improvement of the
current efficiency with time.
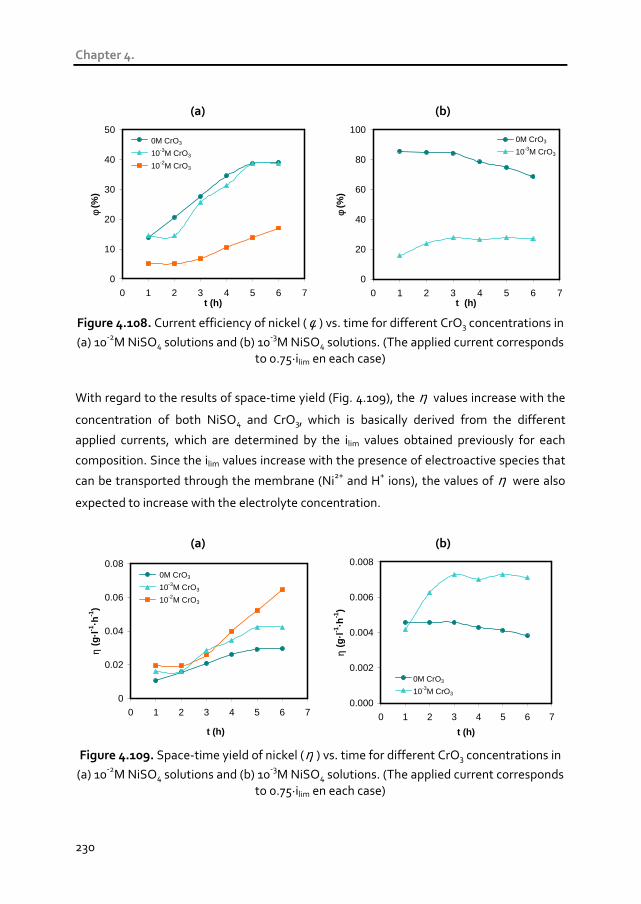
Chapter 4.
230
(a) (b)
0
10
20
30
40
50
0 1 2 3 4 5 6 7t (h)
φ (%
)
0M CrO3
10-3M CrO3
10-2M CrO3
0
20
40
60
80
100
0 1 2 3 4 5 6 7t (h)
φ (%
)
0M CrO3
10-3M CrO3
Figure 4.108. Current efficiency of nickel ( φ ) vs. time for different CrO3 concentrations in
(a) 10-2M NiSO4 solutions and (b) 10-3M NiSO4 solutions. (The applied current corresponds to 0.75·ilim en each case)
With regard to the results of space-time yield (Fig. 4.109), the η values increase with the
concentration of both NiSO4 and CrO3, which is basically derived from the different
applied currents, which are determined by the ilim values obtained previously for each
composition. Since the ilim values increase with the presence of electroactive species that
can be transported through the membrane (Ni2+ and H+ ions), the values of η were also
expected to increase with the electrolyte concentration.
(a) (b)
0
0.02
0.04
0.06
0.08
0 1 2 3 4 5 6 7
t (h)
η (g
·l-1
·h-1
)
0M CrO3
10-3M CrO3
10-2M CrO3
0.000
0.002
0.004
0.006
0.008
0 1 2 3 4 5 6 7
t (h)
η (g
·l-1
·h-1
)
0M CrO3
10-3M CrO3
Figure 4.109. Space-time yield of nickel (η ) vs. time for different CrO3 concentrations in
(a) 10-2M NiSO4 solutions and (b) 10-3M NiSO4 solutions. (The applied current corresponds to 0.75·ilim en each case)
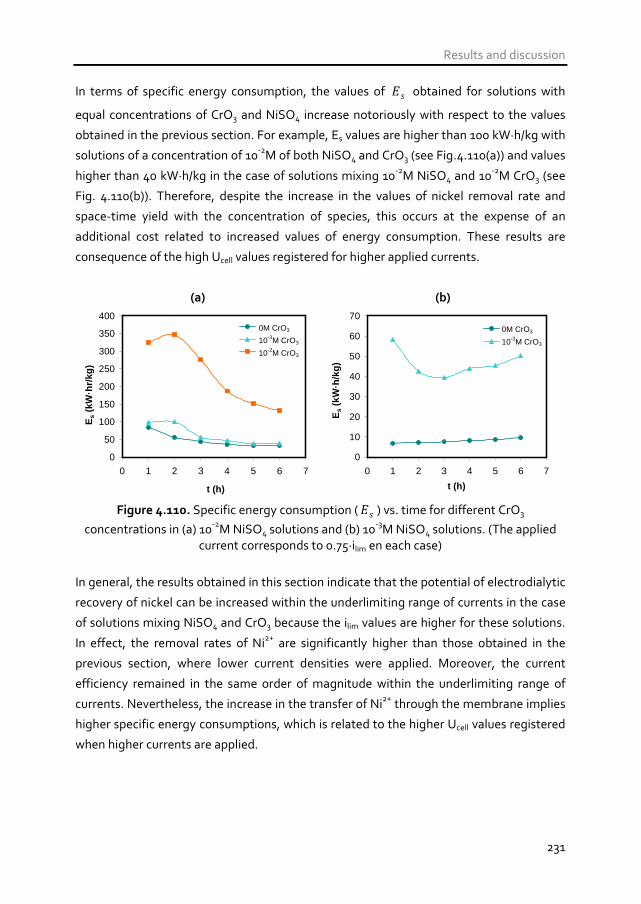
Results and discussion
231
In terms of specific energy consumption, the values of sE obtained for solutions with
equal concentrations of CrO3 and NiSO4 increase notoriously with respect to the values
obtained in the previous section. For example, Es values are higher than 100 kW·h/kg with
solutions of a concentration of 10-2M of both NiSO4 and CrO3 (see Fig.4.110(a)) and values
higher than 40 kW·h/kg in the case of solutions mixing 10-2M NiSO4 and 10-2M CrO3 (see
Fig. 4.110(b)). Therefore, despite the increase in the values of nickel removal rate and
space-time yield with the concentration of species, this occurs at the expense of an
additional cost related to increased values of energy consumption. These results are
consequence of the high Ucell values registered for higher applied currents.
(a) (b)
0
50
100
150
200
250
300
350
400
0 1 2 3 4 5 6 7
t (h)
Es
(kW
·hr/
kg)
0M CrO3
10-3M CrO3
10-2M CrO3
0
10
20
30
40
50
60
70
0 1 2 3 4 5 6 7
t (h)
Es
(kW
·h/k
g)0M CrO3
10-3M CrO3
Figure 4.110. Specific energy consumption ( sE ) vs. time for different CrO3
concentrations in (a) 10-2M NiSO4 solutions and (b) 10-3M NiSO4 solutions. (The applied current corresponds to 0.75·ilim en each case)
In general, the results obtained in this section indicate that the potential of electrodialytic
recovery of nickel can be increased within the underlimiting range of currents in the case
of solutions mixing NiSO4 and CrO3 because the ilim values are higher for these solutions.
In effect, the removal rates of Ni2+ are significantly higher than those obtained in the
previous section, where lower current densities were applied. Moreover, the current
efficiency remained in the same order of magnitude within the underlimiting range of
currents. Nevertheless, the increase in the transfer of Ni2+ through the membrane implies
higher specific energy consumptions, which is related to the higher Ucell values registered
when higher currents are applied.
Chapter 4.
232
4.4.3 Effect of the current regime
Once the effect of the concentration of NiSO4 and CrO3 on the transference of Ni2+ ions
through the cation-exchange membrane has been studied under the application of
underlimiting currents, the effect of the current regime is also investigated. For this
purpose, galvanostatic experiments conducted at values of 75, 100 and 125% of the ilim
calculated for each composition were carried out. As occurred in the previous section, the
experiments corresponding to the mixture solution of 10-3M NiSO4 and 10-2M CrO3 could
not be conducted because the Ucell values were higher than the limits bearable by the
galvanostat.
The results obtained with 10-2M NiSO4 solutions are presented as a function of the time of
galvanostatic operation in Fig. 4.111. The nickel removal rates ( X , Fig. 4.111(a)) increase
with the range of applied currents. More specifically, the nickel removal rate reached
after the 6 h of operation was 35%, 71% and 83% for increasing values of current density.
These results prove that the overlimiting currents are associated with an increase in the
transport of the electrolyte counterions (Ni2+ ions) through the membrane, even though
conditions of intensive concentration polarization may predominate in the depleting
diffusion boundary layer. Therefore, coupled convection may be the phenomenon
causing an additional supply of Ni2+ ions to the membrane at intensive current regimes,
whereas the transport of new current carriers (H+ and OH- ions resulting from the
dissociation of water) would be irrelevant. It has to be pointed out that during the
experiments carried out at 75%·ilim, overlimiting current phenomena could also take place
at a certain time if the electrolyte concentration in the central compartment decreased to
such an extent that the actual ilim would reach the value of the applied current density.
Regarding the evolution of the cell voltage with time; the results show a different
evolution of this parameter depending on the current regime. The cell voltage can be
considered as the sum of different contributions: the resistance of the solution present in
the different compartments, the resistance of the electrodes, the resistance of the ion-
exchange membranes and that of the boundary layers next to the membranes. In Fig.
4.111(b) an increase in Ucell is observed in every case at different time values. Under the
application of 75%·ilim, the cell voltage increases from 13.2 V at two hours of operation to
14.4 V after four hours. However, at overlimiting currents the increase in the cell voltage
occurs at the beginning of the experiments. Hence, this important increase in the cell
voltage can be mainly attributed to the counterion depletion at the interface between the
Results and discussion
233
membrane and the solution in the central compartment, which originates a solution layer
of high electric resistance. After the first increase, the values of cell voltage are stabilized
or even decrease with time depending on the applied current. This decrease can be
associated with an additional supply of ions to the membrane caused by
electroconvection. Specifically, electroconvection would imply the mixing of the
depleting boundary layer, hence reducing the resistance of the depleted solution near the
membrane. Finally, cell voltage values increase with time at the end of the experiments
due to the decrease in the conductivity of the central compartment. This increase in Ucell
is significantly higher in the case of 125%·ilim, which could be probably due to the
formation of precipitates.
The evolution of the current efficiency and specific energy consumption with time
obtained for 10-2M NiSO4 solutions is presented in Fig. 4.111(c)-(d). Current efficiency
values rise in every case during the duration of the experiments. Nevertheless, the final
values of current efficiency are significantly higher in the case of applying currents of 100
and 125%·ilim, reaching an efficiency around 60% in both cases. In contrast, the values of
φ achieved with underlimiting currents are lower than 40%, which corroborates the
positive effect of electroconvection on the process. The formation of electroconvective
vortices of higher height when stronger electric fields are applied would be the
phenomenon responsible for an increased supply of Ni2+ ions from the bulk solution to the
membrane. The increased transport of Ni2+ ions through the membrane occurring at
larger times also implies a decrease of the sE values, as shown in Fig. 4.111(d). The sE
values obtained for the experiment conducted at underlimiting currents are higher than
those obtained at overlimiting currents. However, the values of sE of the three curves
become closer with time, in a range between 20-35 kW·h/kg at the end of the
experiments. The difference between the three curves decreases with time because in the
case of overlimiting currents the resistance in the central compartment rises more
notoriously due to the intensive ion depletion. This entails a significant increase in the
Ucell values, which attenuates the decrease of sE , even though their current efficiencies
are higher than those achieved at 75%·ilim.

Chapter 4.
234
(a) (b)
0
20
40
60
80
100
0 1 2 3 4 5 6 7
t (h)
X (
%)
125% ilim100% ilim 75% ilim
10
14
18
22
26
0 1 2 3 4 5 6 7
t (h)
Uce
ll (
V)
125% ilim100% ilim 75% ilim
Development of concentration polarization
Onset of electroconvection
(c) (d)
0
10
20
30
40
50
60
70
0 1 2 3 4 5 6 7
t (h)
φ (%
)
125% ilim100% ilim 75% ilim
0
20
40
60
80
100
0 1 2 3 4 5 6 7
t (h)
Es
(kW
·h/k
g)
125% ilim100% ilim 75% ilim
Figure 4.111. Parameters calculated for the experiment conducted with 10-2M NiSO4 solutions at different regimes of applied current. Evolution with time of (a) nickel removal rate, (b) cell voltage, (c) current efficiency of nickel and (d) specific energy consumption.
The results corresponding to mixtures of 10-2M NiSO4 and 10-3M CrO3 are shown in Fig.
4.112. In this case the nickel removal rate also increases with the applied current, which
confirms the positive effect of electroconvection also in mixture solutions containing
chromic acid. Moreover, there is a change in the trend of the X values, which increase
moderately for the first hours of the experiments, and then (after the second hour)
increase more notoriously, maybe due to the positive effect of coupled convection on the
transport of Ni2+ ions. For the experiments carried out at a current of 75%·ilim, the
concentration at which the applied current coincides with the limiting one may also be
reached, since a slight increase in the Ucell took place after the first two hours. The first
increase in Ucell is also very slight in the test corresponding to 100%·ilim and appears at the
beginning of the experiment, whereas it is unnoticeable in the case of 125%·ilim. Finally,
Results and discussion
235
an additional increase in the Ucell values appears in each case at the time when the nickel
removal rate reaches a value of 40% (at 5, 4 and 3 h of electrodialysis for 75, 100 and
125%·ilim, respectively), as indicated in Fig. 4.112(a)-(b). The dilution in the central
compartment may promote the final increment in Ucell because the resistance of the
solution in the central compartment rises.
The current efficiency and specific energy consumption (Fig. 4.112(c)-(d)) show the same
trend as that observed previously for single salt solutions. The current efficiency increases
with time due to the emergence of electroconvection, which leads to decreasing values of
sE with time. The improvement in the transport of Ni2+ ions with the applied current
density could be caused by the generation of electroconvective vortices of higher height,
as already observed in the chronopotentiometric results presented in section 4.3 (see for
example Fig. 4.90). However, in contrast to the results obtained in the absence of chromic
acid, here the differences between the three curves are small, thus confirming the
important role of the electrolyte composition on the magnitude of electroconvection.
Electroconvection seems to be enhanced by ions with high hydrated size, such as Ni2+
ions, since their motion involves the mixing of large volumes of electrolyte and implies a
more important distortion of the diffusion boundary layers. On the contrary, higher
concentrations of CrO3, which provides H+ to the solution, reduce the increase in the
current efficiency associated with the transition from under- to overlimiting regimes. In
addition, as already deduced from the current-voltage curves obtained with different
electrolyte compositions, the transition to overlimiting currents implies larger membrane
voltage drops (lplateau) with increasing concentrations of H+ ions, thus causing the
moderate differences registered in Fig. 4.112(d).
As discussed in the previous section (4.3), the different behavior of H+ and Ni2+ ions can be
explained by the different transport mechanism showed by protons, since protons are
transported in the solution preferentially being exchanged between different water
molecules (Grotthuss transport). This kind of transport allows for an increase in the
current transfer through the membrane, but does not imply an additional mixing of the
diffusion boundary layer. As a consequence, the increase in the current efficiency for the
transport of Ni2+ ions decreases for lower [Ni2+]/[H+] ratios, since the lowered
predominance of nickel in the solution reduces its implication in the motion of important
volumes of solution originated by electroconvective vortices. These results are in
congruence with previous studies that proved that electroconvection is facilitated by the
presence of ionic species with high Stokes radius, such as Ni2+ ions [61,78,102]. However,
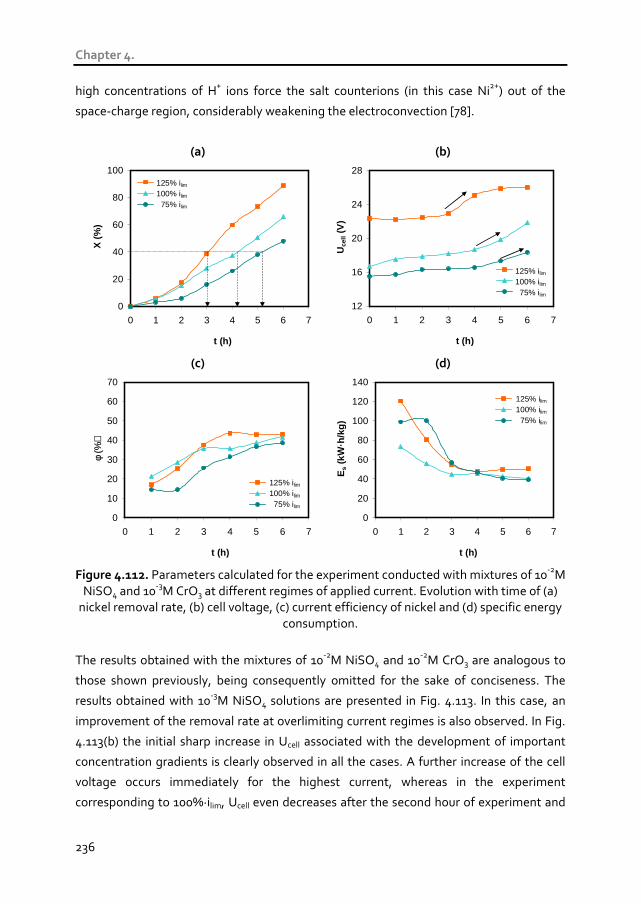
Chapter 4.
236
high concentrations of H+ ions force the salt counterions (in this case Ni2+) out of the
space-charge region, considerably weakening the electroconvection [78].
(a) (b)
0
20
40
60
80
100
0 1 2 3 4 5 6 7
t (h)
X (
%)
125% ilim100% ilim 75% ilim
12
16
20
24
28
0 1 2 3 4 5 6 7
t (h)U
cell (
V)
125% ilim100% ilim 75% ilim
(c) (d)
0
10
20
30
40
50
60
70
0 1 2 3 4 5 6 7
t (h)
φ (%
)
125% ilim100% ilim 75% ilim
0
20
40
60
80
100
120
140
0 1 2 3 4 5 6 7
t (h)
Es
(kW
·h/k
g)
125% ilim100% ilim 75% ilim
Figure 4.112. Parameters calculated for the experiment conducted with mixtures of 10-2M NiSO4 and 10-3M CrO3 at different regimes of applied current. Evolution with time of (a)
nickel removal rate, (b) cell voltage, (c) current efficiency of nickel and (d) specific energy consumption.
The results obtained with the mixtures of 10-2M NiSO4 and 10-2M CrO3 are analogous to
those shown previously, being consequently omitted for the sake of conciseness. The
results obtained with 10-3M NiSO4 solutions are presented in Fig. 4.113. In this case, an
improvement of the removal rate at overlimiting current regimes is also observed. In Fig.
4.113(b) the initial sharp increase in Ucell associated with the development of important
concentration gradients is clearly observed in all the cases. A further increase of the cell
voltage occurs immediately for the highest current, whereas in the experiment
corresponding to 100%·ilim, Ucell even decreases after the second hour of experiment and
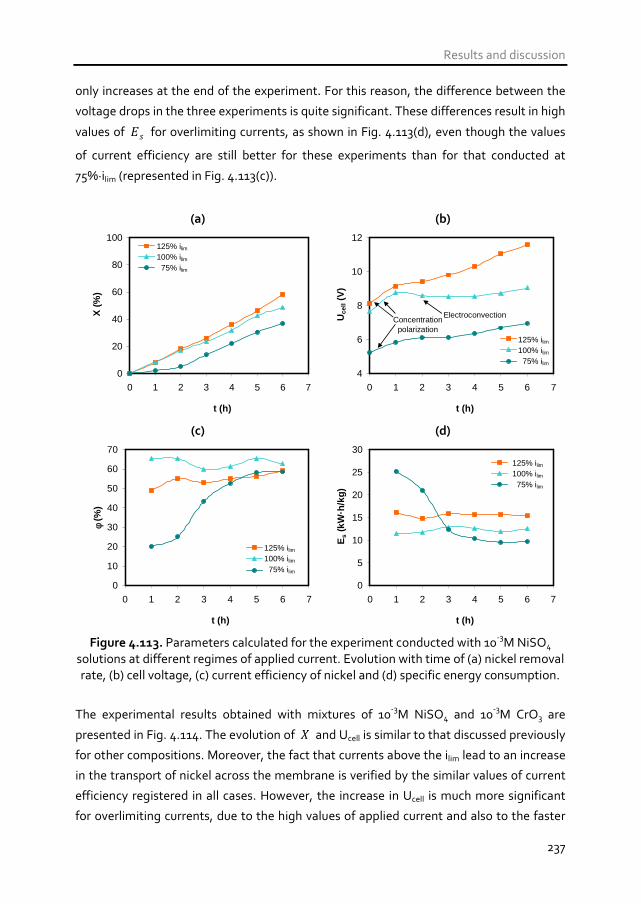
Results and discussion
237
only increases at the end of the experiment. For this reason, the difference between the
voltage drops in the three experiments is quite significant. These differences result in high
values of sE for overlimiting currents, as shown in Fig. 4.113(d), even though the values
of current efficiency are still better for these experiments than for that conducted at
75%·ilim (represented in Fig. 4.113(c)).
(a) (b)
0
20
40
60
80
100
0 1 2 3 4 5 6 7
t (h)
X (
%)
125% ilim100% ilim 75% ilim
4
6
8
10
12
0 1 2 3 4 5 6 7
t (h)
Uce
ll (
V)
125% ilim100% ilim 75% ilim
Concentration polarization
Electroconvection
(c) (d)
0
10
20
30
40
50
60
70
0 1 2 3 4 5 6 7
t (h)
φ (%
)
125% ilim100% ilim 75% ilim
0
5
10
15
20
25
30
0 1 2 3 4 5 6 7
t (h)
Es
(kW
·h/k
g)
125% ilim100% ilim 75% ilim
Figure 4.113. Parameters calculated for the experiment conducted with 10-3M NiSO4 solutions at different regimes of applied current. Evolution with time of (a) nickel removal rate, (b) cell voltage, (c) current efficiency of nickel and (d) specific energy consumption.
The experimental results obtained with mixtures of 10-3M NiSO4 and 10-3M CrO3 are
presented in Fig. 4.114. The evolution of X and Ucell is similar to that discussed previously
for other compositions. Moreover, the fact that currents above the ilim lead to an increase
in the transport of nickel across the membrane is verified by the similar values of current
efficiency registered in all cases. However, the increase in Ucell is much more significant
for overlimiting currents, due to the high values of applied current and also to the faster

Chapter 4.
238
depletion of ions occurred in the central compartment of the electrodialysis cell. As a
consequence of the high voltage cells, the values of sE obtained for the overlimiting
currents were comparatively higher than the values obtained for the underlimiting
current (see Fig. 4.114(d)). In addition, the increase in the sE values with the applied
current could be strongly related to the fact that having a major proportion of protons in
relation to that of Ni2+ ions hampers electroconvection, and therefore the magnitude of
the membrane voltage drop associated to the application of overlimiting currents is
significantly higher than in the previous experiments where the [Ni2+]/[H+] ratio was
higher.
(a) (b)
0
20
40
60
80
100
0 1 2 3 4 5 6 7
t (h)
X (
%)
125% ilim100% ilim 75% ilim
5
10
15
20
25
30
35
40
0 1 2 3 4 5 6 7
t (h)
Uce
ll (
V)
125% ilim100% ilim 75% ilim
(c) (d)
0
5
10
15
20
25
30
35
0 1 2 3 4 5 6 7
t (h)
φ (%
)
125% ilim100% ilim 75% ilim
0
20
40
60
80
100
120
0 1 2 3 4 5 6 7
t (h)
Es
(kW
·h/k
g)
125% ilim100% ilim 75% ilim
Figure 4.114. Parameters calculated for the experiment conducted with the mixtures of 10-3M NiSO4 and 10-3M CrO3 at different regimes of applied current. Evolution with time of (a) nickel removal rate, (b) cell voltage, (c) current efficiency of nickel and (d) specific
energy consumption.
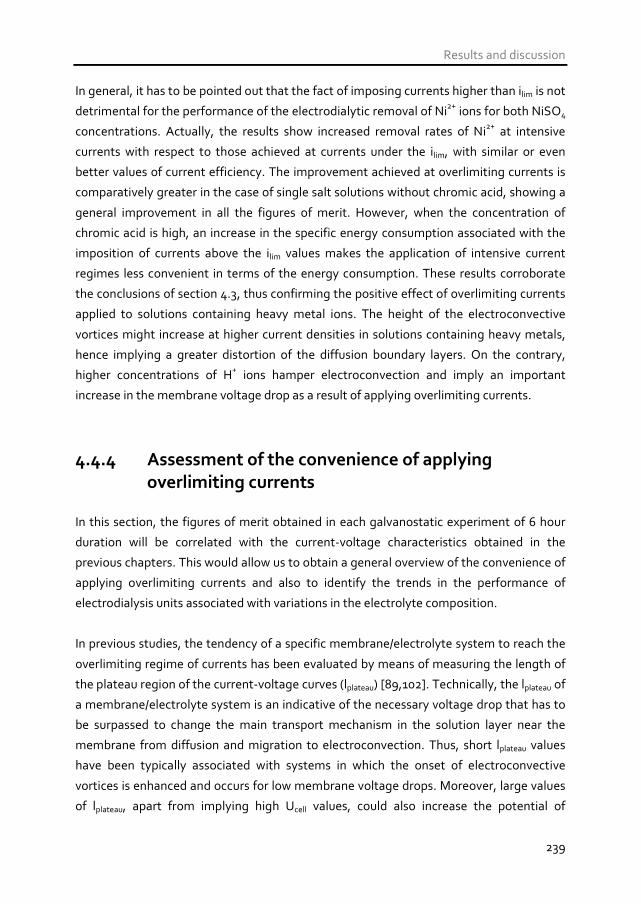
Results and discussion
239
In general, it has to be pointed out that the fact of imposing currents higher than ilim is not
detrimental for the performance of the electrodialytic removal of Ni2+ ions for both NiSO4
concentrations. Actually, the results show increased removal rates of Ni2+ at intensive
currents with respect to those achieved at currents under the ilim, with similar or even
better values of current efficiency. The improvement achieved at overlimiting currents is
comparatively greater in the case of single salt solutions without chromic acid, showing a
general improvement in all the figures of merit. However, when the concentration of
chromic acid is high, an increase in the specific energy consumption associated with the
imposition of currents above the ilim values makes the application of intensive current
regimes less convenient in terms of the energy consumption. These results corroborate
the conclusions of section 4.3, thus confirming the positive effect of overlimiting currents
applied to solutions containing heavy metal ions. The height of the electroconvective
vortices might increase at higher current densities in solutions containing heavy metals,
hence implying a greater distortion of the diffusion boundary layers. On the contrary,
higher concentrations of H+ ions hamper electroconvection and imply an important
increase in the membrane voltage drop as a result of applying overlimiting currents.
4.4.4 Assessment of the convenience of applying
overlimiting currents
In this section, the figures of merit obtained in each galvanostatic experiment of 6 hour
duration will be correlated with the current-voltage characteristics obtained in the
previous chapters. This would allow us to obtain a general overview of the convenience of
applying overlimiting currents and also to identify the trends in the performance of
electrodialysis units associated with variations in the electrolyte composition.
In previous studies, the tendency of a specific membrane/electrolyte system to reach the
overlimiting regime of currents has been evaluated by means of measuring the length of
the plateau region of the current-voltage curves (lplateau) [89,102]. Technically, the lplateau of
a membrane/electrolyte system is an indicative of the necessary voltage drop that has to
be surpassed to change the main transport mechanism in the solution layer near the
membrane from diffusion and migration to electroconvection. Thus, short lplateau values
have been typically associated with systems in which the onset of electroconvective
vortices is enhanced and occurs for low membrane voltage drops. Moreover, large values
of lplateau, apart from implying high Ucell values, could also increase the potential of
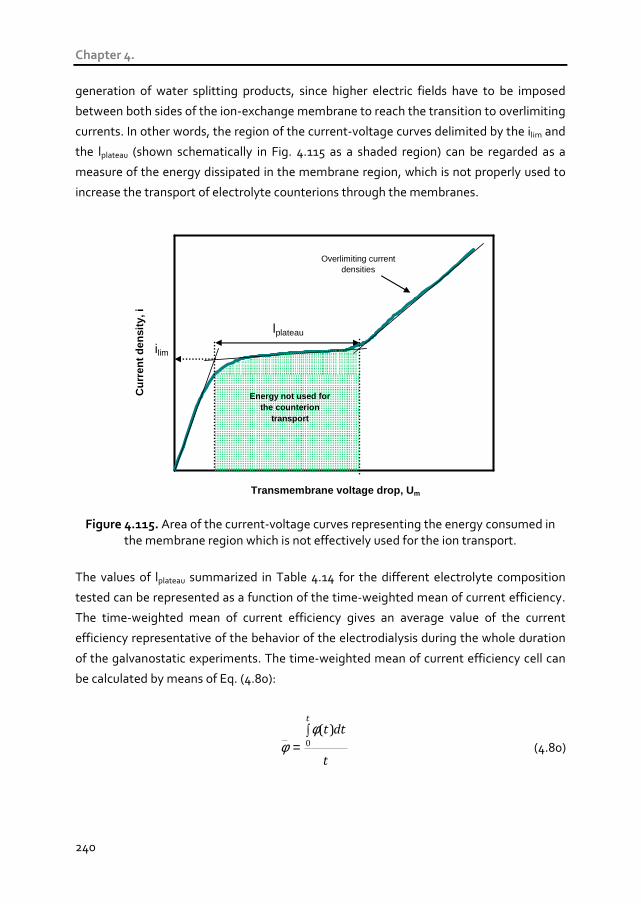
Chapter 4.
240
generation of water splitting products, since higher electric fields have to be imposed
between both sides of the ion-exchange membrane to reach the transition to overlimiting
currents. In other words, the region of the current-voltage curves delimited by the ilim and
the lplateau (shown schematically in Fig. 4.115 as a shaded region) can be regarded as a
measure of the energy dissipated in the membrane region, which is not properly used to
increase the transport of electrolyte counterions through the membranes.
Transmembrane voltage drop, U m
Cur
rent
den
sity
, i
ilim
Overlimiting current densities
lplateau
Energy not used for the counterion
transport
Figure 4.115. Area of the current-voltage curves representing the energy consumed in
the membrane region which is not effectively used for the ion transport.
The values of lplateau summarized in Table 4.14 for the different electrolyte composition
tested can be represented as a function of the time-weighted mean of current efficiency.
The time-weighted mean of current efficiency gives an average value of the current
efficiency representative of the behavior of the electrodialysis during the whole duration
of the galvanostatic experiments. The time-weighted mean of current efficiency cell can
be calculated by means of Eq. (4.80):
t
dttt
∫= 0
)(φφ (4.80)
Results and discussion
241
In the present case, the time considered for the calculations corresponds to the 6 h of
duration of the experiments. The φ values are represented as a function of the lplateau in
Fig. 4.116. The points linked by vertical lines correspond to experiments carried out at
different current regimes for each solution composition. As already deduced from Table
4.14, increasing concentrations of Ni2+ and decreasing of H+ ions in the electrolyte induce
a reduction in the lplateau values, which can be interpreted as a facilitated emergence of
electroconvection. Moreover, the trends shown in Fig. 4.116 also indicate that the lowest
values of current efficiency are those attained with solutions whose composition implied
larger lplateau values in their respective current-voltage curves. Obviously, the values of
current efficiency are implicitly affected by the composition of the electrolyte, since the
φ values may be higher for solutions implying large [Ni2+]/[H+] values, where the
transport of Ni2+ ions predominates over that of H+ ions. However, there is also a strong
dependence between the lplateau values and the current efficiency, since the highest
efficiencies are obtained for the lowest lplateau values. Moreover, the difference between
the φ values obtained for a specific composition at under- and overlimiting currents is
broader as the lplateau decreases. These results may be associated with the formation of
vortices of greater height as more Ni2+ ions are involved in the emergence of
electroconvection and, therefore, would indicate an improved supply of Ni2+ ions to the
membrane surface occurring at overlimiting currents. On the contrary, for larger lplateau
values the differences between the different current regimes are almost negligible. The
dependence between the current efficiency for the removal of Ni2+ ions and the lplateau
values calculated from the current-voltage curves with different electrolyte compositions
is strongly connected to the results obtained by Pismenskaia et al. [78,109], in which
intensive electroconvection was observed only in the case where low H+ ions were
involved in the process.

Chapter 4.
242
0
10
20
30
40
50
60
70
0 0.1 0.2 0.3 0.4 0.5 0.6
lplateau (V)
φ (%
)
10-3M NiSO4
10-2M NiSO4
10-3M NiSO4 + 10-3M CrO3
10-2M NiSO4 + 10-3M CrO3
10-2M NiSO4 + 10-2M CrO3
100% ilim
100% ilim
100% ilim
100% ilim
125% ilim
125% ilim
125% ilim
125% ilim 75% ilim
75% ilim
75% ilim
75% ilim
125% ilim 75% ilim
100% ilim
Figure 4.116. Relationship between the time-weighted mean of current efficiency ( φ )
obtained at different current regimes with the plateau length for different solution compositions.
In terms of energy consumption, if the values of lplateau are multiplied by the values of ilim
of their corresponding current-voltage curve and the effective membrane area (Am), a
parameter indicative of the energy cost related to surpassing the ilim values is obtained.
Then, the time-weighted mean of sE ( sE ) could be also related to this parameter. The
values of sE were calculated with an analogous procedure to that used for the time-
weighted mean of current efficiency:
t
dttE
E
t
s
s
∫= 0
)(
(4.81)
Fig. 4.117 shows the relationship existing between the values of sE and the parameter
lplateau·ilim·Am for each solution composition. Due to the different range of ilim values, the
different results have been grouped by constant concentrations of NiSO4 (10-3M and
10-2M). Within each group of compositions, the specific energy consumption increases
with the parameter lplateau·ilim·Am. These results indicate that there is a strong correlation
between the energy consumption of the electrodialysis cell and the energy dissipated in
the membrane region. Moreover, for a specific concentration (fixed value of lplateau·ilim·Am),

Results and discussion
243
the differences between the sE values obtained at 75%·ilim and 125%·ilim are almost
irrelevant for low lplateau·ilim·Am values. On the contrary, significant differences are
observed for the highest values of lplateau·ilim·Am, since the change from under- to
overlimiting currents implies a notorious increase in the energy consumption. Therefore,
from a point of view based on energetic considerations, when this parameter takes the
highest values, the convenience of applying overlimiting current regimes is reduced. In
this respect, several studies have been conducted in order to develop ion-exchange
membranes with induced surface inhomogeneity, as this has been proven to imply
reduced lplateau values and would consequently increase the advantages of applying
intensive current regimes [62,87,111]. In the same way, the present work demonstrates
the importance of the composition of the electrolyte in terms of the transport properties
of the species present in the solutions and their relative predominance in the electrolyte,
which determine to a certain extent the values of lplateau and the convenience of applying
overlimiting currents. Accordingly, in order to achieve a good management of industrial
waste effluents their composition and the ions involved in the concentration polarization
mechanisms should deserve special attention.
0
50
100
150
200
250
300
0.0001 0.001 0.01 0.1
lplateau ·ilim·Am (W)
Es
(kW
·h/k
g)
10-3M NiSO4
10-2M NiSO4
10-3M NiSO4 + 10-3M CrO3
10-2M NiSO4 + 10-3M CrO3
10-2M NiSO4 + 10-2M CrO3
125% ilim
75% ilim
125% ilim
75% ilim
100% ilim
75% ilim
100% ilim
100% ilim
125% ilim
125% ilim
100% ilim
75% ilim
125% ilim 75% ilim
100% ilim
Figure 4.117. Relationship between the time-weighted mean of specific energy
consumption ( SE ) obtained at different current regimes with the values of lplateau·ilim·Am
for different solution compositions.

Chapter 4.
244
4.4.5 Conclusions
The experiments carried out in this section (4.4) have been useful to corroborate some of
the conclusions already obtained from the previous ones (4.1, 4.2 and 4.3). Moreover,
other effects related to long-term effects arising in an electrodialysis cell have been
investigated. The main conclusions drawn from the galvanostatic experiments are:
For a constant underlimiting current, the transport of Ni2+ ions through the
cation-exchange membrane decreases with an increase in the concentration of
CrO3. The H+ ions provided by chromic acid compete with the Ni2+ ions for the
transport through the membrane, hence diminishing the values of current
efficiency for the transport of Ni2+ ions. However, the higher conductivity of the
mixtures of NiSO4 and CrO3 lead to lower Ucell values.
The potential of the electrodialysis operations within the underlimiting range of
currents is higher in the case of mixtures of NiSO4 and CrO3 with respect to single
salt solutions of NiSO4. This is caused by the significantly higher ilim values
obtained in the case of the mixture solutions. Nevertheless, the increased nickel
removal rates with the mixture solutions are achieved at the cost of an increased
specific energy consumption of the electrodialysis cell.
The effect of the CrO3 concentration on the transport of Ni2+ ions through the
membrane is more significant in the case of 10-3M NiSO4 than in 10-2M NiSO4
solutions. These results reveal an important role of the [Ni2+]/[H+] ratio on the
current efficiency of the cells. When the concentration of NiSO4 is higher, the
evolution of φ with time is increasing, which could be a consequence of the
decreasing concentration of SO42- ions in the central compartment as they cross
the anion-exchange membrane. The decreasing concentration of membrane
coions allows for a higher selectivity of the membrane and could also imply the
dissociation of the uncharged complex specie NiSO4, thus increasing the supply
of Ni2+ ions to the membrane.
The galvanostatic operation at overlimiting current densities leads to a general
increase of the nickel removal rates with respect to the results obtained at
underlimiting currents. These results are achieved without implying a decline in
the current efficiency, which is even increased in some cases. Therefore,
Results and discussion
245
electroconvection may be the main mechanism of overlimiting conductance,
which implies an increased supply of electrolyte counterions to the membrane
surface. On the other hand, the role of the dissociation of water is less important.
The increased transport of electrolyte counterions through the membrane can
also imply a decrease in the specific energy consumption. Nevertheless, as the
conductivity of the electrolyte in the central compartment decreases, the
voltage cell can increase notoriously at longer times of the electrodialysis
operations, hence attenuating the positive effect of the overlimiting currents on
the energy consumption.
The strong correlation between the lplateau and φ and sE values confirms the use
of current-voltage curves of ion-exchange membranes as a simple and useful
tool to evaluate the viability of applying overlimiting currents to electrodialysis
systems. There is a strong relationship between the values of lplateau, which
indicate the energy dissipated in the membrane region when overlimiting
currents are applied, and the Es values, which indicate the energy consumed in
the entire electrodialysis cell.
In general, the convenience of applying overlimiting currents in terms of energy
consumption is higher for systems with low lplateau values, namely, with solution
compositions with high concentrations of Ni2+ and low concentrations of H+ ions.
Therefore, the galvanostatic experiments also confirm that electroconvection is
the main mechanism of overlimiting mass transfer, as it was already deduced
from the chronopotentiometric experiments and current-voltage characteristics.

Chapter 4.
246
4.5 References [1] A. Gruger, A. Régis, T. Schmatko, P. Colomban, Nanostructure of Nafion®
membranes at different states of hydration: An IR and Raman study, Vibrational
Spectroscopy, 26 (2001) 215-225.
[2] I. Herraiz-Cardona, E. Ortega, V. Pérez-Herranz, Evaluation of the Zn2+ transport
properties through a cation-exchange membrane by chronopotentiometry,
Journal of Colloid and Interface Science, 341 (2010) 380-385.
[3] P. Sistat, G. Pourcelly, Chronopotentiometric response of an ion-exchange
membrane in the underlimiting current-range. Transport phenomena within the
diffusion layers, Journal of Membrane Science, 123 (1997) 121-131.
[4] S. Kotrlý, L. Sucha, Handbook of Chemical Equilibria in Analytical Chemistry,
Ellis Horwood Ltd., Chinchester, 1985.
[5] D.R. Lide, CRC Handbook of Chemistry and Physics, CRC Press Inc., Boca Raton,
2009.
[6] P. Dlugolecki, B. Anet, S.J. Metz, K. Nijmeijer, M. Wessling, Transport limitations
in ion exchange membranes at low salt concentrations, Journal of Membrane
Science, 346 (2010) 163-171.
[7] J.S. Park, J.H. Choi, J.J. Woo, S.H. Moon, An electrical impedance spectroscopic
(EIS) study on transport characteristics of ion-exchange membrane systems,
Journal of Colloid and Interface Science, 300 (2006) 655-662.
[8] P. Dlugolecki, P. Ogonowski, S.J. Metz, M. Saakes, K. Nijmeijer, M. Wessling, On
the resistances of membrane, diffusion boundary layer and double layer in ion
exchange membrane transport, Journal of Membrane Science, 349 (2010) 369-
379.
[9] F.G. Wilhelm, N.F.A. Van der Vegt, M. Wessling, H. Strathmann,
Chronopotentiometry for the advanced current-voltage characterisation of
bipolar membranes, Journal of Electroanalytical Chemistry, 502 (2001) 152-166.
Results and discussion
247
[10] F.G. Wilhelm, N.F.A. Van der Vegt, H. Strathmann, M. Wessling, Comparison of
bipolar membranes by means of chronopotentiometry, Journal of Membrane
Science, 199 (2002) 177-190.
[11] M. García-Gabaldón, V. Pérez-Herranz, E. Ortega, Evaluation of two ion-
exchange membranes for the transport of tin in the presence of hydrochloric
acid, Journal of Membrane Science, 371 (2011) 65-74.
[12] L. Marder, E.M. Ortega Navarro, V. Pérez-Herranz, A.M. Bernardes, J.Z. Ferreira,
Chronopotentiometric study on the effect of boric acid in the nickel transport
properties through a cation-exchange membrane, Desalination, 249 (2009) 348-
352.
[13] C. Korzenowski, M.A.S. Rodrigues, L. Bresciani, A.M. Bernardes, J.Z. Ferreira,
Purification of spent chromium bath by membrane electrolysis, Journal of
Hazardous Materials, 152 (2008) 960-967.
[14] R. Baker, Membrane technology and applications, John Wiley & Sons, Ltd.,
Menlo Park, California, 2004.
[15] R. Audinos, G. Pichelin, Characterization of electrodialysis membranes by
chronopotentiometry, Desalination, 68 (1988) 251-263.
[16] L. Marder, E.M. Ortega Navarro, V. Pérez-Herranz, A.M. Bernardes, J.Z. Ferreira,
Evaluation of transition metals transport properties through a cation-exchange
membrane by chronopotentiometry, Journal of Membrane Science, 284 (2006)
267-275.
[17] A. Alcaraz, F.G. Wilhelm, M. Wessling, P. Ramírez, The role of the salt electrolyte
on the electrical conductive properties of a polymeric bipolar membrane, Journal
of Electroanalytical Chemistry, 513 (2001) 36-44.
[18] D.A. Cowan, J.H. Brown, Effect of turbulence on limiting current in
electrodialysis cells, Industrial & Engineering Chemistry, 51 (1959) 1445-1448.
[19] N. Pismenskaya, V. Nikonenko, B. Auclair, G. Pourcelly, Transport of weak-
electrolyte anions through anion exchange membranes: Current-voltage
characteristics, Journal of Membrane Science, 189 (2001) 129-140.
Chapter 4.
248
[20] N.D. Pismenskaya, E.I. Belova, V.V. Nikonenko, C. Larchet, Electrical
conductivity of cation- and anion-exchange membranes in ampholyte solutions,
Russian Journal of Electrochemistry, 44 (2008) 1285-1291.
[21] N. Pismenskaya, E. Laktionov, V. Nikonenko, A. El Attar, B. Auclair, G. Pourcelly,
Dependence of composition of anion-exchange membranes and their electrical
conductivity on concentration of sodium salts of carbonic and phosphoric acids,
Journal of Membrane Science, 181 (2001) 185-197.
[22] Membrane technology in the chemical industry, Wiley-VCH, 2001.
[23] T. Okada, Y. Ayato, M. Yuasa, I. Sekine, The effect of impurity cations on the
transport characteristics of perfluorosulfonated ionomer membranes, Journal of
Physical Chemistry B, 103 (1999) 3315-3322.
[24] X. Li, H. Zhang, Z. Mai, H. Zhang, I. Vankelecom, Ion exchange membranes for
vanadium redox flow battery (VRB) applications, Energy & Environmental
Science, 4 (2011) 1147-1160.
[25] M.E. Vallejo, F. Persin, C. Innocent, P. Sistat, G. Pourcelly, Electrotransport of
Cr(VI) through an anion exchange membrane, Separation and Purification
Technology, 21 (2000) 61-69.
[26] A. Agrawal, K.K. Sahu, An overview of the recovery of acid from spent acidic
solutions from steel and electroplating industries, Journal of Hazardous
Materials, 171 (2009) 61-75.
[27] J. Wisniewski and G. Wisniewska, Water and acid recovery from the rinse after
metal etching operations, Hydrometallurgy, 53 (1999) 105-119.
[28] C. Vallois, P. Sistat, S. Roualdès, G. Pourcelly, Separation of H+/Cu2+ cations by
electrodialysis using modified proton conducting membranes, Journal of
Membrane Science, 216 (2003) 13-25.
[29] G.l. Chamoulaud, D. Bélanger, Modification of ion-exchange membrane used for
separation of protons and metallic cations and characterization of the
membrane by current-voltage curves, Journal of Colloid and Interface Science,
281 (2005) 179-187.

Results and discussion
249
[30] T. Benvenuti, R.S. Krapf, M.A.S. Rodrigues, A.M. Bernardes, J. Zoppas-Ferreira,
Recovery of nickel and water from nickel electroplating wastewater by
electrodialysis, Separation and Purification Technology, 129 (2014) 106-112.
[31] D.C. Buzzi, L.S. Viegas, M.A.S. Rodrigues, A.M. Bernardes, J.A.S. Tenório, Water
recovery from acid mine drainage by electrodialysis, Minerals Engineering, 40
(2013) 82-89.
[32] P.G. Priya, C.A. Basha, V. Ramamurthi, S.N. Begum, Recovery and reuse of Ni(II)
from rinsewater of electroplating industries, Journal of Hazardous Materials, 163
(2009) 899-909.
[33] K.P. Nickens, S.R. Patierno, S. Ceryak, Chromium genotoxicity: A double-edged
sword, Chemico-Biological Interactions, 188 (2010) 276-288.
[34] Y. Lorrain, G. Pourcelly, C. Gavach, Influence of cations on the proton leakage
through anion-exchange membranes, Journal of Membrane Science, 110 (1996)
181-190.
[35] H. Strathmann, Chapter 6: Ion-exchange membrane processes in water
treatment, in: Sustainability science and engineering
sustainable water for the future: water recycling versus desalination, pp. 141-
199, Elsevier, 2010.
[36] H. Luo, G. Liu, R. Zhang, Y. Bai, S. Fu, Y. Hou, Heavy metal recovery combined
with H2 production from artificial acid mine drainage using the microbial
electrolysis cell, Journal of Hazardous Materials, 270 (2014) 153-159.
[37] S.S. Chen, C.W. Li, H.D. Hsu, P.C. Lee, Y.M. Chang, C.H. Yang, Concentration
and purification of chromate from electroplating wastewater by two-stage
electrodialysis processes, Journal of Hazardous Materials, 161 (2009) 1075-1080.
[38] J. Khan, B.P. Tripathi, A. Saxena, V.K. Shahi, Electrochemical membrane reactor:
In situ separation and recovery of chromic acid and metal ions, Electrochimica
Acta, 52 (2007) 6719-6727.
[39] L. Hartinger, Handbook of effluent treatment and recycling for the metal
finishing industry, ASM International, Finishing Publications Ltd., 1994.
Chapter 4.
250
[40] Reference document on best available techniques for the surface treatment of
metals and plastics. IPPC Bureau, European Comission, 2014.
[41] Nickel and chromium plating, Butterworth-Heinemann, 1986.
[42] I. Frenzel, H. Holdik, D.F. Stamatialis, G. Pourcelly, M. Wessling, Chromic acid
recovery by electro-electrodialysis: I. Evaluation of anion-exchange membrane,
Journal of Membrane Science, 261 (2005) 49-57.
[43] I. Frenzel, H. Holdik, D.F. Stamatialis, G. Pourcelly, M. Wessling, Chromic acid
recovery by electro-electrodialysis: II. Pilot scale process, development, and
optimization, Separation and Purification Technology, 47 (2005) 27-35.
[44] G. Orhan, C. Arslan, H. Bombach, M. Stelter, Nickel recovery from the rinse
waters of plating baths, Hydrometallurgy, 65 (2002) 1-8.
[45] J.J. Qin, M.H. Oo, M.N. Wai, C.M. Ang, F.S. Wong, H. Lee, A dual membrane
UF/RO process for reclamation of spent rinses from a nickel-plating operation - a
case study, Water Research, 37 (2003) 3269-3278.
[46] S. Logette, C. Eysseric, G. Pourcelly, A. Lindheimer, C. Gavach, Selective
permeability of a perfluorosulphonic membrane to different valency cations. Ion-
exchange isotherms and kinetic aspects, Journal of Membrane Science, 144
(1998) 259-274.
[47] E. Vallejo, G. Pourcelly, C. Gavach, R. Mercier, M. Pineri, Sulfonated polyimides
as proton conductor exchange membranes. Physicochemical properties and
separation H+/Mz+ by electrodialysis comparison with a perfluorosulfonic
membrane, Journal of Membrane Science, 160 (1999) 127-137.
[48] P.V. Vyas, P. Ray, G.S. Trivedi, S.K. Adhikary, R. Rangarajan, Studies on
exchange equilibria of cations between cation-exchange membranes and
electrolytic solutions, Journal of Colloid and Interface Science, 246 (2002) 366-
371.
[49] L.X. Tuan, C. Buess-Herman, H.D. Hurwitz, Absorption equilibrium and
permselectivity of cation exchange membranes in sulfuric acid, sodium chloride
and nickel sulfate media, Journal of Membrane Science, 323 (2008) 288-298.

Results and discussion
251
[50] J. Kotas, Z. Stasicka, Chromium occurrence in the environment and methods of
its speciation, Environmental Pollution, 107 (2000) 263-283.
[51] S. Sang, Q. Wu, K. Huang, A discussion on ion conductivity at cation exchange
membrane/solution interface, Colloids and Surfaces A: Physicochemical and
Engineering Aspects, 320 (2008) 43-48.
[52] P. Sobron, A. Sanz, T. Acosta, F. Rull, A Raman spectral study of stream waters
and efflorescent salts in Rio Tinto, Spain, Spectrochimica Acta Part A: Molecular
and Biomolecular Spectroscopy, 71 (2009) 1678-1682.
[53] J.M. Nieto, A.M. Sarmiento, M. Olías, C.R. Canovas, I. Riba, J. Kalman, T.A.
Delvalls, Acid mine drainage pollution in the Tinto and Odiel rivers (Iberian Pyrite
Belt, SW Spain) and bioavailability of the transported metals to the Huelva
Estuary, Environment International, 33 (2007) 445-455.
[54] Treatment of acid mine drainage. London, House of Commons Library, 1999.
[55] K.L. Huang, T.M. Holsen, J.R. Selman, Impurity partitioning in Nafion and
ceramic separators used for purification of spent chromium plating solutions,
Journal of Membrane Science, 210 (2002) 137-145.
[56] P.N. Pintauro, R. Tandon, L. Chao, W. Xu, R. Evilia, Equilibrium partitioning of
monovalent/divalent cation-salt mixtures in Nafion cation-exchange
membranes, Journal of Physical Chemistry, 99 (1995) 12915-12924.
[57] M. Taky, G. Pourcelly, C. Gavach, A. Elmidaoui, Chronopotentiometric response
of a cation exchange membrane in contact with chromium(III) solutions,
Desalination, 105 (1996) 219-228.
[58] J.M. Casas, G. Crisóstomo, L. Cifuentes, Speciation of the Fe(II)-Fe(III)-H2SO4-
H2O system at 25 and 50 ºC, Hydrometallurgy, 80 (2005) 254-264.
[59] M. Wang, Y.X. Jia, T.T. Yao, K.K. Wang, The endowment of monovalent
selectivity to cation exchange membrane by photo-induced covalent
immobilization and self-crosslinking of chitosan, Journal of Membrane Science,
442 (2013) 39-47.
Chapter 4.
252
[60] T. Chakrabarty, B. Shah, N. Srivastava, V.K. Shahi, U. Chudasama, Zirconium tri-
ethylene tetra-amine ligand-chelator complex based cross-linked membrane for
selective recovery of Cu2+ by electrodialysis, Journal of Membrane Science, 428
(2013) 462-469.
[61] V.V. Nikonenko, N.D. Pismenskaya, E.I. Belova, P. Sistat, P. Huguet, G.
Pourcelly, C. Larchet, Intensive current transfer in membrane systems:
Modelling, mechanisms and application in electrodialysis, Advances in Colloid
and Interface Science, 160 (2010) 101-123.
[62] J. Balster, M.H. Yildirim, D.F. Stamatialis, R. Ibanez, R.G.H. Lammertink, V.
Jordan, M. Wessling, Morphology and microtopology of cation-exchange
polymers and the origin of the overlimiting current, Journal of Physical
Chemistry B, 111 (2007) 2152-2165.
[63] Y. Tanaka, Water dissociation in ion-exchange membrane electrodialysis,
Journal of Membrane Science, 203 (2002) 227-244.
[64] Y. Tanaka, M. Seno, Concentration polarization and water dissociation in ion-
exchange membrane electrodialysis. Mechanism of water dissociation, Journal
of the Chemical Society, Faraday Transactions 1, 82 (1986) 2065-2077.
[65] N. Pismenskaia, P. Sistat, P. Huguet, V. Nikonenko, G. Pourcelly,
Chronopotentiometry applied to the study of ion transfer through anion
exchange membranes, Journal of Membrane Science, 228 (2004) 65-76.
[66] I. Rubinstein, B. Zaltzman, O. Kedem, Electric fields in and around ion-exchange
membranes, Journal of Membrane Science, 125 (1997) 17-21.
[67] F. Maletzki, H.W. Rösler, E. Staude, Ion transfer across electrodialysis
membranes in the overlimiting current range: stationary voltage current
characteristics and current noise power spectra under different conditions of free
convection, Journal of Membrane Science, 71 (1992) 105-116.
[68] R. Simons, Electric field effects on proton transfer between ionizable groups and
water in ion exchange membranes, Electrochimica Acta, 29 (1984) 151-158.
Results and discussion
253
[69] V.I. Zabolotsky, V.V. Nikonenko, N.D. Pismenskaya, E.V. Laktionov, M.K.
Urtenov, H. Strathmann, M. Wessling, G.H. Koops, Coupled transport
phenomena in overlimiting current electrodialysis, Separation and Purification
Technology, 14 (1998) 255-267.
[70] I. Rubinstein, B. Zaltzman, Electro-osmotically induced convection at a
permselective membrane, Physical Review E, 62 (2000) 2238-2251.
[71] J.H. Choi, S.H. Moon, Structural change of ion-exchange membrane surfaces
under high electric fields and its effects on membrane properties, Journal of
Colloid and Interface Science, 265 (2003) 93-100.
[72] R. Simons, Strong electric fields effects on proton transfer between membrane-
bound amines and water, Nature, 280 (1979) 824-826.
[73] V.I. Zabolotskii, Dissociation of water molecules in systems with ion-exchange
membranes, Russian Chemical Reviews, 57 (1988) 801.
[74] M.S. Kang, Y.J. Choi, H.J. Lee, S.H. Moon, Effects of inorganic substances on
water splitting in ion-exchange membranes: I. Electrochemical characteristics of
ion-exchange membranes coated with iron hydroxide/oxide and silica sol,
Journal of Colloid and Interface Science, 273 (2004) 523-532.
[75] Y. Kharkats, Theory of the exaltation effect and the effect of correlation
exaltation of migration current, Journal of Electroanalytical Chemistry and
Interfacial Electrochemistry, 105 (1979) 97-114.
[76] Y. Kharkats, A.V. Sokirko, Theory of the effect of migration current exaltation
taking into account dissociation-recombination reactions, Journal of
Electroanalytical Chemistry and Interfacial Electrochemistry, 303 (1991) 27-44.
[77] V.I. Zabolotsky, V.V. Nikonenko, N.D. Pismenskaya, On the role of gravitational
convection in the transfer enhancement of salt ions in the course of dilute
solution electrodialysis, Journal of Membrane Science, 119 (1996) 171-181.
[78] N.D. Pismenskaya, V.V. Nikonenko, E.I. Belova, G.Y. Lopatkova, P. Sistat, G.
Pourcelly, K. Larshe, Coupled convection of solution near the surface of ion-

Chapter 4.
254
exchange membranes in intensive current regimes, Russian Journal of
Electrochemistry, 43 (2007) 307-327.
[79] N.D. Pismenskaya, V.V. Nikonenko, V.I. Zabolotsky, R. Sandoux, G. Pourcelly,
A.A. Tskhay, Effects of the desalination chamber design on the mass-transfer
characteristics of electrodialysis apparatuses at overlimiting current densities,
Russian Journal of Electrochemistry, 44 (2008) 818-827.
[80] E.I. Belova, G.Y. Lopatkova, N.D. Pismenskaya, V.V. Nikonenko, C. Larchet, G.
Pourcelly, Effect of anion-exchange membrane surface properties on
mechanisms of overlimiting mass transfer, Journal of Physical Chemistry B, 110
(2006) 13458-13469.
[81] V.V. Nikonenko, A.V. Kovalenko, M.K. Urtenov, N.D. Pismenskaya, J. Han, P.
Sistat, G. Pourcelly, Desalination at overlimiting currents: State-of-the-art and
perspectives, Desalination, 342 (2014) 85-106.
[82] C. Larchet, S. Nouri, B. Auclair, L. Dammak, V. Nikonenko, Application of
chronopotentiometry to determine the thickness of diffusion layer adjacent to
an ion-exchange membrane under natural convection, Advances in Colloid and
Interface Science, 139 (2008) 45-61.
[83] V.I. Zabolotskii, V.V. Nikonenko, M.K. Urtenov, K.A. Lebedev, V.V. Bugakov,
Electroconvection in systems with heterogeneous ion-exchange membranes,
Russian Journal of Electrochemistry, 48 (2012) 692-703.
[84] I. Rubinstein, L. Shtilman, Voltage against current curves of cation exchange
membranes, Journal of the Chemical Society, Faraday Transactions 2, 75 (1979)
231-246.
[85] S.M. Rubinstein, G. Manukyan, A. Staicu, I. Rubinstein, B. Zaltzman, R.G.H.
Lammertink, F. Mugele, M. Wessling, Direct observation of a nonequilibrium
electro-osmotic instability, Physical Review Letters, 101 (2008) 236101.
[86] R. Kwak, G. Guan, W.K. Peng, J. Han, Microscale electrodialysis: Concentration
profiling and vortex visualization, Desalination, 308 (2013) 138-146.

Results and discussion
255
[87] R. Ibanez, D.F. Stamatialis, M. Wessling, Role of membrane surface in
concentration polarization at cation exchange membranes, Journal of
Membrane Science, 239 (2004) 119-128.
[88] E.D. Belashova, N.A. Melnik, N.D. Pismenskaya, K.A. Shevtsova, A.V. Nebavsky,
K.A. Lebedev, V.V. Nikonenko, Overlimiting mass transfer through cation-
exchange membranes modified by Nafion film and carbon nanotubes,
Electrochimica Acta, 59 (2012) 412-423.
[89] M. Wessling, L.G. Morcillo, S. Abdu, Nanometer-thick lateral polyelectrolyte
micropatterns induce macrosopic electro-osmotic chaotic fluid instabilities,
Scientific Reports, 4 (2014).
[90] Y. Kim, D.F. Lawler, Overlimiting current by interactive ionic transport between
space charge region and electric double layer near ion-exchange membranes,
Desalination, 285 (2012) 245-252.
[91] N.D. Pismenskaya, V.V. Nikonenko, N.A. Melnik, G. Pourcelli, G. Larchet, Effect
of the ion-exchange-membrane/solution interfacial characteristics on the mass
transfer at severe current regimes, Russian Journal of Electrochemistry, 48
(2012) 610-628.
[92] V.V.R. Nandigana, N.R. Aluru, Understanding anomalous current-voltage
characteristics in microchannel-nanochannel interconnect devices, Journal of
Colloid and Interface Science, 384 (2012) 162-171.
[93] A. Yaroshchuk, What makes a nano-channel? A limiting-current criterion,
Microfluid Nanofluid, 12 (2012) 615-624.
[94] T.A. Zangle, A. Mani, J.G. Santiago, Theory and experiments of concentration
polarization and ion focusing at microchannel and nanochannel interfaces,
Chemical Society Reviews, 39 (2010) 1014-1035.
[95] R. Simons, The origin and elimination of water splitting in ion exchange
membranes during water demineralisation by electrodialysis, Desalination, 28
(1979) 41-42.
Chapter 4.
256
[96] Y. Tanaka, Water dissociation reaction generated in an ion exchange membrane,
Journal of Membrane Science, 350 (2010) 347-360.
[97] S.S. Mel'nikov, O.V. Shapovalova, N.V. Shel'deshov, V.I. Zabolotskii, Effect of d-
metal hydroxides on water dissociation in bipolar membranes, Petroleum
Chemistry, 51 (2011) 577-584.
[98] S. Mafé, P. Ramírez, A. Alcaraz, Electric field-assisted proton transfer and water
dissociation at the junction of a fixed-charge bipolar membrane, Chemical
Physics Letters, 294 (1998) 406-412.
[99] M.S. Kang, Y.J. Choi, S.H. Moon, Effects of inorganic substances on water
splitting in ion-exchange membranes: II. Optimal contents of inorganic
substances in preparing bipolar membranes, Journal of Colloid and Interface
Science, 273 (2004) 533-539.
[100] J. Pretz, E. Staude, Reverse electrodialysis (RED) with bipolar membranes, an
energy storage system, Berichte der Bunsengesellschaft für physikalische
Chemie, 102 (1998) 676-685.
[101] N.D. Pismenskaya, V.V. Nikonenko, N.A. Melnik, K.A. Shevtsova, E.I. Belova, G.
Pourcelly, D. Cot, L. Dammak, C. Larchet, Evolution with time of hydrophobicity
and microrelief of a cation-exchange membrane surface and its impact on
overlimiting mass transfer, Journal of Physical Chemistry B, 116 (2011) 2145-
2161.
[102] J.H. Choi, H.J. Lee, S.H. Moon, Effects of electrolytes on the transport
phenomena in a cation-exchange membrane, Journal of Colloid and Interface
Science, 238 (2001) 188-195.
[103] I. Rubinstein, F. Maletzki, Electroconvection at an electrically inhomogeneous
permselective membrane surface, Journal of the Chemical Society, Faraday
Transactions, 87 (1991) 2079-2087.
[104] J. Barthel, W. Kunz, P. Turq, O. Bernard, Electrolyte solutions, transport
properties, in: Encyclopedia of Physical Science and Technology (Third Edition),
pp. 243-259, Academic Press, New York, 2003.
Results and discussion
257
[105] R. Tadmor, E. Hernández-Zapata, N. Chen, P. Pincus, J.N. Israelachvili, Debye
length and double-layer forces in polyelectrolyte solutions, Macromolecules, 35
(2002) 2380-2388.
[106] V.M. Barragán, C. Bauzá, Current-voltage curves for ion-exchange membranes:
A method for determining the limiting current density, Journal of Colloid and
Interface Science, 205 (1998) 365-373.
[107] J.J. Krol, M. Wessling, H. Strathmann, Concentration polarization with
monopolar ion exchange membranes: current-voltage curves and water
dissociation, Journal of Membrane Science, 162 (1999) 145-154.
[108] N. Agmon, The Grotthuss mechanism, Chemical Physics Letters, 244 (1995) 456-
462.
[109] E. Belova, G. Lopatkova, N. Pismenskaya, V. Nikonenko, C. Larchet, Role of
water splitting in development of electroconvection in ion-exchange membrane
systems, Desalination, 199 (2006) 59-61.
[110] V.K. Shahi, S.K. Thampy, R. Rangarajan, Studies on transport properties of
surfactant immobilized anion-exchange membrane, Journal of Membrane
Science, 158 (1999) 77-83.
[111] E. Volodina, N. Pismenskaya, V. Nikonenko, C. Larchet, G. Pourcelly, Ion transfer
across ion-exchange membranes with homogeneous and heterogeneous
surfaces, Journal of Colloid and Interface Science, 285 (2005) 247-258.

259
Chapter 5
CONCLUSIONS
5.1 Conclusions
The improvement and development of sustainable electromembrane processes could
imply an important progress in the treatment of metal containing effluents. However, the
systems composed of ion-exchange membranes and solutions with multivalent metals
are complex. Therefore, a deep understanding of the mass transfer processes involved in
electrodialysis cells is required in order to introduce them in industrial processes. The
research conducted in the present Thesis aims to contribute to increase the knowledge on
these mass transfer processes. The general conclusions of this Doctoral Thesis are
presented in different sections, according to the main subjects addressed in Chapter 4:
5.1.1 Transport of single salt solutions
The transport of metals of different valence through the Nafion 117 cation-exchange has
been investigated in systems of single salt solutions (section 4.1). The main conclusions
regarding this study are:
Chapter 5.
260
In general all the membrane fixed charges are equilibrated with the solution
counterions. In the case of Na2SO4 and NiSO4 solutions; Na+ and Ni
2+ ions,
respectively, balance the membrane fixed charges. However, in the case of
Cr2(SO4)3 and Fe2(SO4)3, apart from the free metal ions (Cr3+
and Fe3+
), also
complex ions can be bound to the membrane fixed charges.
The chronopotentiometric response obtained for Na2SO4 solutions is the typical
one observed in the literature, and the curves show a sharp increase in Um
associated with the depletion of Na+ ions at the membrane surface in the diluting
compartment. On the contrary, the chronopotentiograms registered for
multivalent metals show several increases in Um, which denote that apart from
the depletion of free cations (Ni2+
, Cr3+
and Fe3+
), other complex ions positively
charged cross the membrane. In the case of NiSO4 solutions, the dissociation of
NiSO4 and the generation of hydroxilated species could occur at high current
densities. On the contrary, with Cr2(SO4)3 and Fe2(SO4)3 solutions, the complex
ions CrSO4+ and FeSO4
+ are present from the beginning of the experiments.
The formation of Ni(OH)2 and Fe(OH)3 precipitates at the anodic side of the
membrane occurred during the chronopotentiometric experiments as a
consequence of the application of overlimiting currents. This phenomenon
occurs when the pH of the electrolyte near the membrane region (pHeq)
increases and reaches the pH at which the solubility of the metallic hydroxides
decreases.
In general, the current-voltage curves obtained show three characteristic
regions, the quasi-ohmic region, the plateau region and the region of
overlimiting currents. However, in those cases where the formation of
precipitates at the membrane surface takes place (concentrated solutions of
NiSO4 and Fe2(SO4)3), very long plateaus are formed. With the NiSO4 solutions
the extended plateaus lead to a sharp increase of current with Um due to the
enhanced dissociation of water occurring at the membrane/precipitate interface.
On the contrary, with the Fe2(SO4)3 solutions, the precipitates formed obstruct
the membrane pores and the current-voltage curves do not present overlimiting
region. In the case of diluted solutions of Cr2(SO4)3 two plateaus associated with
the depletion of different ionic species are clearly identified in the curves.
Conclusions
261
In general the electrical resistance of the membrane systems corresponding to
the quasi-ohmic region, R1, decreases as the electrolyte concentration increases.
The ilim values increase with the electrolyte concentration with an approximately
linear dependence for the systems of Na2SO4, NiSO4 and Fe2(SO4)3, as predicted
by the Peers’ equation. This trend is not accomplished with the Cr2(SO4)3
solutions because several ilim values were obtained for the most diluted
concentrations.
5.1.2 Transport of multicomponent mixtures
The competitive ion transport has been investigated by considering two different
multicomponent mixtures (section 4.2). Solutions of NiSO4 and CrO3 (which forms
chromic acid, H2CrO4) have been used to study the transport competition between Ni2+
and H+ ions through cation-exchange membranes. These solutions resemble the
composition of rinse waters generated in the metal finishing industry. The main
conclusions reached with this system are:
When immersed in mixtures of NiSO4 and CrO3, the membrane fixed charges are
preferentially balanced with multicharged Ni2+
ions. At low concentrations of
NiSO4, the addition of CrO3 alters more significantly the ion uptake of the
membranes, and the amount of fixed charges equilibrated with H+ ions
increases.
In general, the chronopotentiometric and the current-voltage curves obtained
for the mixtures of NiSO4 and CrO3 have an analogous shape to that obtained
with single salt solutions of NiSO4. However, the presence of CrO3 increases the
magnitude of current values at which each feature is registered in the
chronopotentiograms. This indicates that the H+ ions compete with the Ni
2+ ions
for the transport through the membrane, thus shifting the depletion of the Ni2+
ions from the membrane surface to higher values of current density. Moreover,
the presence of CrO3 reduces the initial pH to values around 2-3, which makes
more difficult the formation of Ni(OH)2 precipitates at the membrane surface.
The transport number of Ni2+
through the membrane (TNi2+
) is significantly high
in single salt solutions of NiSO4, reaching values around 0.9. In the mixture
solutions, the TNi2+
decreases for decreasing [Ni2+
]/[H+] ratios.

Chapter 5.
262
Mixtures of Fe2(SO4)3 and Na2SO4 having concentrations that resemble the composition
of acid mine drainage solutions have been considered to study the competitive ion
transport between ions of different valence. The main conclusions of this study are:
The membrane fixed charges show a higher affinity for Fe(III) with respect to
that for Na+ ions. These results are due to the stronger electrostatic interactions
existing between the sulfonate groups of the membranes and multivalent ions.
The speciation of Fe(III) inside the membrane is altered with the increase in the
concentration of Na2SO4 in the equilibrating solution, since the formation of
FeSO4+ ions is favored and the proportion of these ions in the membrane phase
increases while that of Fe3+
ions decreases.
The chronopotentiometric and current-voltage results obtained for 0.o2M
Fe2(SO4)3 solutions show two different membrane behaviors in the underlimiting
range of currents. At low underlimiting currents the concentration of FeSO4+ ions
is predominant in the electrolyte and these are the main cationic species crossing
the cation-exchange membrane. However, as the polarization of the membrane
is intensified, FeSO4+ ions dissociate into Fe
3+ and SO4
2- ions. This phenomenon
promotes the transport of Fe3+
ions through the membrane, and implies a
reduction of the electrical resistance of the membrane system. The reduced
electrical resistance is consequence of the higher mobility and conductivity of
Fe3+
ions.
The chronopotentiometric curves obtained for the mixtures of Fe2(SO4)3 and
Na2SO4 show an inflexion point at low current densities, which is related to a first
limiting current density, ilim1, and its corresponding plateau in the current-voltage
curves. These features are attributed to the depletion of Na+ ions from the
membrane surface in the diluting compartment. Therefore, the transport of Na+
ions seems to be favored at low current densities; whereas at current densities
higher than ilim1, the transport of Fe3+
through the membrane is more significant.
A second limiting current density, ilim2, is reached when the formation of Fe(OH)3
precipitates occurs at the anodic side of the membrane.
The resistance of the membrane system strongly depends on the counterions
that are equilibrating the membrane fixed charges. For a constant Fe2(SO4)3
concentration of 0.02M, the values of R1 increase with respect to the single salt
solutions with a concentration of Na2SO4 of 0.01M, whereas it decreases again

Conclusions
263
when the concentration of Na2SO4 is increased to 0.02M. The first increase in R1
seems to be caused by the replacement of Fe3+
ions inside the membrane phase
with Na+ ions, which reduces the conductivity of the membrane. However, the
decrease in R1 obtained for higher Na2SO4 concentrations is mainly due to the
positive effect of the Na+ ions on the conductivity of the diffusion boundary
layers, which compensates the decrease in conductivity of the membrane phase.
5.1.3 Mechanisms of overlimiting currents
The effect of the electrolyte composition on the mechanisms of overlimiting currents has
been also investigated (section 4.3). The main conclusions of these results are
summarized as follows:
The dissociation of water is the main mechanism originating the overlimiting
currents when the formation of metallic hydroxides takes place at the anodic
membrane surface (concentrated solutions of NiSO4 and Fe2(SO4)3). This has
been corroborated by the acute pH changes occurred once the layer of
precipitates was formed. The dissociation of water is very important in systems
with precipitates of Ni(OH)2. On the contrary, the dissociation of water is less
important in systems with precipitates of Fe(OH)3 due to the blockage of the
membrane pores by the precipitates.
Electroconvection is the main mechanism of overlimiting mass transfer in diluted
solutions of all the metals tested: Na2SO4, NiSO4, Cr2(SO4)3 and Fe2(SO4)3. The
electroconvective vortices induce the distortion of the diffusion boundary layer
and are manifested in the chronopotentiograms as oscillations in Um. The
magnitude of the oscillations in Um increases with the applied current density,
which indicates that the height of the electroconvective vortices becomes higher
at high overlimiting currents, thus increasing the supply of counterions to the
membrane depleting surface.
The role of gravitational convection on the overlimiting currents is important in
concentrated solutions of Cr2(SO4)3 and NiSO4. The magnitude of gravitational
convection increases with the electrolyte concentration and, at higher currents,
gravitational convection and electroconvection have a synergic effect on the
reduction of the electrical resistance of the membrane system.
Chapter 5.
264
The length of the plateau region of the current-voltage curves, lplateau, has been
used as an indicator for comparing the tendency to initiate the overlimiting
currents of different membrane/electrolyte systems. Systems with short
plateaus imply an inducement of the overlimiting currents for shorter membrane
voltage drops. The lplateau values decrease for higher concentrations of
multivalent metals. This is caused by the large size of multivalent ions, which
promote the motion of large volumes of fluid when the phenomena of coupled
convection are initiated. On the contrary, higher concentrations of H+ ions are
associated with large lplateau values. Protons hamper electroconvection because
they displace the multivalent ions from the space charge region. Moreover, H+
ions are transported via the Grotthuss mechanism without involving the motion
of large volumes of fluid.
5.1.4 Galvanostatic electrodialysis experiments
Finally, galvanostatic experiments were conducted (section 4.4) in order to corroborate
the results obtained in the previous sections. The effect of the electrolyte composition on
the membrane selectivity and on the development of overlimiting currents was evaluated
using mixtures of NiSO4 and CrO3. The main conclusions obtained from the galvanostatic
experiments are summarized as follows:
In the range of underlimiting current densities, for a constant concentration of
NiSO4, the selectivity of the cation-exchange membrane for Ni2+
ions decreases
with an increase of the concentration of CrO3. This is caused by the increasing
participation of H+ ions in the current transfer through the membranes, which
reduces the current efficiency for the transport of Ni2+
. These results are in
agreement with the TNi2+
values previously calculated.
The values of ilim increase with the concentration of CrO3 for the multicomponent
mixtures. Therefore, the mass transfer rates of Ni2+
ions can be improved within
the underlimiting range of currents in the case of the mixtures of NiSO4 and
CrO3. However, this improvement is attained at the expense of higher specific
energy consumptions.
Overlimiting current densities lead to higher nickel transport rates. In terms of
energy consumption, this increased transfer of Ni2+
ions through the membranes
is beneficial for the process when the concentration of Ni2+
is relatively higher
Conclusions
265
than that of H+ ions. On the contrary, for high concentrations of CrO3, the
increased Ni2+
transfer rates achieved at overlimiting currents imply an
important increase in the specific energy consumption, s
E . These results
corroborate the good correlation between the lplateau values, the electrolyte
composition, and the convenience of applying overlimiting currents. The Ucell
values achieved at overlimiting currents in systems with large lplateau values
confirm the important contribution of the membrane voltage drop to the total
cell voltage. Moreover, the s
E values increase considerably with time as a
consequence of the depletion of ions occurring in the central compartment.

Related Documents