Terrestrial arthropod abundance and phenology in the Canadian Arctic: modelling resource availability for Arctic-nesting insectivorous birds Elise Bolduc, 1 Nicolas Casajus, Pierre Legagneux, Laura McKinnon, H. Grant Gilchrist, Maria Leung, R.I. Guy Morrison, Don Reid, Paul A. Smith, Christopher M. Buddle, Joe ¨l Be ˆty Abstract—Arctic arthropods are essential prey for many vertebrates, including birds, but arthropod populations and phenology are susceptible to climate change. The objective of this research was to model the relationship between seasonal changes in arthropod abundance and weather variables using data from a collaborative pan-Canadian (Southampton, Herschel, Bylot, and Ellesmere Islands) study on terrestrial arthropods. Arthropods were captured with passive traps that provided a combined measure of abundance and activity (a proxy for arthropod availability to foraging birds). We found that 70% of the deviance in daily arthropod availability was explained by three temperature covariates: mean daily temperature, thaw degree-day, and thaw degree-day 2 . Models had an adjusted R 2 of 0.29–0.95 with an average among sites and arthropod families of 0.67. This indicates a moderate to strong fit to the raw data. The models for arthropod families with synchronous emergence, such as Tipulidae (Diptera), had a better fit (average adjusted R 2 of 0.80) than less synchronous taxa, such as Araneae (R 2 5 0.60). Arthropod abundance was typically higher in wet than in mesic habitats. Our models will serve as tools for researchers who want to correlate insectivorous bird breeding data to arthropod availability in the Canadian Arctic. Re ´sume ´—Dans la toundra arctique, les arthropodes constituent des proies essentielles pour de nombreux verte ´bre ´s dont les oiseaux. Cependant, les populations d’arthropodes et leur phe ´nologie sont susceptibles de subir des modifications face aux changements climatiques. Notre e ´tude utilise des donne ´es sur les arthropodes terrestres provenant d’une initiative pancanadienne (I ˆ les Southampton, Herschel, Bylot et Ellesmere), afin de mode ´liser la relation entre les changements saisonniers d’abondance d’arthropodes et les variables environnementales. Des pie `ges fournissant une mesure combine ´e de l’abondance et de l’activite ´ des arthropodes ont e ´te ´ utilise ´s afin d’obtenir un indice de la disponibilite ´ des arthropodes pour les oiseaux. Dans nos mode `les, trois covariables lie ´es a ` la tempe ´rature (tempe ´rature, degre ´s-jours et degre ´s-jours 2 ) expliquent 70% de la de ´viance. Selon les sites et les familles d’arthropodes mode ´lise ´s, les R 2 ajuste ´s des mode `les ont varie ´s de 0.29–0.95 (moyenne de 0.67). Les mode `les pour les familles d’arthropodes ayant une e ´mergence synchronise ´e, comme les Tipulidae (Diptera), avaient de meilleurs R 2 ajuste ´s (0.80 en moyenne) comparativement aux groupes dont la disponibilite ´ est plus re ´partie dans le temps, comme les araigne ´es (0.60). L’abondance d’arthropodes e ´tait ge ´ne ´ralement plus grande dans les milieux humides que dans les milieux plus secs. Nos mode `les pourront servir d’outil aux chercheurs qui de ´sireraient corre ´ler leurs donne ´es sur la reproduction des insectivores avec des donne ´es sur la disponibilite ´ d’arthropodes dans l’Arctique Canadien. E. Bolduc, 1 N. Casajus, P. Legagneux, L. McKinnon, J. Be ˆty, De ´partement de biologie & Centre d’e ´tudes nordiques, Universite ´ du Que ´bec a ` Rimouski, 300 Alle ´e des Ursulines, Rimouski, Quebec, Canada G5L 3A1 H.G. Gilchrist, R.I.G. Morrison, National Wildlife Research Centre, Carleton University, 1125 Colonel By Drive (Raven Road), Ottawa, Ontario, Canada KJA OH3 M. Leung, Wild Tracks Ecological Consulting, 39 Harbottle Road, Whitehorse, Yukon, Canada Y1A 5T2 D. Reid, Wildlife Conservation Society Canada, PO Box 31127, Whitehorse, Yukon, Canada Y1A 5T2 P.A. Smith, Smith and Associates Ecological Research Ltd, 772 – 7 th Conc. South, Pakenham, Ontario, Canada K0A 2X0 C.M. Buddle, Department of Natural Resource Sciences, McGill University 21, 111 Lakeshore Road, Ste-Anne-de-Bellevue, Quebec, Canada H9X 3V9 1 Corresponding author (e-mail: [email protected]). doi:10.4039/tce.2013.4 Received 16 June 2012. Accepted 3 December 2012. Can. Entomol. 145: 155–170 (2013) 2013 Entomological Society of Canada 155

Welcome message from author
This document is posted to help you gain knowledge. Please leave a comment to let me know what you think about it! Share it to your friends and learn new things together.
Transcript
Terrestrial arthropod abundance and phenologyin the Canadian Arctic: modelling resource
availability for Arctic-nesting insectivorous birds
Elise Bolduc,1 Nicolas Casajus, Pierre Legagneux, Laura McKinnon,H. Grant Gilchrist, Maria Leung, R.I. Guy Morrison, Don Reid, Paul A. Smith,
Christopher M. Buddle, Joel Bety
Abstract—Arctic arthropods are essential prey for many vertebrates, including birds, butarthropod populations and phenology are susceptible to climate change. The objective of thisresearch was to model the relationship between seasonal changes in arthropod abundance andweather variables using data from a collaborative pan-Canadian (Southampton, Herschel, Bylot, andEllesmere Islands) study on terrestrial arthropods. Arthropods were captured with passive traps thatprovided a combined measure of abundance and activity (a proxy for arthropod availability toforaging birds). We found that 70% of the deviance in daily arthropod availability was explained bythree temperature covariates: mean daily temperature, thaw degree-day, and thaw degree-day2. Modelshad an adjusted R2 of 0.29–0.95 with an average among sites and arthropod families of 0.67.This indicates a moderate to strong fit to the raw data. The models for arthropod families withsynchronous emergence, such as Tipulidae (Diptera), had a better fit (average adjusted R2 of 0.80)than less synchronous taxa, such as Araneae (R2 5 0.60). Arthropod abundance was typically higherin wet than in mesic habitats. Our models will serve as tools for researchers who want to correlateinsectivorous bird breeding data to arthropod availability in the Canadian Arctic.
Resume—Dans la toundra arctique, les arthropodes constituent des proies essentielles pour denombreux vertebres dont les oiseaux. Cependant, les populations d’arthropodes et leur phenologiesont susceptibles de subir des modifications face aux changements climatiques. Notre etude utilisedes donnees sur les arthropodes terrestres provenant d’une initiative pancanadienne (Iles Southampton,Herschel, Bylot et Ellesmere), afin de modeliser la relation entre les changements saisonniersd’abondance d’arthropodes et les variables environnementales. Des pieges fournissant une mesurecombinee de l’abondance et de l’activite des arthropodes ont ete utilises afin d’obtenir un indice dela disponibilite des arthropodes pour les oiseaux. Dans nos modeles, trois covariables liees a latemperature (temperature, degres-jours et degres-jours2) expliquent 70% de la deviance. Selon lessites et les familles d’arthropodes modelises, les R2 ajustes des modeles ont varies de 0.29–0.95(moyenne de 0.67). Les modeles pour les familles d’arthropodes ayant une emergence synchronisee,comme les Tipulidae (Diptera), avaient de meilleurs R2 ajustes (0.80 en moyenne) comparativementaux groupes dont la disponibilite est plus repartie dans le temps, comme les araignees (0.60).L’abondance d’arthropodes etait generalement plus grande dans les milieux humides que dans lesmilieux plus secs. Nos modeles pourront servir d’outil aux chercheurs qui desireraient correler leursdonnees sur la reproduction des insectivores avec des donnees sur la disponibilite d’arthropodesdans l’Arctique Canadien.
E. Bolduc,1 N. Casajus, P. Legagneux, L. McKinnon, J. Bety, Departement de biologie & Centre d’etudesnordiques, Universite du Quebec a Rimouski, 300 Allee des Ursulines, Rimouski, Quebec, Canada G5L 3A1H.G. Gilchrist, R.I.G. Morrison, National Wildlife Research Centre, Carleton University, 1125 Colonel ByDrive (Raven Road), Ottawa, Ontario, Canada KJA OH3M. Leung, Wild Tracks Ecological Consulting, 39 Harbottle Road, Whitehorse, Yukon, Canada Y1A 5T2D. Reid, Wildlife Conservation Society Canada, PO Box 31127, Whitehorse, Yukon, Canada Y1A 5T2P.A. Smith, Smith and Associates Ecological Research Ltd, 772 – 7th Conc. South, Pakenham, Ontario,Canada K0A 2X0C.M. Buddle, Department of Natural Resource Sciences, McGill University 21, 111 Lakeshore Road,Ste-Anne-de-Bellevue, Quebec, Canada H9X 3V9
1Corresponding author (e-mail: [email protected]).doi:10.4039/tce.2013.4
Received 16 June 2012. Accepted 3 December 2012.
Can. Entomol. 145: 155–170 (2013) � 2013 Entomological Society of Canada
155

Introduction
Climate change is a significant environmental
disturbance that will alter the distribution and
abundance of species (Thomas et al. 2004;
Berteaux et al. 2006; Post et al. 2009). Changes in
climate are not only associated with temperature
changes but also with environmental stochasticity
that directly affects life cycles of animals (Saether
1997; Thomas et al. 2004; Jenouvrier et al.
2009). As ectotherms, arthropods are particularly
sensitive to climate variation since they are bio-
chemically, physiologically, and behaviourally
dependent on temperature (Huey and Berrigan
2001; Frazier et al. 2006) and their abundance is
primarily driven by temperature (Deutsch et al.
2008; Tulp and Schekkerman 2008). Effects of
climate change on arthropods may be most acute
and significant in the Arctic since this region’s
climate is warming at a disproportionate rate
relative to the rest of the planet (Arctic Climate
Impact Assessment 2004) and rapid changes in
arthropod phenology, abundance or species
assemblage are expected (Deutsch et al. 2008).
Arctic food webs are relatively simple (Elton
1927; Gauthier et al. 2012) and many trophic
interactions in the Arctic are linked to arthropods
(Hodkinson and Coulson 2004). Millions of
insectivorous birds breed in the Arctic (Com-
mittee for Holarctic Shorebird Monitoring 2004)
and rely on terrestrial arthropods for their
survival and reproduction (Pearce-Higgins and
Yalden 2004; Schekkerman et al. 2004). On the
Arctic tundra, surface-active arthropods are
abundant only for a short period of time varying
from a few days to a few weeks every year
(MacLean and Pitelka 1971; Hodkinson et al.
1996; Schekkerman et al. 2004; Tulp 2007). In
Arctic-nesting shorebirds, chick growth rates
appear to be influenced strongly by the avail-
ability of arthropods (Tulp and Schekkerman
2001; Schekkerman et al. 2003; Schekkerman
et al. 2004; McKinnon et al. 2012). The timing
and duration of this period of high arthropod
availability, however, can change rapidly
because of global warming as recorded over
the last 10–30 years in Siberia, Russia, and
eastern Greenland (Høye et al. 2007; Tulp and
Schekkerman 2008).
The relationship between climate change and
the ecology of species is often assessed via
correlations within long-term data sets including
climate, primary producers, and consumers (Both
and Visser 2001; Root et al. 2003; Dickey et al.
2008; Visser 2008). Although long-term data sets
on insectivorous birds exist, seasonal changes in
Arctic arthropod abundance are poorly docu-
mented (but see Tulp and Schekkerman 2008)
and this remains an obstacle in determining the
effect of climate change on insectivorous bird
populations.
Since climate (for which long-term data exist
and are freely available; Hijmans et al. 2005) is
directly related to the abundance of surface-
active arthropods (Danks 1981; Hodkinson et al.
1998; Bale et al. 2002; Tulp and Schekkerman
2008), predicting or hindcasting Arctic arthro-
pod abundance requires the selection of relevant
climatic covariates to model arthropod abun-
dance. This is the objective of our research.
Here we report the results of a collaborative
pan-Canadian study of surface-active Arctic
arthropods and provide predictive models of
daily arthropod availability for four sites that
differ in terms of their climate and arthropod
communities.
Methods
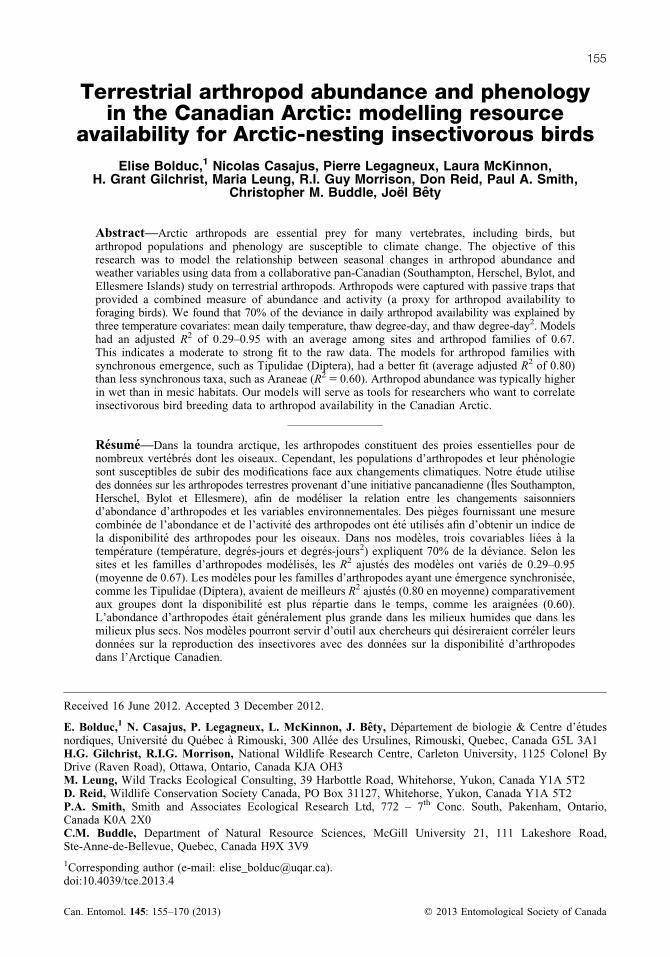
Arthropod samplingArthropods were sampled from June to
August using a rectangular pitfall trap
(38 cm 3 5 cm and 7 cm deep). Above the pitfall
trap, a 40 cm 3 40 cm mesh screen was set
vertically. Above the screen, a plastic cone
funnelled flying insects into a collecting jar
(Fig. 1). Traps were placed with the mesh
perpendicular to prevailing winds, and their
design was similar to traps used by Schekkerman
et al. (2003). These passive traps provided a
combined measure of abundance and activity
levels of arthropods, and so a proxy for arthro-
pod availability to foraging birds, and data
from such methods have been correlated to
chick growth rate (Schekkerman et al. 2003;
McKinnon et al. 2012). Traps were used on four
different Arctic islands across the Canadian
Arctic: Southampton (638590N, 818400W; mean
summer temperature 5 7.1 8C) from 2006 to
2008, Herschel (698350N, 1388550W; 10.6 8C) in
2007 and 2008, Bylot (73880N, 798580W; 5.8 8C)
from 2005 to 2008, and Ellesmere (Alert)
156 Can. Entomol. Vol. 145, 2013
� 2013 Entomological Society of Canada
(828290N, 628210W; 3.8 8C) in 2007 and 2008. At
each site, five traps located 20 m apart from each
other on a straight line were set in both dry
upland (mesic) or low wetland (wet) tundra, the
main foraging habitats for the dominant insec-
tivorous bird species (passerines and shorebirds)
during their brood-rearing period. Site-specific
habitat descriptions are available in Smith
et al. (2007) (Southampton), Ale et al. (2011)
(Herschel), Gauthier et al. (2011) (Bylot), and
Morrison et al. (2005) (Ellesmere). Traps were
emptied at approximately two-day intervals, and
arthropods were stored in ethanol (70%) until
sorting and identification in the laboratory.
Insects were sorted into families, and spiders
were grouped together. Springtails and mites
were not included in the analyses because of
their very low contribution to total arthropod
biomass. Butterflies and bumblebees were also
excluded because few individuals were collected
due to the design of the traps and because these
few heavy specimens had a strong influence on
daily variation in biomass. Moreover, adults of
these taxa are not key prey for shorebirds or
passerines. Sorting and identification was con-
ducted on a subsample of three to five traps for
each habitat and site. A standardised daily index
of arthropod availability (mg/trap) was calcu-
lated by dividing the total arthropod biomass
(dry mass) by the number of traps sorted and by
the number of days between sampling event. To
transform arthropod counts into dry mass, we
used length to dry mass equations derived from
our samples (Picotin 2008) or from the literature
(Rogers et al. 1977; Sage 1982; Sample et al.
1993; Hodar 1996). For some of the dominant
groups, we dried and weighed specimens and
calculated a mean individual dry mass (Picotin
2008). When individual variation in size was
high, individuals were grouped within size
categories and mean dry mass was obtained
for each category. A list of equations is provided
in the supplementary materials of McKinnon
et al. (2012).
Climate dataMean hourly weather data (temperature in 8C,
precipitation in mm, relative humidity in %,
radiation in W/m2, and wind speed in km/h)
from the closest automated weather stations
were used to build predictive models of daily
arthropod availability. Stations were located
, 0.5 km (Southampton), 0.5–3.0 km (Herschel),
1 km (Bylot), and 2 km (Ellesmere) away from the
trapping sites. Radiation data were unavailable for
Ellesmere and Herschel Island.
Statistical analysesClimatic variables known to influence the
phenology of emergence, activity patterns, and/or
abundance of arthropods (Wigglesworth 1972;
Strathdee et al. 1993; Whittaker and Tribe 1998;
Roy et al. 2001; Goulson et al. 2005; Høye and
Forchhammer 2008; Tulp and Schekkerman
2008) were used to construct models of arthropod
availability: daily temperature (T), relative
humidity (H), precipitation (Rain), wind speed
(Wi), thaw degree-days (D), and solar incidental
radiation (R, log-transformed to improve nor-
mality). Correlations among meteorological
variables ranged between 0.02 and 0.52 except
between T and H (Pearson correlation 5 0.70).
High multicolinearity was coming from one study
site: Ellesmere (Pearson correlation 5 0.92). For
this particular site, H and T were not entered
simultaneously in the model. All variables were
averaged over the number of days between trap
Fig. 1. Arthropod trap in the field.
Bolduc et al. 157
� 2013 Entomological Society of Canada

checks except for precipitation and thaw degree-
days. The sum of precipitation between trapping
sessions was used (95% of the trapping sessions
lasted two days, 4% lasted one or three days and
1% lasted four days), and thaw degree-days
represented the accumulated mean daily tem-
peratures between the first spring day above 0 8C
and the day of sampling (sub-zero temperatures
being treated as zeros). The quadratic form of
thaw degree-days (D2) was included in the
models in order to represent the curvilinear
pattern of seasonal arthropod availability. We
also included the interaction between T and D as
a variable because (i) insect development is
proportional to accumulation in degree-days
(Wagner et al. 1991; Gullan and Cranston 2005)
and (ii) temperature can affect insects differently
depending on their developmental stage (Gullan
and Cranston 2005).
We used generalised linear mixed models with
a Poisson distribution (McCullagh and Nelder
1989) to analyse the relationships between
weather variables and arthropod dry mass. To
account for repeated data across years, year was
treated as a random factor in the analyses. Since
the purpose of our models was not to test
hypotheses but rather to select the best predictors
of arthropod availability, model selection was
based on adjusted R2. When more than one model
had the same adjusted R2 (,1% variation), the
model with the least number of parameters was
preferred. For each of the four study sites, we
created separate models for all of the dominant
families. A family was considered dominant for a
given site if its dry mass accounted for .10% of
the total arthropod dry mass excluding spiders for
at least one year (spiders had a high biomass
contribution in early season and that could inter-
fere with the contribution of other groups during
the peak in arthropod abundance). Spiders were,
by default, considered a dominant group at all
sites. A threshold of 10% was set in order to select
a limited number of dominant families while still
accounting for most of the dry mass encountered.
Dominant groups accounted for between 78% and
91% of total dry mass by site. Separate models
were created for wet and mesic habitats.
For each model, the associated deviance for
each selected variable (based on our model
selection) was calculated. We then calculated the
average deviance for each covariate based on the
37 models (each site/habitat/family) presented in
Table 2. Proportions of deviance were calculated
based on the partial R2 and variables that were not
included in a model were set to 0% except when
data were unavailable (radiation in Ellesmere and
Herschel).
Using the models described above, we calcu-
lated the estimated dry mass for each study site
(sum of the predictions for the dominant groups).
We then compared these predictions to the actual
dry mass measured for all families (dominant
and no-dominant altogether).
In order to validate the models, we developed
a cross-validation technique to assess the fit
of our models on an independent data set. For
this sake, we used data from Bylot Island, the
only site for which we had a relatively large
data set available (i.e., up to four years). We
constructed models based on three years of data
(except for Araneae and Ichneumonidae, where
only three and two years were available) and
confronted the predicted values from these
models to the independent data of the fourth
year. We repeated this procedure four times (for
each three-year combination) for Chironomidae
(Diptera), Carabidae (Coleoptera), Muscidae
(Diptera), and Tipulidae (Diptera) and three or
two times for Araneae and Ichneumonidae
(Hymenoptera). We then calculated the adjusted
R2 and generated a figure for each year and taxon
for the wet habitat. Such approach is ideal
to assess the reliability of a predictive model
(Efron and Tibshirani 1993).
We also performed a Linear Mixed Model to
investigate both effects of habitat and study sites
on arthropod availability (all families com-
bined). In this model, we linked arthropod
availability to site, habitat, and the interaction of
both. We put days and years as random factors
(days nested in year) in order to account for
repeatability.
Results
Descriptive resultsA total of 300 days of sampling over up
to four years at four different sites yielded
342 451 arthropods identified to the family
level, except for spiders. In total, representatives
of 92 families were found. The most common
groups were Araneae, Carabidae, Chironomidae,
158 Can. Entomol. Vol. 145, 2013
� 2013 Entomological Society of Canada

Tipulidae, Muscidae (Diptera), Ichneumonidae,
Mycetophilidae (Diptera), and Scatophagidae
(Diptera) (Table 1). Diversity (expressed as the
number of different families) was higher at
Herschel (n 5 81) than at Southampton, Bylot or
Ellesmere (n 5 37, 38, 26, respectively). At each
site, only a few families (6–10) contributed
significantly (more than 1%) to the total dry
mass. There was considerable inter-annual var-
iation in seasonal trends of arthropod availability
in terms of timing, duration, and magnitude of
peaks in total dry mass, both within and among
sites (Fig. 2). Although variable among sites,
arthropod availability was generally highest in
early July (Fig. 2). On Bylot Island, for example,
peaks were short-lived each year (two to seven
days) and usually occurred within the same
17-day period (28 June to 14 July).
Modelling resultsOur models had a relatively strong fit to the
raw data for most arthropod families (adjusted
R2 up to 0.95; Table 2 and Fig. 3) across all sites.
Seasonal change in daily availability of arthro-
pods was determined primarily by the following
environmental variables: cumulative temperatures
above 0 8C (thaw degree-days) and its quadratic
form (mean % deviance explained 5 48.5%7 4.7
SE), and mean daily temperature (mean %
deviance explained 5 23.2%7 4.6 SE). The
other climatic variables (mean daily wind speed,
mean daily relative humidity, total daily pre-
cipitation, mean daily incidental radiation, and the
interaction between daily temperature and thaw
degree-day) each accounted for ,10% of the
deviance explained (Fig. 4).
Predicted and observed data are presented for
each site, year, habitat, and family in Figure 3.
Based on these models, we calculated an estimated
dry mass for each study site (sum of the predic-
tions for the dominant groups), which explained
well the total dry mass of arthropods measured for
all dominant and nondominant arthropods family
pooled (R2 varied from 0.30 to 0.95 depending on
the site or year considered Fig. 2).
In the cross-validation, models generally
performed slightly less than models with full data
but overall the predictive power of the validation
models was still good. Average adjusted R2 of the
validation models was 0.487 0.042 SE and
0.357 0.05 SE for the wet and mesic habitats,
respectively. In all the validation models, the date
Table 1. Total dry mass of the different families averaged over the number of years of sampling.
Ellesmere
(2007–2008)
Bylot
(2005–2008)
Herschel
(2007–2008)
Southampton
(2006–2008)
mg/year % mg/year % mg/year % mg/year %
Anthomyiidae 1 ,1 25 1 46 1 116 3
Araneae 110 10 476 25 1367 21 2247 49
Carabidae 165 9 2179 33 366 8
Chironomidae 185 17 226 12 260 4 414 9
Dolichopodidae 61 3 17 ,1 44 1
Empididae ,1 ,1 38 2 59 1 58 1
Ichneumonidae 20 2 165 9 118 2 15 ,1
Muscidae 445 41 321 17 110 2 259 6
Mycetophilidae 226 21 44 2 153 2 22 ,1
Scatophagidae 1 ,1 18 1 110 2 316 7
Sciaridae 49 5 18 1 57 1 38 1
Syrphidae 3 ,1 32 2 9 ,1 2 ,1
Tipulidae 14 1 208 11 1600 24 563 12
Total
Minimum 762 1133 6491 3321
Maximum 1407 2160 6725 5504
Average 1085 1870 6608 4583
Only families representing more than 1% of total biomass for at least one year are presented in the table but all familiesare included in the totals.
Bolduc et al. 159
� 2013 Entomological Society of Canada

of the peak of abundance could be assessed with
great accuracy (Fig. 5 on wet habitat).
Arthropod availability differed according to
habitat type. The mean dry mass was 63.3776.03
SE mg per trap per day and 40.8473.14 SE in
wet and mesic habitats, respectively, all sites
combined (Linear Mixed Models with days nested
in year: F1,341 5 12.69, P , 0.001). The interaction
between habitat and study site was not significant
(F3,335 5 0.25, P 5 0.86) revealing that similar
patterns of availability occurred in both habitats
within a study site. The abundance also greatly
differed according to study site (F3,339 5 34.28,
P , 0.001).
Fig. 2. Predicted and observed total daily arthropod availability in wet habitat in four Canadian Arctic sites.
0
50
100
150
200
250
300
350
15 01 01 15 15 01 15
0
100
200
300
400
500
600
700
800
900
15 01 15 01 15 01 15 01
0
50
100
150
200
250
15 15 15 15
0
50
100
150
01 15 01 01 15 01
ELLESMERE
BYLOT
HERSCHEL
SOUTHAMPTON
01 01 01 01 0101 0115 15 15 15 15 15
15
2007R2=0.52
2008R2=0.59
2005R2=0.49
2006R2=0.90
2007R2=0.91
2008R2=0.69
2007R2=0.95
2008R2=0.53
2006R2=0.95
2007R2=0.85
2008R2=0.86
ObservedPredicted
Art
hrop
od a
vaila
bilit
y(m
g/tr
ap/d
ay)
Art
hrop
od a
vaila
bilit
y(m
g/tr
ap/d
ay)
Art
hrop
od a
vaila
bilit
y(m
g/tr
ap/d
ay)
Art
hrop
od a
vaila
bilit
y(m
g/tr
ap/d
ay)
Jul Aug Jul Aug
Jul AugJun Jun Jul AugJun Jul AugJun Jul
AugJun Jul AugJun Jul
160 Can. Entomol. Vol. 145, 2013
� 2013 Entomological Society of Canada

Table 2. Parameter estimates for the generalized linear mixed models of weather variables on availability of the dominant arthropod groups (dry mass of arthropod
expressed in mg/trap/day).
Site family Habitat Intercept D (1021 8C) D2 (1024 8C2) T (1022 8C)
Wi
(1021 km/h)
H
(1021 %)
R (1022
(log(W/m2)
Rain
(1021 mm) T 3 D (1023) adj R2
Ellesmere
Araneae Humid 0.24 (0.7) 0.13 (0.1) 20.64 (0.38) 0.22 (0.04) 20.60 (0.22) NA 20.43 (0.56) 0.70
Araneae Mesic 7.29 (1.73) 20.15 (0.1) 0.14 (0.41) 20.52 (0.24) 20.53 (0.18) NA 20.61 (0.56) 0.76
Chironomidae Humid 20.72 (0.72) 0.82 (0.12) 25.36 (0.62) 20.17 (0.07) 20.84 (0.15) NA 5.00 (0.8) 0.55
Chironomidae Mesic 3.16 (1.25) 20.12 (0.03) 20.18 (0.14) NA 20.68 (0.52) 0.48
Muscidae Humid 10.52 (0.76) 21.08 (0.1) 20.79 (0.07) NA 21.68 (0.38) 0.45
Muscidae Mesic 20.82 (0.71) 0.20 (0.03) 20.45 (0.13) NA 21.11 (0.63) 0.47
Mycetophilidae Humid 2.39 (1.22) 20.14 (0.02) 0.30 (0.04) 20.69 (0.17) NA 21.33 (0.29) 0.54
Mycetophilidae Mesic 0.23 (1.97) 0.35 (0.29) 22.30 (1.38) 0.51 (0.08) 23.34 (0.53) NA 0.78
Bylot
Araneae Humid 2.17 (1.63) 20.01 (0.01) 22.66 (0.61) 20.55 (0.09) 0.99 (0.21) 20.43 (0.25) 0.43
Araneae Mesic 212.65 (1.24) 0.03 (0.02) 0.53 (0.04) 0.46 (0.09) 1.74 (0.14) 21.51 (0.26) 0.51
Carabidae Humid 26.63 (1.53) 20.13 (0.01) 0.37 (0.04) 0.42 (0.12) 0.80 (0.13) 0.67
Carabidae Mesic 1.1 (0.76) 20.12 (0.02) 0.20 (0.05) 23.15 (1.29) 20.29 (0.18) 0.79
Chironomidae Humid 20.83 (0.53) 0.65 (0.04) 22.67 (0.16) 0.09 (0.02) 20.13 (0.1) 0.58
Chironomidae Mesic 27 (2) 0.12 (0.03) 0.78 (0.11) 0.38 (0.19) 22.47 (0.57) 0.67
Ichneumonidae Humid 21.3 (0.73) 0.29 (0.04) 20.73 (0.1) 0.06 (0.1) 22.84 (1.12) 20.32 (0.14) 0.56 (0.45) 0.69
Ichneumonidae Mesic 21.07 (4.14) 0.36 (0.07) 20.76 (0.14) 0.23 (0.08) 21.43 (1.82) 20.18 (0.26) 20.32 (0.41) 20.43 (0.29) 0.72
Muscidae Humid 210.03 (1.51) 0.01 (0.01) 0.34 (0.03) 2.94 (0.55) 0.34 (0.11) 1.17 (0.15) 0.57 (0.1) 0.50
Muscidae Mesic 29.36 (1.47) 0.10 (0.01) 0.44 (0.8) 1.53 (0.2) 0.71 (0.13) 0.79
Tipulidae Humid 214.41 (0.95) 2.42 (0.14) 28.85 (0.51) 0.04 (0.02) 0.24 (0.13) 0.87
Tipulidae Mesic 211.54 (6.11) 1.19 (0.24) 24.23 (0.81) 0.59 (0.15) 23.64 (2.55) 0.82 (0.48) 21.01 (0.42) 21.01 (0.31) 0.84
Herschel
Araneae Humid 3.47 (0.25) 0.05 (0.01) 20.12 (0.02) 20.77 (0.1) NA 20.36 (0.13) 0.38
Araneae Mesic 9.61 (0.58) 20.02 (0) 20.28 (0.07) 20.69 (0.07) NA 0.29
Carabidae Humid 2.33 (0.25) 0.03 (0.02) 20.10 (0.03) 0.15 (0.02) 20.42 (0.08) NA 0.70
Carabidae Mesic 11.69 (0.56) 0.00 (0.01) 20.10 (0.02) 0.04 (0.01) 0.51 (0.04) 21.00 (0.06) NA 0.71
Tipulidae Humid 25.73 (0.42) 0.73 (0.04) 21.80 (0.08) 0.30 (0.01) NA 0.95
Tipulidae Mesic 25.16 (0.81) 0.10 (0.02) 0.79 (0.05) 1.34 (0.13) NA 22.25 (0.22) 0.55
Southampton
Araneae Humid 27.05 (2.96) 20.05 (0.01) 0.18 (0.03) 0.22 (0.19) 1.17 (0.3) 0.73
Araneae Mesic 26.19 (1.98) 20.06 (0.02) 0.16 (0.02) 0.10 (0.11) 1.25 (0.32) 0.79
Carabidae Humid 27.18 (1.43) 0.19 (0.01) 1.32 (0.21) 20.81 (0.41) 0.84
Bold
uc
et
al.
161
�2
01
3E
nto
mo
log
icalS
ociety
of
Can
ada

Discussion
The objective of our study was to generate
predictive models of daily arthropod availability
in the Canadian Arctic. Based on data collected
at four different sites that varied in terms of their
climate and arthropod communities, we found
part of the variation to be dependent on climatic
variables measured daily such as precipitation
or wind. The other part of the variation was
explained by daily temperature and a larger time
scale measure of weather (thaw degree-day).
Indeed, with mean daily temperature, thaw
degree-day, and its quadratic form, more than
70% of the daily variation in arthropod avail-
ability was explained by our models. This is a
substantial portion of the deviance, emphasising
the overarching importance of both temperature
and variables measured over larger time scales
in determining seasonal change in arthropod
availability. Our research results complement
work conducted in other Arctic regions such as
the Taymir Peninsula in Siberia, Russia, where
cumulative degree-days was a better predictor of
the number of arthropods caught than the com-
bination of date and temperature (Schekkerman
et al. 2004). Together with our results, this
highlights the importance of including tempera-
ture, cumulative temperature, and its quadratic
form in studies aimed at forecasting arthropod
abundance rather than focusing mostly on daily
temperature variation as is often the case
(Deutsch et al. 2008).
As ectotherms, arthropods are highly sensitive
to climate variation (Danks 1981; Hodkinson
et al. 1998; Bale et al. 2002). Population growth
rates and development of many arthropod
species is linked to temperature (Huey and
Berrigan 2001; Frazier et al. 2006). As expected,
we found higher dry mass (and diversity) of
arthropods for sites with a warmer summer.
However, predicting the effect of global warm-
ing also requires further information on possible
lagged effects (like density dependence and
previous summer temperature).
There was considerable variation in seasonal
trends of arthropod availability in terms of timing,
duration, and magnitude of peaks in total bio-
mass both between sites and between habitats
within sites. Arthropod availability was higher in
wet habitats than in mesic habitats and this wasTa
ble
2.
Co
nti
nu
ed
Sit
efa
mil
yH
abit
atIn
terc
ept
D(1
02
18C
)D
2(1
02
48C
2)
T(1
02
28C
)
Wi
(10
21
km
/h)
H
(10
21
%)
R(1
02
2
(lo
g(W
/m2)
Rai
n
(10
21
mm
)T
3D
(10
23)
adj
R2
Car
abid
aeM
esic
26
.22
(1.6
1)
20
.10
(0.0
1)
0.1
5(0
.01
)2
0.2
1(0
.06
)1
.42
(0.1
9)
0.9
4
Ch
iro
no
mid
aeH
um
id2
4.9
1(1
.84
)0
.57
(0.0
5)
21
.34
(0.1
4)
0.3
7(0
.05
)2
0.3
1(0
.06
)2
0.2
3(0
.16
)0
.83
(0.1
9)
22
.27
(0.4
7)
0.8
2
Ch
iro
no
mid
aeM
esic
22
.3(1
.64
)0
.45
(0.0
4)
21
.02
(0.1
3)
0.3
6(0
.04
)2
0.2
7(0
.06
)2
0.2
6(0
.14
)0
.64
(0.1
8)
22
.40
(0.4
2)
0.8
0
Mu
scid
aeH
um
id2
4.8
2(1
.05
)0
.77
(0.0
6)
21
.84
(0.1
6)
20
.37
(0.0
7)
0.1
6(0
.15
)0
.05
(0.2
1)
0.8
6
Mu
scid
aeM
esic
12
.74
(1.2
5)
0.1
7(0
.01
)2
0.5
3(0
.07
)2
1.5
0(0
.14
)0
.90
(0.2
1)
0.6
0
Sca
top
hag
idae
Hu
mid
6.7
7(1
.36
)0
.11
(0.0
1)
20
.39
(0.0
5)
21
.05
(0.0
8)
0.6
8(0
.14
)0
.39
Sca
top
hag
idae
Mes
ic2
11
.97
(3.0
4)
0.9
0(0
.11
)2
2.7
0(0
.33
)0
.11
(0.0
6)
0.7
2(0
.29
)2
0.3
0(0
.28
)0
.53
Tip
uli
dae
Hu
mid
29
.81
(0.7
)1
.67
(0.0
7)
24
.64
(0.2
1)
20
.01
(0.0
2)
20
.36
(0.0
4)
0.3
4(0
.09
)0
.94
Tip
uli
dae
Mes
ic2
11
.4(3
.26
)1
.05
(0.1
)2
4.0
6(0
.35
)0
.40
(0.1
2)
20
.34
(0.0
7)
0.9
5(0
.24
)2
0.8
1(0
.21
)1
.20
(0.2
6)
1.3
9(0
.97
)0
.92
Co
effi
cien
tsin
bo
ldw
ere
sign
ifica
nt
and
wh
ere
coef
fici
ents
are
mis
sin
g,
the
corr
esp
on
din
gv
aria
ble
was
abse
nt
fro
mth
em
od
else
lect
ed.
Nu
mb
ers
inp
aren
thes
esre
pre
sen
tth
est
and
ard
erro
rsas
soci
ated
wit
hea
chco
effi
cien
t.C
erta
inv
aria
ble
sw
ere
no
tm
easu
red
(NA
)at
som
esi
tes.
Wea
ther
var
iab
les
are
asfo
llo
ws:
Dis
the
accu
mu
lati
on
of
thaw
deg
ree-
day
s(1
02
18C
),D
2is
the
squ
are
of
the
accu
mu
lati
on
inth
awd
egre
e-d
ays
(10
24
8C2
),T
isav
erag
ed
aily
tem
per
atu
re(1
02
28C
),W
iis
aver
age
dai
lyw
ind
spee
d(1
02
1k
m/h
),H
isav
erag
ed
aily
rela
tiv
eh
um
idit
y(1
02
1%
),R
isav
erag
edai
lyin
ciden
tal
radia
tion
(10
22
log(W
/m2
)),
Rai
nis
tota
ldai
lypre
cipit
atio
nbet
wee
ntw
otr
appin
gse
ssio
ns
(10
21
mm
),an
dT
3D
isth
ein
tera
ctio
nb
etw
een
Tan
dD
(10
23
).
162 Can. Entomol. Vol. 145, 2013
� 2013 Entomological Society of Canada

Fig. 3. Predicted and observed arthropod availability split by sites, year, and habitat for the most abundant
families.
0
10
20
0
10
20
15 01 15 01 15
0
5
10
0
5
10
15 01 15 01 15
0
10
20
30
40
0
10
20
30
40
15 01 15 01 15
0
10
20
0
10
20
15 01 15 01 15
0
20
40
60
80
100
0
20
40
60
80
100
15 01 15 01 15
0
20
40
60
0
20
40
60
15 01 15 01 15
0
20
40
60
0
20
40
60
15 01 15 01 15
0
10
20
0
10
20
15 01 15 01 15
Art
hrop
od a
vaila
bilit
y (m
g/tr
ap/d
ay)
Ellesmere, wet habitat
Muscidae MycetophilidaeChironomidae
Observed
Predicted
Jun Jul Aug
2007
2008
2007
2008
Ellesmere, mesic habitat
Araneae
Jun Jul Aug Jun Jul Aug Jun Jul Aug
Art
hrop
od a
vaila
bilit
y (m
g/tr
ap/d
ay)
0
20
40
60
80
100
0
20
40
60
80
100
0
20
40
60
80
100
0
20
40
60
80
100
15 01 15 01 15
0
20
40
60
0
20
40
60
0
20
40
60
0
20
40
60
15 01 15 01 15
0
10
20
30
0
10
20
30
0
10
20
30
0
10
20
30
15 01 15 01 15
020406080
100120140
020406080
100120140
020406080
100120140
020406080
100120140
15 01 15 01 15
0
10
20
30
40
0
10
20
30
40
0
10
20
30
40
15 01 15 01 15
0
10
0
10
15 01 15 01 15
Bylot, wet habitat
Tipulidae Chironomidae Carabidae Muscidae
Araneae
Ichneumonidae
Observed
Predicted
AugJun Jul AugJun Jul AugJun Jul AugJun Jul AugJun Jul AugJun Jul
2005
2008
2007
2006
Bolduc et al. 163
� 2013 Entomological Society of Canada

Fig. 3. Continued
0
10
20
0
10
20
0
10
20
0
10
20
15 01 15 01 15
0
10
20
0
10
20
0
10
20
0
10
20
15 01 15 01 15
0
10
20
0
10
20
0
10
20
0
10
20
15 01 15 01 15
0
20
40
60
80
0
20
40
60
80
0
20
40
60
80
0
20
40
60
80
15 01 15 01 15
0
20
40
60
0
20
40
60
0
20
40
60
15 01 15 01 15
0
2
4
6
8
10
0
2
4
6
8
10
15 01 15 01 15
Art
hrop
od a
vaila
bilit
y (m
g/tr
ap/d
ay)
Bylot, mesic habitat
Tipulidae Chironomidae Carabidae Muscidae
Araneae
Ichneumonidae
Observed
Predicted
AugJun Jul AugJun Jul AugJun Jul AugJun Jul AugJun Jul AugJun Jul
2005
2008
2007
2006
0
20
40
60
80
0
20
40
60
80
15 01 15 01 15
0
20
40
60
80
0
20
40
60
80
15 01 15 01 15
0
50
100
150
200
250
300
0
50
100
150
200
250
300
15 01 15 01 15
0100200300400500600700800900
0100200300400500600700800900
15 01 15 01 15
0
20
40
60
80
0
20
40
60
80
15 01 15 01 15
0
20
40
60
0
20
40
60
15 01 15 01 15
Art
hrop
od a
vaila
bilit
y (m
g/tr
ap/d
ay)
Herschel, wet habitat
Tipulidae CarabidaeAraneae
Observed
Predicted
Jun Jul Aug
2007
2008
2007
2008
Jun Jul Aug Jun Jul Aug
Herschel, mesic habitat
164 Can. Entomol. Vol. 145, 2013
� 2013 Entomological Society of Canada

consistent for all our study sites; we uncovered no
significant interaction between habitat and site.
Interestingly, for a specific site, climatic variables
had similar effects on the abundance and pheno-
logy of a particular family for both habitats.
Knowing the habitat characteristic of a site and its
temperature thus appear to be an important
covariate to model Arctic arthropod availability.
Fig. 3. Continued
0
50
100
150
200
250
0
50
100
150
200
250
0
50
100
150
200
250
15 01 15 01 15
0
20
40
60
80
100
120
0
20
40
60
80
100
120
0
20
40
60
80
100
120
15 01 15 01 15
0
20
40
60
80
100
0
20
40
60
80
100
0
20
40
60
80
100
15 01 15 01 15
0
20
40
60
80
100
0
20
40
60
80
100
0
20
40
60
80
100
15 01 15 01 15
0
10
20
30
40
0
10
20
30
40
0
10
20
30
40
15 01 15 01 15
0
10
20
30
40
0
10
20
30
40
15 01 15 01 15
Art
hrop
od a
vaila
bilit
y (m
g/tr
ap/d
ay)
Southampton, wet habitat
Tipulidae Scatophagidae Carabidae Chironomidae Muscidae
Araneae
Observed
Predicted
AugJun Jul AugJun Jul AugJun Jul AugJun Jul AugJun Jul AugJun Jul
2006
2008
2007
0
20
40
60
80
0
20
40
60
80
0
20
40
60
80
15 01 15 01 15
0
10
20
30
0
10
20
30
0
10
20
30
15 01 15 01 15
0
20
40
60
80
100
120
140
0
20
40
60
80
100
120
140
0
20
40
60
80
100
120
140
15 01 15 01 15
0
20
40
60
80
0
20
40
60
80
0
20
40
60
80
15 01 15 01 15
0
20
40
0
20
40
0
20
40
15 01 15 01 15
0
10
20
30
40
0
10
20
30
40
15 01 15 01 15
Art
hrop
od a
vaila
bilit
y (m
g/tr
ap/d
ay)
Southampton, mesic habitat
Tipulidae Scatophagidae Carabidae Chironomidae Muscidae
Araneae
Observed
Predicted
AugJun Jul AugJun Jul AugJun Jul AugJun Jul AugJun Jul AugJun Jul
2006
2008
2007
Bolduc et al. 165
� 2013 Entomological Society of Canada

Across the sites, different patterns of abundance
and phenology were evident among the different
arthropod families that were sampled. For example,
Tipulidae (Diptera; crane flies) showed very
synchronised peaks of abundance, whereas Araneae
(spiders) were present throughout the study period.
This is likely related to the natural history of
the different families. In certain species of crane
flies, for example, all adults that emerge in a
given summer overwintered in the prepupal stage
(MacLean 1973). As a result, there is no feeding
requirement before their emergence as adults and a
more synchronised emergence is therefore possi-
ble. Studies of crane flies in the Arctic, including
ours (Fig. 3), have revealed well-defined peaks of
abundance (MacLean and Pitelka 1971; Tulp and
Schekkerman 2008) supporting the concept of a
synchronised emergence. As a consequence, our
climatic models for crane flies had a good fit to
the data. This life-history strategy has also been
observed in a number of Arctic Chironomidae
(nonbiting midges) species (Danks and Oliver
1972). However, the timing of emergence of
nonbiting midges is directly linked to the tem-
perature of the pond in which the prepupal stage
resides (Danks and Oliver 1972). Since ponds can
warm up at different rates (based on depth, for
example), emergence can be synchronised within
ponds rather than across broad spatial scales. In
Fig. 4. Average (1SE) of the % of deviance explained
by the different weather variables from models
generated for each family and year. Weather variables
are as follows: D is the accumulation of thaw degree-
days, D2 is the square of the accumulation in thaw
degree-days, T is average daily temperature, Wi is
average daily wind speed, H is average daily relative
humidity, R is average daily incidental radiation, Rain
is total daily precipitation between two trapping
sessions, and T 3 D is the interaction between T and D.
Fig. 5. Cross-validation models based on data from Bylot Island. We constructed models from all the data
available minus one year. The observed values from the year left out (indicated on the left of the graphs) were
then contrasted with the predictions from the cross-validation model.
0153045607590
105
0153045607590
105
0153045607590
105
0153045607590
105
15 01 15 01 15
010203040506070
010203040506070
010203040506070
010203040506070
15 01 15 01 15
05
101520253035
05
101520253035
05
101520253035
05
101520253035
15 01 15 01 15
020406080
100120140
020406080
100120140
020406080
100120140
020406080
100120140
15 01 15 01 15
05
10152025303540
05
10152025303540
05
10152025303540
15 01 15 01 15
05
101520
05
101520
15 01 15 01 15
Art
hrop
od a
vaila
bilit
y (m
g/tr
ap/d
ay)
Bylot, wet habitat
Tipulidae Chironomidae Carabidae Muscidae
Araneae
Ichneumonidae
Observed
Predicted
AugJun Jul AugJun Jul AugJun Jul AugJun Jul AugJun Jul AugJun Jul
2005
2008
2007
2006
R2=0.65 R2=0.50 R2=0.43 R2=0.16
R2=0.12R2=0.40R2=0.50R2=0.37 R2=0.48
R2=0.83 R2=0.65 R2=0.37 R2=0.63 R2=0.27 R2=0.72
R2=0.70 R2=0.28 R2=0.68 R2=0.35 R2=0.34 R2=0.52
166 Can. Entomol. Vol. 145, 2013
� 2013 Entomological Society of Canada

our observations, there is more than one peak
of nonbiting midges in any given year and the
peaks are not as well defined as for crane flies
(see Fig. 3). Numerous peaks may also be due to
several species emerging at different times con-
sidering that nonbiting midges contributes a high
proportion of species to the tundra insect fauna
(MacLean and Pitelka 1971). In spiders, we did not
observe a synchronised peak of abundance (see
Fig. 3). They are present throughout the season and
usually are active at the very beginning of snow
melt (Meltofte and Høye 2007; this study).
These contrasting patterns of arthropod phe-
nology may be important in their role as food for
birds. Both spiders and crane flies are important
to successful reproduction of insectivorous birds
but they likely play different roles. Spiders are
active at the very beginning of snow melt and are
present throughout the season (Meltofte and
Høye 2007; this study). It has been found that
the abundance of wolf spider Pardosa glacialis
(Thorell, 1872) (Araneae: Lycosidae) was prob-
ably the only variable influencing the timing of
reproduction of jaegers Stercorarius longicaudus
(Vieillot, 1819) (Aves: Stercoriidae) in Greenland
(Meltofte and Høye 2007). Arthropods that are
present early in the season may be especially
important for the long-distant migrants that
arrive at their Arctic breeding grounds with little
to no stored energy and must rely upon early
emerging arthropods in order to rebuild fat
reserves and produce eggs (Danks 1971; Klaassen
et al. 2001; Meltofte et al. 2008). On the other
hand, arthropods such as crane flies, which
exhibit peaks later in the season may be more
important for the growth and survival of offspring
(Pearce-Higgins and Yalden 2004).
Arthropods with an availability that is limited
in time (synchronised emergence) can provide a
great source of food for chicks if hatching is
synchronised with emergence. But achieving this
synchrony can be challenging, especially in the
context of climate change (Both and Visser 2001;
Thomas et al. 2001). For example, studies have
now indicated that an asynchrony between hatch
of shorebird chicks and peaks in crane flies can
reduce chick growth rates (McKinnon et al. 2012)
and even lead to potential population declines in
some shorebird species (Pearce-Higgins et al.
2005). However, abundance of arthropods rather
than asynchrony may better predict population
decline in different shorebirds species (Pearce-
Higgins et al. 2009; Pearce-Higgins 2010).
Changes in climate are likely to induce
changes in the patterns of arthropod availability
with the potential to affect several trophic levels
within the tundra food web. The unique data we
have collected as part of this pan-Canadian
effort, and the models we have tested will help
us to forecast and/or hindcast arthropod avail-
ability over time, so that we can gain greater
insight into the potential effects of changing
arthropod availability for Arctic insectivores.
Future research should continue to refine our
understanding of seasonal variation in arthropod
availability and attempt to study variation at
lower taxonomic levels such as genus and, if
possible, species. However, with over 2000
species of arthropods in arctic North America
(Danks 1992), this could prove to a be a very
interesting, though rather challenging task.
Acknowledgements
Funding and logistic assistance for the collection
of specimens was provided by grants from the
Canadian federal government’s International Polar
Year program, the Natural Science and Engineer-
ing Research Council of Canada, and the Canadian
Ministry of Environment to the Arctic Wildlife
Observatories Linking Vulnerable EcoSystems
International Polar Year project. Our study was
also made possible due to funding by the Fonds
Quebecois de recherche sur la nature et les tech-
nologies (FQRNT), Wildlife Conservation Society
Canada, the Garfield Weston Award for Northern
Research, and the Northern Scientific Training
Program. Logistical support was provided by
Polar Continental Shelf Project and Parks Canada.
Special thanks to Ludovic Jolicoeur, Benoit
Laliberte, Emilie D’astous, Pierre-Yves l’Herault,
Maryse Cloutier, Jean-Remi Julien, Scott Gilbert,
Georges-Olivier Cimon, William Halliday, and
Alice Kenney for field work. Thanks also to
Valerie Delisle-Gagnon, Sarah Loboda, Hirondelle
Varady-Szabo, Annie Hibbert, Samuel Pinna,
Maude Picotin, Ludovic Jolicoeur, and Karine
Richer for identification of arthropods in the
laboratory. Thank you to Alain Caron, Nicolas
Lecomte, Arnaud Tarroux, Eeva Soininen, the
members of the Bety-Berteaux laboratory, and two
anonymous referees for their helpful comments.
Bolduc et al. 167
� 2013 Entomological Society of Canada

References
Ale, S.B., Morris, D.W., Dupuch, A., and Moore, D.E.2011. Habitat selection and the scale of ghostlycoexistence among Arctic rodents. Oikos, 120:1191–1200. doi:10.1111/j.1600-0706.2010.18933.x.
Arctic Climate Impact Assessment. 2004. Impacts ofwarming climate: Arctic Climate Impact Assessment.Cambridge University Press, Cambridge, UnitedKingdom.
Bale, J.S., Masters, G.J., Hodkinson, I.D., Awmack,C., Bezemer, T.M., Brown, V.K., et al. 2002.Herbivory in global climate change research: directeffects of rising temperature on insect herbivores.Global Change Biology, 8: 1–16. doi:10.1046/j.1365-2486.2002.00451.x.
Berteaux, D., Humphries, M.M., Krebs, C.J., Lima, M.,McAdam, A.G., Pettorelli, N., et al. 2006. Constraintsto projecting the effects of climate change onmammals. Climate Research, 32: 151–158.
Both, C. and Visser, M.E. 2001. Adjustment toclimate change is constrained by arrival date in along-distance migrant bird. Nature, 411: 296–298.
Committee for Holarctic Shorebird Monitoring.2004. Monitoring Arctic-nesting shorebirds: aninternational vision for the future. Wader StudyGroup Bulletin, 103: 2–5.
Danks, H.V. 1971. A note on the early season food ofarctic migrants. Canadian Field-Naturalist, 85: 71–72.
Danks, H.V. 1981. Arctic arthropods: a review ofsystematics and ecology with particular reference tothe North American fauna. Entomological Societyof Canada, Ottawa, Canada.
Danks, H.V. 1992. Arctic insects as indicators ofenvironmental change. Arctic, 45: 159–166.
Danks, H.V. and Oliver, D.R. 1972. Seasonalemergence of some high Arctic Chironomidae(Diptera). The Canadian Entomologist, 104:661–686.
Deutsch, C.A., Tewksbury, J.J., Huey, R.B., Sheldon,K.S., Ghalambor, C.K., Haak, D.C., et al. 2008.Impacts of climate warming on terrestrialectotherms across latitude. Proceedings of theNational Academy of Sciences, 105: 6668–6672.doi:10.1073/pnas.0709472105.
Dickey, M.-H., Gauthier, G., and Cadieux, M.-C.2008. Climatic effects on the breeding phenologyand reproductive success of an arctic-nesting goosespecies. Global Change Biology, 14: 1973–1985.doi:10.1111/j.1365-2486.2008.01622.x.
Efron, B. and Tibshirani, R.J. 1993. An introduction tothe bootstrap. In Monographs on statistics andapplied probability. Edited by B. Raton. Chapman& Hall, London, United Kingdom. Pp. 413–425.
Elton, C.S. 1927. Animal ecology. MacmillanCompany, New York, United States of America.
Frazier, M.R., Huey, R.B., and Berrigan, D. 2006.Thermodynamics constrains the evolution of insectpopulation growth rates: ‘‘Warmer is better’’.American Naturalist, 168: 512–520. doi:10.1086/506977.
Gauthier, G., Berteaux, D., Bety, J., Tarroux, A.,Therrien, J.-F., McKinnon, L., et al. 2011. Thetundra food web of Bylot Island in a changingclimate and the role of exchanges betweenecosystems. Ecoscience, 18: 223–235. doi:10.2980/18-3-3453.
Gauthier, G., Berteaux, D., Bety, J., Tarroux, A.,Therrien, J.F., McKinnon, L., et al. 2012. TheArctic tundra food web in a changing climateand the role of exchanges between ecosystems.Ecoscience, 18: 223–235.
Goulson, D., Derwent, L.C., Hanley, M.E., Dunn,D.W., and Abolins, S.R. 2005. Predicting calyptratefly populations from the weather, and probableconsequences of climate change. Journal ofApplied Ecology, 42: 795–804.
Gullan, P.J. and Cranston, P.S. 2005. The insects: anoutline of entomology. Blackwell Publishing,Oxford, United Kingdom.
Hijmans, R.J., Cameron, S.E., Parra, J.L., Jones, P.G.,and Jarvis, A. 2005. Very high resolution interpolatedclimate surfaces for global land areas. InternationalJournal of Climatology, 25: 1965–1978. doi:10.1002/joc.1276.
Hodar, J.A. 1996. The use of regression equations forestimation of arthropod biomass in ecologicalstudies. Acta Oecologica, 17: 421–433.
Hodkinson, I.D. and Coulson, S.J. 2004. Are highArctic terrestrial food chains really that simple?The Bear Island food web revisited. Oikos, 106:427–431.
Hodkinson, I.D., Coulson, S.J., Webb, N.R., Block, W.,Strathdee, A.T., Bale, J.S., et al. 1996. Temperatureand the biomass of flying midges (Diptera:Chironomidae) in the high Arctic. Oikos, 75: 241–248.
Hodkinson, I.D., Webb, N.R., Bale, J.S., Block, W.,Coulson, S.J., and Strathdee, A.T. 1998. Global changeand Arctic ecosystems: conclusions and predictionsfrom experiments with terrestrial invertebrates onspitsbergen. Arctic and Alpine Research, 30: 306–313.
Høye, T.T. and Forchhammer, M.C. 2008. Theinfluence of weather conditions on the activity ofhigh-arctic arthropods inferred from long-termobservations [online]. BMC Ecology, 8. Availablefrom http://www.ncbi.nlm.nih.gov/pmc/articles/PMC2390509/pdf/1472-6785-8-8.pdf [accessed27 December 2012].
Høye, T.T., Post, E., Meltofte, H., Schmidt, N.M., andForchhammer, M.C. 2007. Rapid advancement ofspring in the High Arctic. Current Biology, 17:R449–R451.
Huey, R.B. and Berrigan, D. 2001. Temperature,demography, and ectotherm fitness. The AmericanNaturalist, 158: 204–210.
Jenouvrier, S., Caswell, H., Barbraud, C., Holland, M.,Stroeve, J., and Weimerskirch, H. 2009. Demo-graphic models and IPCC climate projectionspredict the decline of an emperor penguinpopulation. Proceedings of the National Academyof Sciences of the United States of America, 106:1844–1847.
168 Can. Entomol. Vol. 145, 2013
� 2013 Entomological Society of Canada

Klaassen, M., Lindstrom, A., Meltofte, H., and Piersma,T. 2001. Ornithology – Arctic waders are not capitalbreeders. Nature, 413: 794–794. doi:10.1038/35101654.
MacLean, S.F. 1973. Life cycle and growth energeticsof the Arctic Crane fly Pedicia hannai antenatta.Oikos, 24: 436–443.
MacLean, S.F. and Pitelka, F.A. 1971. Seasonalpatterns of abundance of tundra arthropods nearBarrow. Arctic, 24: 19–40.
McCullagh, P. and Nelder, J.A. 1989. Generalizedlinear models. Chapman and Hall, London, UnitedKingdom.
McKinnon, L., Picotin, M., Bolduc, E., Juillet, C., andBety, J. 2012. Timing of breeding, peak foodavailability, and effects of mismatch on chick growthin birds nesting in the High Arctic. Canadian Journalof Zoology, 90: 961–971. doi:10.1139/z2012-064.
Meltofte, H. and Høye, T.T. 2007. Reproductiveresponse to fluctuating lemming density andclimate of the long-tailed Skua Stercorariuslongicaudus at Zackenberg, Northeast Greenland,1996–2006. Dansk Orn Foren Tidsskr, 101: 109–119.
Meltofte, H., Høye, T.T., and Schmidt, N.M. 2008.Effects of food availability, snow and predation onbreeding performance of waders at Zackenberg.In High-Arctic ecosystem dynamics in a changingclimate. Edited by H. Meltofte, T.R. Christensen,B. Elberling, M.C. Forchammer, and M. Rasch.Elsevier Academic Press Inc., San Diego,California, United States of America. Pp. 325–341.
Morrison, R.I.G., Davidson, N.C., and Piersma, T.2005. Transformations at high latitudes: why do redknots bring body stores to the breeding grounds?Condor, 107: 449–457. doi:10.1650/7614.
Pearce-Higgins, J.W. 2010. Using diet to assess thesensitivity of northern and upland birds to climatechange. Climate Research, 45: 119–130.doi:10.3354/cr00920.
Pearce-Higgins, J.W. and Yalden, D.W. 2004. Habitatselection, diet, arthropod availability and growth of amoorland wader: the ecology of European GoldenPlover Pluvialis apricaria chicks. Ibis, 146: 335–346.
Pearce-Higgins, J.W., Yalden, D.W., Dougall, T., andBeale, C. 2009. Does climate change explainthe decline of a trans-Saharan Afro-Palaearcticmigrant? Oecologia, 159: 649–659. doi:10.1007/s00442-008-1242-4.
Pearce-Higgins, J.W., Yalden, D.W., and Whittingham,M.J. 2005. Warmer springs advance the breedingphenology of golden plovers Pluvialis apricaria andtheir prey (Tipulidae). Oecologia, 143: 470–476.
Picotin, M. 2008. Variation climatique, abondanced’arthropodes et phenologie de la reproduction chezdeux especes de limicoles nichant dans le hautArctiqueMaster. Universite du Quebec a Rimouski,Rimouski, Quebec, Canada.
Post, E., Forchhammer, M.C., Bret-Harte, M.S.,Callaghan, T.V., Christensen, T.R., Elberling, B.,et al. 2009. Ecological dynamics across the Arcticassociated with recent climate change. Science, 325:1355–1358. doi:10.1126/science.1173113.
Rogers, L.E., Buschbom, R.L., and Watson, C.R.1977. Length–weight relationships of shrub-steppeinvertebrates. Annals of the Entomological Societyof America, 70: 51–53.
Root, T.L., Price, J.T., Hall, K.R., Schneider, S.H.,Rosenzweig, C., and Pounds, J.A. 2003. Fingerprintsof global warming on wild animals and plants. Nature,421: 57–60.
Roy, D.B., Rothery, P., Moss, D., Pollard, E., andThomas, J.A. 2001. Butterfly numbers and weather:predicting historical trends in abundance and thefuture effects of climate change. Journal of AnimalEcology, 70: 201–217.
Saether, B.-E. 1997. Environmental stochasticity andpopulation dynamics of large herbivores: a searchfor mechanisms. Trends in Ecology and Evolution,12: 143–149.
Sage, R.D. 1982. Wet and dry-weight estimates ofinsects and spiders based on length. AmericanMidland Naturalist, 108: 407–411.
Sample, B.E., Cooper, R.J., Greer, R.D., and Withmore,R.C. 1993. Estimation of insect biomass by length andwidth. American Midland Naturalist, 129: 234–240.
Schekkerman, H., Tulp, I., Calf, K.M., and de Leeuw,J.J. 2004. Studies on breeding shorebirds atMedusa Bay, Taimyr, in summer 2002 [online].In Alterra report 922. Alterra, Wageningen, TheNetherlands. Available from http://edepot.wur.nl/23058 [accessed 30 December 2012].
Schekkerman, H., Tulp, I., Piersma, T., and Visser,G.H. 2003. Mechanisms promoting higher growthrate in Arctic than in temperate shorebirds.Oecologia, 134: 332–342.
Smith, P.A., Gilchrist, G.H., and Smith, J.N.M. 2007.Effects of nest habitat, food, and parental behavioron shorebird nest success. The Condor, 109: 15–31.doi:10.1650/0010-5422(2007)109[15:eonhfa]2.0.co;2.
Strathdee, A.T., Bale, J.S., Block, W.C., Coulson, S.J.,Hodkinson, I.D., and Webb, N.R. 1993. Effects oftemperature elevation on a field population ofAcyrthosiphon svalbardicum (Hemiptera: Aphididae)on Spitsbergen. Oecologia, 96: 457–465.
Thomas, D.W., Blondel, J., Perret, P., Lambrechts, M.M.,and Speakman, J.R. 2001. Energetic and fitness costsof mismatching resource supply and demand inseasonally breeding birds. Science, 291: 2598–2600.
Thomas, C.D., Cameron, A., Green, R.E., Bakkenes,M., Beaumont, L.J., Collingham, Y.C., et al. 2004.Extinction risk from climate change. Nature, 427:145–148. doi:10.1038/nature02121.
Tulp, I. 2007. The Arctic pulse, timing of breeding inlong-distance migrant shorebirds [online]. Ph.D.thesis, University of Groningen. Available fromhttp://www.waddenacademie.nl/fileadmin/inhoud/pdf/06-wadweten/Proefschriften/Thesis_ITulp_verkl.pdf[accessed 30 December 2012].
Tulp, I. and Schekkerman, H. 2001. Studies on breedingshorebirds at Medusa Bay, Taimyr, in summer 2001[online]. In Alterra report 451. Alterra, Wageningen,The Netherlands. Available from http://edepot.wur.nl/21801 [accessed 30 December 2012].
Bolduc et al. 169
� 2013 Entomological Society of Canada

Tulp, I. and Schekkerman, H. 2008. Has preyavailability for Arctic birds advanced with climatechange? Hindcasting the abundance of tundraarthropods using weather and seasonal variation.Arctic, 61: 48–60.
Visser, M.E. 2008. Keeping up with a warming world;assessing the rate of adaptation to climate change.Proceedings of the Royal Society B – BiologicalSciences, 275: 649–659. doi:10.1098/rspb.2007.0997.
Wagner, T.L., Olson, R.L., and Willers, J.L. 1991.Modeling arthropod development time. Journal ofAgricultural Entomology, 8: 251–270.
Whittaker, J.B. and Tribe, N.P. 1998. Predictingnumbers of an insect (Neophilaenus lineatus:Homoptera) in a changing climate. Journal ofAnimal Ecology, 67: 987–991.
Wigglesworth, V.B. 1972. The principles of insectphysiology. Chapman and Hall, London, UnitedKingdom.
170 Can. Entomol. Vol. 145, 2013
� 2013 Entomological Society of Canada
Related Documents