Terrain Analysis Using Digital Elevation Models David G. Tarboton Dan Ames Utah State University http://www.engineering.usu.edu/dtarb

Welcome message from author
This document is posted to help you gain knowledge. Please leave a comment to let me know what you think about it! Share it to your friends and learn new things together.
Transcript

Terrain Analysis Using Digital Elevation Models
David G. TarbotonDan Ames
Utah State University
http://www.engineering.usu.edu/dtarb
Outline
■ Primary Digital Elevation Model (DEM) analysis◆ Flow Directions◆ Drainage Area◆ Slope◆ Channel network and watershed
delineation■ Secondary DEM analysis
◆ (Terrain stability mapping)◆ Weighted drainage area accumulation
(equivalent clearcut analysis)■ Software

Related activities
■ Distributed hydrologic modeling.■ Channel network geomorphology and
mapping using digital elevation models. ■ Terrain stability mapping and GIS use
in hydrologic modeling. (SINMAP)■ Snowmelt processes and models.■ GIS in Water Resources Online Course
(with David Maidment, U. of Texas)
For more detail, papers and software see http://www.engineering.usu.edu/dtarb/

q = atan S
DDw
hhw
qf-q+
=sin
tan]wr1[cosCFS
AREA 1
AREA 2
3
12
SINMAPTerrain Stability
Mapping

Elevation Surface — the ground surface elevation at each point
Digital Elevation Model — A digital representation of an elevation surface. Examples include a (square) digital elevation grid, triangular irregular network, set of digital line graph contours or random points.

Digital Elevation Model and Hydrology Data Sources
■ The USGS National Elevation Dataset (NED) http://edcnts12.cr.usgs.gov/ned/
Highest-resolution, best-quality elevation data available across the United States merged into a seamless raster format. 1 arc-second cells (1:24,000 scale).
■ National Hydrography Dataset (NHD) http://nhd.usgs.gov/
The stream network and water bodies of the United States organized by 8-digit hydrologic cataloging units.
Digital Elevation Grid — a grid of cells (square or rectangular) in some coordinate system having land surface elevation as the value stored in each cell.
Square Digital Elevation Grid —a common special case of the digital elevation grid
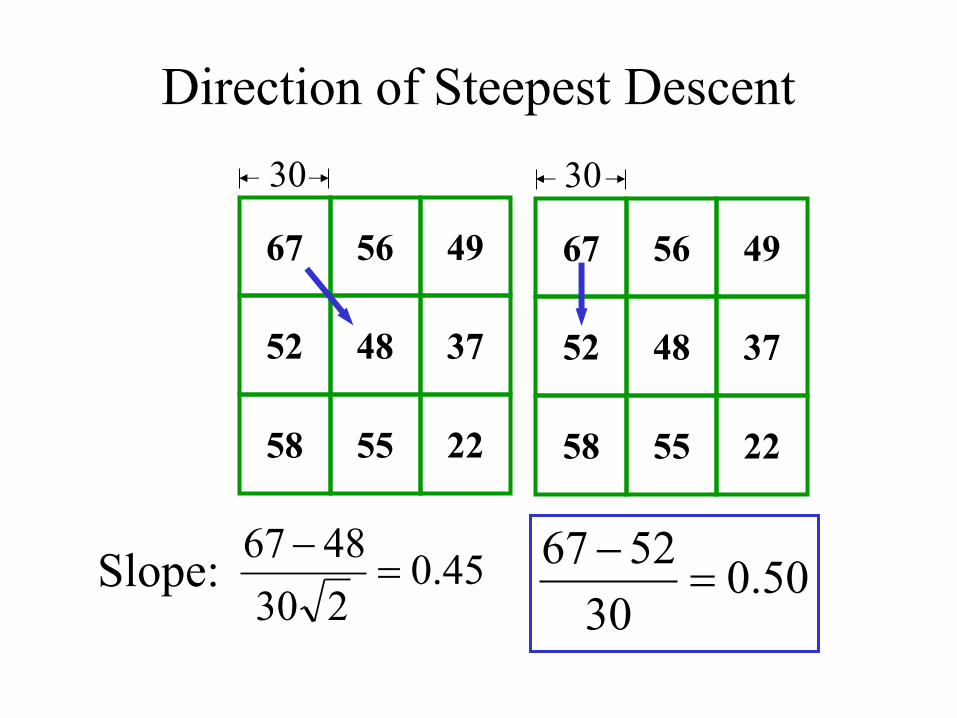
67 56 49
52 48 37
58 55 22
30
67 56 49
52 48 37
58 55 22
30
45.02304867
=-
50.0305267
=-Slope:
Direction of Steepest Descent

Digital Elevation Model Based Channel Network Delineation
1 1 11 1
1
1
1
1
1
1
1
1
1
4 3 3
12 2
223
16
256
Drainage Area
4
5
6
3
7
2
1
8
Eight direction pour point model D8 Grid network
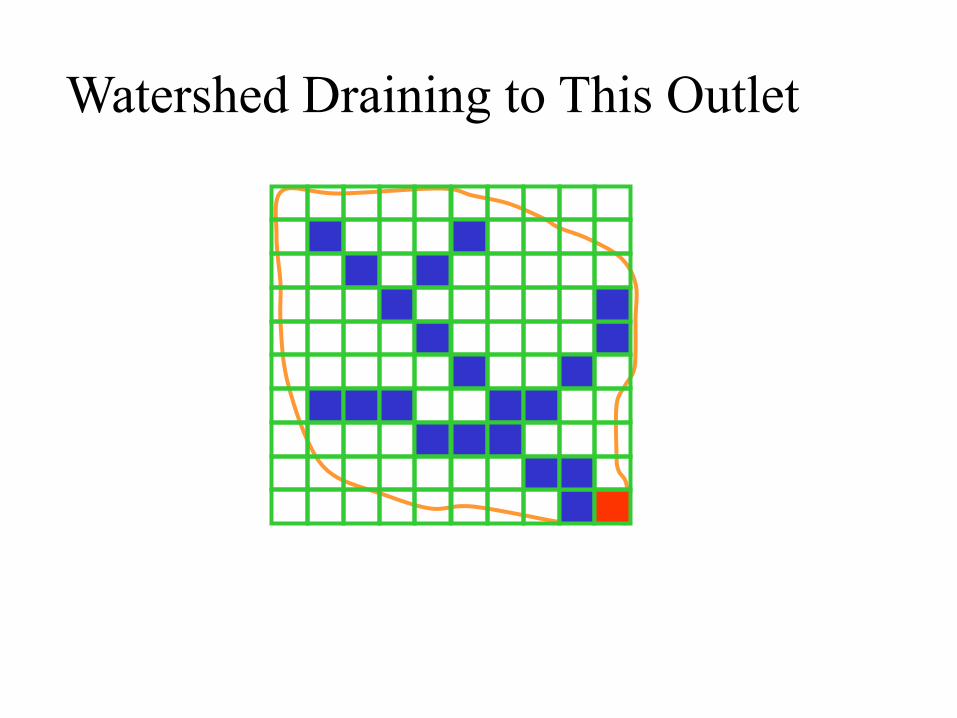
Watershed Draining to This Outlet

1 0 1 Kilometers Streams from 1:250,000blue lines
Streams from 1:250,000 blue lines
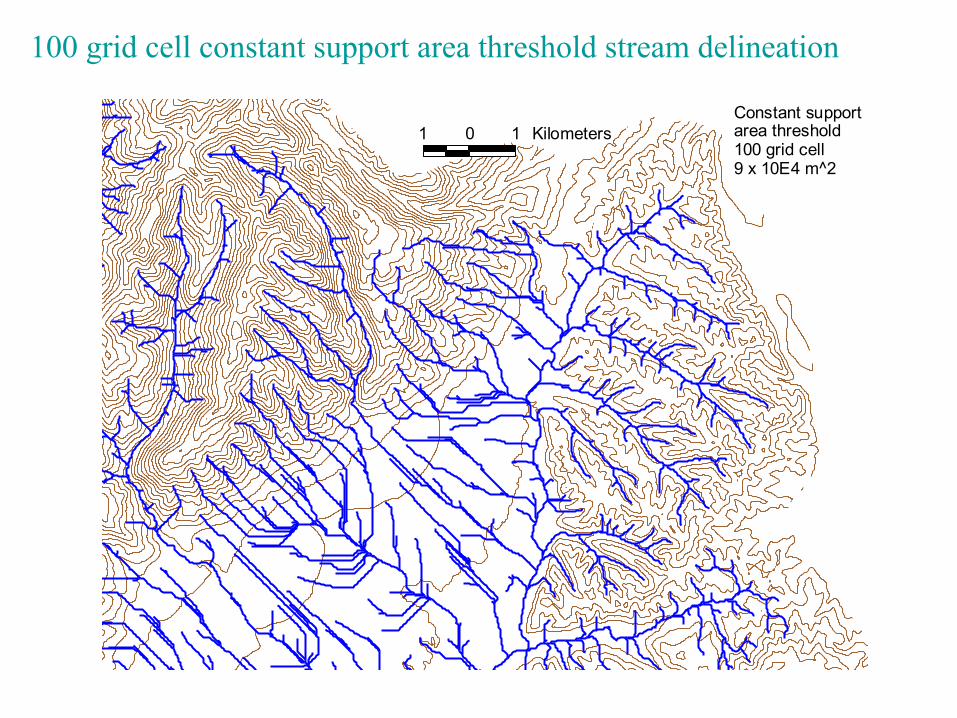
100 grid cell constant support area threshold stream delineation
1 0 1 KilometersConstant support area threshold100 grid cell9 x 10E4 m^2

200 grid cell constant support area based stream delineation
1 0 1 Kilometersconstant support area threshold200 grid cell18 x 10E4 m^2
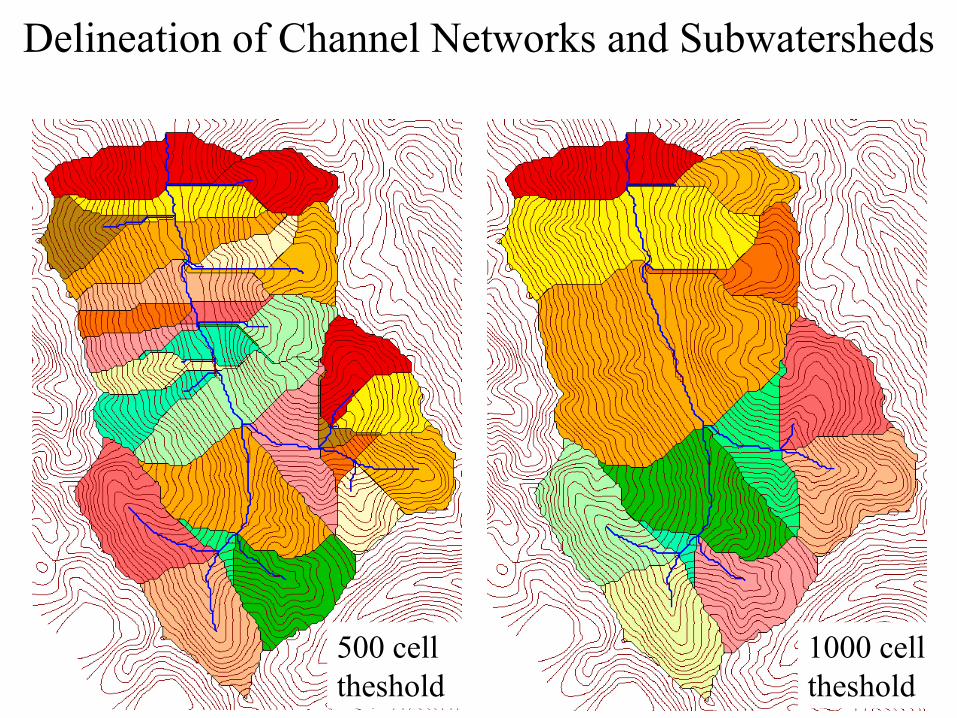
Delineation of Channel Networks and Subwatersheds
500 cell theshold
1000 cell theshold

How to decide on support area threshold ?
AREA 1
AREA 23
12
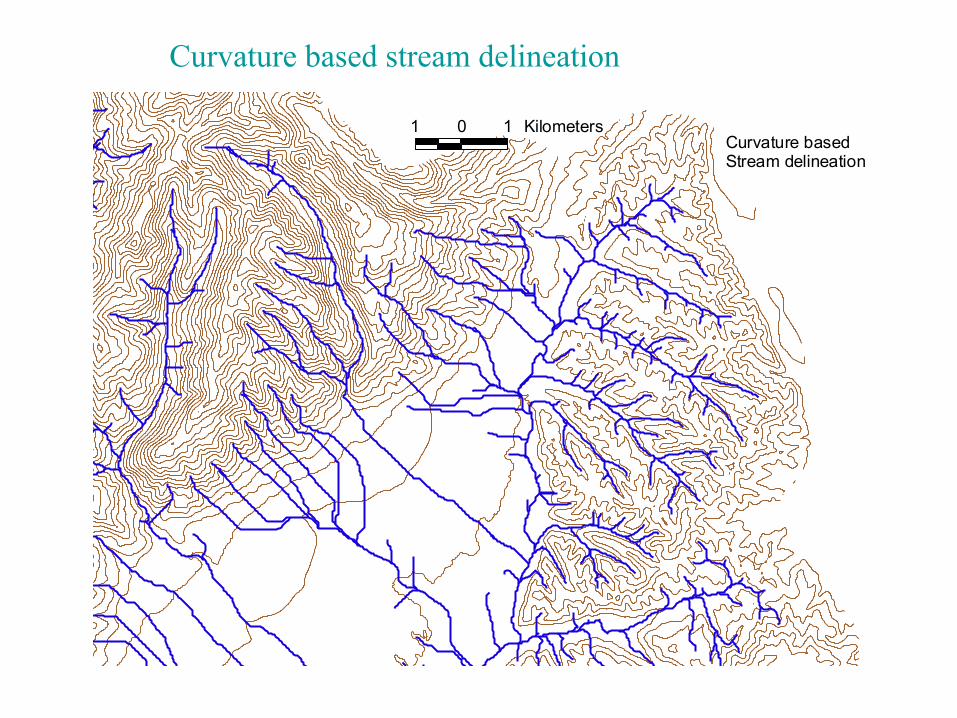
1 0 1 KilometersCurvature basedStream delineation
Curvature based stream delineation

0 1 Kilometers 0 1 KilometersDriftwood, PA Sunland, CA
Topographic Texture and Drainage DensitySame scale, 20 m contour interval Sunland, CADriftwood, PA

Canyon Creek, Trinity Alps, Northern California.
Photo D K Hagans

Gently Sloping Convex Landscape
From W. E. Dietrich
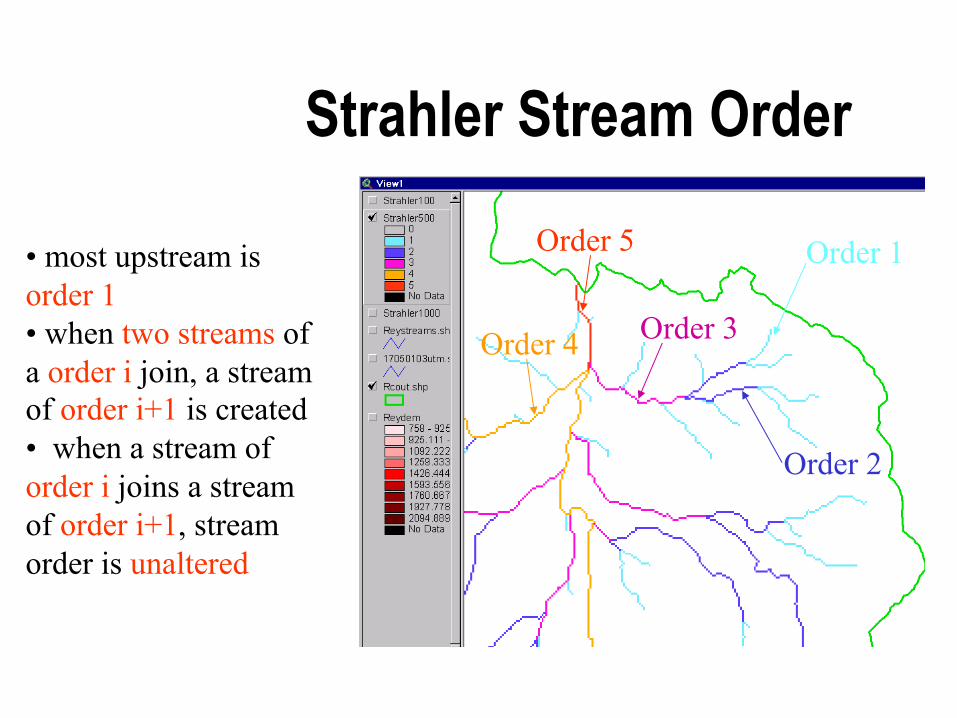
Strahler Stream Order
Order 1
Order 2
• most upstream is order 1• when two streams of a order i join, a stream of order i+1 is created• when a stream of order i joins a stream of order i+1, stream order is unaltered
Order 3Order 4
Order 5
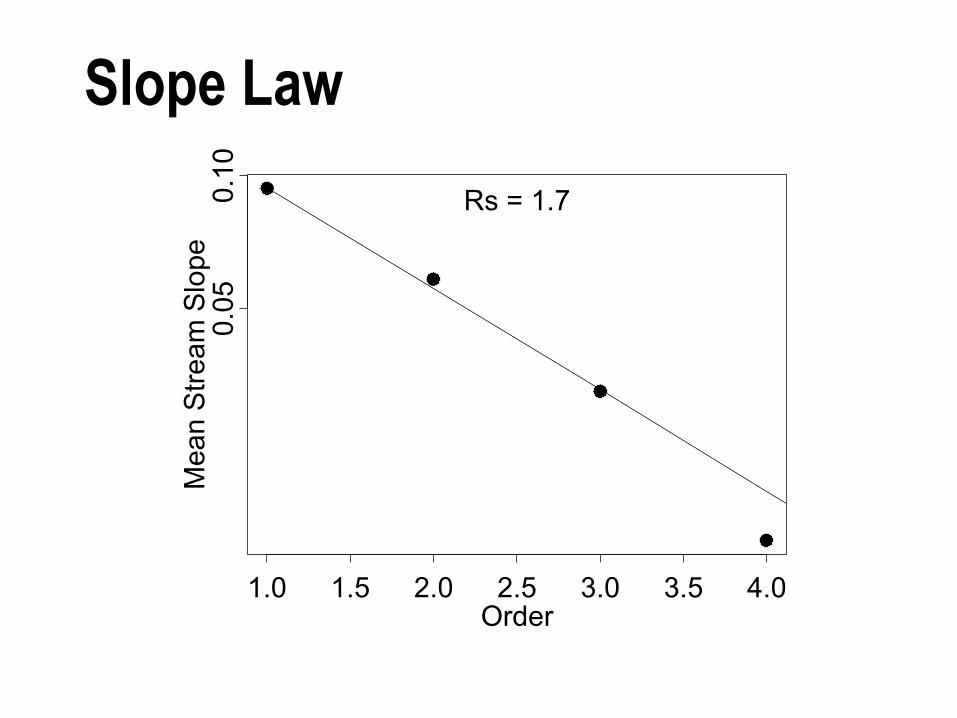
Slope Law
Order
Mea
n St
ream
Slo
pe
1.0 1.5 2.0 2.5 3.0 3.5 4.0
0.05
0.10
Rs = 1.7

Constant Stream Drops Law
Order
Mea
n St
ream
Dro
p
1.0 1.5 2.0 2.5 3.0 3.5 4.0
5010
050
0Rd = 0.944
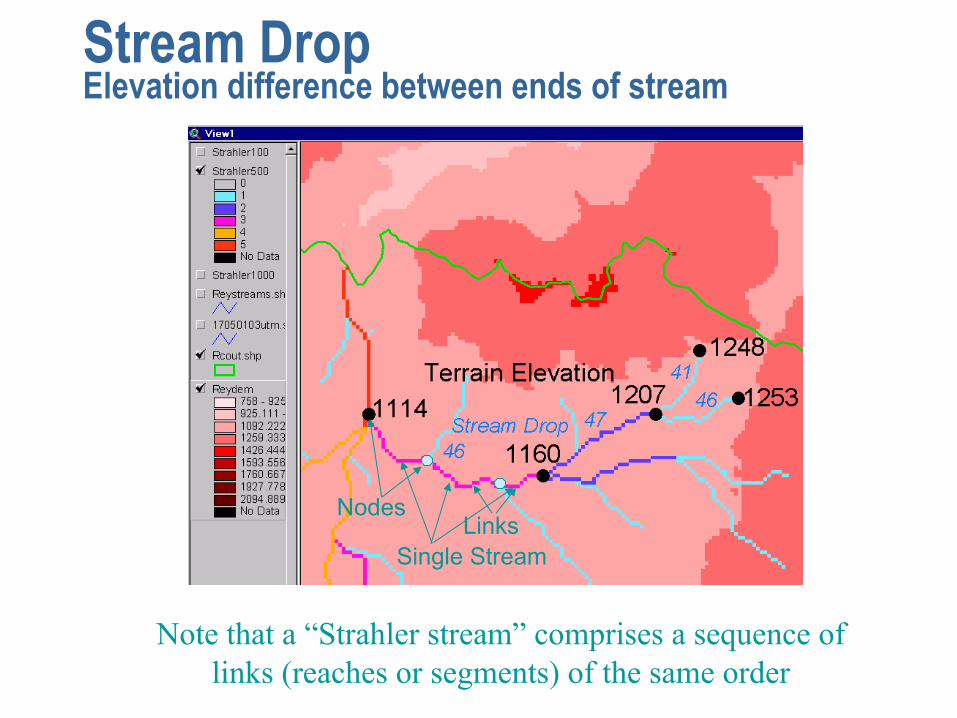
Stream DropElevation difference between ends of stream
Note that a “Strahler stream” comprises a sequence of links (reaches or segments) of the same order
NodesLinks
Single Stream

Suggestion: Map channel networks from the DEM at the finest resolution consistent with observed
channel network geomorphology ‘laws’.
■ Break in constant stream drop property■ Break in slope versus contributing area
relationship■ Physical basis in the form instability theory
of Smith and Bretherton (1972), see Tarboton et al. 1992

Statistical Analysis of Stream Drops
Elevation Drop for Streams
0
100
200
300
400
500
600
0 1 2 3 4 5 6Strahler Order
Dro
p (m
eter
s)
DropMean Drop

T-Test for Difference in Mean Values
72 130
Order 1 Order 2-4Mean X 72.2 Mean Y 130.3Std X 68.8 Std Y 120.8Var X 4740.0 Var Y 14594.5Nx 268 Ny 81
0
T-test checks whether difference in means is large (> 2)when compared to the spread of the data around the mean values
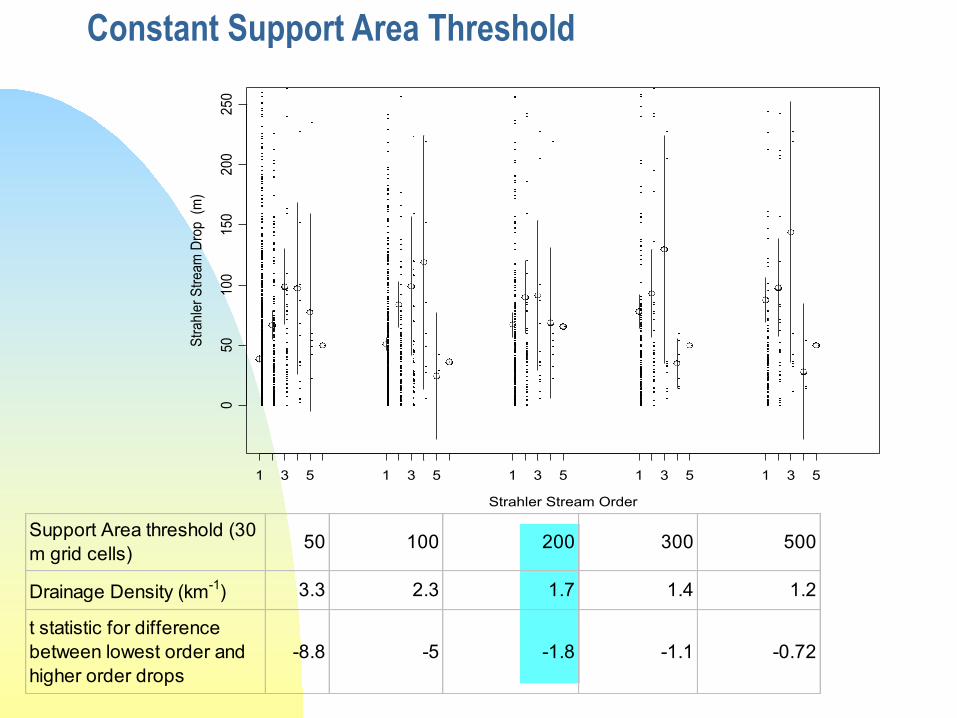
Constant Support Area Threshold
Strahler Stream Order
Stra
hler
Stre
am D
rop
(m)
050
100
150
200
250
1 3 5 1 3 5 1 3 5 1 3 5 1 3 5
Support Area threshold (30 m grid cells) 50 100 200 300 500
Drainage Density (km-1) 3.3 2.3 1.7 1.4 1.2
t statistic for difference between lowest order and higher order drops
-8.8 -5 -1.8 -1.1 -0.72
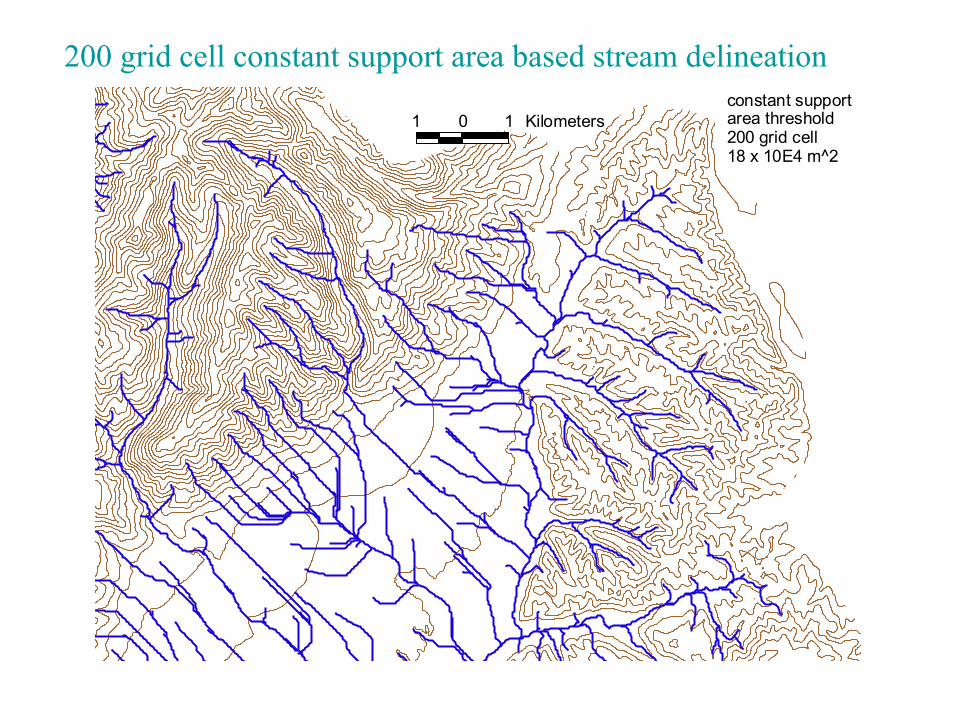
200 grid cell constant support area based stream delineation
1 0 1 Kilometersconstant support area threshold200 grid cell18 x 10E4 m^2

Local Curvature Computation(Peuker and Douglas, 1975, Comput. Graphics Image Proc. 4:375)
43
41
48
47
48
47 54
51
54
51 56
58
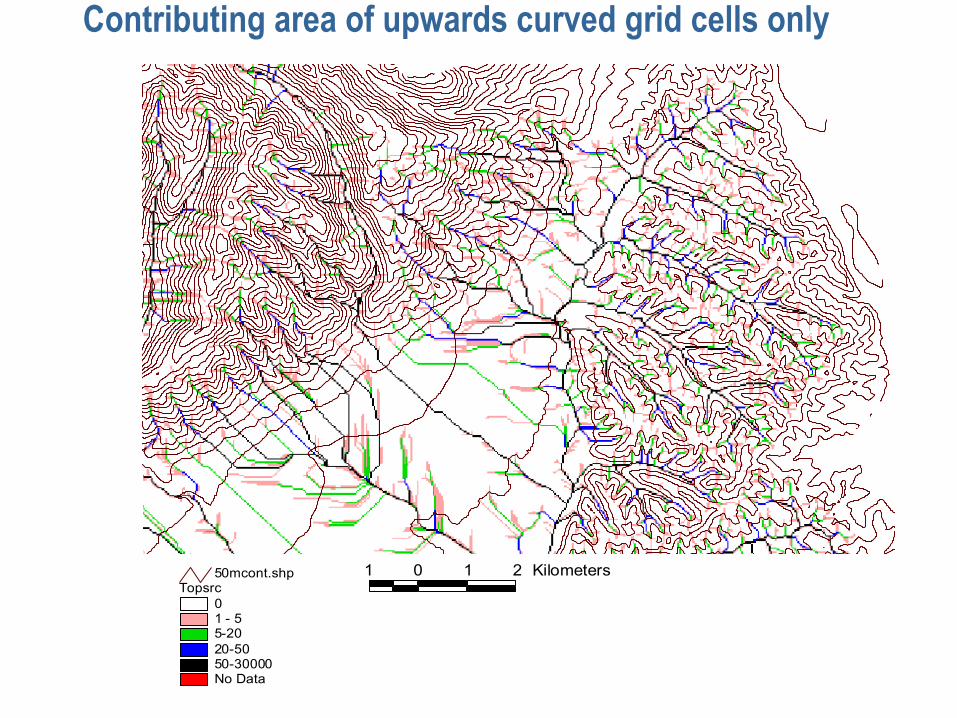
Contributing area of upwards curved grid cells only
Topsrc01 - 55-2020-5050-30000No Data
50mcont.shp 1 0 1 2 Kilometers

Upward Curved Contributing Area Threshold
Strahler Stream Order
Stra
hler
Stre
am D
rop
(m)
050
100
150
200
250
1 3 5 1 3 5 1 3 5 1 3 5
Upward curved support area threshold (30 m grid cells) 10 15 20 30
Drainage Density (km-1) 2.2 1.8 1.6 1.4
t statistic for difference between lowest order and higher order drops
-4.1 -2.2 -1.3 -1.2

1 0 1 KilometersCurvature basedStream delineation
Curvature based stream delineation
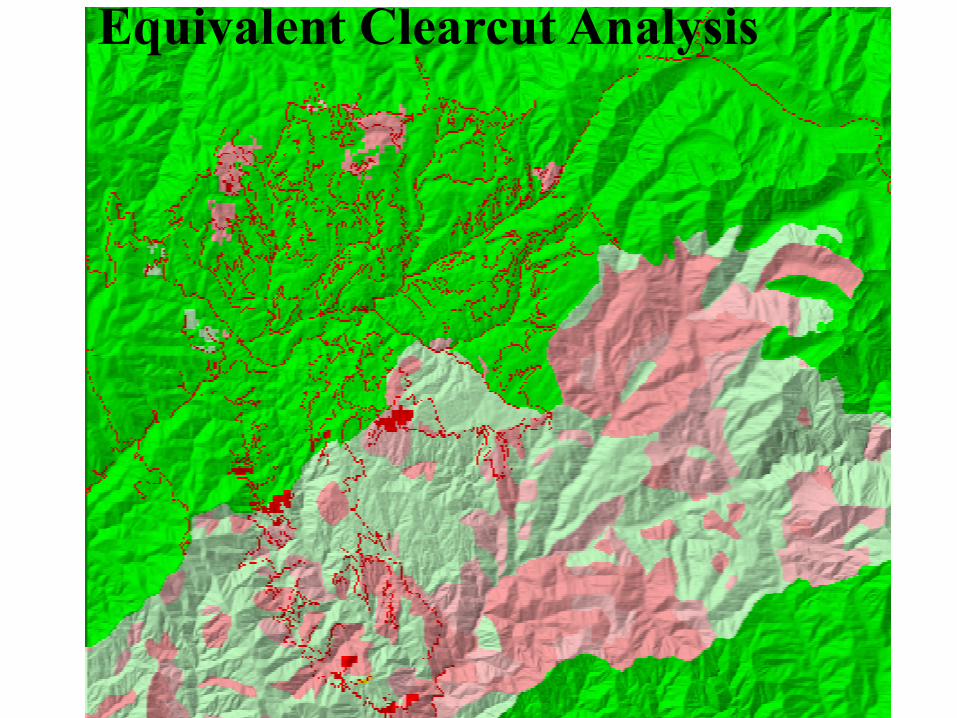
Equivalent Clearcut Analysis

Strmeca0 - 0.010.01 - 0.050.05 - 0.150.15 - 0.20.2 - 0.40.4 - 0.60.6 - 0.80.8 - 1No Data


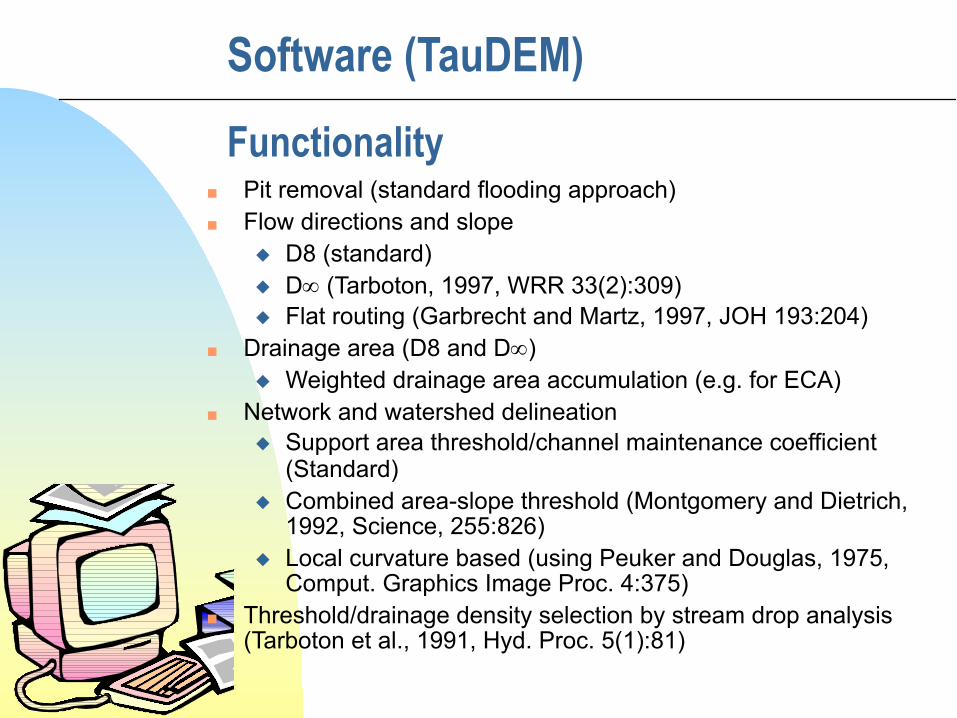
Software (TauDEM)
Functionality■ Pit removal (standard flooding approach)■ Flow directions and slope
◆ D8 (standard)◆ D¥ (Tarboton, 1997, WRR 33(2):309)◆ Flat routing (Garbrecht and Martz, 1997, JOH 193:204)
■ Drainage area (D8 and D¥)◆ Weighted drainage area accumulation (e.g. for ECA)
■ Network and watershed delineation◆ Support area threshold/channel maintenance coefficient
(Standard)◆ Combined area-slope threshold (Montgomery and Dietrich,
1992, Science, 255:826)◆ Local curvature based (using Peuker and Douglas, 1975,
Comput. Graphics Image Proc. 4:375)■ Threshold/drainage density selection by stream drop analysis
(Tarboton et al., 1991, Hyd. Proc. 5(1):81)
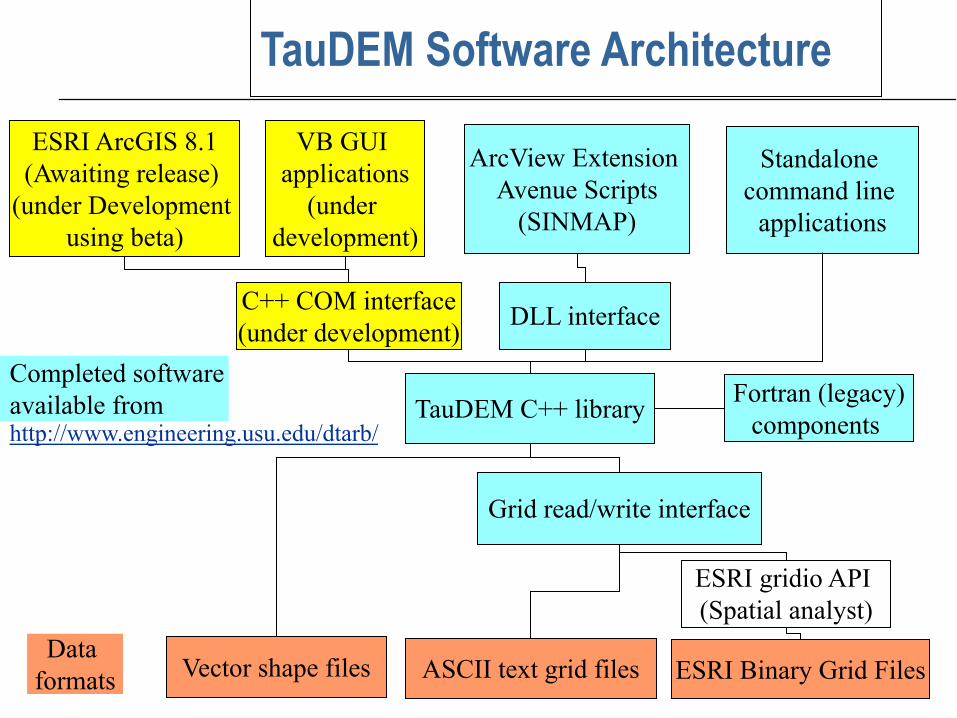
TauDEM Software Architecture
ESRI Binary Grid FilesASCII text grid files
ESRI gridio API (Spatial analyst)
Grid read/write interface
TauDEM C++ library Fortran (legacy)components
DLL interface
ArcView Extension Avenue Scripts
(SINMAP)
Standalone command line
applications
C++ COM interface(under development)
VB GUI applications
(under development)
ESRI ArcGIS 8.1(Awaiting release)
(under Development using beta)
Vector shape filesData
formats
Completed software available from http://www.engineering.usu.edu/dtarb/
Conclusions■ Terrain analysis using digital elevation models
provides considerable capability useful in hydrologic analysis
■ In channel network delineation use consistency with geomorphology laws to adapt support area threshold and drainage density to the natural texture of the topography.
■ Use curvature based methods to allow channel network drainage density to be spatially variable to adapt to variable topographic texture.
Are there any questions ?
AREA 1
AREA 23
12
Related Documents