TERMINAL DUES Impact on financial transfers among designated postal operators of the Universal Postal Union 2018-2021 cycle agreements 22 September 2017 U.S. Postal Regulatory Commission

Welcome message from author
This document is posted to help you gain knowledge. Please leave a comment to let me know what you think about it! Share it to your friends and learn new things together.
Transcript
TERMINAL DUESImpact on financial transfers among designated postal operators of the Universal Postal Union 2018-2021 cycle agreements22 September 2017U.S. Postal Regulatory Commission

© Copenhagen Economics A/S22 September 2017
Henrik Ballebye OkholmAnna Möller BoivieJimmy GårdebrinkMartina Facino
Impact on financial transfers among designated postal operators of the Universal Postal Union 2018-2021 cycle agreements
TERMINAL DUES
AUTHORS
In a report to the Postal Regulatory Commission (PRC) in September 2014, Copenhagen Economics identified three types of potential market distortions created by the current UPU terminal dues system:
1. Distortion of competition for (i) last-mile handling and (ii) first-mile handling of cross-border letter post items
2. Distortion of demand for (i) delivery serviceswithin and outside the terminal dues system, (ii) domestic versus cross-border delivery, and (iii) cross-border delivery originating in transition versus target countries
3. Financial transfers1 between designated postal operators
In December 2015, the PRC asked Copenhagen Economics to conduct a quantitative analysis, estimating the magnitude of the third type of distortion: the financial transfers between designated postal operators caused by the terminal dues system in 2014.
In this previous study, we estimated the financial transfers caused by the UPU terminal dues system to 950 million Special Drawings Right (SDR), equivalent to approximately 1,4 billion USD. We also highlighted that financial transfers primarily are created by low terminal dues for small packets, one of the letter formats covered by the terminal dues system.
In September 2016, the UPU Congress agreed on a number of changes to the terminal dues system, entering into effect as of January 1, 2018. Perhaps most notably, the changes include separate (and higher) terminal dues for E-format items (bulky letters and small packets).
Against this background, the PRC has asked Copenhagen Economics to estimate the impact of these changes on financial transfers going forward.
The report provides new quantifications of financial transfers with the current system and with the updated system respectively. The methodology
applied is identical to that applied in the previous report, but with the addition of refined volume and tariff data and with new specifications for the updated regulation. Due to these refinements, the magnitude of financial transfers in this report is not directly comparable to that in the previous report.
Preface
3
The Universal Postal Union (UPU) system of terminal dues governs payments between designated
postal operators for the transport, sorting, and delivery of cross-border letter post items in the
destination country. UPU rates are used by many postal operators across the world, both directly and
indirectly (as a fall-back provision when negotiating bilateral agreements). In this report we show that
the UPU rates are distortive and lead to USD 3.1 billion in financial transfers between postal operators
in 2018.
ANNA MÖLLER BOIVIEManaging Economist
Project Manager
1 Financial transfers are the net gain or loss for the postal operator, deriving from the difference between the actual terminal dues paid/received and the counterfactual terminal dues that would be paid/received in the absence of the UPU system of terminal dues. This concept is explained in detail in chapter 1.

EXECUTIVE SUMMARY 1. INTRODUCTION
2. THE UPU SYSTEM FOR TERMINAL DUES
3. FUTURE DEVELOPMENTS IN CROSS-BORDER LETTER POST FLOWS
4. IMPACT OF CHANGES TO TERMINAL DUES ON FINANCIAL TRANSFERS APPENDIX

EXECUTIVE SUMMARY

Executive summary
Terminal dues are payments between designated postal operators for the transport, sorting and delivery of cross-border letter post items in the destination country. These international tariffs are governed by the Universal Postal Union (UPU).
The compensation that designated postal operators receive from delivering inbound cross-border letter mail (i.e., the actual terminal dues) differs from the compensation that they would require in a situation without the UPU terminal dues system in place (i.e., the counterfactual terminal dues). This gives rise to financial transfers between designated postal operators around the world. Financial transfers can potentially create distortionary spill-over effects on national markets (e.g., compensation for postal operators’ losses funded by taxes). The financial transfer for each bilateral flow of cross-border letters is determined by the difference between the actual and the counterfactual terminal dues rate for that bilateral flow.
The UPU terminal dues rates are effective in cycles of four years. The current rates (in place from 1 January 2014 to 31 December 2017) were established by the UPU Convention adopted in Doha in 2012.
In September 2016, the UPU Congress in Istanbul set the path for the 2018 through 2021 cycle of UPU terminal dues. The agreements made in Istanbul build on the current system, but with adjustments to some key parameters. Perhaps most notably, the updated system separates terminal dues for small and large letters (P- and G-format items) from those of bulky letters and small packets (E-format items).
In this report, we quantify the financial transfers caused by the UPU terminal dues system with and without the changes agreed in Istanbul. We do this by comparing the actual terminal dues rates set out by the UPU Convention to a set of counterfactual terminal dues rates which reflect the prices that would have been paid without the UPU Convention in place.
Our results suggest that the changes agreed upon in Istanbul only have a minor impact on the total value of financial transfers created by the UPU terminal dues system. In our base case scenario, the total value of net financial transfers are estimated to SDR 2.2bn (corresponding to USD 3.1bn) in 2018 with the amended system in place. This is only 8 per cent lower than what would have been the case if the current system had remained in place (resulting in net financial transfers of SDR 2.4bn).
6
Total value of financial transfers applying current and updated system for UPU terminal dues in 2018
Source: Copenhagen Economics
2.401
2.216
-
500
1.000
1.500
2.000
2.500
3.000
Current System, in 2018 Updated System, in 2018
SDR, Million
-8%

A determining factor for the development of financial transfers over time is the development in cross-border mail volumes (in particular small packets containing products bought online). In order to quantify the total value of financial transfers over time, we therefore include in our analysis a forecast of the development of international letter volumes.
The results of our analysis show that, although the adjustments agreed in Istanbul may reduce the size of transfers slightly compared to the current system, they will not prevent transfers from growing with time. In fact, our base case scenario suggests a growth of financial transfers by 50 per cent 2018-2021. This corresponds to an average annual compound growth rate of 14 per cent.
Although previous reports and literature unequivocally point to the fact that small packets will grow as a result of growing e-commerce, there is uncertainty about the precise pace. In order to account for this uncertainty, we have created three scenarios for the future development in international letter mail volumes. The scenarios provide us with a range for the predicted total financial transfers created by the UPU system for terminal dues.
The resulting transfers range between SDR 2.1 bnand SDR 2.4 bn in 2018, growing to between SDR 2.8 bn and SDR 4 bn in 2021.
Financial transfers 2016-2021
Total financial transfers, by scenario of volume development
Source: Copenhagen Economics
Source: Copenhagen Economics
7
-
500
1.000
1.500
2.000
2.500
3.000
3.500
4.000
4.500
2018 2019 2020 2021
SDR, Million
Base case Extensive case Conservative case
-
500
1.000
1.500
2.000
2.500
3.000
3.500
2016 2017 2018 2019 2020 2021
SDR, Million
Current System Updated System

1INTRODUCTION
1.1 BACKGROUND 1.2 THE ASSIGNMENT AND OUR APPROACH

1.1 Background
THE UPU SYSTEM FOR TERMINAL DUESThe Universal Postal Union (UPU) is an intergovernmental organisation and a global forum for cooperation between governments on topics related to the postal sector and international postal services. The UPU was founded in 1874. At that time, the organisation included 21 member countries. Today, 220 countries and territories are part of the UPU.
Amongst other things, the UPU sets the rules for international mail exchanges between designated postal operators in its member countries. An essential part of this work concerns inter-governmental agreements governing terminal dues.
Terminal dues are the payments between designated postal operators for the transport, sorting, and delivery of cross-border letter post items in the destination country. They apply to all products classified as letter items, which is split into three groups: small letters (P), large letters (G)(sometimes referred to as “flats”), and bulky letters and small packets (E). The groups are defined by a set of minimum and maximum dimensions and weights.
Terminal dues affect all cross-border deliveries of letter mail either directly or indirectly by serving as a fall-back provision in the negotiation of bilateral agreements. As some cross-border letter post traffic grows, spurred by positive developments in e-commerce, these payments become increasingly important for postal operators. In 2015, a total of 3.4 billion cross-border letter post items were sent
globally 2 and cross-border e-commerce trade is expected to have a global compound annual growth rate (CAGR) of 29 per cent between 2014 and 2020 3.
UPU members revise the terminal dues rates every four years in a general congress and changes to the system must be agreed by a majority of UPU members. The last congress took place in Istanbul in September 2016, where the members agreed on a number of changes to the current system to be implemented in 2018.
Data on global letter post flows within and between regions demonstrates that the main flows of cross-border letter post have historically been between industrialised countries. Large volumes of cross-border letters multiply the impact of the regulated terminal dues rates, since they apply to more letters that need to be delivered. This suggests that designated postal operators in these countries would be most affected by any changes to the current level of terminal dues. However, with an increasing share of citizens in Western Europe and North America shopping at online marketplaces in Asia, the flow of cross-border letter mail from Asia to Western Europe and North America is increasing. As a result, designated operators in these countries are also significantly affected by any changes to the current terminal dues system.
Countries may agree on other terms than the UPU terminal dues rates. These bilateral agreements will in that case determine the actual compensation between those postal operators. In this report, we assume that all countries in our analysis apply UPU
terminal dues to all international letter mail (i.e., no application of bilateral or other multilateral agreements). This assumption is reasonable to assess the design of the current system and changes made to it for purposes of measuring the maximum financial transfers under the system currently and as modified. However, this assumption also likely overstates the actual financial transfers between regions and countries where bilateral and multilateral agreements govern international mail transactions.
2 UPU (2015) Research on Postal Markets3 Accenture (2016) Cross-Border Ecommerce 9

THE CONCEPT OF FINANCIAL TRANSFERSFinancial transfers emerge because the actual compensation that designated postal operators receive from delivering inbound cross-border letter mail (i.e., the actual terminal dues) differs from the compensation that they would require in a situation without the UPU terminal dues system in place (i.e., the counterfactual terminal dues). The distortion per letter sent (outbound) or received (inbound) is thus the difference between the actual and the counterfactual terminal dues rate.
Our analysis is based on a counterfactual terminal dues rate corresponding to 70 per cent of the price charged by the postal operator for end-to-end
delivery of domestic letter post items. Since most of the costs for mail delivery are incurred in the last-mile delivery phase, the 70 per cent is an approximation of the domestic price for last-mile delivery of a priority, single-piece letter.
The inbound effect is the difference between the actual terminal dues rate received by a designated postal operator and the counterfactual rate, aggregated for all inbound (import) letter mail volumes. The outbound effect is the difference between the actual terminal dues rate paid and the counterfactual rate, aggregated for all outbound (export) letter mail volumes. The sum of the inbound effect and the outbound effect corresponds to the net
effect, representing either a positive or negative net financial transfer for the designated postal operator in question.
QUANTIFICATION OF FINANCIAL TRANSFERSIn 2015, the Postal Regulatory Commission (PRC) asked Copenhagen Economics to quantify the size of financial transfers created by the UPU terminal dues system. Our analysis revealed an estimated total value of net financial transfers between 154 designated postal operators in the current terminal dues system of approximately 950m. special drawing rights4 (SDR) in 2014, corresponding to 1.4bn. USD.
The concept of financial transfers explained
Source: Copenhagen Economics
4 The amounts are expressed in SDR, which is also the currency that we will use in our analysis. In December 2014 1 SDR corresponded to approximately 1.46 USD according to the IMF 10
The figure and table to the right illustrate the concept of financial transfers. It provides an example calculation of the net effect for three countries (A, B, and C):• A has a high cost for last-mile delivery and is a net
exporter of cross-border letters,• B has a high cost for last-mile delivery and is a net
importer of cross-border letters,• C has a low cost for last-mile delivery and is a net
exporter of cross-border letters.The terminal due per kg is assumed to be 0.14 for the three countries and the counterfactual terminal dues are assumed to be 0.1 for country C and 0.5 for country A and B. Based on the mail volumes exchanged between the countries, the net effects are the following:� Country A: net loss of 80� Country B: net loss of 160� Country C: net gain of 240Note that the total loss equals the total gain, proving that the terminal dues system creates a pure transfer of money between designated postal operators.
Inbound effect Outbound effectNet effect
A
B-A: 400*(0.1-
0.5)=-160
C-A: 200*(0.1-
0.5)=-80
A-B: -400*(0.1-
0.5)=160
A-C: -200*(0,1-
0,1)=0
Loss:
80
B
A-B: 400*(0.1-
0.5)=-160
C-B: 400*(0.1-
0.5)=-160
B-A: -400*(0.1-
0.5)=160
B-C: -100*(0,1-
0,1)=0
Loss: 160
C
A-C: 300*(0.1-
0.1)=0
B-C: 100*(0.1-
0.1)=0
C-A: -200*(0.1-
0.5)=80
C-B: -400*(0,1-
0,5)=160
Gain:240

1.2 The assignment and our approach
THE ASSIGNMENTIn the most recent UPU Congress in Istanbul in September 2016, a number of changes were made to the UPU terminal dues system. These changes will come into effect in 2018 and may impact the financial transfers caused by the system. In fact, some changes agreed in Istanbul were de facto aimed at reducing these transfers.
In the study conducted on behalf of PRC in 2015, Copenhagen Economics quantified the value of the financial transfers and analysed the patterns of the distribution of positive and negative net transfers for different countries. Against the background of the recent changes to the terminal dues system, the PRC has asked Copenhagen Economics to update the model for calculating financial transfers from the UPU terminal dues.
The updated model takes into account the outcome of the UPU Congress in Istanbul. Furthermore, the PRC has asked for a scenario analysis based on a stylised forecast of letter volume development.
OUR APPROACHOur analysis is based on a seven-step approach where we:1. Collect and update the existing model with new
data, including updates on domestic postage rates and volumes.
2. Analyse necessary changes in the terminal dues model based on the outcome of the Istanbul congress.
3. Change model specifications according to changes agreed in Istanbul.
4. Run the model with the UPU system before and after Istanbul to estimate the effect of the changes of the Istanbul agreement on total transfers and individual countries.
5. Design scenarios for future outlook.6. Run the model with future scenarios to estimate
the effect on financial transfers.7. Discuss and interpret the results of our analysis.
Our approach is also depicted on the next page.
11

Illustration of our approach
5 An overview of the data used in the model can be found in the appendix. 12
Source: Copenhagen Economics
Existing model:Current system, 2014
data
Update of data in existing model:
Current system, new data5
Transfers in 2018 with current system and current volume
New model:New regulatory
system, new data
Transfers in 2018 with new system and
current volume
Effect of new system
New model:New system,
Applied on future scenarios
Transfers 2018-2021 with new system, including volume
forecast
Effect of market developments
Model
Input
Output
Result
New data on postal rates and volumes
Change of model specifications
Scenario analysis of postal volume development
1
2
3
4
5
7
6

2THE UNIVERSAL POSTAL UNION (UPU) SYSTEM FOR TERMINAL DUES
2.1 THE DESIGN OF THE UPU TERMINAL DUES SYSTEM2.2 CHANGES AGREED AT THE ISTANBUL CONGRESS2.3 IMPLICATIONS FOR THE ESTIMATION OF FINANCIAL TRANSFERS

2.1 The design of the UPU terminal dues system
THE TERMINAL DUES SYSTEM IS A TWO-TIER SYSTEMThe current UPU system for terminal dues is a two-tiered system dating back to 19896. It consists of six groups of countries belonging to two different systems: the target system and the transitional system.
The transitional system mainly applies to exchanges of international letter mail to, from, or between designated operators in countries traditionally considered “developing”. The target system mainlygoverns the exchange of letter post items between designated operators in countries and territories previously thought of as “industrialised”. In 2010, countries and territories classified as “developing” started to join the target system.
Countries in the transitional system can opt in to the target system, but not the other way around. Depending on when they joined the target system or when it is foreseen that they will join the target system, UPU members are currently divided into 6 groups: 1.1, 1.2, 2, 3, 4, and 5, see Table 2.1.
TERMINAL DUES RATES DEPEND ON THE GROUP TO WHICH THE SENDER AND RECEIVER BELONG The terminal dues received by a designated postal operator for the last-mile handling of cross-border letter post depend on the terminal dues group to which it belongs as well as on the terminal dues group to which the sending postal operator belongs. As of 2016, countries or territories that are part of the target system (groups 1.1, 1.2, 2, and 3) pay each other target rates, while terminal dues to, from, and between countries or territories in the transitional system (groups 4 and 5) are paid at transitional rates, see Table 2.2.
Table 2.1: Universal Postal Union groups
Table 2.2: Terminal dues rates type by origin and destination group
Note: UPU countries and territories are divided into six groups based on a postal development indicator (PDI), which comprises a macroeconomic component (gross national income, GNI, per capita) and a postal-specific component (normal unit cost per letter
based on full-time staff). The data are from 2014.Source: UPU (2015) Statistics and Accounting Guide,
http://www.upu.int/uploads/tx_sbdownloader/guideTerminalDuesStatisticsAccountingEn.pdf
Source: UPU (2015) Statistics and Accounting Guide, http://www.upu.int/uploads/tx_sbdownloader/guideTerminalDuesStatisticsAccountingEn.pdf
6 WIK (2010) Study on the External Dimension of the EU Postal Acquis, page 218 14
GroupNumber of countries and
territories in the groupDescription
1.1 41 Countries in target system prior to 2010
1.2 13 Joined target system in 2010
2 24 Joined target system in 2012
3 39 Joined target system in 2016
4 53 Apply transitional system rates
5 50 Apply transitional system rates
Paying country or territory
(origin)Receiving country (destination) Rate Paid
Target
Target Target
Transition Transition
Transition
Target Transition
Transition Transition

Table 2.3: Schedule of terminal dues rates
Source: UPU (2017) Statistics and Accounting Guide http://www.upu.int/uploads/tx_sbdownloader/guideTerminalDuesStatisticsAccountingEn.pdf
15
Actual terminal dues rates are calculated based on the UPU methodology set out in the 25th UPU Congress for the period of 2014 through 2017.
THE TRANSITIONAL SYSTEMFor the transitional system, the UPU prescribes rates (for delivering inbound letter mail) that have both per item and per kilogram components. These per item and per kilogram rates for the transitional system are equal to the minimum level (i.e. the floor rate) of the target system for any given year.
In particular, terminal dues rates are calculated as a fixed rate per kilogram if the total inbound flow from a certain country is less than 75 tons per annum. This is done by assuming an average number of items per kilogram of mail and setting one per kilogram rate for transition countries.
If the total inbound flow from a certain country is above 75 tons per annum, a fixed per-item rate is applied in combination with a fixed per-kilogram rate.
THE TARGET SYSTEMFor the target system, the rates (for delivering inbound letter post) are based on 70 per cent of the domestic tariff for a 20-gram priority small letter and a 175-gram priority large letter in the destination country, though subject to caps and floors (per item and per kilogram). The level of the floors and caps depends on group classification (1.1, 1.2, 2, or 3). There is also a limit depending on the size of mail flows where a fixed per kilogram rate will apply if the total inbound mail flow is less than 75 tons.
In practice, however, caps and floors are so close toeach other that the terminal dues received by target countries are often a fixed rate that is not aligned with their domestic tariffs.
The schedule of terminal dues rates applicable to the different groups is laid out in Table 2.3. In addition, terminal dues in the target system are adjusted based on the quality of service of mail delivery.
Mail flow Terminal dues 2017, SDR
Intra group 1.1Cap: 2.507/kg + 0.321/item (<75 tons: 6.249/kg)
Floor: 1.729/kg + 0.221/item (<75 tons: 4.716/kg)
Intra group 1.2 + between group 1.1. and 1.2
Cap: 1.954/kg + 0.249/item (<75 tons: 6.249/kg)
Floor: 1.729/kg + 0.221/item (<75 tons: 4.716/kg)
To, from, and between groups 3, 4, and 5
<75 tons: 4.432/kg
>75 tons: 1.729/kg + 0.221/item

CALCULATION OF THE ACTUAL TARGET RATESIn order to calculate the current terminal dues ratesfor countries in the target system, the UPU makesuse of domestic prices which are later related to pre-defined caps and floors. We need information abouttwo reference tariffs:• The tariff for a 20 g small (P) priority letter post
item in the domestic service, converted into SDR(DP1)
• The tariff for a 175 g large (G) priority letter-postitem in the domestic service, converted into SDR(DP2)
According to the UPU Convention, the terminal dues rate per item before caps and floors is 70 per cent times the tariff of the 0-20g small letter (DP1) times 0.01 (10 grams assumed to be the average weight for a small letter7). In order to calculate per-kilogram rates, as a first step, a linear relationship between weights and tariffs is assumed and calculated. These two rates (per item and per kilogram) are then applied to an item of average weight (the reference weight is assumed by the UPU to be 81 grams in the current system), in order to get the uncapped terminal dues rate for an average item, see Figure 2.1.
If the uncapped terminal dues rates for the reference weight are higher than the cap, the capped rates will be used. If the uncapped terminal dues rates for the reference weight are lower than the floor, the floor rates will be used. Finally, if the uncapped terminal dues rates for the reference weight are between the cap and the floor, then a target rate is calculated based on the uncapped terminal dues.
7 UPU (2017) Statistics and Accounting Guide, page 6 16
Figure 2.1: Calculation of uncapped terminal dues rate
Source: Copenhagen Economics; UPU (2015) Statistics and Accounting Guide
0
0,2
0,4
0,6
0,8
1
1,2
1,4
0 20 40 60 80 100 120 140 160 180 200
SDR
Weight, gram
The target rate is calculated by multiplying the per item and per kilogram floor rates by a ratio of uncapped revenue and floor revenue. This means that if domestic tariffs in one country are higher than the floor rates, that postal operator will get a higher add-on to the floor rate (but not higher than the cap).
The target terminal dues rates per kilogram are thus calculated as:
�� = 70%×� × �� − 0.01 + ���
���� ×�� + ����× ����
Similarly, the target terminal dues rates per item in are calculated as:
�� = 70%×� × �� − 0.01 + ���
���� ×�� + ����× ����
where, M = constant rate of change = (DP2-DP1) / (0.175-0.01) (this is the slope in the diagram in Figure 2.1) DP1 and DP2= domestic postage rates without VAT for 0-20g P and 100-250g G Wavg = the average weight of a letter post item, set at 81g Rwfl = floor rate per kilogramRifl = floor rate per item
For each bilateral mail flow, the effective rate will depend on (i) the group to which a postal operator belongs, (ii) from which country the inbound mail flow is coming, and (iii) whether or not the terminal dues for the bilateral flow in question is subject to a cap or floor.

2.2 Changes agreed at the Istanbul Congress
The terminal dues rates are decided upon at the UPU Congress for inclusion in the Universal Postal Convention. The Convention was last revised in September 2016 in Istanbul. The 2016 Congress in Istanbul set the path for the 2018 through 2021 cycle of UPU terminal dues. The agreements made build on the current system, but with adjustments to some key parameters. A comparison of key parameters between the current system and the updated system is provided in Table 2.4.
One important change agreed in Istanbul was the introduction of a new classification of E-format shipments. Currently, the E-format is defined as “bulky letters” and is characterized only by its physical specifications (not by the content of the shipment). After 2018, there will be a formal recognition of the fact that some E-format shipments contain documents (defined as bulky letters) whereas others contain goods (defined as small packets). An important reason for this change is the growth in e-commerce which is calling for more shipments containing goods to be sent cross-border.Since these shipments are usually more expensive to handle in the last mile compared to shipments containing documents, the terminal dues rates that postal operators receive as compensation for last-mile delivery will be especially important for these shipments. However, concerning the terminal dues charged/received for E-format shipments in the 2018-21 cycle, no distinction will be made between bulky letters and small packets.
Perhaps the most important feature of the updated system is the practical separation of small and large
letters (P and G) from bulky letters and small packets (E).
We have identified three key aspects of the updated system with implications for the financial impact of the system from 2018:1. New target system formula including a
separate ‘rate line’ for bulky letters and small packets
2. New structure and level of caps and floors for bulky letters and small packets
3. Higher annual increase in the caps for bulky letters and small packets
The classification of countries has been consolidated into four groups instead of the current six. This change reflects the fact that the rates paid by countries in groups 1.2 and 2, and separately in 4 and 5, gradually transition towards the rates applied among industrialised countries in group 1.1 at the same level. Furthermore, the UPU Congress approved an Integrated Product Plan (IPP) that may have future implications for terminal dues, see Box 2.1.
SEPARATE RATE LINE FOR BULKY LETTERS AND SMALL PACKETS The updated system still builds on a target formula that departs from domestic postage rates. Instead of having the same formula in the target system for all letter post formats, the updated system now separates small letters (P-format) and large letters (G-format) on the one hand, and bulky letters and small packets (E-format) on the other. The new rate structure for bulky letters and small packets is
“flatter”. This implies a lower compensation per kilogram of mail but a higher compensation per number of items as compared to the current system. This change reflects the fact that bulky letters and small packets, compared to letters, are more expensive to handle at lower weights.
The key parameter used to adjust this feature is the “item-to-kilo ratio”. The item-to-kilo ratio is commonly expressed as a percentage, but is perhaps more intuitively described as a weight. It is the weight that, if multiplied by a specific per-kilo rate, adds the same amount as the corresponding per-item rate. Mathematically, it is simply the per-item rate divided by the per-kilo rate. It therefore establishes the rate structure for bulky letters and small packets in the target system. Whereas the item-to-kilo ratio is 0.128 for all products in the current system, it will be 0.445 for bulky letters and small packets in the new system and remain the same for small and large letters.
NEW LEVELS OF CAPS AND FLOORS FOR SMALL PACKETS Going from the current system to the updated version in 2018 will also mean that the level of caps and floors that apply will shift.
For bulky letters and small packets, the cap per kilogram will be 37 per cent lower going from 2017 to 2018, whereas the per-item cap is 120 per cent higher. This means that the caps also have a flatter rate structure for bulky letters and small packets.
17
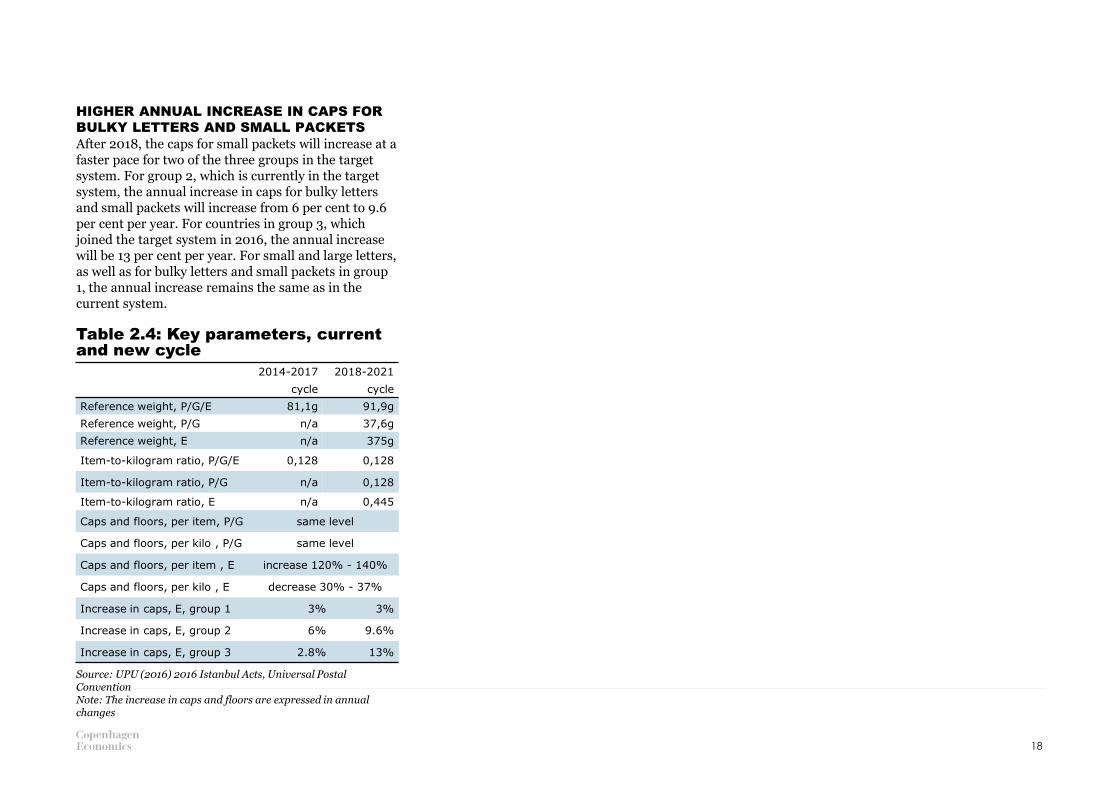
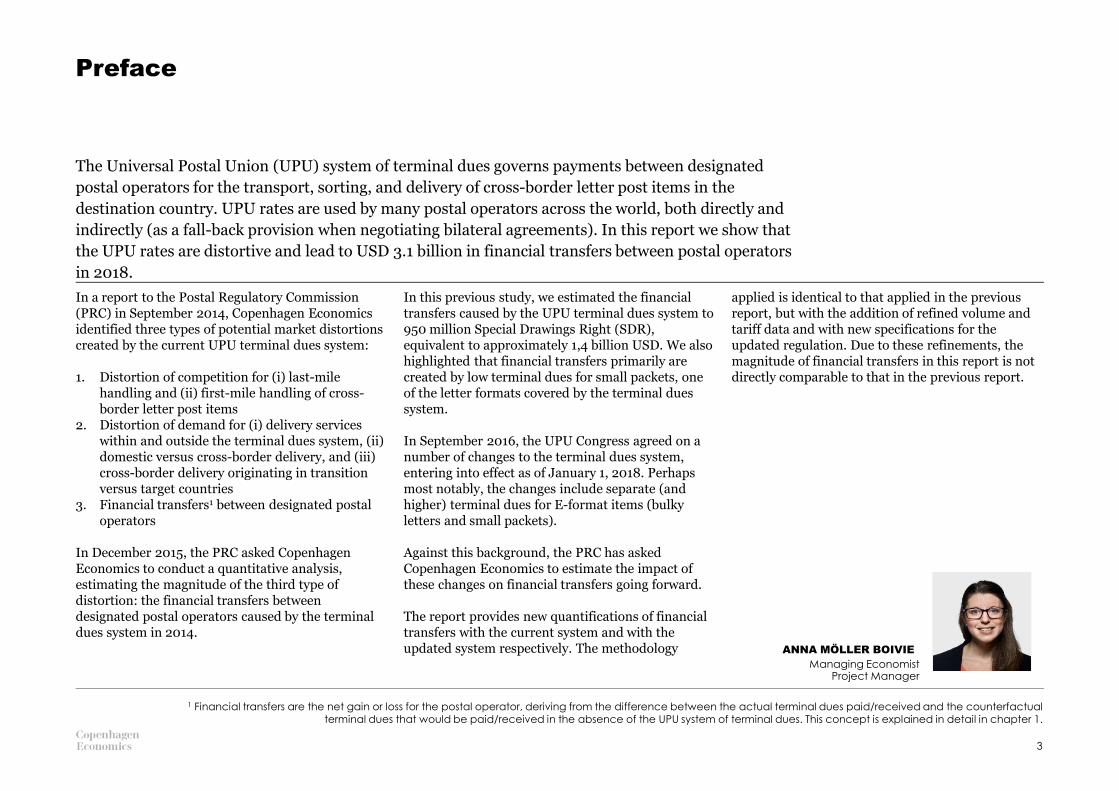
Table 2.4: Key parameters, current and new cycle
18
2014-2017
cycle
2018-2021
cycle
Reference weight, P/G/E 81,1g 91,9g
Reference weight, P/G n/a 37,6g
Reference weight, E n/a 375g
Item-to-kilogram ratio, P/G/E 0,128 0,128
Item-to-kilogram ratio, P/G n/a 0,128
Item-to-kilogram ratio, E n/a 0,445
Caps and floors, per item, P/G same level
Caps and floors, per kilo , P/G same level
Caps and floors, per item , E increase 120% - 140%
Caps and floors, per kilo , E decrease 30% - 37%
Increase in caps, E, group 1 3% 3%
Increase in caps, E, group 2 6% 9.6%
Increase in caps, E, group 3 2.8% 13%
HIGHER ANNUAL INCREASE IN CAPS FOR BULKY LETTERS AND SMALL PACKETSAfter 2018, the caps for small packets will increase at a faster pace for two of the three groups in the target system. For group 2, which is currently in the target system, the annual increase in caps for bulky letters and small packets will increase from 6 per cent to 9.6 per cent per year. For countries in group 3, which joined the target system in 2016, the annual increase will be 13 per cent per year. For small and large letters, as well as for bulky letters and small packets in group 1, the annual increase remains the same as in the current system.
Source: UPU (2016) 2016 Istanbul Acts, Universal Postal ConventionNote: The increase in caps and floors are expressed in annual changes
BOX 2.1: INTEGRATED PRODUCT PLAN Besides the changes regarding terminal dues discussed above, another reform, the Integrated Product Plan (IPP), was decided upon by the Istanbul congress. Currently, the first step of the plan is approved and the second step still remains to be agreed on.
The aim of the IPP is to develop a fully integrated portfolio of products (letter post items, parcel post items and EMS) and a suitable remuneration system that cover the costs of delivering the products in the last mile.
As part of the implementation of step 1, the first stage on the route to integration will be to introduce a documents and goods classification. Letter-post formats P and G and bulky letters (E-format) will be
restricted to documents while small packets (E-format) can contain only goods. Parcel-post items and Express Mail Service (EMS) will remain unchanged.
The potential impact of the IPP on the financial transfers caused by the terminal dues system lies precisely in the separation of documents and goods. With the current definition of the E-format, small packets containing goods are treated identically to bulky letters containing documents, see illustration below. As of 2018, based on the IPP, this will no longer be the case.
The first step is aimed to have mainly conceptual implications and bring only minimal operational changes for designated postal operators.8
In 2018, the UPU will hold an extraordinary mid-term Congress that aims to consider an updated version of the IPP that includes proposals relating to the remuneration system. These proposals will serve as a basis for implementation of the second step of the IPP in 2020.
The precise implications for the terminal dues system and the associated financial transfers will depend on how the IPP is implemented and executed. The small packets play an important role in the international letter post system and will be a key factor also in the future.
Source: UPU (2017) 26th Congress. Integrated Product Plan (IPP) 2017–2020. Congress–Doc 39.Rev 1
8 UPU (2017) 26th. Integrated Product Plan (IPP) 2017–2020. Congress. Congress–Doc 39.Rev . Page 2 19
Non-priority
&
Priority
Express
Letter-post items
Express Mail Service
Parcels
Small Packets
Bulky Letters
ELargeLetters
Small Letters
P G
Documents Goods
2.3 Implications for the estimation of financial transfers
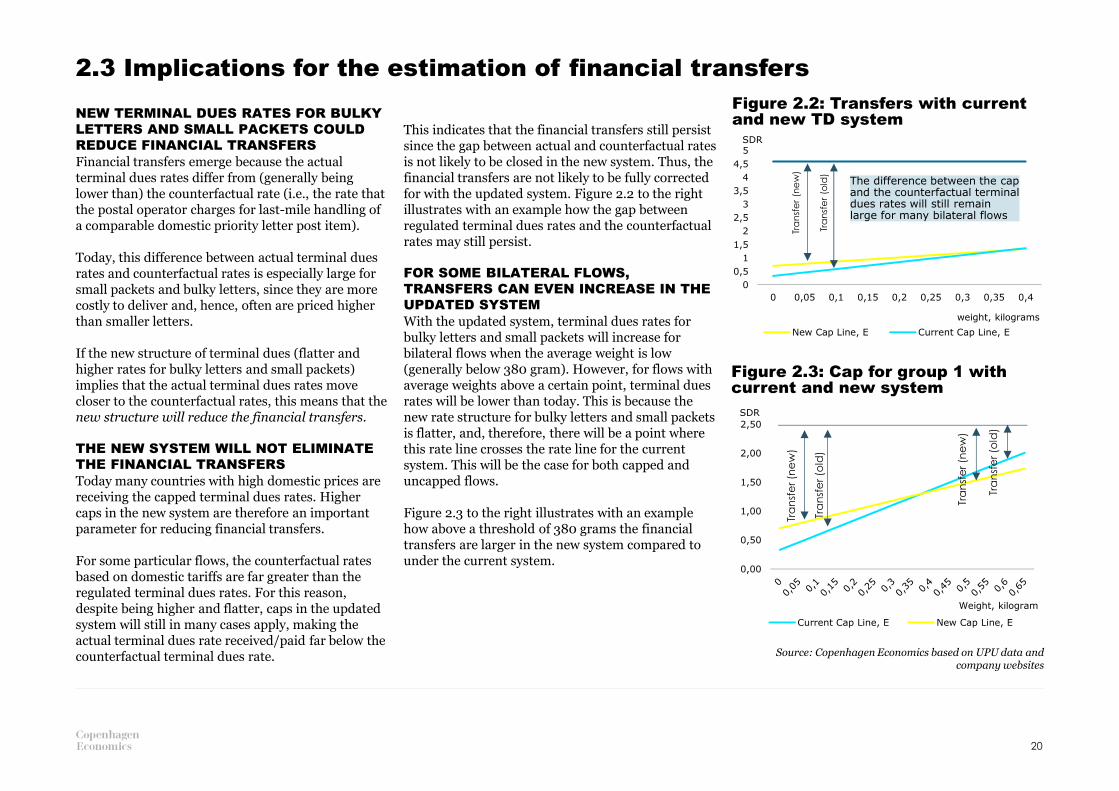
NEW TERMINAL DUES RATES FOR BULKY LETTERS AND SMALL PACKETS COULD REDUCE FINANCIAL TRANSFERSFinancial transfers emerge because the actual terminal dues rates differ from (generally being lower than) the counterfactual rate (i.e., the rate that the postal operator charges for last-mile handling of a comparable domestic priority letter post item).
Today, this difference between actual terminal dues rates and counterfactual rates is especially large for small packets and bulky letters, since they are more costly to deliver and, hence, often are priced higher than smaller letters.
If the new structure of terminal dues (flatter and higher rates for bulky letters and small packets) implies that the actual terminal dues rates move closer to the counterfactual rates, this means that the new structure will reduce the financial transfers.
THE NEW SYSTEM WILL NOT ELIMINATE THE FINANCIAL TRANSFERSToday many countries with high domestic prices are receiving the capped terminal dues rates. Higher caps in the new system are therefore an important parameter for reducing financial transfers.
For some particular flows, the counterfactual rates based on domestic tariffs are far greater than the regulated terminal dues rates. For this reason, despite being higher and flatter, caps in the updated system will still in many cases apply, making the actual terminal dues rate received/paid far below the counterfactual terminal dues rate.
This indicates that the financial transfers still persist since the gap between actual and counterfactual rates is not likely to be closed in the new system. Thus, the financial transfers are not likely to be fully corrected for with the updated system. Figure 2.2 to the right illustrates with an example how the gap between regulated terminal dues rates and the counterfactual rates may still persist.
FOR SOME BILATERAL FLOWS, TRANSFERS CAN EVEN INCREASE IN THE UPDATED SYSTEMWith the updated system, terminal dues rates for bulky letters and small packets will increase for bilateral flows when the average weight is low (generally below 380 gram). However, for flows with average weights above a certain point, terminal dues rates will be lower than today. This is because the new rate structure for bulky letters and small packets is flatter, and, therefore, there will be a point where this rate line crosses the rate line for the current system. This will be the case for both capped and uncapped flows.
Figure 2.3 to the right illustrates with an example how above a threshold of 380 grams the financial transfers are larger in the new system compared to under the current system.
Figure 2.2: Transfers with current and new TD system
Figure 2.3: Cap for group 1 with current and new system
Source: Copenhagen Economics based on UPU data and company websites
20
0
0,5
1
1,5
2
2,5
3
3,5
4
4,5
5
0 0,05 0,1 0,15 0,2 0,25 0,3 0,35 0,4
SDR
weight, kilograms
New Cap Line, E Current Cap Line, E
The difference between the cap and the counterfactual terminal dues rates will still remain large for many bilateral flows
Tra
nsf
er
(old
)
Tra
nsf
er
(ne
w)
0,00
0,50
1,00
1,50
2,00
2,50
SDR
Weight, kilogram
Current Cap Line, E New Cap Line, E
Tra
nsf
er (o
ld)
Tra
nsf
er (n
ew
)
Tra
nsf
er (o
ld)
Tra
nsf
er (n
ew
)

3FUTURE DEVELOPMENTS IN INTERNATIONAL LETTER POST FLOWS
3.1 HISTORICAL DEVELOPMENT IN CROSS-BORDER MAIL VOLUMES3.2 METHODOLOGY FOR VOLUME PROJECTIONS3.3 SCENARIOS FOR FUTURE DEVELOPMENT IN INTERNATIONAL LETTER VOLUMES

Introduction and main findings
In this chapter, we show how future mail volume estimates are incorporated into our model of financial transfers. In order to assess the impact of the regulatory changes in the coming terminal dues cycle (2018-2021) we have to develop different scenarios for the future development of cross-border letter volumes. Since the updated regulatory framework for the terminal dues separates small and large letters from bulky letters and small packets, we need to assess the volume development for the different letter formats over time. We consider the development from 2016 (our base year for volume data) to 2021 (the last year of the coming terminal dues cycle).
Our forecast of letter volumes 2016-2021 consists of two steps. First, we analyse available data on historical mail volume development until 2016. We find that international mail volumes have had a negative trend overall, mainly as a result of electronic substitution. However, we also find that part of the international letter mail volume, namely bulky letters and small packets, have been increasing rapidly in recent years due to increased e-commerce. Second, we incorporate projections of e-substitution and cross-border e-commerce to estimate future volumes for use in three scenarios. Figure 3.1 shows our estimated base case development of cross-border mail volumes for the three different letter mail formats between 2016 and 2021.
Figure 3.1: Development of international letter mail, base case
Source: Copenhagen Economics based on modelling data
22
The growth in the volumes of bulky letters and small packets is likely to differ across geographical regions. Capturing these dynamics is important since it will impact the financial transfers between countries located in different regions.
Our results demonstrate a shift in cross-border letter delivery patterns with a larger share of international letters being delivered from the Asia-Pacific region and a smaller relative share being delivered from industrialised countries in Western Europe and North America. This trend is largely driven by the growth in e-commerce and is expected to continue in the future.
0
500
1000
1500
2000
2500
3000
3500
2016 2017 2018 2019 2020 2021
Volume, Million
P G E

3.1 Historical development in cross-border mail volumes
LETTER VOLUMES ARE DECLINING, LARGELY DUE TO ELECTRONIC SUBSTITUTION
Between 1990 and 2015, international letter mail volumes declined by more than 10 per cent, see Figure 3.2. Although this development is driven by increased substitution to electronic means of communication, there is no evidence that industrialised countries with more mature online infrastructure have experienced higher rates of decline in letters than developing countries. In fact, evidence indicates that developing countries have experienced a proportionally higher decline in mail volumes, partly due to a steep increase in technology adoption.
Whereas the development differs across regions with the largest relative declines in the Arab countries and in the Asia-Pacific region, see Figure 3.3, the average development in letter mail volumes 2010-2015 was -2 per cent per year. We take this as a base line for our scenarios for future volume developments for small and large letters, assuming a similar pattern in the future.
Figure 3.2: Global cross-border letter volume development, 1990-2015
Figure 3.3: Change in outbound cross-border letter volume, 2010-2015
Source: UPU (2016) Research on Postal MarketsNote: The index shows the development where 1990 is normalized to 100
Source: UPU (2016) Research on Postal Markets
23
80
82
84
86
88
90
92
94
96
98
100
102
1990 1995 2000 2005 2010 2015
Volume, index
-7,9%
-1,9%
-10,6%
-5,8%
-17,4%
-2,9%
Africa Latin America Asia-Pacific
Eastern Europe
and CIS Arab countries
Industrialized
countries

PARCELS ARE INCREASING RAPIDLY DUE TO E-COMMERCEAt the same time as international letter mail volumes have been falling, international parcel mail volumes have increased substantially – a trend largely driven by the increase in cross-border e-commerce, see Figure 3.4
This growth is not homogenously distributed across regions. Whereas there has been a rapid increase in the international flow of parcels from countries in the Asia-Pacific region to countries in Western Europe and North America, countries in the Middle East region and in Africa have so far not seen the same growth of e-commerce as the rest of the world.9
CROSS-BORDER E-COMMERCE GOODS ARE OFTEN DELIVERED IN THE MAIL STREAMSince many of the items bought online are small in size and of low weight, these are often not delivered as parcel post, but instead as letter post (small packets). In fact, the UPU estimates that 80 per cent of “mail items” generated by e-commerce weight less than 2 kg and are processed in letter post streams.10
The fact that e-commerce items are shipped in the letter mail stream is reflected in a significant increase in the international volumes of small packets between 2005 and 2015. Thus, whereas the volumes of small letters (P-format) and large letters (G-format) in the international mail flows have declined over the past ten years, the volumes of small packets (E-format) have increased, see Figure 3.5.
Figure 3.4: International parcels, globally
Figure 3.5: International letter volume by letter type
Note: 1990 = 100Source: UPU(2016) Research on Postal Markets
Source: UPU(2016) Research on Postal Markets
9 UPU (2016) Research on Postal Martkets, page 21; 10 UPU (2017) About Letter Post Developmenthttp://www.upu.int/en/activities/letter-post-development/about-letter-post-development.html 24
90
95
100
105
110
115
1990 1995 2000 2005 2010 2015
Volume, index
00,20,40,60,8
11,21,41,61,8
Transactions Correspondence Direct Mail Printed Matters Small Packets
P G E
Volume, Billion
2005 2015
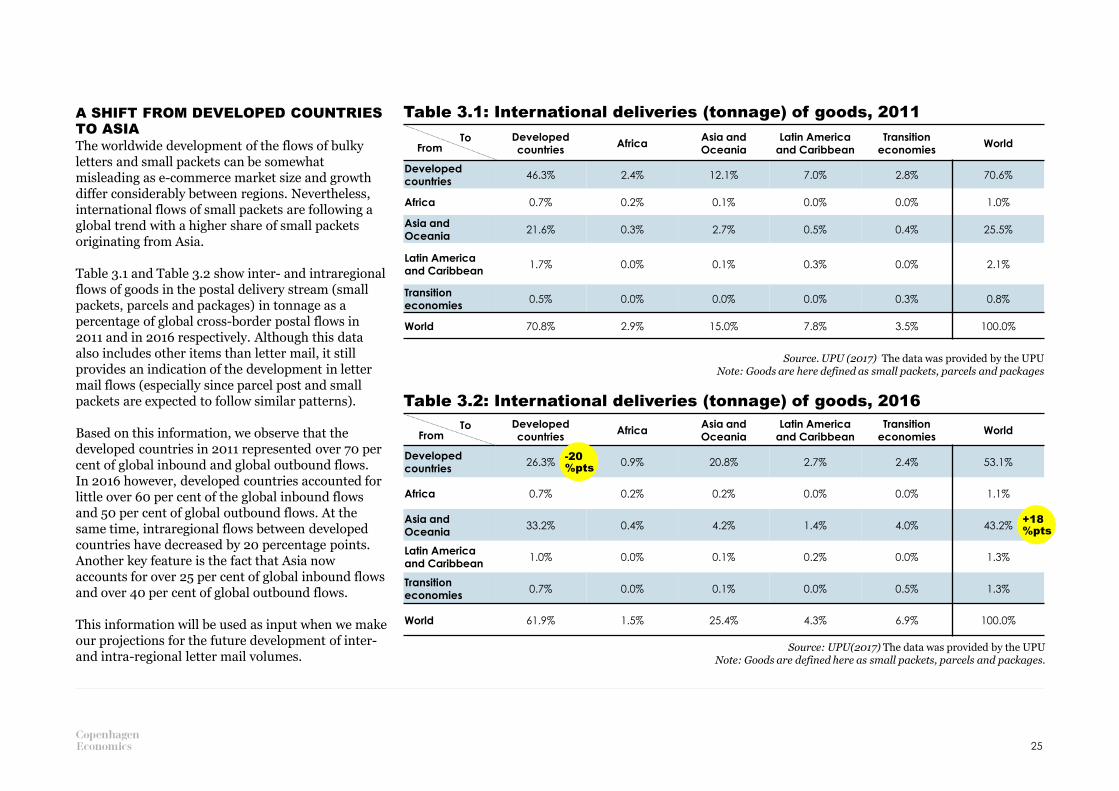
A SHIFT FROM DEVELOPED COUNTRIES TO ASIA The worldwide development of the flows of bulky letters and small packets can be somewhat misleading as e-commerce market size and growth differ considerably between regions. Nevertheless, international flows of small packets are following a global trend with a higher share of small packets originating from Asia.
Table 3.1 and Table 3.2 show inter- and intraregional flows of goods in the postal delivery stream (small packets, parcels and packages) in tonnage as a percentage of global cross-border postal flows in 2011 and in 2016 respectively. Although this data also includes other items than letter mail, it still provides an indication of the development in letter mail flows (especially since parcel post and small packets are expected to follow similar patterns).
Based on this information, we observe that the developed countries in 2011 represented over 70 per cent of global inbound and global outbound flows. In 2016 however, developed countries accounted for little over 60 per cent of the global inbound flows and 50 per cent of global outbound flows. At the same time, intraregional flows between developed countries have decreased by 20 percentage points. Another key feature is the fact that Asia now accounts for over 25 per cent of global inbound flows and over 40 per cent of global outbound flows.
This information will be used as input when we make our projections for the future development of inter-and intra-regional letter mail volumes.
Table 3.1: International deliveries (tonnage) of goods, 2011
Table 3.2: International deliveries (tonnage) of goods, 2016
Source. UPU (2017) The data was provided by the UPUNote: Goods are here defined as small packets, parcels and packages
Source: UPU(2017) The data was provided by the UPUNote: Goods are defined here as small packets, parcels and packages.
Developed
countriesAfrica
Asia and
Oceania
Latin America
and Caribbean
Transition
economiesWorld
Developed
countries 26.3% 0.9% 20.8% 2.7% 2.4% 53.1%
Africa 0.7% 0.2% 0.2% 0.0% 0.0% 1.1%
Asia and
Oceania 33.2% 0.4% 4.2% 1.4% 4.0% 43.2%
Latin America
and Caribbean 1.0% 0.0% 0.1% 0.2% 0.0% 1.3%
Transition
economies 0.7% 0.0% 0.1% 0.0% 0.5% 1.3%
World 61.9% 1.5% 25.4% 4.3% 6.9% 100.0%
25
Developed
countriesAfrica
Asia and
Oceania
Latin America
and Caribbean
Transition
economiesWorld
Developed
countries 46.3% 2.4% 12.1% 7.0% 2.8% 70.6%
Africa 0.7% 0.2% 0.1% 0.0% 0.0% 1.0%
Asia and
Oceania 21.6% 0.3% 2.7% 0.5% 0.4% 25.5%
Latin America
and Caribbean 1.7% 0.0% 0.1% 0.3% 0.0% 2.1%
Transition
economies 0.5% 0.0% 0.0% 0.0% 0.3% 0.8%
World 70.8% 2.9% 15.0% 7.8% 3.5% 100.0%
-20 %pts
+18 %pts
FromTo
FromTo
3.2 Methodology for volume projections
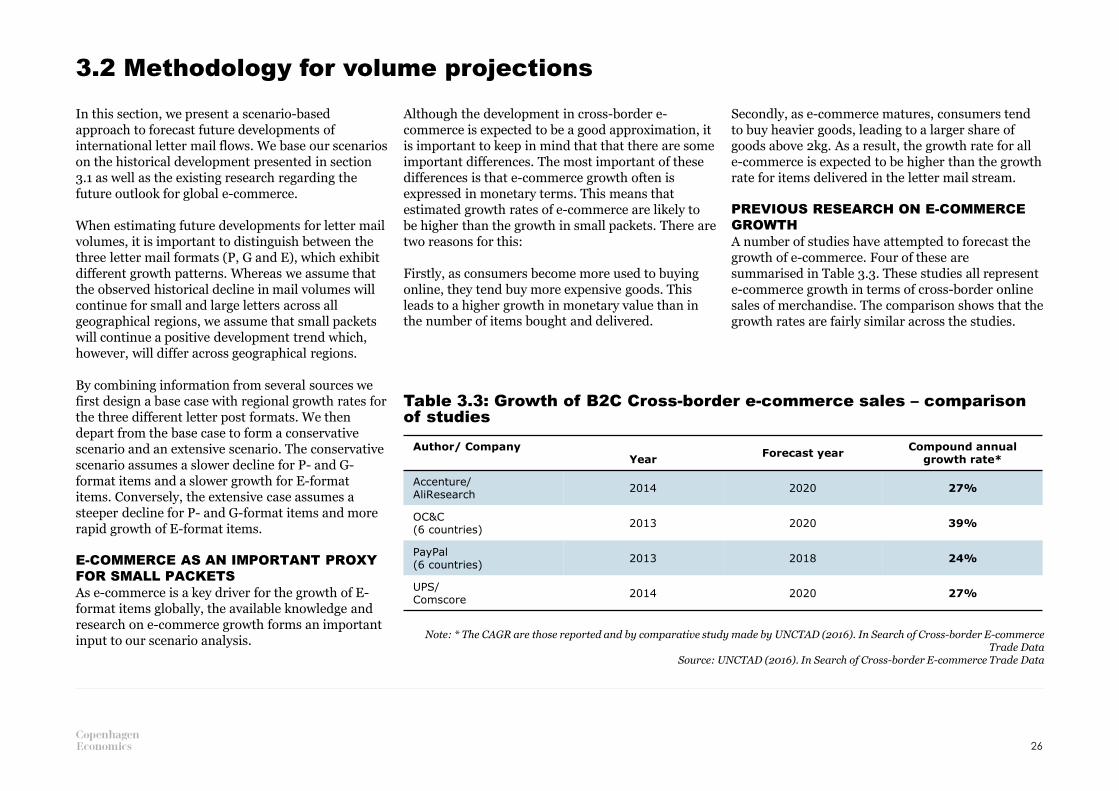
Table 3.3: Growth of B2C Cross-border e-commerce sales – comparison of studies
Note: * The CAGR are those reported and by comparative study made by UNCTAD (2016). In Search of Cross-border E-commerce Trade Data
Source: UNCTAD (2016). In Search of Cross-border E-commerce Trade Data
26
In this section, we present a scenario-based approach to forecast future developments of international letter mail flows. We base our scenarios on the historical development presented in section 3.1 as well as the existing research regarding the future outlook for global e-commerce.
When estimating future developments for letter mail volumes, it is important to distinguish between the three letter mail formats (P, G and E), which exhibit different growth patterns. Whereas we assume that the observed historical decline in mail volumes will continue for small and large letters across all geographical regions, we assume that small packets will continue a positive development trend which, however, will differ across geographical regions.
By combining information from several sources we first design a base case with regional growth rates for the three different letter post formats. We then depart from the base case to form a conservative scenario and an extensive scenario. The conservative scenario assumes a slower decline for P- and G-format items and a slower growth for E-format items. Conversely, the extensive case assumes a steeper decline for P- and G-format items and more rapid growth of E-format items.
E-COMMERCE AS AN IMPORTANT PROXY FOR SMALL PACKETSAs e-commerce is a key driver for the growth of E-format items globally, the available knowledge and research on e-commerce growth forms an important input to our scenario analysis.
Author/ CompanyYear
Forecast yearCompound annual
growth rate*
Accenture/AliResearch
2014 2020 27%
OC&C(6 countries)
2013 2020 39%
PayPal(6 countries)
2013 2018 24%
UPS/Comscore
2014 2020 27%
Although the development in cross-border e-commerce is expected to be a good approximation, it is important to keep in mind that that there are some important differences. The most important of these differences is that e-commerce growth often is expressed in monetary terms. This means that estimated growth rates of e-commerce are likely to be higher than the growth in small packets. There are two reasons for this:
Firstly, as consumers become more used to buying online, they tend buy more expensive goods. This leads to a higher growth in monetary value than in the number of items bought and delivered.
Secondly, as e-commerce matures, consumers tend to buy heavier goods, leading to a larger share of goods above 2kg. As a result, the growth rate for all e-commerce is expected to be higher than the growth rate for items delivered in the letter mail stream.
PREVIOUS RESEARCH ON E-COMMERCE GROWTH A number of studies have attempted to forecast the growth of e-commerce. Four of these are summarised in Table 3.3. These studies all represent e-commerce growth in terms of cross-border online sales of merchandise. The comparison shows that the growth rates are fairly similar across the studies.
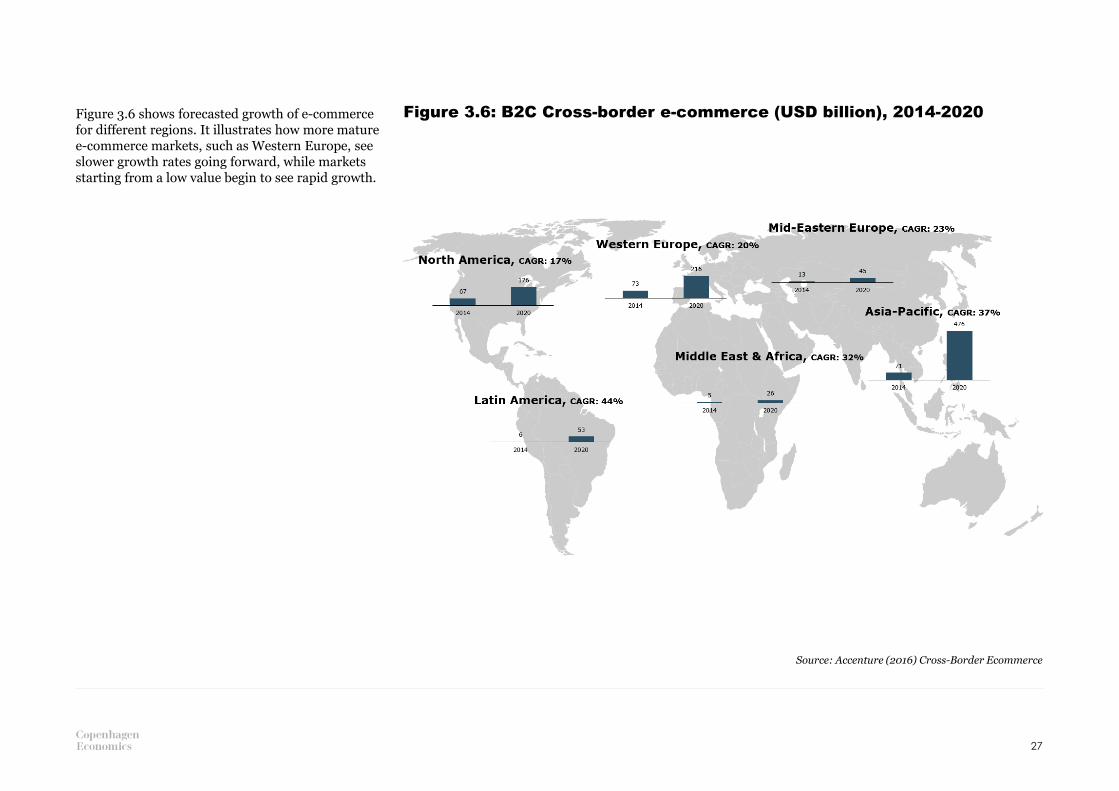
Figure 3.6 shows forecasted growth of e-commerce for different regions. It illustrates how more mature e-commerce markets, such as Western Europe, see slower growth rates going forward, while markets starting from a low value begin to see rapid growth.
Figure 3.6: B2C Cross-border e-commerce (USD billion), 2014-2020
Source: Accenture (2016) Cross-Border Ecommerce
27

5. THE GROWTH RATES BETWEEN GROUPS ARE CALCULATED FROM TOTAL IMPORTS AND EXPORTS PER REGION AND INDIVIDUAL WEIGHTSBy combining several sources we can now form our estimates of annual growth rates from and to each group. By weighting by the volumes estimated by our model, each row and column must now average the total export and import flows respectively.
In other words, because we know a and c in the equation above and symmetrically for the import flows, we can derive the growth rates for each individual group-to-group flow.
Note: *Details of the specific countries belonging to each group can be found in appendix C.
28
In the following, we outline how we have determined the annual growth rates for E-format items in our scenarios. We do this in five steps.
1. Organize countries into four groups2. Estimate total average growth rates for inbound
small packets3. Estimate total average growth rates for outbound
small packets4. Estimate volumes of individual flows5. Derive growth rates of individual flows
1. THE COUNTRIES ARE ORGANIZED INTO FOUR GROUPS*E-commerce exporters: developed economies, primarily in Asia. These e-commerce markets are characterized by large outbound flows. Industrialised countries: developed economies with mature e-commerce markets.Transition economies: emerging economies, largely consisting of countries within the OECD. Developing countries: developing countries with less developed e-commerce sectors.
For an exact presentation of which countries are included in each group, see appendix C.
2. THE TOTAL INBOUND GROWTH RATESE-commerce development is used as a proxy for the flow of small packets.
Mature e-commerce markets such as North America and Western Europe buy more expensive items online. Therefore any growth rate measured in monetary values will be higher than if measured in number of items shipped.
3. THE TOTAL OUTBOUND GROWTH RATESWhereas emerging economies in Asia, such as China and India, are expected to grow at a fast pace, Industrialised countries in North America and Western Europe already have high outbound flows and will not growth very fast in relative terms. Symmetrically, transitional economies and developing countries do not have large outbound flows and are therefore expected to see significant growth rates in relative terms.
4. VOLUMES ARE USED TO DETERMINE THE INDIVIDUAL FLOWS’ GROWTH RATESTo determine the growth of individual flows between country groups we rely on information about each country group’s share of global mail flows, as used in our model.
The individual inter-regional growth rates (inbound and outbound) are multiplied by their share of global (inbound and outbound) mail flows. This calculation is repeated across all regions and provides us with the total growth rate of inbound and outbound mail flows for a region.
For example, to arrive at the total growth rate of Industrialised countries’ outbound volumes, the growth rates of flows going from these countries to the other regions are multiplied by the respective shares of outbound flows that goes to each group and then summed across all regions. More detailed tables with the results for each group-to-group flow are reported in appendix C.
Export growth rate, Industrialised
countries
Growth rate of flowfrom
Industrialisedto [group]
% group export going
to [group]∑
a b c
3.3 Scenarios for future development in international letter volumes
2016-2021 ANNUAL GROWTH RATES FOR SMALL AND LARGE LETTERSFor small and large letters (P- and G-format items), we assume the same decline for all inter- and intraregional flows for three scenarios:• Base case: -2 per cent per year• Conservative case: -1 per cent per year• Extensive case: -3 per cent per year
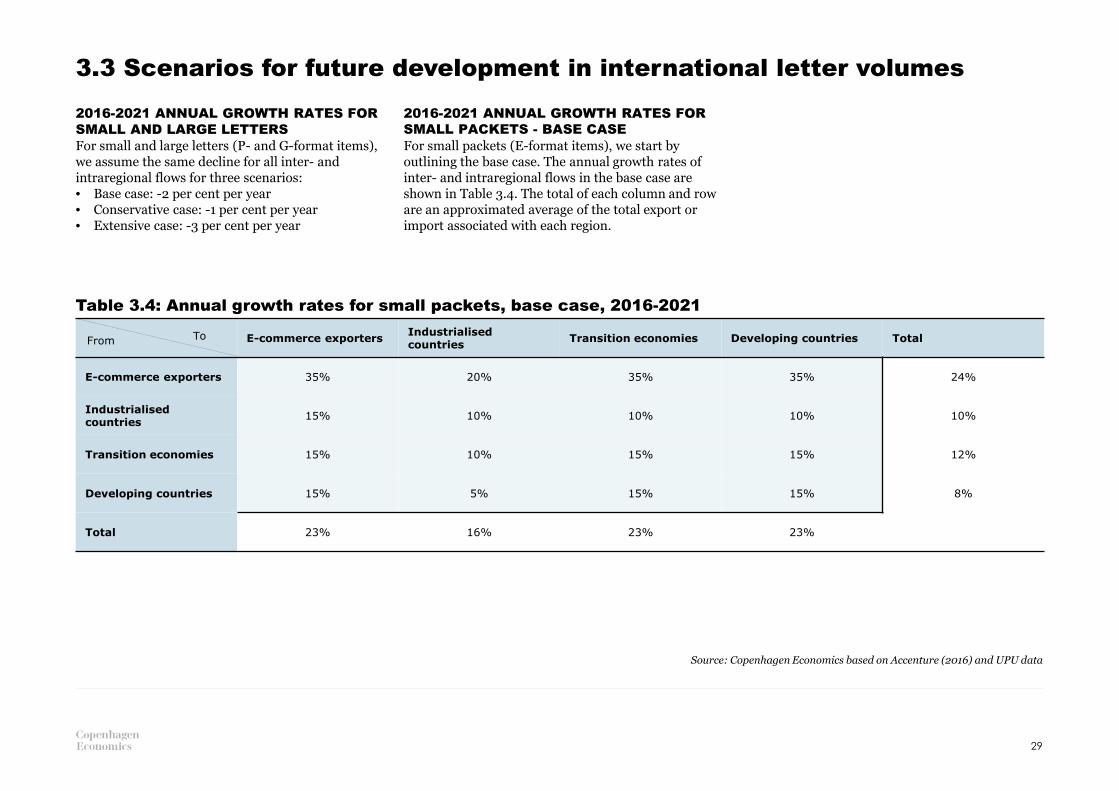
2016-2021 ANNUAL GROWTH RATES FOR SMALL PACKETS - BASE CASEFor small packets (E-format items), we start by outlining the base case. The annual growth rates of inter- and intraregional flows in the base case are shown in Table 3.4. The total of each column and row are an approximated average of the total export or import associated with each region.
Table 3.4: Annual growth rates for small packets, base case, 2016-2021
Source: Copenhagen Economics based on Accenture (2016) and UPU data
29
E-commerce exportersIndustrialised countries
Transition economies Developing countries Total
E-commerce exporters 35% 20% 35% 35% 24%
Industrialised countries
15% 10% 10% 10% 10%
Transition economies 15% 10% 15% 15% 12%
Developing countries 15% 5% 15% 15% 8%
Total 23% 16% 23% 23%
ToFrom

2016-2021 ANNUAL GROWTH RATES FOR SMALL PACKETS – CONSERVATIVE CASETable 3.5 shows the annual growth rates of inter- and intraregional flows in the conservative case.
These growth rates represent a decrease of 5 percentage points compared to the base case.
2016-2021 ANNUAL GROWTH RATES FOR SMALL PACKETS – EXTENSIVE CASETable 3.6 shows the annual growth rates of inter- and intraregional flows in the extensive case.
These growth rates represent an increase of 5 percentage points compared to the base case.
Table 3.5: Conservative case
Table 3.6: Extensive case
Source: Copenhagen Economics based on Accenture (2016) and UPU data
Source: Copenhagen Economics based on Accenture (2016) and UPU data
30
E-commerceexporters
Industrialised countries
Transition economies
Developing countries
total
E-commerceexporters
30% 15% 30% 30% 19%
Industrialised countries
10% 5% 5% 5% 5%
Transition economies
10% 5% 10% 10% 7%
Developing countries
10% 1% 10% 10% 3%
Total 15% 5% 10% 10%
FromTo
E-commerceexporters
Industrialised countries
Transition economies
Developing countries
total
E-commerceexporters
40% 25% 40% 40% 29%
Industrialised countries
20% 15% 15% 15% 15%
Transition economies
20% 15% 20% 20% 17%
Developing countries
20% 10% 20% 20% 13%
Total 18% 11% 18% 18%
FromTo
32%
9%
59%
P G E
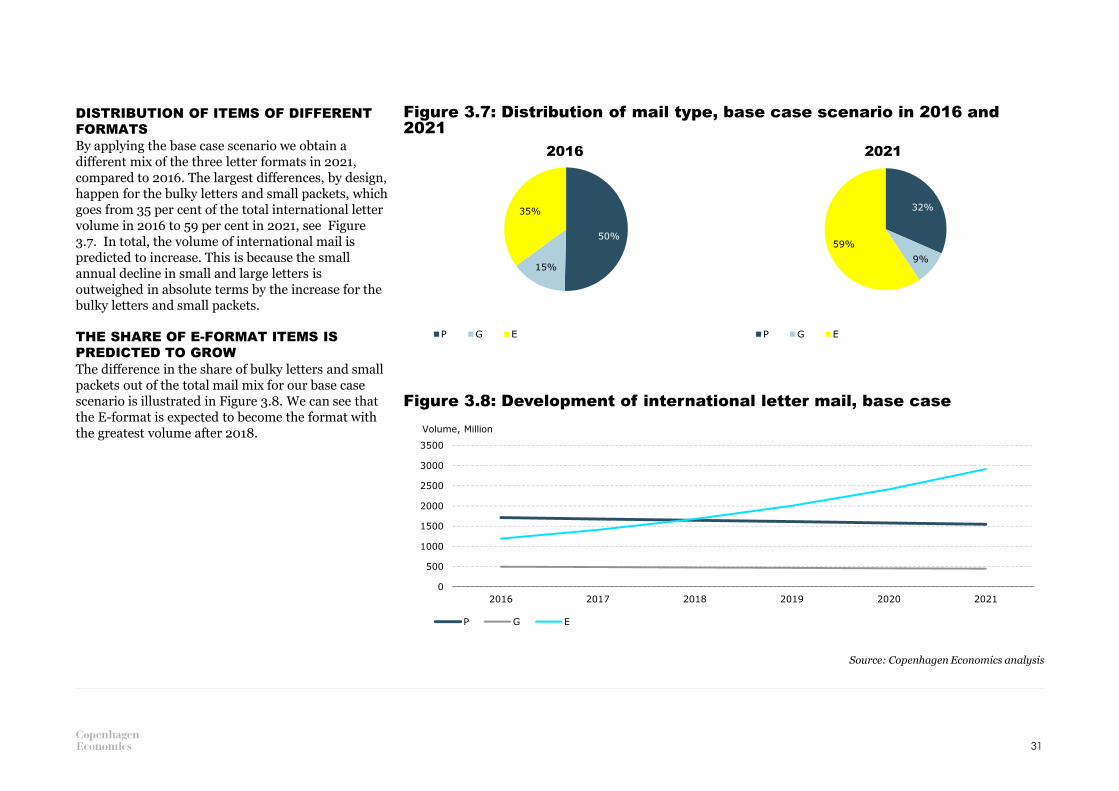
DISTRIBUTION OF ITEMS OF DIFFERENT FORMATSBy applying the base case scenario we obtain a different mix of the three letter formats in 2021, compared to 2016. The largest differences, by design, happen for the bulky letters and small packets, which goes from 35 per cent of the total international letter volume in 2016 to 59 per cent in 2021, see Figure 3.7. In total, the volume of international mail is predicted to increase. This is because the small annual decline in small and large letters is outweighed in absolute terms by the increase for the bulky letters and small packets.
THE SHARE OF E-FORMAT ITEMS IS PREDICTED TO GROWThe difference in the share of bulky letters and small packets out of the total mail mix for our base case scenario is illustrated in Figure 3.8. We can see that the E-format is expected to become the format with the greatest volume after 2018.
Figure 3.7: Distribution of mail type, base case scenario in 2016 and 2021
Figure 3.8: Development of international letter mail, base case
Source: Copenhagen Economics analysis
31
2016 2021
50%
15%
35%
P G E
0
500
1000
1500
2000
2500
3000
3500
2016 2017 2018 2019 2020 2021
Volume, Million
P G E

4IMPACT OF CHANGES TO THE TERMINAL DUES SYSTEM ON FINANCIAL TRANSFERS
4.1 TOTAL VALUE OF TRANSFERS WITH AND WITHOUT THE CHANGES AGREED IN ISTANBUL4.2 IMPACT ON INDIVIDUAL COUNTRIES4.3 FINANCIAL TRANSFERS TOWARDS 2030

2.401
2.216
-
500
1.000
1.500
2.000
2.500
3.000
Current System, in 2018 Updated System, in 2018
SDR, Million
4.1 Total value of transfers before and after the changes agreed in Istanbul
In order to disentangle the impact of the regulatory changes implemented in 2018 from the impact of the development in cross-border mail flows, we start our analysis by keeping mail volumes constant at a given level.
We quantify the global financial transfers with the new terminal dues system in 2018 and compare them to a situation where the current system would be applied also in 2018.
In this analysis, we rely on three specific assumptions: • We assume that letter volumes develop according
to our base case scenario from 2016 to 2018 • We assume that domestic prices increase by an
inflation rate of 2 per cent per year, and • We assume that the annual increase in terminal
dues rates in the current system is applied also from 2017 to 2018 and onwards until 2021.
REGULATORY CHANGES ARE NOT EXPECTED TO HAVE A LARGE IMPACT ON TRANSFERS Our analysis suggests that the changes agreed upon in Istanbul do not bring about large changes to the total value of the financial transfers.
Our simulations show that, compared to continuing with the current system, the updated terminal dues system is expected result in a 8 per cent decrease in financial transfers for 2018, see Figure 4.1.
Figure 4.1: Total value of financial transfers applying current and updated system in 2018
Source: Copenhagen Economics based on UPU data and company websites
33
-8%

-
500
1.000
1.500
2.000
2.500
3.000
2018 2019 2020 2021
SDR, Million
Current System Updated System
THE IMPACT OF THE REGULATORY CHANGES IS DRIVEN BY BULKY LETTERS AND SMALL PACKETS The change in the total value of financial transfers is expected to come from the E-format items (bulky letters and small packets)11. Compared to keeping the current system, financial transfers resulting from E-format items are expected to decrease by 9 per cent, see Figure 4.2.
The financial transfers resulting from P- and G-format items (small and large letters) are not expected to change significantly. This is simply because most of the changes in the updated system are related to E-format items only.
THE IMPACT WILL INCREASE OVER TIMESince the updated system includes a larger annual increase in caps compared to the current one, the impact of the new system will increase over time. In fact, our analysis shows that the difference between the current and the updated system will grow from 8 per cent in 2018 to 14 per cent in 2021, see Figure 4.3.
Although the new system will reduce the amount of financial transfers compared to the existing one, financial transfers for some flows will still grow over time. This is because absolute differences between actual terminal dues and counterfactual rates are very large. For example, in cases where the domestic tariffs are significantly higher than the actual terminal dues, even a small increase in domestic tariffs by 2 per cent per year may outweigh a 13 per cent increase of actual terminal dues.
Figure 4.2: Total value of financial transfers by letter type in 2018
Figure 4.3: Total value of financial transfers between 2018 and 2021
Source: Copenhagen Economics based on UPU data and company websites
Note: The volumes are kept constant over time in order to isolate the effect of the regulatory changes.Source: Copenhagen Economics based on UPU data and company websites
11 Since there is no practical distinction between bulky letters and small packets and we only observe them as one letter format, the E-format, we do not separate any effects based on whether it come from bulky letters or small packets. 34
8% 14%
-
500
1.000
1.500
2.000
2.500
P G E
SDR, Million
Current System, in 2018 Updated System, in 2018

Figure 4.4: E-commerce exporter example
Source: UPU (2015) Statistics and Accounting Guide http://www.upu.int/uploads/tx_sbdownloader/guideTerminalDuesStatisticsAccountingEn.pdf
35
THE FINANCIAL TRANSFERS ARE NOT EQUALLY DISTRIBUTED The financial transfers can also be examined on a country by country basis. Since every transfer created by the terminal dues system will benefit one designated postal operator while making another designated postal operator worse off, some countries will experience a net gain from the system and others will experience a net loss. In total, the total value of financial transfers is zero, i.e. one country’s gain is another country’s loss.
The size of gains and losses can vary largely across different countries, mainly due to two reasons: 1. The difference between the actual terminal dues
paid and the counterfactual terminal dues are different for different flows. Since postal markets exhibit country-specific characteristics, counterfactual terminal dues rates will vary across countries as well.
2. Some countries are net importers and others are net exporters of international letter mail. This means that some operators receive large positive transfers on large outbound flows while others lose significantly on large inbound flows.
E-COMMERCE EXPORTERS AND TRANSITIONAL ECONOMIES EXPERIENCE THE LARGEST POSITIVE NET EFFECT The 15 countries found to have the highest estimated positive net effect are all classified as e-commerce exporters or transitional economies.
For these countries, the positive net effect is based on a large share of outbound E-format items where the actual terminal dues paid are lower than the counterfactual rate. Out of the total net effect for these countries, approximately 80 per cent comes from the E-format (example provided in Figure 4.4).
These emerging economies all experience a reduced net effect from the updated system, i.e. they get asmaller positive effect. There are two explanations for this. First, the positive effect comes primarily from the bulky letters and small packets where the changes are made. Second, the average weight of E-format items being exported from these countries is
low in general, which means that the terminal dues that have to be paid in the new system are higher compared to the current system, see section 2.3. For these countries, the effect from E-format items is reduced (smaller positive effect) by between 10-14 per cent.
0
100
200
300
400
500
600
700
800
P G E
SDR, Million
Current System, in 2018 Updated System, in 2018
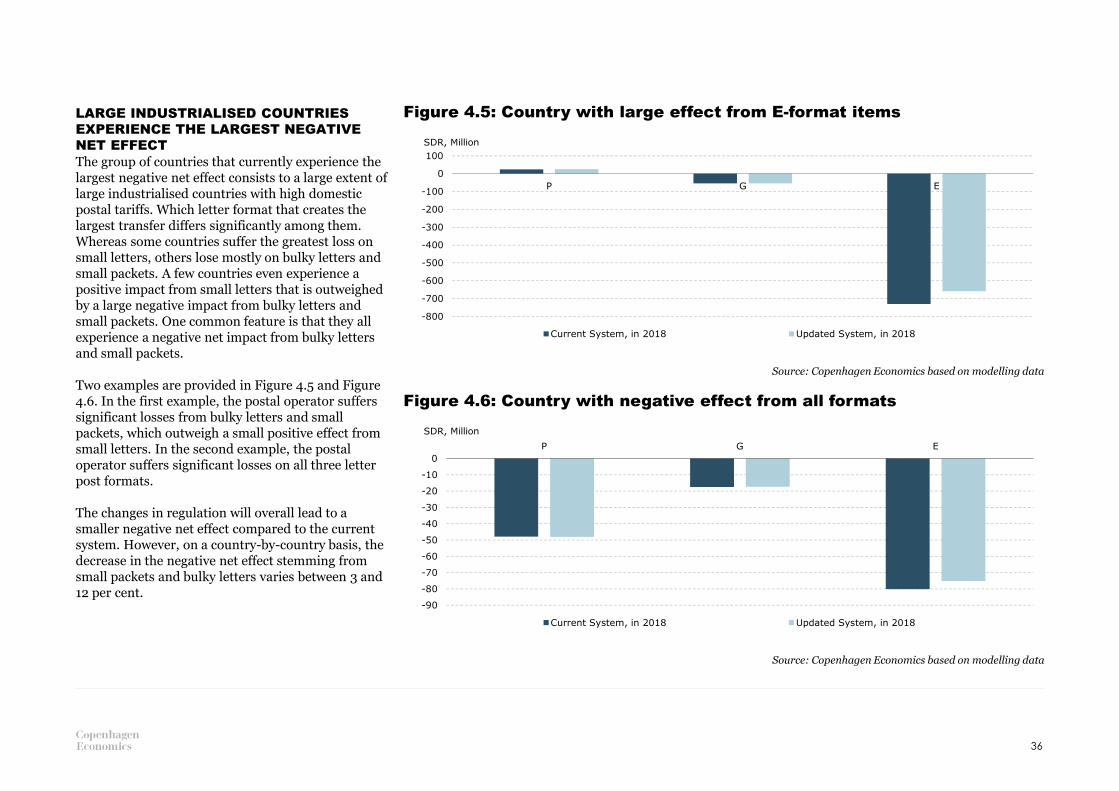
LARGE INDUSTRIALISED COUNTRIES EXPERIENCE THE LARGEST NEGATIVE NET EFFECT The group of countries that currently experience the largest negative net effect consists to a large extent of large industrialised countries with high domestic postal tariffs. Which letter format that creates the largest transfer differs significantly among them. Whereas some countries suffer the greatest loss on small letters, others lose mostly on bulky letters and small packets. A few countries even experience a positive impact from small letters that is outweighed by a large negative impact from bulky letters and small packets. One common feature is that they all experience a negative net impact from bulky letters and small packets.
Two examples are provided in Figure 4.5 and Figure 4.6. In the first example, the postal operator suffers significant losses from bulky letters and small packets, which outweigh a small positive effect from small letters. In the second example, the postal operator suffers significant losses on all three letter post formats.
The changes in regulation will overall lead to a smaller negative net effect compared to the current system. However, on a country-by-country basis, the decrease in the negative net effect stemming from small packets and bulky letters varies between 3 and 12 per cent.
Figure 4.5: Country with large effect from E-format items
Figure 4.6: Country with negative effect from all formats
Source: Copenhagen Economics based on modelling data
Source: Copenhagen Economics based on modelling data
36
-800
-700
-600
-500
-400
-300
-200
-100
0
100
P G E
SDR, Million
Current System, in 2018 Updated System, in 2018
-90
-80
-70
-60
-50
-40
-30
-20
-10
0
P G E
SDR, Million
Current System, in 2018 Updated System, in 2018

SOME REGIONS RECEIVE MORE POSITIVE TRANSFERS THAN OTHERS Our model based on bilateral mail flows enables us to aggregate and analyse the geographical patterns of financial transfers between regions. We do this by aggregating our result for the base case in 2018 with the updated system across countries. This analysis excludes financial transfers between countries in the same region. Our analysis reveals that two geographical regions receive a significant positive net financial transfer from the UPU terminal dues system. These two regions are Asia-Pacific and Eastern Europe & Central Asia.
The Asia-Pacific region receives a significant positive net transfer both from North America and Western Europe and experiences very small transfers to or from the rest of the world, see Figure 4.8. The positive transfers experienced by operators in the Asia-Pacific region are expected to grow due to the global trend of cross-border delivery of small packets from the this region.
The pattern for Eastern Europe & Central Asia looks slightly different. The largest positive transfer is emerging from the exchange in cross-border letter mail with Western Europe, see Figure 4.9. There is also a significant positive transfer from the exchange with North America.
When a higher share of the international small packets is delivered from the Asia-Pacific and Eastern Europe & Central Asia, the financial transfers from Western Europe and North America to these regions will grow.
Figure 4.8 Asia-Pacific net financial transfer
Figure 4.9 Eastern Europe & Central Asia net financial transfer
Note: The specific countries can be found in Annex BSource: Copenhagen Economics based on modelling data
Note: The specific countries can be found in Annex BSource: Copenhagen Economics based on modelling data
37
850
997
-3 -19
3
-2
1.826
-
500
1.000
1.500
2.000
Western Europe North America North Africa &
Middle East
South Central
America
Eastern Europe &
Central Asia
Sub-Saharan
Africa
total
SDR, Million
141
-3
44 0 0 0
181
-
50
100
150
200
Western Europe Asia-Pacific North America North Africa &
Middle East
South Central
America
Sub-Saharan
Africa
total
SDR, Million

Due to the construction of the transfer system, the positive net transfers to the Asia-Pacific region and to Eastern Europe & Central Asia must be balanced by negative net transfers for other geographical regions. Our analysis shows that the two geographical regions receiving the largest negative net financial transfers are Western Europe and North America.
Western Europe experiences the largest negative net transfer overall with negative net transfers from all other regions, see Figure 4.10. The most significant negative transfers are, as mentioned above, coming from exchanges with the Asia-Pacific region and Eastern Europe & Central Asia.
North America experiences a negative financial net transfer, with the largest negative impact coming from exchanges with the Asia-Pacific region, see Figure 4.11.
4.10 Western Europe net financial transfer
4.11 North America net financial transfer
Note: The specific countries can be found in Annex BSource: Copenhagen Economics based on modelling data
Note: The specific countries can be found in Annex BSource: Copenhagen Economics based on modelling data
38
-850
-50 -7 -21
-141 -7
-1.076
-1.500
-1.000
-500
-
Asia-Pacific North America North Africa &
Middle East
South Central
America
Eastern Europe
& Central Asia
Sub-Saharan
Africa
total
SDR, Million
-997
-1 -12 -44 -3
50
-1.007
-1.500
-1.000
-500
-
Asia-Pacific North Africa &
Middle East
South Central
Am. &Carb.
Eastern Europe
& Central Asia
Sub-Saharan
Africa
Western Europe total
SDR, Million
4.3 Financial transfers towards 2021
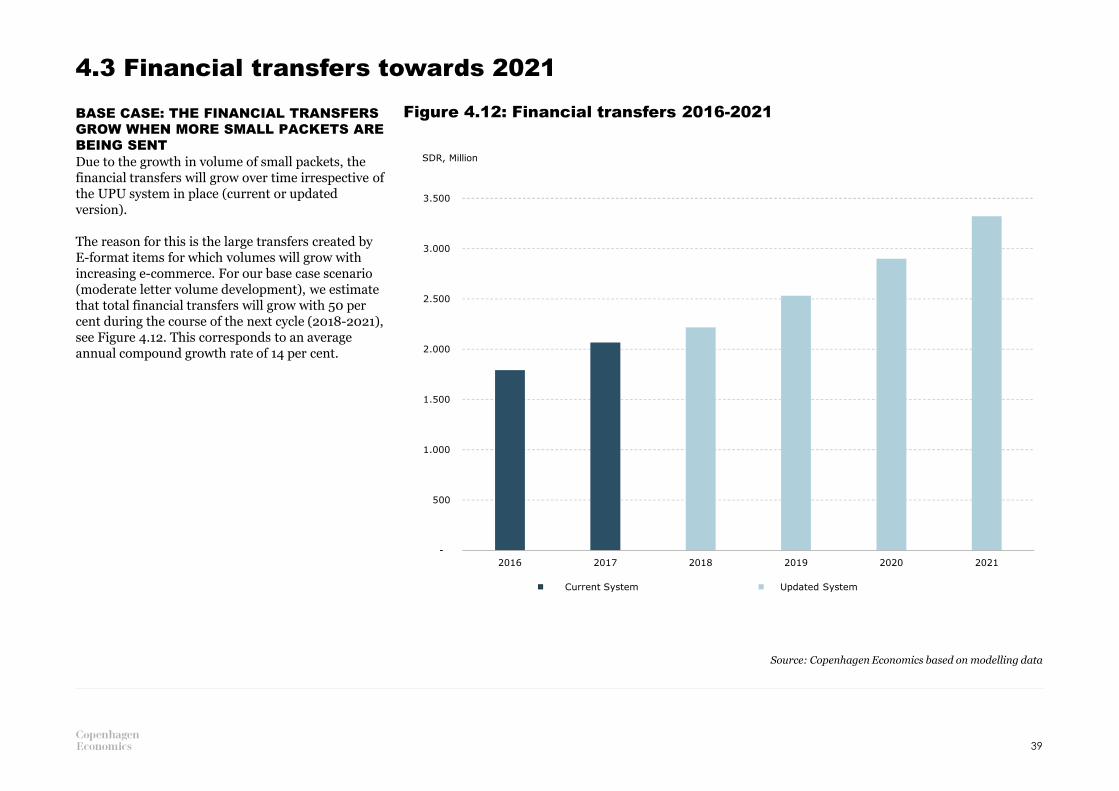
BASE CASE: THE FINANCIAL TRANSFERS GROW WHEN MORE SMALL PACKETS ARE BEING SENT Due to the growth in volume of small packets, the financial transfers will grow over time irrespective of the UPU system in place (current or updated version).
The reason for this is the large transfers created by E-format items for which volumes will grow with increasing e-commerce. For our base case scenario (moderate letter volume development), we estimate that total financial transfers will grow with 50 per cent during the course of the next cycle (2018-2021), see Figure 4.12. This corresponds to an average annual compound growth rate of 14 per cent.
Figure 4.12: Financial transfers 2016-2021
Source: Copenhagen Economics based on modelling data
39
-
500
1.000
1.500
2.000
2.500
3.000
3.500
2016 2017 2018 2019 2020 2021
SDR, Million
Current System Updated System
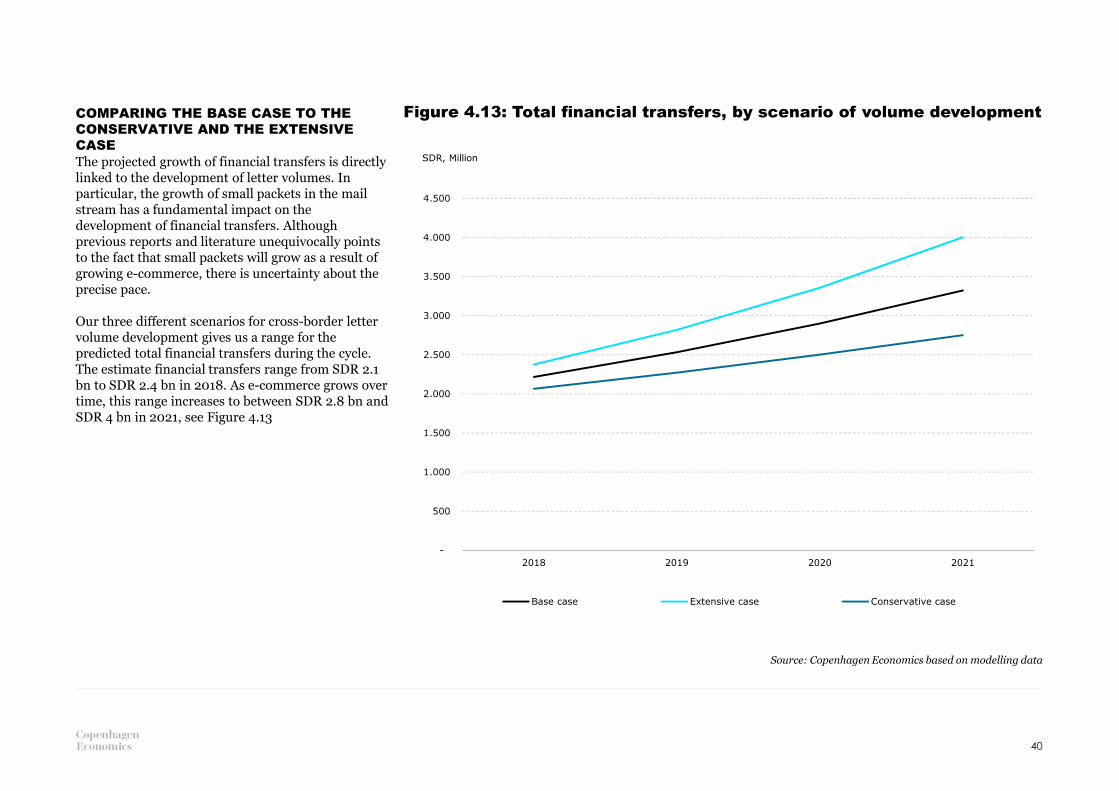
COMPARING THE BASE CASE TO THE CONSERVATIVE AND THE EXTENSIVE CASE The projected growth of financial transfers is directly linked to the development of letter volumes. In particular, the growth of small packets in the mail stream has a fundamental impact on the development of financial transfers. Although previous reports and literature unequivocally points to the fact that small packets will grow as a result of growing e-commerce, there is uncertainty about the precise pace.
Our three different scenarios for cross-border letter volume development gives us a range for the predicted total financial transfers during the cycle. The estimate financial transfers range from SDR 2.1 bn to SDR 2.4 bn in 2018. As e-commerce grows over time, this range increases to between SDR 2.8 bn and SDR 4 bn in 2021, see Figure 4.13
Figure 4.13: Total financial transfers, by scenario of volume development
40
-
500
1.000
1.500
2.000
2.500
3.000
3.500
4.000
4.500
2018 2019 2020 2021
SDR, Million
Base case Extensive case Conservative case
Source: Copenhagen Economics based on modelling data
-
500
1.000
1.500
2.000
2.500
3.000
3.500
4.000
4.500
2018 2019 2020 2021
SDR, Million
Current System Updated System
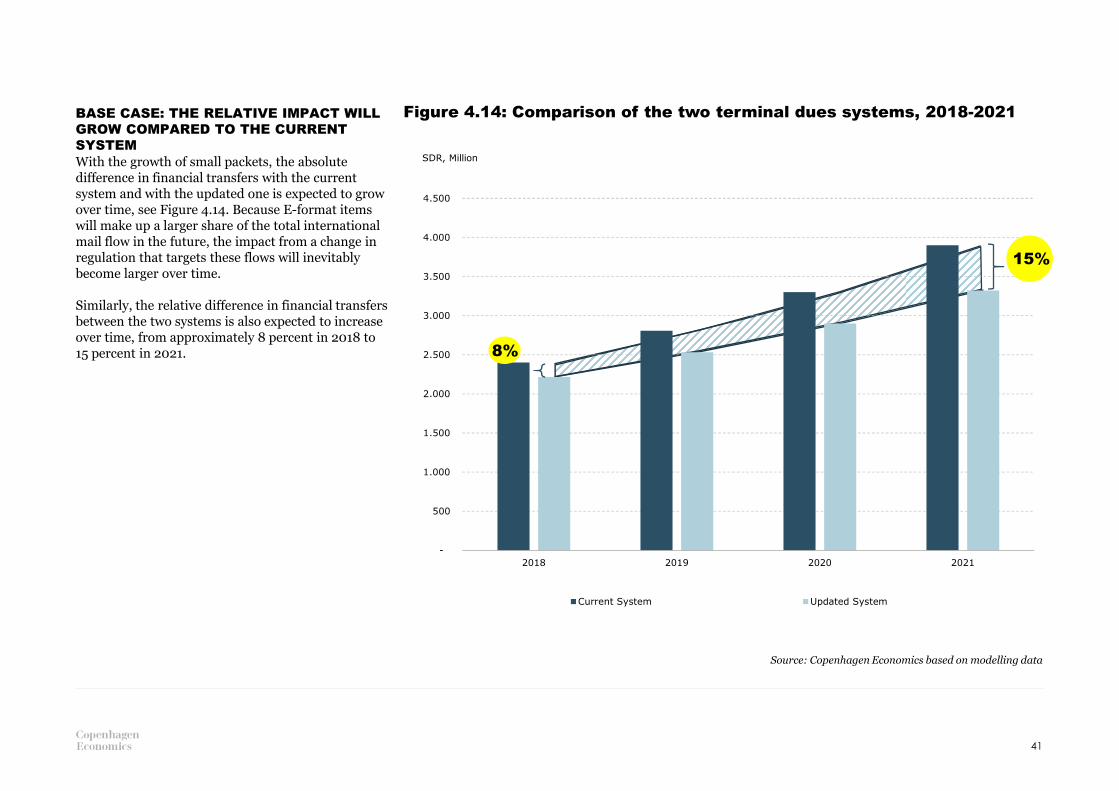
BASE CASE: THE RELATIVE IMPACT WILL GROW COMPARED TO THE CURRENT SYSTEMWith the growth of small packets, the absolute difference in financial transfers with the current system and with the updated one is expected to grow over time, see Figure 4.14. Because E-format items will make up a larger share of the total international mail flow in the future, the impact from a change in regulation that targets these flows will inevitably become larger over time.
Similarly, the relative difference in financial transfers between the two systems is also expected to increase over time, from approximately 8 percent in 2018 to 15 percent in 2021.
Figure 4.14: Comparison of the two terminal dues systems, 2018-2021
41
8%
15%
Source: Copenhagen Economics based on modelling data
6APPENDIX
A. POSTAGE PRICES COLLECTION AND CALCULATION OF COUNTERFACTUAL TERMINAL DUESB. ESTIMATION OF CROSS-BORDER LETTER VOLUMESC. SCENARIO ANALYSIS METHODOLOGY
ANNEX A: Collection of postage rates and calculation of counterfactual terminal dues
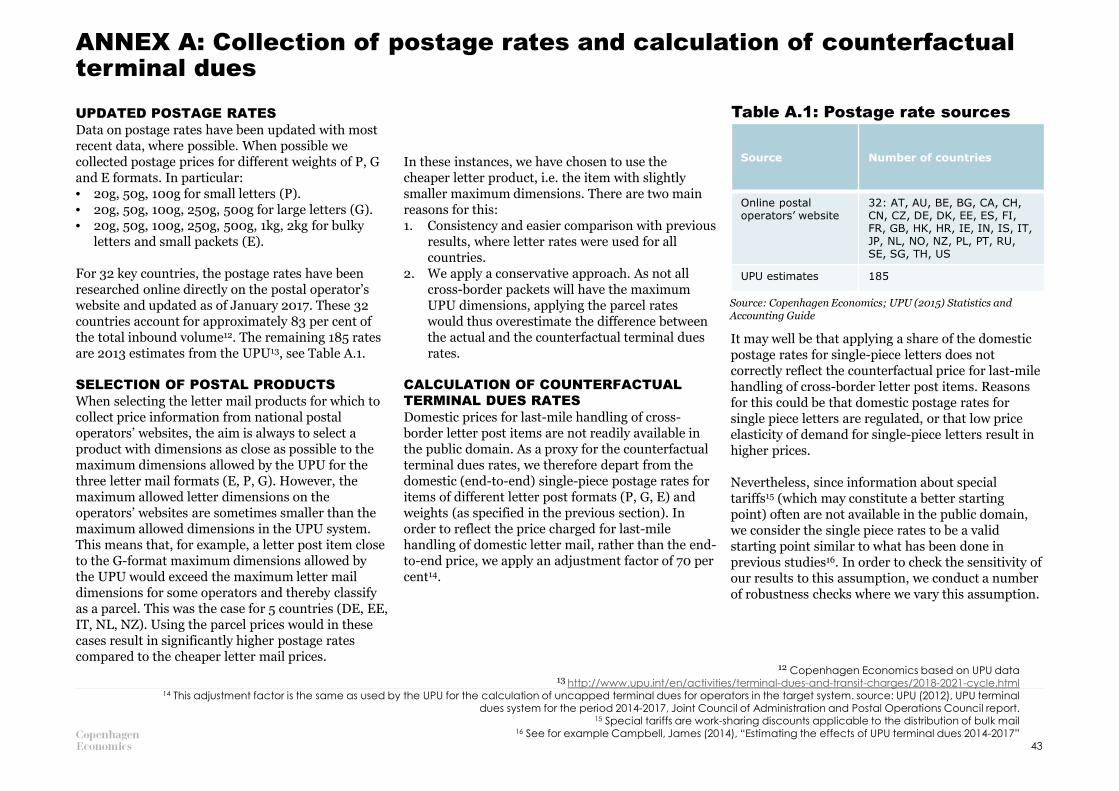
UPDATED POSTAGE RATESData on postage rates have been updated with most recent data, where possible. When possible we collected postage prices for different weights of P, G and E formats. In particular:• 20g, 50g, 100g for small letters (P).• 20g, 50g, 100g, 250g, 500g for large letters (G).• 20g, 50g, 100g, 250g, 500g, 1kg, 2kg for bulky
letters and small packets (E).
For 32 key countries, the postage rates have been researched online directly on the postal operator’s website and updated as of January 2017. These 32 countries account for approximately 83 per cent of the total inbound volume12. The remaining 185 rates are 2013 estimates from the UPU13, see Table A.1.
SELECTION OF POSTAL PRODUCTSWhen selecting the letter mail products for which to collect price information from national postal operators’ websites, the aim is always to select a product with dimensions as close as possible to the maximum dimensions allowed by the UPU for the three letter mail formats (E, P, G). However, the maximum allowed letter dimensions on the operators’ websites are sometimes smaller than the maximum allowed dimensions in the UPU system. This means that, for example, a letter post item close to the G-format maximum dimensions allowed by the UPU would exceed the maximum letter mail dimensions for some operators and thereby classify as a parcel. This was the case for 5 countries (DE, EE, IT, NL, NZ). Using the parcel prices would in these cases result in significantly higher postage rates compared to the cheaper letter mail prices.
In these instances, we have chosen to use the cheaper letter product, i.e. the item with slightly smaller maximum dimensions. There are two main reasons for this:1. Consistency and easier comparison with previous
results, where letter rates were used for all countries.
2. We apply a conservative approach. As not all cross-border packets will have the maximum UPU dimensions, applying the parcel rates would thus overestimate the difference between the actual and the counterfactual terminal dues rates.
CALCULATION OF COUNTERFACTUAL TERMINAL DUES RATESDomestic prices for last-mile handling of cross-border letter post items are not readily available in the public domain. As a proxy for the counterfactual terminal dues rates, we therefore depart from the domestic (end-to-end) single-piece postage rates for items of different letter post formats (P, G, E) and weights (as specified in the previous section). In order to reflect the price charged for last-mile handling of domestic letter mail, rather than the end-to-end price, we apply an adjustment factor of 70 per cent14.
Table A.1: Postage rate sources
Source: Copenhagen Economics; UPU (2015) Statistics and Accounting Guide
12 Copenhagen Economics based on UPU data13 http://www.upu.int/en/activities/terminal-dues-and-transit-charges/2018-2021-cycle.html
14 This adjustment factor is the same as used by the UPU for the calculation of uncapped terminal dues for operators in the target system. source: UPU (2012), UPU terminal dues system for the period 2014-2017, Joint Council of Administration and Postal Operations Council report.
15 Special tariffs are work-sharing discounts applicable to the distribution of bulk mail16 See for example Campbell, James (2014), “Estimating the effects of UPU terminal dues 2014-2017”
43
Source Number of countries
Online postal operators’ website
32: AT, AU, BE, BG, CA, CH, CN, CZ, DE, DK, EE, ES, FI, FR, GB, HK, HR, IE, IN, IS, IT, JP, NL, NO, NZ, PL, PT, RU, SE, SG, TH, US
UPU estimates 185
It may well be that applying a share of the domestic postage rates for single-piece letters does not correctly reflect the counterfactual price for last-mile handling of cross-border letter post items. Reasons for this could be that domestic postage rates for single piece letters are regulated, or that low price elasticity of demand for single-piece letters result in higher prices.
Nevertheless, since information about special tariffs15 (which may constitute a better starting point) often are not available in the public domain, we consider the single piece rates to be a valid starting point similar to what has been done in previous studies16. In order to check the sensitivity of our results to this assumption, we conduct a number of robustness checks where we vary this assumption.

Instead of estimating a simple linear relationship between two prices – that of a 20g domestic small priority letter and that of a 175g domestic large priority letter, as UPU does17 – we use several prices per letter mail format to calculate the counterfactual terminal dues rates.
By using three tariffs (i.e. three weight steps) for small letters, five tariffs for large letters and seven tariffs for small packets, we are able to calculate counterfactual terminal dues rates that mirror the actual situation better than what would have been the case if only two tariffs would have been used.
In order to calculate an average rate (i.e. the counterfactual terminal dues rate) per format, we make assumptions about the distribution of weights within each format. These assumptions are primarily based on a UPU study from 201418 containing estimated distributions of items across different weight steps for each letter format P, G and E.
Once the weight distribution for each format is established, it is straightforward to calculate a counterfactual terminal dues rate per item for each format.
17 See UPU (2014), International Bureau Circular 11218 UPU, (2014), POC C3 LPRG 2014.2 Doc 4a, “Results of the items per kilogramme (IPK) study” (committee document). 44

ANNEX B: Estimation of cross-border letter mail volumes
ESTIMATION OF BILATERAL MAIL FLOWS Bilateral mail flows between designated postal operators are an essential input in the model, as their magnitude will determine the size of the financial transfers.
In order to estimate financial net transfers in our model, we need information about bilateral flows of letter mail up to 2kg between all designated postal operators (both in terms of the number of items and in terms of their total weight), split by letter format (P, G, E). As this information is not readily available
in the public domain, we have to construct our own data set, based on publicly available data and reasonable assumptions about the performance of global mail markets.
Whereas we have information about aggregate flows of cross-border letter post items between regions, we do not know how the cross-border volume to and from each region is disaggregated among the countries in the region. Moreover, we do not have information about the product mix (i.e., the distribution of letter formats). For this reason, we
use a number of proxies to approximate mail flows subject to UPU terminal dues. The process of estimating bilateral mail flows is depicted in Figure B.1 and described in detail below.
45
FIGURE B.1: PROCESS OF CALCULATING VOLUME ESTIMATES
Input data
Estimate of total inbound and
outbound letter mail flow per
country(number of items)
1
Total inbound and outbound mail flow per
postal operator (number of items)
Bilateral mail flows from country to country as % of
global cross-border flow
Bilateral mail flows in volumes
(number of items)
3 4
Bilateral mail flows in kilograms per
format(weight)
6
Estimates of intra-and inter-region mail flows as % of total inbound and
outbound per region
Assumption:proportional
regional participation
Estimate of total global mail
volume(number of items)
Bilateral mail flows per format
(number of items)
5
Estimates for the distribution of
formats
Average weight for product type
Inter- and intra-regional mail flow
as % of global cross-border flow
2

As a first step, we obtain estimates of the total inbound and outbound mail flows (in terms of number of items) for individual countries. The starting point for this is readily available data for total inbound and outbound mail flows from the UPU statistical database19, measured in number of items. 2013 is the latest year in the UPU statistics database for which we have a broad coverage of data, see table B.1 and table B.2. Hence, we use this as a reference.
If we cannot find information for a specific country or territory in the UPU dataset from 2013, we turn to UPU statistics from other years. When neither of these sources can provide us with an estimate, we turn to domestic sources such as the national regulatory authorities and designated operators. This adds data points for another five countries. For seven additional countries with data for domestic (but not cross-border) letter volumes, we are able to construct our own estimate of cross-border volumes by using a reasonable ratio of cross-border to domestic letter mail volumes20. This results in a data set of inbound and outbound volumes (in number of items) for 180 countries and territories.
As a second step, we collect data on inter- and intra-regional flows, i.e. how much mail is sent from a given region (e.g. Western Europe) to another region (e.g. Asia-Pacific). The data is for 2016 and is provided by the UPU and other sources. The regional data is in tonnage. In order to estimate the volume of letters in terms of the number of items, we have used additional information on the number of items per kilogram of mail for each regional flow21. This exercise provides us with estimates of relative flows in volume for each region, i.e. the proportion of a specific bi-regional flow out of the total global flow.
As a third step, we make an important assumption about proportional regional participation where we depart from the ratios calculated in step two and apply them to inter-regional mail flows. By applying this assumption, we are able to estimate data points for each bilateral mail flow (from country to country) as a percentage of the global cross-border mail flow in 2013. While this methodology fails to take into account factors such as distance and international relations22, it is the best available approximation of bilateral flows and does not suffer from further data gaps.
19 UPU Postal Statistics Database, http://pls.upu.int/pls/ap/ssp_report.main?p_language=AN&p_choice=BROWSE20 The ratios used are based on information from previous years regarding the relationship between domestic and cross-border mail volumes. Where this information is not available, a ratio is constructed based on assumptions regarding the similarity of countries (i.e. countries of similar size can be expected to have the same ratio between
domestic and cross-border flows)21 UPU, (2014), POC C3 LPRG 2014.2 Doc 4a, “Results of the items per kilogramme (IPK) study” (committee document)
22 Factors such as distance, international relations, and a common language can be important for the mail exchange between certain countries.
46
TABLE B.1: SOURCES OF OUTBOUND VOLUMES
TABLE B.2: SOURCES OF INBOUND VOLUMES
Note: The percentages are subject to rounding
Source: Copenhagen Economics
Note: The percentages are subject to rounding
Source: Copenhagen Economics
SourceNumber of countries
% of countries
2013 UPU estimate 115 64%
UPU estimate from other year
51 28%
based on domestic UPU data and ratio of domestic to international
8 4%
designated operator 3 2%
government /regulator 3 2%
other 1 1%
SourceNumber of countries
% of countries
2013 UPU estimate 108 60%
UPU estimate from other year
58 32%
based on domestic UPU data and ratio of domestic to international
10 6%
designated operator 2 1%
government /regulator 1 1%
other 1 1%
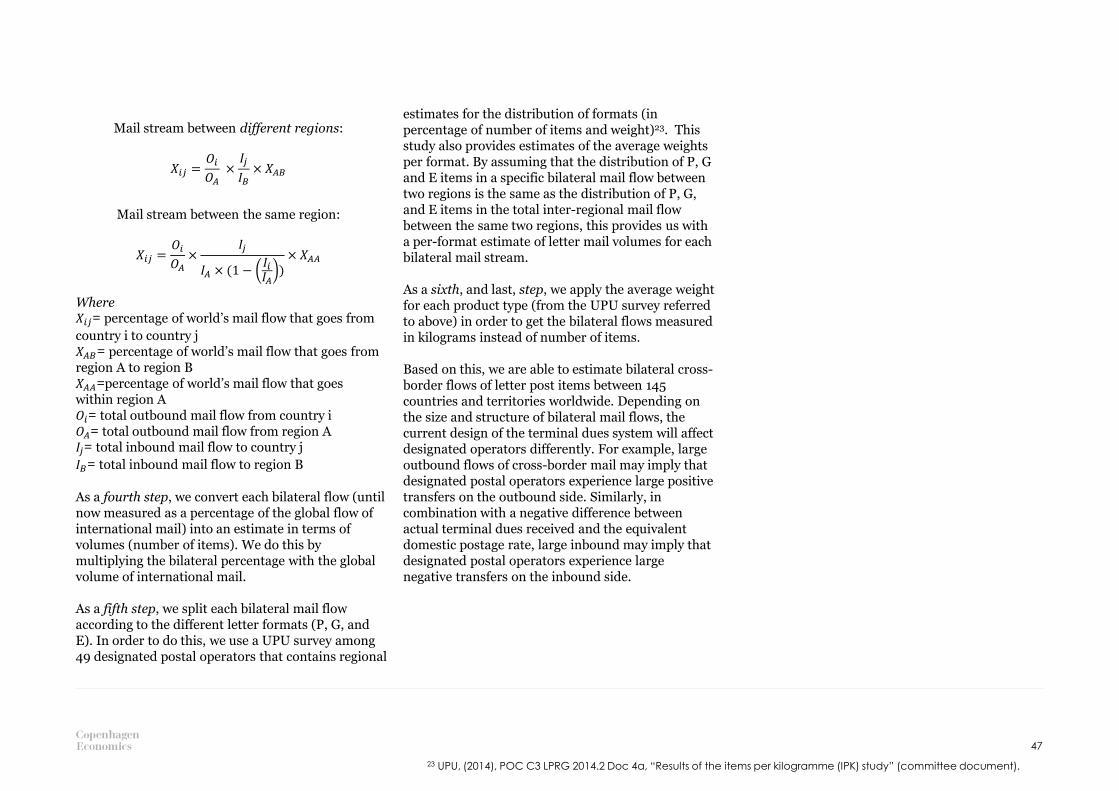
As a fourth step, we convert each bilateral flow (until now measured as a percentage of the global flow of international mail) into an estimate in terms of volumes (number of items). We do this by multiplying the bilateral percentage with the global volume of international mail.
As a fifth step, we split each bilateral mail flow according to the different letter formats (P, G, and E). In order to do this, we use a UPU survey among 49 designated postal operators that contains regional
estimates for the distribution of formats (in percentage of number of items and weight)23. This study also provides estimates of the average weights per format. By assuming that the distribution of P, G and E items in a specific bilateral mail flow between two regions is the same as the distribution of P, G, and E items in the total inter-regional mail flow between the same two regions, this provides us with a per-format estimate of letter mail volumes for each bilateral mail stream.
As a sixth, and last, step, we apply the average weight for each product type (from the UPU survey referred to above) in order to get the bilateral flows measured in kilograms instead of number of items.
Based on this, we are able to estimate bilateral cross-border flows of letter post items between 145 countries and territories worldwide. Depending on the size and structure of bilateral mail flows, the current design of the terminal dues system will affect designated operators differently. For example, large outbound flows of cross-border mail may imply that designated postal operators experience large positive transfers on the outbound side. Similarly, in combination with a negative difference between actual terminal dues received and the equivalent domestic postage rate, large inbound may imply that designated postal operators experience large negative transfers on the inbound side.
23 UPU, (2014), POC C3 LPRG 2014.2 Doc 4a, “Results of the items per kilogramme (IPK) study” (committee document).
47
Mail stream between different regions:
��� =��
��×
��
��× ���
Where���= percentage of world’s mail flow that goes from
country i to country j ���= percentage of world’s mail flow that goes from region A to region B���=percentage of world’s mail flow that goes within region A��= total outbound mail flow from country i��= total outbound mail flow from region A��= total inbound mail flow to country j
��= total inbound mail flow to region B
Mail stream between the same region:
��� =��
��×
��
�� × (1 −����)
× ���

48
Groups Countries that belong to each region
Sub-Saharan AfricaBW,GA,MU,SC,ZA,CG,CI,CM,CV,GH,KE,NA,NG,SZ,ZW,AO,BF,BI,BJ,CD,CF,ER,ET,GM,GN,GQ,GW,LR,LS,MG,ML,MW,MZ,NE,RW,SL,SN,SS,ST,TD,TG,TZ,UG,ZM
South Central AmericaAI,AW,BM,BS,KY,TC,VG,AG,BB,CW,DM,GD,KN,MS,SX,TT,AR,BR,CL,CR,CU,JM,LC,MX,PA,SR,UY,VC,VE,AC,BO,BZ,CO,DO, EC,GT,GY,HN,NI,PE,PY,SH,SV,HT
Asia-PacificAU,JP,NC,NF,NZ,PF,PN,WF,HK,SG,BN,CK,KR,MO,CN,FJ,MV,MY,NR,NU,TH,ID,IN,IR,KP,LK,MN,PG,PH,PK,TK,TO,AF,AS,BD, BT,KH,KI,LA,MM,NP,SB,TL,TV,VN,VU,WS
Eastern Europe & Central AsiaSI,CY,CZ,EE,HR,HU,MT,PL,SK,BA,BG,BY,KZ,LT,LV,ME,MK,RO,RS,RU,TR,UA,AL,AM,AZ,GE,KG,MD,TJ,TM,UZ
North Africa & Middle East AE,KW,QA,BH,SA,LB,LY,OM,TN,DZ,EG,IQ,JO,MA,SY,DJ,KM,MR,PS,SD,SO,YE
Western Europe AT,BE,CH,DE,DK,ES,FI,FK,FO,FR,GB,GG,GI,GL,GR,IE,IL,IM,IS,IT,JE,LI,LU,MC,NL,NO,PT,SE,SM,VA
North America CA,US
Source: Copenhagen Economics
TABLE B.3: REGIONAL COUNTRY GROUPINGS

ANNEX C: Scenario analysis methodology
For our projections of bulky letters and small packet we start out by forming relevant country groups. The groups are based on characteristics of the market taking into consideration the maturity of e-commerce, which is the key driver of our projections. All countries in our analysis is divided into four groups, see Table C.1.
The first group, e-commerce exporters, consists of countries that are net exporters of letters with a rapidly growing e-commerce market.
The second group, Industrialised countries, is based on geographic and economic characteristics. The e-commerce market is already a significant share of the total retail market in many of these countries. Geographically, we find these countries in North
America and Western Europe, along with Australia, New Zealand and Japan.
The third group, Transition Economies, consists of countries with less mature e-commerce markets but with economies that already see considerable growth rates.
Finally, the last group, Developing countries, consists of all other outstanding countries. This group of countries starts from very low volumes of bulky mail and small packets.
49
TABLE C.1: COUNTRY GROUPS FOR SCENARIO ANALYSIS
Groups Countries included
E-commerce exportersHK, CN, SG, IN, TH
Industrialised countriesAT, BE, CA, CH, DE, DK, ES, FI, FR, GB, GR, IE, IL, IS, IT, LU, NL, NO, PT, SE, US, AU, NZ, JP
Transition economiesBG, BR, CY, EE, HR, HU, LT, LV, MX, NE, PL, RU, SI, CZ, MT, RO, CL, KR, TR
Developing countries AE, AW, BM, BS, KW, QA, BB, BH, BN, GD, MO, SA, SK, TT, AR, BA, BW, BY, CR, CU, FJ, JM, KZ, LB, LC, LY, MK, MU, MV, MY, OM, PA, SR, TN, UA, UY, VE, ZA, AL, AM, BO, CI, CM, CO, CV, DO, DZ, EC, EG, GE, GH, GT, GY, HN, ID, IQ, JO, KE, KG, LK, MA, MD, MN, NG, NI, PE, PG, PH, PK, PY, SV, SY, SZ, AO, BD, BF, BI, BJ, BT, CD, CF, DJ, ER, ET, GM, GN, HT, KH, KI, LA, MG, MM, MR, MW, MZ, NP, RW, SB, SN, TG, TZ, UG, UZ, VN, VU, YE, ZM
Source: Copenhagen Economics
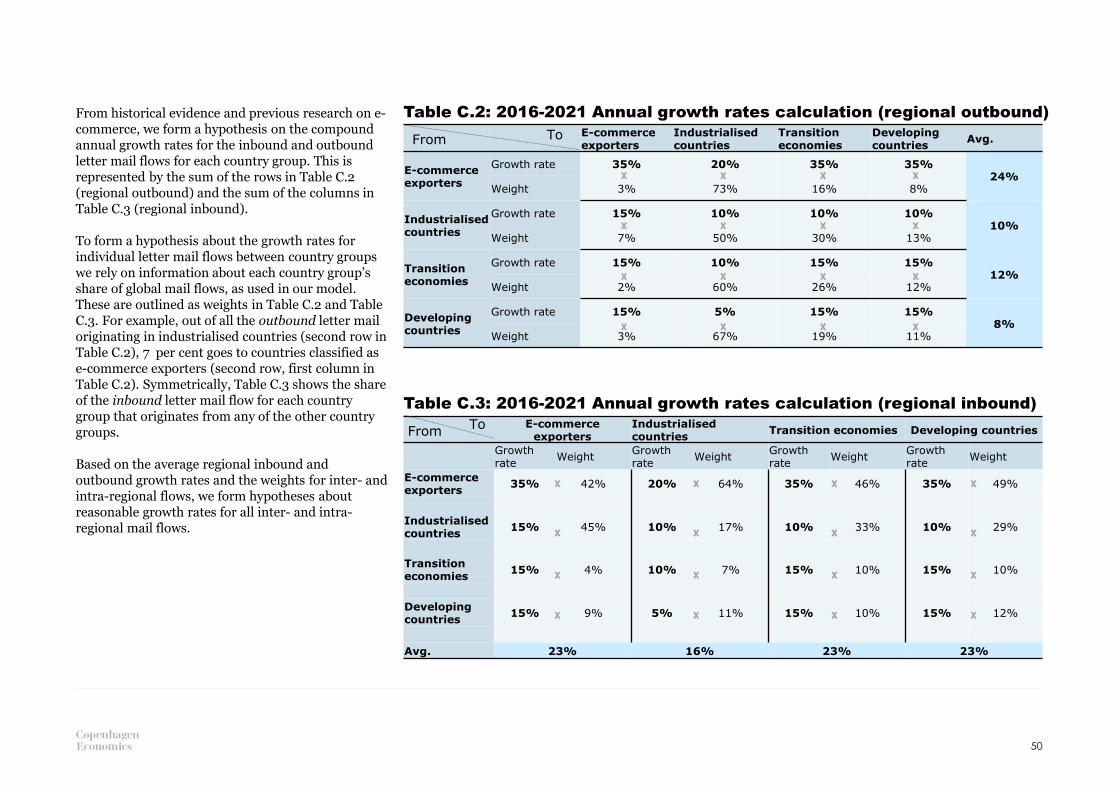
E-commerce exporters
Industrialised countries
Transition economies
Developing countries
Avg.
E-commerce exporters
Growth rate 35% 20% 35% 35%24%
Weight 3% 73% 16% 8%
Industrialised countries
Growth rate 15% 10% 10% 10%10%
Weight 7% 50% 30% 13%
Transition economies
Growth rate 15% 10% 15% 15%12%
Weight 2% 60% 26% 12%
Developing countries
Growth rate 15% 5% 15% 15%8%
Weight 3% 67% 19% 11%
From historical evidence and previous research on e-commerce, we form a hypothesis on the compound annual growth rates for the inbound and outbound letter mail flows for each country group. This is represented by the sum of the rows in Table C.2 (regional outbound) and the sum of the columns in Table C.3 (regional inbound).
To form a hypothesis about the growth rates for individual letter mail flows between country groups we rely on information about each country group’s share of global mail flows, as used in our model. These are outlined as weights in Table C.2 and Table C.3. For example, out of all the outbound letter mail originating in industrialised countries (second row in Table C.2), 7 per cent goes to countries classified as e-commerce exporters (second row, first column in Table C.2). Symmetrically, Table C.3 shows the share of the inbound letter mail flow for each country group that originates from any of the other country groups.
Based on the average regional inbound and outbound growth rates and the weights for inter- and intra-regional flows, we form hypotheses about reasonable growth rates for all inter- and intra-regional mail flows.
Table C.2: 2016-2021 Annual growth rates calculation (regional outbound)
Table C.3: 2016-2021 Annual growth rates calculation (regional inbound)
50
From To
E-commerce exporters
Industrialised countries
Transition economies Developing countries
Growth rate
WeightGrowth rate
WeightGrowth rate
WeightGrowth rate
Weight
E-commerce exporters
35% 42% 20% 64% 35% 46% 35% 49%
Industrialised countries
15% 45% 10% 17% 10% 33% 10% 29%
Transition economies
15% 4% 10% 7% 15% 10% 15% 10%
Developing countries
15% 9% 5% 11% 15% 10% 15% 12%
Avg. 23% 16% 23% 23%
FromTo

Hard facts. Clear Stories.
ABOUT COPENHAGEN ECONOMICS
Copenhagen Economics is the leading economic consultancy in the Nordic region. Founded in2000, the firm counts more than 70 people and operates across the world. Global CompetitionReview (CGR) lists Copenhagen Economics as one of the top 20 economic consultancies in theworld.
We provide independent advice based on recognised research methods, and our experts havein-depth sector knowledge.
www.copenhageneconomics.com
Related Documents