September 06, 2012 The Philippine Stock Exchange, Inc. 3F Philippine Stock Exchange Plaza Ayala Triangle, Ayala Avenue Makati City Attention: Ms. Janet A. Encarnacion Head, Disclosure Department Gentlemen: We are attaching the amended “2012 2 nd Quarter Report (SEC Form 17-Q)” and the SEC checklist of the required disclosures with our comments/ explanations to comply with their requirements. We trust the foregoing meets your requirements. Very truly yours, TERESA CECILIA H. REYES Vice President – Finance

Welcome message from author
This document is posted to help you gain knowledge. Please leave a comment to let me know what you think about it! Share it to your friends and learn new things together.
Transcript
September 06, 2012 The Philippine Stock Exchange, Inc. 3F Philippine Stock Exchange Plaza Ayala Triangle, Ayala Avenue Makati City Attention: Ms. Janet A. Encarnacion Head, Disclosure Department Gentlemen: We are attaching the amended “2012 2nd Quarter Report (SEC Form 17-Q)” and the SEC checklist of the required disclosures with our comments/ explanations to comply with their requirements. We trust the foregoing meets your requirements. Very truly yours, TERESA CECILIA H. REYES Vice President – Finance

SEC FORM 17-Q
CHECKLIST OF REQUIRED DISCLOSURES
SM PRIME HOLDINGS, INC.
For the Quarter Ended: June 30, 2012
SUMMARY OF COMMENTS SEC Remarks Company’s
Comments
General Instruction: If any of the following is not
applicable, please state/explain in a separate covering
letter.
PART I – FINANCIAL INFORMATION
3. Interim Statements of Comprehensive Income for the
current interim period and cumulatively for current financial
year to date, with comparative Income Statements for the
comparable interim periods (current and year-to-date) of
the immediately preceding financial year.
2nd Qtr. - January to June of the current interim period
Incomplete –
Statement of
Comprehensive Income
for Three Months
Ended June 30, 2012 &
2011
See attached
“Consolidated
Statements of
Comprehensive
Income” for Three
Months Ended June
30, 2012 & 2011
- January to June of the preceding financial year
- April to June of the current interim period
- April to June of the preceding financial year
Notes to Interim Financial Statements:
Item 2. Management’s Discussion and Analysis (MDA) of Financial Condition and Results of Operations
[Part III, Par. (A)(2)(b)]
FINANCIAL RISK DISCLOSURE
b. Evaluate whether the company could provide clearer
and more transparent disclosure regarding its financial
instruments including but not limited to the following
information:
3. The significant judgments made in classifying a
particular financial instrument in the fair value hierarchy; Not complied with
See FS. Note 21
Financial Instruments
Pages 38-39
c. If any one of the foregoing disclosure is not applicable to
the company, so state in the report and provide a brief
explanation.
ADDITIONAL REQUIREMENTS (SRC Rule 68, as amended October 2011)
A schedule showing financial soundness indicators in two
comparative period as follows: 1) current/liquidity ratios; 2)
solvency ratios, debt-to-equity ratio; 3) asset-to-equity ratio;
4) interest rate coverage ratio; 5) profitability ratio and 6)
other relevant ratio as the Commission may prescribe.
Not complied with
See attached “Key
Performance
Indicators”

A S 0 9 4 - 0 0 0 0 8 8 SEC Registration Number
S M P R I M E H O L D I N G S , I N C . A N D S U B S I
D D I A R I E S
(Company’s Full Name)
M a l l o f A s i a A r e n a A n n e x B u i l d i n g
, C o r a l W a y c o r . J . W . D i o k n o B l v d
. , M a l l o f A s i a C o m p l e x , B r g y . 7 6
Z o n e 1 0 , C B P - 1 A , P a s a y C i t y 1 3 0 0 (Business Address: No. Street City/Town/Province)
Mr. Jeffrey C. Lim 831-1000 (Contact Person) (Company Telephone Number)
0 6 3 0 1 7 - Q Month Day (Form Type) Month Day
(Fiscal Year) (Annual Meeting)
(Secondary License Type, If Applicable)
Dept. Requiring this Doc. Amended Articles Number/Section
Total Amount of Borrowings
Total No. of Stockholders Domestic Foreign
To be accomplished by SEC Personnel concerned
File Number LCU
Document ID Cashier
S T A M P S
Remarks: Please use BLACK ink for scanning purposes.
COVER SHEET
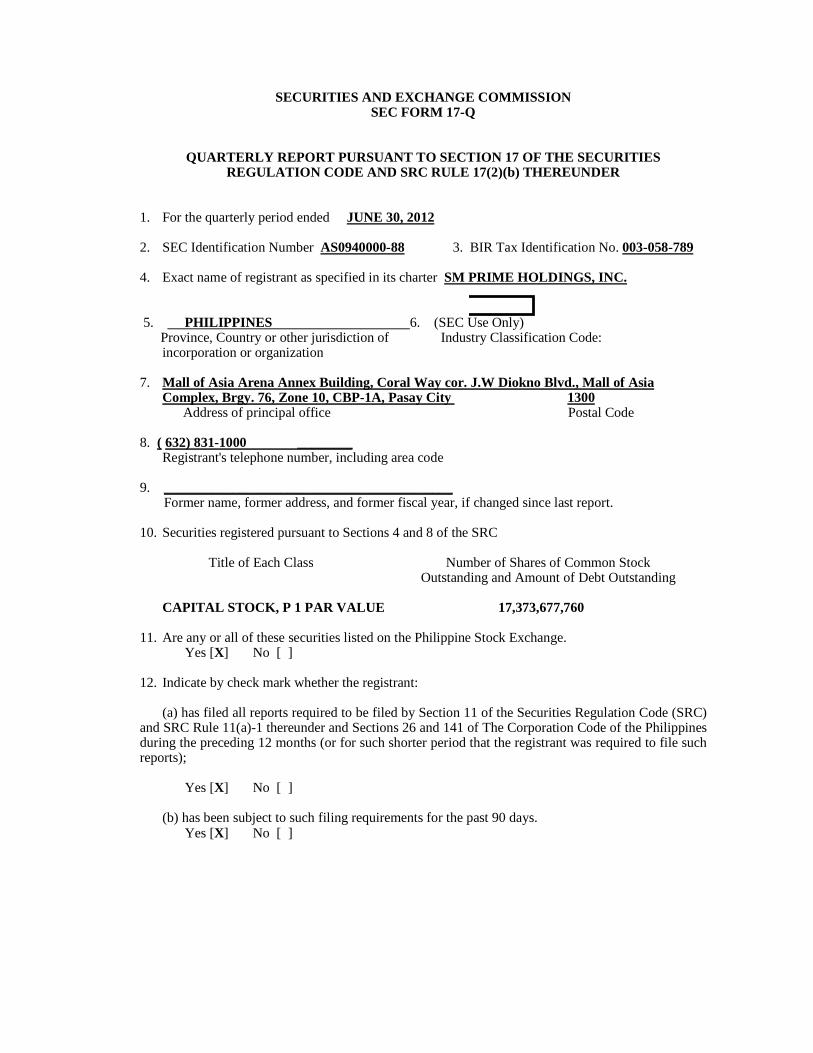
SECURITIES AND EXCHANGE COMMISSION SEC FORM 17-Q
QUARTERLY REPORT PURSUANT TO SECTION 17 OF THE SECURITIES REGULATION CODE AND SRC RULE 17(2)(b) THEREUNDER
1. For the quarterly period ended JUNE 30, 2012
2. SEC Identification Number AS0940000-88 3. BIR Tax Identification No. 003-058-789 4. Exact name of registrant as specified in its charter SM PRIME HOLDINGS, INC.
5. PHILIPPINES 6. (SEC Use Only) Province, Country or other jurisdiction of
incorporation or organization Industry Classification Code:
7. Mall of Asia Arena Annex Building, Coral Way cor. J.W Diokno Blvd., Mall of Asia
Complex, Brgy. 76, Zone 10, CBP-1A, Pasay City 1300 Address of principal office Postal Code 8. ( 632) 831-1000 ________ Registrant's telephone number, including area code 9. __________________________________________ Former name, former address, and former fiscal year, if changed since last report. 10. Securities registered pursuant to Sections 4 and 8 of the SRC Title of Each Class Number of Shares of Common Stock
Outstanding and Amount of Debt Outstanding CAPITAL STOCK, P 1 PAR VALUE 17,373,677,760 11. Are any or all of these securities listed on the Philippine Stock Exchange. Yes [X] No [ ] 12. Indicate by check mark whether the registrant: (a) has filed all reports required to be filed by Section 11 of the Securities Regulation Code (SRC) and SRC Rule 11(a)-1 thereunder and Sections 26 and 141 of The Corporation Code of the Philippines during the preceding 12 months (or for such shorter period that the registrant was required to file such reports); Yes [X] No [ ] (b) has been subject to such filing requirements for the past 90 days. Yes [X] No [ ]

SM Prime Holdings, Inc. and Subsidiaries
Consolidated Financial Statements
June 30, 2012 and December 31, 2011
and Six Months Ended June 30, 2012 and 2011

SM PRIME HOLDINGS, INC. AND SUBSIDIARIES CONSOLIDATED BALANCE SHEETS
June 30, 2012
(Unaudited)
December 31, 2011
(Audited)
ASSETS
Current Assets Cash and cash equivalents (Notes 6, 18, 20 and 21) P=12,496,758,506 P=8,290,216,039 Short-term investments (Notes 7, 18, 20 and 21) 842,400,000 876,800,000 Investments held for trading (Notes 8, 18, 20 and 21) 747,147,955 812,953,412 Receivables (Notes 9, 18, 20 and 21) 4,902,431,251 4,940,102,186 Available-for-sale investments (Notes 12, 18, 20 and 21) 1,000,000,000 1,000,000,000 Prepaid expenses and other current assets (Note 10) 1,742,902,480 1,276,452,460 Total Current Assets 21,731,640,192 17,196,524,097
Noncurrent Assets Investment properties - net (Notes 11 and 18) 115,133,968,663 107,836,216,127 Derivative assets (Notes 20 and 21) 105,169,566 115,618,680 Deferred tax assets (Note 16) 216,092,259 254,132,999 Other noncurrent assets (Note 11) 3,693,642,099 3,153,887,932 Total Noncurrent Assets 119,148,872,587 111,359,855,738
P=140,880,512,779 P=128,556,379,835
LIABILITIES AND STOCKHOLDERS’ EQUITY
Current Liabilities Accounts payable and other current liabilities (Notes 13, 18, 20 and 21) P=10,653,073,668 P=10,150,278,123 Current portion of long-term debt (Notes 14, 18, 20 and 21) 892,042,323 799,086,409 Income tax payable 489,033,911 623,013,182 Total Current Liabilities 12,034,149,902 11,572,377,714
Noncurrent Liabilities Long-term debt - net of current portion (Notes 14, 18, 20 and 21) 51,051,604,093 40,093,522,320 Tenants’ deposits (Notes 19, 20 and 21) 7,794,543,341 7,467,302,387 Deferred tax liabilities (Note 16) 1,261,539,026 1,258,514,789 Derivative liabilities (Notes 20 and 21) 248,285,787 237,979,926 Liability for purchased land - net of current portion 1,460,554,452 1,551,018,812 Other noncurrent liabilities (Notes 11, 18, 20 and 21) 1,879,761,958 2,028,857,966 Total Noncurrent Liabilities 63,696,288,657 52,637,196,200
Equity Attributable to Equity Holders of the Parent Capital stock (Notes 15 and 22) 17,392,534,760 13,917,800,067 Additional paid-in capital - net (Notes 2 and 15) 8,219,067,298 8,219,067,298 Cumulative translation adjustment (Note 15) 584,506,984 872,658,862 Retained earnings (Note 15): Appropriated 27,000,000,000 7,000,000,000 Unappropriated 11,285,009,830 33,865,609,976 Treasury stock (Notes 15 and 22) (101,474,705) (101,474,705) Total Equity Attributable to Equity Holders of the Parent (Note 20) 64,379,644,167 63,773,661,498
Non-controlling Interests (Notes 2 and 15) 770,430,053 573,144,423 Total Stockholders’ Equity 65,150,074,220 64,346,805,921
P=140,880,512,779 P=128,556,379,835
See accompanying Notes to Consolidated Financial Statements.
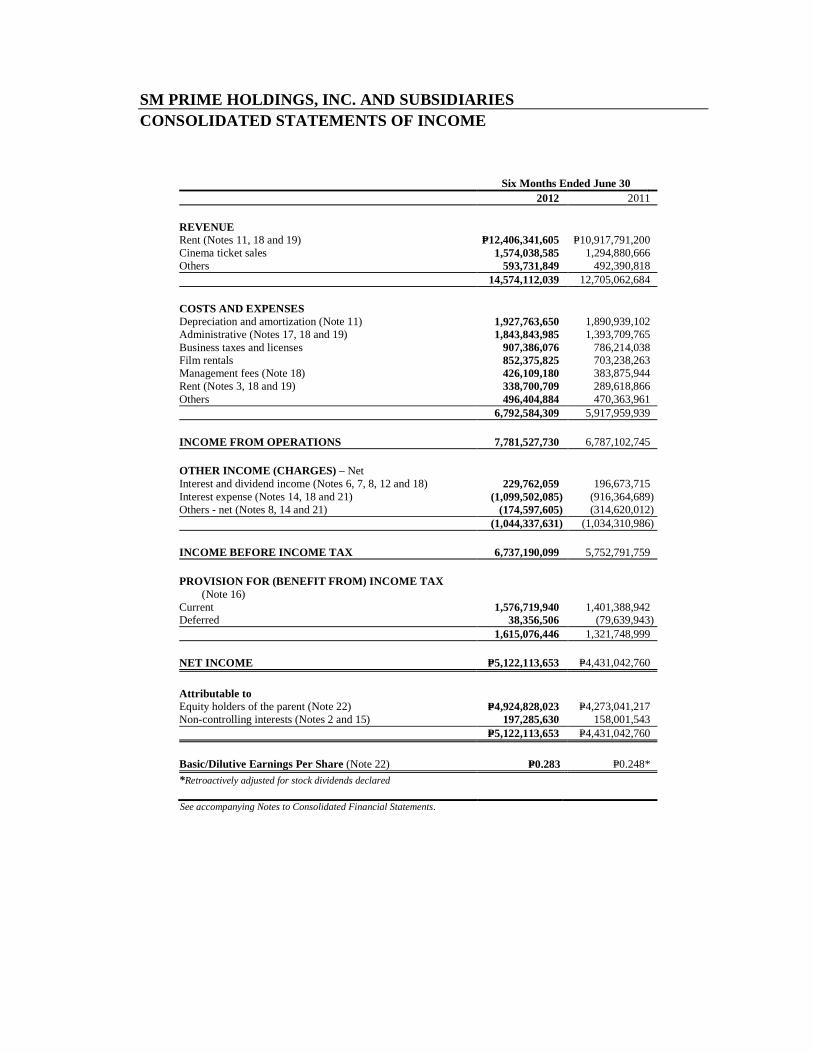
SM PRIME HOLDINGS, INC. AND SUBSIDIARIES CONSOLIDATED STATEMENTS OF INCOME
Six Months Ended June 30 2012 2011
REVENUE Rent (Notes 11, 18 and 19) P=12,406,341,605 P=10,917,791,200 Cinema ticket sales 1,574,038,585 1,294,880,666 Others 593,731,849 492,390,818 14,574,112,039 12,705,062,684
COSTS AND EXPENSES Depreciation and amortization (Note 11) 1,927,763,650 1,890,939,102 Administrative (Notes 17, 18 and 19) 1,843,843,985 1,393,709,765 Business taxes and licenses 907,386,076 786,214,038 Film rentals 852,375,825 703,238,263 Management fees (Note 18) 426,109,180 383,875,944 Rent (Notes 3, 18 and 19) 338,700,709 289,618,866 Others 496,404,884 470,363,961 6,792,584,309 5,917,959,939
INCOME FROM OPERATIONS 7,781,527,730 6,787,102,745
OTHER INCOME (CHARGES) – Net Interest and dividend income (Notes 6, 7, 8, 12 and 18) 229,762,059 196,673,715 Interest expense (Notes 14, 18 and 21) (1,099,502,085) (916,364,689) Others - net (Notes 8, 14 and 21) (174,597,605) (314,620,012) (1,044,337,631) (1,034,310,986)
INCOME BEFORE INCOME TAX 6,737,190,099 5,752,791,759
PROVISION FOR (BENEFIT FROM) INCOME TAX (Note 16)
Current 1,576,719,940 1,401,388,942 Deferred 38,356,506 (79,639,943) 1,615,076,446 1,321,748,999
NET INCOME P=5,122,113,653 P=4,431,042,760
Attributable to Equity holders of the parent (Note 22) P=4,924,828,023 P=4,273,041,217 Non-controlling interests (Notes 2 and 15) 197,285,630 158,001,543 P=5,122,113,653 P=4,431,042,760
Basic/Dilutive Earnings Per Share (Note 22) P=0.283 P=0.248*
*Retroactively adjusted for stock dividends declared
See accompanying Notes to Consolidated Financial Statements.

SM PRIME HOLDINGS, INC. AND SUBSIDIARIES CONSOLIDATED STATEMENTS OF COMPREHENSIVE INCOME Six Months Ended June 30 2012 2011
NET INCOME P=5,122,113,653 P=4,431,042,760
OTHER COMPREHENSIVE INCOME (LOSS) - Net Unrealized loss on available-for-sale investments -net
of tax (Notes 12 and 15) – (2,076,596) Cumulative translation adjustment (Note 15) (288,151,878) 73,126,990 (288,151,878) 71,050,394
TOTAL COMPREHENSIVE INCOME P=4,833,961,775 P=4,502,093,154
Attributable to Equity holders of the parent P=4,636,676,145 P=4,344,091,611 Non-controlling interests (Notes 2 and 15) 197,285,630 158,001,543
P=4,833,961,775 P=4,502,093,154
See accompanying Notes to Consolidated Financial Statements.

SM PRIME HOLDINGS, INC. AND SUBSIDIARIES CONSOLIDATED STATEMENTS OF INCOME
Three Months Ended June 30 2012 2011
REVENUE Rent (Notes 11, 18 and 19) P=6,375,290,397 P=5,662,260,054 Cinema ticket sales 871,043,185 722,349,735 Others 292,821,193 253,515,645 7,539,154,775 6,638,125,434
COSTS AND EXPENSES Depreciation and amortization (Note 11) 987,295,884 964,696,104 Administrative (Notes 17, 18 and 19) 977,532,801 764,234,139 Film rentals 475,402,090 402,144,148 Business taxes and licenses 450,341,573 397,258,868 Management fees (Note 18) 208,086,116 198,626,127 Rent (Notes 3, 18 and 19) 176,151,051 148,318,719 Others 276,083,339 243,617,957 3,550,892,854 3,118,896,062
INCOME FROM OPERATIONS 3,988,261,921 3,519,229,372
OTHER INCOME (CHARGES) – Net Interest and dividend income (Notes 6, 7, 8, 12 and 18) 98,666,801 102,089,286 Interest expense (Notes 14, 18 and 21) (551,359,284) (485,577,343) Others - net (Notes 8, 14 and 21) (137,283,156) (232,270,097) (589,975,639) (615,758,154)
INCOME BEFORE INCOME TAX 3,398,286,282 2,903,471,218
PROVISION FOR (BENEFIT FROM) INCOME TAX (Note 16)
Current 788,813,882 726,483,945 Deferred 20,076,116 (54,174,342) 808,889,998 672,309,603
NET INCOME P=2,589,396,284 P=2,231,161,615
Attributable to Equity holders of the parent (Note 22) P=2,490,958,554 P=2,153,974,699 Non-controlling interests (Notes 2 and 15) 98,437,730 77,186,916 P=2,589,396,284 P=2,231,161,615
See accompanying Notes to Consolidated Financial Statements.
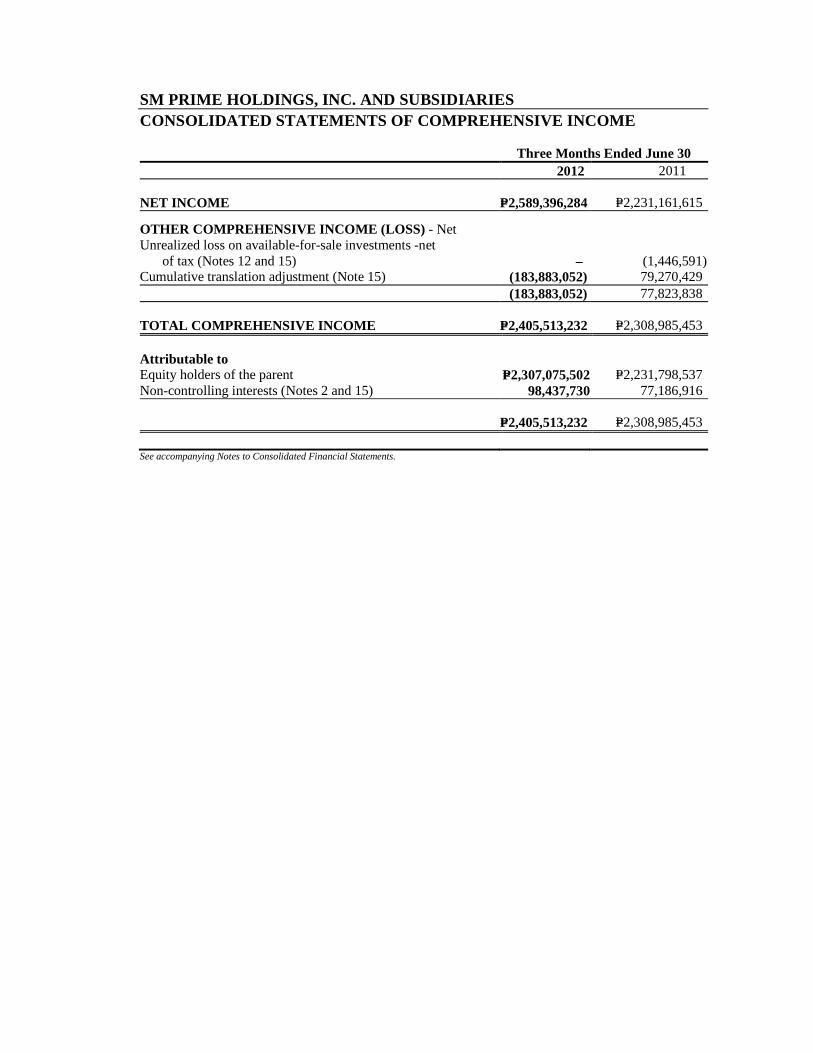
SM PRIME HOLDINGS, INC. AND SUBSIDIARIES CONSOLIDATED STATEMENTS OF COMPREHENSIVE INCOME Three Months Ended June 30 2012 2011
NET INCOME P=2,589,396,284 P=2,231,161,615
OTHER COMPREHENSIVE INCOME (LOSS) - Net Unrealized loss on available-for-sale investments -net
of tax (Notes 12 and 15) – (1,446,591) Cumulative translation adjustment (Note 15) (183,883,052) 79,270,429 (183,883,052) 77,823,838
TOTAL COMPREHENSIVE INCOME P=2,405,513,232 P=2,308,985,453
Attributable to Equity holders of the parent P=2,307,075,502 P=2,231,798,537 Non-controlling interests (Notes 2 and 15) 98,437,730 77,186,916
P=2,405,513,232 P=2,308,985,453
See accompanying Notes to Consolidated Financial Statements.
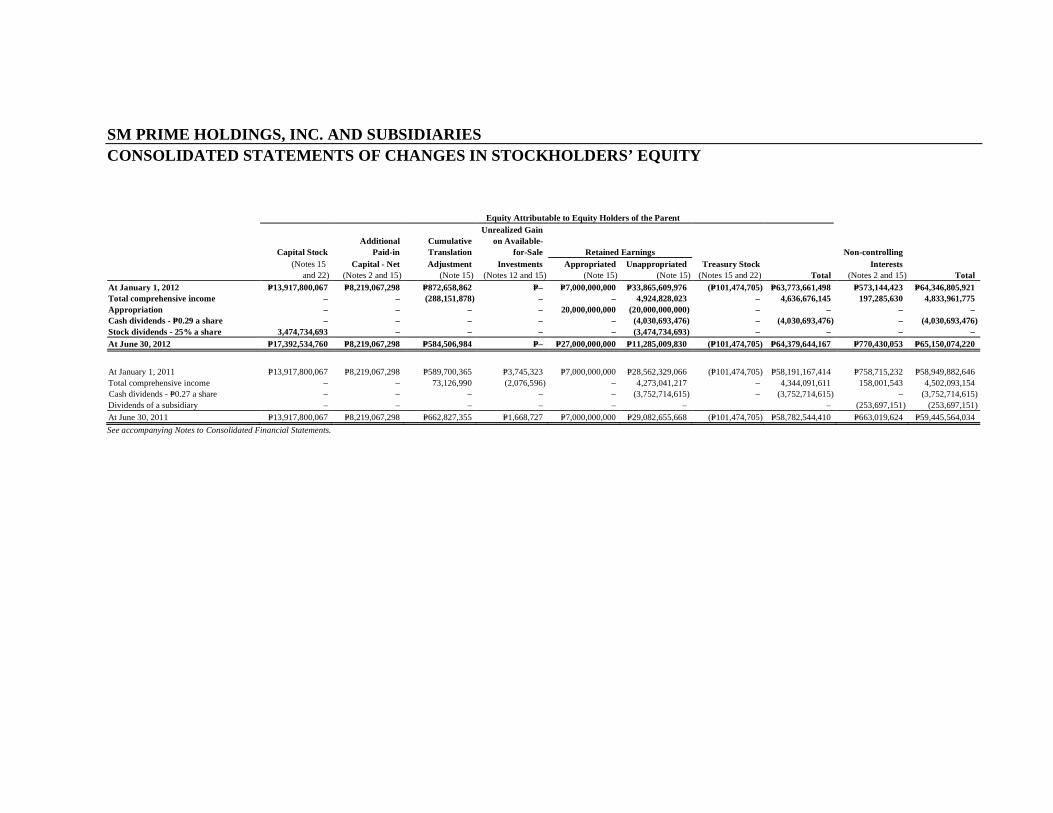
SM PRIME HOLDINGS, INC. AND SUBSIDIARIES CONSOLIDATED STATEMENTS OF CHANGES IN STOCKHOLDERS’ EQUITY Equity Attributable to Equity Holders of the Parent Unrealized Gain Additional Cumulative on Available- Capital Stock Paid-in Translation for-Sale Retained Earnings Non-controlling (Notes 15 Capital - Net Adjustment Investments Appropriated Unappropriated Treasury Stock Interests and 22) (Notes 2 and 15) (Note 15) (Notes 12 and 15) (Note 15) (Note 15) (Notes 15 and 22) Total (Notes 2 and 15) Total At January 1, 2012 P=13,917,800,067 P=8,219,067,298 P=872,658,862 P=– P=7,000,000,000 P=33,865,609,976 (P=101,474,705) P=63,773,661,498 P=573,144,423 P=64,346,805,921 Total comprehensive income – – (288,151,878) – – 4,924,828,023 – 4,636,676,145 197,285,630 4,833,961,775 Appropriation – – – – 20,000,000,000 (20,000,000,000) – – – – Cash dividends - P=0.29 a share – – – – – (4,030,693,476) – (4,030,693,476) – (4,030,693,476) Stock dividends - 25% a share 3,474,734,693 – – – – (3,474,734,693) – – – – At June 30, 2012 P=17,392,534,760 P=8,219,067,298 P=584,506,984 P=– P=27,000,000,000 P=11,285,009,830 (P=101,474,705) P=64,379,644,167 P=770,430,053 P=65,150,074,220
At January 1, 2011 P=13,917,800,067 P=8,219,067,298 P=589,700,365 P=3,745,323 P=7,000,000,000 P=28,562,329,066 (P=101,474,705) P=58,191,167,414 P=758,715,232 P=58,949,882,646 Total comprehensive income – – 73,126,990 (2,076,596) – 4,273,041,217 – 4,344,091,611 158,001,543 4,502,093,154 Cash dividends - P=0.27 a share – – – – – (3,752,714,615) – (3,752,714,615) – (3,752,714,615) Dividends of a subsidiary – – – – – – – (253,697,151) (253,697,151) At June 30, 2011 P=13,917,800,067 P=8,219,067,298 P=662,827,355 P=1,668,727 P=7,000,000,000 P=29,082,655,668 (P=101,474,705) P=58,782,544,410 P=663,019,624 P=59,445,564,034
See accompanying Notes to Consolidated Financial Statements.

SM PRIME HOLDINGS, INC. AND SUBSIDIARIES CONSOLIDATED STATEMENTS OF CASH FLOWS
Six Months Ended June 30 2012 2011
CASH FLOWS FROM OPERATING ACTIVITIES Income before income tax and non-controlling interests P=6,737,190,099 P=5,752,791,759 Adjustments for: Depreciation and amortization (Note 11) 1,927,763,650 1,890,939,102 Interest expense (Notes 14, 18 and 21) 1,099,502,085 916,364,689 Interest and dividend income (Notes 6, 7, 8, 12 and 18) (229,762,059) (196,673,715) Unrealized mark-to-market loss on derivatives (Note 21) 23,927,896 119,251,508 Mark-to-market loss on derivatives (Note 21) 1,114,580 38,123,249 Unrealized foreign exchange loss (gain) - net (44,443,102) 80,595,528 Mark-to-market loss on investments
held for trading (Note 8) 1,404,000 6,375,000 Operating income before working capital changes 9,516,697,149 8,607,767,120 Decrease (increase) in: Receivables (22,666,221) 167,359,672 Prepaid expenses and other current assets (467,787,980) (89,471,193) Increase in: Accounts payable and other current liabilities 444,985,740 1,504,767,278 Tenants’ deposits 356,875,567 369,901,113 Cash generated from operations 9,828,104,255 10,560,323,990 Income taxes paid (1,708,714,076) (1,342,839,476) Net cash provided by operating activities 8,119,390,179 9,217,484,514
CASH FLOWS FROM INVESTING ACTIVITIES Decrease (increase) in: Investment properties (Note 11) (10,196,168,984) (6,067,039,401) Other noncurrent assets (544,898,441) 413,853,682 Investments held for trading 55,500,457 (296,725,000) Interest and dividend received 222,852,405 194,333,977 Net cash used in investing activities (10,462,714,563) (5,755,576,742)
CASH FLOWS FROM FINANCING ACTIVITIES Proceeds from availment of loans (Notes 14 and 18) 17,856,250,000 13,102,782,300 Payments of: Loans (Notes 14 and 18) (6,151,625,254) (12,088,413,703) Dividends (4,030,693,476) (3,752,714,615) Interest (1,087,769,778) (989,288,923) Payments to unwinding of interest rate swaps - net (4,287,500) (39,694,500) Decrease in non-controlling interests – (253,697,151) Net cash provided by (used in) financing activities 6,581,873,992 (4,021,026,592)
EFFECT OF EXCHANGE RATE CHANGES ON CASH AND CASH EQUIVALENTS (32,007,141) (2,520,678)
NET INCREASE (DECREASE) IN CASH AND CASH EQUIVALENTS 4,206,542,467 (561,639,498)
CASH AND CASH EQUIVALENTS AT BEGINNING OF YEAR 8,290,216,039 9,719,718,284
CASH AND CASH EQUIVALENTS AT END OF YEAR P=12,496,758,506 P=9,158,078,786
See accompanying Notes to Consolidated Financial Statements.
SM PRIME HOLDINGS, INC. AND SUBSIDIARIES NOTES TO CONSOLIDATED FINANCIAL STATEMENTS 1. Corporate Information
SM Prime Holdings, Inc. (SMPH or the Parent Company) was incorporated in the Philippines and registered with the Securities and Exchange Commission (SEC) on January 6, 1994. The Parent Company and its subsidiaries (collectively referred to as “the Company”) develop, conduct, operate and maintain the business of modern commercial shopping centers and all businesses related thereto, such as the conduct, operation and maintenance of shopping center spaces for rent, amusement centers, or cinema theaters within the compound of the shopping centers. Its main sources of revenue include rent income from leases in mall and food court, cinema ticket sales and amusement income from bowling, ice skating and others.
The Parent Company’s shares of stock are publicly traded in the Philippine Stock Exchange (PSE).
The Parent Company is 21.65% and 40.96% directly-owned by SM Investments Corporation (SMIC) and SM Land, Inc. (SM Land), respectively. SM Land is a 66.89% owned subsidiary of SMIC. SMIC, the ultimate parent company, is a Philippine corporation which listed its common shares with the PSE in 2005.
The registered office and principal place of business of the Parent Company is Mall of Asia Arena Annex Building, Coral Way cor. J.W. Diokno Blvd., Mall of Asia Complex, Brgy. 76, Zone 10, CBP-1A, Pasay City 1300.
2. Basis of Preparation
The accompanying consolidated financial statements have been prepared on a historical cost basis, except for derivative financial instruments, investments held for trading and available-for-sale (AFS) investments which have been measured at fair value. The consolidated financial statements are presented in Philippine peso, which is the Parent Company’s functional and presentation currency under Philippine Financial Reporting Standards (PFRS). All values are rounded to the nearest peso, except when otherwise indicated.
Statement of Compliance The accompanying consolidated financial statements have been prepared in compliance with PFRS. PFRS includes statements named PFRS, Philippine Accounting Standards (PAS) and Philippine Interpretations from the International Financial Reporting and Interpretations Committee (IFRIC) issued by the Financial Reporting Standards Council (FRSC).
Changes in Accounting Policies and Disclosures The accounting policies adopted are consistent with those of the previous financial year, except for the following amended PAS and Philippine Interpretations which the Company has adopted during the year:
� PAS 1, Presentation of Financial Statements - Presentation of Items of Other Comprehensive Income (OCI),
� PAS 12, Income Taxes (Amendment) - Recovery of Underlying Assets,
- 2 -
� PFRS 7, Financial Instruments: Disclosures - Enhanced Derecognition Disclosure Requirements.
The adoption of these new standards or interpretations has no material effect on the consolidated financial statements.
Future Changes in Accounting Policies
Standards and Interpretations The Company did not early adopt the following standards and Philippine Interpretations that have been approved but are not yet effective. The Company will adopt these standards and interpretations on their effective dates.
� PAS 19, Employee Benefits (Amendment), will become effective for annual periods beginning on or after January 1, 2013.
� PAS 27, Separate Financial Statements (as revised in 2011), will become effective for annual periods beginning on or after January 1, 2013.
� PAS 28, Investments in Associates and Joint Ventures (as revised in 2011), will become effective for annual periods beginning on or after January 1, 2013.
� PAS 32, Financial Instruments: Presentation - Offsetting Financial Assets and Financial liabilities, will become effective for annual periods beginning on or after January 1, 2014.
� PFRS 7, Financial Instruments: Disclosures - Offsetting Financial Assets and Financial Liabilities, will become effective for annual periods beginning on or after January 1, 2013.
� PFRS 10, Consolidated Financial Statements, will become effective for annual periods beginning on or after January 1, 2013.
� PFRS 11, Joint Arrangements, will become effective for annual periods beginning on or after January 1, 2013.
� PFRS 12, Disclosure of Interests in Other Entities, will become effective for annual periods beginning on or after January 1, 2013.
� PFRS 13, Fair Value Measurement, will become effective for annual periods beginning on or after January 1, 2013.
� PFRS 9, Financial Instruments: Classification and Measurement, will become effective for annual periods beginning on or after January 1, 2015. PFRS 9 reflects the first phase of the work on the replacement of PAS 39 and applies to classification and measurement of financial assets and financial liabilities as defined in PAS 39. In subsequent phases, hedge accounting and impairment of financial assets will be addressed with the completion of this project expected in 2012. The adoption of the first phase of PFRS 9 will have an effect on the classification and measurement of the Company’s financial assets, but will potentially have no impact on classification and measurements of financial liabilities. The Company will quantify the effect in conjunction with the other phases, when issued, to present a comprehensive picture. As of June 30, 2012, the Company has decided not to early adopt PFRS 9 on its consolidated financial statements.

- 3 -
Basis of Consolidation The consolidated financial statements include the accounts of the Parent Company and the following subsidiaries:
Company Country of
Incorporation Percentage of Ownership
SM Malls Owned 2012 2011 First Asia Realty Development Corporation
(FARDC) Philippines 74.19 74.19 SM Megamall Premier Central, Inc. - do - 100.00 100.00 SM City Clark Consolidated Prime Dev. Corp. - do - 100.00 100.00 SM City Dasmariñas Premier Southern Corp. - do - 100.00 100.00 SM City Batangas and SM City
Lipa San Lazaro Holdings Corporation - do - 100.00 100.00 – Southernpoint Properties Corp. (SPC) - do - 100.00 100.00 – First Leisure Ventures Group Inc. (FLVGI) - do - 50.00 50.00 SM by the Bay Affluent Capital Enterprises Limited (Affluent)
and Subsidiaries British Virgin
Islands 100.00 100.00 SM City Xiamen and SM City
Chengdu Mega Make Enterprises Limited (Mega Make)
and Subsidiaries - do - 100.00 100.00 SM City Jinjiang Springfield Global Enterprises Limited
(Springfield) - do- 100.00 100.00 – SM Land (China) Limited (SM Land China)
and Subsidiaries Hong Kong 100.00 100.00 SM Suzhou
FLVGI is accounted for as a subsidiary by virtue of control, as evidenced by the majority members of the Board of Directors (BOD) representing the Parent Company.
The financial statements of the subsidiaries are prepared for the same reporting year as the Parent Company, using consistent accounting policies.
All intracompany balances, transactions, income and expenses resulting from intracompany transactions are eliminated in full.
Subsidiaries are consolidated from the date of acquisition, being the date on which the Company obtains control, and continue to be consolidated until the date that such control ceases.
Non-controlling interests represent the portion of profit or loss and net assets not held by the Company and are presented separately in the consolidated statements of income and within stockholders’ equity in the consolidated balance sheets, separately from equity attributable to equity holders of the parent.
3. Significant Accounting Judgments, Estimates and Assumptions
The preparation of the Company’s consolidated financial statements requires management to make judgments, estimates and assumptions that affect the reported amounts of revenue, expenses, assets and liabilities, and the disclosures of contingent liabilities, at the reporting date. However, uncertainty about the assumptions and estimates could result in outcomes that could require a material adjustment to the carrying amount of the asset or liability affected in the future.
Judgments In the process of applying the Company’s accounting policies, management has made the following judgments, apart from those involving estimates and assumptions, which have the most significant effect on the amounts recognized in the consolidated financial statements.
Operating Lease Commitments - Company as Lessor. The Company has entered into commercial property leases on its investment property portfolio. The Company has determined, based on an

- 4 -
evaluation of the terms and conditions of the arrangements, that it retains all the significant risks and rewards of ownership of the properties and thus accounts for the contracts as operating leases.
Rent income amounted to P=12,406 million and P=10,918 million for the six months ended June 30, 2012 and 2011, respectively.
Operating Lease Commitments - Company as Lessee. The Company has entered into various lease agreements as a lessee. Management has determined that all the significant risks and benefits of ownership of the properties, which the Company leases under operating lease arrangements, remain with the lessor. Accordingly, the leases were accounted for as operating leases.
Rent expense amounted to P=339 million and P=290 million for the six months ended June 30, 2012 and 2011, respectively (see Note 19).
Estimates and Assumptions The key estimates and assumptions that may have significant risks of causing material adjustments to the carrying amounts of assets and liabilities within the next financial year are discussed below.
Estimation of Allowance for Impairment Losses on Receivables. The Company maintains an allowance for impairment losses at a level considered adequate to provide for potential uncollectible receivables. The level of allowance is evaluated by the Company on the basis of factors that affect the collectability of the accounts. These factors include, but are not limited to, the length of the Company’s relationship with the customers, average age of accounts and collection experience. The Company performs a regular review of the age and status of these accounts, designed to identify accounts with objective evidence of impairment and provide the appropriate allowance for impairment losses. The amount and timing of recorded expenses for any period would differ if the Company made different judgments or utilized different methodologies. An increase in allowance for impairment losses would increase the recorded operating expenses and decrease current assets.
The carrying amount of receivables amounted to P=4,902 million and P=4,940 million as of June 30, 2012 and December 31, 2011, respectively (see Note 9).
Impairment of AFS Investments. The Company treats AFS investments as impaired when there has been a significant or prolonged decline in the fair value below its cost or whether other objective evidence of impairment exists. The determination of what is ‘significant’ or ‘prolonged’ requires judgment. The Company treats ‘significant’ generally as 20% or more of the original cost of investment, and ‘prolonged’ as period longer than 12 months. In addition, the Company evaluates other factors, including normal volatility in share price for quoted equities and future cash flows and the discount factors for unquoted equities.
The Company’s AFS investments amounted to P=1,000 million as of June 30, 2012 and December 31, 2011 (see Note 12).
Estimation of Useful Lives of Investment Properties. The useful life of each of the Company’s investment property is estimated based on the period over which the asset is expected to be available for use. Such estimation is based on a collective assessment of industry practice, internal technical evaluation and experience with similar assets. The estimated useful life of each asset is reviewed periodically and updated if expectations differ from previous estimates due to physical wear and tear, technical or commercial obsolescence and legal or other limitations on the use of the asset. It is possible, however, that future results of operations could be materially affected by

- 5 -
changes in the amounts and timing of recorded expenses brought about by changes in the factors mentioned above. A reduction in the estimated useful life of any investment property would increase the recorded operating expenses and decrease investment properties.
There is no change in the estimated useful lives of investment properties in 2012 and 2011.
Impairment of Nonfinancial Assets. The Company assesses at each reporting date whether there is an indication that investment properties may be impaired. An investment property’s recoverable amount is the higher of an investment property’s fair value less costs to sell and its value in use. When the carrying amounts of the investment properties exceed their recoverable amounts, the investment properties are considered impaired and are written down to their recoverable amounts.
The net book value of investment properties amounted to P=115,134 million and P=107,836 million as of June 30, 2012 and December 31, 2011, respectively (see Note 11).
Realizability of Deferred Tax Assets. The Company’s assessment on the recognition of deferred tax assets on deductible temporary differences is based on the projected taxable income in the succeeding periods. This projection is based on the Company’s past and future results of operations.
Deferred tax assets amounted to P=216 million and P=254 million as of June 30, 2012 and December 31, 2011, respectively (see Note 16).
Pension Cost. The determination of the Company’s obligation and cost of pension benefits is dependent on the selection of certain assumptions used by actuaries in calculating such amounts. Those assumptions are described in Note 17 and include, among others, the discount rate, expected rate of return on plan assets and salary increase rate. In accordance with PFRS, actual results that differ from the assumptions are accumulated and amortized over future periods and therefore, generally affect the recognized expense and recorded obligation in such future periods.
Fair Value of Financial Assets and Liabilities. The Company carries certain financial assets and liabilities at fair value in the consolidated balance sheets. Determining the fair value of financial assets and liabilities requires extensive use of accounting estimates and judgment. The significant components of fair value measurement were determined using verifiable objective evidence (i.e., foreign exchange rates, interest rates, volatility rates). However, the amount of changes in fair value would differ if the Company utilized different valuation methodologies and assumptions. Any changes in the fair value of these financial assets and liabilities would affect profit and loss and other comprehensive income.
The methods and assumptions used to estimate the fair value of financial assets and liabilities are discussed in Note 21.
Contingencies. The Company has various legal claims. The Company’s estimates of the probable costs for the resolution of these claims have been developed in consultation with in-house as well as outside counsel handling the prosecution and defense of the cases and are based upon an analysis of potential results. The Company currently does not believe these legal claims will have a material adverse effect on its consolidated financial position and results of operations. It is possible, however, that future results of operations could be materially affected by changes in the estimates or in the effectiveness of strategies relating to these proceedings. No provisions were made in relation to these claims.

- 6 -
4. Summary of Significant Accounting and Financial Reporting Policies
Cash and Cash Equivalents Cash includes cash on hand and in banks. Cash equivalents are short-term, highly liquid investments that are readily convertible to known amounts of cash with original maturities of three months or less from dates of acquisitions and are subject to an insignificant risk of change in value.
Financial Instruments - Initial Recognition and Subsequent Measurement
Date of Recognition. The Company recognizes a financial instrument in the consolidated balance sheets when it becomes a party to the contractual provisions of the instrument. In the case of a regular way purchase or sale of financial assets, recognition and derecognition, as applicable, is done using settlement date accounting. Regular way purchases or sales are purchases or sales of financial assets that require delivery of assets within the period generally established by regulation or convention in the market place. Derivatives are recognized on a trade date basis.
Initial Recognition of Financial Instruments. Financial instruments are recognized initially at fair value, which is the fair value of the consideration given (in case of an asset) or received (in case of a liability). The initial measurement of financial instruments, except for those categorized as at fair value through profit or loss (FVPL), includes transaction costs.
The Company classifies its financial instruments in the following categories: financial assets and financial liabilities at FVPL, loans and receivables, held-to-maturity (HTM) investments, AFS investments and other financial liabilities. The classification depends on the purpose for which the instruments are acquired and whether they are quoted in an active market. Management determines the classification at initial recognition and, where allowed and appropriate, re-evaluates this classification at every reporting date.
Determination of Fair Value. The fair value of financial instruments traded in active markets at the balance sheet date is based on their quoted market price or dealer price quotations (bid price for long positions and ask price for short positions), without any deduction for transaction costs. When current bid and asking prices are not available, the price of the most recent transaction provides evidence of the current fair value as long as there has not been a significant change in economic circumstances since the time of the transaction.
For all other financial instruments not listed in an active market, the fair value is determined by using appropriate valuation techniques. Valuation techniques include net present value techniques, comparison to similar instruments for which market observable prices exist, options pricing models, and other relevant valuation models.
Day 1 Difference. Where the transaction price in a non-active market is different from the fair value based on other observable current market transactions in the same instrument or based on a valuation technique whose variables include only data from observable market, the Company recognizes the difference between the transaction price and fair value (a ‘Day 1’ difference) in the consolidated statements of income unless it qualifies for recognition as some other type of asset. In cases where unobservable data is used, the difference between the transaction price and model value is only recognized in the consolidated statements of income only when the inputs become observable or when the instrument is derecognized. For each transaction, the Company determines the appropriate method of recognizing the ‘Day 1’ difference amount.
- 7 -
Financial Assets and Liabilities at FVPL. Financial assets and liabilities at FVPL include financial assets and liabilities held for trading and financial assets and liabilities designated upon initial recognition as at FVPL.
Financial assets and liabilities are classified as held for trading if they are acquired for the purpose of selling in the near term. Derivatives, including any separated derivatives, are also classified under financial assets or liabilities at FVPL, unless these are designated as hedging instruments in an effective hedge or financial guarantee contracts. Gains or losses on investments held for trading are included in the consolidated statements of income under the “Others - net” account. Interest income on investments held for trading is included in the consolidated statements of income under the “Interest and dividend income” account. Instruments under this category are classified as current assets if these are hold primarily for the purpose of trading or expected to be realized/settled within 12 months from balance sheet date. Otherwise, these are classified as noncurrent assets.
Financial assets and liabilities may be designated by management at initial recognition as at FVPL when any of the following criteria is met:
� the designation eliminates or significantly reduces the inconsistent treatment that would otherwise arise from measuring the assets and liabilities or recognizing gains or losses on a different basis; or
� the assets and liabilities are part of a group of financial assets, financial liabilities or both which are managed and their performance are evaluated on a fair value basis, in accordance with a documented risk management or investment strategy; or
� the financial instrument contains an embedded derivative, unless the embedded derivative does not significantly modify the cash flows or it is clear, with little or no analysis, that it would not be separately recorded.
Classified as financial assets at FVPL are the Company’s investments held for trading and derivative assets. The aggregate carrying values of financial assets under this category amounted to P=852 million and P=929 million as of June 30, 2012 and December 31, 2011, respectively. Included under financial liabilities at FVPL are the Company’s derivative liabilities. The carrying values of financial liabilities at FVPL amounted to P=248 million and P=238 million as of June 30, 2012 and December 31, 2011, respectively (see Note 21).
Loans and Receivables. Loans and receivables are nonderivative financial assets with fixed or determinable payments that are not quoted in an active market. They are not entered into with the intention of immediate or short-term resale and are not designated as AFS investments or financial assets at FVPL. Loans and receivables are included in current assets if maturity is within 12 months from balance sheet date. Otherwise, these are classified as noncurrent assets.
After initial measurement, loans and receivables are subsequently measured at amortized cost using the effective interest method, less allowance for impairment. Amortized cost is calculated by taking into account any discount or premium on acquisition and fees that are an integral part of the effective interest rate. Gains and losses are recognized in the consolidated statements of income when the loans and receivables are derecognized and impaired, as well as through the amortization process.
Classified under this category are the Company’s cash and cash equivalents, short-term investments and receivables. The aggregate carrying values of financial assets under this category
- 8 -
amounted to P=18,242 million and P=14,107 million as of June 30, 2012 and December 31, 2011, respectively (see Note 21).
HTM Investments. HTM investments are quoted nonderivative financial assets with fixed or determinable payments and fixed maturities for which the Company’s management has the positive intention and ability to hold to maturity. Where the Company sells other than an insignificant amount of HTM investments, the entire category would be tainted and reclassified as AFS investments. After initial measurement, these investments are measured at amortized cost using the effective interest method, less impairment in value. Amortized cost is calculated by taking into account any discount or premium on acquisition and fees that are an integral part of the effective interest rate. Gains and losses are recognized in the consolidated statements of income when the HTM investments are derecognized or impaired, as well as through the amortization process. Assets under this category are classified as current assets if maturity is within 12 months from balance sheet date and as noncurrent assets if maturity date is more than 12 months from balance sheet date.
The Company has no investments classified as HTM as of June 30, 2012 and December 31, 2011.
AFS Investments. AFS investments are nonderivative financial assets that are designated in this category or are not classified in any of the other categories. They are purchased and held indefinitely, and may be sold in response to liquidity requirements or changes in market conditions. Subsequent to initial recognition, AFS investments are carried at fair value in the consolidated balance sheets. Changes in the fair value of such assets are reported as unrealized gain or loss on AFS investments recognized as other comprehensive income in the consolidated statements of comprehensive income until the investment is derecognized or the investment is determined to be impaired. On derecognition or impairment, the cumulative gain or loss previously reported in consolidated statements of comprehensive income is transferred to the consolidated statements of income. Assets under this category are classified as current assets if management intends to sell these financial assets within 12 months from balance sheet date. Otherwise, these are classified as noncurrent assets.
Classified under this category are the Company’s investments in corporate notes and redeemable preferred shares. The carrying values of financial assets classified under this category amounted to P=1,000 million as of June 30, 2012 and December 31, 2011 (see Note 21).
Other Financial Liabilities. This category pertains to financial liabilities that are not held for trading or not designated as at FVPL upon the inception of the liability. These include liabilities arising from operations or borrowings.
Other financial liabilities are recognized initially at fair value and are subsequently carried at amortized cost, taking into account the impact of applying the effective interest method of amortization (or accretion) for any related premium, discount and any directly attributable transaction costs. Gains and losses are recognized in the consolidated statements of income when the liabilities are derecognized, as well as through the amortization process. Other financial liabilities are classified as current liabilities if settlement is within 12 months from balance sheet date. Otherwise, these are classified as noncurrent liabilities.
This category includes accounts payable and other current liabilities, long-term debt, tenants’ deposits, liability for purchased land and other noncurrent liabilities (except for taxes payables and other payables covered by other accounting standards). The carrying values of financial liabilities under this category amounted to P=72,770 million and P=61,412 million as of June 30, 2012 and December 31, 2011, respectively (see Note 21).
- 9 -
Classification of Financial Instruments Between Debt and Equity A financial instrument is classified as debt if it provides for a contractual obligation to:
� deliver cash or another financial asset to another entity;
� exchange financial assets or financial liabilities with another entity under conditions that are potentially unfavorable to the Company; or
� satisfy the obligation other than by the exchange of a fixed amount of cash or another financial asset for a fixed number of own equity shares.
If the Company does not have an unconditional right to avoid delivering cash or another financial asset to settle its contractual obligation, the obligation meets the definition of a financial liability.
The components of issued financial instruments that contain both liability and equity elements are accounted for separately, with the equity component being assigned the residual amount after deducting from the instrument as a whole the amount separately determined as the fair value of the liability component on the date of issue.
Debt Issuance Costs Debt issuance costs are deducted against long-term debt and are amortized over the terms of the related borrowings using the effective interest method.
Derivative Financial Instruments The Company uses derivative financial instruments such as long-term currency swaps, foreign currency call options, non-deliverable forwards, foreign currency range options, interest rate swaps and cross currency swaps to hedge the risks associated with foreign currency and interest rate fluctuations (see Note 21). Such derivative financial instruments are initially recognized at fair value on the date on which the derivative contract is entered into and are subsequently re-measured at fair value. Derivatives are carried as assets when the fair value is positive and as liabilities when the fair value is negative.
The Company’s derivative instruments provide economic hedges under the Company’s policies but are not designated as accounting hedges.
Embedded Derivative. An embedded derivative is a component of a hybrid (combined) instrument that also includes a nonderivative host contract with the effect that some of the cash flows of the hybrid instrument vary in a way similar to a stand-alone derivative. An embedded derivative is separated from the host contract and accounted for as a derivative if all of the following conditions are met: a) the economic characteristics and risks of the embedded derivative are not closely related to the economic characteristics and risks of the host contract; b) a separate instrument with the same terms as the embedded derivative would meet the definition of a derivative; and c) the hybrid instrument is not recognized at FVPL.
The Company assesses whether embedded derivatives are required to be separated from the host contracts when the Company becomes a party to the contract. Subsequent reassessment is prohibited unless there is a change in the terms of the contract that significantly modifies the cash flows that otherwise would be required under the contract, in which case reassessment is required. The Company determines whether a modification to cash flows is significant by considering the extent to which the expected future cash flows associated with the embedded derivative, the host contract or both have changed and whether the change is significant relative to the previously expected cash flow on the contract.

- 10 -
Derecognition of Financial Assets and Liabilities
Financial Assets. A financial asset (or, where applicable, a part of a financial asset or part of a group of similar financial assets) is derecognized when:
� the rights to receive cash flows from the asset have expired;
� the Company retains the rights to receive cash flows from the asset, but has assumed an obligation to pay them in full without material delay to a third party under a “pass-through” arrangement; or
� the Company has transferred its rights to receive cash flows from the asset and either (a) has transferred substantially all the risks and rewards of the asset, or (b) has neither transferred nor retained substantially all the risks and rewards of the asset, but has transferred control of the asset.
When the Company has transferred its rights to receive cash flows from an asset and has neither transferred nor retained substantially all the risks and rewards of the asset, nor transferred control of the asset, the asset is recognized to the extent of the Company’s continuing involvement in the asset. Continuing involvement that takes the form of a guarantee over the transferred asset is measured at the lower of original carrying amount of the asset and the maximum amount of consideration that the Company could be required to repay.
Financial Liabilities. A financial liability is derecognized when the obligation under the liability is discharged or cancelled or expired.
When an existing financial liability is replaced by another from the same lender on substantially different terms, or the terms of an existing liability are substantially modified, such modification is treated as a derecognition of the original liability and the recognition of a new liability, and the difference in the respective carrying amounts is recognized in the consolidated statements of income.
Impairment of Financial Assets The Company assesses at each balance sheet date whether a financial asset or a group of financial assets is impaired. A financial asset or a group of financial assets is deemed to be impaired, if and only if, there is objective evidence of impairment as a result of one or more events that occurred after the initial recognition of the asset (an incurred loss event) and that loss event has an impact on the estimated future cash flows of the financial asset or a group of financial assets that can be reliably estimated. Objective evidence of impairment may include indications that the borrower or a group of borrowers is experiencing significant financial difficulty, default or delinquency in interest or principal payments, the probability that they will enter bankruptcy or other financial reorganization and where observable data indicate that there is measurable decrease in the estimated future cash flows, such as changes in arrears or economic conditions that correlate with defaults.
Financial Assets Carried at Amortized Cost. If there is objective evidence that an impairment loss on financial assets carried at amortized cost has been incurred, the amount of the loss is measured as the difference between the asset’s carrying amount and the present value of estimated future cash flows (excluding future credit losses that have not been incurred) discounted at the financial asset’s original effective interest rate (i.e., the effective interest rate computed at initial recognition). The carrying amount of the asset shall be reduced through the use of an allowance account. The amount of the loss shall be recognized in the consolidated statements of income.
- 11 -
The Company first assesses whether objective evidence of impairment exists individually for financial assets that are individually significant, and individually or collectively for financial assets that are not individually significant. If it is determined that no objective evidence of impairment exists for an individually assessed financial asset, whether significant or not, the asset is included in a group of financial assets with similar credit risk characteristics and that group of financial assets is collectively assessed for impairment. Assets that are individually assessed for impairment and for which an impairment loss is or continues to be recognized are not included in a collective assessment of impairment.
If, in a subsequent period, the amount of impairment loss decreases and the decrease can be related objectively to an event occurring after the impairment was recognized, the previously recognized impairment loss is reversed by adjusting the allowance account. The amount of the reversal is recognized in the consolidated statements of income under “Provision for (reversal of) impairment losses” account, to the extent that the carrying value of the asset does not exceed its amortized cost at reversal date. Interest income continues to be accrued on the reduced carrying amount based on the original effective interest rate of the asset. Assets together with the associated allowance are written off when there is no realistic prospect of future recovery and all collateral, if any, has been realized or has been transferred to the Company. If a future write-off is later recovered, the recovery is recognized in the consolidated statements of income under “Others - net” account.
Assets Carried at Cost. If there is objective evidence that an impairment loss has been incurred in an unquoted equity instrument that is not carried at fair value because its fair value cannot be reliably measured, or on a derivative asset that is linked to and must be settled by delivery of such an unquoted equity instrument, the amount of the loss is measured as the difference between the asset’s carrying amount and the present value of estimated future cash flows discounted at the current market rate of return for a similar financial asset.
AFS Investments. In the case of equity instruments classified as AFS investments, evidence of impairment would include a significant or prolonged decline in fair value of investments below its cost. Where there is evidence of impairment, the cumulative loss - measured as the difference between the acquisition cost and the current fair value, less any impairment loss on that financial asset previously recognized in the consolidated statements of income - is removed from the consolidated statements of comprehensive income and recognized in the consolidated statements of income. Impairment losses on equity investments are not reversed through the consolidated statements of income. Increases in fair value after impairment are recognized directly in the consolidated statements of comprehensive income.
In the case of debt instruments classified as AFS investments, impairment is assessed based on the same criteria as financial assets carried at amortized cost. Future interest income is based on the reduced carrying amount of the asset and is accrued based on the rate of interest used to discount future cash flows for the purpose of measuring impairment loss. Such accrual is recorded as part of “Interest and dividend income” account in the consolidated statements of income. If, in subsequent year, the fair value of a debt instrument increased and the increase can be objectively related to an event occurring after the impairment loss was recognized in the consolidated statements of income, the impairment loss is reversed through the consolidated statements of income.

- 12 -
Offsetting Financial Instruments Financial assets and financial liabilities are offset and the net amount is reported in the consolidated balance sheets if, and only if, there is a currently enforceable legal right to offset the recognized amounts and there is an intention to settle on a net basis, or to realize the asset and settle the liability simultaneously. This is not generally the case with master netting agreements, where the related assets and liabilities are presented gross in the consolidated balance sheets.
Business Combinations Business combinations involving entities or businesses under common control are business combinations in which all of the combining entities or businesses are ultimately controlled by the same party or parties both before and after the business combination, and that control is not transitory. Business combinations under common control are accounted for similar to pooling of interest method.
In applying the pooling of interest method, the assets, liabilities and equity of the acquired companies for the reporting period in which the common control business combinations occur and for the comparative periods presented, are included in the consolidated financial statements at their carrying amounts as if the combinations had occurred from the beginning of the earliest period presented in the financial statements, regardless of the actual date of the combination. The excess of the cost of business combinations over the net carrying amounts of the identifiable assets and liabilities of the acquired companies is considered as equity adjustment from business combinations, included under “Additional paid-in capital - net” account in the stockholders’ equity section of the consolidated balance sheets.
Acquisition of Non-controlling Interests Changes in a parent’s ownership interest in a subsidiary that do not result in a loss of control are accounted for as equity transactions (i.e., transactions with owners in their capacity as owners). In such circumstances, the carrying amounts of the controlling and non-controlling interests shall be adjusted to reflect the changes in their relative interests in the subsidiary. Any difference between the amount by which the non-controlling interests are adjusted and the fair value of the consideration paid shall be recognized directly in equity and included under “Additional paid-in capital - net” account in the stockholders’ equity section of the consolidated balance sheets.
Investment Properties Investment properties represent land and land use rights, buildings, structures, equipment and improvements of the shopping malls and shopping mall complex under construction.
Investment properties, except land and shopping mall complex under construction, are measured initially at cost, including transaction costs, less accumulated depreciation and amortization and accumulated impairment in value, if any. The carrying amount includes the cost of replacing part of an existing investment property at the time that cost is incurred if the recognition criteria are met, and excludes the costs of day-to-day servicing of an investment property.
Land is stated at cost less any impairment in value.
Shopping mall complex under construction is stated at cost and includes the cost of land, construction costs, property and equipment, and other direct costs. Cost also includes interest on borrowed funds incurred during the construction period, provided that the carrying amount does not exceed the amount realizable from the use or sale of the asset.

- 13 -
Depreciation and amortization is calculated on a straight-line basis over the following estimated useful lives of the assets:
Land use rights 40–60 years Buildings and improvements 35 years Building equipment, furniture, leasehold improvements and others 3–15 years
The residual values, useful lives and method of depreciation and amortization of the assets are reviewed and adjusted, if appropriate, at each financial year-end.
Shopping mall complex under construction is not depreciated until such time that the relevant assets are completed and put into operational use.
When each major inspection is performed, the cost is recognized in the carrying amount of the investment properties as a replacement, if the recognition criteria are met.
Investment property is derecognized when either it has been disposed or when it is permanently withdrawn from use and no future economic benefit is expected from its disposal. Any gains or losses on the retirement or disposal of an investment property are recognized in the consolidated statements of income in the year of retirement or disposal.
Impairment of Nonfinancial Assets The carrying value of investment properties and other nonfinancial assets is reviewed for impairment when events or changes in circumstances indicate that the carrying value may not be recoverable. If any such indication exists, and if the carrying value exceeds the estimated recoverable amount, the assets or cash-generating units are written down to their recoverable amounts. The recoverable amount of investment properties and other nonfinancial assets is the greater of fair value less costs to sell or value in use. The fair value less costs to sell is the amount obtainable from the sale of an asset in an arm’s-length transaction less costs to sell. In assessing value in use, the estimated future cash flows are discounted to their present value using a pre-tax discount rate that reflects current market assessments of the time value of money and the risks specific to the asset. For an asset that does not generate largely independent cash inflows, the recoverable amount is determined for the cash-generating unit to which the asset belongs. Impairment losses are recognized in the consolidated statements of income in those expense categories consistent with the function of the impaired asset.
An assessment is made at each reporting date as to whether there is any indication that previously recognized impairment losses may no longer exist or may have decreased. If such indication exists, the recoverable amount is estimated. A previously recognized impairment loss is reversed only if there has been a change in the estimates used to determine the asset’s recoverable amount since the last impairment loss was recognized. If that is the case, the carrying amount of the asset is increased to its recoverable amount. That increased amount cannot exceed the carrying amount that would have been determined, net of depreciation and amortization, had no impairment loss been recognized for the asset in prior years. Such reversal is recognized in profit or loss. After such a reversal, the depreciation and amortization charges are adjusted in future periods to allocate the asset’s revised carrying amount, less any residual value, on a systematic basis over its remaining useful life.
Capital Stock Capital stock is measured at par value for all shares issued. When shares are sold at a premium, the difference between the proceeds and the par value is credited to additional paid-in capital account.
- 14 -
Treasury Stock Own equity instruments which are acquired (treasury shares) are deducted from stockholders’ equity and accounted for at cost. No gain or loss is recognized in the consolidated statements of income on the purchase, sale, issuance or cancellation of the Company’s own equity instruments.
Revenue Recognition Revenue is recognized when it is probable that the economic benefits associated with the transaction will flow to the Company and the amount of the revenue can be reliably measured. Revenue is measured at the fair value of the consideration received, excluding discounts and sales taxes. The following specific recognition criteria must also be met before revenue is recognized:
Rent. Revenue is recognized on a straight-line basis over the lease term or based on the terms of the lease, as applicable.
Cinema Ticket Sales, Others. Revenue is recognized upon receipt of cash from the customer which coincides with the rendering of services.
Interest. Revenue is recognized as the interest accrues, taking into account the effective yield on the asset.
Dividend Income. Revenue is recognized when the right to receive the payment is established.
Management Fees Management fees are recognized as expense in accordance with the terms of the management contracts.
Expenses Operating and interest expenses are recognized as incurred.
Pension Cost The Parent Company is a participant in the SM Corporate and Management Companies Employer Retirement Plan. The plan is a funded, noncontributory defined benefit retirement plan administered by a Board of Trustees covering all regular full-time employees. The cost of providing benefits under the defined benefit plan is determined using the projected unit credit method. This method reflects service rendered by employees to the date of valuation and incorporates assumptions concerning the employees’ projected salaries. Pension cost includes current service cost, interest cost, expected return on plan assets, amortization of unrecognized past service costs, recognition of actuarial gains (losses) and effect of any curtailments or settlements. Past service cost is amortized over a period until the benefits become vested. The portion of the actuarial gains and losses is recognized when it exceeds the “corridor” (10% of the greater of the present value of the defined benefit obligation or fair value of the plan assets) at the previous reporting date, divided by the expected average remaining working lives of active plan members.
The amount recognized as net pension asset or liability is the net of the present value of the defined benefit obligation at balance sheet date, plus any actuarial gains (less any actuarial losses) not recognized minus past service cost not yet recognized minus the fair value of plan assets at balance sheet date out of which the obligations are to be settled directly. Foreign Currency-denominated Transactions Transactions in foreign currencies are initially recorded in the functional currency rate at the date of the transaction. Monetary assets and liabilities denominated in foreign currencies are restated at
- 15 -
the functional currency rate of exchange at balance sheet date. All differences are taken to the consolidated statements of income. Non-monetary items that are measured in terms of historical cost in a foreign currency are translated using the exchange rates as at the dates of the initial transactions. Non-monetary items measured at fair value in a foreign currency are translated using the exchange rates at the date when the fair value was determined.
Foreign Currency Translations The assets and liabilities of foreign operations are translated into Philippine peso at the rate of exchange ruling at the balance sheet date and their respective statements of income are translated at the weighted average rates for the year. The exchange differences arising on the translation are included in the consolidated statements of changes in stockholders’ equity under “Cumulative translation adjustment” account. On disposal of a foreign entity, the deferred cumulative amount of exchange differences recognized in stockholders’ equity relating to that particular foreign operation is recognized in profit or loss.
Leases The determination of whether an arrangement is, or contains, a lease is based on the substance of the arrangement at inception date of whether the fulfillment of the arrangement is dependent on the use of a specific asset or assets or the arrangement conveys a right to use the asset.
Company as Lessee. Leases which do not transfer to the Company substantially all the risks and benefits of ownership of the asset are classified as operating leases. Operating lease payments are recognized as expense in the consolidated statements of income on a straight-line basis over the lease term. Associated costs, such as maintenance and insurance, are expensed as incurred.
Company as Lessor. Leases where the Company does not transfer substantially all the risks and benefits of ownership of the asset are classified as operating leases. Rent income from operating leases are recognized as income on a straight-line basis over the lease term or based on the terms of the lease, as applicable. Initial direct costs incurred in negotiating an operating lease are added to the carrying amount of the leased asset and recognized over the lease term on the same basis as rent income. Contingent rents are recognized as revenue in the period in which they are earned.
Provisions Provisions are recognized when the Company has a present obligation (legal or constructive) as a result of a past event, it is probable that an outflow of resources embodying economic benefits will be required to settle the obligation, and a reliable estimate can be made of the amount of the obligation. If the effect of the time value of money is material, provisions are determined by discounting the expected future cash flows at a pre-tax rate that reflects current market assessments of the time value of money and, where appropriate, the risks specific to the liability. Where discounting is used, the increase in the provision due to the passage of time is recognized as interest expense. Where the Company expects a provision to be reimbursed, the reimbursement is recognized as a separate asset but only when the receipt of the reimbursement is virtually certain. Borrowing Costs Borrowing costs are generally expensed as incurred. Borrowing costs are capitalized if they are directly attributable to the acquisition or construction of a qualifying asset. Capitalization of borrowing costs commences when the activities to prepare the asset are in progress and expenditures and borrowing costs are being incurred. Borrowing costs are capitalized until the assets are substantially ready for their intended use. If the carrying amount of the asset exceeds its recoverable amount, an impairment loss is recognized. Borrowing costs include interest charges

- 16 -
and other costs incurred in connection with the borrowing of funds used to finance the shopping mall complex.
Taxes
Current Tax. Current tax assets and liabilities for the current and prior periods are measured at the amount expected to be recovered from or paid to the taxation authorities. The tax rates and tax laws used to compute the amount are those that are enacted or substantively enacted at balance sheet date.
Deferred Tax. Deferred tax is provided using the balance sheet liability method on temporary differences at the balance sheet date between the tax bases of assets and liabilities and their carrying amounts for financial reporting purposes. Deferred tax liabilities are recognized for all taxable temporary differences, except for those that are stated under the standard.
Deferred tax assets are recognized for all deductible temporary differences, carryforward benefits of minimum corporate income tax (MCIT) and net operating loss carryover (NOLCO), to the extent that it is probable that taxable profit will be available against which the deductible temporary differences, and the carryforward benefits of MCIT and NOLCO can be utilized.
The carrying amount of deferred tax assets is reviewed at each balance sheet date and reduced to the extent that it is no longer probable that sufficient taxable profit will be available to allow all or part of the deferred tax assets to be utilized.
Deferred tax assets and liabilities are measured at the tax rates that are expected to apply to the year when the asset is realized or the liability is settled, based on tax rates (and tax laws) that have been enacted or substantively enacted at balance sheet date.
Deferred tax relating to items recognized outside profit or loss is recognized outside profit or loss. Deferred tax items are recognized in correlation to the underlying transaction either in other comprehensive income or directly in equity.
Deferred tax assets and deferred tax liabilities are offset, if a legally enforceable right exists to offset current tax assets against current tax liabilities and the deferred taxes relate to the same taxable entity and the same taxation authority.
Sales Tax. Revenue, expenses and assets are recognized net of the amount of sales tax, except:
� where the sales tax incurred on a purchase of assets or services is not recoverable from the taxation authority, in which case the sales tax is recognized as part of the cost of acquisition of the asset or as part of the expense item as applicable; and
� receivables and payables that are stated with the amount of sales tax included.
The net amount of sales tax recoverable from, or payable to, the taxation authority is included as part of “Prepaid expenses and other current assets” or “Accounts payable and other current liabilities” accounts in the consolidated balance sheets.
Basic/Diluted Earnings Per Share (EPS) Basic/Diluted EPS is computed by dividing the net income for the year by the weighted average number of issued and outstanding shares of stock during the year, with retroactive adjustments for any stock dividends declared.

- 17 -
Geographical Segment The Company’s business of shopping mall development and operations is organized and managed separately according to geographical areas where the Company operates, namely the Philippines and China. This is the basis upon which the Company reports its primary segment information presented in Note 5 to the consolidated financial statements.
Contingencies Contingent liabilities are not recognized in the consolidated financial statements. They are disclosed in the notes to consolidated financial statements unless the possibility of an outflow of resources embodying economic benefits is remote. Contingent assets are not recognized in the consolidated financial statements but are disclosed in the notes to consolidated financial statements when an inflow of economic benefits is probable.
Subsequent Events Post year-end events that provide additional information about the Company’s position at balance sheet date (adjusting events) are reflected in the consolidated financial statements. Post year-end events that are not adjusting events are disclosed in the notes to consolidated financial statements when material.
5. Segment Information
For management purposes, operating segment is monitored through geographical location as the Company’s risks and rates of return are affected predominantly by differences in economic and political environments where they operate. Each geographical area is organized and managed separately and viewed as a distinct strategic business unit that caters to different markets.
As of June 30, 2012, the Company owns forty-three (43) shopping malls in the Philippines and four shopping malls in China. Each geographical area is organized and managed separately and viewed as a distinct strategic business unit that caters to different markets.
Management monitors the operating results of its business units separately for the purpose of making decisions about resource allocation and performance assessment. Segment performance is evaluated based on operating profit or loss and is measured consistently with operating profit or loss in the consolidated financial statements.
Inter-segment Transactions Transfer prices between geographical segments are set on an arm’s length basis similar to transactions with related parties. Such transfers are eliminated in consolidation.
Geographical Segment Data
2012 Philippines China Eliminations Consolidated (In Thousands)
Revenue P=13,301,438 P=1,272,674 P=– P=14,574,112
Segment results: Income before income tax P=6,247,049 P=490,141 P=– P=6,737,190 Provision for income tax 1,445,971 169,105 – 1,615,076 Net income P=4,801,078 P=321,036 P=– P=5,122,114

- 18 -
2012 Philippines China Eliminations Consolidated (In Thousands)
Net income attributable to: Equity holders of the Parent P=4,603,792 P=321,036 P=– P=4,924,828 Non-controlling interests 197,286 – – 197,286
Segment profit P=7,273,767 P=507,761 P=– P=7,781,528
Segment assets P=127,655,296 P=24,531,814 (P=11,306,597) P=140,880,513
Segment liabilities P=68,763,410 P=18,231,379 (P=11,264,350) P=75,730,439
Other information: Depreciation and amortization P=1,693,514 P=234,250 P=– P=1,927,764 Capital expenditures 8,565,087 1,631,082 – 10,196,169
2011 Philippines China Eliminations Consolidated (In Thousands)
Revenue P=11,725,853 P=979,210 P=– P=12,705,063
Segment results: Income before income tax P=5,432,131 P=320,661 P=– P=5,752,792 Provision for income tax 1,211,837 109,912 – 1,321,749 Net income P=4,220,294 P=210,749 P=– P=4,431,043
Net income attributable to: Equity holders of the Parent P=4,062,292 P=210,749 P=– P=4,273,041 Non-controlling interests 158,002 – – 158,002
Segment profit P=6,370,993 P=416,110 P=– P=6,787,103
Other information: Depreciation and amortization P=1,676,083 P=214,856 P=– P=1,890,939 Capital expenditures 4,919,195 1,147,844 – 6,067,039
6. Cash and Cash Equivalents
This account consists of:
June 30,
2012 December 31,
2011 Cash on hand and in banks (see Note 18) P=3,636,056,826 P=2,029,711,118 Temporary investments (see Note 18) 8,860,701,680 6,260,504,921 P=12,496,758,506 P=8,290,216,039
Cash in banks earn interest at the respective bank deposit rates. Temporary investments are made for varying periods depending on the immediate cash requirements of the Company, and earn interest at the respective temporary investment rates.

- 19 -
Interest income earned from bank deposits and temporary investments amounted to P=161 million and P=117 million for the six months ended June 30, 2012 and 2011, respectively.
7. Short-term Investments
This account pertains to a time deposit with Banco de Oro Unibank, Inc. (BDO) amounting to P=870 million (US$20 million) and P=877 million (US$20 million) as of June 30, 2012 and December 31, 2011, respectively, with fixed interest rate of 3.24%. Such deposit is intended to meet short-term cash requirements and may be preterminated anytime by the Company.
Interest income earned from short-term investments amounted to P=14 million for the six months ended June 30, 2012 and 2011.
8. Investments Held for Trading
This account consists of investments in Philippine government and corporate bonds amounting to P=747 million and P=813 million as of June 30, 2012 and December 31, 2011, respectively, with yields ranging from 3.18% to 12.29%. These Philippine peso-denominated and U.S. dollar-denominated investments have various maturities ranging from 2012 to 2018.
Investments held for trading include unrealized mark-to-market loss amounting to P=1 million and P=6 million for the six months ended June 30, 2012 and 2011, respectively, the amounts of which are included under “Others - net” account in the consolidated statements of income
Interest income earned from investments held for trading amounted to P=22 million and P=20 million for the six months ended June 30, 2012 and 2011, respectively.
9. Receivables
This account consists of:
June 30,
2012 December 31,
2011 Rent: Third-party tenants P=2,291,919,861 P=2,434,700,115 Related parties (see Note 18) 1,481,534,490 1,587,324,781 Advances to suppliers 780,732,003 578,440,037 Accrued interest (see Note 18) 52,465,763 45,556,109 Others 295,779,134 294,081,144 P=4,902,431,251 P=4,940,102,186
Rent receivables generally have terms of 30-90 days.
Advances to suppliers, accrued interest and others are normally collected throughout the financial year.

- 20 -
The aging analysis of receivables follows:
June 30, 2012
December 31, 2011
Neither past due nor impaired P=4,606,298,968 P=4,595,446,764 Past due but not impaired: 91-120 days 60,935,474 44,538,728 Over 120 days 235,196,809 300,116,694 P=4,902,431,251 P=4,940,102,186
Receivables are assessed by management of the Company as not impaired, good and collectible. 10. Prepaid Expenses and Other Current Assets
This account consists of:
June 30,
2012 December 31,
2011 Input taxes P=647,348,574 P=591,293,627 Prepaid expenses 667,379,899 366,033,201 Advances to contractors (see Note 11) 260,951,864 151,283,101 Others 167,222,143 167,842,531 P=1,742,902,480 P=1,276,452,460
Prepaid expenses mainly consist of prepayments for insurance and real property taxes.
11. Investment Properties
This account consists of:
June 30, 2012
Land and Land
Use Rights Buildings and
Improvements
Building Equipment,
Furniture and Others
Shopping Mall Complex Under
Construction Total Cost Balance at beginning of year P=22,402,878,158 P=80,235,045,499 P=16,950,695,663 P=15,546,814,568 P=135,135,433,888 Additions 2,464,557,963 1,357,703,133 442,829,683 5,794,534,619 10,059,625,398 Transfers 13,010,061 2,589,200,962 228,168,330 (2,830,379,353) – Translation adjustments (141,049,624) (539,073,105) (63,137,024) (194,612,855) (937,872,608) Balance at end of year 24,739,396,558 83,642,876,489 17,558,556,652 18,316,356,979 144,257,186,678 Accumulated Depreciation
and Amortization Balance at beginning of year 437,595,529 17,718,731,839 9,142,890,393 – 27,299,217,761 Depreciation and amortization 27,848,847 1,254,555,542 645,359,261 – 1,927,763,650 Translation adjustments (9,026,525) (67,267,721) (27,469,150) – (103,763,396) Balance at end of year 456,417,851 18,906,019,660 9,760,780,504 – 29,123,218,015 Net Book Value P=24,282,978,707 P=64,736,856,829 P=7,797,776,148 P=18,316,356,979 P=115,133,968,663

- 21 -
December 31, 2011
Land and Land
Use Rights Buildings and Improvements
Building Equipment,
Furniture and Others
Shopping Mall Complex Under
Construction Total Cost Balance at beginning of year P=19,524,757,159 P=72,278,698,603 P=15,707,347,346 P=9,817,096,213 P=117,327,899,321 Additions 2,093,747,242 1,625,733,325 626,763,170 12,669,351,155 17,015,594,892 Transfers 631,214,391 5,942,660,350 552,191,221 (7,126,065,962) – Translation adjustments 153,159,366 387,953,221 64,393,926 186,433,162 791,939,675 Balance at end of year 22,402,878,158 80,235,045,499 16,950,695,663 15,546,814,568 135,135,433,888 Accumulated Depreciation
and Amortization Balance at beginning of year 401,895,611 15,111,732,471 7,873,969,685 – 23,387,597,767 Depreciation and amortization 27,969,238 2,547,427,337 1,254,574,591 – 3,829,971,166 Translation adjustments 7,730,680 59,572,031 14,346,117 – 81,648,828 Balance at end of year 437,595,529 17,718,731,839 9,142,890,393 – 27,299,217,761 Net Book Value P=21,965,282,629 P=62,516,313,660 P=7,807,805,270 P=15,546,814,568 P=107,836,216,127
Included under “Land” account are the 212,119 square meters of real estate properties with a carrying value of P=452 million and P=474 million as of June 30, 2012 and December 31, 2011, respectively, and a fair value of P=13,531 million as of August 2007, planned for residential development in accordance with the cooperative contracts entered into by Mega Make and Affluent with Grand China and Oriental Land Development Limited (Oriental Land) on March 15, 2007. The value of these real estate properties were not part of the consideration amounting to P=10,827 million paid by the Parent Company to Grand China and Oriental Land. Accordingly, the assets were recorded at their carrying values under “Investment properties - net” account and a corresponding liability equivalent to the same amount, which is shown as part of “Other noncurrent liabilities” account in the consolidated balance sheets.
A portion of investment properties located in China with a carrying value of P=2,525 million and P=638 million as of June 30, 2012 and December 31, 2011, respectively, and a fair value of P=16,879 million for SM Xiamen as of August 2007 and P=1,920 million for SM Suzhou and SM Chongqing as of June 30, 2012, were mortgaged as collaterals to secure the domestic borrowings in China (see Note 14).
Rent income from investment properties amounted to P=12,406 million and P=10,918 million for the six months ended June 30, 2012 and 2011, respectively. Direct operating expenses from investment properties that generated rent income amounted to P=6,793 million and P=5,918 million for the six months ended June 30, 2012 and 2011, respectively.
The fair value of investment properties amounted to P=218,071 million as of July 31, 2010 as determined by an independent appraiser who holds a recognized and relevant professional qualification. The valuation of investment properties was based on market values using income approach. The fair value represents the amount at which the assets can be exchanged between a knowledgeable, willing seller and a knowledgeable, willing buyer in an arm’s length transaction at the date of valuation, in accordance with International Valuation Standards as set out by the International Valuation Standards Committee.
Below are the significant assumptions used in the valuation:
Discount rate 11.75% Capitalization rate 8.00% Average growth rate 6.00%
Shopping mall complex under construction mainly pertains to costs incurred for the development of SM San Fernando, SM Consolacion Cebu, SM General Santos, SM Lanang Davao, SM Taguig, SM Chongqing, SM Zibo and SM Tianjin.

- 22 -
Shopping mall complex under construction includes cost of land amounting to P=1,766 million and P=1,575 million as of June 30, 2012 and December 31, 2011, respectively.
Construction contracts with various contractors related to the construction of the above-mentioned projects amounted to P=49,522 million and P=39,240 million as of June 30, 2012 and December 31, 2011, respectively, inclusive of overhead, cost of labor and materials and all other costs necessary for the proper execution of the works. The outstanding contracts are valued at P=14,806 million and P=10,268 million as of June 30, 2012 and December 31, 2011, respectively.
Interest capitalized to shopping mall complex under construction amounted to P=58 million and P=30 million in 2012 and 2011, respectively. Capitalization rates used were 6.48% and 5.68% in 2012 and 2011, respectively.
12. Available-for-Sale Investments
As of June 30, 2012 and December 31, 2011, this account consists of investments in corporate notes issued by BDO amounting to P=1,000 million with fixed interest rate of 6.80% (see Note 18). Investments in corporate notes are intended to meet short-term cash requirements. Interest income earned from AFS investments amounted to P=33 million and P=46 million for the six months ended June 30, 2011.
13. Accounts Payable and Other Current Liabilities
This account consists of:
June 30,
2012 December 31,
2011 Trade P=4,358,195,110 P=4,914,654,211 Accrued operating expenses: Third parties 3,742,950,551 2,892,708,398 Related parties (see Note 18) 148,359,029 102,408,081 Liability for purchased land 1,215,696,026 1,304,436,777 Accrued interest (see Notes 14 and 18) 383,166,145 314,938,946 Taxes payable 509,542,341 203,919,456 Others 295,164,466 417,212,254 P=10,653,073,668 P=10,150,278,123
Trade payables primarily consist of liabilities to suppliers and contractors, which are noninterest-bearing and are normally settled within a 30-day term. Accrued operating expenses mainly pertain to payables to electrical and water utility providers and accrued management fees which are normally settled throughout the financial year.
Liability for purchased land, accrued interest and taxes payable are expected to be settled throughout the financial year.
Others are normally settled throughout the financial year.
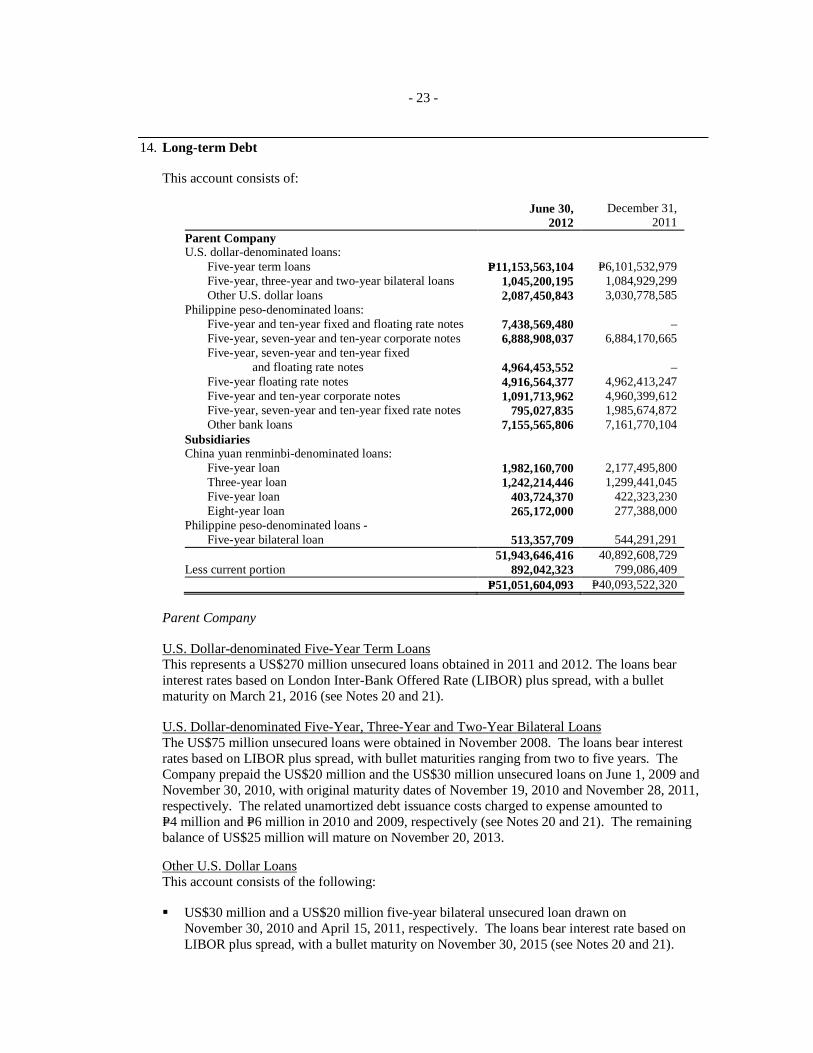
- 23 -
14. Long-term Debt
This account consists of:
June 30,
2012 December 31,
2011 Parent Company U.S. dollar-denominated loans: Five-year term loans P=11,153,563,104 P=6,101,532,979 Five-year, three-year and two-year bilateral loans 1,045,200,195 1,084,929,299 Other U.S. dollar loans 2,087,450,843 3,030,778,585 Philippine peso-denominated loans: Five-year and ten-year fixed and floating rate notes 7,438,569,480 – Five-year, seven-year and ten-year corporate notes 6,888,908,037 6,884,170,665 Five-year, seven-year and ten-year fixed
and floating rate notes 4,964,453,552 – Five-year floating rate notes 4,916,564,377 4,962,413,247 Five-year and ten-year corporate notes 1,091,713,962 4,960,399,612 Five-year, seven-year and ten-year fixed rate notes 795,027,835 1,985,674,872 Other bank loans 7,155,565,806 7,161,770,104 Subsidiaries China yuan renminbi-denominated loans: Five-year loan 1,982,160,700 2,177,495,800 Three-year loan 1,242,214,446 1,299,441,045 Five-year loan 403,724,370 422,323,230 Eight-year loan 265,172,000 277,388,000 Philippine peso-denominated loans - Five-year bilateral loan 513,357,709 544,291,291 51,943,646,416 40,892,608,729 Less current portion 892,042,323 799,086,409 P=51,051,604,093 P=40,093,522,320
Parent Company
U.S. Dollar-denominated Five-Year Term Loans This represents a US$270 million unsecured loans obtained in 2011 and 2012. The loans bear interest rates based on London Inter-Bank Offered Rate (LIBOR) plus spread, with a bullet maturity on March 21, 2016 (see Notes 20 and 21).
U.S. Dollar-denominated Five-Year, Three-Year and Two-Year Bilateral Loans The US$75 million unsecured loans were obtained in November 2008. The loans bear interest rates based on LIBOR plus spread, with bullet maturities ranging from two to five years. The Company prepaid the US$20 million and the US$30 million unsecured loans on June 1, 2009 and November 30, 2010, with original maturity dates of November 19, 2010 and November 28, 2011, respectively. The related unamortized debt issuance costs charged to expense amounted to P=4 million and P=6 million in 2010 and 2009, respectively (see Notes 20 and 21). The remaining balance of US$25 million will mature on November 20, 2013.
Other U.S. Dollar Loans This account consists of the following:
� US$30 million and a US$20 million five-year bilateral unsecured loan drawn on November 30, 2010 and April 15, 2011, respectively. The loans bear interest rate based on LIBOR plus spread, with a bullet maturity on November 30, 2015 (see Notes 20 and 21).
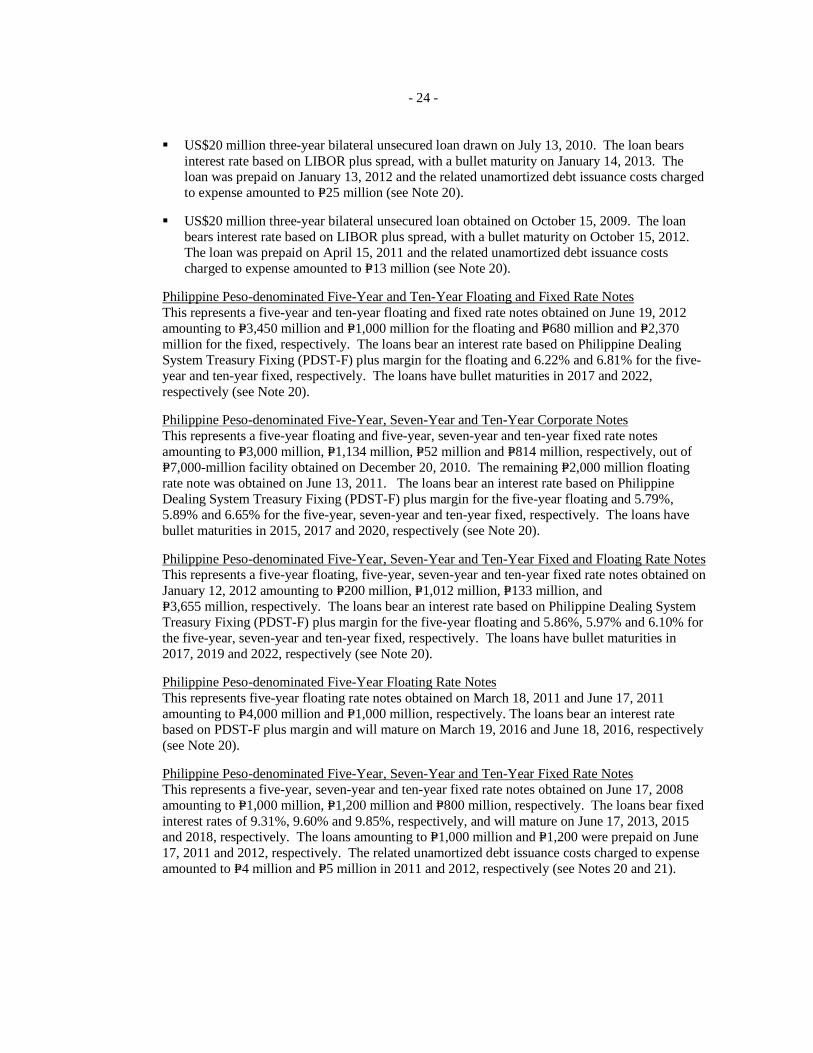
- 24 -
� US$20 million three-year bilateral unsecured loan drawn on July 13, 2010. The loan bears interest rate based on LIBOR plus spread, with a bullet maturity on January 14, 2013. The loan was prepaid on January 13, 2012 and the related unamortized debt issuance costs charged to expense amounted to P=25 million (see Note 20).
� US$20 million three-year bilateral unsecured loan obtained on October 15, 2009. The loan bears interest rate based on LIBOR plus spread, with a bullet maturity on October 15, 2012. The loan was prepaid on April 15, 2011 and the related unamortized debt issuance costs charged to expense amounted to P=13 million (see Note 20).
Philippine Peso-denominated Five-Year and Ten-Year Floating and Fixed Rate Notes This represents a five-year and ten-year floating and fixed rate notes obtained on June 19, 2012 amounting to P=3,450 million and P=1,000 million for the floating and P=680 million and P=2,370 million for the fixed, respectively. The loans bear an interest rate based on Philippine Dealing System Treasury Fixing (PDST-F) plus margin for the floating and 6.22% and 6.81% for the five-year and ten-year fixed, respectively. The loans have bullet maturities in 2017 and 2022, respectively (see Note 20).
Philippine Peso-denominated Five-Year, Seven-Year and Ten-Year Corporate Notes This represents a five-year floating and five-year, seven-year and ten-year fixed rate notes amounting to P=3,000 million, P=1,134 million, P=52 million and P=814 million, respectively, out of P=7,000-million facility obtained on December 20, 2010. The remaining P=2,000 million floating rate note was obtained on June 13, 2011. The loans bear an interest rate based on Philippine Dealing System Treasury Fixing (PDST-F) plus margin for the five-year floating and 5.79%, 5.89% and 6.65% for the five-year, seven-year and ten-year fixed, respectively. The loans have bullet maturities in 2015, 2017 and 2020, respectively (see Note 20).
Philippine Peso-denominated Five-Year, Seven-Year and Ten-Year Fixed and Floating Rate Notes This represents a five-year floating, five-year, seven-year and ten-year fixed rate notes obtained on January 12, 2012 amounting to P=200 million, P=1,012 million, P=133 million, and P=3,655 million, respectively. The loans bear an interest rate based on Philippine Dealing System Treasury Fixing (PDST-F) plus margin for the five-year floating and 5.86%, 5.97% and 6.10% for the five-year, seven-year and ten-year fixed, respectively. The loans have bullet maturities in 2017, 2019 and 2022, respectively (see Note 20).
Philippine Peso-denominated Five-Year Floating Rate Notes This represents five-year floating rate notes obtained on March 18, 2011 and June 17, 2011 amounting to P=4,000 million and P=1,000 million, respectively. The loans bear an interest rate based on PDST-F plus margin and will mature on March 19, 2016 and June 18, 2016, respectively (see Note 20).
Philippine Peso-denominated Five-Year, Seven-Year and Ten-Year Fixed Rate Notes This represents a five-year, seven-year and ten-year fixed rate notes obtained on June 17, 2008 amounting to P=1,000 million, P=1,200 million and P=800 million, respectively. The loans bear fixed interest rates of 9.31%, 9.60% and 9.85%, respectively, and will mature on June 17, 2013, 2015 and 2018, respectively. The loans amounting to P=1,000 million and P=1,200 were prepaid on June 17, 2011 and 2012, respectively. The related unamortized debt issuance costs charged to expense amounted to P=4 million and P=5 million in 2011 and 2012, respectively (see Notes 20 and 21).

- 25 -
Philippine Peso-denominated Five-Year and Ten-Year Corporate Notes This represents a five-year floating and fixed rate and ten-year fixed rate notes obtained on April 14, 2009 amounting to P=200 million, P=3,700 million and P=1,100 million, respectively. The loans bear an interest rate based on PDST-F plus margin for the five-year floating and 8.4% and 10.1% for the five-year and ten-year fixed, respectively. The loans have bullet maturities in 2014 and 2019, respectively. The Company prepaid the P=200 million and P=3,700 million loans on April 15, 2012, with original maturity date of April 15, 2014. The related unamortized debt issuance costs charged to expense amounted to P=17 million (see Note 20).
Other Bank Loans This account consists of the following:
� Five-year loan obtained on June 29, 2010 amounting to P=1,000 million and will mature on June 29, 2015. The loan carries an interest rate based on PDST-F plus an agreed margin (see Note 20).
� Five-year inverse floating rate notes obtained on June 23, 2010 amounting to P=1,000 million. The loans bear an interest rate based on agreed fixed rate less PDST-F and will mature on June 23, 2015 (see Notes 20 and 21).
� Five-year bullet loan obtained on January 13, 2010 amounting to P=1,000 million and will mature on January 13, 2015. The loan carries an interest rate based on PDST-F plus an agreed margin (see Note 20).
� Five-year bullet loan obtained on November 3, 2009 amounting to P=1,000 million and will mature on November 3, 2014. The loan carries interest based on PDST-F plus on agreed margin (see Note 20).
� Five-year bullet loans obtained on October 16, 2009 amounting to P=2,000 million and P=830 million. The loans bear an interest rate based on PDST-F plus an agreed margin and will mature on October 16, 2014 and October 16, 2012, respectively. The Company prepaid the P=830 million loan on April 13, 2011. The related unamortized debt issuance costs charged to expense amounted to P=2 million (see Note 20).
� Four-year bullet loan obtained on April 15, 2009 amounting to P=750 million and will mature on April 15, 2013. The loan carries an interest rate based on Philippine Reference Rate (PHIREF) plus margin. The loan was prepaid on October 17, 2011, the related balance of unamortized debt issuance cost charged to expense amounted to P=3 million in 2011 (see Notes 20 and 21).
� Five-year bullet loan obtained on March 3, 2008 amounting to P=1,000 million and will mature on March 3, 2013. The loan carries a fixed interest rate of 7.18%. The loan was prepaid on March 3, 2011, the related balance of unamortized debt issuance cost charged to expense amounted to P=3 million in 2011 (see Note 20).
� Ten-year bullet fixed rate loan obtained on August 16, 2006 amounting to P=1,200 million. The loan carries a fixed interest rate of 9.75% and will mature on August 16, 2016 (see Note 20).
Subsidiaries
China Yuan Renminbi-denominated Five-Year Loan This represents a five-year loan obtained on August 26, 2009 amounting to ¥350 million to finance the construction of shopping malls. The loan is payable in semi-annual installments
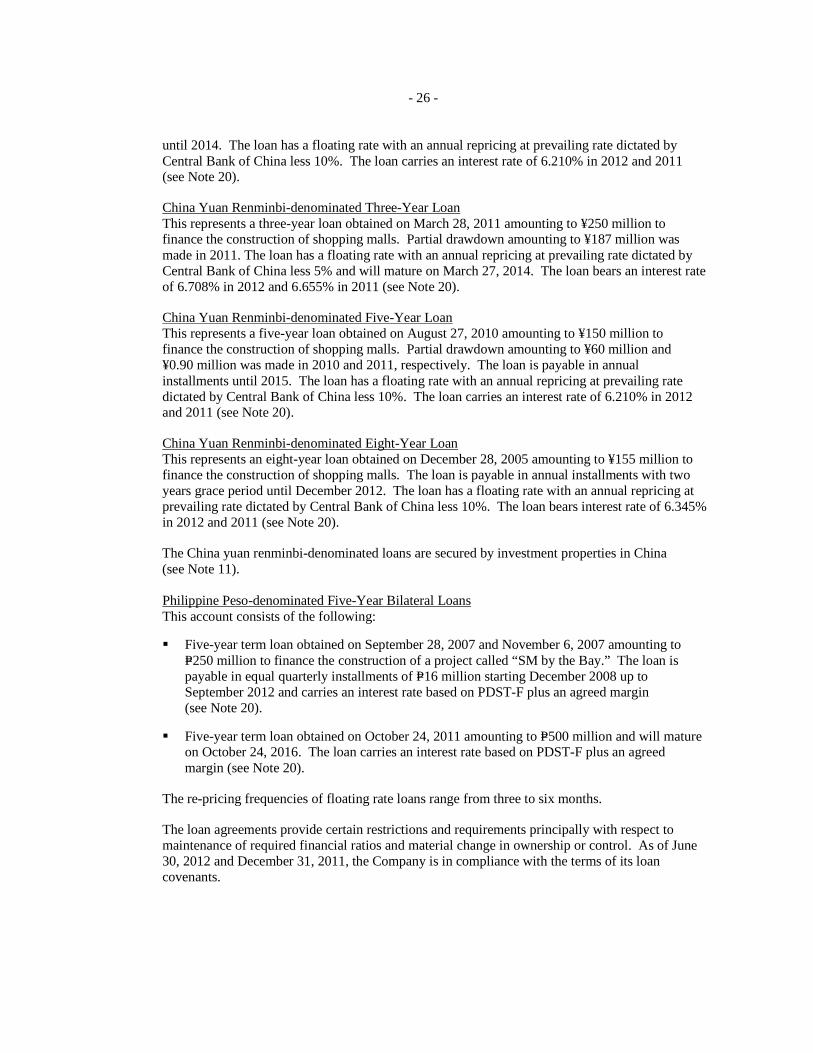
- 26 -
until 2014. The loan has a floating rate with an annual repricing at prevailing rate dictated by Central Bank of China less 10%. The loan carries an interest rate of 6.210% in 2012 and 2011 (see Note 20).
China Yuan Renminbi-denominated Three-Year Loan This represents a three-year loan obtained on March 28, 2011 amounting to ¥250 million to finance the construction of shopping malls. Partial drawdown amounting to ¥187 million was made in 2011. The loan has a floating rate with an annual repricing at prevailing rate dictated by Central Bank of China less 5% and will mature on March 27, 2014. The loan bears an interest rate of 6.708% in 2012 and 6.655% in 2011 (see Note 20).
China Yuan Renminbi-denominated Five-Year Loan This represents a five-year loan obtained on August 27, 2010 amounting to ¥150 million to finance the construction of shopping malls. Partial drawdown amounting to ¥60 million and ¥0.90 million was made in 2010 and 2011, respectively. The loan is payable in annual installments until 2015. The loan has a floating rate with an annual repricing at prevailing rate dictated by Central Bank of China less 10%. The loan carries an interest rate of 6.210% in 2012 and 2011 (see Note 20).
China Yuan Renminbi-denominated Eight-Year Loan This represents an eight-year loan obtained on December 28, 2005 amounting to ¥155 million to finance the construction of shopping malls. The loan is payable in annual installments with two years grace period until December 2012. The loan has a floating rate with an annual repricing at prevailing rate dictated by Central Bank of China less 10%. The loan bears interest rate of 6.345% in 2012 and 2011 (see Note 20).
The China yuan renminbi-denominated loans are secured by investment properties in China (see Note 11). Philippine Peso-denominated Five-Year Bilateral Loans This account consists of the following:
� Five-year term loan obtained on September 28, 2007 and November 6, 2007 amounting to P=250 million to finance the construction of a project called “SM by the Bay.” The loan is payable in equal quarterly installments of P=16 million starting December 2008 up to September 2012 and carries an interest rate based on PDST-F plus an agreed margin (see Note 20).
� Five-year term loan obtained on October 24, 2011 amounting to P=500 million and will mature on October 24, 2016. The loan carries an interest rate based on PDST-F plus an agreed margin (see Note 20).
The re-pricing frequencies of floating rate loans range from three to six months.
The loan agreements provide certain restrictions and requirements principally with respect to maintenance of required financial ratios and material change in ownership or control. As of June 30, 2012 and December 31, 2011, the Company is in compliance with the terms of its loan covenants.

- 27 -
Debt Issuance Costs The movements in unamortized debt issuance costs are as follows:
June 30,
2012 December 31,
2011 Balance at beginning of year P=457,844,346 P=263,713,789 Additions 102,952,745 393,909,193 Amortization (104,146,991) (199,778,636) Balance at end of year P=456,650,100 P=457,844,346
Amortization of debt issuance costs is recognized in the consolidated statements of income under “Others - net” account.
Repayment Schedule Repayments of long-term debt are scheduled as follows:
Year Amount 2012 P=574,456,323 2013 1,821,611,647 2014 5,742,104,176 2015 11,542,024,370 2016 18,006,060,000 2017 to 2021 14,714,040,000 P=52,400,296,516
15. Stockholders’ Equity
Capital Stock The Company has an authorized capital stock of 20,000,000,000 shares with a par value of P=1 a share. The issued shares are 17,392,534,760 shares as of June 30, 2012 and 13,917,800,067 shares as of December 31, 2011.
On April 24, 2012, the BOD and the stockholders approved the declaration of a 25% stock dividend or 3,475 million shares to all stockholders. This was subsequently approved by the SEC on June 14, 2012 and the stock dividends were issued on June 20, 2012.
The following summarizes the information on the Company's registration of securities under the Securities Regulation Code:
Date of SEC Approval
Authorized Shares
No. of Shares Issued
Issue/Offer Price
March 15, 1994 10,000,000,000 – P=– April 22, 1994 – 6,369,378,049 5.35 May 29, 2007 10,000,000,000 – – May 20, 2008 – 912,897,212 11.86 October 14, 2010 – 569,608,700 11.50
The Company declared stock dividends in 2012, 2007, 1996 and 1995. The total number of shareholders is 2,525 and 2,627 as of June 30, 2012 and December 31, 2011, respectively.

- 28 -
International Placement of Shares On October 14, 2010, the Parent Company has undergone an international placement of its shares to raise capital to finance strategic expansion programs in the Philippines and in China as well as for general working capital.
In connection with the international placement of its shares, the Parent Company engaged into a Placement Agreement with SM Land (the Selling Shareholder) and CLSA Limited and Macquarie Capital (Singapore) Pte. Limited (the “Joint Bookrunners”) on October 14, 2010. As stated in the Placement Agreement, SM Land shall sell its 570 million SMPH Common Shares (the “Sale Shares”) with a par value of P=1 per share at P=11.50 (Offer Price) per share to the Joint Bookrunners, or to investors that the Joint Bookrunners may procure outside the Philippines (the “International Placement”).
Contemporaneous with the signing of the Placement Agreement, the Parent Company likewise entered into a Subscription Agreement with SM Land. As stated in the Subscription Agreement, SM Land will not directly receive any proceeds from the International Placement, but instead SM Land has conditionally agreed to subscribe for, and the Parent Company has conditionally agreed to issue, out of its authorized but unissued capital stock, new SMPH common shares in an amount equal to the aggregate number of the Sale Shares sold by SM Land in the International Placement at a subscription price of P=11.50 per share, which is equal to the Offer Price of the Sale Shares.
SM Land was able to sell through the Joint Bookrunners the total Sale Shares of 570 million SMPH common shares. Likewise, SM Land subscribed for and the Parent Company issued to SM Land the same number of new SMPH common shares. The proceeds of P=6,414 million, net of transaction costs capitalized, add up to the capital of the Parent Company.
Unrealized Gain on Available-for-Sale Investments and Cumulative Translation Adjustment The tax effects relating to each component of other comprehensive income are as follows:
2012 2011 Before Tax
Amount Tax Benefit Net-of-tax
Amount Before Tax
Amount Tax Benefit Net-of-tax
Amount Unrealized loss on
AFS investments P=– P=– P=– (P=2,307,329) P=230,733 (P=2,076,596) Cumulative translation adjustment (288,151,878) – (288,151,878) 73,126,990 – 73,126,990 (P=288,151,878) P=– (P=288,151,878) P=70,819,661 P=230,733 P=71,050,394
Retained Earnings On April 24, 2012, the BOD approved the additional appropriation of retained earnings amounting to P=20 billion for future corporate expansion programs.
The retained earnings account is restricted for the payment of dividends to the extent of P=6,274 million and P=5,214 million as of June 30, 2012 and December 31, 2011, respectively, representing the cost of shares held in treasury (P=101 million in 2012 and 2011) and accumulated equity in net earnings of the subsidiaries totaling P=6,173 million and P=5,113 million as of June 30, 2012 and December 31, 2011, respectively. The accumulated equity in net earnings of the subsidiaries is not available for dividend distribution until such time that the Parent Company receives the dividends from the subsidiaries.
Treasury Stock Treasury stock, totaling 18,857,000 shares, is stated at acquisition cost.

- 29 -
16. Income Tax
The components of deferred tax assets and liabilities are as follows:
June 30,
2012 December 31,
2011 Deferred tax assets - Unrealized foreign exchange losses and others P=216,092,259 P=254,132,999
Deferred tax liabilities - Undepreciated capitalized interest, unrealized
foreign exchange gains and others P=1,261,539,026 P=1,258,514,789
On November 26, 2008, the Bureau of Internal Revenue issued Revenue Regulation No. 16-2008 which implemented the provisions of Republic Act 9504 on optional standard deduction (OSD). This regulation allowed both individual and corporate tax payers to use OSD in computing their taxable income. For corporations, they may elect a standard deduction in an amount equivalent to 40% of gross income, as provided by law, in lieu of the itemized allowed deductions.
17. Pension Cost
The Parent Company has a funded, noncontributory defined benefit retirement plan covering all of its regular full-time employees. As of December 31, 2011, the date of latest actuarial valuation, the actuarial asset amounted to P=23 million. The annual normal cost amounted to P=5 million. The principal actuarial assumptions used to determine the pension benefits include salary increase of 10% a year and a return on plan assets of 6% a year.
18. Related Party Transactions
Transactions with related parties are made at terms equivalent to those that prevail in arm’s length transactions. Outstanding balances at year-end are unsecured, interest free and settlement occurs in cash. There have been no guarantees provided or received for any related party receivables or payables. For the six months ended June 30, 2012 and 2011, the Company has not recorded any impairment of receivables relating to amounts owed by related parties. This assessment is undertaken each financial year through examining the financial position of the related party and the market in which the related party operates.
Parties are considered to be related if one party has the ability, directly or indirectly, to control the other party in making financial and operating decisions and the parties are subject to common control. Related parties may be individuals or corporate entities.
The significant related party transactions entered into by the Company with its ultimate parent company and affiliates and the amounts included in the consolidated financial statements with respect to such transactions follow:
a. The Company has existing lease agreements with its affiliates, the SM Retail Group and SM Banking Group. Total rent income amounted to P=3,972 million and P=3,503 million for the six months ended June 30, 2012 and 2011, respectively. Rent receivable, included under “Receivables” account in the consolidated balance sheets, amounted to P=1,482 million and P=1,587 million as of June 30, 2012 and December 31, 2011, respectively.
- 30 -
b. The Company leases the land where two of its malls are located from SMIC and its affiliate, SM Land for a period of 50 years, renewable upon mutual agreement of the parties. The Company shall pay SMIC and SM Land a minimum fixed amount or a certain percentage of its gross rent income, whichever is higher. Rent expense, included under “Costs and expenses” account in the consolidated statements of income, amounted to P=120 million and P=110 million for the six months ended June 30, 2012 and 2011, respectively. Rent payable to SMIC and SM Land included under “Accounts payable and other current liabilities” account in the consolidated balance sheets, amounted to P=36 million and P=18 million as of June 30, 2012 and December 31, 2011, respectively.
c. The Company pays management fees to its affiliates, Shopping Center Management Corporation, West Avenue Theaters Corporation and Family Entertainment Center, Inc. for managing the operations of the malls. Total management fees, included under “Costs and expenses” account in the consolidated statements of income, amounted to P=426 million and P=384 million for the six months ended June 30, 2012 and 2011, respectively. Accrued management fees, included under “Accounts payable and other current liabilities” account in the consolidated balance sheets, amounted to P=112 million and P=84 million as of June 30, 2012 and December 31, 2011, respectively.
d. The Company has certain bank accounts and cash placements that are maintained with the SM Banking Group and SMIC. Cash and cash equivalents, short-term investments and investments held for trading amounted to P=9,041 million and P=5,584 million as of June 30, 2012 and December 31, 2011, respectively. Interest income amounted to P=157 million and P=133 million for the six months ended June 30, 2012 and 2011, respectively. Accrued interest receivable, included under “Receivables” account in the consolidated balance sheets, amounted to P=36 million and P=35 million as of June 30, 2012 and December 31, 2011, respectively.
e. As of December 31, 2011, the outstanding long-term debt from the SM Banking Group and SMIC amounted to P=698 million. Interest expense amounted to P=17 million and P=40 million for the six months ended June 30, 2012 and 2011, respectively. Accrued interest payable, included under “Accounts payable and other current liabilities” account in the consolidated balance sheets, amounted to P=12 million as of December 31, 2011. There are no outstanding long-term debt from the SM Banking Group and SMIC as of June 30, 2012.
f. AFS investments include investments in corporate notes issued by BDO amounting to P=1,000 million as of June 30, 2012 and December 31, 2011. Interest income amounted to P=33 million and P=34 million for the six months ended June 30, 2012 and 2011, respectively. Interest receivable, included under “Receivables” account in the consolidated balance sheets, amounted to P=6 million as of June 30, 2012 and December 31, 2011.
g. The SM China Companies entered into land development contracts with Grand China and Oriental Land to jointly develop certain sites in the cities of Jinjiang, Chengdu and Xiamen, with areas of 158,727 square meters, 19,952 square meters and 33,440 square meters, as of June 30, 2012 and December 31, 2011. Under the terms of the contracts, the SM China Companies will provide the land use rights while Grand China and Oriental Land will fund the development expenses, among others.
h. The total compensation paid to key management personnel of the Company amounted to P=17 million and P=15 million for the six months ended June 30, 2012 and 2011, respectively. No other special benefits are paid to management personnel other than the usual monthly salaries and government mandated bonuses.
- 31 -
19. Lease Agreements
The Company’s lease agreements with its tenants are generally granted for a term of one year, with the exception of some of the larger tenants operating nationally, which are granted initial lease terms of five years, renewable on an annual basis thereafter. Upon inception of the lease agreement, tenants are required to pay certain amounts of deposits. Tenants likewise pay either a fixed monthly rent, which is calculated with reference to a fixed sum per square meter of area leased, or pay rent on a percentage rental basis, which comprises a basic monthly amount and a percentage of gross sales or a minimum set amount, whichever is higher.
Rent income amounted to P=12,406 million and P=10,918 million for the six months ended June 30, 2012 and 2011, respectively.
The Company also leases certain parcels of land where some of its malls are situated or constructed. The terms of the lease are for periods ranging from 15 to 50 years, renewable for the same period under the same terms and conditions. Rent payments are generally computed based on a certain percentage of the Company’s gross rent income or a certain fixed amount, whichever is higher.
Rent expense included under “Costs and expenses” account in the consolidated statements of income amounted to P=339 million and P=290 million for the six months ended June 30, 2012 and 2011, respectively.
20. Financial Risk Management Objectives and Policies
The Company’s principal financial instruments, other than derivatives, comprise of cash and cash equivalents, short-term investments, investments held for trading, accrued interest and other receivables, AFS investments and bank loans. The main purpose of these financial instruments is to finance the Company’s operations. The Company has various other financial assets and liabilities such as rent receivables and trade payables, which arise directly from its operations.
The Company also enters into derivative transactions, principally interest rate swaps, cross currency swaps, foreign currency call options, non-deliverable forwards and foreign currency range options. The purpose is to manage the interest rate and currency risks arising from the Company’s operations and its sources of finance (see Note 21).
The main risks arising from the Company’s financial instruments are interest rate risk, foreign currency risk, credit risk and liquidity risk. The Company’s BOD and management review and agree on the policies for managing each of these risks as summarized below. Interest Rate Risk The Company’s exposure to interest rate risk relates primarily to its financial instruments with floating interest and/or fixed interest rates. Fixed rate financial instruments are subject to fair value interest rate risk while floating rate financial instruments are subject to cash flow interest rate risk. Re-pricing of floating rate financial instruments is done every three to six months. Interest on fixed rate financial instruments is fixed until maturity of the instrument. The details of financial instruments that are exposed to interest rate risk are disclosed in Notes 6, 8, 12 and 14.
The Company’s policy is to manage its interest cost using a mix of fixed and floating rate debts. To manage this mix in a cost-efficient manner, the Company enters into interest rate swaps, in which the Company agrees to exchange, at specified intervals, the difference between fixed and

- 32 -
floating rate interest amounts calculated by reference to an agreed-upon notional principal amount. These swaps are designated to economically hedge underlying debt obligations. As of June 30, 2012 and December 31, 2011, after taking into account the effect of interest rate swaps, approximately 42% and 53% respectively, of the Company’s long-term borrowings are at a fixed rate of interest (see Note 21).
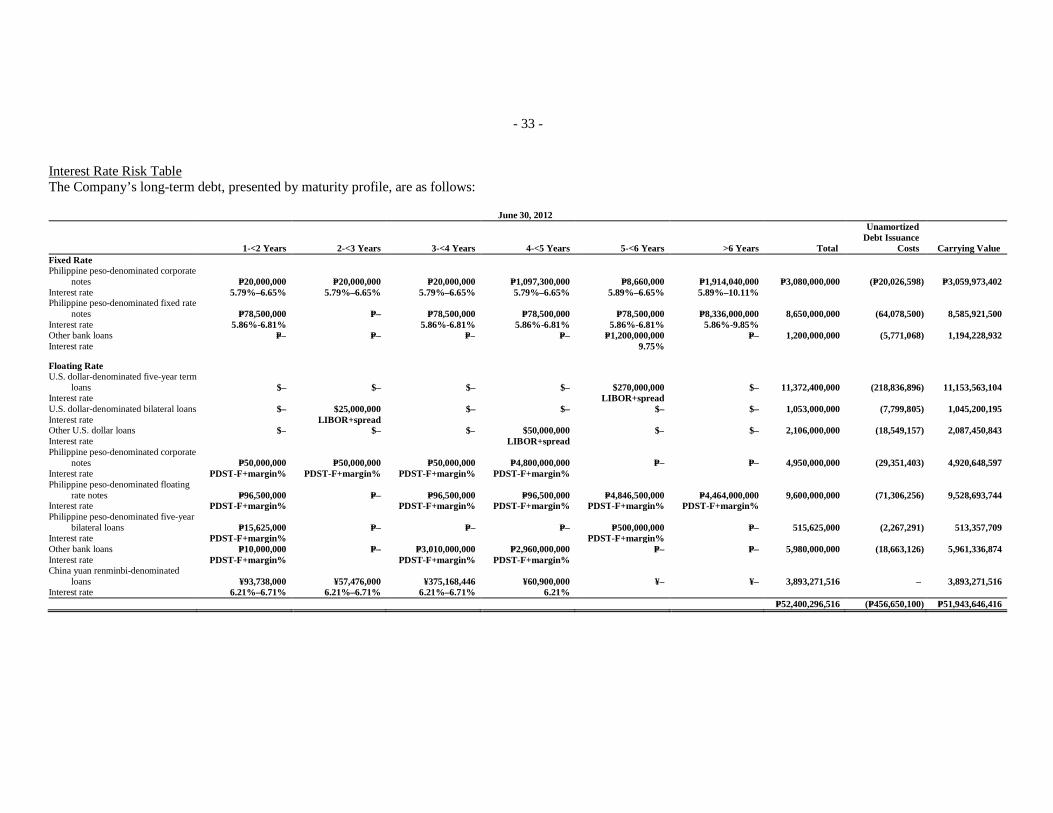
- 33 -
Interest Rate Risk Table The Company’s long-term debt, presented by maturity profile, are as follows:
June 30, 2012
1-<2 Years 2-<3 Years 3-<4 Years 4-<5 Years 5-<6 Years >6 Years Total
Unamortized Debt Issuance
Costs Carrying Value Fixed Rate Philippine peso-denominated corporate
notes P=20,000,000 P=20,000,000 P=20,000,000 P=1,097,300,000 P=8,660,000 P=1,914,040,000 P=3,080,000,000 (P=20,026,598) P=3,059,973,402 Interest rate 5.79%–6.65% 5.79%–6.65% 5.79%–6.65% 5.79%–6.65% 5.89%–6.65% 5.89%–10.11% Philippine peso-denominated fixed rate
notes P=78,500,000 P=– P=78,500,000 P=78,500,000 P=78,500,000 P=8,336,000,000 8,650,000,000 (64,078,500) 8,585,921,500 Interest rate 5.86%-6.81% 5.86%-6.81% 5.86%-6.81% 5.86%-6.81% 5.86%-9.85% Other bank loans P=– P=– P=– P=– P=1,200,000,000 P=– 1,200,000,000 (5,771,068) 1,194,228,932 Interest rate 9.75%
Floating Rate U.S. dollar-denominated five-year term
loans $– $– $– $– $270,000,000 $– 11,372,400,000 (218,836,896) 11,153,563,104 Interest rate LIBOR+spread U.S. dollar-denominated bilateral loans $– $25,000,000 $– $– $– $– 1,053,000,000 (7,799,805) 1,045,200,195 Interest rate LIBOR+spread Other U.S. dollar loans $– $– $– $50,000,000 $– $– 2,106,000,000 (18,549,157) 2,087,450,843 Interest rate LIBOR+spread Philippine peso-denominated corporate
notes P=50,000,000 P=50,000,000 P=50,000,000 P=4,800,000,000 P=– P=– 4,950,000,000 (29,351,403) 4,920,648,597 Interest rate PDST-F+margin% PDST-F+margin% PDST-F+margin% PDST-F+margin% Philippine peso-denominated floating
rate notes P=96,500,000 P=– P=96,500,000 P=96,500,000 P=4,846,500,000 P=4,464,000,000 9,600,000,000 (71,306,256) 9,528,693,744 Interest rate PDST-F+margin% PDST-F+margin% PDST-F+margin% PDST-F+margin% PDST-F+margin% Philippine peso-denominated five-year
bilateral loans P=15,625,000 P=– P=– P=– P=500,000,000 P=– 515,625,000 (2,267,291) 513,357,709 Interest rate PDST-F+margin% PDST-F+margin% Other bank loans P=10,000,000 P=– P=3,010,000,000 P=2,960,000,000 P=– P=– 5,980,000,000 (18,663,126) 5,961,336,874 Interest rate PDST-F+margin% PDST-F+margin% PDST-F+margin% China yuan renminbi-denominated
loans ¥93,738,000 ¥57,476,000 ¥375,168,446 ¥60,900,000 ¥– ¥– 3,893,271,516 – 3,893,271,516 Interest rate 6.21%–6.71% 6.21%–6.71% 6.21%–6.71% 6.21% P=52,400,296,516 (P=456,650,100) P=51,943,646,416

- 34 -
December 31, 2011
1-<2 Years 2-<3 Years 3-<4 Years 4-<5 Years 5-<6 Years >6 Years Total
Unamortized Debt Issuance
Costs Carrying Value Fixed Rate Philippine peso-denominated corporate
notes P=25,550,000 P=25,550,000 P=3,697,800,000 P=1,097,300,000 P=8,660,000 P=1,914,040,000 P=6,768,900,000 (P=39,878,468) P=6,729,021,532 Interest rate 5.79%–8.40% 5.79%–8.40% 5.79%–8.40% 5.79%–6.65% 5.89%–6.65% 5.89%–10.11% Philippine peso-denominated fixed rate
notes P=990,000 P=990,000 P=990,000 P=1,194,060,000 P=– P=800,000,000 1,997,030,000 (11,355,128) 1,985,674,872 Interest rate 9.60% 9.60% 9.60% 9.60% 9.85% Other bank loans P=– P=– P=– P=– P=1,200,000,000 P=– 1,200,000,000 (6,327,316) 1,193,672,684 Interest rate 9.75%
Floating Rate U.S. dollar-denominated five-year term
loans $– $– $– $– $145,000,000 $– 6,356,800,000 (255,267,021) 6,101,532,979 Interest rate LIBOR+spread U.S. dollar-denominated bilateral loans $– $25,000,000 $– $– $– $– 1,096,000,000 (11,070,701) 1,084,929,299 Interest rate LIBOR+spread Other U.S. dollar loans $– $20,000,000 $– $50,000,000 $– $– 3,068,800,000 (38,021,415) 3,030,778,585 Interest rate LIBOR+spread LIBOR+spread Philippine peso-denominated corporate
notes P=50,300,000 P=50,300,000 P=248,800,000 P=4,800,000,000 P=– P=– 5,149,400,000 (33,851,255) 5,115,548,745 Interest rate PDST-F+margin% PDST-F+margin% PDST-F+margin% PDST-F+margin% Philippine peso-denominated five-year
floating rate notes P=50,000,000 P=50,000,000 P=50,000,000 P=50,000,000 P=4,800,000,000 P=– 5,000,000,000 (37,586,753) 4,962,413,247 Interest rate PDST-F+margin% PDST-F+margin% PDST-F+margin% PDST-F+margin% PDST-F+margin% Philippine peso-denominated five-year
bilateral loans P=46,875,000 P=– P=– P=– P=500,000,000 P=– 546,875,000 (2,583,709) 544,291,291 Interest rate PDST-F+margin% PDST-F+margin% Other bank loans P=10,000,000 P=10,000,000 P=3,010,000,000 P=2,960,000,000 P=– P=– 5,990,000,000 (21,902,580) 5,968,097,420 Interest rate PDST-F+margin% PDST-F +margin% PDST-F+margin% PDST-F+margin% China yuan renminbi-denominated
loans ¥88,738,000 ¥77,476,000 ¥375,168,446 ¥60,900,000 ¥– ¥– 4,176,648,075 – 4,176,648,075 Interest rate 6.20%–6.65% 6.20%–6.65% 6.20%–6.65% 6.20%–6.65% P=41,350,453,075 (P=457,844,346) P=40,892,608,729

- 35 -
Foreign Currency Risk Foreign currency risk is the risk that the fair value or future cash flows of a financial instrument will fluctuate because of changes in foreign exchange rates. To manage its foreign currency risk, stabilize cash flows and improve investment and cash flow planning, the Company enters into foreign currency swap contracts, cross-currency swaps, foreign currency call options, non-deliverable forwards and foreign currency range options aimed at reducing and/or managing the adverse impact of changes in foreign exchange rates on financial performance and cash flows (see Note 21).
The Company’s foreign currency-denominated monetary assets and liabilities amounted to P=13,753 million (US$326 million) and P=14,875 million (US$353 million), respectively, as of June 30, 2012, and P=10,350 million (US$236 million) and P=10,808 million (US$246 million), respectively, as of December 31, 2011.
In translating the foreign currency-denominated monetary assets and liabilities to peso amounts, the exchange rate used was P=42.12 to US$1.00 and P=43.84 to US$1.00, the Philippine peso to U.S. dollar exchange rate as of June 30, 2012 and December 31, 2011, respectively.
Credit Risk Credit risk is the risk that a counterparty will not meet its obligations under a financial instrument or customer contract, leading to a financial loss. It is the Company’s policy that all prospective tenants are subject to screening procedures. In addition, receivable balances are monitored on an ongoing basis with the result that the Company’s exposure to bad debts is not significant. Given the Company’s diverse base of tenants, it is not exposed to large concentrations of credit risk.
With respect to credit risk arising from the other financial assets of the Company, which comprise of cash and cash equivalents, short-term investments, investments held for trading, AFS investments and certain derivative instruments, the Company’s exposure to credit risk arises from the default of the counterparty, with a maximum exposure equal to the carrying amount of these instruments. The fair values of these financial instruments are disclosed in Note 21.
Since the Company trades only with recognized third parties, there is no requirement for collateral.
Credit Quality of Financial Assets The credit quality of financial assets is determined by the Company using high quality and standard quality as internal credit ratings.
High Quality. Pertains to financial assets with counterparties who are not expected by the Company to default in settling its obligations, thus credit risk exposure is minimal. This normally includes large prime financial institutions, companies and government agencies.
Standard Quality. Other financial assets not belonging to high quality financial assets are included in this category.

- 36 -
As of June 30, 2012 and December 31, 2011, the credit quality of the Company’s financial assets is as follows:
Neither Past Due nor Impaired Past Due High Standard but not Quality Quality Impaired Total Loans and Receivables Cash and cash equivalents* P=12,445,765,035 P=– P=– P=12,445,765,035 Short-term investments 842,400,000 – – 842,400,000 Receivables from: Rent – 3,477,322,068 296,132,283 3,773,454,351 Accrued interest 52,465,763 – – 52,465,763 Advances to suppliers and others – 1,076,511,137 – 1,076,511,137 Financial Assets at FVPL Investments held for trading - Corporate and government bonds 747,147,955 – – 747,147,955 Derivative assets 105,169,566 – – 105,169,566 AFS Investments Debt securities 1,000,000,000 – – 1,000,000,000
P=15,192,948,319 P=4,553,833,205 P=296,132,283 P=20,042,913,807 *Excluding cash on hand amounting to P=51 million.
December 31, 2011 Neither Past Due nor Impaired Past Due High Standard but not Quality Quality Impaired Total Loans and Receivables Cash and cash equivalents* P=8,252,825,018 P=– P=– P=8,252,825,018 Short-term investments 876,800,000 – – 876,800,000 Receivables from: Rent – 3,677,369,474 344,655,422 4,022,024,896 Accrued interest 45,556,109 – – 45,556,109 Advances to suppliers and others – 872,521,181 – 872,521,181
Financial Assets at FVPL Investments held for trading - Corporate and government bonds 812,953,412 – – 812,953,412 Derivative assets 115,618,680 – – 115,618,680
AFS Investments Debt securities 1,000,000,000 – – 1,000,000,000
P=11,103,753,219 P=4,549,890,655 P=344,655,422 P=15,998,299,296 *Excluding cash on hand amounting to P=37 million.
Liquidity Risk The Company seeks to manage its liquidity profile to be able to finance its capital expenditures and service its maturing debts. The Company’s objective is to maintain a balance between continuity of funding and flexibility through evaluation of projected and actual cash flow information. Liquidity risk arises from the possibility that the Company may encounter difficulties in raising funds to meet commitments from financial instruments or that a market for derivatives may not exist in some circumstance.
The Company’s financial assets, which have maturity of less than 12 months and used to meet its short-term liquidity needs, are cash and cash equivalents, short-term investments and investments held for trading amounting to P=12,496 million, P=842 million and P=747 million, respectively, as of June 30, 2012, and P=8,290 million, P=877 million and P=813 million, respectively, as of December 31, 2011. Also included in the Company’s financial assets used to meet its short-term liquidity needs are current AFS investments amounting to P=1,000 million as of June 30, 2012 and December 31, 2011.
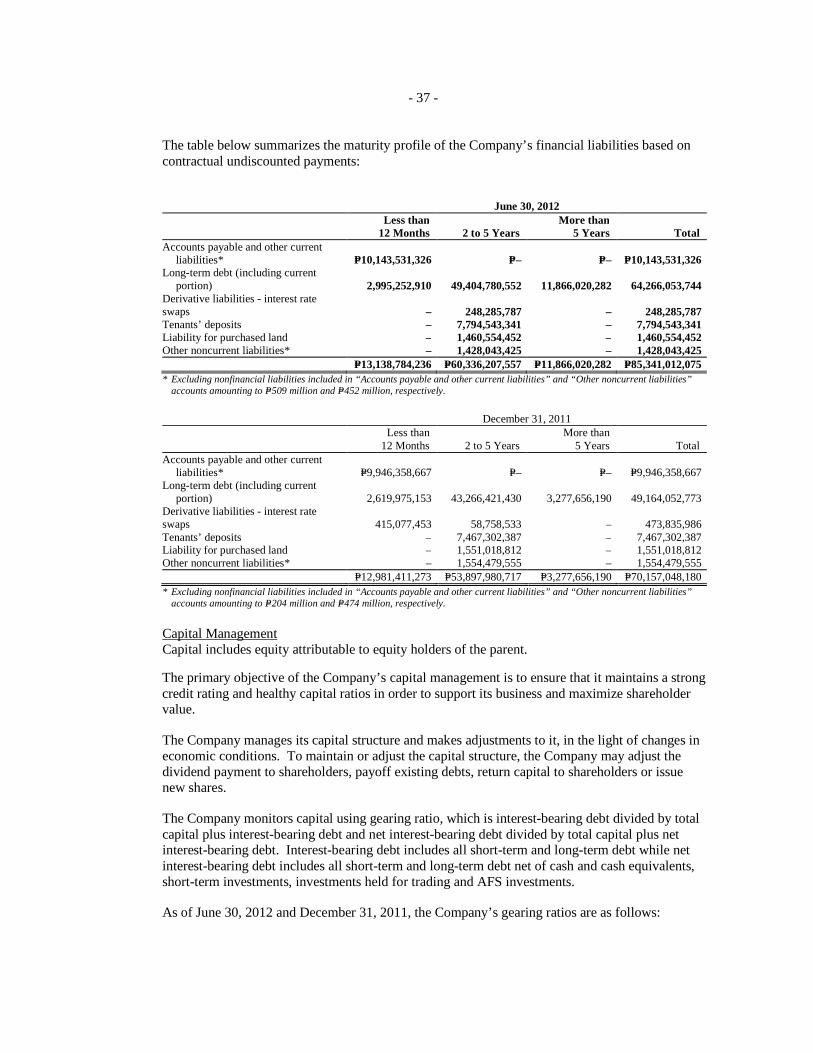
- 37 -
The table below summarizes the maturity profile of the Company’s financial liabilities based on contractual undiscounted payments:
June 30, 2012
Less than
12 Months 2 to 5 Years More than
5 Years Total Accounts payable and other current
liabilities* P=10,143,531,326 P=– P=– P=10,143,531,326 Long-term debt (including current
portion) 2,995,252,910 49,404,780,552 11,866,020,282 64,266,053,744 Derivative liabilities - interest rate swaps – 248,285,787 – 248,285,787 Tenants’ deposits – 7,794,543,341 – 7,794,543,341 Liability for purchased land – 1,460,554,452 – 1,460,554,452 Other noncurrent liabilities* – 1,428,043,425 – 1,428,043,425
P=13,138,784,236 P=60,336,207,557 P=11,866,020,282 P=85,341,012,075 * Excluding nonfinancial liabilities included in “Accounts payable and other current liabilities” and “Other noncurrent liabilities”
accounts amounting to P=509 million and P=452 million, respectively.
December 31, 2011
Less than
12 Months 2 to 5 Years More than
5 Years Total Accounts payable and other current
liabilities* P=9,946,358,667 P=– P=– P=9,946,358,667 Long-term debt (including current
portion) 2,619,975,153 43,266,421,430 3,277,656,190 49,164,052,773 Derivative liabilities - interest rate swaps 415,077,453 58,758,533 – 473,835,986 Tenants’ deposits – 7,467,302,387 – 7,467,302,387 Liability for purchased land – 1,551,018,812 – 1,551,018,812 Other noncurrent liabilities* – 1,554,479,555 – 1,554,479,555
P=12,981,411,273 P=53,897,980,717 P=3,277,656,190 P=70,157,048,180 * Excluding nonfinancial liabilities included in “Accounts payable and other current liabilities” and “Other noncurrent liabilities”
accounts amounting to P=204 million and P=474 million, respectively.
Capital Management Capital includes equity attributable to equity holders of the parent.
The primary objective of the Company’s capital management is to ensure that it maintains a strong credit rating and healthy capital ratios in order to support its business and maximize shareholder value.
The Company manages its capital structure and makes adjustments to it, in the light of changes in economic conditions. To maintain or adjust the capital structure, the Company may adjust the dividend payment to shareholders, payoff existing debts, return capital to shareholders or issue new shares.
The Company monitors capital using gearing ratio, which is interest-bearing debt divided by total capital plus interest-bearing debt and net interest-bearing debt divided by total capital plus net interest-bearing debt. Interest-bearing debt includes all short-term and long-term debt while net interest-bearing debt includes all short-term and long-term debt net of cash and cash equivalents, short-term investments, investments held for trading and AFS investments.
As of June 30, 2012 and December 31, 2011, the Company’s gearing ratios are as follows:

- 38 -
Interest-bearing Debt to Total Capital plus Interest-bearing Debt
June 30,
2012 December 31,
2011 Current portion of long-term debt P=892,042,323 P=799,086,409 Long-term debt - net of current portion 51,051,604,093 40,093,522,320 Total interest-bearing debt (a) 51,943,646,416 40,892,608,729 Total equity attributable to equity holders of
the Parent 64,379,644,167 63,773,661,498 Total interest-bearing debt and equity attributable to
equity holders of the Parent (b) P=116,323,290,583 P=104,666,270,227
Gearing ratio (a/b) 45% 39%
Net Interest-bearing Debt to Total Capital plus Net Interest-bearing Debt
June 30,
2012 December 31,
2011 Current portion of long-term debt P=892,042,323 P=799,086,409 Long-term debt - net of current portion 51,051,604,093 40,093,522,320 Less cash and cash equivalents, short-term investments,
investments held for trading and AFS investments (15,086,306,461) (10,979,969,451) Total net interest-bearing debt (a) 36,857,339,955 29,912,639,278 Total equity attributable to equity holders of the Parent 64,379,644,167 63,773,661,498 Total net interest-bearing debt and equity attributable to
equity holders of the Parent (b) P=101,236,984,122 P=93,686,300,776
Gearing ratio (a/b) 36% 32%
21. Financial Instruments
Carrying Values The table below presents a comparison of the carrying amounts of the Company’s financial instruments by category:
June 30,
2012 March 31,
2012 December 31,
2011 Financial Assets Loans and receivables P=18,241,589,757 P=22,004,898,824 P=14,107,118,225 Financial assets at FVPL 852,317,521 856,015,278 928,572,092 AFS investments 1,000,000,000 1,000,000,000 1,000,000,000 P=20,093,907,278 P=23,860,914,102 P=16,035,690,317
Financial Liabilities Financial liabilities at FVPL P=248,285,787 P=268,632,830 P=237,979,926 Other financial liabilities 72,770,318,960 70,070,371,518 61,411,768,150 P=73,018,604,747 P=70,339,004,348 P=61,649,748,076
Fair Values The carrying amounts of the Company’s other financial assets approximate their fair values due to the short-term nature of the transactions.

- 39 -
Fair Value Hierarchy The Company uses the following hierarchy for determining and disclosing the fair value of financial instruments by valuation technique:
Level 1: Quoted prices in active markets for identical assets or liabilities;
Level 2: Those involving inputs other than quoted prices included in Level 1 that are observable for the asset or liability, either directly (as prices) or indirectly (derived from prices); and,
Level 3: Those with inputs for the asset or liability that are not based on observable market data (unobservable inputs).
The following table shows the Company’s financial instruments carried at fair value as of June 30, 2012 and December 31, 2011 based on Levels 1 and 2:
2012 2011 Level 1 Level 2 Level 1 Level 2 Financial Assets Financial assets at FVPL: Investments held for trading -
corporate and government bonds P=747,147,955 P=– P=812,953,412 P=– Derivative assets – 105,169,566 – 115,618,680 747,147,955 105,169,566 812,953,412 115,618,680 AFS investments: Corporate notes - quoted – 1,000,000,000 – 1,000,000,000 Redeemable preferred shares -
unquoted – – – – P=747,147,955 P=1,105,169,566 P=812,953,412 P=1,115,618,680
Financial Liabilities Financial liabilities at FVPL - Derivative liabilities P=– P=248,285,787 P=– P=237,979,926
During the period ended June 30, 2012 and December 31, 2011, there were no transfers between Level 1 and Level 2 fair value measurements. There are no financial instruments classified under Level 3.
Derivative Financial Instruments To address the Company’s exposure to market risk for changes in interest rates primarily to long-term floating rate debt obligations and manage its foreign currency risk, the Company entered into various derivative transactions such as interest rate swaps, cross currency swaps, foreign currency call options, non-deliverable forwards and foreign currency range options.
The table below shows information on the Company’s interest rate swaps presented by maturity profile.
June 30, 2012 <1 Year >1-<2 Years >2-<5 Years Floating-Fixed Outstanding notional amount $145,000,000 $145,000,000 $145,000,000 Receive-floating rate 6 months LIBOR+margin% 6 months LIBOR+margin% 6 months LIBOR+margin% Pay-fixed rate 2.91%–3.28% 2.91%–3.28% 2.91%–3.28% Outstanding notional amount $50,000,000 $50,000,000 $50,000,000 Receive-floating rate 6 months LIBOR+margin% 6 months LIBOR+margin% 6 months LIBOR+margin% Pay-fixed rate 3.18%–3.53% 3.18%–3.53% 3.18%–3.53%

- 40 -
June 30, 2012 <1 Year >1-<2 Years >2-<5 Years Outstanding notional amount $25,000,000 $25,000,000 $– Receive-floating rate 6 months LIBOR+margin% 6 months LIBOR+margin% Pay-fixed rate 4.10% 4.10% Fixed-Floating Outstanding notional amount P=980,000,000 P=970,000,000 P=960,000,000 Receive-fixed rate 5.44% 5.44% 5.44% Pay-floating rate 3MPDST-F 3MPDST-F 3MPDST-F Outstanding notional amount P=980,000,000 P=970,000,000 P=960,000,000 Receive-fixed rate 7.36% 7.36% 7.36% Pay-floating rate 3MPDST-F+margin% 3MPDST-F+margin% 3MPDST-F+margin%
December 31, 2011 <1 Year >1-<2 Years >2-<5 Years Floating-Fixed Outstanding notional amount $145,000,000 $145,000,000 $145,000,000 Receive-floating rate 6 months LIBOR+margin% 6 months LIBOR+margin% 6 months LIBOR+margin% Pay-fixed rate 2.91%–3.28% 2.91%–3.28% 2.91%–3.28% Outstanding notional amount $50,000,000 $50,000,000 $50,000,000 Receive-floating rate 6 months LIBOR+margin% 6 months LIBOR+margin% 6 months LIBOR+margin% Pay-fixed rate 3.18%–3.53% 3.18%–3.53% 3.18%–3.53% Outstanding notional amount $25,000,000 $25,000,000 $– Receive-floating rate 6 months LIBOR+margin% 6 months LIBOR+margin% Pay-fixed rate 4.10% 4.10% Outstanding notional amount $20,000,000 $20,000,000 $– Receive-floating rate 6 months LIBOR+margin% 6 months LIBOR+margin% Pay-fixed rate 3.41% 3.41% Fixed-Floating Outstanding notional amount P=980,000,000 P=970,000,000 P=960,000,000 Receive-fixed rate 5.44% 5.44% 5.44% Pay-floating rate 3MPDST-F 3MPDST-F 3MPDST-F Outstanding notional amount P=980,000,000 P=970,000,000 P=960,000,000 Receive-fixed rate 7.36% 7.36% 7.36% Pay-floating rate 3MPDST-F+margin% 3MPDST-F+margin% 3MPDST-F+margin%
Interest Rate Swaps. In 2011, the Parent Company entered into US$ interest rate swap agreements with aggregate notional amount of US$145 million. Under the agreements, the Parent Company effectively converts the floating rate U.S. dollar-denominated term loan into fixed rate loan with semi-annual payment intervals up to March 21, 2015 (see Note 14). As of June 30, 2012 and December 31, 2011, the floating to fixed interest rate swaps have aggregate negative fair value of P=154 million and P=142 million, respectively.
The Parent Company also entered into US$ interest rate swap agreement with notional amount of US$20 million in 2011. Under the agreement, the Parent Company effectively converts the floating rate U.S. dollar-denominated five-year bilateral unsecured loan into fixed rate loan with semi-annual payment intervals up to November 30, 2014 (see Note 14). As of June 30, 2012 and December 31, 2011, the floating to fixed interest rate swaps have aggregate negative fair value of P=17 million and P=15 million, respectively.
In 2010, the Parent Company entered into the following interest rate swap agreements:

- 41 -
� A US$ interest rate swap agreement with nominal amount of US$30 million. Under the agreement, the Parent Company effectively converts the floating rate U.S. dollar-denominated five-year bilateral unsecured loan into fixed rate loan with semi-annual payment intervals up to November 30, 2015 (see Note 14). As of June 30, 2012 and December 31, 2011, the floating to fixed interest rate swap has a negative fair value of P=46 million and P=38 million, respectively.
� Two Philippine peso interest rate swap agreements with notional amount of P=1,000 million each, with amortization of P=10 million every anniversary. The combined net cash flows of the two swaps effectively converts the Philippine peso-denominated five-year inverse floating rate notes into floating rate notes with quarterly payment intervals up to June 2015 (see Note 14). As of June 30, 2012 and December 31, 2011, these swaps have positive fair values of P=105 million and P=116 million, respectively.
� A US$ interest rate swap agreement with notional amount of US$40 million. Under the agreement, the Parent Company effectively converts the floating rate U.S. dollar-denominated three-year club loan into fixed rate loan with semi-annual payment intervals up to October 28, 2012 (see Note 14). On May 9, 2011 and July 28, 2011, the interest rate swap agreement was preterminated as a result of the prepayment of the underlying loan. Fair value changes from the preterminated swap recognized in the consolidated statements of income amounted to P=4 million loss in 2011.
A US$ interest rate swap agreement with notional amount of US$20 million. Under the agreement, the Parent Company effectively converts the floating rate U.S. dollar-denominated three-year bilateral unsecured loan into fixed rate loan with semi-annual payment intervals up to January 14, 2013 (see Note 14). As December 31, 2011, the floating to fixed interest rate swap has a negative fair value of P=3 million, respectively. On January 13, 2012, the interest rate swap was preterminated as a result of the prepayment of the underlying loan. Fair value changes from the preterminated swap recognized on the consolidated statements of income amounted to P=1 million loss in 2012. In 2009, the Parent Company entered into US$ interest rate swap agreements with an aggregate notional amount of US$145 million. Under these agreements, the Parent Company effectively converts the floating rate US$30 million two-year bilateral loan, US$90 million three-year term loan and US$25 million five-year bilateral loan into fixed rate loans with semi-annual payment intervals up to November 2011, May 2012 and November 2013, respectively (see Note 14). The Parent Company preterminated the US$30 million swap on November 30, 2010 and the US$90 million swap on May 16, 2011. Fair value changes from the preterminated swaps recognized in the consolidated statements of comprehensive income amounted to P=9 million loss in 2011 and P=6 million gain in 2010. As of June 30, 2012 and December 31, 2011, the outstanding floating to fixed interest rate swaps has negative fair values of P=31 million and P=40 million, respectively.
Also in 2009, the Parent Company entered into Philippine peso interest rate swap agreement with notional amount of P=750 million. Under the agreement, the Parent Company effectively converts the floating rate Philippine peso-denominated four-year bullet term loan into fixed rate loan with quarterly payment intervals up to April 2013 (see Note 14). On October 17, 2011, the interest rate swap was preterminated as a result of the prepayment of the underlying loan.
In 2008, the Parent Company entered into Philippine peso interest swap agreements with an aggregate notional amount of P=1,000 million with repayment of P=5 million every anniversary. Under these agreements, the Parent Company effectively swaps the fixed rate Philippine peso-

- 42 -
denominated five-year syndicated fixed rate notes into floating rate loans based on PDST-F plus an agreed margin with quarterly payment intervals up to June 2013 (see Note 14). On March 14, 2011, the interest rate swap was preterminated as a result of the prepayment of the underlying loan. Fair value changes from the preterminated swap recognized in the consolidated statements of income amounted to P=27 million loss in 2011.
22. Basic/Diluted EPS Computation
Basic/diluted EPS is computed as follows:
2012 2011 Net income attributable to equity holders of the
Parent (a) P=4,924,828,023 P=4,273,041,217
Common shares issued 13,348,191,367 13,348,191,367 Stocks dividends (see Note 15) 3,474,734,693 3,474,734,693 Weighted average number of shares issued in equity
placement (see Note 15) 569,608,700 403,472,829 Common shares issued at end of year 17,392,534,760 17,226,398,889 Less treasury stock 18,857,000 18,857,000 Weighted average number of common shares
outstanding (b) 17,373,677,760 17,207,541,889
Earnings per share (a/b) P=0.283 P=0.248
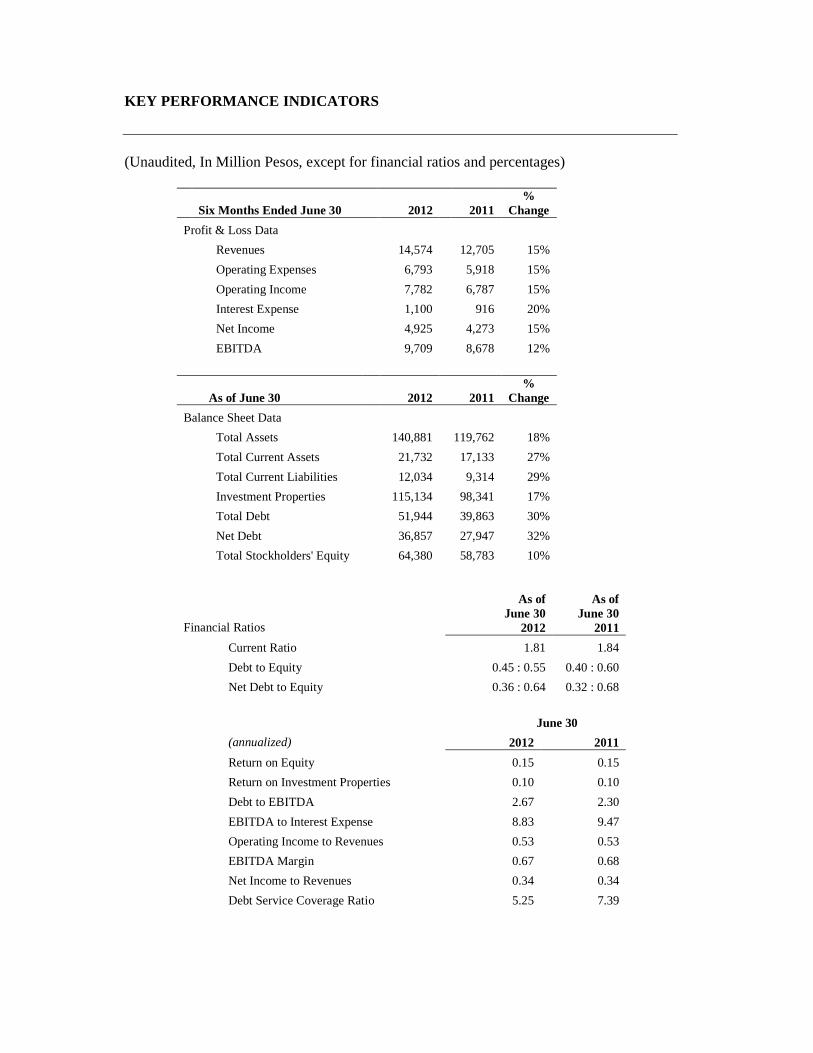
KEY PERFORMANCE INDICATORS
(Unaudited, In Million Pesos, except for financial ratios and percentages)
Six Months Ended June 30 2012 2011 %
Change
Profit & Loss Data
Revenues 14,574 12,705 15%
Operating Expenses 6,793 5,918 15%
Operating Income 7,782 6,787 15%
Interest Expense 1,100 916 20%
Net Income 4,925 4,273 15%
EBITDA 9,709 8,678 12%
As of June 30
2012 2011 %
Change
Balance Sheet Data
Total Assets 140,881 119,762 18%
Total Current Assets 21,732 17,133 27%
Total Current Liabilities 12,034 9,314 29%
Investment Properties 115,134 98,341 17%
Total Debt 51,944 39,863 30%
Net Debt 36,857 27,947 32%
Total Stockholders' Equity 64,380 58,783 10%
Financial Ratios
As of June 30
2012
As of June 30
2011
Current Ratio 1.81 1.84
Debt to Equity 0.45 : 0.55 0.40 : 0.60
Net Debt to Equity 0.36 : 0.64 0.32 : 0.68
June 30
(annualized) 2012 2011
Return on Equity 0.15 0.15
Return on Investment Properties 0.10 0.10
Debt to EBITDA 2.67 2.30
EBITDA to Interest Expense 8.83 9.47
Operating Income to Revenues 0.53 0.53
EBITDA Margin 0.67 0.68
Net Income to Revenues 0.34 0.34
Debt Service Coverage Ratio 5.25 7.39

MANAGEMENT’S DISCUSSION AND ANALYSIS OF FINANCIAL C ONDITION AND RESULTS OF OPERATIONS
Financial and Operational Highlights (In Million Pesos, except for financial ratios and percentages)
Second Quarter
Six Months Ended June 30
2012 % to
Revenues 2011 % to
Revenues %
Change 2012 % to
Revenues 2011 % to
Revenues %
Change
Profit & Loss Data
Revenues 7,539 100%
6,638 100% 14% 14,574 100%
12,705 100% 15%
Operating Expenses 3,551 47% 3,119 47% 14% 6,793 47% 5,918 47% 15%
Operating Income 3,988 53% 3,519 53% 13% 7,782 53% 6,787 53% 15%
Net Income 2,491 33% 2,154 32% 16% 4,925 34% 4,273 34% 15%
EBITDA 4,976 66% 4,484 68% 11% 9,709 67% 8,678 68% 12%
June 30
2012
% to Total Assets
Dec 31 2011
% to Total Assets
% Change
Balance Sheet Data
Total Assets 140,881 100% 128,556 100% 10%
Investment Properties 115,134 82% 107,836 84% 7%
Total Debt 51,944 37% 40,893 32% 27%
Net Debt 36,857 26% 29,913 23% 23%
Total Stockholders' Equity 64,380 46% 63,774 50% 1%
Financial Ratios June 30
2012 Dec 31
2011
Current Ratio 1.81 1.49
Debt to Equity 0.45 : 0.55 0.39 : 0.61
Net Debt to Equity 0.36 : 0.64 0.32 : 0.68
June 30
(annualized) 2012 2011
Return on Equity 0.15 0.15
Return on Investment Properties 0.10 0.10
Debt to EBITDA 2.67 2.30
EBITDA to Interest Expense 8.83 9.47
Operating Income to Revenues 0.53 0.53
EBITDA Margin 0.67 0.68
Net Income to Revenues 0.34 0.34
Debt Service Coverage Ratio 5.25 7.39

SM Prime Holdings, Inc., the country’s leading shopping mall developer and operator which currently owns forty four malls in the Philippines and four malls in China, posts 15% increase in gross revenues for the first half of 2012 to P=14.57 billion from P=12.71 billion in the same period 2011. Rental revenues, accounting for 85% of total revenues, grew by 14% amounting to P=12.41 billion from same period last year of P=10.92 billion. This is largely due to rentals from new SM Supermalls opened in years’ 2010 and 2011, namely, SM City Tarlac, SM City San Pablo, SM City Calamba, SM City Novaliches and SM City Masinag. The new malls added 380,000 square meters to total gross floor area. Excluding the new malls and expansions, same-store rental growth is at 8%. In terms of gross revenues, the four malls in China contributed P=1.27 billion in 2012 and P=0.98 billion in 2011, or 9% and 8% of total consolidated revenues, respectively. Likewise, in terms of rental revenues, the China operations contributed 10% and 9% to SM Prime’s consolidated rental revenues in 2012 and 2011, respectively. Gross revenues of the four malls in China increased 30% in 2012 compared to the same period in 2011 largely due to improvements in the average occupancy rate, lease renewals and the opening of the SM Xiamen Lifestyle and SM Suzhou which added 182,000 square meters of gross floor area. Average occupancy rate for the four malls is now at 95%. For the first half of 2012, cinema ticket sales increased by 22% to P=1.57 billion from P=1.29 billion in the same period last year due to more blockbuster movies and roll-out of cinema turnstile system which made the cinema viewing experience more convenient for customers and has led to increase in foot traffic. In 2012, major blockbusters shown were “The Avengers,” “Unofficially Yours,” “The Hunger Games,” “Wrath of the Titans” and “Enteng ng Ina Mo.” In 2011, major films shown were “Kung Fu Panda 2,” “Thor,” “Pirates of the Caribbean 4,” “Catch Me I’m in Love” and “X-Men: First Class.” Amusement and other revenues likewise increased by 21% to P=594 million in 2012 from P=492 million in 2011 mainly due to higher income from amusement rides. This account is mainly composed of amusement income from rides, bowling and ice skating operations including the SM Science Discovery Center and the SM Storyland. Operating expenses increased by 15% from P=5.92 billion in 2011 to P=6.79 billion in 2012 mainly due to increase in administrative expenses particularly, utilities, business taxes and manpower expenses. Same-store growth in operating expenses is 8%. Likewise, income from operations posted a 15% growth from P=6.79 billion in 2011 to P=7.78 billion in 2012. In terms of operating expenses, the four malls in China contributed P=0.76 billion in 2012 and P=0.56 billion in 2011, or 11% and 10% of SM Prime’s consolidated operating expenses, respectively. Interest and dividend income increased by 17% to P=230 million in 2012 compared to P=197 million in 2011 mainly due to higher average balance of temporary investments in the first half of 2012 compared to same period last year. Interest expense likewise increased by 20% to P=1.1 billion in 2012 from P=0.92 billion in 2011 due to new loan availments. Net income for the six months ended 2012 increased by 15% at P=4.92 billion from same period last year of P=4.27 billion. On a stand-alone basis, the net income of China operations increased to P=321 million in 2012 compared to P=211 million in 2011 for a 52%
increase, while net income of the Philippine operations grew 13% at P=4.60 billion in 2012 from P=4.06 billion in 2011. On the balance sheet side, cash and cash equivalents significantly increased by 51% from P=8.29 billion as of December 31, 2011 to P=12.50 billion as of June 30, 2012. This account includes the proceeds from loans drawn in 2012 amounting to P=7.5 billion and $100 million for working capital and capital expenditure requirements. Investments held for trading decreased by 8% from P=813 million as of December 31, 2011 to P=747 million as of June 30, 2012, due to investments in corporate bonds which matured in March 2012. Receivables decreased by 1% from P=4.94 billion as of December 31, 2011 to P=4.90 billion as of June 30, 2012, due to subsequent collections of rental receivables. While prepaid expenses and other current assets increased by 37% from P=1.28 billion as of December 31, 2011 to P=1.74 billion as of June 30, 2012, mainly due to prepaid insurance on investment properties and advances to contractors. Investment properties increased by 7% from P=107.84 billion as of December 31, 2011 to P=115.13 billion as of June 30, 2012 because of on-going new mall projects located in Taguig, Pampanga, Cebu City, General Santos and Davao City in the Philippines and Chongqing, Zibo and Tianjin in China. Derivative assets decreased by 9% from P=116 million as of December 31, 2011 to P=105 million as of June 30, 2012. On the other hand, derivative liabilities increased by 4% from P=238 million as of December 31, 2011 to P=248 million as of June 30, 2012, mainly resulting from mark-to-market gains and losses on interest rate swaps used to hedge interest rate exposure on loans. Deferred tax assets decreased by 15% from P=254 million as of December 31, 2011 to P=216 million as of June 30, 2012 due to reversal of unrealized losses recognized in prior years, while deferred tax liabilities increased to P=1.262 billion as of June 30, 2012 from P=1.258 billion as of December 31, 2011 due to capitalized interest. The increase in accounts payable and other current liabilities by 5% from P=10.15 billion as of December 31, 2011 to P=10.65 billion as of June 30, 2012, is mainly due to payables related to accrued operating expenses. Long-term debt increased by 27% from P=40.89 billion as of December 31, 2011 to P=51.94 billion as of June 30, 2012 due to new loan availments amounting to P=11 billion, net of prepayments. The increase in tenants’ deposits by 4% from P=7.47 billion as of December 31, 2011 to P=7.79 billion as of June 30, 2012 is due to the new malls and expansions. Liability for purchased land decreased by 6% from P=1.55 billion as of December 31, 2011 to P=1.46 billion as of June 30, 2012 due to payments for land acquisitions. Other noncurrent liabilities likewise decreased by 7% from P=2.03 billion as of December 31, 2011 to P=1.88 billion as of June 30, 2012 due to subsequent payments.
The Company’s performance indicators are measured in terms of the following: (1) current ratio which measures the ratio of total current assets to total current liabilities; (2) debt to equity which measures the ratio of interest bearing liabilities to stockholders’ equity; (3) net debt to equity which measures the ratio of interest bearing liabilities net of cash and cash equivalents and investment securities to stockholders’ equity; (4) debt service coverage ratio (DSCR) which measures the ratio of annualized operating cash flows to loans payable, current portion of long-term debt and interest expense, excluding the portion of debt which are fully hedged by cash and cash equivalents and temporary investments; (5) return on equity (ROE) which measures the ratio of net income to capital provided by stockholders; (6) earnings before interest, income taxes, depreciation and amortization (EBITDA); (7) debt to EBITDA which measures the ratio of EBITDA to total interest-bearing liabilities; (8) EBITDA to interest expense which measures the ratio of EBITDA to interest expense; (9) operating income to revenues which basically measures the gross profit ratio; (10) EBITDA margin which measures the ratio of EBITDA to gross revenues and (11) net income to revenues which measures the ratio of net income to gross revenues. The following discuss in detail the key performance indicators of the Company. The Company’s current ratio increased to 1.81:1 from 1.49:1 as of June 30, 2012 and December 31, 2011, respectively, mainly due to the proceeds from loans availed in 2012. Similarly, interest-bearing debt to stockholders’ equity increased to 0.45:0.55 from 0.39:0.61 as of June 30, 2012 and December 31, 2011, respectively, while net interest-bearing debt to stockholders’ equity also increased to 0.36:0.64 from 0.32:0.68 as of June 30, 2012 and December 31, 2011, respectively due to the additional loans. Debt service coverage ratio decreased to 5.25:1 from 7.39:1 for the six months ended June 30, 2012 and 2011, respectively, due to increase in interest expense in 2012 compared to 2011. In terms of profitability, ROE remains steady at 15% for the periods ended June 30, 2012 and 2011. EBITDA increased by 12% to P=9.71 billion in 2012 from P=8.68 billion in 2011. Debt to EBITDA slightly increased to 2.67:1 from 2.30:1 as of June 30, 2012 and 2011, respectively, due to increase in long-term debt. While EBITDA to interest expense decreased to 8.83:1 from 9.47:1 for the six months ended June 30, 2012 and 2011, respectively, due to higher interest expense in 2012. Consolidated operating income to revenues is steady at 53% for the periods ended June 30, 2012 and 2011. On a stand-alone basis, operating income margin of the Philippines and China operations is at 55% and 40% in 2012, compared to 54% and 42% in 2011, respectively. EBITDA margin remains strong at 67% and 68% for the periods ended June 30, 2012 and 2011, respectively. On a stand-alone basis, EBITDA margin of the Philippines and China operations is at 67% and 58% in 2012 and 69% and 64% in 2011, respectively. Net income to revenues is steady at 34% for the periods ended June 30, 2012 and 2011. On a stand-alone basis, net income margin of the Philippines and China operations is at 35% and 25% in 2012 and 35% and 22% in 2011, respectively. The Company has no known direct or contingent financial obligation that is material to the Company, including any default or acceleration of an obligation. There were no contingent

liabilities or assets in the Company’s balance sheet. The Company has no off-balance sheet transactions, arrangements, obligations during the reporting year as of balance sheet date. There are no known trends, events, material changes, seasonal aspects or uncertainties that are expected to affect the company’s continuing operations. SM Prime has forty four Supermalls strategically located in the Philippines with a total gross floor area of 5.3 million square meters. Likewise, the Company also has four Supermalls located in the cities of Xiamen, Jinjiang, Chengdu and Suzhou in China with a total gross floor area of 0.6 million square meters. Earlier this year, SM Prime opened SM City Olongapo in Zambales, SM City Consolacion in Cebu and SM City San Fernando in Pampanga. For the rest of 2012, SM Prime is scheduled to launch SM City Lanang in Davao City, SM City General Santos in South Cotabato and SM Chongqing in China. By year-end, SM Prime will have 46 malls in the Philippines and five in China with an estimated combined gross floor area of 6.3 million square meters.

SIGNATURES Pursuant to the requirements of the Securities Regulation Code, the registrant has duly caused this report to be signed on its behalf by the undersigned hereunto duly authorized. SM PRIME HOLDINGS, INC. Registrant Date: September 04, 2012 JEFFREY C. LIM Executive Vice-President
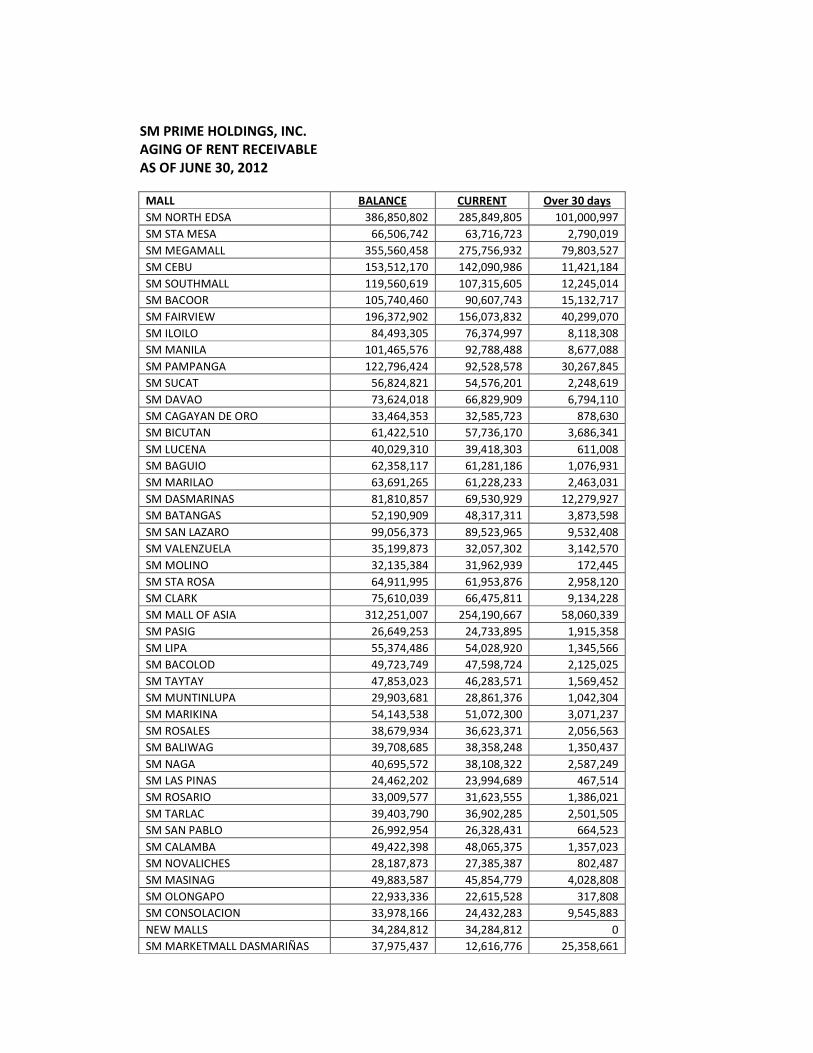
SM PRIME HOLDINGS, INC.
AGING OF RENT RECEIVABLE
AS OF JUNE 30, 2012
MALL BALANCE CURRENT Over 30 days
SM NORTH EDSA 386,850,802 285,849,805 101,000,997
SM STA MESA 66,506,742 63,716,723 2,790,019
SM MEGAMALL 355,560,458 275,756,932 79,803,527
SM CEBU 153,512,170 142,090,986 11,421,184
SM SOUTHMALL 119,560,619 107,315,605 12,245,014
SM BACOOR 105,740,460 90,607,743 15,132,717
SM FAIRVIEW 196,372,902 156,073,832 40,299,070
SM ILOILO 84,493,305 76,374,997 8,118,308
SM MANILA 101,465,576 92,788,488 8,677,088
SM PAMPANGA 122,796,424 92,528,578 30,267,845
SM SUCAT 56,824,821 54,576,201 2,248,619
SM DAVAO 73,624,018 66,829,909 6,794,110
SM CAGAYAN DE ORO 33,464,353 32,585,723 878,630
SM BICUTAN 61,422,510 57,736,170 3,686,341
SM LUCENA 40,029,310 39,418,303 611,008
SM BAGUIO 62,358,117 61,281,186 1,076,931
SM MARILAO 63,691,265 61,228,233 2,463,031
SM DASMARINAS 81,810,857 69,530,929 12,279,927
SM BATANGAS 52,190,909 48,317,311 3,873,598
SM SAN LAZARO 99,056,373 89,523,965 9,532,408
SM VALENZUELA 35,199,873 32,057,302 3,142,570
SM MOLINO 32,135,384 31,962,939 172,445
SM STA ROSA 64,911,995 61,953,876 2,958,120
SM CLARK 75,610,039 66,475,811 9,134,228
SM MALL OF ASIA 312,251,007 254,190,667 58,060,339
SM PASIG 26,649,253 24,733,895 1,915,358
SM LIPA 55,374,486 54,028,920 1,345,566
SM BACOLOD 49,723,749 47,598,724 2,125,025
SM TAYTAY 47,853,023 46,283,571 1,569,452
SM MUNTINLUPA 29,903,681 28,861,376 1,042,304
SM MARIKINA 54,143,538 51,072,300 3,071,237
SM ROSALES 38,679,934 36,623,371 2,056,563
SM BALIWAG 39,708,685 38,358,248 1,350,437
SM NAGA 40,695,572 38,108,322 2,587,249
SM LAS PINAS 24,462,202 23,994,689 467,514
SM ROSARIO 33,009,577 31,623,555 1,386,021
SM TARLAC 39,403,790 36,902,285 2,501,505
SM SAN PABLO 26,992,954 26,328,431 664,523
SM CALAMBA 49,422,398 48,065,375 1,357,023
SM NOVALICHES 28,187,873 27,385,387 802,487
SM MASINAG 49,883,587 45,854,779 4,028,808
SM OLONGAPO 22,933,336 22,615,528 317,808
SM CONSOLACION 33,978,166 24,432,283 9,545,883
NEW MALLS 34,284,812 34,284,812 0
SM MARKETMALL DASMARIÑAS 37,975,437 12,616,776 25,358,661

MALL BALANCE CURRENT Over 30 days
SM BY THE BAY 36,426,183 25,631,292 10,794,891
SM SAVEMORE NAGTAHAN 7,164,643 7,154,274 10,369
SM SAVEMORE APALIT 4,785,044 4,549,384 235,660
SM HYPERMARKET SUCAT 7,556,601 6,543,624 1,012,977
SM CHINA MALLS 116,815,542 27,015,079 89,800,463
3,773,454,351 3,181,438,492 592,015,859
Related Documents


