Review of Candle Emissions Literature and Recommendations Prepared By Joan Strawson, TERA Patricia Nance, TERA Jay Zhao, TERA Submitted by Toxicology Excellence for Risk Assessment (TERA) 2300 Montana Avenue, Ste. 409 Cincinnati, OH 45211 Submitted to Consumer Specialty Products Association Air Care Division Date 28 April 2005

Welcome message from author
This document is posted to help you gain knowledge. Please leave a comment to let me know what you think about it! Share it to your friends and learn new things together.
Transcript

Review of Candle Emissions
Literature and Recommendations
Prepared By
Joan Strawson, TERA Patricia Nance, TERA
Jay Zhao, TERA
Submitted by
Toxicology Excellence for Risk Assessment (TERA) 2300 Montana Avenue, Ste. 409
Cincinnati, OH 45211
Submitted to
Consumer Specialty Products Association Air Care Division
Date 28 April 2005

i
Table of Contents Table of Contents ................................................................................................................. i
List of Tables i 1. Introduction .................................................................................................................... 1 2. Consumer Concerns ....................................................................................................... 1
2.1 Candle Soot .............................................................................................................. 1 2.2 Indoor air pollution .................................................................................................. 2 2.3 Lead Wicks .............................................................................................................. 3
3. Government Initiative .................................................................................................... 4 4. Scientific Research on Candle Emissions ...................................................................... 4
4.1 Particulate Matter Emissions ................................................................................... 5 4.2 Organics .................................................................................................................... 7 4.3 Health Effects of Candle Emissions and Risk Assessment .................................. 12
5. Data Gaps ..................................................................................................................... 17 6. References .................................................................................................................... 18
6.1 Consumer Concerns Literature .............................................................................. 18 6.2 Government Initiative Literature ........................................................................... 19 6.3 Scientific Literature ............................................................................................... 19
List of Tables Table 1. Estimated Air Concentration of Selected Organics ............................................. 9 Table 2. Emission of Selected Organic Compounds from Gel-Wax and Paraffin Candles.
................................................................................................................................... 11 Table 3. Comparison of Chemical Air Concentrations (Worst Case) with Risk Values . 15 Table 4. Comparison of Chemical Air Concentrations (Real Exposure) with Risk Values
................................................................................................................................... 17

1
1. Introduction Candles have been used by humans for thousands of years. Candles have gained popularity over the past 30 years resulting in the current abundance of candle shops and aromatherapy candle products. U.S. candle sales reached $2.1 billion in 1998 and are growing at 10 to 15 percent annually1. With the increase in candle use, comes public concern about potential health effects due to the exposure to candle emissions. This has resulted from an increased attention to general indoor air quality issues as well as an increased focus on the health effects of fragrances. Numerous reports appearing in the scientific and medical literature have generally drawn attention to the claims of adversity. Although the scientific and medical data are far from clear on this subject, public policy has shifted towards increased protection of consumers from fragrance exposures and towards more concern for indoor air quality. The potential for regulatory authorities to regulate candles could grow as more research is published. The purpose of this report is to review and summarize the available data on candle emissions, including emissions of fragrance components, gas phase combustion products, and particulate matter (soot). The review covers three distinct aspects of the available data. Public information, including popular press, was reviewed to identify key consumer concerns regarding candle emissions. All the public information found was from searching the internet using search engines such as Google. Sources of public information came from website, industry, activist groups, and the media. The scientific literature was reviewed to identify key scientific issues and data gaps related to candle emissions. An array of databases was searched for sources of scientific literature. A variety of databases were searched such as TOXNET, MEDLINE/PubMed, RTECS, ATSDR, IPCS, and many more. Government initiatives were reviewed to understand the regulatory response to consumer concerns. Government agency website were searched including the U.S Environmental Protection Agency (U.S. EPA) and the Agency for Toxic Substances and Disease Registry (ATSDR). Each of these three areas was searched using a series of key words including: candle, candle emissions, soot AND candle, soot AND particulate, soot AND particle size, soot NOT diesel, particulate matter, particulate AND indoor, paraffin, stearin, beeswax, and burning candle. 2. Consumer Concerns A review of the popular press reveals that the issues of most concern to the public include the formation of soot from burning candles and the emission of lead and other metals from burning wicks containing metals. Public concerns over soot include both the physical damage that soot can cause in homes and the health effects of breathing soot. Fewer reports in the popular press address the health effects of organic compounds present in candle emissions. 2.1 Candle Soot
1 American Lung Association website.

2
Candle soot is the most prevalent of these issues. The production of candle soot has been implicated as a possible source of a phenomenon called black soot deposition. It is also referred to by many other names such as “ghosting,” “carbon tracking,” and “dirty house syndrome.” It is characterized by the appearance of a black or gray residue appearing of the interior surfaces of homes. Soot is a product of incomplete combustion of carbon-containing material and can appear as a gray to black colored substance. The number and type of wicks and the candle scent may also play a major role in the type of particulates that are emitted in the soot. The composition of the candle and the fragrance will also determine the number and the amount of emissions produced. The views of black soot deposition vary throughout the press. Articles in the Wall Street Journal (Tejada, 1999), The Ottawa Citizen (Dow, 1999) and the Indoor Environment Review (Rasmussen, 1998) all proceed with warnings of soot damage to one’s home and limit their comments on the variety of health effects to candle emissions. In addition, an insurance website and a HVAC company website also emphasize the potential for residential damage rather than heath risks. An article in Home Energy Magazine (Vigil, 1998) gives an overview of what “ghosting” is and the variety of sources of the soot, such as oil heat, wood burning stoves, and lightly touching on candles. The article describes a homeowner in Texas who had been burning up to 10 candles at a time for 12 years and did not have a problem with soot, until recently. After purchasing new aromatic candles, the homeowner noticed that stains began appearing within months on the walls and draperies. A sidebar from the article entitled, “This Little Light of Mine” focused specifically on candles. It was found that scented candles, jar candles, and oil candles appear to emit a higher soot output than standard wax candles. Bailey Engineering Corporation (BEC) performed test on a variety of candles showing that the use of lower-grade waxes and materials are resulting in a high oil content which produces more soot. Four candles were burned for 15 hours and produced enough soot that the test was stopped for fear of producing too much damage in the house. Newsletters from two universities focused on black soot deposition associated with candles. Both newsletters are a part of an educational series offered by their respective universities. The Ohio State newsletter (Adler, 2004) article briefly defines black soot deposition and gives recommendations on the types of candles one should use to reduce the amount of soot. The Auburn University newsletter (LaPrade, 1999) article adds information on possible health concerns related to black soot deposition, such as respiratory health effects. The New York Times (Revkin, 2001) and the USA Today (Watson, 2001) both referenced the research conducted by the US EPA that showed a relationship between soot particles and potential health effects. The U.S. EPA report (2001) is the only government report found that addresses the public’s concern. 2.2 Indoor air pollution

3
Indoor air pollution is another concern expressed in the popular press. The byproducts produced from burning candles include carbon monoxide (CO), carbon dioxide (CO2), nitrogen oxides (NOx), aldehydes, unburned/partially burned hydrocarbons and particulate matter (soot particles). The byproducts of candles can vary depending on the composition and fragrance of the candles. A variety of health effects are associated with exposure to indoor air pollution, including respiratory symptoms (sore throat, cough, phlegm, and tight chest), airway irritation, asthma, bronchitis and emphysema. Reducing unnecessary exposures to indoor pollutants may help to reduce the risk of adverse effects. There are many general concerns regarding the potential health effects, including asthma and allergies, from exposure to candle emissions(Gadish, 2001 and Watson, 2001). Another emission of concern is hydrocarbons, specifically polycyclic aromatic hydrocarbons (PAH) which are well known for their cancer-causing potency. There is also concern regarding exposure to scented candles, but the research on this area is very limited (Gadish, 2001). The National Candle Association, as well as the U.S EPA recommends candle wicks be trimmed to a quarter inch to reduce the amount of particulates released during burning. 2.3 Lead Wicks Another issue of candle emissions found in the press is concerning lead. Lead is sometimes used as a stiffening agent in candle wicks to keep the wick out of the molten wax during burning. The burning of lead wicks can emit lead particulates into the air and then deposit them onto indoor surfaces. Lead dust and particles are especially dangerous to children, as many people are aware of due to the lead-based paint removal effort. The majority of all candle manufacturers have ceased to produce candles with lead wicks, but many imported candles still use lead wicks. In 2000, the Sun newspaper printed an article (Harris, 2000) warning consumers to burn candles wisely. The article cited a University of Michigan study that found that a third of the candles that were tested from the United States, Mexico, and China emitted more lead into the air than is recommended by the U.S EPA (final standard for airborne lead is 1.5 micrograms lead per cubic meter of air). The procedure to test candle wicks for lead is also discussed. A ban and recall of candles with lead wicks has been requested by a consumer watchdog group called Public Citizen (Sobel et al., 2000). Laboratory tests showed that lead concentrations in the air were nine to 33 percent higher than recommended federal indoor air guidelines when the candle burned for three hours. For this study, 285 candles from stores in the Washington-Baltimore area were purchased. Metal wicks were found in 86 of the candles, of which nine were found to have high amounts of lead (24 to 118, mg). In 1974, the Consumer Product Safety Commission and the National Candle Association voluntarily agreed to stop using lead-containing wicks. In October 2003, the Consumer Product Safety Commission banned the use of lead cored wicks in the United States. Canada proposed banning lead wicks in November 2003.
4
Lead exposure is an important issue in candle emissions, but since it is no longer legal to sell candles with lead cored wicks in the U.S., the topic will not be further discussed in this paper. 3. Government Initiative No, government agency regulates candle emissions. The U.S. Occupational Safety and Health Administration (OSHA) does regulate paraffin wax fumes in the workplace. The Occupational Safety & Health Administration (OSHA) developed a toxicological profile for exposure to paraffin wax fumes. Paraffin wax is used as a sealer or waterproofing agent, as well as in the candle making industry. OSHA established an 8-hour TWA limit of 2 mg/m3 (OSHA, 1992). The National Institute for Occupational Safety and Health (NIOSH) and the ACGIH both agree with this occupational exposure limit. Since paraffin wax fumes are not generated to any significant extent by a burning candle, it has little relevance to the candles burned in the home. The U.S. Environmental Protection Agency (EPA) does not have any regulatory standards on candle emissions. However, in January 2001, the U.S. EPA did prepare a report summarizing the available information on candles and incense as potential sources of indoor air pollution, incorporating marketing and scientific information. Three areas of concern were identified as follows: lead-core wick candles; candle soot emissions; and indoor particulate emissions from incense. The U.S. EPA concluded that candles with lead wicks have the potential to generate indoor airborne lead concentration of health concern and soot emissions can be reduced by keeping candle wicks short, drafts at a minimum, and burning unscented candles There have been no published use or safety guidelines from any other government agency on candle emissions. Some private and public organizations have suggested ways to reduce the amount of candle emissions as noted previously. 4. Scientific Research on Candle Emissions Limited credible research has been done evaluating candle emissions. Studies have been conducted which characterize the nature of candle emissions and attempt to quantify the amounts of contaminants as well as understanding the conditions that affect emissions. Consistent with public concerns, much of the research has been done to characterize the fine particulate matter, the primary component of soot that is present in candle emissions2. Research as also been done to characterize the organic compounds that are considered to be products of combustion: polycyclic aromatic hydrocarbons (PAH), and polychlorinated dibenzodioxins and furans (PCDD/PCDFs). Less research has been conducted on the presence of volatile organic compounds in candle emissions, and almost no research has been done that correlates specific organic compounds in emissions with
2 Note, a reasonable amount of research has been done on lead and other metals that could be present in emissions due to metal wicks. However, in accordance with the scope of work for this project, that research has not been included in this report.
5
specific ingredients used to scent or color candles. The following sections describe the available scientific research on candle emissions. 4.1 Particulate Matter Emissions Guo et al (2000) evaluated the fine particulate (PM2.5) emissions from five types of candles purchased from local stores. The tests were conducted in a research house, under conditions that are as close to realistic as possible. The test facility was a research house located in Cary, NC in which one bedroom was used as a test chamber. The room was isolated from the remainder of the house by blocking the air supply registers and closing the interior door. Particle-free air supply was provided to the room keeping the room under slight positive pressure to prevent the infiltration of particles from the outdoors and adjacent rooms. The resulting background concentration of fine particles in the room was less than 2 µg/m3. The test candles consisted of 3 samples of scented paraffin candles, one beeswax candle, and one birthday candle. (Results of tests on the birthday candle will not be discussed in this paper.) Details of the candle were not given except to state the material that the candles were made of paraffin or beeswax. The test candles were placed on a table away from the direct draft of a ceiling fan used to keep the air mixed. Burning duration was 4-6 hours. Particles with aerodynamic diameters of less than 10 µm (PM10) and less than 2.5 µm (PM2.5) were sampled simultaneously onto Teflon filters using cyclones. The PM size distribution and real-time concentration were determined with an electric low-pressure impactor (ELPI). The ELPI continued to operate 4 hours after candles were extinguished. During normal burning conditions, Guo et al. (2000) demonstrated that fine particle concentrations ranged from 14.9 to 1137 µg/m3 (emissions rates ranged from 41 to 5287 µg/h/wick). The distribution of fine particle diameters appears to range from about 0.08 to 1.5 µm, with the 0.3 µm particles making up the largest percent of the overall weight. Smoldering created slightly larger particles although the pattern of distribution did not change. In most cases, the PM emission rate was fairly steady during the normal burning period, but was higher immediately after the candle was lit. Also, the smoldering period immediately after the flame was extinguished generated more particles than the entire period of normal burning. The peak concentration was less if a snuffer was used to extinguish the flame instead of blowing it out. The authors concluded that under normal conditions, the candles tested do not produce significant amounts of particle although there was a great deal of variation in emission rates even when similar candles were tested. Excessive sooting and smoldering conditions generate more particles than several hours of normal burning. Fine et al. (1999) characterized the particulate and organic emissions that resulted from burning paraffin and beeswax candles used in churches. In each experiment, the candle was burned for 15 minutes in a burn chamber approximately 0.64 m3. After the candle was extinguished, the air in the chamber was sampled for an additional 15 minutes to collect all airborne particles remaining in the chamber. Five tests were conducted for each candle. All effluent from the chamber was pumped out through a stainless steel port, and then split into different sample lines for chemical analysis. Particle size

6
distribution and emission rate was measured during three different conditions – normal burn, sooting (large, flickering flame with visible black particle emissions), and smoldering (after flame extinguished, with visible white particle emissions). During a normal burn, the particle emission is characterized by a low emission rate and a peak particle size of 0.05 µm. The authors indicate that both sooting and smoldering significantly increase the emission of particles. Sooting results in an order-of-magnitude increase in emission rates, and an increase of peak particle size to about 0.4 µm. Smoldering conditions result in an increase of emission rate equivalent to about 2 orders of magnitude and a peak particle size of about 0.8 µm. Fine et al. (1999) also examined the composition of the particles, and noted that sooting produces particles that are predominantly elemental carbon whereas normal burning produces mostly organic compounds. Of the identified organic compounds in the candle particulate emissions, alkanes were the predominant chemicals class, followed by alkanoic acids, long-chain aldehydes, alkenes, and cycloalkanes. No PAH were detected in the particulate emissions during normal burn; PAH were not evaluated during sooting and smoldering. The authors demonstrated that the profile of organic compounds in the particulate emissions and the unburned wax are similar, suggesting that evaluating the wax is a more practical approach to estimating the chemical composition of the emissions. They postulate that the presence of these organic chemicals in the particulate emissions result from the volatilization of alkane material from the wax pool followed by condensation onto the particulate phase. Finally, the authors noted that the organic profile of candle emissions was very different from that of diesel emissions, with candle emissions containing more organics with larger carbon number than diesel emission. Krause et al. (1999) characterized the particulate and gas phase emissions of aromatic candles using a 45 L stainless steel chamber with high air exchange rates. The authors in this abstract provided no specific information about the candles or methods used to generate emissions. Particulate emissions ranged in size from 0.06 to 0.1 µm and particulate emission rates were up to 3.5 mg/min. Gas phase emissions contained a variety of volatile and semivolatile compounds including benzene, 2-butanone, chloroform, carbon tetrachloride, and xylenes. However, no information was provided in the abstract about concentrations or emission rates of these compounds. The authors concluded that candle emissions resembled diesel exhaust in its particle size and organic composition. Over a 16-month period, Wallace (2000) conducted real-time monitoring for particles, PAH, and carbon monoxide inside an occupied house in suburban Virginia. The author concluded that candles and incense produce large quantities of fine particles; however, the emission rate or concentration of particulate attributed to candles was not quantified. Stove gas burners, the oven, toasting, frying and broiling were also important sources of fine particles. While it was concluded that, overall, wood smoke was the largest single source of PAH, one citronella candle was a powerful PAH source.
4.1.1 Conclusions Regarding Particulate Matter Emissions
7
Only two well-conducted and completely reported studies that have characterized particulate emissions are available (Guo et al., 2000; Fine et al., 1999). The work by Krause et al. is only available to the public as a series of abstracts, which have incompletely reported data. This work was done as a Master’s Thesis; if the thesis were available to the public, there would likely be more complete information for evaluating the credibility of the study. The study by Wallace (2000) is useful for evaluating the overall impacts of indoor air pollution, but does not provide enough specific information regarding the emissions from burning candles to allow for a comparison with the other studies. One clear conclusion from the studies is that burning candles results in the generation of fine particles with diameter of less than 2.5 µm (PM2.5). All three studies were consistent in their evaluation of particle sizes released during burning, so a reasonable conclusion is that fine particulate matter in candle emissions has a diameter range of 0.05 to 1.5 µm. Two of the studies evaluated how different burn conditions could affect the size of particulate particles. Excessive sooting and smoldering appear to result in the formation of larger particles. No quantitative conclusions can be drawn regarding fine particulate matter emissions. Each study used a different experimental design, making a comparison among the studies difficult. Each study measured “emission rate” although each study measured emission rate in a different way. Guo et al.(2000) measured emission rate as the mass of particulate produced per unit time per wick; Fine et al. (1999) measured emission rate as the mass of particulate produced per mass of wax burned; Krause et al (1999) measured emission rate as the mass of particulate produced per unit of time. The only conclusion that appears to be consistent among the studies is that emission rate appears to be low during normal burn conditions, but then increases in conditions that cause sooting. Emission rate appears to be highest during the period of smoldering after flame is extinguished. Guo et al. (2000) also measured particulate concentration under conditions that simulated actual exposure (i.e., candles burning in an actual room in a house) more closely than the other studies (i.e., candles burning in a small chamber). This study reported particulate concentrations of 14.9-1137 µg/m3 in the test room following a 4-6 hour burn and an additional 4-hour sampling period. However, it is not clear whether this concentration can be compared to U.S. EPA’s National Ambient Air Quality Standard for PM2.5 of 65 µg/m3 for a 24-hour averaging time 4.2 Organics Lau et al. (1997) evaluated emissions of burning candles for the presence of PCDD/PCDF, PAH, and selected volatile organic compounds. In addition, candle raw materials, including waxes, wicks, colors, and lacquers, were evaluated for the presence of organic compounds. Nine candles were burned at the same time in a chamber that allowed for the sampling of emissions under defined conditions with a constant oxygen concentration and without turbulences. Pre-cleaned air was used during the study and the air exchange and flow rates in the chamber were adjusted to give realistic burning conditions. Generally, the authors concluded that the levels of organic contaminants in

8
raw materials used in candle manufacturing are low. As an exception to this rule, 462 µg/kg of total PAH was detected in paraffin wax, of which 70% was naphthalene. Based on the source of paraffin (petroleum distillate) this is not an unexpected finding. In addition, total chlorophenols and PCDD/PCDFs were detected in higher concentrations in beeswax compared with paraffin or stearin wax, with concentrations of 256 µg/kg, and 11ng TEQ3/kg, respectively. The authors noted that these substances are readily found in ambient air. Lau et al. (1997) reported the emission of specific contaminants from burning candles as an emission factor adjusted to the amount of contaminant in 1 g of wax. PCDD/PCDFs were detected in all types of candles tested, with emission factors ranging from 0.004 to 0.047 pg TEQ/g. Total PAH was detected in all types of candles tested, with emission factors ranging from 4.75 to 156 ng/g. Benzo(a)pyrene (BaP)4 was not detected in emissions from beeswax or stearin candles; emission factors for BaP in paraffin candles ranged from 0.01 to 0.13 ng/g. Similarly, acetaldehyde was not detected in emissions from beeswax or stearin candles and emission factors ranged from 26 to 62 ng/g in paraffin candles. Formaldehyde was found in emissions from all candle types with emission factors ranging from 3.7 to 14.1 ng/g. Finally, acrolein was only found in the emissions of the stearin candles and one of the paraffin candles, but not in any of the remaining tests; the emission factor was 5.4 ng/g. For all contaminants tested, the specific emission volume (volume of air per amount of wax being burned) was an average of 0.09 m3/g wax. By dividing the emission factors by the emission volume, Lau et al (1997) was able to express chemical emissions as an air concentration. Assuming a worst-case scenario, the highest emission factors were used to estimate the chemical air concentrations that would result from burning 30 candles for 3 hours in a room 40 m3 (a total of 540 g wax burned). These air concentrations are shown in Table 1. The authors note that these air concentrations are well below German workplace limits.
3 TEQ stands for Toxic Equivalents. The PCDDs and PCDFs can contain from 4 to 8 chlorine atoms; both the number and position of the chlorine atoms determines the overall toxicity of each congener. 2,3,7,8-tetrachlorodibenzodioxin is the most potent congener and is assigned a toxic equivalency of 1. The relative toxicity of the remaining congeners is expressed as a fraction of 1. Therefore, the total weight of the toxic equivalents is the measurement used when an environmental mixture of several PCDD/PCDF congeners is being evaluated. 4 BaP is a polycyclic aromatic hydrocarbon (PAH). It is the best characterized and most toxic PAH.

9
Table 1. Estimated Air Concentration of Selected Organics
Compound Lau et al. (1997) Estimated Air Concentration (µg/m3)
Schwind and Hosseinpour (1994) Estimated Air
Concentration (µg/m3) Formaldehyde 0.19 17 Acetaldehyde 0.834 --- Acrolein 0.073 <1 Benzo(a)pyrene 0.002 --- Naphthalene --- 0.04 PCDD/PCDF 0.635 (pg TEQ/m3) 0.038 (pg TEQ/m3) U.S. EPA (2001) reports a study by Schwind and Hosseinpour (1994) that evaluated candle emissions of 30 candles burned for 4 hours in a 50 m3 room with approximately 0.7 L/min air flow. The air concentrations reported by EPA for this study are presented in Table 1 so they can be compared to those estimated by Lau et al. (1997). OKOMETRIC GmbH (1998) evaluated the emissions from 9 gel-wax candles for PCDD/PCDFs, PAH, and short-chain aldehydes. All nine candles were burned at the same time, but the paper does not provide additional information on the methods used to generate emissions or measure chemical concentration. In addition, emissions from paraffin wax candles were evaluated, but no information was provided on the number of candles burned, the duration of burn, etc. The measured emissions of PCDD/PCDF, BaP, formaldehyde, acetaldehyde, and acrolein were compared to German Maximum Workplace Concentrations (Maximale Arbeitsplatzkonzentrationen - MAK). The results are presented in Table 2 and show that the concentrations of all compounds were lower than the threshold values. Formaldehyde was measured at the highest concentration in the candle emissions. The authors estimated that for formaldehyde, in order to exceed the MAK value, 30 candles would have to burn for 4 hours in a room smaller than 2.02 m3. As a part of the same series of studies, OKOMETRIC GmbH (1997) also investigated the emissions from paraffin candles that contained various aroma mixtures. Nine candles were burned at the same time, but the paper does not provide additional information on the methods used to generate emissions. The reported PCDD/PCDF concentration ranged from 0.04 to 0.13 pg TEQ/m3, benzo(a)pyrene <0.03 - 0.10 pg/m3, formaldehyde 0.001 - 0.003 mg/m3, acetaldehyde <0.01 mg/m3, and acrolein <0.005 mg/m3, respectively. The authors concluded that the oxidation products in the air through emissions from nine burning candles only were only fractions of corresponding MAK or Technical Guiding Concentration (Technische Richtkonzentrationen, TRK) values. TRK defines the airborne concentration of named carcinogenic materials which is the minimum possible given the state of current technologies, and TRKs are assigned only for materials for which there is no current MAK. It is not clear whether the study of OKOMETRIC GmbH (1997) is the same work cited by Okometric GmbH (1998) as shown in Table 2.

10

11
Table 2. Emission of Selected Organic Compounds from Gel-Wax and Paraffin Candles.
Substances German TRK value
German MAK value
Gel-wax candle
emission as % of threshold
Paraffin candle
emission as % of threshold
PCDD/PCDF 50 pg TEQ/m3 -- 0.22 0.4 Benzo(a)pyrene 2000 ng/m3 -- <0.0015 0.006 Formaldehyde -- 0.6 mg/m3 2.3 2.8 Acetaldehyde -- 90 mg/m3 <0.011 0.001 Acrolein -- 0.25 mg/m3 <2 0.4 Wentzel-Hartung (1994) evaluated candle emissions for the presence of PAH and PCDD/PCDF. For each test, 20 candles were burned for 9 hours in a test room measuring 18.5 m3. Candles colored with oil-based dyes or varnished were tested. For the PCDD/PCDF analysis, purple candles were evaluated since chloranil, which is used in the synthesis of the purple dye, has been suggested as a source of dioxins in candle emissions. No information was provided about how air concentrations of the compounds were measured. Benzo(a)pyrene (BaP) was measured as a surrogate for all PAH. BaP concentration in the room before burning candles was 0.0004 µg/m3. After burning either 20 candles with either oil-based dyes or 20 candles with varnish, the BaP concentration in the room ranged from 0.0004 to 0.00012 µg/m3. Burning 20 purple candles did not increase the concentration of PCDD/PCDF in the room; concentrations ranged from 226-379 pg TEQ/m3 before burning and 141 to 373 pg TEQ/m3 after burning. Purple candles produced with the dye “violet 23” have been reported to increase exposure to dioxins. Malisch (1994) tested the colored layers of 30 candles to determine if dioxins or furans were present in the wax. The three samples with the highest concentrations contained 1.8, 1.4, and 0.8 ng dioxin TEQ/kg. Of all candles, 83% had concentrations > 0.5 ng dioxin TEQ/kg, and 57% had concentrations >0.2 dioxin TEQ/kg. The congeners present were primarily OCDD, HPCDF, and OCDF. This report does not measure candle emissions, but estimated that burning a candle “highly contaminated” with dioxin TEQ could lead to an air concentration of 40 pg TEQ/m3. 5
4.2.1 Conclusions Regarding Organic Emissions Similar to the studies on particulate matter, the studies evaluating the organic content of candle emissions are limited in number. Only one of the studies, Lau et al. (1997), has described its methods with enough detail that the quality of the results can be evaluated. This study appears to be a well-conducted and generated good quality data. However, 5 Note, the authors do not present an actual concentration of dioxin in wax that would result in this air concentration.

12
even with Lau et al. (1997) it is not clear if the chemical analysis included a broad spectrum of all potential organic compounds, or was only limited to those reported in the paper. In all the papers reviewed, the candles tested were not well characterized In addition, all of the studies were conducted in Germany using German candles, so the results may not be representative of candles manufactured in the United States. PCDD/PDCFs, benzo(a)pyrene, formaldehyde, acetaldehyde, and acrolein have all been detected in candle emissions studies (Lau et al., 1997; Schwind and Hosseinpour ;1994; OKOMETRIC GmbH. ,1998; OKOMETRIC GmbH, 1997). Although Lau et al. (1997) evaluated a variety of candles with different colors and lacquers, there was no apparent correlation between the organic compounds released in the emissions and the color and finish used to make the candles. Again, similar to the studies on particulate matter, no quantitative conclusions can be drawn regarding organic compounds in candle emissions. Each study used a different experimental design, making a comparison among the studies difficult. Generally, aldehydes (formaldehyde and acetaldehyde) appear to be released in larger amounts than other organics. Four studies (Lau et al., 1997; Schwind and Hosseinpour ;1994; OKOMETRIC,1998; OKOMETRIC GmbH, 1997) estimated the air concentration of selected organic compounds that would result from burning multiple candles in a room for several hours. The authors all then compared the air concentrations to appropriate German workplace threshold values and found that resulting air concentrations would be well below these threshold values. 4.3 Health Effects of Candle Emissions and Risk Assessment Only one study reported health effects in humans following exposure to candle emissions. Bonnekoh and Merk (1991) report the case of a 60-year old male who developed eczema on his face, neck, and hands that worsened following when served as a sacristan in the cathedral. The condition was particularly bad following feast days and cleared up following long-term absences from the cathedral. Patch tests revealed a strong reaction to benzoyl peroxide that was present in the air as a result of using burning beeswax candles that had been bleached. This result suggests that a compounds used to bleach wax could be present in candle emissions and might cause an allergic response in sensitive individuals. However, the situation described in this case study is highly unusual, and the contribution of candle emission was not well characterized. Therefore, it is not expected to be a typical reaction in people burning candles in a home environment. No other studies evaluating the health effects of candle emissions in either humans or animals were located. However, two authors used the available data on candle emissions to estimate risk posed by exposure to burning candles. Stephen et al (2001) estimated the excess cancer risk from benzene in emissions from burning candles. The authors concluded that the concentration of benzene in building air is a function of the following variables: rate of benzene emission from burning candles,

13
the building volume, the rate of exchange of building air with outdoor air, length of time the candle burns, and the length of time after the candle was extinguished. The time-weighted-average concentration of benzene in building air while an exposed individual is in the building was calculated by dividing both the period of time while the candle was burning, and the period after the candle was extinguished, into 8 equal segments. The average concentration during each time segment was approximated by calculating, then averaging the beginning and ending concentration for each time segment. Each segmental concentration was multiplied by a time weighting factor equal to the fraction of the total time the exposed individual spent indoors represented by that segment. The 16 time-weighted segmental concentrations were then summed to obtain the approximate time-weighted-average concentration for the period of time the exposed individual spent indoors. The 24-hour time-weighted-average concentration was then calculated by multiplying the time-weighted-average "indoor" concentration by the fraction of the day the exposed individual spent indoors. The benzene emission rate used was from the work of Krause (1999) that measured the benzene emission rates from 80 scented candles. Applying U.S. EPA’s inhalation potency value for benzene, the 95th percentile for cancer risk due to benzene exposure was between 3.2 x 10⁻⁷ and 1.2 x 10⁻⁶, indicating the risk estimates associated with candle emissions is indistinguishable from other indoor air constituent risks. These results support the conclusion that the public health risks posed by benzene in candle emissions do not exceed a threshold of 1 excess cancer in 100,000 individuals. As part of their study on the levels of organic compounds in candle emissions, Lau et al. (1997) used their measured emission factors for the PCDD/PCDFs to conduct an exposure assessment for candle emissions. The authors used the following calculation to estimate the exposure dose:
Dose = Ef x M x B x T x R x 1 V BW Where: Ef Emission Factor (ng/g wax) M Mass of wax being burned (g wax) V Volume of the room (m3) B Breathing volume (for adults, 0.6 m3/h) T Exposure time (h) R Absorption fraction from lung (100%) BW Body weight (70 kg) The authors concluded that for 1 candle (6 g wax) burned 1 hour in a room 40 m3 the dose of PCDD/PCDF is 0.00006 pg TEQ/ kg BW. If 30 candles (540 g wax) were burned for 3 hours, the dose increased to 0.016 pg TEQ/kg BW. TERA compared this dose estimate to the slope factor for PCDD/PCDF available in U.S. EPA (2000) draft dioxin assessment of 0.001 per pg TEQ/kg/-day, these doses are equivalent to a cancer risk of 6 x 10⁻⁸ and 1.6 x 10⁻⁵, respectively. Considering that U.S. EPA estimates that the upper bound cancer risk of PCDD/PCDF for the general population is 10-3, the risk posed by PCDD/PCDF in candle emissions is insignificant.

14
4.3.1 Conclusions Regarding Health Effects and Risk Assessment
No studies were located that evaluated the effects of inhaling candle emissions in either animals or humans. In addition, no information was located that evaluated the effects of candle emissions on sensitive populations. However, it is expected that populations that are sensitive to other air pollutants, such as children, the elderly, and individuals with compromised respiratory function, would also be sensitive to candle emissions. Although two studies (Stephen et al., 2000; Lau et al., 1997) were located that conducted a risk assessment on a single component of candle emissions, no studies were located that conducted a thorough assessment of the combined health effects of all components of candle emissions. Both the Stephen et al. (2000) and Lau et al. (1997) assessments appear to be well conducted and credible. However, the Stephen et al. (2000) study is only reported as a lengthy abstract, so it is not possible to completely evaluate each of the exposure assumptions that were used to conduct the assessment. In addition, the Stephen et al. assessment relies on emissions data generated by Krause that were not available for review. Nonetheless, it appears reasonable to conclude that benzene and PCDD/PCDFs in emissions from multiple candles burned in a room for several hours do not affect human health based on the available results. Table 3 compares the highest reported air concentration of organic compounds in candle emissions with risk values associated with no adverse effects. These air concentrations are based on a worst-case assumption of multiple candles (30 candles) burned in a room (40-50 m3) for several hours (3-4 hrs) calculated by Lau et al. (1997) or Schwind and Hosseinpour (1994), whichever is higher. One of the compounds, acrolein, reached air concentration that exceed noncancer risk value. In addition, two compounds, PCDD/PCDFs and formaldehyde, reached an air concentration that result in an increased cancer risk of 1 in 10,000. However, all these comparison are based on the worst-case scenarios, that is someone would have to be exposed to these air concentrations generated under extreme condition (30 candles burning in a small room) continuously for an entire lifetime in order for potential adverse health effects to occur. Thus, an appropriate next step might be to selectively investigate the more likely exposure to these chemicals under realistic conditions. Fortunately, such information is available as we presented below.

15
Table 3. Comparison of Chemical Air Concentrations (Worst Case) with Risk Values
Chemical Highest Reported
Concentration (mg/m3)
OSHA PEL
(mg/m3)
ATSDR Chronic
MRL (mg/m3)
EPA RfC
(mg/m3)
EPA Unit Risk (per
mg/m3)
Cancer Risk
PCDD/PCDF 6.4 x10⁻¹⁰ TEQ a
NA NA NA 2.9 x 10⁵ 1
2 in 10,000
Benzo(a)pyrene 2 x 10⁻⁶ a 0.2 NA NA (1.6 mg/m3)2
--
Formaldehyde 1.7 x 10⁻² b NA 1.2 NA 1.3 x 10-
2 2 in 10,000
Acetaldehyde 8.3 x 10⁻⁴ a 360 NA 9 x10⁻³ 2.2 x 10-
3 2 in 1,000,000
Acrolein 7.3 x 10⁻⁵ a 0.25 NA 2 x10⁻⁵ NA NA NA – Not available a Lau et al., 1997 b Schwind and Hosseinpour (1994) 1 This unit risk is calculated based on U.S. EPA’s draft inhalation unit risk of 0.001 per pg TEQ/kg-day for TCDD assuming default adult body weight of 70 kg and inhalation volume of 20 m3/day. 2 Health Canada’s Tumorigenic Concentration05. PEL=Permissible Exposure Limits; MRL=Minimal Risk Levels; RfC=Reference Concentration. Since the extreme concentrations summarized in Table 3 are not likely to be achieved by typical candle use, we conducted a preliminary calculation of exposure concentrations based on a set of survey data on candle use from PKS Research Partner (2002). The survey was conducted to determine the purchasing and candle use patterns for people that have bought candles within the past year. The data include frequency of burning candles in each home, number of candles usually burned at one time, and length of time candles were burned at one time. Information about the distribution of these candle-use data was incorporated into the calculations using Monte Carlo technique. In a Monte Carlo simulation, we performed calculations to estimate the highest possible exposure concentration and a typical daily exposure concentration. The Monte Carlo simulation provided a distribution of the estimated concentrations based on the input distribution of the candle use; therefore, it provides a description of the possible exposure in real life. The actual calculation equations used in Monte Carlo analysis are listed below, which are based on the equation used by Lau et al. (1997). For the highest exposure concentration CH (ng/m3):
CH = Ef x N x Q x D
Where: Ef Emission Factor (ng/g wax) N number of candles usually burned at one time

16
Q 6 g per candle-hour of burning (Lauet al., 1997) D length of time candles were burned (hours) For daily exposure concentration CD (ng/m3):
CD = CH x D/24 x F/7 Where: CH highest exposure concentration (ng/m3) D length of time candles were burned (hrs/time)
F frequency burning candles in each home (times/week) Table 4 summarizes the estimated exposure concentration for various chemicals based on real candle-use data. In these estimations, a conservative (the highest) emission factor for each chemical was obtained from Lau et al. (1997). Similarly, the conservative room size (small room) of 40 m3 was used. The results of our Monte Carlo analysis suggest that in real life, even the exposure concentrations at the higher end (e.g., 95 percentile) in human population are lower than the reported worst-case estimates listed in Table 3, and the average daily exposures are about an order of magnitude lower than their corresponding highest estimated concentration. Thus, typical candle use is not likely to cause an adverse affect on human health. Nonetheless, this preliminary comparison relied on several assumptions, such as room size. In addition, only normal candle burning was considered while conditions that result in smoldering and sooting were not considered. Therefore, a more adequately characterized exposure assessment is needed, especially during the complete burning condition, in order to better quantitatively estimate the exposure concentration.
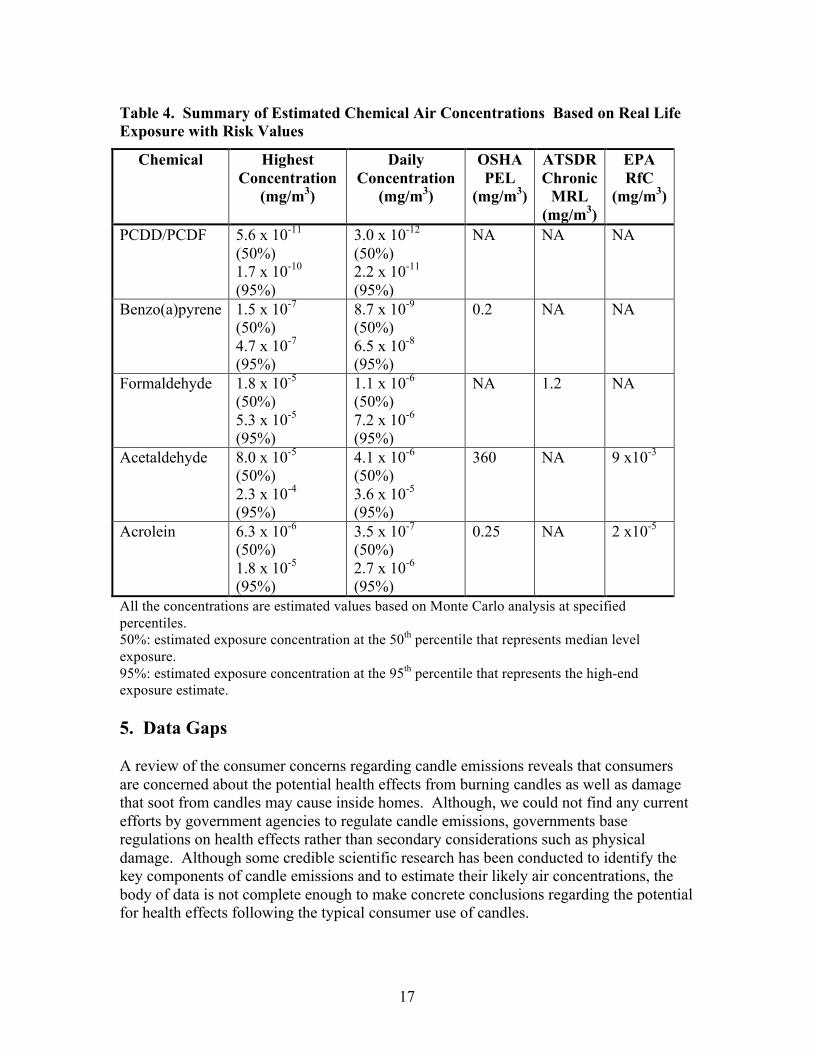
17
Table 4. Summary of Estimated Chemical Air Concentrations Based on Real Life Exposure with Risk Values
Chemical Highest Concentration
(mg/m3)
Daily Concentration
(mg/m3)
OSHA PEL
(mg/m3)
ATSDR Chronic
MRL (mg/m3)
EPA RfC
(mg/m3)
PCDD/PCDF 5.6 x 10⁻¹¹ (50%) 1.7 x 10⁻¹⁰
(95%)
3.0 x 10⁻¹² (50%) 2.2 x 10⁻¹¹ (95%)
NA NA NA
Benzo(a)pyrene 1.5 x 10⁻⁷ (50%) 4.7 x 10⁻⁷ (95%)
8.7 x 10⁻⁹ (50%) 6.5 x 10⁻⁸ (95%)
0.2 NA NA
Formaldehyde 1.8 x 10⁻⁵ (50%) 5.3 x 10⁻⁵ (95%)
1.1 x 10⁻⁶ (50%) 7.2 x 10⁻⁶ (95%)
NA 1.2 NA
Acetaldehyde 8.0 x 10⁻⁵ (50%) 2.3 x 10⁻⁴ (95%)
4.1 x 10⁻⁶ (50%) 3.6 x 10⁻⁵ (95%)
360 NA 9 x10⁻³
Acrolein 6.3 x 10⁻⁶ (50%) 1.8 x 10⁻⁵ (95%)
3.5 x 10⁻⁷ (50%) 2.7 x 10⁻⁶ (95%)
0.25 NA 2 x10⁻⁵
All the concentrations are estimated values based on Monte Carlo analysis at specified percentiles. 50%: estimated exposure concentration at the 50th percentile that represents median level exposure. 95%: estimated exposure concentration at the 95th percentile that represents the high-end exposure estimate. 5. Data Gaps A review of the consumer concerns regarding candle emissions reveals that consumers are concerned about the potential health effects from burning candles as well as damage that soot from candles may cause inside homes. Although, we could not find any current efforts by government agencies to regulate candle emissions, governments base regulations on health effects rather than secondary considerations such as physical damage. Although some credible scientific research has been conducted to identify the key components of candle emissions and to estimate their likely air concentrations, the body of data is not complete enough to make concrete conclusions regarding the potential for health effects following the typical consumer use of candles.

18
Candle emissions are complex mixtures composed of fine particulate matter (PM2.5), organic products of combustion (PCDD/PCDFs and PAH), and volatile organic compounds. Approaches to mixtures risk assessment indicate that the most appropriate method for conducting a mixtures assessment is to evaluate the complex mixture as a whole. Currently there are no inhalation toxicity studies that assess the health effects associated with exposure to candle emissions. Ideally, a chronic rodent inhalation toxicity study of candle emission would provide the most useful data for evaluating the health effects. Alternatively, an acceptable approach is to conduct a mixture risk assessment based on toxicity data of the individual components of the mixture and assume that the effective doses are additive (US EPA 2000). In order to follow this approach, the following data are required: a complete characterization of the candle emission components, description of the consumer practices that result in an average and a worst-case exposure to candle emissions, and estimation of chemical air concentrations following conditions that represent the average and worst-case exposures. Although several studies (Guo et al., 2000; Fine et al., 1999; Lau et al., 1997) do provide credible data on components of candle emissions, none of the available studies completely characterize the emissions for both particulates and organics. At this point, the database regarding candle emissions is poor. Although the available data do suggest that burning candles under normal use and conditions poses no health threat, much additional data would be needed to confirm this conclusion. These data would include accurate characterization of the chemical composition of candle emissions during typical use in home environment, better characterization of exposure scenarios, and a better characterization of the health effects of these complex mixtures. 6. References 6.1 Consumer Concerns Literature Adler, L. 2004. Black soot deposits from candles. Family Matters Newsletter. Ohio State University, OH. January. Dow, C. 1999. You can't judge a flame by its flicker. The Ottawa Citizen. (E1) February 23. Gadish, T. 2001. Indoor environmental notebook: Everything you wanted to know about indoor air pollution and more. Ball State University Department of Natural Resources and Environmental Management. Harris, M. 2000. USA: Burn wisely with candles. The Sun. February 19-21. LaPrade, J.C. 1999. The use of candles is associated with the black soot deposition phenomenon. Environmental Education Series Timely Information Newsletter. Auburn University, AL. June 11.
19
Rasmussen, D. 1998. Scented Candles Investigated as cause of Indoor Soot, Staining. Indoor Environ Rev 8(3): 1. Revkin, A. 2001. Tiny bits of soot tied to illness. New York Times. April 21. Salt Lake City Channel 5 Eye Witness News. 1999. EPA report: Candles & incense. http://web.ksl.com/dump/news/cc/series/candepa.htm Sobel, H.L., Wolfe, S.M., Lurie, P. 2000. Petition to the consumer product safety commission to ban and recall candles with lead-containing wicks. Public Citizen's Health Research Group. Tejada, C. 1999. Slimy black residue lights up flame in ms. Flanders; Could it be candles? The Wallstreet Journal. March 31. University of Berkley Wellness. 1999. The great indoors. Newsletter. February. Vigil, F. 1998. Black stains in houses: Soot, dust, or ghosts? Advanced Energy Corp. http://www.homeenergy.org/198ghost.html. Watson, T. 2001. Candles might be polluting your home, EPA says; Multiple wicks raise toxin level. USA TODAY. Thursday, June 14. 6.2 Government Initiative Literature OSHA (Occupational Health and Safety Administration). 1992. Chemical Sampling Information: Paraffin wax fumes. US Department of Labor. http://www.osha.gov/dts/chemicalsampling/data/CH_259400.html US EPA (US Environmental Protection Agency). 2001. Candles and incense as potential sources of indoor air pollution: Market analysis and literature review. Office of Research and Development, National Risk Management Research Laboratory, Research Triangle Park. 6.3 Scientific Literature Bonnekoh, B. and Merk, H.F. 1991. Airborne allergic contact dermatitis from benzoyl peroxide as a bleaching agent of candle wax. Contact Dermatitis 24: 367-368. Fine, P., Cass, G. and Simoneit, B. 1999. Characterization of fine particle emissions from burning church candles. Environ Sci Technol 33: 2352-2362. Guo, Z., Mosley, R., McBrian, J.A. and Fortmann, R. 2000. Fine particulate matter emissions from candles. Paper presented at Engineering Solutions to Indoor Air Quality Problems. Raleigh, NC, July 17-19.

20
Krause, J., Poor, N. and Harbison, R. 1999. Characterization of aromatic candle emissions and its similarity to diesel engine exhaust. Toxicologist 48: 395. Lau, C., Fiedler, H., Hutzinger, O., Schwind, K.H. and Hosseinpour, J. 1997. Levels of selected organic compounds in materials for candle production and human exposure to candle emissions. Chemosphere 34: 1623-1630. Malisch, R. 1994. Determination of dioxins and furans in coloured candle wax. Chemosphere 29: 1957-1963. OKOMETRIC GmbH. 1997. Investigation of oxidation gasses from paraffin aromatic candles in toxicological relevance to classes of damaging materials. Concluding Report. OKOMETRIC GmbH. 1998. Product Declaration: Gel-Wax-Candles. Bayreuth Institute of Environmental Research, Hamburg, Germany. PKS Research Partners. 2002. Candle usage tabulations. Prepared for Robin Leedy & Assoc. Schwind, K.H. and Hosseinpour, J. 1994. Analysis of raw-materials and candle combustion products. Oekometric GambH for the Association of German Candle Manufacturers, Inc., Bayreuth, Germany. Stephen, F.D., Stineman, C., Jonmaire, P. and Harbison, R. 2001. Risk analysis of candle emissions: I. Soot and benzene. Res Commun Pharm Toxicol 6: 3-18. US EPA (US Environmental Protection Agency). 2000. Supplementary Guidance for Conducting Health Risk Assessment of Chemical Mixtures. http://cfpub.epa.gov/ncea/raf/recordisplay.cfm?deid=20533 US EPA (US Environmental Protection Agency). 2001. Candles and incense as potential sources of indoor air pollution: Market analysis and literature review. Office of Research and Development, National Risk Management Research Laboratory, Research Triangle Park. Wallace, L. 2000. Real-time monitoring of particles, PAH, and CO in an occupied townhouse. Appl Occup Environ Hyg 15: 39-47. Wenzel-Hartung, R. 1994. The high-quality candle. SOFW-Journal: 1-5.
Related Documents