Printed by Jouve, 75001 PARIS (FR) (19) EP 2 604 704 A1 TEPZZ 6Z47Z4A_T (11) EP 2 604 704 A1 (12) EUROPEAN PATENT APPLICATION (43) Date of publication: 19.06.2013 Bulletin 2013/25 (21) Application number: 13151745.0 (22) Date of filing: 02.02.2009 (51) Int Cl.: C12Q 1/68 (2006.01) (84) Designated Contracting States: AT BE BG CH CY CZ DE DK EE ES FI FR GB GR HR HU IE IS IT LI LT LU LV MC MK MT NL NO PL PT RO SE SI SK TR (30) Priority: 01.02.2008 US 25536 P 26.09.2008 US 100293 P (62) Document number(s) of the earlier application(s) in accordance with Art. 76 EPC: 09708907.2 / 2 245 199 (71) Applicant: The General Hospital Corporation Boston, MA 02114 (US) (72) Inventors: • Skog, Johan Karl Olov Cambridge, MA 02141 (US) • Breakefield, Xandra Newton, MA 02459 (US) • Brown, Dennis Natwick, MA 01760 (US) • Miranda, Kevin St. Louis, MO 63108 (US) • Russo, Leileata Melrose, MA 02176 (US) (74) Representative: Crease, Devanand John et al Keltie LLP Fleet Place House 2 Fleet Place London EC4M 7ET (GB) Remarks: This application was filed on 17-01-2013 as a divisional application to the application mentioned under INID code 62. (54) Use of microvesicles in diagnosis and prognosis of medical diseases and conditions (57) The presently disclosed subject matter is direct- ed to methods of aiding diagnosis, prognosis, monitoring and evaluation of a disease or other medical condition in a subject by detecting a biomarker in microvesicles iso- lated from a biological, sample from the subject. Moreo- ver, disclosed subject matter is directed to methods of diagnosis, monitoring a disease by determining the con- centration of microvesicles within a biological sample; methods of delivering a nucleic acid or protein to a target all by administering microvesicles that contain said nu- cleic acid or protein; methods for performing a body fluid transfusion by introducing a microvesicle-free or micro- vesicle enriched fluid fraction into a patient.

Welcome message from author
This document is posted to help you gain knowledge. Please leave a comment to let me know what you think about it! Share it to your friends and learn new things together.
Transcript
Printed by Jouve, 75001 PARIS (FR)
(19)E
P2
604
704
A1
TEPZZ 6Z47Z4A_T(11) EP 2 604 704 A1
(12) EUROPEAN PATENT APPLICATION
(43) Date of publication: 19.06.2013 Bulletin 2013/25
(21) Application number: 13151745.0
(22) Date of filing: 02.02.2009
(51) Int Cl.:C12Q 1/68 (2006.01)
(84) Designated Contracting States: AT BE BG CH CY CZ DE DK EE ES FI FR GB GR HR HU IE IS IT LI LT LU LV MC MK MT NL NO PL PT RO SE SI SK TR
(30) Priority: 01.02.2008 US 25536 P26.09.2008 US 100293 P
(62) Document number(s) of the earlier application(s) in accordance with Art. 76 EPC: 09708907.2 / 2 245 199
(71) Applicant: The General Hospital CorporationBoston, MA 02114 (US)
(72) Inventors: • Skog, Johan Karl Olov
Cambridge, MA 02141 (US)
• Breakefield, XandraNewton, MA 02459 (US)
• Brown, DennisNatwick, MA 01760 (US)
• Miranda, KevinSt. Louis, MO 63108 (US)
• Russo, LeileataMelrose, MA 02176 (US)
(74) Representative: Crease, Devanand John et alKeltie LLP Fleet Place House 2 Fleet PlaceLondon EC4M 7ET (GB)
Remarks: This application was filed on 17-01-2013 as a divisional application to the application mentioned under INID code 62.
(54) Use of microvesicles in diagnosis and prognosis of medical diseases and conditions
(57) The presently disclosed subject matter is direct-ed to methods of aiding diagnosis, prognosis, monitoringand evaluation of a disease or other medical condition ina subject by detecting a biomarker in microvesicles iso-lated from a biological, sample from the subject. Moreo-ver, disclosed subject matter is directed to methods ofdiagnosis, monitoring a disease by determining the con-centration of microvesicles within a biological sample;methods of delivering a nucleic acid or protein to a targetall by administering microvesicles that contain said nu-cleic acid or protein; methods for performing a body fluidtransfusion by introducing a microvesicle-free or micro-vesicle enriched fluid fraction into a patient.
EP 2 604 704 A1
2
5
10
15
20
25
30
35
40
45
50
55
Description
CROSS REFERENCE TO RELATED APPLICATIONS
[0001] This application claims priority to US provisional applications 61/025,536, filed February 1, 2008 and 61/100,293,filed September 26, 2008, each of which is incorporated herein by reference in its entirety.
GOVERNMENTAL SUPPORT
[0002] This invention was made with Government support under grants NCI CA86355 and NCI CA69246 awarded bythe National Cancer Institute. The Government has certain rights in the invention.
FIELD OF THE INVENTION
[0003] The present invention relates to the fields of medical diagnosis, patient monitoring, treatment efficacy evaluation,nucleic acid and protein delivery, and blood transfusion.
BACKGROUND OF THE INVENTION
[0004] Glioblastomas are highly malignant brain tumors with a poor prognosis despite intensive research and clinicalefforts (Louis et al., 2007). The invasive nature of this tumor makes complete surgical resection impossible and themedian survival time is only about 15 months (Stupp et al., 2005). Glioblastoma cells as well as many other tumor cellshave a remarkable ability to mold their stromal environment to their own advantage. Tumor cells directly alter surroundingnormal cells to facilitate tumor cell growth, invasion, chemoresistance, immune-evasion and metastasis (Mazzocca etal., 2005; Muerkoster et al., 2004; Singer et al., 2007). The tumor cells also hijack the normal vasculature and stimulaterapid formation of new blood vessels to supply the tumor with nutrition (Carmeliet and Jain, 2000). Although the immunesystem can initially suppress tumor growth, it is often progressively blunted by tumor activation of immunosuppressivepathways (Gabrilovich, 2007).[0005] Small microvesicles shed by cells are known as exosomes (Thery et al., 2002). Exosomes are reported ashaving a diameter of approximately 30-100 nm and are shed from many different cell types under both normal andpathological conditions (Thery et al., 2002). These microvesicles were first described as a mechanism to discard trans-ferrin-receptors from the cell surface of maturing reticulocytes (Pan and Johnstone, 1983). Exosomes are formed throughinward budding of endosomal membranes giving rise to intracellular multivesicular bodies (MVB) that later fuse with theplasma membrane, releasing the exosomes to the exterior (Thery et al., 2002). However, there is now evidence for amore direct release of exosomes. Certain cells, such as Jurkat T-cells, are said to shed exosomes directly by outwardbudding of the plasma membrane (Booth et al., 2006). All membrane vesicles shed by cells are referred to hereincollectively as microvesicles.[0006] Microvesicles in Drosophila melanogaster, so called argosomes, are said to contain morphogens such asWingless protein and to move over large distances through the imaginal disc epithelium in developing Drosophila mel-anogaster embryos (Greco et al., 2001). Microvesicles found in semen, known as prostasomes, are stated to have awide range of functions including the promotion of sperm motility, the stabilization of the acrosome reaction, the facilitationof immunosuppression and the inhibition of angiogenesis (Delves et al., 2007). On the other hand, prostasomes releasedby malignant prostate cells are said to promote angiogenesis. Microvesicles are said to transfer proteins (Mack et al.,2000) and recent studies state that microvesicles isolated from different cell lines can also contain messenger RNA(mRNA) and microRNA (miRNA) and can transfer mRNA to other cell types (Baj-Krzyworzeka et al., 2006; Valadi et al.,2007).[0007] Microvesicles derived from B-cells and dendritic cells are stated to have potent immuno-stimulatory and anti-tumor effects in vivo and have been used as antitumor vaccines (Chaput et al., 2005). Dendritic cell-derived microvesiclesare stated to contain the co-stimulatory proteins necessary for T-cell activation, whereas most tumor cell-derived micro-vesicles do not (Wieckowski and Whiteside, 2006). Microvesicles isolated from tumor cells may act to suppress theimmune response and accelerate tumor growth (Clayton et al., 2007; Liu et al., 2006a). Breast cancer microvesiclesmay stimulate angiogenesis, and platelet-derived microvesicles may promote tumor progression and metastasis of lungcancer cells (Janowska-Wieczorek et al., 2005; Millimaggi et al., 2007).[0008] Cancers arise through accumulation of genetic alterations that promote unrestricted cell growth. It has beenstated that each tumor harbors, on average, around 50-80 mutations that are absent in non-tumor cells (Jones et al.,2008; Parsons et al., 2008; Wood et al., 2007). Current techniques to detect these mutation profiles include the analysisof biopsy samples and the non-invasive analysis of mutant tumor DNA fragments circulating in bodily fluids such asblood (Diehl et al., 2008). The former method is invasive, complicated and possibly harmful to subjects. The latter method
EP 2 604 704 A1
3
5
10
15
20
25
30
35
40
45
50
55
inherently lacks sensitivity due to the extremely low copy number of mutant cancer DNA in bodily fluid (Gormally et al.,2007). Therefore, one challenge facing cancer diagnosis is to develop a diagnostic method that can detect tumor cellsat different stages non-invasively, yet with high sensitivity and specificity. It has also been stated that gene expressionprofiles (encoding mRNA or microRNA) can distinguish cancerous and non-cancerous tissue (Jones et al., 2008; Parsonset al., 2008; Schetter et al., 2008). However, current diagnostic techniques to detect gene expression profiles requireintrusive biopsy of tissues. Some biopsy procedures cause high risk and are potentially harmful. Moreover, in a biopsyprocedure, tissue samples are taken from a limited area and may give false positives or false negatives, especially intumors which are heterogeneous and/or dispersed within normal tissue. Therefore, a non-intrusive and sensitive diag-nostic method for detecting biomarkers would be highly desirable.
SUMMARY OF THE INVENTION
[0009] In general, the invention is a novel method for detecting in a subject the presence or absence of a variety ofbiomarkers contained in microvesicles, thereby aiding the diagnosis, monitoring and evaluation of diseases, other medicalconditions, and treatment efficacy associated with microvesicle biomarkers.[0010] One aspect of the invention are methods for aiding in the diagnosis or monitoring of a disease or other medicalcondition in a subject, comprising the steps of: a) isolating a microvesicle fraction from a biological sample from thesubject; and b) detecting the presence or absence of a biomarker within the microvesicle fraction, wherein the biomarkeris associated with the disease or other medical condition. The methods may further comprise the step or steps ofcomparing the result of the detection step to a control (e.g., comparing the amount of one or more biomarkers detectedin the sample to one or more control levels), wherein the subject is diagnosed as having the disease or other medicalcondition (e.g., cancer) if there is a measurable difference in the result of the detection step as compared to a control.[0011] Another aspect of the invention is a method for aiding in the evaluation of treatment efficacy in a subject,comprising the steps of: a) isolating a microvesicle fraction from a biological sample from the subject; and b) detectingthe presence or absence of a biomarker within the microvesicle fraction, wherein the biomarker is associated with thetreatment efficacy for a disease or other medical condition. The method may further comprise the step of providing aseries of a biological samples over a period of time from the subject. Additionally, the method may further comprise thestep or steps of determining any measurable change in the results of the detection step (e.g., the amount of one or moredetected biomarkers) in each of the biological samples from the series to thereby evaluate treatment efficacy for thedisease or other medical condition.[0012] In certain preferred embodiments of the foregoing aspects of the invention, the biological sample from thesubject is a sample of bodily fluid. Particularly preferred body fluids are blood and urine.[0013] In certain preferred embodiments of the foregoing aspects of the invention, the methods further comprise theisolation of a selective microvesicle fraction derived from cells of a specific type (e.g., cancer or tumor cells). Additionally,the selective microvesicle fraction may consist essentially of urinary microvesicles.[0014] In certain embodiments of the foregoing aspects of the invention, the biomarker associated with a disease orother medical condition is i) a species of nucleic acid; ii) a level of expression of one or more nucleic acids; iii) a nucleicacid variant; or iv) a combination of any of the foregoing. Preferred embodiments of such biomarkers include messengerRNA, microRNA, DNA, single stranded DNA, complementary DNA and noncoding DNA.[0015] In certain embodiments of the foregoing aspects of the invention, the disease or other medical condition is aneoplastic disease or condition (e.g., glioblastoma, pancreatic cancer, breast cancer, melanoma and colorectal cancer),a metabolic disease or condition (e.g., diabetes, inflammation, perinatal conditions or a disease or condition associatedwith iron metabolism), a post transplantation condition, or a fetal condition.[0016] Another aspect of the invention is a method for aiding in the diagnosis or monitoring of a disease or othermedical condition in a subject, comprising the steps of a) obtaining a biological sample from the subject; and b) determiningthe concentration of microvesicles within the biological sample.[0017] Yet another aspect of this invention is a method for delivering a nucleic acid or protein to a target cell in anindividual comprising the steps of administering microvesicles which contain the nucleic acid or protein, or one or morecells that produce such microvesicles, to the individual such that the microvesicles enter the target cell of the individual.In a preferred embodiment of this aspect of the invention, microvesicles are delivered to brain cells.[0018] A further aspect of this invention is a method for performing bodily fluid transfusion (e.g., blood, serum orplasma), comprising the steps of obtaining a fraction of donor body fluid free of all or substantially all microvesicles, orfree of all or substantially all microvesicles from a particular cell type (e.g., tumor cells), and introducing the microvesi-cle-free fraction to a patient. A related aspect of this invention is a composition of matter comprising a sample of bodyfluid (e.g., blood, serum or plasma) free of all or substantially all microvesicles, or free of all or substantially all microvesiclesfrom a particular cell type.[0019] Another aspect of this invention is a method for performing bodily fluid transfusion (e.g., blood, serum or plasma),comprising the steps of obtaining a microvesicle-enriched fraction of donor body fluid and introducing the microvesicle-
EP 2 604 704 A1
4
5
10
15
20
25
30
35
40
45
50
55
enriched fraction to a patient. In a preferred embodiment, the fraction is enriched with microvesicles derived from aparticular cell type. A related aspect of this invention is a composition of matter comprising a sample of bodily fluid (e.g.,blood, serum or plasma) enriched with microvesicles.[0020] A further aspect of this invention is a method for aiding in the identification of new biomarkers associated witha disease or other medical condition, comprising the steps of obtaining a biological sample from a subject; isolating amicrovesicle fraction from the sample; and detecting within the microvesicle fraction species of nucleic acid; their re-spective expression levels or concentrations; nucleic acid variants; or combinations thereof.[0021] Various aspects and embodiments of the invention will now be described in detail. It will be appreciated thatmodification of the details may be made without departing from the scope of the inventionclaims. Further, unless otherwiserequired by context, singular terms shall include pluralities and plural terms shall include the singular.[0022] All patents, patent applications, and publications identified are expressly incorporated herein by reference forthe purpose of describing and disclosing, for example, the methodologies described in such publications that might beused in connection with the present invention. These publications are provided solely for their disclosure prior to thefiling date of the present application. Nothing in this regard should be construed as an admission that the inventors arenot entitled to antedate such disclosure by virtue of prior invention or for any other reason. All statements as to the dateor representations as to the contents of these documents are based on the information available to the applicants anddo not constitute any admission as to the correctness of the dates or contents of these documents.
BRIEF DESCRIPTION OF THE DRAWINGS
[0023]
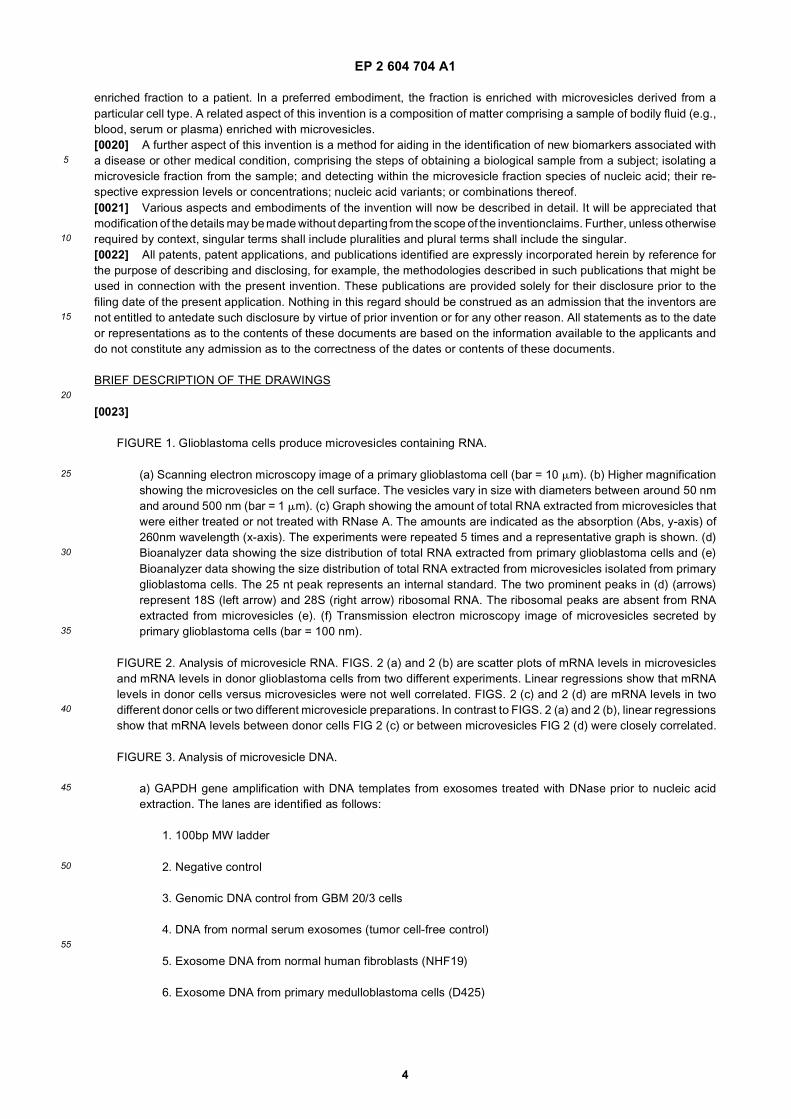
FIGURE 1. Glioblastoma cells produce microvesicles containing RNA.
(a) Scanning electron microscopy image of a primary glioblastoma cell (bar = 10 mm). (b) Higher magnificationshowing the microvesicles on the cell surface. The vesicles vary in size with diameters between around 50 nmand around 500 nm (bar = 1 mm). (c) Graph showing the amount of total RNA extracted from microvesicles thatwere either treated or not treated with RNase A. The amounts are indicated as the absorption (Abs, y-axis) of260nm wavelength (x-axis). The experiments were repeated 5 times and a representative graph is shown. (d)Bioanalyzer data showing the size distribution of total RNA extracted from primary glioblastoma cells and (e)Bioanalyzer data showing the size distribution of total RNA extracted from microvesicles isolated from primaryglioblastoma cells. The 25 nt peak represents an internal standard. The two prominent peaks in (d) (arrows)represent 18S (left arrow) and 28S (right arrow) ribosomal RNA. The ribosomal peaks are absent from RNAextracted from microvesicles (e). (f) Transmission electron microscopy image of microvesicles secreted byprimary glioblastoma cells (bar = 100 nm).
FIGURE 2. Analysis of microvesicle RNA. FIGS. 2 (a) and 2 (b) are scatter plots of mRNA levels in microvesiclesand mRNA levels in donor glioblastoma cells from two different experiments. Linear regressions show that mRNAlevels in donor cells versus microvesicles were not well correlated. FIGS. 2 (c) and 2 (d) are mRNA levels in twodifferent donor cells or two different microvesicle preparations. In contrast to FIGS. 2 (a) and 2 (b), linear regressionsshow that mRNA levels between donor cells FIG 2 (c) or between microvesicles FIG 2 (d) were closely correlated.
FIGURE 3. Analysis of microvesicle DNA.
a) GAPDH gene amplification with DNA templates from exosomes treated with DNase prior to nucleic acidextraction. The lanes are identified as follows:
1. 100bp MW ladder
2. Negative control
3. Genomic DNA control from GBM 20/3 cells
4. DNA from normal serum exosomes (tumor cell-free control)
5. Exosome DNA from normal human fibroblasts (NHF19)
6. Exosome DNA from primary medulloblastoma cells (D425)
EP 2 604 704 A1
5
5
10
15
20
25
30
35
40
45
50
55
b) GAPDH gene amplification with DNA templates from exosomes without prior DNase treatment. The lanesare identified as follows:
1. 100bp MW ladder
2. DNA from primary melanoma cell 0105
3. Exosome DNA from melanoma 0105
4. Negative Control
5. cDNA from primary GBM 20/3 (positive control)
c) Human Endogenous Retrovirus K gene amplification. The lanes are identified as follows:
1. 100 bp MW ladder
2. Exosome DNA from medulloblastoma D425 a
3. Exosome DNA from medulloblasotma D425 b
4. Exosome DNA from normal human fibroblasts (NHF19)
5. Exosome DNA from normal human serum
6. Genomic DNA from GBM 20/3.
7. Negative Control
d) Tenascin C gene amplification. The lanes are listed identified follows:
1. 100bp MW ladder
2. Exosomes from normal human fibroblasts (NHF19)
3. Exosomes from serum (tumor cell free individual A)
4. Exosomes from serum (tumor cell free individual B)
5. Exosomes from primary medulloblastoma cell D425
e) Transposable Line 1 element amplification. The lanes are identified as follows:
1. 100bp MW ladder.
2. Exosome DNA from normal human serum.
3. Exosome DNA from normal human fibroblasts
4. Exosome DNA from medulloblastoma D425 a
5. Exosome DNA from medulloblastoma D425 b
f) DNA is present in exosomes from D425 medulloblastoma cell. The lanes are identified as follows:
1. 100bp marker
2. D425 no DNase
EP 2 604 704 A1
6
5
10
15
20
25
30
35
40
45
50
55
3. D425 with DNase
4. 1kb marker
g) Single stranded nucleic acid analysis using a RNA pico chip. Upper panel: purified DNA was not treated withDNase; lower panel: purified DNA was treated with DNase. The arrow in the upper panel refers to the detectednucleic acids. The peak at 25 nt is an internal standard.
h) Analysis of nucleic acids contained in exosomes from primary medulloblastoma D425. Upper panel: singlestranded nucleic acids detected by a RNA pico chip. Lower panel: double stranded nucleic acids detected bya DNA 1000 chip. The arrow in the upper panel refers to the detected nucleic acids. The two peaks (15 and1500 bp) are internal standards.
i) Analysis of exosome DNA from different origins using a RNA pico chip. Upper panel: DNA was extractedfrom exosomes from glioblastoma cells. Lower panel: DNA was extracted from exosomes from normalhuman fibroblasts.
FIGURE 4. Extracellular RNA extraction from serum is more efficient when a serum exosome isolation step isincluded. a) Exosome RNA from serum. b) Direct whole serum extraction. c) Empty well. Arrows refer to the detectedRNA in the samples.
FIGURE 5. Comparison of gene expression levels between microvesicles and cells of origin. 3426 genes were foundto be more than 5-fold differentially distributed in the microvesicles as compared to the cells from which they werederived (p-value <0.01).
FIGURE 6. Ontological analysis of microvesicular RNAs. (a) Pie chart displays the biological process ontology ofthe 500 most abundant mRNA species in the microvesicles. (b) Graph showing the intensity of microvesicle RNAsbelonging to ontologies related to tumor growth. The x-axis represents the number of mRNA transcripts present inthe ontology. The median intensity levels on the arrays were 182.
FIGURE 7. Clustering diagram ofmRNA levels. Microarray data on the mRNA expression profiles in cell lines andexosomes isolated from the culture media of these cell lines were analyzed and clusters of expression profiles weregenerated. The labels of the RNA species are as follows:
20/3C-1: Glioblastoma 20/3 Cell RNA, array replicate 1
20/3C-2: Glioblastoma 20/3 Cell RNA, array replicate 2
11/5C: Glioblastoma 11/5 Cell RNA
0105C: Melanoma 0105 Cell RNA
0664C: Melanoma 0664 Cell RNA
0664 E-1: Melanoma 0664 exosome RNA, array replicate 1
0664 E-2: Melanoma 0664 exosome RNA, array replicate 2
0105E: Melanoma 0105 Exosome RNA
20/3E: Glioblastoma 20/3 Exosome RNA
11/5E-1: Glioblastoma 11/5 Exosomes, array replicate 1
11/5E-2: Glioblastoma 11/5 Exosomes, array replicate 2
GBM: glioblastoma. The scale refers to the distance between clusters.
EP 2 604 704 A1
7
5
10
15
20
25
30
35
40
45
50
55
FIGURE 8. Microvesicles from serum contain microRNAs. Levels of mature miRNAs extracted from microvesiclesand from glioblastoma cells from two different patients (GBM1 and GBM2) were analysed using quantitative miRNART-PCR. The cycle threshold (Ct) value is presented as the mean 6 SEM (n = 4).
FIGURE 9. Clustering diagram of microRNA levels. Microarray data on the microRNA expression profiles in celllines and exosomes isolated from the culture media of these cell lines were analyzed and clusters of expressionprofiles were generated. The labels of the RNA species are as follows:
0664C-1: Melanoma 0664 Cell RNA, array replicate 1
0664C-2: Melanoma 0664 Cell RNA, array replicate 2
0105C-1: Melanoma 0105 Cell RNA, array replicate 1
0105C-2: Melanoma 0105 Cell RNA, array replicate 2
20/3C-1: Glioblastoma 20/3 Cell RNA, array replicate 1
20/3C-2: Glioblastoma 20/3 Cell RNA, array replicate 2
11/5C-1: Glioblastoma 11/5 Cell RNA, array replicate 1
11/5C-2: Glioblastoma 11/5 Cell RNA, array replicate 2
11/5E-1: Glioblastoma 11/5 Exosomes, array replicate 1
11/5E-2: Glioblastoma 11/5 Exosomes, array replicate 2
20/3E-1: Glioblastoma 20/3 Exosome RNA, array replicate 1
20/3E-2: Glioblastoma 20/3 Exosome RNA, array replicate 2
0664 E: Melanoma 0664 exosome RNA
0105E-1: Melanoma 0105 Exosome RNA, array replicate 1
0105E-2: Melanoma 0105 Exosome RNA, array replicate 2
GBM: Glioblastoma. The scale refers to the distance between clusters.
FIGURE 10. The expression level of microRNA-21 in serum microvesicles is associated with glioma. Shown is abar graph, normal control serum on the left, glioma serum on the right. Quantitative RT-PCR was used to measurethe levels of microRNA-21 (miR-21) in exosomes from serum of glioblastoma patients as well as normal patientcontrols. Glioblastoma serum showed a 5.4 reduction of the Ct-value, corresponding to an approximately 40(2ΔCt)-fold increase of miR21. The miR21 levels were normalized to GAPDH in each sample (n=3).
FIGURE 11. Nested RT-PCR was used to detect EGFRvIII mRNA in tumor samples and corresponding serumexosomes. The wild type EGFR PCR product appears as a band at 1153 bp and the EGFRvIII PCR product appearsas a band at 352 bp. RT PCR of GAPDH mRNA was included as a positive control (226 bp). Samples consideredas positive for EGFRvIII are indicated with an asterisk. Patients 11, 12 and 14 showed only a weak amplification ofEGFRvIII in the tumor sample, but it was evident when more samples were loaded.
FIGURE 12. Nested RT PCR of EGFRvIII was performed on microvesicles from 52 normal control serums. EGFRvIII(352 bp) was never found in the normal control serums. PCR of GAPDH (226 bp) was included as a control.
FIGURE 13. Hepcidin mRNA can be detected within exosomes from human serum. A) Pseudo-gel generated byan Agilent Bioanalyzer. B) Raw plot generated by an Agilent Bioanalyser for the positive control (Sample 1). C) Rawplot generated by an Agilent Bioanalyser for the negative control (Sample 2). D) Raw plot generated by an Agilent
EP 2 604 704 A1
8
5
10
15
20
25
30
35
40
45
50
55
Bioanalyser for the exosomes (Sample 3).
FIGURE 14. Urinary exosome isolation and nucleic acid identification within urinary exosomes. (a) Electron micro-scopy image of a multivesicular body (MVB) containing many small "exosomes" in a kidney tubule cell. (b) Electronmicroscopy image of isolated urinary exosomes. (c) Analysis of RNA transcripts contained within urinary exosomesby an Agilent Bioanalyzer. A broad range of RNA species were identified but both 18S and 28S ribosomal RNAswere absent. (d) Identification of various RNA transcripts in urinary exosomes by PCR. The transcripts thus identifiedwere: Aquaporin 1 (AQP1); Aquaporin 2 (AQP2); Cubulin (CUBN); Megalin (LRP2); Arginine Vasopressin Receptor2 (AVPR2); Sodium/Hydrogen Exchanger 3 (SLC9A3); V-ATPase B1 subunit (ATP6V1B1); Nephrin (NPHS1); Po-docin (NPHS2); and Chloride Channel 3 (CLCN3). From top to bottom, the five bands in the molecular weight (MW)lane correspond to 1000, 850, 650, 500, 400, 300 base pair fragments. (e) Bioanalyzer diagrams of exosomal nucleicacids from urine samples. The numbers refer to the numbering of human individuals. (f) Pseudogels depicting PCRproducts generated with different primer pairs using the nucleic acid extracts described in (e). House refers to actingene and the actin primers were from Ambion (TX, USA). The +ve control refers to PCRs using human kidney cDNAfrom Ambion (TX, USA) as templates and the -ve control refers to PCRs without nucleic acid templates. (g) Pseudo-gel picture showing positive identification of actin gene cDNA via PCR with and without the DNase treatment ofexosomes prior to nucleic acid extraction. (h) Bioanalyzer diagrams showing the amount of nucleic acids isolatedfrom human urinary exosomes.
FIGURE 15. Analysis of prostate cancer biomarkers in urinary exosomes. (a) Gel pictures showing PCR productsof the TMPRSS2-ERG gene and digested fragments of the PCR products. P1 and P2 refer to urine samples frompatient 1 and patient 2, respectively. For each sample, the undigested product is in the left lane and the digestedproduct is in the right lane. MWM indicates lanes with MW markers. The sizes of the bands (both undigested anddigested) are indicated on the right of the panel. (b) Gel pictures showing PCR products of the PCA3 gene anddigested fragments of the PCR products. P1, P2, P3 and P4 refer to urine samples from patient 1, patient 2, patient3 and patient 4, respectively. For each sample, the undigested product is in the left lane and the digested productis in the right lane. MWM indicates lanes with MW markers. The sizes of the bands (both undigested and digested)are indicated on the right of the panel. (c) A summary of the information of the patients and the data presented in(a) and (b). TMERG refers to the TMPRSS2-ERG fusion gene.
FIGURE 16. BRAF mRNA is contained within microvesicles shed by melanoma cells. (a) An electrophoresis gelpicture showing RT-PCR products of BRAF gene amplification. (b) An electrophoresis gel picture showing RT-PCRproducts of GAPDH gene amplification. The lanes and their corresponding samples are as follows: Lane #1 - 100bp Molecular Weight marker; Lane #2 - YUMEL-01-06 exo; Lane # 3 - YUMEL-01-06 cell; Lane # 4 YUMEL-06-64exo; Lane # 5. YUMEL-06-64 cell; Lane # 6. M34 exo; Lane # 7 - M34 cell; Lane # 8 - Fibroblast cell; Lane # 9 -Negative control. The reference term "exo" means that the RNA was extracted from exosomes in the culture media.The reference term "cell" means that the RNA was extracted from the cultured cells. The numbers following YUMELrefers to the identification of a specific batch of YUMEL cell line. (c) Sequencing results of PCR products fromYUMEL-01-06 exo. The results from YUMEL-01-06 cell, YUMEL-06-64 exo and YUMEL-06-64 cell are the sameas those from YUMEL-01-06 exo. (d) Sequencing results of PCR products from M34 exo. The results from M34 cellare the same as those from M34 exo.
FIGURE 17. Glioblastoma microvesicles can deliver functional RNA to HBMVECs. (a) Purified microvesicles werelabelled with membrane dye PKH67 (green) and added to HBMVECs. The microvesicles were internalised intoendosome-like structures within an hour. (b) Microvesicles were isolated from glioblastoma cells stably expressingGluc. RNA extraction and RT-PCR of Gluc and GAPDH mRNAs showed that both were incorporated into micro-vesicles. (c) Microvesicles were then added to HBMVECs and incubated for 24 hours. The Gluc activity was measuredin the medium at 0, 15 and 24 hours after microvesicle addition and normalized to Gluc activity in microvesicles.The results are presented as the mean 6 SEM (n = 4).
FIGURE 18. Glioblastoma microvesicles stimulate angiogenesis in vitro and contain angiogenic proteins. (a) HBM-VECs were cultured on Matrigel™ in basal medium (EBM) alone, or supplemented with GBM microvesicles(EBM+MV) or angiogenic factors (EGM). Tubule formation was measured after 16 hours as average tubule length6 SEM compared to cells grown in EBM (n = 6). (b) Total protein from primary glioblastoma cells and microvesicles(MV) from these cells (1 mg each) were analysed on a human angiogenesis antibody array. (c) The arrays werescanned and the intensities analysed with the Image J software (n = 4).
FIGURE 19. Microvesicles isolated from primary glioblastoma cells promote proliferation of the U87 glioblastoma
EP 2 604 704 A1
9
5
10
15
20
25
30
35
40
45
50
55
cell line. 100,000 U87 cells were seeded in wells of a 24 well plate and allowed to grow for three days in (a) normalgrowth medium (DMEM-5% FBS) or (b) normal growth medium supplemented with 125 mg microvesicles. (c) Afterthree days, the non-supplemented cells had expanded to 480,000 cells, whereas the microvesicle-supplementedcells had expanded to 810,000 cells. NC refers to cells grown in normal control medium and MV refers to cells grownin medium supplemented with microvesicles. The result is presented as the mean 6 SEM (n=6).
DETAILED DESCRIPTION OF THE INVENTION
[0024] Microvesicles are shed by eukaryotic cells, or budded off of the plasma membrane, to the exterior of the cell.These membrane vesicles are heterogeneous in size with diameters ranging from about 10nm to about 5000 nm. Thesmall microvesicles (approximately 10 to 1000nm, and more often 30 to 200 nm in diameter) that are released byexocytosis of intracellular multivesicular bodies are referred to in the art as "exosomes". The methods and compositionsdescribed herein are equally applicable to microvesicles of all sizes; preferably 30 to 800 nm; and more preferably 30to 200 nm.[0025] In some of the literature, the term "exosome" also refers to protein complexes containing exoribonucleaseswhich are involved in mRNA degradation and the processing of small nucleolar RNAs (snoRNAs), small nuclear RNAs(snRNAs) and ribosomal RNAs (rRNA) (Liu et al., 2006b; van Dijk et al., 2007). Such protein complexes do not havemembranes and are not "microvesicles" or "exosomes" as those terms are used here in.
Exosomes As Diagnostic And/Or Prognostic Tools
[0026] Certain aspects of the present invention are based on the surprising finding that glioblastoma derived micro-vesicles can be isolated from the serum of glioblastoma patients. This is the first discovery of microvesicles derived fromcells in the brain, present in a bodily fluid of a subject. Prior to this discovery it was not known whether glioblastomacells produced microvesicles or whether such microvesicles could cross the blood brain barrier into the rest of the body.These microvesicles were found to contain mutant mRNA associated with tumor cells. The microvesicles also containedmicroRNAs (miRNAs) which were found to be abundant in glioblastomas. Glioblastoma-derived microvesicles were alsofound to potently promote angiogenic features in primary human brain microvascular endothelial cells (HBMVEC) inculture. This angiogenic effect was mediated at least in part through angiogenic proteins present in the microvesicles.The nucleic acids found within these microvesicles, as well as other contents of the microvesicles such as angiogenicproteins, can be used as valuable biomarkers for tumor diagnosis, characterization and prognosis by providing a geneticprofile. Contents within these microvesicles can also be used to monitor tumor progression over time by analyzing ifother mutations are acquired during tumor progression as well as if the levels of certain mutations are becoming increasedor decreased over time or over a course of treatment[0027] Certain aspects of the present invention are based on the finding that microvesicles are secreted by tumor cellsand circulating in bodily fluids. The number of microvesicles increases as the tumor grows. The concentration of themicrovesicles in bodily fluids is proportional to the corresponding tumor load. The bigger the tumor load, the higher theconcentration of microvesicles in bodily fluids.[0028] Certain aspects of the present invention are based on another surprising finding that most of the extracellularRNAs in bodily fluid of a subj ect are contained within microvesicles and thus protected from degradation by ribonucleases.As shown in Example 3, more than 90% of extracellular RNA in total serum can be recovered in microvesicles.[0029] One aspect of the present invention relates to methods for detecting, diagnosing, monitoring, treating or eval-uating a disease or other medical condition in a subject by determining the concentration of microvesicles in a biologicalsample. The determination may be performed using the biological sample without first isolating the microvesicles or byisolating the microvesicles first.[0030] Another aspect of the present invention relates to methods for detecting, diagnosing, monitoring, treating orevaluating a disease or other medical condition in a subject comprising the steps of, isolating exosomes from a bodilyfluid of a subject, and analyzing one or more nucleic acids contained within the exosomes. The nucleic acids are analyzedqualitatively and/or quantitatively, and the results are compared to results expected or obtained for one or more othersubjects who have or do not have the disease or other medical condition. The presence of a difference in microvesicularnucleic acid content of the subject, as compared to that of one or more other individuals, can indicate the presence orabsence of, the progression of (e.g., changes of tumor size and tumor malignancy), or the susceptibility to a disease orother medical condition in the subject.[0031] Indeed, the isolation methods and techniques described herein provide the following heretofore unrealizedadvantages: 1) the opportunity to selectively analyze disease-or tumor-specific nucleic acids, which may be realized byisolating disease- or tumor-specific microvesicles apart from other microvesicles within the fluid sample; 2) significantlyhigher yield of nucleic acid species with higher sequence integrity as compared to the yield/integrity obtained by extractingnucleic acids directly from the fluid sample; 3) scalability, e.g. to detect nucleic acids expressed at low levels, the sensitivity
EP 2 604 704 A1
10
5
10
15
20
25
30
35
40
45
50
55
can be increased by pelleting more microvesicles from a larger volume of serum; 4) purer nucleic acids in that proteinand lipids, debris from dead cells, and other potential contaminants and PCR inhibitors are excluded from the microvesiclepellets before the nucleic acid extraction step; and 5) more choices in nucleic acid extraction methods as microvesiclepellets are of much smaller volume than that of the starting serum, making it possible to extract nucleic acids from thesemicrovesicle pellets using small volume column filters.[0032] The microvesicles are preferably isolated from a sample taken of a bodily fluid from a subject. As used herein,a "bodily fluid" refers to a sample of fluid isolated from anywhere in the body of the subject, preferably a peripherallocation, including but not limited to, for example, blood, plasma, serum, urine, sputum, spinal fluid, pleural fluid, nippleaspirates, lymph fluid, fluid of the respiratory, intestinal, and genitourinary tracts, tear fluid, saliva, breast milk, fluid fromthe lymphatic system, semen, cerebrospinal fluid, intra-organ system fluid, ascitic fluid, tumor cyst fluid, amniotic fluidand combinations thereof.[0033] The term "subject" is intended to include all animals shown to or expected to have microvesicles. In particularembodiments, the subject is a mammal, a human or nonhuman primate, a dog, a cat, a horse, a cow, other farm animals,or a rodent (e.g. mice, rats, guinea pig. etc.). The term "subject" and "individual" are used interchangeably herein.[0034] Methods of isolating microvesicles from a biological sample are known in the art. For example, a method ofdifferential centrifugation is described in a paper by Raposo et al. (Raposo et al., 1996), and similar methods are detailedin the Examples section herein. Methods of anion exchange and/or gel permeation chromatography are described inUS Patent Nos. 6,899,863 and 6,812,023. Methods of sucrose density gradients or organelle electrophoresis are de-scribed in U.S. Patent No. 7,198,923. A method of magnetic activated cell sorting (MACS) is described in (Taylor andGercel-Taylor, 2008). A method of nanomembrane ultrafiltration concentrator is described in (Cheruvanky et al., 2007).Preferably, microvesicles can be identified and isolated from bodily fluid of a subject by a newly developed microchiptechnology that uses a unique microfluidic platform to efficiently and selectively separate tumor derived microvesicles.This technology, as described in a paper by Nagrath et al. (Nagrath et al., 2007), can be adapted to identify and separatemicrovesicles using similar principles of capture and separation as taught in the paper. Each of the foregoing referencesis incorporated by reference herein for its teaching of these methods.[0035] In one embodiment, the microvesicles isolated from a bodily fluid are enriched for those originating from aspecific cell type, for example, lung, pancreas, stomach, intestine, bladder, kidney, ovary, testis, skin, colorectal, breast,prostate, brain, esophagus, liver, placenta, fetus cells. Because the microvesicles often carry surface molecules suchas antigens from their donor cells, surface molecules may be used to identify, isolate and/or enrich for microvesiclesfrom a specific donor cell type (Al-Nedawi et al., 2008; Taylor and Gercel-Taylor, 2008). In this way, microvesiclesoriginating from distinct cell populations can be analyzed for their nucleic acid content. For example, tumor (malignantand non-malignant) microvesicles carry tumor-associated surface antigens and may be detected, isolated and/or enrichedvia these specific tumor-associated surface antigens. In one example, the surface antigen is epithelial-cell-adhesion-molecule (EpCAM), which is specific to microvesicles from carcinomas of lung, colorectal, breast, prostate, head andneck, and hepatic origin, but not of hematological cell origin (Balzar et al., 1999; Went et al., 2004). In another example,the surface antigen is CD24, which is a glycoprotein specific to urine microvesicles (Keller et al., 2007). In yet anotherexample, the surface antigen is selected from a group of molecules CD70, carcinoembryonic antigen (CEA), EGFR,EGFRvIII and other variants, Fas ligand, TRAIL, tranferrin receptor, p38.5, p97 and HSP72. Additionally, tumor specificmicrovesicles may be characterized by the lack of surface markers, such as CD80 and CD86.[0036] The isolation of microvesicles from specific cell types can be accomplished, for example, by using antibodies,aptamers, aptamer analogs or molecularly imprinted polymers specific for a desired surface antigen. In one embodiment,the surface antigen is specific for a cancer type. In another embodiment, the surface antigen is specific for a cell typewhich is not necessarily cancerous. One example of a method of microvesicle separation based on cell surface antigenis provided in U.S. Patent No. 7,198,923. As described in, e.g., U.S. Patent Nos. 5,840,867 and 5,582,981, WO/2003/050290 and a publication by Johnson et al. (Johnson et al., 2008), aptamers and their analogs specifically bindsurface molecules and can be used as a separation tool for retrieving cell type-specific microvesicles. Molecularlyimprinted polymers also specifically recognize surface molecules as described in, e.g., US Patent Nos. 6,525,154,7,332,553 and 7,384,589 and a publication by Bossi et al. (Bossi et al., 2007) and are a tool for retrieving and isolatingcell type-specific microvesicles. Each of the foregoing reference is incorporated herein for its teaching of these methods.[0037] It may be beneficial or otherwise desirable to extract the nucleic acid from the exosomes prior to the analysis.Nucleic acid molecules can be isolated from a microvesicle using any number of procedures, which are well-known inthe art, the particular isolation procedure chosen being appropriate for the particular biological sample. Examples ofmethods for extraction are provided in the Examples section herein. In some instances, with some techniques, it mayalso be possible to analyze the nucleic acid without extraction from the microvesicle.[0038] In one embodiment, the extracted nucleic acids, including DNA and/or RNA, are analyzed directly without anamplification step. Direct analysis may be performed with different methods including, but not limited to, the nanostringtechnology. NanoString technology enables identification and quantification of individual target molecules in a biologicalsample by attaching a color coded fluorescent reporter to each target molecule. This approach is similar to the concept
EP 2 604 704 A1
11
5
10
15
20
25
30
35
40
45
50
55
of measuring inventory by scanning barcodes. Reporters can be made with hundreds or even thousands of differentcodes allowing for highly multiplexed analysis. The technology is described in a publication by Geiss et al. (Geiss et al.,2008) and is incorporated herein by reference for this teaching.[0039] In another embodiment, it may be beneficial or otherwise desirable to amplify the nucleic acid of the microvesicleprior to analyzing it. Methods of nucleic acid amplification are commonly used and generally known in the art, manyexamples of which are described herein. If desired, the amplification can be performed such that it is quantitative.Quantitative amplification will allow quantitative determination of relative amounts of the various nucleic acids, to generatea profile as described below.[0040] In one embodiment, the extracted nucleic acid is RNA. RNAs are then preferably reverse-transcribed intocomplementary DNAs before further amplification. Such reverse transcription may be performed alone or in combinationwith an amplification step. One example of a method combining reverse transcription and amplification steps is reversetranscription polymerase chain reaction (RT-PCR), which may be further modified to be quantitative, e.g., quantitativeRT-PCR as described in US Patent No. 5,639,606, which is incorporated herein by reference for this teaching.[0041] Nucleic acid amplification methods include, without limitation, polymerase chain reaction (PCR) (US PatentNo. 5,219,727) and its variants such as in situ polymerase chain reaction (US Patent No. 5,538,871), quantitativepolymerase chain reaction (US Patent No. 5,219,727), nested polymerase chain reaction (US Patent No. 5,556,773),self sustained sequence replication and its variants (Guatelli et al., 1990), transcriptional amplification system and itsvariants (Kwoh et al., 1989), Qb Replicase and its variants (Miele et al., 1983), cold-PCR (Li et al., 2008) or any othernucleic acid amplification methods, followed by the detection of the amplified molecules using techniques well knownto those of skill in the art. Especially useful are those detection schemes designed for the detection of nucleic acidmolecules if such molecules are present in very low numbers. The foregoing references are incorporated herein for theirteachings of these methods.[0042] The analysis of nucleic acids present in the microvesicles is quantitative and/or qualitative. For quantitativeanalysis, the amounts (expression levels), either relative or absolute, of specific nucleic acids of interest within themicrovesicles are measured with methods known in the art (described below). For qualitative analysis, the species ofspecific nucleic acids of interest within the microvesicles, whether wild type or variants, are identified with methodsknown in the art (described below).[0043] "Genetic aberrations" is used herein to refer to the nucleic acid amounts as well as nucleic acid variants withinthe microvesicles. Specifically, genetic aberrations include, without limitation, over-expression of a gene (e.g., onco-genes) or a panel of genes, under-expression of a gene (e.g., tumor suppressor genes such as p53 or RB) or a panelof genes, alternative production of splice variants of a gene or a panel of genes, gene copy number variants (CNV) (e.g.DNA double minutes) (Hahn, 1993), nucleic acid modifications (e.g., methylation, acetylation and phosphorylations),single nucleotide polymorphisms (SNPs), chromosomal rearrangements (e.g., inversions, deletions and duplications),and mutations (insertions, deletions, duplications, missense, nonsense, synonymous or any other nucleotide changes)of a gene or a panel of genes, which mutations, in many cases, ultimately affect the activity and function of the geneproducts, lead to alternative transcriptional splicing variants and/or changes of gene expression level.[0044] The determination of such genetic aberrations can be performed by a variety of techniques known to the skilledpractitioner. For example, expression levels of nucleic acids, alternative splicing variants, chromosome rearrangementand gene copy numbers can be determined by microarray analysis (US Patent Nos. 6,913,879, 7,364,848, 7,378,245,6,893,837 and 6,004,755) and quantitative PCR. Particularly, copy number changes may be detected with the IlluminaInfinium II whole genome genotyping assay or Agilent Human Genome CGH Microarray (Steemers et al., 2006). Nucleicacid modifications can be assayed by methods described in, e.g., US Patent No. 7,186,512 and patent publication WO/2003/023065. Particularly, methylation profiles may be determined by Illumina DNA Methylation OMA003 Cancer Panel.SNPs and mutations can be detected by hybridization with allele-specific probes, enzymatic mutation detection, chemicalcleavage of mismatched heteroduplex (Cotton et al., 1988), ribonuclease cleavage of mismatched bases (Myers et al.,1985), mass spectrometry (US Patent Nos. 6,994,960, 7,074,563, and 7,198,893), nucleic acid sequencing, single strandconformation polymorphism (SSCP) (Orita et al., 1989), denaturing gradient gel electrophoresis (DGGE)(Fischer andLerman, 1979a; Fischer and Lerman, 1979b), temperature gradient gel electrophoresis (TGGE) (Fischer and Lerman,1979a; Fischer and Lerman, 1979b), restriction fragment length polymorphisms (RFLP) (Kan and Dozy, 1978a; Kanand Dozy, 1978b), oligonucleotide ligation assay (OLA), allele-specific PCR (ASPCR) (US Patent No. 5,639,611), ligationchain reaction (LCR) and its variants (Abravaya et al., 1995; Landegren et al., 1988; Nakazawa et al., 1994), flow-cytometric heteroduplex analysis (WO/2006/113590) and combinations/modifications thereof. Notably, gene expressionlevels may be determined by the serial analysis of gene expression (SAGE) technique (Velculescu et al., 1995). Ingeneral, the methods for analyzing genetic aberrations are reported in numerous publications, not limited to those citedherein, and are available to skilled practitioners. The appropriate method of analysis will depend upon the specific goalsof the analysis, the condition/history of the patient, and the specific cancer(s), diseases or other medical conditions tobe detected, monitored or treated. The forgoing references are incorporated herein for their teachings of these methods.[0045] A variety of genetic aberrations have been identified to occur and/or contribute to the initial generation or
EP 2 604 704 A1
12
5
10
15
20
25
30
35
40
45
50
55
progression of cancer. Examples of genes which are commonly up-regulated (i.e. over-expressed) in cancer are providedin Table 4 (cancers of different types) and Table 6 (pancreatic cancer). Examples of microRNAs which are up-regulatedin brain tumor are provided in Table 8. In one embodiment of the invention, there is an increase in the nucleic acidexpression level of a gene listed in Table 4 and/or Table 6 and/or of a microRNA listed in Table 8. Examples of geneswhich are commonly down-regulated (e.g. under-expressed) in cancer are provided in Table 5 (cancers of differenttypes) and Table 7 (pancreatic cancer). Examples of microRNAs which are down-regulated in brain tumor are providedin Table 9. In one embodiment of the invention, there is a decrease in the nucleic acid expression level of a gene listedin Table 5 and/or Table 7 and/or a microRNA listed in Table 9. Examples of genes which are commonly under expressed,or over expressed in brain tumors are reviewed in (Furnari et al., 2007), and this subject matter is incorporated hereinby reference. With respect to the development of brain tumors, RB and p53 are often down-regulated to otherwisedecrease their tumor suppressive activity. Therefore, in these embodiments, the presence or absence of an increaseor decrease in the nucleic acid expression level of a gene(s) and/or a microRNA(s) whose disregulated expression levelis specific to a type of cancer can be used to indicate the presence or absence of the type of cancer in the subj ect.[0046] Likewise, nucleic acid variants, e.g., DNA or RNA modifications, single nucleotide polymorphisms (SNPs) andmutations (e.g., missense, nonsense, insertions, deletions, duplications) may also be analyzed within microvesiclesfrom bodily fluid of a subject, including pregnant females where microvesicles derived from the fetus may be in serumas well as amniotic fluid. Non-limiting examples are provided in Table 3. In yet a further embodiment, the nucleotidevariant is in the EGFR gene. In a still further embodiment, the nucleotide variant is the EGFRvIII mutation/variant. Theterms "EGFR","epidermal growth factor receptor" and "ErbB 1 "are used interchangeably in the art, for example asdescribed in a paper by Carpenter (Carpenter, 1987). With respect to the development of brain tumors, RB, PTEN, p16,p21 and p53 are often mutated to otherwise decrease their tumor suppressive activity. Examples of specific mutationsin specific forms of brain tumors are discussed in a paper by Furnari et al. (Furnari et al., 2007), and this subject matteris incorporated herein by reference.[0047] In addition, more genetic aberrations associated with cancers have been identified recently in a few ongoingresearch projects. For example, the Cancer Genome Atlas (TCGA) program is exploring a spectrum of genomic changesinvolved in human cancers. The results of this project and other similar research efforts are published and incorporatedherein by reference (Jones et al., 2008; McLendon et al., 2008; Parsons et al., 2008; Wood et al., 2007). Specifically,these research projects have identified genetic aberrations, such as mutations (e.g., missense, nonsense, insertions,deletions and duplications), gene expression level variations (mRNA or microRNA), copy number variations and nucleicacid modification (e.g. methylation), in human glioblastoma, pancreatic cancer, breast cancer and/or colorectal cancer.The genes most frequently mutated in these cancers are listed in Table 11 and Table 12 (glioblastoma), Table 13(pancreatic cancer), Table 14 (breast cancer) and Table 15 (colorectal cancer). The genetic aberrations in these genes,and in fact any genes which contain any genetic aberrations in a cancer, are targets that may be selected for use indiagnosing and/or monitoring cancer by the methods described herein.[0048] Detection of one or more nucleotide variants can be accomplished by performing a nucleotide variant screenon the nucleic acids within the microvesicles. Such a screen can be as wide or narrow as determined necessary ordesirable by the skilled practitioner. It can be a wide screen (set up to detect all possible nucleotide variants in genesknown to be associated with one or more cancers or disease states). Where one specific cancer or disease is suspectedor known to exist, the screen can be specific to that cancer or disease. One example is a brain tumor/brain cancer screen(e.g., set up to detect all possible nucleotide variants in genes associated with various clinically distinct subtypes of braincancer or known drug-resistant or drug-sensitive mutations of that cancer).[0049] In one embodiment, the analysis is of a profile of the amounts (levels) of specific nucleic acids present in themicrovesicle, herein referred to as a "quantitative nucleic acid profile" of the microvesicles. In another embodiment, theanalysis is of a profile of the species of specific nucleic acids present in the microvesicles (both wild type as well asvariants), herein referred to as a "nucleic acid species profile." A term used herein to refer to a combination of thesetypes of profiles is "genetic profile" which refers to the determination of the presence or absence of nucleotide species,variants and also increases or decreases in nucleic acid levels.[0050] Once generated, these genetic profiles of the microvesicles are compared to those expected in, or otherwisederived from a healthy normal individual. A profile can be a genome wide profile (set up to detect all possible expressedgenes or DNA sequences). It can be narrower as well, such as a cancer wide profile (set up to detect all possible genesor nucleic acids derived therefrom, or known to be associated with one or more cancers). Where one specific cancer issuspected or known to exist, the profile can be specific to that cancer (e.g., set up to detect all possible genes or nucleicacids derived therefrom, associated with various clinically distinct subtypes of that cancer or known drug-resistant orsensitive mutations of that cancer).[0051] Which nucleic acids are to be amplified and/or analyzed can be selected by the skilled practitioner. The entirenucleic acid content of the exosomes or only a subset of specific nucleic acids which are likely or suspected of beinginfluenced by the presence of a disease or other medical condition such as cancer, can be amplified and/or analyzed.The identification of a nucleic acid aberration(s) in the analyzed microvesicle nucleic acid can be used to diagnose the
EP 2 604 704 A1
13
5
10
15
20
25
30
35
40
45
50
55
subject for the presence of a disease such as cancer, hereditary diseases or viral infection with which that aberration(s) is associated. For instance, analysis for the presence or absence of one or more nucleic acid variants of a genespecific to a cancer (e.g. the EGFRvIII mutation) can indicate the cancer’s presence in the individual. Alternatively, orin addition, analysis of nucleic acids for an increase or decrease in nucleic acid levels specific to a cancer can indicatethe presence of the cancer in the individual (e.g., a relative increase in EGFR nucleic acid, or a relative decrease in atumor suppressor gene such as p53).[0052] In one embodiment, mutations of a gene which is associated with a disease such as cancer (e.g. via nucleotidevariants, over-expression or under-expression) are detected by analysis of nucleic acids in microvesicles, which nucleicacids are derived from the genome itself in the cell of origin or exogenous genes introduced through viruses. The nucleicacid sequences may be complete or partial, as both are expected to yield useful information in diagnosis and prognosisof a disease. The sequences may be sense or anti-sense to the actual gene or transcribed sequences. The skilledpractitioner will be able to devise detection methods for a nucleotide variance from either the sense or anti-sense nucleicacids which may be present in a microvesicle. Many such methods involve the use of probes which are specific for thenucleotide sequences which directly flank, or contain the nucleotide variances. Such probes can be designed by theskilled practitioner given the knowledge of the gene sequences and the location of the nucleic acid variants within thegene. Such probes can be used to isolate, amplify, and/or actually hybridize to detect the nucleic acid variants, asdescribed in the art and herein.[0053] Determining the presence or absence of a particular nucleotide variant or plurality of variants in the nucleicacid within microvesicles from a subject can be performed in a variety of ways. A variety of methods are available forsuch analysis, including, but not limited to, PCR, hybridization with allele-specific probes, enzymatic mutation detection,chemical cleavage of mismatches, mass spectrometry or DNA sequencing, including minisequencing. In particularembodiments, hybridization with allele specific probes can be conducted in two formats: 1) allele specific oligonucleotidesbound to a solid phase (glass, silicon, nylon membranes) and the labeled sample in solution, as in many DNA chipapplications, or 2) bound sample (often cloned DNA or PCR amplified DNA) and labeled oligonucleotides in solution(either allele specific or short so as to allow sequencing by hybridization). Diagnostic tests may involve a panel ofvariances, often on a solid support, which enables the simultaneous determination of more than one variance. In anotherembodiment, determining the presence of at least one nucleic acid variance in the microvesicle nucleic acid entails ahaplotyping test. Methods of determining haplotypes are known to those of skill in the art, as for example, in WO 00/04194.[0054] In one embodiment, the determination of the presence or absence of a nucleic acid variant(s) involves deter-mining the sequence of the variant site or sites (the exact location within the sequence where the nucleic acid variationfrom the norm occurs) by methods such as polymerase chain reaction (PCR), chain terminating DNA sequencing (USPatent No. 5547859), minisequencing (Fiorentino et al., 2003), oligonucleotide hybridization, pyrosequencing, Illuminagenome analyzer, deep sequencing, mass spectrometry or other nucleic acid sequence detection methods. Methodsfor detecting nucleic acid variants are well known in the art and disclosed in WO 00/04194, incorporated herein byreference. In an exemplary method, the diagnostic test comprises amplifying a segment of DNA or RNA (generally afterconverting the RNA to complementary DNA) spanning one or more known variants in the desired gene sequence. Thisamplified segment is then sequenced and/or subjected to electrophoresis in order to identify nucleotide variants in theamplified segment.[0055] In one embodiment, the invention provides a method of screening for nucleotide variants in the nucleic acid ofmicrovesicles isolated as described herein. This can be achieved, for example, by PCR or, alternatively, in a ligationchain reaction (LCR) (Abravaya et al., 1995; Landegren et al., 1988; Nakazawa et al., 1994). LCR can be particularlyuseful for detecting point mutations in a gene of interest (Abravaya et al., 1995). The LCR method comprises the stepsof designing degenerate primers for amplifying the target sequence, the primers corresponding to one or more conservedregions of the nucleic acid corresponding to the gene of interest, amplifying PCR products with the primers using, as atemplate, a nucleic acid obtained from a microvesicle, and analyzing the PCR products. Comparison of the PCR productsof the microvesicle nucleic acid to a control sample (either having the nucleotide variant or not) indicates variants in themicrovesicle nucleic acid. The change can be either an absence or presence of a nucleotide variant in the microvesiclenucleic acid, depending upon the control.[0056] Analysis of amplification products can be performed using any method capable of separating the amplificationproducts according to their size, including automated and manual gel electrophoresis, mass spectrometry, and the like.[0057] Alternatively, the amplification products can be analyzed based on sequence differences, using SSCP, DGGE,TGGE, chemical cleavage, OLA, restriction fragment length polymorphisms as well as hybridization, for example, nucleicacid microarrays.[0058] The methods of nucleic acid isolation, amplification and analysis are routine for one skilled in the art andexamples of protocols can be found, for example, in Molecular Cloning: A Laboratory Manual (3-Volume Set) Ed. JosephSambrook, David W. Russel, and Joe Sambrook, Cold Spring Harbor Laboratory, 3rd edition (January 15, 2001), ISBN:0879695773. A particular useful protocol source for methods used in PCR amplification is PCR Basics: From Backgroundto Bench by Springer Verlag; 1st edition (October 15, 2000), ISBN: 0387916008.
EP 2 604 704 A1
14
5
10
15
20
25
30
35
40
45
50
55
[0059] Many methods of diagnosis performed on a tumor biopsy sample can be performed with microvesicles sincetumor cells, as well as some normal cells are known to shed microvesicles into bodily fluid and the genetic aberrationswithin these microvesicles reflect those within tumor cells as demonstrated herein. Furthermore, methods of diagnosisusing microvesicles have characteristics that are absent in methods of diagnosis performed directly on a tumor biopsysample. For example, one particular advantage of the analysis of microvesicular nucleic acids, as opposed to otherforms of sampling of tumor/cancer nucleic acid, is the availability for analysis of tumor/cancer nucleic acids derived fromall foci of a tumor or genetically heterogeneous tumors present in an individual. Biopsy samples are limited in that theyprovide information only about the specific focus of the tumor from which the biopsy is obtained. Different tumorous/cancerous foci found within the body, or even within a single tumor often have different genetic profiles and are notanalyzed in a standard biopsy. However, analysis of the microvesicular nucleic acids from an individual presumablyprovides a sampling of all foci within an individual. This provides valuable information with respect to recommendedtreatments, treatment effectiveness, disease prognosis, and analysis of disease recurrence, which cannot be providedby a simple biopsy.[0060] Identification of genetic aberrations associated with specific diseases and/or medical conditions by the methodsdescribed herein can also be used for prognosis and treatment decisions of an individual diagnosed with a disease orother medical condition such as cancer. Identification of the genetic basis of a disease and/or medical condition providesuseful information guiding the treatment of the disease and/or medical condition. For example, many forms of chemo-therapy have been shown to be more effective on cancers with specific genetic abnormalities/aberrations. One exampleis the effectiveness of EGFR-targeting treatments with medicines, such as the kinase inhibitors gefitinib and erlotinib.Such treatment have been shown to be more effective on cancer cells whose EGFR gene harbors specific nucleotidemutations in the kinase domain of EGFR protein (U.S. Patent publication 20060147959). In other words, the presenceof at least one of the identified nucleotide variants in the kinase domain of EGFR nucleic acid message indicates that apatient will likely benefit from treatment with the EGFR-targeting compound gefitinib or erlotinib. Such nucleotide variantscan be identified in nucleic acids present in microvesicles by the methods described herein, as it has been demonstratedthat EGFR transcripts of tumor origin are isolated from microvesicles in bodily fluid.[0061] Genetic aberrations in other genes have also been found to influence the effectiveness of treatments. Asdisclosed in the publication by Furnari et al. (Furnari et al., 2007), mutations in a variety of genes affect the effectivenessof specific medicines used in chemotherapy for treating brain tumors. The identification of these genetic aberrations inthe nucleic acids within microvesicles will guide the selection of proper treatment plans.[0062] As such, aspects of the present invention relate to a method for monitoring disease (e.g. cancer) progressionin a subject, and also to a method for monitoring disease recurrence in an individual. These methods comprise the stepsof isolating microvesicles from a bodily fluid of an individual, as discussed herein, and analyzing nucleic acid within themicrovesicles as discussed herein (e.g. to create a genetic profile of the microvesicles). The presence/absence of acertain genetic aberration/profile is used to indicate the presence/absence of the disease (e.g. cancer) in the subject asdiscussed herein. The process is performed periodically over time, and the results reviewed, to monitor the progressionor regression of the disease, or to determine recurrence of the disease. Put another way, a change in the genetic profileindicates a change in the disease state in the subject. The period of time to elapse between sampling of microvesiclesfrom the subject, for performance of the isolation and analysis of the microvesicle, will depend upon the circumstancesof the subject, and is to be determined by the skilled practitioner. Such a method would prove extremely beneficial whenanalyzing a nucleic acid from a gene that is associated with the therapy undergone by the subject. For example, a genewhich is targeted by the therapy can be monitored for the development of mutations which make it resistant to thetherapy, upon which time the therapy can be modified accordingly. The monitored gene may also be one which indicatesspecific responsiveness to a specific therapy.[0063] Aspects of the present invention also relate to the fact that a variety of non-cancer diseases and/or medicalconditions also have genetic links and/or causes, and such diseases and/or medical conditions can likewise be diagnosedand/or monitored by the methods described herein. Many such diseases are metabolic, infectious or degenerative innature. One such disease is diabetes (e.g. diabetes insipidus) in which the vasopressin type 2 receptor (V2R) is modified.Another such disease is kidney fibrosis in which the genetic profiles for the genes of collagens, fibronectin and TGF-βare changed. Changes in the genetic profile due to substance abuse (e.g. a steroid or drug use), viral and/or bacterialinfection, and hereditary disease states can likewise be detected by the methods described herein.[0064] Diseases or other medical conditions for which the inventions described herein are applicable include, but arenot limited to, nephropathy, diabetes insipidus, diabetes type I, diabetes II, renal disease glomerulonephritis, bacterialor viral glomerulonephritides, IgA nephropathy, Henoch-Schonlein Purpura, membranoproliferative glomerulonephritis,membranous nephropathy, Sjogren’s syndrome, nephrotic syndrome minimal change disease, focal glomerulosclerosisand related disorders, acute renal failure, acute tubulointerstitial nephritis, pyelonephritis, GU tract inflammatory disease,Pre-clampsia, renal graft rejection, leprosy, reflux nephropathy, nephrolithiasis, genetic renal disease, medullary cystic,medullar sponge, polycystic kidney disease, autosomal dominant polycystic kidney disease, autosomal recessive poly-cystic kidney disease, tuberous sclerosis, von Hippel-Lindau disease, familial thin-glomerular basement membrane
EP 2 604 704 A1
15
5
10
15
20
25
30
35
40
45
50
55
disease, collagen III glomerulopathy, fibronectin glomerulopathy, Alport’s syndrome, Fabry’s disease, Nail-Patella Syn-drome, congenital urologic anomalies, monoclonal gammopathies, multiple myeloma, amyloidosis and related disorders,febrile illness, familial Mediterranean fever, HIV infection-AIDS, inflammatory disease, systemic vasculitides, polyarteritisnodosa, Wegener’s granulomatosis, polyarteritis, necrotizing and crecentic glomerulonephritis, polymyositis-dermato-myositis, pancreatitis, rheumatoid arthritis, systemic lupus erythematosus, gout, blood disorders, sickle cell disease,thrombotic thrombocytopenia purpura, Fanconi’s syndrome, transplantation, acute kidney injury, irritable bowel syn-drome, hemolytic-uremic syndrome, acute corticol necrosis, renal thromboembolism, trauma and surgery, extensiveinjury, burns, abdominal and vascular surgery, induction of anesthesia, side effect of use of drugs or drug abuse,circulatory disease myocardial infarction, cardiac failure, peripheral vascular disease, hypertension, coronary heartdisease, non-atherosclerotic cardiovascular disease, atherosclerotic cardiovascular disease, skin disease, soriasis, sys-temic sclerosis, respiratory disease, COPD, obstructive sleep apnoea, hypoia at high altitude or erdocrine disease,acromegaly, diabetes mellitus, or diabetes insipidus.[0065] Selection of an individual from whom the microvesicles are isolated is performed by the skilled practitionerbased upon analysis of one or more of a variety of factors. Such factors for consideration are whether the subject hasa family history of a specific disease (e.g. a cancer), has a genetic predisposition for such a disease, has an increasedrisk for such a disease due to family history, genetic predisposition, other disease or physical symptoms which indicatea predisposition, or environmental reasons. Environmental reasons include lifestyle, exposure to agents which causeor contribute to the disease such as in the air, land, water or diet. In addition, having previously had the disease, beingcurrently diagnosed with the disease prior to therapy or after therapy, being currently treated for the disease (undergoingtherapy), being in remission or recovery from the disease, are other reasons to select an individual for performing themethods.[0066] The methods described herein are optionally performed with the additional step of selecting a gene or nucleicacid for analysis, prior to the analysis step. This selection can be based on any predispositions of the subject, or anyprevious exposures or diagnosis, or therapeutic treatments experienced or concurrently undergone by the subject.[0067] The cancer diagnosed, monitored or otherwise profiled, can be any kind of cancer. This includes, withoutlimitation, epithelial cell cancers such as lung, ovarian, cervical, endometrial, breast, brain, colon and prostate cancers.Also included are gastrointestinal cancer, head and neck cancer, non-small cell lung cancer, cancer of the nervoussystem, kidney cancer, retina cancer, skin cancer, liver cancer, pancreatic cancer, genital-urinary cancer and bladdercancer, melanoma, and leukemia. In addition, the methods and compositions of the present invention are equally ap-plicable to detection, diagnosis and prognosis of non-malignant tumors in an individual (e.g. neurofibromas, meningiomasand schwannomas).[0068] In one embodiment, the cancer is brain cancer. Types of brain tumors and cancer are well known in the art.Glioma is a general name for tumors that arise from the glial (supportive) tissue of the brain. Gliomas are the mostcommon primary brain tumors. Astrocytomas, ependymomas, oligodendrogliomas, and tumors with mixtures of two ormore cell types, called mixed gliomas, are the most common gliomas. The following are other common types of braintumors: Acoustic Neuroma (Neurilemmoma, Schwannoma. Neurinoma), Adenoma, Astracytoma, Low-Grade Astrocy-toma, giant cell astrocytomas, Mid-and High-Grade Astrocytoma, Recurrent tumors, Brain Stem Glioma, Chordoma,Choroid Plexus Papilloma, CNS Lymphoma (Primary Malignant Lymphoma), Cysts, Dermoid cysts, Epidermoid cysts,Craniopharyngioma, Ependymoma Anaplastic ependymoma, Gangliocytoma (Ganglioneuroma), Ganglioglioma, Gliob-lastoma Multiforme (GBM), Malignant Astracytoma, Glioma, Hemangioblastoma, Inoperable Brain Tumors, Lymphoma,Medulloblastoma (MDL), Meningioma, Metastatic Brain Tumors, Mixed Glioma, Neurofibromatosis, Oligodendroglioma.Optic Nerve Glioma, Pineal Region Tumors, Pituitary Adenoma, PNET (Primitive Neuroectodermal Tumor), Spinal Tu-mors, Subependymoma, and Tuberous Sclerosis (Bourneville’s Disease).[0069] In addition to identifying previously known nucleic acid aberrations (as associated with diseases), the methodsof the present invention can be used to identify previously unidentified nucleic acid sequences/modifications (e.g. posttranscriptional modifications) whose aberrations are associated with a certain disease and/or medical condition. This isaccomplished, for example, by analysis of the nucleic acid within microvesicles from a bodily fluid of one or more subjectswith a given disease/medical condition (e.g. a clinical type or subtype of cancer) and comparison to the nucleic acidwithin microvesicles of one or more subjects without the given disease/medical condition, to identify differences in theirnucleic acid content. The differences may be any genetic aberrations including, without limitation, expression level ofthe nucleic acid, alternative splice variants, gene copy number variants (CNV), modifications of the nucleic acid , singlenucleotide polymorphisms (SNPs), and mutations (insertions, deletions or single nucleotide changes) of the nucleic acid.Once a difference in a genetic parameter of a particular nucleic acid is identified for a certain disease, further studiesinvolving a clinically and statistically significant number of subjects may be carried out to establish the correlation betweenthe genetic aberration of the particular nucleic acid and the disease. The analysis of genetic aberrations can be doneby one or more methods described herein, as determined appropriate by the skilled practitioner.
EP 2 604 704 A1
16
5
10
15
20
25
30
35
40
45
50
55
Exosomes As Delivery Vehicles
[0070] Aspects of the present invention also relate to the actual microvesicles described herein. In one embodiment,the invention is an isolated microvesicle as described herein, isolated from an individual. In one embodiment, the mi-crovesicle is produced by a cell within the brain of the individual (e.g. a tumor or non-tumor cell). In another embodiment,the microvesicle is isolated from a bodily fluid of an individual, as described herein. Methods of isolation are describedherein.[0071] Another aspect of the invention relates to the finding that isolated microvesicles from human glioblastoma cellscontain mRNAs, miRNAs and angiogenic proteins. Such glioblastoma microvesicles were taken up by primary humanbrain endothelial cells, likely via an endocytotic mechanism, and a reporter protein mRNA incorporated into the micro-vesicles was translated in those cells. This indicates that messages delivered by microvesicles can change the geneticand/or translational profile of a target cell (a cell which takes up a microvesicle). The microvesicles also containedmiRNAs which are known to be abundant in glioblastomas (Krichevsky et al, manuscript in preparation). Thus micro-vesicles derived from glioblastoma tumors function as delivery vehicles for mRNA, miRNA and proteins which can changethe translational state of other cells via delivery of specific mRNA species, promote angiogenesis of endothelial cells,and stimulate tumor growth.[0072] In one embodiment, microvesicles are depleted from a bodily fluid from a donor subject before said bodily fluidis delivered to a recipient subject. The donor subject may be a subject with an undetectable tumor and the microvesiclesin the bodily fluid are derived from the tumor. The tumor microvesicles in the donor bodily fluid, if unremoved, would beharmful since the genetic materials and proteins in the microvesicle may promote unrestricted growth of cells in therecipient subject.[0073] As such, another aspect of the invention is the use of the microvesicles identified herein to deliver a nucleicacid to a cell. In one embodiment, the cell is within the body of an individual. The method comprises administering amicrovesicle(s) which contains the nucleic acid, or a cell that produces such microvesicles, to the individual such thatthe microvesicles contacts and/or enters the cell of the individual. The cell to which the nucleic acid gets delivered isreferred to as the target cell.[0074] The microvesicle can be engineered to contain a nucleic acid that it would not naturally contain (i.e. which isexogenous to the normal content of the microvesicle). This can be accomplished by physically inserting the nucleic acidinto the microvesicles. Alternatively, a cell (e.g. grown in culture) can be engineered to target one or more specific nucleicacid into the exosome, and the exosome can be isolated from the cell. Alternatively, the engineered cell itself can beadministered to the individual.[0075] In one embodiment, the cell which produces the exosome for administration is of the same or similar origin orlocation in the body as the target cell. That is to say, for delivery of a microvesicle to a brain cell, the cell which producesthe microvesicle would be a brain cell (e.g. a primary cell grown in culture). In another embodiment, the cell whichproduces the exosome is of a different cell type than the target cell. In one embodiment, the cell which produces theexosome is a type that is located proximally in the body to the target cell.[0076] A nucleic acid sequence which can be delivered to a cell via an exosome can be RNA or DNA, and can besingle or double stranded, and can be selected from a group comprising: nucleic acid encoding a protein of interest,oligonucleotides, nucleic acid analogues, for example peptide-nucleic acid (PNA), pseudo-complementary PNA (pc-PNA), locked nucleic acid (LNA) etc. Such nucleic acid sequences include, for example, but are not limited to, nucleicacid sequences encoding proteins, for example that act as transcriptional repressors, antisense molecules, ribozymes,small inhibitory nucleic acid sequences, for example but are not limited to RNAi, shRNA, siRNA, miRNA, antisenseoligonucleotides, and combinations thereof.[0077] Microvesicles isolated from a cell type are delivered to a recipient subject. Said microvesicles may benefit therecipient subject medically. For example, the angiogenesis and pro-proliferation effects of tumor exosomes may helpthe regeneration of injured tissues in the recipient subject. In one embodiment, the delivery means is by bodily fluidtransfusion wherein microvesicles are added into a bodily fluid from a donor subject before said bodily fluid is deliveredto a recipient subject.[0078] In another embodiment, the microvesicle is an ingredient (e.g. the active ingredient in a pharmaceuticallyacceptable formulation suitable for administration to the subject (e.g. in the methods described herein). Generally thiscomprises a pharmaceutically acceptable carrier for the active ingredient. The specific carrier will depend upon a numberof factors (e.g.. the route of administration).[0079] The "pharmaceutically acceptable carrier" means any pharmaceutically acceptable means to mix and/or deliverthe targeted delivery composition to a subject. This includes a pharmaceutically acceptable material, composition orvehicle, such as a liquid or solid filler, diluent, excipient, solvent or encapsulating material, involved in carrying or trans-porting the subject agents from one organ, or portion of the body, to another organ, or portion of the body. Each carriermust be "acceptable" in the sense of being compatible with the other ingredients of the formulation and is compatiblewith administration to a subject, for example a human.
EP 2 604 704 A1
17
5
10
15
20
25
30
35
40
45
50
55
[0080] Administration to the subject can be either systemic or localized. This includes, without limitation, dispensing,delivering or applying an active compound (e.g. in a pharmaceutical formulation) to the subject by any suitable route fordelivery of the active compound to the desired location in the subject, including delivery by either the parenteral or oralroute, intramuscular injection, subcutaneous/intradermal injection, intravenous injection, buccal administration, transder-mal delivery and administration by the rectal, colonic, vaginal, intranasal or respiratory tract route.[0081] It should be understood that this invention is not limited to the particular methodologies, protocols and reagents,described herein and as such may vary. The terminology used herein is for the purpose of describing particular embod-iments only, and is not intended to limit the scope of the present invention, which is defined solely by the claims.[0082] In one respect, the present invention relates to the herein described compositions, methods, and respectivecomponents thereof, as essential to the invention, yet open to the inclusion of unspecified elements, essential or not("comprising"). In some embodiments, other elements to be included in the description of the composition, method orrespective component thereof are limited to those that do not materially affect the basic and novel characteristic(s) ofthe invention ("consisting essentially of"). This applies equally to steps within a described method as well as compositionsand components therein. In other embodiments, the inventions, compositions, methods, and respective componentsthereof, described herein are intended to be exclusive of any element not deemed an essential element to the component,composition or method ("consisting of").
EXAMPLES
[0083] Examples 1-7. Tumor cells shed microvesicles, which contain RNAs, including mRNAs and microRNAs, andthat microvesicles contain more than 90% of the extracellular RNA in bodily fluids.
Example 1: Microvesicles are shed from primary human glioblastoma cells.
[0084] Glioblastoma tissue was obtained from surgical resections and tumor cells were dissociated and cultured asmonolayers. Specifically, brain tumor specimens from patients diagnosed by a neuropathologist as glioblastoma multi-forme were taken directly from surgery and placed in cold sterile Neurobasal media (Invitrogen, Carlsbad, CA, USA).The specimens were dissociated into single cells within 1 hr from the time of surgery using a Neural Tissue DissociationKit (Miltenyi Biotech, Berisch Gladbach, Germany) and plated in DMEM 5% dFBS supplemented with penicillin-strep-tomycin (10 IU ml-1 and 10 mg ml-1, respectively, Sigma-Aldrich, St Louis, MO, USA). Because microvesicles can befound in the fetal bovine serum (FBS) traditionally used to cultivate cells, and these microvesicles contain substantialamounts of mRNA and miRNA, it was important to grow the tumor cells in media containing microvesicle-depleted FBS(dFBS). Cultured primary cells obtained from three glioblastoma tumors were found to produce microvesicles at bothearly and later passages (a passage is a cellular generation defined by the splitting of cells, which is a common cellculture technique and is necessary to keep the cells alive). The microvesicles were able to be detected by scanningelectronmicroscopy (FIGS 1a and 1b) and transmission electronmicroscopy (FIG 1f). Briefly, human glioblastoma cellswere placed on ornithine-coated cover-slips, fixed in 0.5x Karnovskys fixative and then washed 2x5min (2 times with 5min each) with PBS. The cells were dehydrated in 35% EtOH 10 min, 50% EtOH 2x 10 min, 70% EtOH 2x 10 min, 95%EtOH 2x 10 min, and 100% EtOH 4 x 10 min. The cells were then transferred to critical point drying in a TousimisSAMDR1-795 semi-automatic Critical Point Dryer followed by coating with chromium in a GATAN Model 681 HighResolution Ion Beam Coater. As shown in FIGS. 1a and 1b, tumor cells were covered with microvesicles varying in sizefrom about 50 - 500 nm.
Example 2: Glioblastoma microvesicles contain RNA.
[0085] To isolate microvesicles, glioblastoma cells at passage 1-15 were cultured in microvesicle-free media (DMEMcontaining 5% dFBS prepared by ultracentrifugation at 110,000 x g for 16 hours to remove bovine microvesicles). Theconditioned medium from 40 million cells was harvested after 48 hours. The microvesicles were purified by differentialcentrifugation. Specifically, glioblastoma conditioned medium was centrifuged for 10 min at 300 x g to eliminate any cellcontamination. Supernatants were further centrifuged for 20 min at 16,500 x g and filtered through a 0.22 mm filter.Microvesicles were then pelleted by ultracentrifugation at 110,000 x g for 70 min. The microvesicle pellets were washedin 13 ml PBS, pelleted again and resuspended in PBS.[0086] Isolated microvesicles were measured for their total protein content using DC Protein Assay (Bio-Rad, Hercules,CA, USA).[0087] For the extraction of RNA from microvesicles, RNase A (Fermentas, Glen Burnie, MD, USA) at a final concen-tration of 100 mg/ml was added to suspensions of microvesicles and incubated for 15 min at 37°C to get rid of RNAoutside of the microvesicles and thus ensure that the extracted RNA would come from inside the microvesicles. TotalRNA was then extracted from the microvesicles using the MirVana RNA isolation kit (Ambion, Austin TX, USA) according
EP 2 604 704 A1
18
5
10
15
20
25
30
35
40
45
50
55
to the manufacturer’s protocol. After treatment with DNAse according to the manufacturer’s protocol, the total RNA wasquantified using a nanodrop ND-1000 instrument (Thermo Fischer Scientific, Wilmington, DE, USA).[0088] Glioblastoma microvesicles were found to contain RNA and protein in a ratio of approximately 1:80 (mg RNA:mg protein). The average yield of proteins and RNAs isolated from microvesicles over a 48-hour period in culture wasaround 4 mg protein and 50 ng RNA/million cells.[0089] To confirm that the RNA was contained inside the microvesicles, microvesicles were either exposed to RNaseA or mock treatment before RNA extraction (FIG. 1c). There was never more than a 7% decrease in RNA contentfollowing RNase treatment. Thus, it appears that almost all of the extracellular RNA from the media is contained withinthe microvesicles and is thereby protected from external RNases by the surrounding vesicular membrane.[0090] Total RNA from microvesicles and their donor cells were analyzed with a Bioanalyzer, showing that the micro-vesicles contain a broad range of RNA sizes consistent with a variety of mRNAs and miRNAs, but lack 18S and 28Sthe ribosomal RNA peaks characteristic of cellular RNA (FIGS. 1d and 1e).
Example 3: Microvesicles contain DNA.
[0091] To test if microvesicles also contain DNA, exosomes were isolated as mentioned in Example 2 and then treatedwith DNase before being lysed to release contents. The DNase treatment step was to remove DNA outside of theexosomes so that only DNA residing inside the exosomes was extracted. Specifically, the DNase treatment was performedusing the DNA-free kit from Ambion according to manufacturer’s recommendations (Catalog#AM1906). For the DNApurification step, an aliquot of isolated exosomes was lysed in 300ml lysis buffer that was part of the MirVana RNAisolation kit (Ambion) and the DNAs were purified from the lysed mixture using a DNA purification kit (Qiagen) accordingto the manufacturer’s recommendation.[0092] To examine whether the extracted DNA contains common genes, PCRs were performed using primer pairsspecific to GAPDH, Human endogenous retrovirus K, Tenascin-c and Line-1. For the GAPDH gene, the following primerswere used: Forw3GAPDHnew (SEQ ID NO: 1) and Rev3GAPDHnew (SEQ ID NO: 2). The primer pair amplifies a 112bpamplicon if the template is a spliced GAPDH cDNA and a 216bp amplicon if the template is an un-spliced genomicGAPDH DNA. In one experiment, isolated exosomes were treated with DNase before being lysed for DNA extraction(FIG. 3a). The 112bp fragments were amplified as expected from the exosomes from the tumor serum (See Lane 4 inFIG. 3a) and the primary tumor cells (See Lane 6 in FIG. 3a) but not from the exosomes from normal human fibroblasts(See Lane 5 in FIG. 3a). The 216bp fragment could not be amplified from exosomes of all three origins. However,fragments of both 112bp and 216bp were amplified when the genomic DNA isolated from the glioblastoma cell was usedas templates (See Lane 3 in FIG. 3a). Thus, spliced GAPDH DNA exists within exosomes isolated from tumor cells butnot within exosomes isolated from normal fibroblast cells.[0093] In contrast, in another experiment, isolated exosomes were not treated with DNase before being lysed for DNAextraction (FIG. 3b). Not only the 112bp fragments but also the 216bp fragments were amplified from exosomes isolatedfrom primary melanoma cells (See Lane 3 in FIG. 3b), suggesting that non-spliced GAPDH DNA or partially splicedcDNA that has been reverse transcribed exists outside of the exosomes.[0094] For the Human Endogenous Retrovirus K (HERV-K) gene, the following primers were used: HERVK_6Forw(SEQ ID NO: 3) and HERVK_6Rev (SEQ ID NO: 4). The primer pair amplifies a 172bp amplicon. DNA was extractedfrom exosomes that were isolated and treated with DNase, and used as the template for PCR amplification. As shownin FIG. 3c, 172bp fragments were amplified in all tumor and normal human serum exosomes but not in exosomes fromnormal human fibroblasts. These data suggest that unlike exosomes from normal human fibroblasts, tumor and normalhuman serum exosomes contain endogenous retrovirus DNA sequences. To examine if tumor exosomes also containtransposable elements, the following LINE-1 specific primers were used for PCR amplifications: Linel_Forw (SEQ IDNO: 5) and Line1_Rev (SEQ ID NO: 6). These two primers are designed to detect LINE-1 in all species since eachprimer contains equal amounts of two different oligos. For the Line1_Forw primer, one oligo contains a C and the otheroligo contains a G at the position designated with "s". For the Line1_Rev primer, one oligo contains an A and the otheroligo contains a G at the position designated with "r". The primer pair amplifies a 290bp amplicon. The template wasthe DNA extracted from exosomes that were treated with DNase (as described above). As shown in FIG. 3e, 290bpLINE-1 fragments could be amplified from the exosomes from tumor cells and normal human serum but not from exosomesfrom the normal human fibroblasts.[0095] To test if exosomes also contain Tenascin-C DNA, the following primer pair was used to perform PCR: TenascinC Forw (SEQ ID NO: 7) and Tenascin C Rev (SEQ ID NO: 8). The primer pair amplifies a 197bp amplicon. The templatewas the DNA extracted from exosomes that were isolated and then treated with DNase before lysis. As shown in FIG.3d, 197bp Tenascin C fragments were amplified in exosomes from tumor cells or normal human serum but not inexosomes from normal human fibroblasts. Thus, Tenascin-C DNA exists in tumor and normal human serum exosomesbut not in exosomes from normal human fibroblasts.[0096] To further confirm the presence of DNA in exosomes, exosomal DNA was extracted from D425 medulloblastoma
EP 2 604 704 A1
19
5
10
15
20
25
30
35
40
45
50
55
cells using the method described above. Specifically, the exosomes were isolated and treated with DNase before lysis.Equal volumes of the final DNA extract were either treated with DNase or not treated with DNase before being visualizedby Ethidium Bromide staining in 1% agarose gel. Ethidium Bromide is a dye that specifically stains nucleic acids andcan be visualized under ultraviolet light. As shown in FIG. 3f, Ethidium Bromide staining disappeared after DNasetreatment (See Lane 3 in FIG. 3f) while strong staining could be visualized in the un-treated aliquot (See Lane 2 in FIG.3f). The DNase treated and non-treated extracts were also analyzed on a RNA pico chip (Agilent Technologies). Asshown in FIG. 3g, single stranded DNA could be readily detected in the DNase-non-treated extract (See upper panel inFIG. 3g) but could barely be detected in the DNase-treated extract (See lower panel in FIG. 3g).[0097] To test whether the extracted DNA was single-stranded, nucleic acids were extracted from the treated exosomesas described in the previous paragraph and further treated with RNAse to eliminate any RNA contamination. The treatednucleic acids were then analyzed on a RNA pico Bioanalyzer chip and in a DNA 1000 chip. The RNA pico chip onlydetects single stranded nucleic acids. The DNA 1000 chip detected double stranded nucleic acids. As shown in FIG.3h, single stranded nucleic acids were detected (See upper panel) but double stranded nucleic acids were not detected(See lower panel). Thus, the DNA contained within tumor exosomes are mostly single stranded.[0098] To demonstrate that single stranded DNA exists in tumor cells but not in normal human fibroblasts, nucleicacids were extracted from exosomes from either glioblastoma patient serum or normal human fibroblasts. The exosomeswere treated with DNase before lysis and the purified nucleic acids were treated with RNase before analysis. As shownin FIG. 3i, exosomal nucleic acids extracted from glioblastoma patient serum could be detected by a RNA pico chip. Incontrast, only a very small amount of single stranded DNA was extracted from normal human fibroblasts.[0099] Accordingly, exosomes from tumor cells and normal human serum were found to contain contain single-strandedDNA. The single-stranded DNA is a reverse transcription product since the amplification products do not contain introns(FIG. 3a and FIG. 3b). It is known that tumor cells as well as normal progenitor cells/stem cells have active reversetranscriptase (RT) activity although the activity in normal progenitor cells/stem cells is relatively much lower. This RTactivity makes it plausible that RNA transcripts in the cell can be reverse transcribed and packaged into exosomes ascDNA. Interestingly, exosomes from tumor cells contain more cDNAs corresponding to tumor-specific gene transcriptssince tumor cells usually have up-regulated reverse transcriptase activity. Therefore, tumor specific cDNA in exosomesmay be used as biomarkers for the diagnosis or prognosis of different tumor types. The use of cDNAs as biomarkerswould skip the step of reverse transcription compared to the used of mRNA as biomarkers for tumors. In addition, theuse of exosomal cDNA is advantageous over the use of whole serum/plasma DNA because serum/plasma containsgenomic DNA released from dying cells. When testing amplified whole serum/plasma DNA, there will be more background.
Example 4: Most extracellular RNA in human serum is contained within exosomes.
[0100] To determine the amount of RNA circulating in serum as "free RNA"/RNA-protein complex versus the amountof RNA contained within the exosomes, we isolated serum from a healthy human subject, and evenly split the seruminto two samples with equal volume. For sample 1, the serum was ultracentrifuged to remove most microvesicles. Thenthe serum supernatant was collected and RNA left in the supernatant was extracted using Trizol LS. For sample 2, theserum was not ultracentrifuged and total RNA was extracted from the serum using Trizol LS. The amount of RNA in thesample 1 supernatant and sample 2 serum was measured. As a result, it was found that the amount of free RNA insample 1 supernatant was less than 10% of the amount of total RNA isolated from the serum sample 2. Therefore, amajority of the RNA in serum is associated with the exosomes.
Example 5: High efficiency of serum extracellular nucleic acid extraction is achieved by incorporating a serum exosome isolation step.
[0101] Whole serum and plasma contain large amounts of circulating DNA and possibly also RNA protected in proteincomplexes, while free RNA have a half-life of a few minutes in serum. Extracellular nucleic acid profiles in serum varybetween normal and diseased mammals and thus may be biomarkers for certain diseases. To examine the profiles,nucleic acids need to be extracted. However, direct extraction of nucleic acids from serum and plasma is not practical,especially from large serum/plasma volumes. In this case, large volumes of Trizol LS (a RNA extraction reagent) areused to instantly inactivate all serum nucleases before extracting the exosomal nucleic acids. Subsequently, contaminantsprecipitate into the sample and affect subsequent analyses. As shown in Example 4, most extracellular RNAs in serumare contained in serum exosomes. Therefore, we tested whether it is more efficient to isolate extracellular nucleic acidsby isolating the serum exosomes before nucleic acid extraction.[0102] Four milliliter (ml) blood serum from a patient was split into 2 aliquots of 2 ml each. Serum exosomes from onealiquot were isolated prior to RNA extraction. The methods of exosome isolation and RNA extraction are the same asmentioned in Example 2. For the other aliquot, RNA was extracted directly using Trizol LS according to manufacturer’srecommendation. The nucleic acids from these two extractions were analyzed on a Bioanalyzer RNA chip (Agilent
EP 2 604 704 A1
20
5
10
15
20
25
30
35
40
45
50
55
Technologies). As shown in Figure 4, the amount of RNA extracted with the former method is significantly more thanthat obtained from the latter method. Further, the quality of RNA extracted with the latter method is relatively poorcompared to that with the former method. Thus, the step of exosome isolation contributes to the efficiency of extracellularRNA extraction from serum.
Example 6: Microarray analysis of mRNA.
[0103] Microarray analysis of the mRNA population in glioblastoma cells and microvesicles derived from them wasperformed by Miltenyi Biotech (Auburn, CA, USA) using the Agilent Whole Human Genome Microarray, 4x44K, two colorarray. The microarray analysis was performed on two different RNA preparations from primary glioblastoma cells andtheir corresponding microvesicles RNA preparations prepared as described in Examples 1 and 2. The data was analyzedusing the GeneSifter software (Vizxlabs, Seattle, WA, USA). The Intersector software (Vizxlabs) was used to extract thegenes readily detected on both arrays. The microarray data have been deposited in NCBI’s Gene Expression Omnibusand are accessible through GEO series accession number GSE13470.[0104] We found approximately 22,000 gene transcripts in the cells and 27,000 gene transcripts in the microvesiclesthat were detected well above background levels (99% confidence interval) on both arrays. Approximately 4,700 differentmRNAs were detected exclusively in microvesicles on both arrays, indicating a selective enrichment process within themicrovesicles. Consistent with this, there was a poor overall correlation in levels of mRNAs in the microvesicles ascompared to their cells of origin from two tumor cell preparations (FIGS. 2a and 2b). In contrast, there was a goodcorrelation in levels of mRNA from one cell culture (A) versus the second cell culture (B) (FIG. 2c) and a similar correlationin levels of mRNA from the corresponding microvesicles (A) and (B) (FIG. 2d). Accordingly, there is a consistency ofmRNA distribution within the tumor cells and microvesicles. In comparing the ratio of transcripts in the microvesiclesversus their cells of origin, we found 3,426 transcripts differentially distributed more than 5-fold (p-value <0.01). Of these,2,238 transcripts were enriched (up to 380 fold) and 1,188 transcripts were less abundant (up to 90 fold) than in thecells (FIG. 5). The intensities and ratios of all gene transcripts were documented. The ontologies of mRNA transcriptsenriched or reduced more than 10-fold were recorded and reviewed.[0105] The mRNA transcripts that were highly enriched in the microvesicles were not always the ones that were mostabundant in the microvesicles. The most abundant transcripts would be more likely to generate an effect in the recipientcell upon delivery, and therefore the 500 most abundant mRNA transcripts present in microvesicles were divided intodifferent biological processes based on their ontology descriptions (FIG. 6a). Of the various ontologies, angiogenesis,cell proliferation, immune response, cell migration and histone modification were selected for further study as theyrepresent specific functions that could be involved in remodeling the tumor stroma and enhancing tumor growth. Gliob-lastoma microvesicle mRNAs belonging to these five ontologies were plotted to compare their levels and contributionto the mRNA spectrum (FIG. 6b). All five ontologies contained mRNAs with very high expression levels compared tothe median signal intensity level of the array.[0106] A thorough analysis of mRNAs that are enriched in the microvesicles versus donor cells, suggests that theremay be a cellular mechanism for localizing these messages into microvesicles, possibly via a "zip code" in the 3’UTRas described for mRNAs translated in specific cellular locations, such as that for beta actin (Kislauskis et al., 1994). Theconformation of the mRNAs in the microvesicles is not known, but they may be present as ribonuclear particles (RNPs)(Mallardo et al., 2003) which would then prevent degradation and premature translation in the donor cell.[0107] Microarray analysis of the mRNA populations in glioblastoma cells and microvesicles derived from glioblastomacells, melanoma cells, and microvesicles derived from melanoma cells was performed by Illumina Inc. (San Diego, CA,USA) using the Whole-Genome cDNA-mediated Annealing, Selection, Extension, and Ligation (DASL) Assay. TheWhole-Genome DASL Assay combines the PCR and labeling steps of Illumina’s DASL Assay with the gene-basedhybridization and whole-genome probe set of Illumina’s HumanRef-8 BeadChip. This BeadChip covers more than 24,000annotated genes derived from RefSeq (Build 36.2, Release 22). The microarray analysis was performed on two differentRNA preparations from primary glioblastoma cells, microvesicles from glioblastomas cells (derived with the method asdescribed in Examples 1 and 2), melanoma cells, and microvesicles from melanoma cells (derived with the method asdescribed in Examples 1 and 2).[0108] The expression data for each RNA preparation were pooled together and used to generate a cluster diagram.As shown in FIG. 7, mRNA expression profiles for glioblastoma cells, microvesicles from glioblastomas cells, melanomacells, and microvesicles from melanoma cells are clustered together, respectively. Expression profiles of the two primaryglioblastoma cell lines 20/3C and 11/5c are clustered with a distance of about 0.06. Expression profiles of the two primarymelanoma cell lines 0105C and 0664C are clustered with a distance of about 0.09. Expression profiles of exosomesfrom the two primary melanoma cell lines 0105C and 0664C are clustered together with a distance of around 0.15.Expression profiles of exosomes from the two primary glioblastomas cell lines 20/3C and 11/5c are clustered togetherwith a distance of around 0.098. Thus, exosomes from glioblastoma and melanoma have distinctive mRNA expressionsignatures and the gene expression signature of exosomes differs from that of their original cells. These data demonstrate
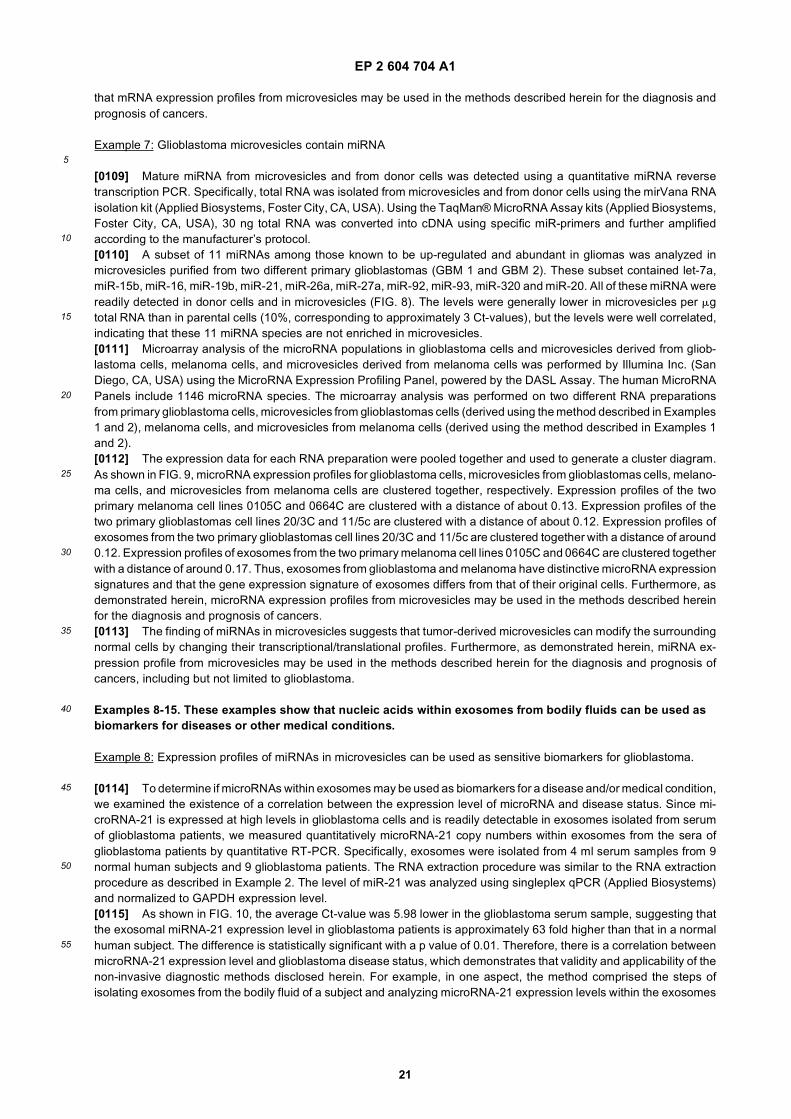
EP 2 604 704 A1
21
5
10
15
20
25
30
35
40
45
50
55
that mRNA expression profiles from microvesicles may be used in the methods described herein for the diagnosis andprognosis of cancers.
Example 7: Glioblastoma microvesicles contain miRNA
[0109] Mature miRNA from microvesicles and from donor cells was detected using a quantitative miRNA reversetranscription PCR. Specifically, total RNA was isolated from microvesicles and from donor cells using the mirVana RNAisolation kit (Applied Biosystems, Foster City, CA, USA). Using the TaqMan® MicroRNA Assay kits (Applied Biosystems,Foster City, CA, USA), 30 ng total RNA was converted into cDNA using specific miR-primers and further amplifiedaccording to the manufacturer’s protocol.[0110] A subset of 11 miRNAs among those known to be up-regulated and abundant in gliomas was analyzed inmicrovesicles purified from two different primary glioblastomas (GBM 1 and GBM 2). These subset contained let-7a,miR-15b, miR-16, miR-19b, miR-21, miR-26a, miR-27a, miR-92, miR-93, miR-320 and miR-20. All of these miRNA werereadily detected in donor cells and in microvesicles (FIG. 8). The levels were generally lower in microvesicles per mgtotal RNA than in parental cells (10%, corresponding to approximately 3 Ct-values), but the levels were well correlated,indicating that these 11 miRNA species are not enriched in microvesicles.[0111] Microarray analysis of the microRNA populations in glioblastoma cells and microvesicles derived from gliob-lastoma cells, melanoma cells, and microvesicles derived from melanoma cells was performed by Illumina Inc. (SanDiego, CA, USA) using the MicroRNA Expression Profiling Panel, powered by the DASL Assay. The human MicroRNAPanels include 1146 microRNA species. The microarray analysis was performed on two different RNA preparationsfrom primary glioblastoma cells, microvesicles from glioblastomas cells (derived using the method described in Examples1 and 2), melanoma cells, and microvesicles from melanoma cells (derived using the method described in Examples 1and 2).[0112] The expression data for each RNA preparation were pooled together and used to generate a cluster diagram.As shown in FIG. 9, microRNA expression profiles for glioblastoma cells, microvesicles from glioblastomas cells, melano-ma cells, and microvesicles from melanoma cells are clustered together, respectively. Expression profiles of the twoprimary melanoma cell lines 0105C and 0664C are clustered with a distance of about 0.13. Expression profiles of thetwo primary glioblastomas cell lines 20/3C and 11/5c are clustered with a distance of about 0.12. Expression profiles ofexosomes from the two primary glioblastomas cell lines 20/3C and 11/5c are clustered together with a distance of around0.12. Expression profiles of exosomes from the two primary melanoma cell lines 0105C and 0664C are clustered togetherwith a distance of around 0.17. Thus, exosomes from glioblastoma and melanoma have distinctive microRNA expressionsignatures and that the gene expression signature of exosomes differs from that of their original cells. Furthermore, asdemonstrated herein, microRNA expression profiles from microvesicles may be used in the methods described hereinfor the diagnosis and prognosis of cancers.[0113] The finding of miRNAs in microvesicles suggests that tumor-derived microvesicles can modify the surroundingnormal cells by changing their transcriptional/translational profiles. Furthermore, as demonstrated herein, miRNA ex-pression profile from microvesicles may be used in the methods described herein for the diagnosis and prognosis ofcancers, including but not limited to glioblastoma.
Examples 8-15. These examples show that nucleic acids within exosomes from bodily fluids can be used as biomarkers for diseases or other medical conditions.
Example 8: Expression profiles of miRNAs in microvesicles can be used as sensitive biomarkers for glioblastoma.
[0114] To determine if microRNAs within exosomes may be used as biomarkers for a disease and/or medical condition,we examined the existence of a correlation between the expression level of microRNA and disease status. Since mi-croRNA-21 is expressed at high levels in glioblastoma cells and is readily detectable in exosomes isolated from serumof glioblastoma patients, we measured quantitatively microRNA-21 copy numbers within exosomes from the sera ofglioblastoma patients by quantitative RT-PCR. Specifically, exosomes were isolated from 4 ml serum samples from 9normal human subjects and 9 glioblastoma patients. The RNA extraction procedure was similar to the RNA extractionprocedure as described in Example 2. The level of miR-21 was analyzed using singleplex qPCR (Applied Biosystems)and normalized to GAPDH expression level.[0115] As shown in FIG. 10, the average Ct-value was 5.98 lower in the glioblastoma serum sample, suggesting thatthe exosomal miRNA-21 expression level in glioblastoma patients is approximately 63 fold higher than that in a normalhuman subject. The difference is statistically significant with a p value of 0.01. Therefore, there is a correlation betweenmicroRNA-21 expression level and glioblastoma disease status, which demonstrates that validity and applicability of thenon-invasive diagnostic methods disclosed herein. For example, in one aspect, the method comprised the steps ofisolating exosomes from the bodily fluid of a subject and analyzing microRNA-21 expression levels within the exosomes
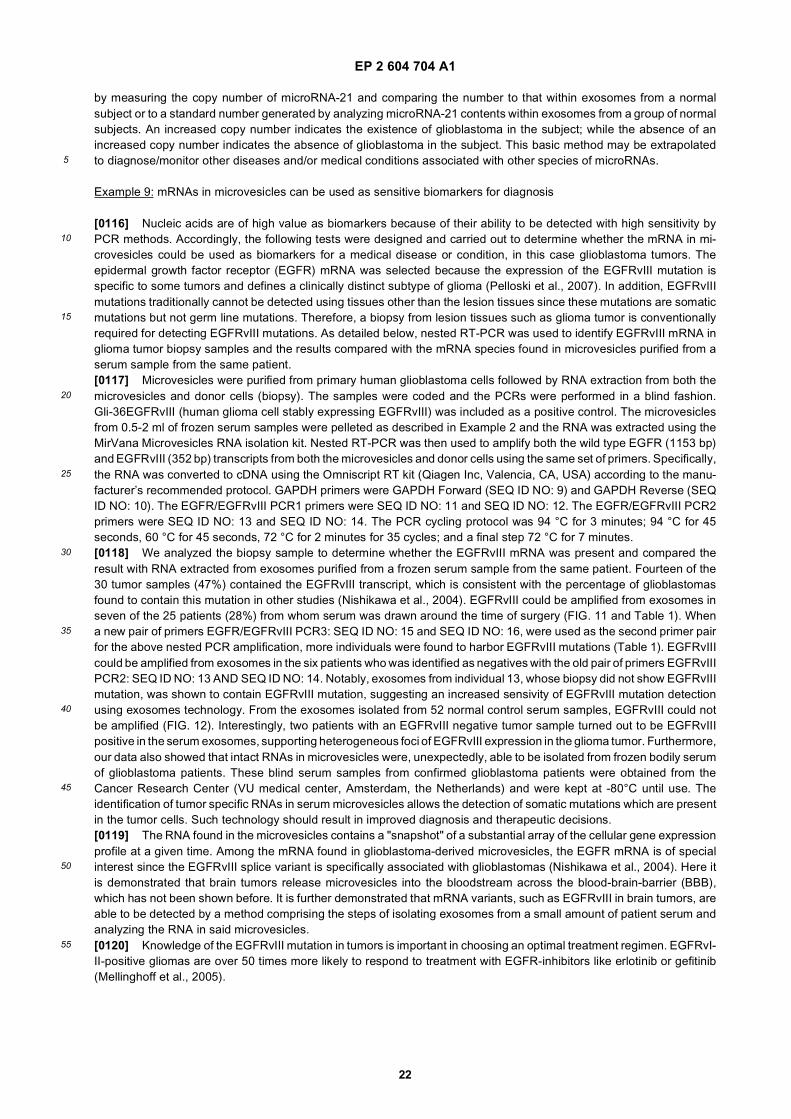
EP 2 604 704 A1
22
5
10
15
20
25
30
35
40
45
50
55
by measuring the copy number of microRNA-21 and comparing the number to that within exosomes from a normalsubject or to a standard number generated by analyzing microRNA-21 contents within exosomes from a group of normalsubjects. An increased copy number indicates the existence of glioblastoma in the subject; while the absence of anincreased copy number indicates the absence of glioblastoma in the subject. This basic method may be extrapolatedto diagnose/monitor other diseases and/or medical conditions associated with other species of microRNAs.
Example 9: mRNAs in microvesicles can be used as sensitive biomarkers for diagnosis
[0116] Nucleic acids are of high value as biomarkers because of their ability to be detected with high sensitivity byPCR methods. Accordingly, the following tests were designed and carried out to determine whether the mRNA in mi-crovesicles could be used as biomarkers for a medical disease or condition, in this case glioblastoma tumors. Theepidermal growth factor receptor (EGFR) mRNA was selected because the expression of the EGFRvIII mutation isspecific to some tumors and defines a clinically distinct subtype of glioma (Pelloski et al., 2007). In addition, EGFRvIIImutations traditionally cannot be detected using tissues other than the lesion tissues since these mutations are somaticmutations but not germ line mutations. Therefore, a biopsy from lesion tissues such as glioma tumor is conventionallyrequired for detecting EGFRvIII mutations. As detailed below, nested RT-PCR was used to identify EGFRvIII mRNA inglioma tumor biopsy samples and the results compared with the mRNA species found in microvesicles purified from aserum sample from the same patient.[0117] Microvesicles were purified from primary human glioblastoma cells followed by RNA extraction from both themicrovesicles and donor cells (biopsy). The samples were coded and the PCRs were performed in a blind fashion.Gli-36EGFRvIII (human glioma cell stably expressing EGFRvIII) was included as a positive control. The microvesiclesfrom 0.5-2 ml of frozen serum samples were pelleted as described in Example 2 and the RNA was extracted using theMirVana Microvesicles RNA isolation kit. Nested RT-PCR was then used to amplify both the wild type EGFR (1153 bp)and EGFRvIII (352 bp) transcripts from both the microvesicles and donor cells using the same set of primers. Specifically,the RNA was converted to cDNA using the Omniscript RT kit (Qiagen Inc, Valencia, CA, USA) according to the manu-facturer’s recommended protocol. GAPDH primers were GAPDH Forward (SEQ ID NO: 9) and GAPDH Reverse (SEQID NO: 10). The EGFR/EGFRvIII PCR1 primers were SEQ ID NO: 11 and SEQ ID NO: 12. The EGFR/EGFRvIII PCR2primers were SEQ ID NO: 13 and SEQ ID NO: 14. The PCR cycling protocol was 94 °C for 3 minutes; 94 °C for 45seconds, 60 °C for 45 seconds, 72 °C for 2 minutes for 35 cycles; and a final step 72 °C for 7 minutes.[0118] We analyzed the biopsy sample to determine whether the EGFRvIII mRNA was present and compared theresult with RNA extracted from exosomes purified from a frozen serum sample from the same patient. Fourteen of the30 tumor samples (47%) contained the EGFRvIII transcript, which is consistent with the percentage of glioblastomasfound to contain this mutation in other studies (Nishikawa et al., 2004). EGFRvIII could be amplified from exosomes inseven of the 25 patients (28%) from whom serum was drawn around the time of surgery (FIG. 11 and Table 1). Whena new pair of primers EGFR/EGFRvIII PCR3: SEQ ID NO: 15 and SEQ ID NO: 16, were used as the second primer pairfor the above nested PCR amplification, more individuals were found to harbor EGFRvIII mutations (Table 1). EGFRvIIIcould be amplified from exosomes in the six patients who was identified as negatives with the old pair of primers EGFRvIIIPCR2: SEQ ID NO: 13 AND SEQ ID NO: 14. Notably, exosomes from individual 13, whose biopsy did not show EGFRvIIImutation, was shown to contain EGFRvIII mutation, suggesting an increased sensivity of EGFRvIII mutation detectionusing exosomes technology. From the exosomes isolated from 52 normal control serum samples, EGFRvIII could notbe amplified (FIG. 12). Interestingly, two patients with an EGFRvIII negative tumor sample turned out to be EGFRvIIIpositive in the serum exosomes, supporting heterogeneous foci of EGFRvIII expression in the glioma tumor. Furthermore,our data also showed that intact RNAs in microvesicles were, unexpectedly, able to be isolated from frozen bodily serumof glioblastoma patients. These blind serum samples from confirmed glioblastoma patients were obtained from theCancer Research Center (VU medical center, Amsterdam, the Netherlands) and were kept at -80°C until use. Theidentification of tumor specific RNAs in serum microvesicles allows the detection of somatic mutations which are presentin the tumor cells. Such technology should result in improved diagnosis and therapeutic decisions.[0119] The RNA found in the microvesicles contains a "snapshot" of a substantial array of the cellular gene expressionprofile at a given time. Among the mRNA found in glioblastoma-derived microvesicles, the EGFR mRNA is of specialinterest since the EGFRvIII splice variant is specifically associated with glioblastomas (Nishikawa et al., 2004). Here itis demonstrated that brain tumors release microvesicles into the bloodstream across the blood-brain-barrier (BBB),which has not been shown before. It is further demonstrated that mRNA variants, such as EGFRvIII in brain tumors, areable to be detected by a method comprising the steps of isolating exosomes from a small amount of patient serum andanalyzing the RNA in said microvesicles.[0120] Knowledge of the EGFRvIII mutation in tumors is important in choosing an optimal treatment regimen. EGFRvI-II-positive gliomas are over 50 times more likely to respond to treatment with EGFR-inhibitors like erlotinib or gefitinib(Mellinghoff et al., 2005).
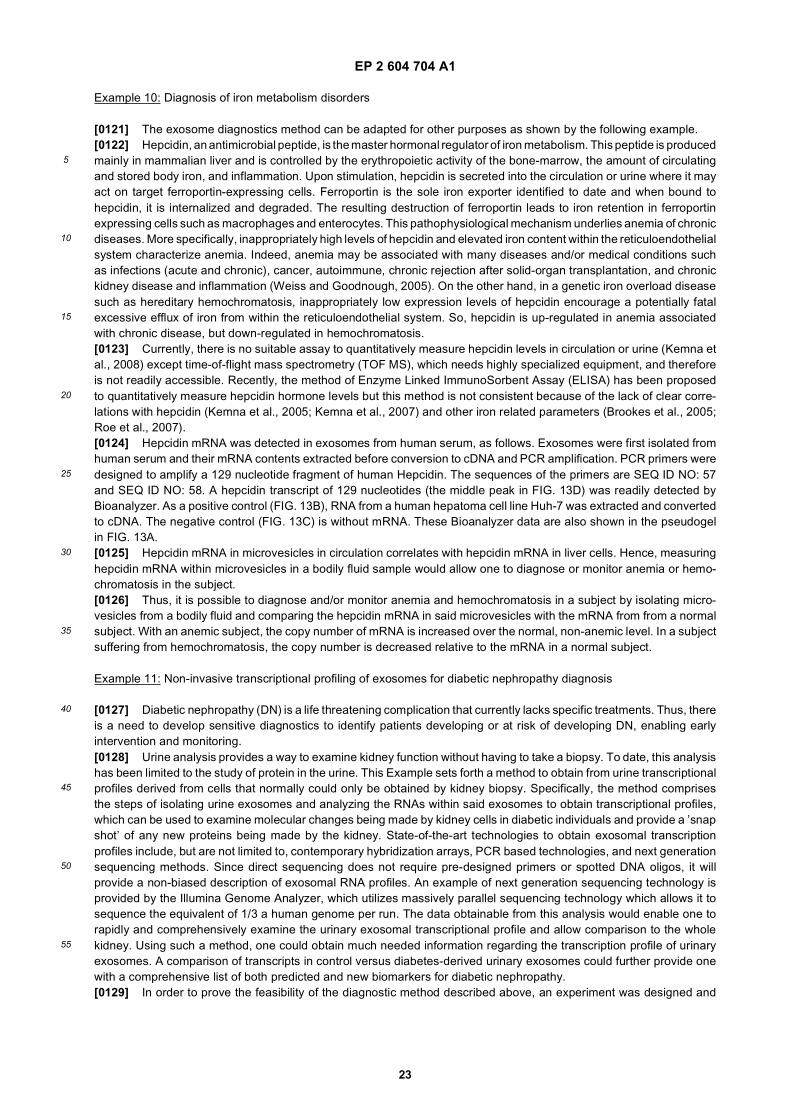
EP 2 604 704 A1
23
5
10
15
20
25
30
35
40
45
50
55
Example 10: Diagnosis of iron metabolism disorders
[0121] The exosome diagnostics method can be adapted for other purposes as shown by the following example.[0122] Hepcidin, an antimicrobial peptide, is the master hormonal regulator of iron metabolism. This peptide is producedmainly in mammalian liver and is controlled by the erythropoietic activity of the bone-marrow, the amount of circulatingand stored body iron, and inflammation. Upon stimulation, hepcidin is secreted into the circulation or urine where it mayact on target ferroportin-expressing cells. Ferroportin is the sole iron exporter identified to date and when bound tohepcidin, it is internalized and degraded. The resulting destruction of ferroportin leads to iron retention in ferroportinexpressing cells such as macrophages and enterocytes. This pathophysiological mechanism underlies anemia of chronicdiseases. More specifically, inappropriately high levels of hepcidin and elevated iron content within the reticuloendothelialsystem characterize anemia. Indeed, anemia may be associated with many diseases and/or medical conditions suchas infections (acute and chronic), cancer, autoimmune, chronic rejection after solid-organ transplantation, and chronickidney disease and inflammation (Weiss and Goodnough, 2005). On the other hand, in a genetic iron overload diseasesuch as hereditary hemochromatosis, inappropriately low expression levels of hepcidin encourage a potentially fatalexcessive efflux of iron from within the reticuloendothelial system. So, hepcidin is up-regulated in anemia associatedwith chronic disease, but down-regulated in hemochromatosis.[0123] Currently, there is no suitable assay to quantitatively measure hepcidin levels in circulation or urine (Kemna etal., 2008) except time-of-flight mass spectrometry (TOF MS), which needs highly specialized equipment, and thereforeis not readily accessible. Recently, the method of Enzyme Linked ImmunoSorbent Assay (ELISA) has been proposedto quantitatively measure hepcidin hormone levels but this method is not consistent because of the lack of clear corre-lations with hepcidin (Kemna et al., 2005; Kemna et al., 2007) and other iron related parameters (Brookes et al., 2005;Roe et al., 2007).[0124] Hepcidin mRNA was detected in exosomes from human serum, as follows. Exosomes were first isolated fromhuman serum and their mRNA contents extracted before conversion to cDNA and PCR amplification. PCR primers weredesigned to amplify a 129 nucleotide fragment of human Hepcidin. The sequences of the primers are SEQ ID NO: 57and SEQ ID NO: 58. A hepcidin transcript of 129 nucleotides (the middle peak in FIG. 13D) was readily detected byBioanalyzer. As a positive control (FIG. 13B), RNA from a human hepatoma cell line Huh-7 was extracted and convertedto cDNA. The negative control (FIG. 13C) is without mRNA. These Bioanalyzer data are also shown in the pseudogelin FIG. 13A.[0125] Hepcidin mRNA in microvesicles in circulation correlates with hepcidin mRNA in liver cells. Hence, measuringhepcidin mRNA within microvesicles in a bodily fluid sample would allow one to diagnose or monitor anemia or hemo-chromatosis in the subject.[0126] Thus, it is possible to diagnose and/or monitor anemia and hemochromatosis in a subject by isolating micro-vesicles from a bodily fluid and comparing the hepcidin mRNA in said microvesicles with the mRNA from from a normalsubject. With an anemic subject, the copy number of mRNA is increased over the normal, non-anemic level. In a subjectsuffering from hemochromatosis, the copy number is decreased relative to the mRNA in a normal subject.
Example 11: Non-invasive transcriptional profiling of exosomes for diabetic nephropathy diagnosis
[0127] Diabetic nephropathy (DN) is a life threatening complication that currently lacks specific treatments. Thus, thereis a need to develop sensitive diagnostics to identify patients developing or at risk of developing DN, enabling earlyintervention and monitoring.[0128] Urine analysis provides a way to examine kidney function without having to take a biopsy. To date, this analysishas been limited to the study of protein in the urine. This Example sets forth a method to obtain from urine transcriptionalprofiles derived from cells that normally could only be obtained by kidney biopsy. Specifically, the method comprisesthe steps of isolating urine exosomes and analyzing the RNAs within said exosomes to obtain transcriptional profiles,which can be used to examine molecular changes being made by kidney cells in diabetic individuals and provide a ’snapshot’ of any new proteins being made by the kidney. State-of-the-art technologies to obtain exosomal transcriptionprofiles include, but are not limited to, contemporary hybridization arrays, PCR based technologies, and next generationsequencing methods. Since direct sequencing does not require pre-designed primers or spotted DNA oligos, it willprovide a non-biased description of exosomal RNA profiles. An example of next generation sequencing technology isprovided by the Illumina Genome Analyzer, which utilizes massively parallel sequencing technology which allows it tosequence the equivalent of 1/3 a human genome per run. The data obtainable from this analysis would enable one torapidly and comprehensively examine the urinary exosomal transcriptional profile and allow comparison to the wholekidney. Using such a method, one could obtain much needed information regarding the transcription profile of urinaryexosomes. A comparison of transcripts in control versus diabetes-derived urinary exosomes could further provide onewith a comprehensive list of both predicted and new biomarkers for diabetic nephropathy.[0129] In order to prove the feasibility of the diagnostic method described above, an experiment was designed and
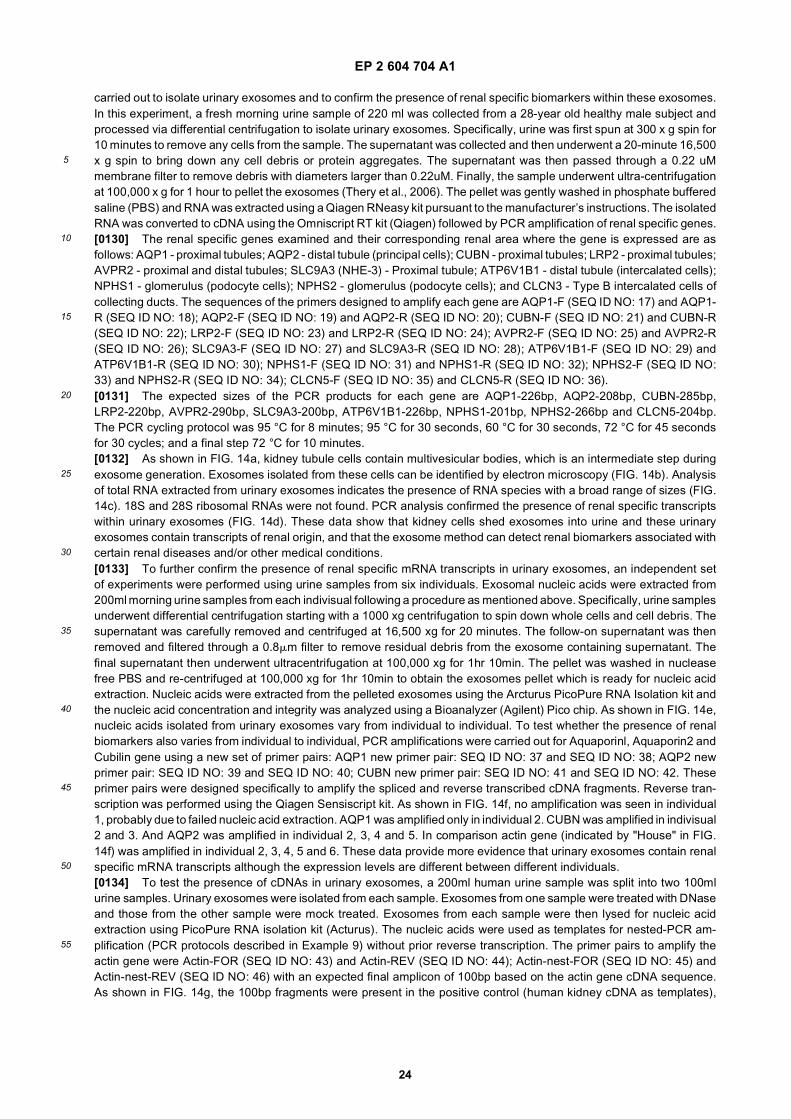
EP 2 604 704 A1
24
5
10
15
20
25
30
35
40
45
50
55
carried out to isolate urinary exosomes and to confirm the presence of renal specific biomarkers within these exosomes.In this experiment, a fresh morning urine sample of 220 ml was collected from a 28-year old healthy male subject andprocessed via differential centrifugation to isolate urinary exosomes. Specifically, urine was first spun at 300 x g spin for10 minutes to remove any cells from the sample. The supernatant was collected and then underwent a 20-minute 16,500x g spin to bring down any cell debris or protein aggregates. The supernatant was then passed through a 0.22 uMmembrane filter to remove debris with diameters larger than 0.22uM. Finally, the sample underwent ultra-centrifugationat 100,000 x g for 1 hour to pellet the exosomes (Thery et al., 2006). The pellet was gently washed in phosphate bufferedsaline (PBS) and RNA was extracted using a Qiagen RNeasy kit pursuant to the manufacturer’s instructions. The isolatedRNA was converted to cDNA using the Omniscript RT kit (Qiagen) followed by PCR amplification of renal specific genes.[0130] The renal specific genes examined and their corresponding renal area where the gene is expressed are asfollows: AQP1 - proximal tubules; AQP2 - distal tubule (principal cells); CUBN - proximal tubules; LRP2 - proximal tubules;AVPR2 - proximal and distal tubules; SLC9A3 (NHE-3) - Proximal tubule; ATP6V1B1 - distal tubule (intercalated cells);NPHS1 - glomerulus (podocyte cells); NPHS2 - glomerulus (podocyte cells); and CLCN3 - Type B intercalated cells ofcollecting ducts. The sequences of the primers designed to amplify each gene are AQP1-F (SEQ ID NO: 17) and AQP1-R (SEQ ID NO: 18); AQP2-F (SEQ ID NO: 19) and AQP2-R (SEQ ID NO: 20); CUBN-F (SEQ ID NO: 21) and CUBN-R(SEQ ID NO: 22); LRP2-F (SEQ ID NO: 23) and LRP2-R (SEQ ID NO: 24); AVPR2-F (SEQ ID NO: 25) and AVPR2-R(SEQ ID NO: 26); SLC9A3-F (SEQ ID NO: 27) and SLC9A3-R (SEQ ID NO: 28); ATP6V1B1-F (SEQ ID NO: 29) andATP6V1B1-R (SEQ ID NO: 30); NPHS1-F (SEQ ID NO: 31) and NPHS1-R (SEQ ID NO: 32); NPHS2-F (SEQ ID NO:33) and NPHS2-R (SEQ ID NO: 34); CLCN5-F (SEQ ID NO: 35) and CLCN5-R (SEQ ID NO: 36).[0131] The expected sizes of the PCR products for each gene are AQP1-226bp, AQP2-208bp, CUBN-285bp,LRP2-220bp, AVPR2-290bp, SLC9A3-200bp, ATP6V1B1-226bp, NPHS1-201bp, NPHS2-266bp and CLCN5-204bp.The PCR cycling protocol was 95 °C for 8 minutes; 95 °C for 30 seconds, 60 °C for 30 seconds, 72 °C for 45 secondsfor 30 cycles; and a final step 72 °C for 10 minutes.[0132] As shown in FIG. 14a, kidney tubule cells contain multivesicular bodies, which is an intermediate step duringexosome generation. Exosomes isolated from these cells can be identified by electron microscopy (FIG. 14b). Analysisof total RNA extracted from urinary exosomes indicates the presence of RNA species with a broad range of sizes (FIG.14c). 18S and 28S ribosomal RNAs were not found. PCR analysis confirmed the presence of renal specific transcriptswithin urinary exosomes (FIG. 14d). These data show that kidney cells shed exosomes into urine and these urinaryexosomes contain transcripts of renal origin, and that the exosome method can detect renal biomarkers associated withcertain renal diseases and/or other medical conditions.[0133] To further confirm the presence of renal specific mRNA transcripts in urinary exosomes, an independent setof experiments were performed using urine samples from six individuals. Exosomal nucleic acids were extracted from200ml morning urine samples from each indivisual following a procedure as mentioned above. Specifically, urine samplesunderwent differential centrifugation starting with a 1000 xg centrifugation to spin down whole cells and cell debris. Thesupernatant was carefully removed and centrifuged at 16,500 xg for 20 minutes. The follow-on supernatant was thenremoved and filtered through a 0.8mm filter to remove residual debris from the exosome containing supernatant. Thefinal supernatant then underwent ultracentrifugation at 100,000 xg for 1hr 10min. The pellet was washed in nucleasefree PBS and re-centrifuged at 100,000 xg for 1hr 10min to obtain the exosomes pellet which is ready for nucleic acidextraction. Nucleic acids were extracted from the pelleted exosomes using the Arcturus PicoPure RNA Isolation kit andthe nucleic acid concentration and integrity was analyzed using a Bioanalyzer (Agilent) Pico chip. As shown in FIG. 14e,nucleic acids isolated from urinary exosomes vary from individual to individual. To test whether the presence of renalbiomarkers also varies from individual to individual, PCR amplifications were carried out for Aquaporinl, Aquaporin2 andCubilin gene using a new set of primer pairs: AQP1 new primer pair: SEQ ID NO: 37 and SEQ ID NO: 38; AQP2 newprimer pair: SEQ ID NO: 39 and SEQ ID NO: 40; CUBN new primer pair: SEQ ID NO: 41 and SEQ ID NO: 42. Theseprimer pairs were designed specifically to amplify the spliced and reverse transcribed cDNA fragments. Reverse tran-scription was performed using the Qiagen Sensiscript kit. As shown in FIG. 14f, no amplification was seen in individual1, probably due to failed nucleic acid extraction. AQP1 was amplified only in individual 2. CUBN was amplified in indivisual2 and 3. And AQP2 was amplified in individual 2, 3, 4 and 5. In comparison actin gene (indicated by "House" in FIG.14f) was amplified in individual 2, 3, 4, 5 and 6. These data provide more evidence that urinary exosomes contain renalspecific mRNA transcripts although the expression levels are different between different individuals.[0134] To test the presence of cDNAs in urinary exosomes, a 200ml human urine sample was split into two 100mlurine samples. Urinary exosomes were isolated from each sample. Exosomes from one sample were treated with DNaseand those from the other sample were mock treated. Exosomes from each sample were then lysed for nucleic acidextraction using PicoPure RNA isolation kit (Acturus). The nucleic acids were used as templates for nested-PCR am-plification (PCR protocols described in Example 9) without prior reverse transcription. The primer pairs to amplify theactin gene were Actin-FOR (SEQ ID NO: 43) and Actin-REV (SEQ ID NO: 44); Actin-nest-FOR (SEQ ID NO: 45) andActin-nest-REV (SEQ ID NO: 46) with an expected final amplicon of 100bp based on the actin gene cDNA sequence.As shown in FIG. 14g, the 100bp fragments were present in the positive control (human kidney cDNA as templates),
EP 2 604 704 A1
25
5
10
15
20
25
30
35
40
45
50
55
DNase treated and non-treated exosomes, but absent in the negative control lane (without templates). Accordingly, actincDNA is present in both the DNase treated and non-treated urinary exosomes.[0135] To test whether most nucleic acids extracted using the method were present within exosomes, the nucleicacids extracted from the DNase treated and non-treated exosomes were dissolved in equal volumes and analyzed usinga RNA Pico chip (Agilent Technologies). As shown in FIG. 14h, the concentration of the isolated nucleic acids from theDNase treated sample was 1,131 pg/ul and that from the non-treated sample was 1,378 pg/ul. Thus, more than 80%nucleic acids extracted from urinary exosomes using the above method were from inside exosomes.[0136] To identify the content of urinary exosomes systematically, nucleic acids were extracted from urinary exosomesand submitted to the Broad Institute for sequencing. Approximately 14 million sequence reads were generated, each76 nucleotides in length. These sequence reads correspond to fragments of DNA/RNA transcripts present within urinaryexosomes. Using an extremely strict alignment parameter (100% identity over full length sequence), approximately 15%of the reads were aligned to the human genome. This percentage would likely increase if less stringent alignment criteriawas used. A majority of these 15% reads did not align with protein coding genes but rather with non-coding genomicelements such are transposons and various LINE & SINE repeat elements. Notably, for those reads that are not alignedto the human genome, many are aligned to viral sequences. To the extent that the compositions and levels of nucleicacids contained in urinary exosomes change with respect to a disease status, profiles of the nucleic acids could be usedaccording to the present methods as biomarkers for disease diagnosis.[0137] This example demonstrates that the exosome method of analyzing urine exosomes can be used to determinecellular changes in the kidney in diabetes-related kidney disease without having to take a high-risk, invasive renal biopsy.The method provides a new and sensitive diagnostic tool using exosomes for early detection of kidney diseases suchas diabetic nephropathy. This will allow immediate intervention and treatment. In sum, the exosome diagnostic methodand technology described herein provides a means of much-needed diagnostics for diabetic nephropathy and otherdiseases which are associated with certain profiles of nucleic acids contained in urinary exosomes.
Example 12: Prostate cancer diagnosis and urinary exosomes
[0138] Prostate cancer is the most common cancer in men today. The risk of prostate cancer is approximately 16%.More than 218,000 men in the United States were diagnosed in 2008. The earlier prostate cancer is detected, the greaterare the chances of successful treatment. According to the American Cancer Society, if prostate cancers are found whilethey are still in the prostate itself or nearby areas, the five-year relative survival rate is over 98%.[0139] One established diagnostic method is carried out by measuring the level of prostate specific antigen (PSA) inthe blood, combined with a digital rectal examination. However, both the sensitivity and specificity of the PSA test requiressignificant improvement. This low specificity results in a high number of false positives, which generate numerousunnecessary and expensive biopsies. Other diagnostic methods are carried out by detecting the genetic profiles of newlyidentified biomarkers including, but not limited to, prostate cancer gene 3 (PCA3) (Groskopf et al., 2006; Nakanishi etal., 2008), a fusion gene between transmembrane protease serine 2 and ETS-related gene (TMPRSS2-ERG) (Tomlinset al., 2005), glutathione S-transferase pi (Goessl et al., 2000; Gonzalgo et al., 2004), and alpha-methylacyl CoA racemase(AMACR) (Zehentner et al., 2006; Zielie et al., 2004) in prostate cancer cells found in bodily fluids such as serum andurine (Groskopf et al., 2006; Wright and Lange, 2007). Although these biomarkers may give increased specificity dueto overexpression in prostate cancer cells (e.g., PCA3 expression is increased 60- to 100-fold in prostate cancer cells),a digital rectal examination is required to milk prostate cells into the urine just before specimen collection (Nakanishi etal., 2008). Such rectal examinations have inherent disadvantages such as the bias on collecting those cancer cells thatare easily milked into urine and the involvement of medical doctors which is costly and time consuming.[0140] Here, a new method of detecting the genetic profiles of these biomarkers is proposed to overcome the limitationmentioned above. The method comprises the steps of isolating exosomes from a bodily fluid and analyzing the nucleicacid from said exosomes. The procedures of the method are similar to those detailed in Example 9. In this example, theurine samples were from four diagnosed prostate cancer patients. As shown in FIG. 15c, the cancer stages werecharacterized in terms of grade, Gleason stage and PSA levels. In addition, the nucleic acids analyzed by nested-RT-PCR as detailed in Example 7 were TMPRSS2-ERG and PCA3, two of the newly identified biomarkers of prostatecancer. For amplification of TMPRSS2-ERG, the primer pair for the first amplification step was TMPRSS2-ERG F1 (SEQID NO: 47) and TMPRSS2-ERG R1 (SEQ ID NO: 48); and the primer pair for the second amplification step was TMPRSS2-ERG F2 (SEQ ID NO: 49) and TMPRSS2-ERG R2 (SEQ ID NO: 50). The expected amplicon is 122 base pairs (bp) andgives two fragments (one is 68 bp, the other is 54 bp) after digestion with the restriction enzyme HaeII. For amplificationof PCA3, the primer pair for the first amplification step was PCA3 F1 (SEQ ID NO: 51) and PCA3 R1 (SEQ ID NO: 52);and the primer pair for the second amplification step was PCA3 F2 (SEQ ID NO: 53) and PCA3 R2 (SEQ ID NO: 54).The expected amplicon is 152 bp in length and gives two fragments (one is 90 bp, the other is 62 bp) after digestionwith the restriction enzyme Sca1.[0141] As shown in FIG. 15a, in both patient 1 and 2, but not in patient 3 and 4, the expected amplicon of TMPRSS2-ERG
EP 2 604 704 A1
26
5
10
15
20
25
30
35
40
45
50
55
could be detected and digested into two fragments of expected sizes. As shown in FIG. 15b, in all four patients, theexpected amplicon of PCA3 could be detected and digested into two fragments of expected sizes. Therefore, PCA3expression could be detected in urine samples from all four patients, while TMPRSS2-ERG expression could only bedetected in urine samples from patient 1 and 2 (FIG. 15c). These data, although not conclusive due to the small samplesize, demonstrate the applicability of the new method in detecting biomarkers of prostate cancer. Further, the exosomemethod is not limited to diagnosis but can be employed for prognosis and/or monitoring other medical conditions relatedto prostate cancer.
Example 13: Microvesicles in non-invasive prenatal diagnosis
[0142] Prenatal diagnosis is now part of established obstetric practice all over the world. Conventional methods ofobtaining fetal tissues for genetic analysis includes amniocentesis and chorionic villus sampling, both of which areinvasive and confer risk to the unborn fetus. There is a long-felt need in clinical genetics to develop methods of non-invasive diagnosis. One approach that has been investigated extensively is based on the discovery of circulating fetalcells in maternal plasma. However, there are a number of barriers that hinder its application in clinical settings. Suchbarriers include the scarcity of fetal cells (only 1.2 cells/ml maternal blood), which requires relatively large volume bloodsamples, and the long half life of residual fetal cells from previous pregnancy, which may cause false positives. Anotherapproach is based on the discovery of fetal DNA in maternal plasma. Sufficient fetal DNA amounts and short clearancetime overcome the barriers associated with the fetal cell method. Nevertheless, DNA only confers inheritable geneticand some epigenetic information, both of which may not represent the dynamic gene expression profiles that are linkedto fetal medical conditions. The discovery of circulating fetal RNA in maternal plasma (Ng et al., 2003b; Wong et al.,2005) may be the method of choice for non-invasive prenatal diagnosis.[0143] Several studies suggest that fetal RNAs are of high diagnostic value. For example, elevated expression of fetalcorticotropin-releasing hormone (CRH) transcript is associated with pre-eclampsia (a clinical condition manifested byhypertension, edema and proteinuria) during pregnancy (Ng et al., 2003a). In addition, the placenta-specific 4 (PLAC4)mRNA in maternal plasma was successfully used in a non-invasive test for aneuploid pregnancy (such as trisomy 21,Down syndrome) (Lo et al., 2007). Furthermore, fetal human chorionic gonadotropin (hCG) transcript in maternal plasmamay be a marker of gestational trophoblastic diseases (GTDs), which is a tumorous growth of fetal tissues in a maternalhost. Circulating fetal RNAs are mainly of placenta origin (Ng et al., 2003b). These fetal RNAs can be detected as earlyas the 4th week of gestation and such RNA is cleared rapidly postpartum.[0144] Prenatal diagnosis using circulating fetal RNAs in maternal plasma, nevertheless, has several limitations. Thefirst limitation is that circulating fetal RNA is mixed with circulating maternal RNA and is not effectively separable.Currently, fetal transcripts are identified, based on an assumption, as those that are detected in pregnant women an-tepartum as well as in their infant’s cord blood, yet are significantly reduced or absent in maternal blood within 24 or 36hours postpartum (Maron et al., 2007). The second limitation is that no method is established to enrich the circulatingfetal RNA for enhanced diagnostic sensitivity since it is still unknown how fetal RNA is packaged and released. The wayto overcome these limitations may lie in the isolation of microvesicles and the analysis of the fetal RNAs therein.[0145] Several facts suggest that microvesicles, which are shed by eukaryotic cells, are the vehicles for circulatingfetal RNAs in maternal plasma. First, circulating RNAs within microvesicles are protected from RNase degradation.Second, circulating fetal RNAs have been shown to remain in the non-cellular fraction of maternal plasma, which isconsistent with the notion that microvesicles encompassing these fetal RNAs are able to be filtered through 0.22 ummembrane. Third, similar to tumorous tissues which are know to shed microvesicles, placental cells, which are a pseudo-malignant fetal tissue, are most likely capable of shedding microvesicles. Thus, a novel method of non-invasive prenataldiagnosis is comprised of isolating fetal microvesicles from maternal blood plasma and then analyzing the nucleic acidswithin the microvesicles for any genetic variants associated with certain diseases and/or other medical conditions.[0146] A hypothetical case of non-invasive prenatal diagnosis is as follows: peripheral blood samples are collectedfrom pregnant women and undergo magnetic activated cell sorting (MACS) or other affinity purification to isolate andenrich fetus-specific microvesicles. The microvesicular pellet is resuspended in PBS and used immediately or stored at-20°C for further processing. RNA is extracted from the isolated microvesicles using the Qiagen RNA extraction kit asper the manufacturer’s instructions. RNA content is analyzed for the expression level of fetal human chorionic gonado-tropin (hCG) transcript. An increased expression level of hCG compared to the standard range points to the developmentof gestational trophoblastic diseases (GTDs) and entail further the need for clinical treatment for this abnormal growthin the fetus. The sensitivity of microvesicle technology makes it possible to detect the GTDs at a very early stage beforeany symptomatic manifestation or structural changes become detectable under ultrasonic examination. The standardrange of hCG transcript levels may be determined by examining a statistically significant number of circulating fetal RNAsamples from normal pregnancies.[0147] This prenatal diagnostic method may be extrapolated to the prenatal diagnosis and/or monitoring of otherdiseases or medical conditions by examining those transcripts associated with these diseases or medical conditions.
EP 2 604 704 A1
27
5
10
15
20
25
30
35
40
45
50
55
For example, extraction and analysis of anaplastic lymphoma kinase (ALK) nucleic acid from microvesicles of fetusorigin from maternal blood is a non-invasive prenatal diagnosis of neuroblastoma, which is closely associated withmutations within the kinase domain or elevated expression of ALK (Mosse et al., 2008). Accordingly, the microvesiclemethods and technology described herein may lead to a new era of much-needed, non-invasive prenatal genetic diag-nosis.
Example 14: Melanoma diagnosis
[0148] Melanoma is a malignant tumor of melanocytes (pigment cells) and is found predominantly in skin. It is a seriousform of skin cancer and accounts for 75 percent of all deaths associated with skin cancer. Somatic activating mutations(e.g. V600E) of BRAF are the earliest and most common genetic abnormality detected in the genesis of human melanoma.Activated BRAF promotes melanoma cell cycle progression and/or survival.[0149] Currently, the diagnosis of melanoma is made on the basis of physical examination and excisional biopsy.However, a biopsy can sample only a limited number of foci within the lesion and may give false positives or falsenegatives. The exosome method provides a more accurate means for diagnosing melanoma. As discussed above, themethod is comprised of the steps of isolating exosomes from a bodily fluid of a subject and analyzing the nucleic acidfrom said exosomes.[0150] To determine whether exosomes shed by melanoma cells contain BRAF mRNA, we cultured primary melanomacells in DMEM media supplemented with exosome-depleted FBS and harvested the exosomes in the media using asimilar procedure as detailed in Example 2. The primary cell lines were Yumel and M34. The Yumel cells do not havethe V600E mutation in BRAF, while M34 cells have the V600E mutation in BRAF. RNAs were extracted from the exosomesand then analyzed for the presence of BRAF mRNA by RT-PCR. The primers used for PCR amplification were: BRAFforward (SEQ ID NO: 55) and BRAF reverse (SEQ ID NO: 56). The amplicon is 118 base pairs (bp) long and covers thepart of BRAF cDNA sequence where the V600E mutation is located. As shown in FIG. 16a, a band of 118 bp wasdetected in exosomes from primary melanoma cells (Yumel and M34 cells), but not in exosomes from human fibroblastcells or negative controls. The negative detection of a band of 118 bp PCR product is not due to a mistaken RNAextraction since GAPDH transcripts could be detected in exosomes from both melanoma cell and human fibroblast cells(FIG. 16b). The 118 bp PCR products were further sequenced to detect the V600E mutation. As shown in FIGS. 16cand 16d, PCR products from YUMEL cells, as expected, contain wild type BRAF mRNA. In contrast, PCR products fromM34 cells, as expected, contain mutant BRAF mRNA with a T-A point mutation, which causes the amino acid Valine (V)to be replaced by Glutamic acid (E) at the amino acid position 600 of the BRAF protein. Furthermore, BRAF mRNAcannot be detected in exosomes from normal human fibroblast cells, suggesting the BRAF mRNA is not contained inexosomes of all tissue origins.[0151] These data suggest that melanoma cells shed exosomes into the blood circulation and thus melanoma can bediagnosed by isolating these exosomes from blood serum and analyzing the nucleic acid therefrom for the presence orabsence of mutations (e.g., V600E) in BRAF. The method described above can also be employed to diagnose melanomasthat are associated with other BRAF mutations and mutations in other genes. The method can also be employed todiagnose melanomas that are associated with the expression profiles of BRAF and other nucleic acids.
Example 15: Detection of MMP levels from exosomes to monitor post transplantation conditions.
[0152] Organ transplants are usually effective treatments for organ failures. Kidney failure, heart disease, end-stagelung disease and cirrhosis of the liver are all conditions that can be effectively treated by a transplant. However, organrejections caused by post-transplantation complications are major obstacles for long-term survival of the allograft recip-ients. For example, in lung transplantations, bronchiolitis obliterans syndrome is a severe complication affecting survivalrates. In kidney transplants, chronic allograft nephropathy remains one of the major causes of renal allograft failure.Ischemia-reperfusion injury damages the donor heart after heart transplantation, as well as the donor liver after orthotopicliver transplantation. These post-transplantation complications may be ameliorated once detected at early stages. There-fore, it is essential to monitor post-transplantation conditions in order to alleviate adverse complications.[0153] Alterations in the extracellular matrix contribute to the interstitial remodeling in post-transplantation complica-tions. Matrix metalloproteinases (MMPs) are involved in both the turnover and degradation of extracellular matrix (ECM)proteins. MMPs are a family of proteolytic, zinc-dependent enzymes, with 27 members described to date, displayingmultidomain structures and substrate specificities, and functioning in the processing, activation, or deactivation of avariety of soluble factors. Serum MMP levels may indicate the status of post-transplantation conditions. Indeed, circulatingMMP-2 is associated with cystatin C, post-transplant duration, and diabetes mellitus in kidney transplant recipients(Chang et al., 2008). Disproportional expression of MMP-9 is linked to the development of bronchiolitis obliterans syn-drome after lung transplantation (Hubner et al., 2005).[0154] MMP mRNAs (MMP1, 8, 12, 15, 20, 21, 24, 26 and 27) can be detected in exosomes shed by glioblastoma
EP 2 604 704 A1
28
5
10
15
20
25
30
35
40
45
50
55
cells as shown in Example 4 and Table 10. The present exosome method, isolating exosomes from a bodily fluid andanalyzing nucleic acids from said exosomes, can be used to monitor transplantation conditions. The exosome isolationprocedure is similar to that detailed in Example 2. The present procedures to analyze nucleic acid contained withinexosomes are detailed in Example 9. A significant increase in the expression level of MMP-2 after kidney transplantationwill indicate the onset and/or deterioration of post-transplantation complications. Similarly, a significantly elevated levelof MMP-9 after lung transplantation, suggests the onset and/or deterioration of bronchiolitis obliterans syndrome.[0155] Therefore, the exosome method can be used to monitor post-transplantation conditions by determining theexpression levels of MMP proteins associated with post-transplantation complications. It is also expected that the methodcan be extrapolated to monitor post-transplantation conditions by determining the expression of other marker genes aswell as monitor other medical conditions by determining the genetic profile of nucleic acids associated with these medicalconditions.
Examples 16-18. Microvesicles can be therapeutic agents or delivery vehicles of therapeutic agents.
Example 16: Microvesicle proteins induce angiogenesis in vitro.
[0156] A study was designed and carried out to demonstrate glioblastoma microvesicles contribute to angiogenesis.HBMVECs (30,000 cells), a brain endothelial cell line, (Cell Systems, Catalogue #ACBRI-376, Kirkland, WA, USA) werecultured on Matrigel-coated wells in a 24-well plate in basal medium only (EBM) (Lonza Biologics Inc., Portsmouth, NH,USA), basal medium supplemented with glioblastoma microvesicles (EBM+ MV) (7 mg/well), or basal medium supple-mented with a cocktail of angiogenic factors (EGM; hydrocortisone, EGF, FGF, VEGF, IGF, ascorbic acid, FBS, andheparin; Singlequots (EBM positive control). Tubule formation was measured after 16 hours and analyzed with the ImageJ software. HBMVECs cultured in the presence of glioblastoma microvesicles demonstrated a doubling of tubule lengthwithin 16 hours. The result was comparable to the result obtained with HBMCECs cultured in the presence of angiogenicfactors (FIG. 18a). These results show that glioblastoma-derived microvesicles play a role in initiating angiogenesis inbrain endothelial cells.[0157] Levels of angiogenic proteins in microvesicles were also analyzed and compared with levels in glioblastomadonor cells. Using a human angiogenesis antibody array, we were able to detect 19 proteins involved in angiogenesis.Specifically, total protein from either primary glioblastoma cells or purified microvesicles isolated from said cells werelysed in lysis buffer (Promega, Madison, WI, USA) and added to the human angiogenesis antibody array (Panomics,Fremont CA, USA) according to manufacturer’s recommendations. The arrays were scanned and analyzed with theImage J software. As shown in FIG. 18b, of the seven of the 19 angiogenic proteins were readily detected in themicrovesicles, 6 (angiogenin, IL-6, IL-8, TIMP-I, VEGF and TIMP-2) were present at higher levels on a total protein basisas compared to the glioblastoma cells (FIG. 18c). The three angiogenic proteins most enriched in microvesicles comparedto tumor cells were angiogenin, IL-6 and 1L-8, all of which have been implicated in glioma angiogenesis with higherlevels associated with increased malignancy (25-27).[0158] Microvesicles isolated from primary glioblastoma cells were also found to promote proliferation of a human U87glioma cell line. In these studies, 100 000 U87 cells were seeded in wells of a 24-well plate and allowed to grow for threedays (DMEM-5%FBS) or DMEM-5%FBS supplemented with 125 mg microvesicles isolated from primary glioblastomacells. After three days, untreated U87 cells (FIG. 19a) were found to be fewer in number as determined using a Burkerchamber, than those supplemented with microvesicles (FIG. 19b). Both non-supplemented and supplemented U87 cellshad increased 5-and 8-fold in number over this period, respectively (FIG. 19c). Thus, glioblastoma microvesicles appearto stimulate proliferation of other glioma cells.
Example 17: Glioblastoma microvesicles are taken up by HBMVECs.
[0159] To demonstrate that glioblastoma microvesicles are able to be taken up by human brain microvesicular en-dothelial cells (HBMVECs), purified glioblastoma microvesicles were labeled with PKH67 Green Fluorescent labelingkit (Sigma-Aldrich, St Louis, MO, USA). The labeled microvesicles were incubated with HBMVEC in culture (5 mg/50,000cells) for 20 min at 4°C. The cells were washed and incubated at 37°C for 1 hour. Within 30 min the PKH67-labeledmicrovesicles were internalized into endosome-like structures within the HBMVECs (FIG. 17a). These results show thatglioblastoma microvesicles can be internalized by brain endothelial cells.[0160] Similar results were obtained when adding the fluorescently labeled microvesicles to primary glioblastoma cells.
Example 18: mRNA delivered by glioblastoma microvesicles can be translated in recipient cells.
[0161] To determine whether glioblastoma-derived microvesicles mRNA could be delivered to and expressed in re-cipient cells, primary human glioblastoma cells were infected with a self-inactivating lentivirus vector expressing secreted
EP 2 604 704 A1
29
5
10
15
20
25
30
35
40
45
50
55
Gaussia luciferase (Gluc) using a CMV promoter at an infection efficiency of >95%. The cells were stably transducedand generated microvesicles during the subsequent passages (2-10 passages were analyzed). Microvesicles wereisolated from the cells and purified as described above. RT-PCR analysis showed that the mRNA for Gluc (555 bp) aswell as GAPDH (226 bp) were present in the microvesicles (FIG. 17b). The level of Gluc mRNA was even higher thanthat for GAPDH as evaluated with quantitative RT-PCR.[0162] Fifty micrograms of the purified microvesicles were added to 50,000 HBMVE cells and incubated for 24 hrs.The Gluc activity in the supernatant was measured directly after microvesicle addition (0 hrs), and after 15 hrs and 24hrs. The Gluc activity in the supernatant was normalized to the Gluc protein activity associated with the microvesicles.The results are presented as the mean 6 SEM (n=4). Specifically, the activity in the recipient HBMVE cells demonstrateda continual translation of the microvesicular Gluc mRNA. Thus, mRNA incorporated into the tumor microvesicles canbe delivered into recipient cells and generate a functional protein.[0163] The statistical analyses in all examples were performed using the Student’s t-test.[0164] The invention is further exemplified in the following clauses:
1. A diagnostic method, wherein said method aids in the detection of a disease or other medical condition in asubject, the method comprising the steps of:
(a) isolating a micro vesicle fraction from a biological sample from the subject;(b) detecting the presence or absence of a biomarker within the microvesicle fraction, wherein the biomarkeris associated with the disease or other medical condition.
2. A monitoring method, wherein said method aids in monitoring the status of a disease or other medical conditionin a subject, the method comprising the steps of:
(a) isolating a microvesicle fraction from a biological sample from the subject;(b) detecting the presence or absence of a biomarker within the microvesicle fraction, wherein the biomarkeris associated with the disease or other medical condition.
3. An evaluation method, wherein said method aids in evaluating treatment efficacy in a subject having a diseaseor other medical condition, the method comprising the steps of:
(a) isolating a microvesicle fraction from a biological sample from the subject;(b) detecting the presence or absence of a biomarker within the microvesicle fraction, wherein the biomarkeris associated with treatment efficacy for the disease or other medical condition.
4. The method of any of clauses 1-3, wherein the biological sample is a sample of bodily fluid.
5. The method of any of clauses 1-4, wherein the biomarker is: (i) a species of nucleic acid; (ii) the level of expressionof a nucleic acid; (iii) a nucleic acid variant; or (iv) a combination thereof.
6. The method of any of clauses 1-5, wherein the biomarker is messenger RNA, microRNA, siRNA or shRNA.
7. The method of any of clauses 1-5, wherein the biomarker is DNA, single stranded DNA, complementary DNA,or noncoding DNA.
8. The method of any of clauses 1-7, wherein the disease or other medical condition is a neoplastic disease orcondition.
9. The method of clause 8, wherein the biomarker is a nucleic acid listed in any of Tables 3-15, or a variant thereof.
10. The method of clause 9, wherein the disease or other medical condition is glioblastoma.
11. The method of clause 10, wherein the biomarker is a nucleic acid listed in any of Tables 8-12, or a variant thereof.
12. The method of clause any of clauses 8-11, wherein the biomarker is microRNA-21.
13. The method of clause 8, wherein the biomarker is associated with a clinically distinct type or subtype of tumor.
EP 2 604 704 A1
30
5
10
15
20
25
30
35
40
45
50
55
14. The method of any of clauses 1-13, wherein the biomarker is a variant in the EGFR gene.
15. The method of clause 14, wherein the biomarker is the EGFRvIII mutation.
16. The method of clause 8, wherein the biomarker is associated with prostate cancer.
17. The method of clause 16, wherein the biomarker is TMPRSS2-ERG, PCA-3, PSA, or variants thereof.
18. The method of clause 8, wherein the biomarker is associated with melanoma.
19. The method of clause 18, wherein the biomarker is a BRAF variant.
20. The method of any of clauses 1-3, wherein the biomarker is the expression level of one or more nucleic acidsselected from the group consisting of let-7a; miR-15b; miR-16; miR-19b; miR-21; miR-26a; miR-27a; miR-92; miR-93; miR-320 and miR-20.
21. The method of any of clauses 1-7, wherein the disease or other medical condition is a metabolic disease orcondition.
22. The method of clause 21, wherein the metabolic disease or condition is diabetes, inflammation, or a perinatalcondition.
23. The method of clause 21, wherein the metabolic disease or condition is associated with iron metabolism.
24. The method of clause 21, wherein the biomarker is a nucleic acid encoding hepcidin, or a fragment or variantthereof.
25. The method of any of clauses 1-7, wherein the medical condition is a post transplantation condition.
26. The method of any of clauses 1-7, wherein the biomarker is mRNA encoding a member of the family of matrixmetalloproteinases.
27. The method of any of clauses 1-7, wherein the biomarker is a nucleic acid listed in Table 10.
28. The method of any of clauses 1-7, wherein the disease or other medical condition is cancer and the biomarkeris a nucleic acid variant of the Kras gene.
29. The method of any of clauses 1-28, wherein the micro vesicles in the micro vesicle fraction have a diameter inthe range of about 30 nm to about 800 nm.
30. The method of clause 29, wherein the range is about 30 nm to about 200 nm.
31. The method of any of clauses 1-30, wherein step (a) is performed by size exclusion chromatography, densitygradient centrifugation, differential centrifugation, nanomembrane ultrafiltration, immunoabsorbent capture, affinitypurification, microfluidic separation, or combinations thereof.
32. The method of any of clauses 1-31, wherein the biomarker is a nucleic acid and the method further comprisesamplification of the nucleic acid.
33. The method of any of clauses 1-32, wherein the detecting step b) is performed by microarray analysis, PCR,hybridization with allele- specific probes, enzymatic mutation detection, ligation chain reaction (LCR), oligonucleotideligation assay (OLA), flow- cytometric heteroduplex analysis, chemical cleavage of mismatches, mass spectrometry,nucleic acid sequencing, single strand conformation polymorphism (SSCP), denaturing gradient gel electrophoresis(DGGE), temperature gradient gel electrophoresis (TGGE), restriction fragment polymorphisms, serial analysis ofgene expression (SAGE), or combinations thereof.
34. The method of any of clauses 1-33, further comprising the isolation of a selective microvesicle fraction derivedfrom cells of a specific type.
EP 2 604 704 A1
31
5
10
15
20
25
30
35
40
45
50
55
35. The method of clause 34, wherein the cells are tumor cells.
36. The method of clause 34, wherein the microvesicle fraction is derived from lung, pancreas, stomach, intestine,bladder, kidney, ovary, testis, skin, colorectal, breast, prostate, brain, esophagus, liver, placenta, fetus cells, orcombinations thereof.
37. The method of clause 34, wherein the selective microvesicle fraction consists essentially of urinary microvesicles.
38. A diagnostic method, wherein said method aids in the detection of a disease or other medical condition in asubject, the method comprising the steps of:
(a) obtaining a biological sample from the subject; and(b) determining the concentration of microvesicles within the biological sample.
39. A monitoring method, wherein said method aids in monitoring the status of a disease or other medical conditionin a subject, the method comprising the steps of:
(a) obtaining a biological sample from the subject; and(b) determining the concentration of microvesicles within the biological sample.
40. The method of clause 38 or 39, further comprising the step of isolating a microvesicle fraction from the biologicalsample prior to determining the concentration.
41. The method of clause 40, wherein the isolation step is performed by size exclusion chromatography, densitygradient centrifugation, differential centrifugation, nanomembrane ultrafiltration, immunoabsorbent capture, affinitypurification, microfluidic separation, or combinations thereof.
42. The method of clause 40 or 41, wherein the microvesicle fraction is derived from cells of a specific type.
43. The method of clause 42, wherein the cells are tumor cells.
44. The method of clause 42, wherein the microvesicle fraction is derived from lung, pancreas, stomach, intestine,bladder, kidney, ovary, testis, skin, colorectal, breast, prostate, brain, esophagus, liver, placenta, fetus cells, orcombinations thereof.
45. The method of clause 42, wherein the selective microvesicle fraction consists essentially of urinary microvesicles.
46. The method of any of clauses 38-45, wherein the microvesicles have a diameter in the range of about 30 nm toabout 800 nm.
47. The method of clause 46, wherein the range is about 30 nm to about 200 nm.
48. A method for delivering a nucleic acid or protein to a target cell in an individual comprising, administering oneor more microvesicles that contain the nucleic acid or protein, or one or more cells that produce such microvesicles,to the individual such that the microvesicles enter the target cell of the individual.
49. The method of clause 48, wherein microvesicles are delivered to a brain cell.
50. The method of clause 48 or 49, wherein the nucleic acid delivered is siRNA, shRNA, mRNA, microRNA, DNA,or combinations thereof.
51. A method for performing a body fluid transfusion, comprising the steps of obtaining a fraction of donor body fluidfree of all or substantially all microvesicles, or free of all or substantially all microvesicles from a particular cell type,and introducing the microvesicle-free fraction to a patient.
52. The method of clause 51, wherein the cell type is a tumor cell type.
53. The method of 51 or 52, wherein the body fluid is blood, serum or plasma.
EP 2 604 704 A1
32
5
10
15
20
25
30
35
40
45
50
55
54. A composition of matter comprising a sample of body fluid free of all or substantially all microvesicles, or freeof all or substantially all microvesicles from a particular cell type.
55. The composition of clause 54, wherein the body fluid is blood, serum or plasma.
56. A method for performing body fluid transfusion, comprising the steps of obtaining a microvesicle-enriched fractionof donor body fluid and introducing the microvesicle- enriched fraction to a patient.
57. The method of clause 56, wherein the fraction is enriched with microvesicles derived from a particular cell type.
58. The method of clause 56 or 57, wherein the body fluid is blood, serum or plasma
59. A composition of matter comprising a sample of body fluid enriched with microvesicles.
60. The composition of clause 59, wherein the microvesicles are derived from a particular cell type.
61. The composition of clause 59 or 60, wherein the bodily fluid is blood, serum or plasma.
References
[0165]
1. Abravaya, K., J.J. Carrino, S. Muldoon, and H.H. Lee. 1995. Detection of point mutations with a modified ligasechain reaction (Gap-LCR). Nucleic Acids Res. 23:675-82.
2. Al-Nedawi, K., B. Meehan, J. Micallef, V. Lhotak, L. May, A. Guha, and J. Rak. 2008. Intercellular transfer of theoncogenic receptor EGFRvIII by microvesicles derived from tumour cells. Nat Cell Biol. 10:619-24.
3. Baj-Krzyworzeka, M., R. Szatanek, K. Weglarczyk, J. Baran, B. Urbanowicz, P. Branski, M.Z. Ratajczak, and M.Zembala. 2006. Tumour-derived microvesicles carry several surface determinants and mRNA of tumour cells andtransfer some of these determinants to monocytes. Cancer Immunol Immunother. 55:808-18.
4. Balzar, M., M.J. Winter, C.J. de Boer, and S.V. Litvinov. 1999. The biology of the 17-1A antigen (Ep-CAM). J MolMed. 77:699-712.
5. Booth, A.M., Y. Fang, J.K. Fallon, J.M. Yang, J.E. Hildreth, and S.J. Gould. 2006. Exosomes and HIV Gag budfrom endosome-like domains of the T cell plasma membrane. J Cell Biol. 172:923-35.
6. Bossi, A., F. Bonini, A.P. Turner, and S.A. Piletsky. 2007. Molecularly imprinted polymers for the recognition ofproteins: the state of the art. Biosens Bioelectron. 22:1131-7.
7. Brookes, M.J., N.K. Sharma, C. Tselepis, and T.H. Iqbal. 2005. Serum pro-hepcidin: measuring active hepcidinor a non-functional precursor? Gut. 54:169-70.
8. Carmeliet, P., and R.K. Jain. 2000. Angiogenesis in cancer and other diseases. Nature. 407:249-57.
9. Carpenter, G. 1987. Receptors for epidermal growth factor and other polypeptide mitogens. Annu Rev Biochem.56:881-914.
10. Chang, H.R., W.H. Kuo, Y.S. Hsieh, S.F. Yang, C.C. Lin, M.L. Lee, J.D. Lian, and S.C. Chu. 2008. Circulatingmatrix metalloproteinase-2 is associated with cystatin C level, posttransplant duration, and diabetes mellitus inkidney transplant recipients. Transl Res. 151:217-23.
11. Chaput, N., J. Taieb, F. Andre, and L. Zitvogel. 2005. The potential of exosomes in immunotherapy. Expert OpinBiol Ther. 5:737-47.
12. Cheruvanky, A., H. Zhou, T. Pisitkun, J.B. Kopp, M.A. Knepper, P.S. Yuen, and R.A. Star. 2007. Rapid isolationof urinary exosomal biomarkers using a nanomembrane ultrafiltration concentrator. Am JPhysiol Renal Physiol.
EP 2 604 704 A1
33
5
10
15
20
25
30
35
40
45
50
55
292:F1657-61.
13. Clayton, A., J.P. Mitchell, J. Court, M.D. Mason, and Z. Tabi. 2007. Human tumor-derived exosomes selectivelyimpair lymphocyte responses to interleukin-2. Cancer Res. 67:7458-66.
14. Cotton, R.G., N.R. Rodrigues, and R.D. Campbell. 1988. Reactivity of cytosine and thymine in single-base-pairmismatches with hydroxylamine and osmium tetroxide and its application to the study of mutations. Proc Natl AcadSci USA. 85:4397-401.
15. Delves, G.H., A.B. Stewart, A.J. Cooper, and B.A. Lwaleed. 2007. Prostasomes, angiogenesis, and tissue factor.Semin Thromb Hemost. 33:75-9.
16. Diehl, F., K. Schmidt, M.A. Choti, K. Romans, S. Goodman, M. Li, K. Thornton, N. Agrawal, L. Sokoll, S.A.Szabo, K.W. Kinzler, B. Vogelstein, and L.A. Diaz, Jr. 2008. Circulating mutant DNA to assess tumor dynamics. NatMed. 14:985-90.
17. Fiorentino, F., M.C. Magli, D. Podini, A.P. Ferraretti, A. Nuccitelli, N. Vitale, M. Baldi, and L. Gianaroli. 2003.The minisequencing method: an alternative strategy for preimplantation genetic diagnosis of single gene disorders.Mol Hum Reprod. 9:399-410.
18. Fischer, S.G., and L.S. Lerman. 1979a. Length-independent separation of DNA restriction fragments in two-di-mensional gel electrophoresis. Cell. 16:191-200.
19. Fischer, S.G., and L.S. Lerman. 1979b. Two-dimensional electrophoretic separation of restriction enzyme frag-ments of DNA. Methods Enzymol. 68:183-91.
20. Furnari, F.B., T. Fenton, R.M. Bachoo, A. Mukasa, J.M. Stommel, A. Stegh, W.C. Hahn, K.L. Ligon, D.N. Louis,C. Brennan, L. Chin, R.A. DePinho, and W.K. Cavenee. 2007. Malignant astrocytic glioma: genetics, biology, andpaths to treatment. Genes Dev. 21:2683-710.
21. Gabrilovich, D.I. 2007. Molecular mechanisms and therapeutic reversal of immune suppression in cancer. CurrCancer Drug Targets. 7:1.
22. Geiss, G.K., R.E. Bumgarner, B. Birditt, T. Dahl, N. Dowidar, D.L. Dunaway, H.P. Fell, S. Ferree, R.D. George,T. Grogan, J.J. James, M. Maysuria, J.D. Mitton, P. Oliveri, J.L. Osborn, T. Peng, A.L. Ratcliffe, P.J. Webster, E.H.Davidson, and L. Hood. 2008. Direct multiplexed measurement of gene expression with color-coded probe pairs.Nat Biotechnol. 26:317-25.
23. Goessl, C., H. Krause, M. Muller, R. Heicappell, M. Schrader, J. Sachsinger, and K. Miller. 2000. Fluorescentmethylation-specific polymerase chain reaction for DNA-based detection of prostate cancer in bodily fluids. CancerRes. 60:5941-5.
24. Gonzalgo, M.L., M. Nakayama, S.M. Lee, A.M. De Marzo, and W.G. Nelson. 2004. Detection of GSTP1 meth-ylation in prostatic secretions using combinatorial MSP analysis. Urology. 63:414-8.
25. Gormally, E., E. Caboux, P. Vineis, and P. Hainaut. 2007. Circulating free DNA in plasma or serum as biomarkerof carcinogenesis: practical aspects and biological significance. Mutat Res. 635:105-17.
26. Greco, V., M. Hannus, and S. Eaton. 2001. Argosomes: a potential vehicle for the spread of morphogens throughepithelia. Cell. 106:633-45.
27. Groskopf, J., S.M. Aubin, I.L. Deras, A. Blase, S. Bodrug, C. Clark, S. Brentano, J. Mathis, J. Pham, T. Meyer,M. Cass, P. Hodge, M.L. Macairan, L.S. Marks, and H. Rittenhouse. 2006. APTIMA PCA3 molecular urine test:development of a method to aid in the diagnosis of prostate cancer. Clin Chem. 52:1089-95.
28. Guatelli, J.C., K.M. Whitfield, D.Y. Kwoh, K.J. Barringer, D.D. Richman, and T.R. Gingeras. 1990. Isothermal,in vitro amplification of nucleic acids by a multienzyme reaction modeled after retroviral replication. Proc Natl AcadSci USA. 87:1874-8.
EP 2 604 704 A1
34
5
10
15
20
25
30
35
40
45
50
55
29. Hahn, P.J. 1993. Molecular biology of double-minute chromosomes. Bioessays. 15:477-84.
30. Hubner, R.H., S. Meffert, U. Mundt, H. Bottcher, S. Freitag, N.E. El Mokhtari, T. Pufe, S. Hirt, U.R. Folsch, andB. Bewig. 2005. Matrix metalloproteinase-9 in bronchiolitis obliterans syndrome after lung transplantation. Eur RespirJ. 25:494-501.
31. Janowska-Wieczorek, A., M. Wysoczynski, J. Kijowski, L. Marquez-Curtis, B. Machalinski, J. Ratajczak, andM.Z. Ratajczak. 2005. Microvesicles derived from activated platelets induce metastasis and angiogenesis in lungcancer. Int J Cancer. 113:752-60.
32. Johnson, S., D. Evans, S. Laurenson, D. Paul, A.G. Davies, P.K. Ferrigno, and C. Walti. 2008. Surface-immo-bilized peptide aptamers as probe molecules for protein detection. Anal Chem. 80:978-83.
33. Jones, S., X. Zhang, D.W. Parsons, J.C. Lin, R.J. Leary, P. Angenendt, P. Mankoo, H. Carter, H. Kamiyama,A. Jimeno, S.M. Hong, B. Fu, M.T. Lin, E.S. Calhoun, M. Kamiyama, K. Walter, T. Nikolskaya, Y. Nikolsky, J.Hartigan, D.R. Smith, M. Hidalgo, S.D. Leach, A.P. Klein, E.M. Jaffee, M. Goggins, A. Maitra, C. Iacobuzio-Donahue,J.R. Eshleman, S.E. Kern, R.H. Hruban, R. Karchin, N. Papadopoulos, G. Parmigiani, B. Vogelstein, V.E. Velculescu,and K.W. Kinzler. 2008. Core Signaling Pathways in Human Pancreatic Cancers Revealed by Global GenomicAnalyses. Science.
34. Kan, Y.W., and A.M. Dozy. 1978a. Antenatal diagnosis of sickle-cell anaemia by D.N.A. analysis of amniotic-fluidcells. Lancet. 2:910-2.
35. Kan, Y.W., and A.M. Dozy. 1978b. Polymorphism of DNA sequence adjacent to human beta-globin structuralgene: relationship to sickle mutation. Proc Natl Acad Sci U S A. 75:5631-5.
36. Keller, S., C. Rupp, A. Stoeck, S. Runz, M. Fogel, S. Lugert, H.D. Hager, M.S. Abdel-Bakky, P. Gutwein, andP. Altevogt. 2007. CD24 is a marker of exosomes secreted into urine and amniotic fluid. Kidney Int. 72:1095-102.
37. Kemna, E., P. Pickkers, E. Nemeth, H. van der Hoeven, and D. Swinkels. 2005. Time-course analysis of hepcidin,serum iron, and plasma cytokine levels in humans injected with LPS. Blood. 106:1864-6.
38. Kemna, E.H., H. Tjalsma, V.N. Podust, and D.W. Swinkels. 2007. Mass spectrometry-based hepcidin measure-ments in serum and urine: analytical aspects and clinical implications. Clin Chem. 53:620-8.
39. Kemna, E.H., H. Tjalsma, H.L. Willems, and D.W. Swinkels. 2008. Hepcidin: from discovery to differentialdiagnosis. Haematologica. 93:90-7.
40. Kislauskis, E.H., X. Zhu, and R.H. Singer. 1994. Sequences responsible for intracellular localization of beta-actinmessenger RNA also affect cell phenotype. J Cell Biol. 127:441-51.
41. Kwoh, D.Y., G.R. Davis, K.M. Whitfield, H.L. Chappelle, L.J. DiMichele, and T.R. Gingeras. 1989. Transcrip-tion-based amplification system and detection of amplified human immunodeficiency virus type 1 with a bead-basedsandwich hybridization format. Proc Natl Acad Sci USA. 86:1173-7.
42. Landegren, U., R. Kaiser, J. Sanders, and L. Hood. 1988. A ligase-mediated gene detection technique. Science.241:1077-80.
43. Li, J., L. Wang, H. Mamon, M.H. Kulke, R. Berbeco, and G.M. Makrigiorgos. 2008. Replacing PCR with COLD-PCRenriches variant DNA sequences and redefines the sensitivity of genetic testing. Nat Med. 14:579-84.
44. Liu, C., S. Yu, K. Zinn, J. Wang, L. Zhang, Y. Jia, J.C. Kappes, S. Barnes, R.P. Kimberly, W.E. Grizzle, andH.G. Zhang. 2006a. Murine mammary carcinoma exosomes promote tumor growth by suppression of NK cell func-tion. J Immunol. 176:1375-85.
45. Liu, Q., J.C. Greimann, and C.D. Lima. 2006b. Reconstitution, activities, and structure of the eukaryotic RNAexosome. Cell. 127:1223-37.
EP 2 604 704 A1
35
5
10
15
20
25
30
35
40
45
50
55
46. Lo, Y.M., N.B. Tsui, R.W. Chiu, T.K. Lau, T.N. Leung, M.M. Heung, A. Gerovassili, Y. Jin, K.H. Nicolaides, C.R.Cantor, and C. Ding. 2007. Plasma placental RNA allelic ratio permits noninvasive prenatal chromosomal aneuploidydetection. Nat Med. 13:218-23.
47. Louis, D.N., H. Ohgaki, O.D. Wiestler, W.K. Cavenee, P.C. Burger, A. Jouvet, B.W. Scheithauer, and P. Kleihues.2007. The 2007 WHO classification of tumours of the central nervous system. Acta Neuropathol. 114:97-109.
48. Mack, M., A. Kleinschmidt, H. Bruhl, C. Klier, P.J. Nelson, J. Cihak, J. Plachy, M. Stangassinger, V. Erfle, andD. Schlondorff. 2000. Transfer of the chemokine receptor CCR5 between cells by membrane-derived microparticles:a mechanism for cellular human immunodeficiency virus 1 infection. Nat Med. 6:769-75.
49. Mallardo, M., A. Deitinghoff, J. Muller, B. Goetze, P. Macchi, C. Peters, and M.A. Kiebler. 2003. Isolation andcharacterization of Staufen-containing ribonucleoprotein particles from rat brain. Proc Natl Acad Sci USA. 100:2100-5.
50. Maron, J.L., K.L. Johnson, D. Slonim, C.Q. Lai, M. Ramoni, G. Alterovitz, Z. Jarrah, Z. Yang, and D.W. Bianchi.2007. Gene expression analysis in pregnant women and their infants identifies unique fetal biomarkers that circulatein maternal blood. J Clin Invest. 117:3007-19.
51. Mazzocca, A., R. Coppari, R. De Franco, J.Y. Cho, T.A. Libermann, M. Pinzani, and A. Toker. 2005. A secretedform of ADAM9 promotes carcinoma invasion through tumor-stromal interactions. Cancer Res. 65:4728-38.
52. McLendon, R., A. Friedman, D. Bigner, E.G. Van Meir, D.J. Brat, G. Marie Mastrogianakis, J.J. Olson, T.Mikkelsen, N. Lehman, K. Aldape, W.K. Alfred Yung, O. Bogler, S. Vandenberg, M. Berger, M. Prados, D. Muzny,M. Morgan, S. Scherer, A. Sabo, L. Nazareth, L. Lewis, O. Hall, Y. Zhu, Y. Ren, O. Alvi, J. Yao, A. Hawes, S.Jhangiani, G. Fowler, A. San Lucas, C. Kovar, A. Cree, H. Dinh, J. Santibanez, V. Joshi, M.L. Gonzalez-Garay, C.A.Miller, A. Milosavljevic, L. Donehower, D.A. Wheeler, R.A. Gibbs, K. Cibulskis, C. Sougnez, T. Fennell, S. Mahan,J. Wilkinson, L. Ziaugra, R. Onofrio, T. Bloom, R. Nicol, K. Ardlie, J. Baldwin, S. Gabriel, E.S. Lander, L. Ding, R.S.Fulton, M.D. McLellan, J. Wallis, D.E. Larson, X. Shi, R. Abbott, L. Fulton, K. Chen, D.C. Koboldt, M.C. Wendl, R.Meyer, Y. Tang, L. Lin, J.R. Osborne, B.H. Dunford-Shore, T.L. Miner, K. Delehaunty, C. Markovic, G. Swift, W.Courtney, C. Pohl, S. Abbott, A. Hawkins, S. Leong, C. Haipek, H. Schmidt, M. Wiechert, T. Vickery, S. Scott, D.J.Dooling, A. Chinwalla, G.M. Weinstock, E.R. Mardis, R.K. Wilson, G. Getz, W. Winckler, R.G. Verhaak, M.S. Law-rence, M. O’Kelly, J. Robinson, G. Alexe, R. Beroukhim, S. Carter, D. Chiang, J. Gould, et al. 2008. Comprehensivegenomic characterization defines human glioblastoma genes and core pathways. Nature.
53. Mellinghoff, I.K., M.Y. Wang, I. Vivanco, D.A. Haas-Kogan, S. Zhu, E.Q. Dia, K.V. Lu, K. Yoshimoto, J.H. Huang,D.J. Chute, B.L. Riggs, S. Horvath, L.M. Liau, W.K. Cavenee, P.N. Rao, R. Beroukhim, T.C. Peck, J.C. Lee, W.R.Sellers, D. Stokoe, M. Prados, T.F. Cloughesy, C.L. Sawyers, and P.S. Mischel. 2005. Molecular determinants ofthe response of glioblastomas to EGFR kinase inhibitors. N Engl J Med. 353:2012-24.
54. Miele, E.A., D.R. Mills, and F.R. Kramer. 1983. Autocatalytic replication of a recombinant RNA. J Mol Biol.171:281-95.
55. Millimaggi, D., M. Mari, S. D’Ascenzo, E. Carosa, E.A. Jannini, S. Zucker, G. Carta, A. Pavan, and V. Dolo.2007. Tumor vesicle-associated CD147 modulates the angiogenic capability of endothelial cells. Neoplasia. 9:349-57.
56. Mosse, Y.P., M. Laudenslager, L. Longo, K.A. Cole, A. Wood, E.F. Attiyeh, M.J. Laquaglia, R. Sennett, J.E.Lynch, P. Perri, G. Laureys, F. Speleman, C. Kim, C. Hou, H. Hakonarson, A. Torkamani, N.J. Schork, G.M. Brodeur,G.P. Tonini, E. Rappaport, M. Devoto, and J.M. Maris. 2008. Identification of ALK as a major familial neuroblastomapredisposition gene. Nature.
57. Muerkoster, S., K. Wegehenkel, A. Arlt, M. Witt, B. Sipos, M.L. Kruse, T. Sebens, G. Kloppel, H. Kalthoff, U.R.Folsch, and H. Schafer. 2004. Tumor stroma interactions induce chemoresistance in pancreatic ductal carcinomacells involving increased secretion and paracrine effects of nitric oxide and interleukin-1beta. Cancer Res. 64:1331-7.
58. Myers, R.M., Z. Larin, and T. Maniatis. 1985. Detection of single base substitutions by ribonuclease cleavageat mismatches in RNA:DNA duplexes. Science. 230:1242-6.
EP 2 604 704 A1
36
5
10
15
20
25
30
35
40
45
50
55
59. Nagrath, S., L.V. Sequist, S. Maheswaran, D.W. Bell, D. Irimia, L. Ulkus, M.R. Smith, E.L. Kwak, S. Digumarthy,A. Muzikansky, P. Ryan, U.J. Balis, R.G. Tompkins, D.A. Haber, and M. Toner. 2007. Isolation of rare circulatingtumour cells in cancer patients by microchip technology. Nature. 450:1235-9.
60. Nakanishi, H., J. Groskopf, H.A. Fritsche, V. Bhadkamkar, A. Blase, S.V. Kumar, J.W. Davis, P. Troncoso, H.Rittenhouse, and R.J. Babaian. 2008. PCA3 molecular urine assay correlates with prostate cancer tumor volume:implication in selecting candidates for active surveillance. J Urol. 179:1804-9; discussion 1809-10.
61. Nakazawa, H., D. English, P.L. Randell, K. Nakazawa, N. Martel, B.K. Armstrong, and H. Yamasaki. 1994. UVand skin cancer: specific p53 gene mutation in normal skin as a biologically relevant exposure measurement. ProcNatl Acad Sci USA. 91:360-4.
62. Ng, E.K., T.N. Leung, N.B. Tsui, T.K. Lau, N.S. Panesar, R.W. Chiu, and Y.M. Lo. 2003a. The concentration ofcirculating corticotropin-releasing hormone mRNA in maternal plasma is increased in preeclampsia. Clin Chem. 49:727-31.
63. Ng, E.K., N.B. Tsui, T.K. Lau, T.N. Leung, R.W. Chiu, N.S. Panesar, L.C. Lit, K.W. Chan, and Y.M. Lo. 2003b.mRNA of placental origin is readily detectable in maternal plasma. Proc Natl Acad Sci USA. 100:4748-53.
64. Nishikawa, R., T. Sugiyama, Y. Narita, F. Furnari, W.K. Cavenee, and M. Matsutani. 2004. Immunohistochemicalanalysis of the mutant epidermal growth factor, deltaEGFR, in glioblastoma. Brain Tumor Pathol. 21:53-6.
65. Orita, M., H. Iwahana, H. Kanazawa, K. Hayashi, and T. Sekiya. 1989. Detection of polymorphisms of humanDNA by gel electrophoresis as single-strand conformation polymorphisms. Proc Natl Acad Sci USA. 86:2766-70.
66. Pan, B.T., and R.M. Johnstone. 1983. Fate of the transferrin receptor during maturation of sheep reticulocytesin vitro: selective externalization of the receptor. Cell. 33:967-78.
67. Parsons, D.W., S. Jones, X. Zhang, J.C. Lin, R.J. Leary, P. Angenendt, P. Mankoo, H. Carter, I.M. Siu, G.L.Gallia, A. Olivi, R. McLendon, B.A. Rasheed, S. Keir, T. Nikolskaya, Y. Nikolsky, D.A. Busam, H. Tekleab, L.A. Diaz,Jr., J. Hartigan, D.R. Smith, R.L. Strausberg, S.K. Marie, S.M. Shinjo, H. Yan, G.J. Riggins, D.D. Bigner, R. Karchin,N. Papadopoulos, G. Parmigiani, B. Vogelstein, V.E. Velculescu, and K.W. Kinzler. 2008. An Integrated GenomicAnalysis of Human Glioblastoma Multiforme. Science.
68. Pelloski, C.E., K.V. Ballman, A.F. Furth, L. Zhang, E. Lin, E.P. Sulman, K. Bhat, J.M. McDonald, W.K. Yung, H.Colman, S.Y. Woo, A.B. Heimberger, D. Suki, M.D. Prados, S.M. Chang, F.G. Barker, 2nd, J.C. Buckner, C.D.James, and K. Aldape. 2007. Epidermal growth factor receptor variant III status defines clinically distinct subtypesof glioblastoma. J Clin Oncol. 25:2288-94.
69. Raposo, G., H.W. Nijman, W. Stoorvogel, R. Liejendekker, C.V. Harding, C.J. Melief, and H.J. Geuze. 1996. Blymphocytes secrete antigen-presenting vesicles. J Exp Med. 183:1161-72.
70. Roe, M.A., C. Spinks, A.L. Heath, L.J. Harvey, R. Foxall, J. Wimperis, C. Wolf, and S.J. Fairweather-Tait. 2007.Serum prohepcidin concentration: no association with iron absorption in healthy men; and no relationship with ironstatus in men carrying HFE mutations, hereditary haemochromatosis patients undergoing phlebotomy treatment,or pregnant women. Br J Nutr. 97:544-9.
71. Schetter, A.J., S.Y. Leung, J.J. Sohn, K.A. Zanetti, E.D. Bowman, N. Yanaihara, S.T. Yuen, T.L. Chan, D.L.Kwong, G.K. Au, C.G. Liu, G.A. Calin, C.M. Croce, and C.C. Harris. 2008. MicroRNA expression profiles associatedwith prognosis and therapeutic outcome in colon adenocarcinoma. JAMA. 299:425-36.
72. Singer, C.F., D. Gschwantler-Kaulich, A. Fink-Retter, C. Haas, G. Hudelist, K. Czerwenka, and E. Kubista. 2007.Differential gene expression profile in breast cancer-derived stromal fibroblasts. Breast Cancer Res Treat.
73. Steemers, F.J., W. Chang, G. Lee, D.L. Barker, R. Shen, and K.L. Gunderson. 2006. Whole-genome genotypingwith the single-base extension assay. Nat Methods. 3:31-3.
74. Stupp, R., W.P. Mason, M.J. van den Bent, M. Weller, B. Fisher, M.J. Taphoorn, K. Belanger, A.A. Brandes, C.
EP 2 604 704 A1
37
5
10
15
20
25
30
35
40
45
50
55
Marosi, U. Bogdahn, J. Curschmann, R.C. Janzer, S.K. Ludwin, T. Gorlia, A. Allgeier, D. Lacombe, J.G. Cairncross,E. Eisenhauer, and R.O. Mirimanoff. 2005. Radiotherapy plus concomitant and adjuvant temozolomide for gliob-lastoma. N Engl J Med. 352:987-96.
75. Taylor, D.D., and C. Gercel-Taylor. 2008. MicroRNA signatures of tumor-derived exosomes as diagnostic bi-omarkers of ovarian cancer. Gynecol Oncol. 110:13-21.
76. Thery, C., S. Amigorena, G. Raposo, and A. Clayton. 2006. Isolation and characterization of exosomes fromcell culture supernatants and biological fluids. Curr Protoc Cell Biol. Chapter 3:Unit 3 22.
77. Thery, C., L. Zitvogel, and S. Amigorena. 2002. Exosomes: composition, biogenesis and function. Nat RevImmunol. 2:569-79.
78. Tomlins, S.A., D.R. Rhodes, S. Perner, S.M. Dhanasekaran, R. Mehra, X.W. Sun, S. Varambally, X. Cao, J.Tchinda, R. Kuefer, C. Lee, J.E. Montie, R.B. Shah, K.J. Pienta, M.A. Rubin, and A.M. Chinnaiyan. 2005. Recurrentfusion of TMPRSS2 and ETS transcription factor genes in prostate cancer. Science. 310:644-8.
79. Valadi, H., K. Ekstrom, A. Bossios, M. Sjostrand, J.J. Lee, and J.O. Lotvall. 2007. Exosome-mediated transferof mRNAs and microRNAs is a novel mechanism of genetic exchange between cells. Nat Cell Biol. 9:654-9.
80. van Dijk, E.L., G. Schilders, and G.J. Pruijn. 2007. Human cell growth requires a functional cytoplasmic exosome,which is involved in various mRNA decay pathways. RNA. 13:1027-35.
81. Velculescu, V.E., L. Zhang, B. Vogelstein, and K.W. Kinzler. 1995. Serial analysis of gene expression. Science.270:484-7.
82. Weiss, G., and L.T. Goodnough. 2005. Anemia of chronic disease. N Engl J Med. 352:1011-23.
83. Went, P.T., A. Lugli, S. Meier, M. Bundi, M. Mirlacher, G. Sauter, and S. Dirnhofer. 2004. Frequent EpCamprotein expression in human carcinomas. Hum Pathol. 35:122-8.
84. Wieckowski, E., and T.L. Whiteside. 2006. Human tumor-derived vs dendritic cell-derived exosomes have distinctbiologic roles and molecular profiles. Immunol Res. 36:247-54.
85. Wong, B.C., R.W. Chiu, N.B. Tsui, K.C. Chan, L.W. Chan, T.K. Lau, T.N. Leung, and Y.M. Lo. 2005. Circulatingplacental RNA in maternal plasma is associated with a preponderance of 5’mRNA fragments: implications for non-invasive prenatal diagnosis and monitoring. Clin Chem. 51:1786-95.
86. Wood, L.D., D.W. Parsons, S. Jones, J. Lin, T. Sjoblom, R.J. Leary, D. Shen, S.M. Boca, T. Barber, J. Ptak, N.Silliman, S. Szabo, Z. Dezso, V. Ustyanksky, T. Nikolskaya, Y. Nikolsky, R. Karchin, P.A. Wilson, J.S. Kaminker,Z. Zhang, R. Croshaw, J. Willis, D. Dawson, M. Shipitsin, J.K. Willson, S. Sukumar, K. Polyak, B.H. Park, C.L.Pethiyagoda, P.V. Pant, D.G. Ballinger, A.B. Sparks, J. Hartigan, D.R. Smith, E. Suh, N. Papadopoulos, P. Buck-haults, S.D. Markowitz, G. Parmigiani, K.W. Kinzler, V.E. Velculescu, and B. Vogelstein. 2007. The genomic land-scapes of human breast and colorectal cancers. Science. 318:1108-13.
87. Wright, J.L., and P.H. Lange. 2007. Newer potential biomarkers in prostate cancer. Rev Urol. 9:207-13.
88. Zehentner, B.K., H. Secrist, X. Zhang, D.C. Hayes, R. Ostenson, G. Goodman, J. Xu, M. Kiviat, N. Kiviat, D.H.Persing, and R.L. Houghton. 2006. Detection of alpha-methylacyl-coenzyme-A racemase transcripts in blood andurine samples of prostate cancer patients. Mol Diagn Ther. 10:397-403.
89. Zielie, P.J., J.A. Mobley, R.G. Ebb, Z. Jiang, R.D. Blute, and S.M. Ho. 2004. A novel diagnostic test for prostatecancer emerges from the determination of alpha-methylacyl-coenzyme a racemase in prostatic secretions. J Urol.172:1130-3.
Table 1. RNA in glioblastoma microvesicles can be used as sensitive biomarkers.
[0166] Nested RT-PCR was used to monitor EGFRvIII mRNA in glioma biopsy tissue as well as exosomes purified
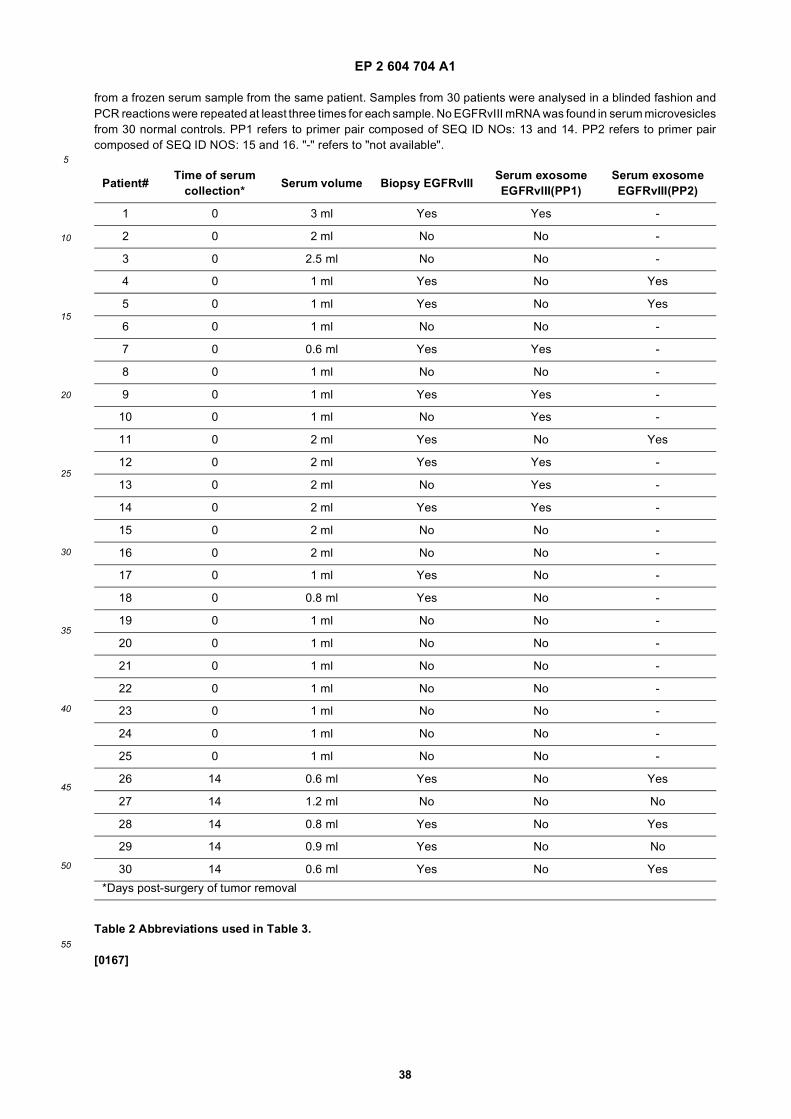
EP 2 604 704 A1
38
5
10
15
20
25
30
35
40
45
50
55
from a frozen serum sample from the same patient. Samples from 30 patients were analysed in a blinded fashion andPCR reactions were repeated at least three times for each sample. No EGFRvIII mRNA was found in serum microvesiclesfrom 30 normal controls. PP1 refers to primer pair composed of SEQ ID NOs: 13 and 14. PP2 refers to primer paircomposed of SEQ ID NOS: 15 and 16. "-" refers to "not available".
Table 2 Abbreviations used in Table 3.
[0167]
Patient#Time of serum
collection*Serum volume Biopsy EGFRvIII
Serum exosome EGFRvIII(PP1)
Serum exosome EGFRvIII(PP2)
1 0 3 ml Yes Yes -
2 0 2 ml No No -
3 0 2.5 ml No No -
4 0 1 ml Yes No Yes
5 0 1 ml Yes No Yes
6 0 1 ml No No -
7 0 0.6 ml Yes Yes -
8 0 1 ml No No -
9 0 1 ml Yes Yes -
10 0 1 ml No Yes -
11 0 2 ml Yes No Yes
12 0 2 ml Yes Yes -
13 0 2 ml No Yes -
14 0 2 ml Yes Yes -
15 0 2 ml No No -
16 0 2 ml No No -
17 0 1 ml Yes No -
18 0 0.8 ml Yes No -
19 0 1 ml No No -
20 0 1 ml No No -
21 0 1 ml No No -
22 0 1 ml No No -
23 0 1 ml No No -
24 0 1 ml No No -
25 0 1 ml No No -
26 14 0.6 ml Yes No Yes
27 14 1.2 ml No No No
28 14 0.8 ml Yes No Yes
29 14 0.9 ml Yes No No
30 14 0.6 ml Yes No Yes
*Days post-surgery of tumor removal
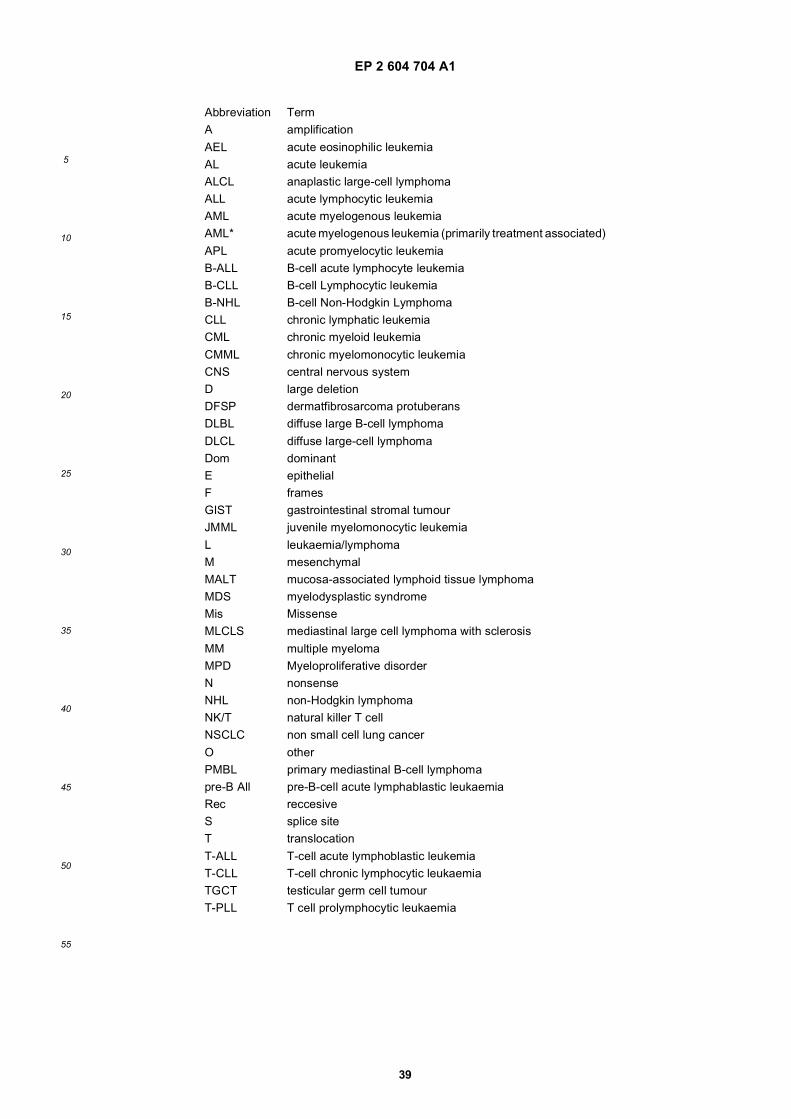
EP 2 604 704 A1
39
5
10
15
20
25
30
35
40
45
50
55
Abbreviation TermA amplification
AEL acute eosinophilic leukemiaAL acute leukemiaALCL anaplastic large-cell lymphomaALL acute lymphocytic leukemiaAML acute myelogenous leukemiaAML* acute myelogenous leukemia (primarily treatment associated)
APL acute promyelocytic leukemiaB-ALL B-cell acute lymphocyte leukemiaB-CLL B-cell Lymphocytic leukemiaB-NHL B-cell Non-Hodgkin LymphomaCLL chronic lymphatic leukemiaCML chronic myeloid leukemia
CMML chronic myelomonocytic leukemiaCNS central nervous systemD large deletionDFSP dermatfibrosarcoma protuberansDLBL diffuse large B-cell lymphoma
DLCL diffuse large-cell lymphomaDom dominantE epithelialF framesGIST gastrointestinal stromal tumourJMML juvenile myelomonocytic leukemia
L leukaemia/lymphomaM mesenchymalMALT mucosa-associated lymphoid tissue lymphomaMDS myelodysplastic syndromeMis MissenseMLCLS mediastinal large cell lymphoma with sclerosis
MM multiple myelomaMPD Myeloproliferative disorderN nonsenseNHL non-Hodgkin lymphomaNK/T natural killer T cellNSCLC non small cell lung cancer
O otherPMBL primary mediastinal B-cell lymphomapre-B All pre-B-cell acute lymphablastic leukaemiaRec reccesiveS splice siteT translocation
T-ALL T-cell acute lymphoblastic leukemiaT-CLL T-cell chronic lymphocytic leukaemiaTGCT testicular germ cell tumourT-PLL T cell prolymphocytic leukaemia
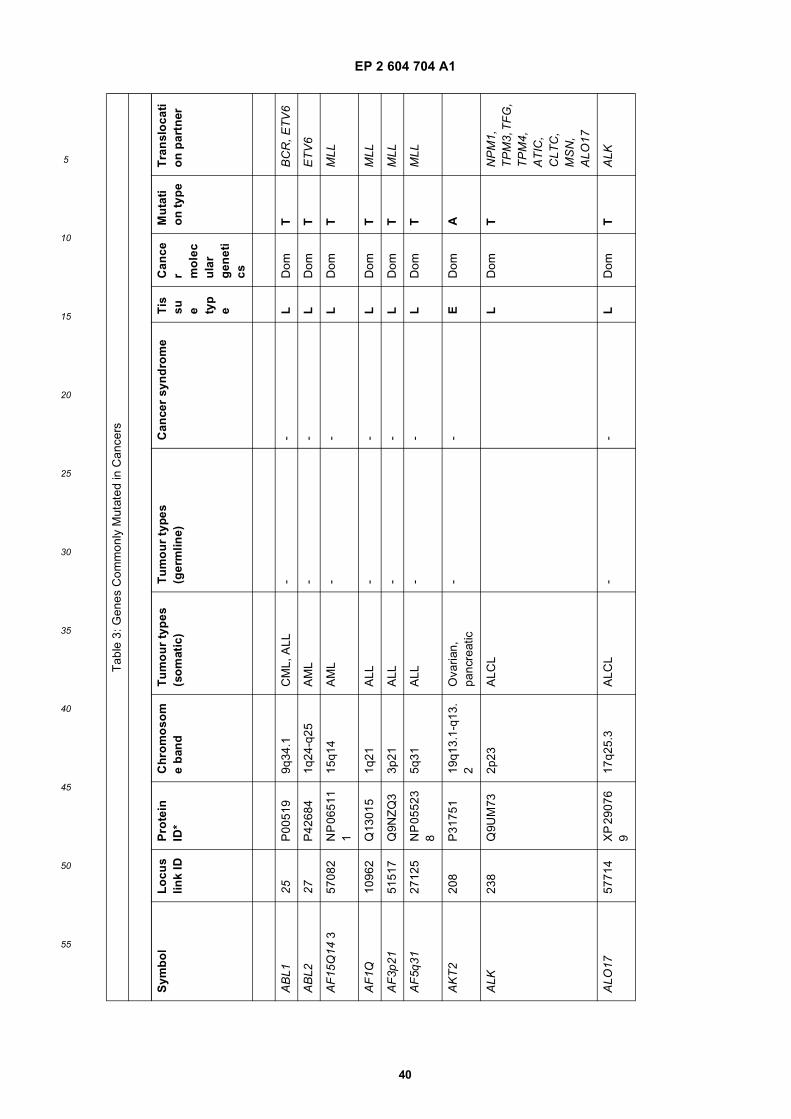
EP 2 604 704 A1
40
5
10
15
20
25
30
35
40
45
50
55
Tab
le 3
: Gen
es C
omm
only
Mut
ated
in C
ance
rs
Sym
bo
lL
ocu
slin
k ID
Pro
tein
ID
*C
hro
mo
som
e b
and
Tu
mo
ur
typ
es
(so
mat
ic)
Tu
mo
ur
typ
es
(ger
mlin
e)C
ance
r sy
nd
rom
eT
issu e ty
pe
Can
cer m
ole
cu
lar
gen
eti
cs
Mu
tati
on
typ
eT
ran
slo
cati
on
par
tner
AB
L125
P00
519
9q34
.1C
ML,
ALL
--
LD
omT
BC
R, E
TV
6
AB
L227
P42
684
1q24
-q25
AM
L-
-L
Dom
TE
TV
6
AF
15Q
14 3
5708
2N
P 0
6511
1
15q1
4A
ML
--
LD
omT
MLL
AF
1Q10
962
Q13
015
1q21
ALL
--
LD
omT
MLL
AF
3p21
5151
7Q
9NZ
Q3
3p21
ALL
--
LD
omT
MLL
AF
5q31
2712
5N
P 0
5523
8
5q31
ALL
--
LD
omT
MLL
AK
T2
208
P31
751
19q1
3.1-
q13.
2O
varia
n,
panc
reat
ic-
-E
Dom
A
ALK
238
Q9U
M73
2p23
ALC
LL
Dom
TN
PM
1,
TP
M3,
TF
G,
TP
M4,
A
TIC
, C
LTC
, M
SN
, A
LO17
ALO
1757
714
XP
290
76
917
q25.
3A
LCL
--
LD
omT
ALK
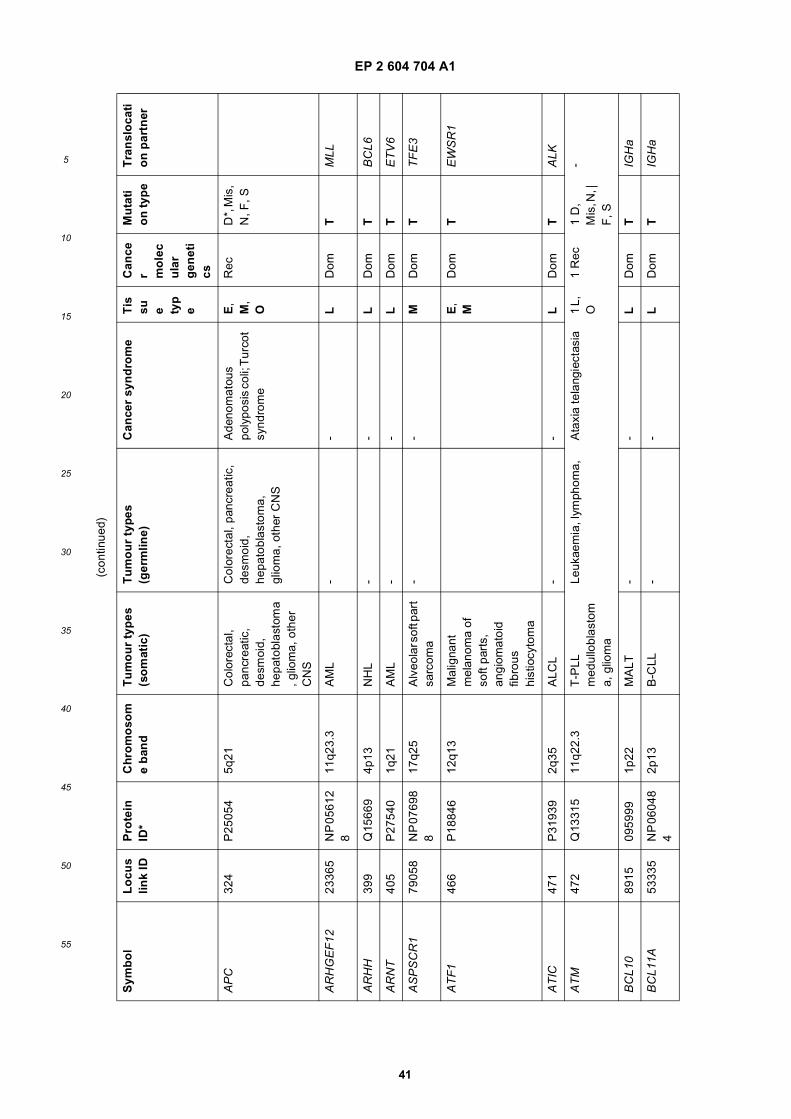
EP 2 604 704 A1
41
5
10
15
20
25
30
35
40
45
50
55
(con
tinue
d)
Sym
bo
lL
ocu
slin
k ID
Pro
tein
ID
*C
hro
mo
som
e b
and
Tu
mo
ur
typ
es
(so
mat
ic)
Tu
mo
ur
typ
es
(ger
mlin
e)C
ance
r sy
nd
rom
eT
issu e ty
pe
Can
cer m
ole
cu
lar
gen
eti
cs
Mu
tati
on
typ
eT
ran
slo
cati
on
par
tner
AP
C32
4P
2505
45q
21C
olor
ecta
l, pa
ncre
atic
, de
smoi
d,
hepa
tobl
asto
ma
, glio
ma,
oth
er
CN
S
Col
orec
tal,
panc
reat
ic,
desm
oid,
he
pato
blas
tom
a,
glio
ma,
oth
er C
NS
Ade
nom
atou
s po
lypo
sis
coli;
Tur
cot
synd
rom
e
E,
M,
O
Rec
D*,
Mis
, N
, F, S
AR
HG
EF
1223
365
NP
056
12
811
q23.
3A
ML
--
LD
omT
MLL
AR
HH
399
Q15
669
4p13
NH
L-
-L
Dom
TB
CL6
AR
NT
405
P27
540
1q21
AM
L-
-L
Dom
TE
TV
6
AS
PS
CR
179
058
NP
076
98
817
q25
Alv
eola
r sof
t par
t sa
rcom
a-
-M
Dom
TT
FE
3
AT
F1
466
P18
846
12q1
3M
alig
nant
m
elan
oma
of
soft
part
s,
angi
omat
oid
fibro
us
hist
iocy
tom
a
E,
MD
omT
EW
SR
1
AT
IC47
1P
3193
92q
35A
LCL
--
LD
omT
ALK
AT
M47
2Q
1331
511
q22.
3T
-PLL
m
edul
lobl
asto
ma,
glio
ma
Leuk
aem
ia, l
ymph
oma,
Ata
xia
tela
ngie
ctas
ia1
L,
O1
Rec
1 D
, M
is, N
, |
F, S
-
BC
L10
8915
0959
991p
22M
ALT
--
LD
omT
IGH
a
BC
L11A
5333
5N
P 0
6048
4
2p13
B-C
LL-
-L
Dom
TIG
Ha
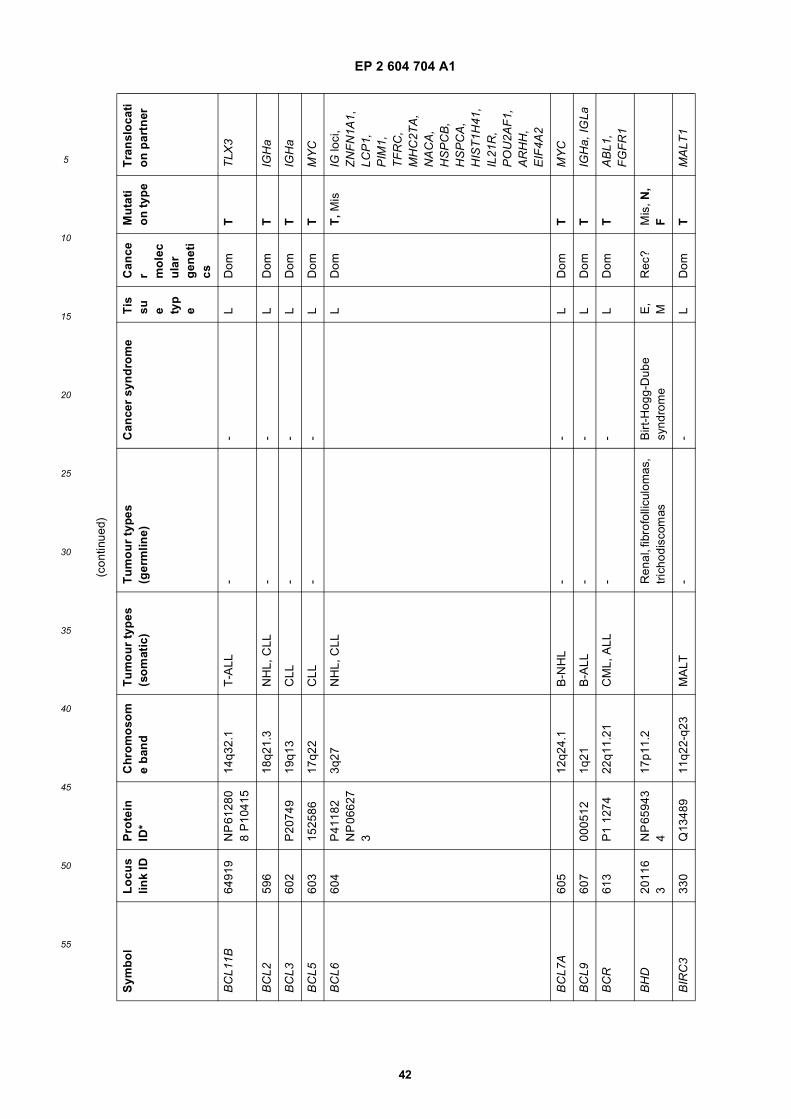
EP 2 604 704 A1
42
5
10
15
20
25
30
35
40
45
50
55
(con
tinue
d)
Sym
bo
lL
ocu
slin
k ID
Pro
tein
ID
*C
hro
mo
som
e b
and
Tu
mo
ur
typ
es
(so
mat
ic)
Tu
mo
ur
typ
es
(ger
mlin
e)C
ance
r sy
nd
rom
eT
issu e ty
pe
Can
cer m
ole
cu
lar
gen
eti
cs
Mu
tati
on
typ
eT
ran
slo
cati
on
par
tner
BC
L11B
6491
9N
P 6
1280
8
P10
415
14q3
2.1
T-A
LL-
-L
Dom
TT
LX3
BC
L259
618
q21.
3N
HL,
CLL
--
LD
omT
IGH
a
BC
L360
2P
2074
919
q13
CLL
--
LD
omT
IGH
a
BC
L560
315
2586
17q2
2C
LL-
-L
Dom
TM
YC
BC
L660
4P
4118
2 N
P 0
6627
3
3q27
NH
L, C
LLL
Dom
T, M
isIG
loci
, Z
NF
N1A
1,
LCP
1,
PIM
1,
TF
RC
, M
HC
2TA
, N
AC
A,
HS
PC
B,
HS
PC
A,
HIS
T1H
41,
IL21
R,
PO
U2A
F1,
A
RH
H,
EIF
4A2
BC
L7A
605
12q2
4.1
B-N
HL
--
LD
omT
MY
C
BC
L960
700
0512
1q21
B-A
LL-
-L
Dom
TIG
Ha,
IGLa
BC
R61
3P
1 12
7422
q11.
21C
ML,
ALL
--
LD
omT
AB
L1,
FG
FR
1
BH
D20
116
3N
P 6
5943
4
17p1
1.2
Ren
al, f
ibro
folli
culo
mas
, tr
icho
disc
omas
Birt
-Hog
g-D
ube
synd
rom
eE
, M
Rec
?M
is, N
, F
BIR
C3
330
Q13
489
11q2
2-q2
3M
ALT
--
LD
omT
MA
LT1

EP 2 604 704 A1
43
5
10
15
20
25
30
35
40
45
50
55
(con
tinue
d)
Sym
bo
lL
ocu
slin
k ID
Pro
tein
ID
*C
hro
mo
som
e b
and
Tu
mo
ur
typ
es
(so
mat
ic)
Tu
mo
ur
typ
es
(ger
mlin
e)C
ance
r sy
nd
rom
eT
issu e ty
pe
Can
cer m
ole
cu
lar
gen
eti
cs
Mu
tati
on
typ
eT
ran
slo
cati
on
par
tner
BLM
641
P54
132
15q2
6.1
Leuk
aem
ia, l
ymph
oma,
sk
in s
quam
ous
cell,
ot
her
canc
ers
Blo
om S
yndr
ome
L, E
Rec
Mis
, N,
F
BM
PR
IA65
7P
3689
410
q22.
3G
astr
oint
estin
al p
olyp
sJu
veni
le p
olyp
osis
ER
ecM
is, N
, F
BR
AF
673
P15
056
7q34
Mel
anom
a,
colo
rect
al,
papi
llary
thyr
oid,
bo
rder
line
ovar
ian,
N
SC
LC,
chol
angi
ocar
cin
oma
ED
omM
D,
Mis
, N,
F, S
BR
CA
167
2P
3839
817
q21
Ova
rian
Bre
ast,
ovar
ian
Her
edita
ry
brea
st/o
varia
nE
Rec
BR
CA
267
5P
5158
713
q12
Bre
ast,
ovar
ian,
pa
ncre
atic
Bre
ast,
ovar
ian,
pa
ncre
atic
, leu
kaem
ia
(FA
NC
B, F
AN
CD
1)
Her
edita
ry b
reas
t/L,
E
ova
ria n
Rec
D, M
is,
N,
-F, S
BR
D4
2347
606
0885
19p1
3.1
Leth
al m
idlin
e ca
rcin
oma
of
youn
g pe
ople
ED
omT
NU
T
BT
G1
694
P31
607
12q2
2B
CLL
--
LD
omT
MY
C
CB
FA
2T1
862
0064
558q
22A
ML
--
LD
omT
MLL
, R
UN
X1
CB
EA
2T3
863
NP
005
17
816
q24
AM
L-
-L
Dom
TR
UN
X1
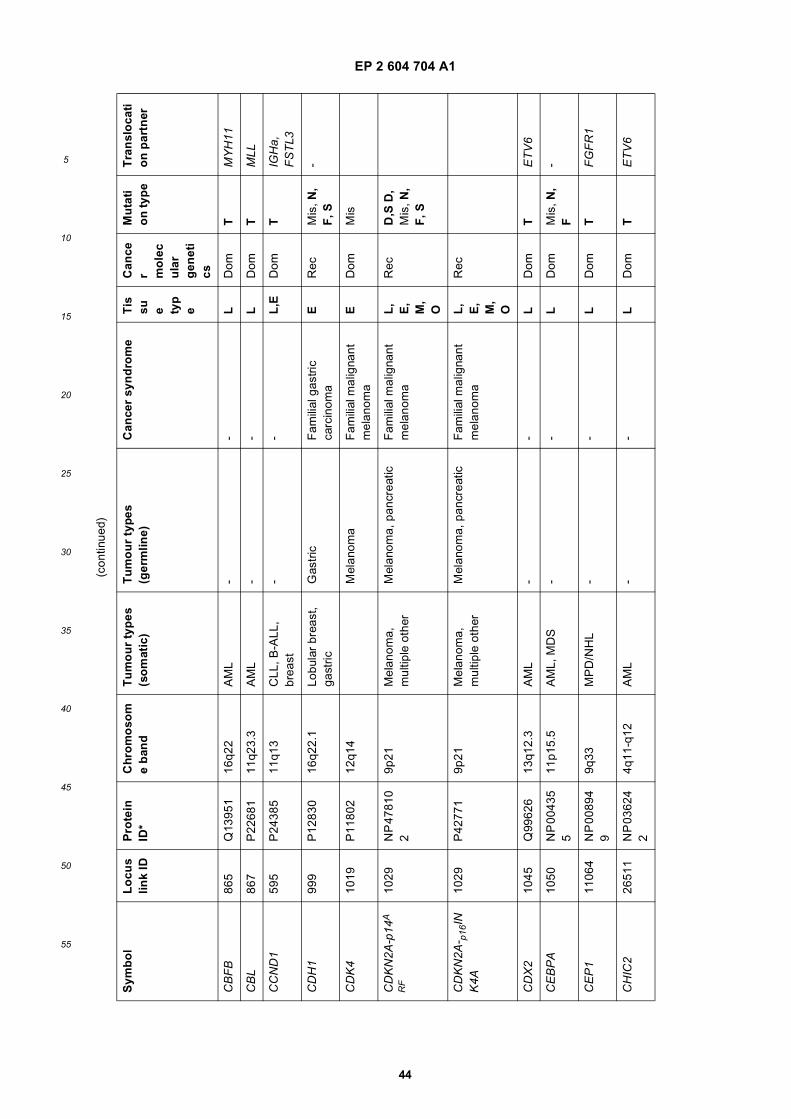
EP 2 604 704 A1
44
5
10
15
20
25
30
35
40
45
50
55
(con
tinue
d)
Sym
bo
lL
ocu
slin
k ID
Pro
tein
ID
*C
hro
mo
som
e b
and
Tu
mo
ur
typ
es
(so
mat
ic)
Tu
mo
ur
typ
es
(ger
mlin
e)C
ance
r sy
nd
rom
eT
issu e ty
pe
Can
cer m
ole
cu
lar
gen
eti
cs
Mu
tati
on
typ
eT
ran
slo
cati
on
par
tner
CB
FB
865
Q13
951
16q2
2A
ML
--
LD
omT
MY
H11
CB
L86
7P
2268
111
q23.
3A
ML
--
LD
omT
MLL
CC
ND
159
5P
2438
511
q13
CLL
, B-A
LL,
brea
st-
-L
,ED
omT
IGH
a,
FS
TL3
CD
H1
999
P12
830
16q2
2.1
Lobu
lar
brea
st,
gast
ricG
astr
icF
amili
al g
astr
ic
carc
inom
aE
Rec
Mis
, N,
F, S
-
CD
K4
1019
P11
802
12q1
4M
elan
oma
Fam
ilial
mal
igna
nt
mel
anom
aE
Dom
Mis
CD
KN
2A-p
14A
RF
1029
NP
478
10
29p
21M
elan
oma,
m
ultip
le o
ther
Mel
anom
a, p
ancr
eatic
Fam
ilial
mal
igna
nt
mel
anom
aL
, E
, M
, O
Rec
D,S
D,
Mis
, N,
F, S
CD
KN
2A- p
16IN
K4A
1029
P42
771
9p21
Mel
anom
a,
mul
tiple
oth
erM
elan
oma,
pan
crea
ticF
amili
al m
alig
nant
m
elan
oma
L,
E,
M,
O
Rec
CD
X2
1045
Q99
626
13q1
2.3
AM
L-
-L
Dom
TE
TV
6
CE
BP
A10
50N
P 0
0435
5
11p1
5.5
AM
L, M
DS
--
LD
omM
is, N
, F
-
CE
P1
1106
4N
P 0
0894
9
9q33
MP
D/N
HL
--
LD
omT
FG
FR
1
CH
IC2
2651
1N
P 0
3624
2
4q11
-q12
AM
L-
-L
Dom
TE
TV
6
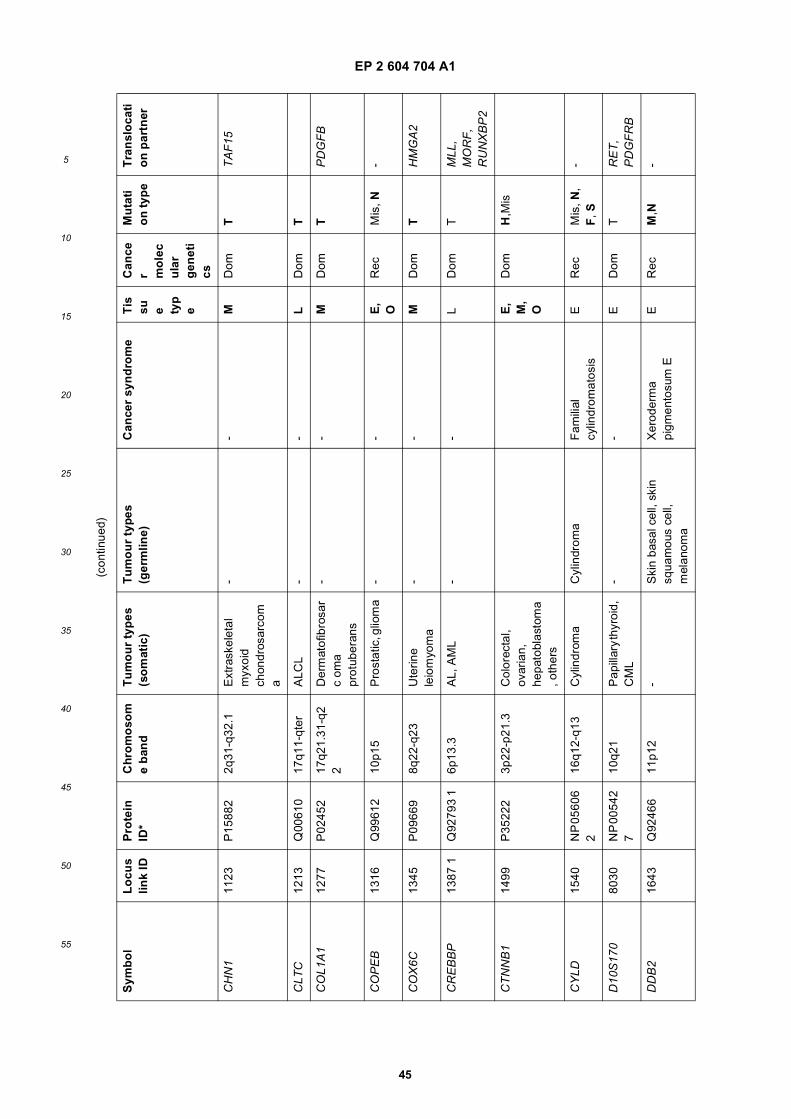
EP 2 604 704 A1
45
5
10
15
20
25
30
35
40
45
50
55
(con
tinue
d)
Sym
bo
lL
ocu
slin
k ID
Pro
tein
ID
*C
hro
mo
som
e b
and
Tu
mo
ur
typ
es
(so
mat
ic)
Tu
mo
ur
typ
es
(ger
mlin
e)C
ance
r sy
nd
rom
eT
issu e ty
pe
Can
cer m
ole
cu
lar
gen
eti
cs
Mu
tati
on
typ
eT
ran
slo
cati
on
par
tner
CH
N1
1123
P15
882
2q31
-q32
.1E
xtra
skel
etal
m
yxoi
d ch
ondr
osar
com
a
--
MD
omT
TA
F15
CLT
C12
13Q
0061
017
q11-
qter
ALC
L-
-L
Dom
T
CO
L1A
112
77P
0245
217
q21.
31-q
22
Der
mat
ofib
rosa
rc
oma
prot
uber
ans
--
MD
omT
PD
GF
B
CO
PE
B13
16Q
9961
210
p15
Pro
stat
ic, g
liom
a-
-E
, O
Rec
Mis
, N-
CO
X6C
1345
P09
669
8q22
-q23
Ute
rine
leio
myo
ma
--
MD
omT
HM
GA
2
CR
EB
BP
1387
1Q
9279
3 1
6p13
.3A
L, A
ML
--
LD
omT
MLL
, M
OR
F,
RU
NX
BP
2
CT
NN
B1
1499
P35
222
3p22
-p21
.3C
olor
ecta
l, ov
aria
n,
hepa
tobl
asto
ma
, oth
ers
E,
M,
O
Dom
H,M
is
CY
LD15
40N
P 0
5606
2
16q1
2-q1
3C
ylin
drom
aC
ylin
drom
aF
amili
al
cylin
drom
atos
isE
Rec
Mis
, N,
F, S
-
D10
S17
080
30N
P 0
0542
7
10q2
1P
apill
ary
thyr
oid,
C
ML
--
ED
omT
RE
T,
PD
GF
RB
DD
B2
1643
Q92
466
11p1
2-
Ski
n ba
sal c
ell,
skin
sq
uam
ous
cell,
m
elan
oma
Xer
oder
ma
pigm
ento
sum
EE
Rec
M,N
-
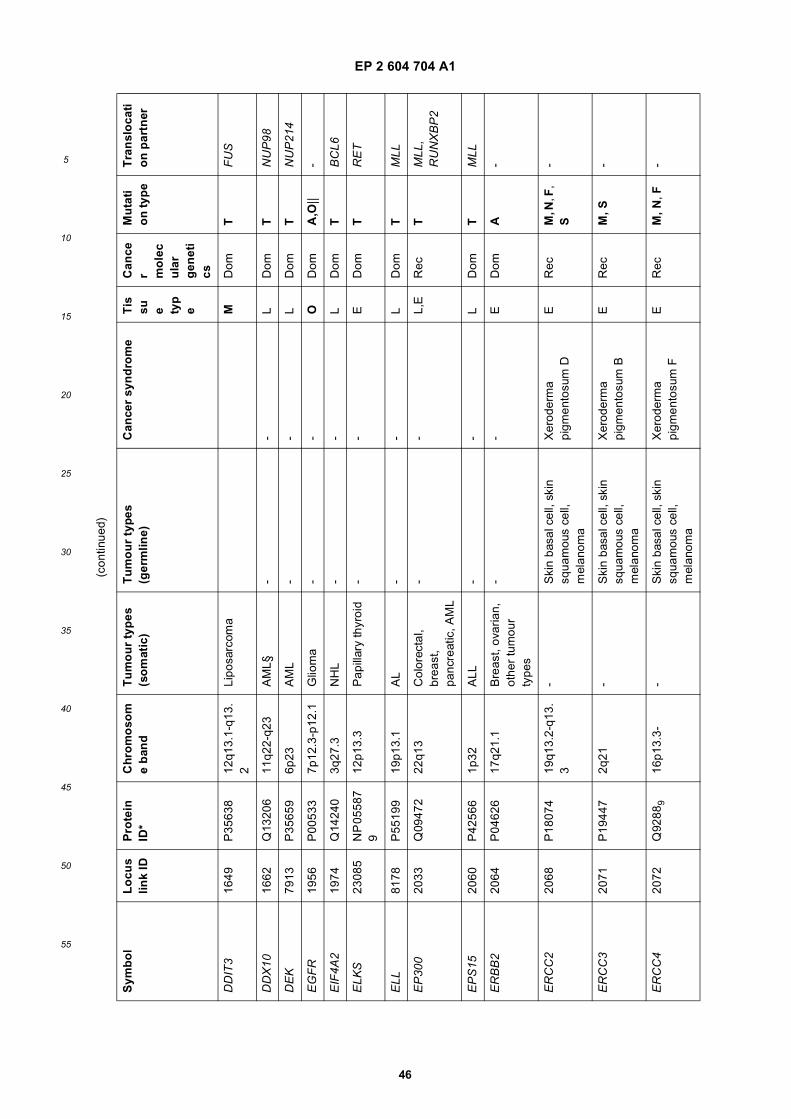
EP 2 604 704 A1
46
5
10
15
20
25
30
35
40
45
50
55
(con
tinue
d)
Sym
bo
lL
ocu
slin
k ID
Pro
tein
ID
*C
hro
mo
som
e b
and
Tu
mo
ur
typ
es
(so
mat
ic)
Tu
mo
ur
typ
es
(ger
mlin
e)C
ance
r sy
nd
rom
eT
issu e ty
pe
Can
cer m
ole
cu
lar
gen
eti
cs
Mu
tati
on
typ
eT
ran
slo
cati
on
par
tner
DD
IT3
1649
P35
638
12q1
3.1-
q13.
2Li
posa
rcom
aM
Dom
TF
US
DD
X10
1662
Q13
206
11q2
2-q2
3A
ML§
--
LD
omT
NU
P98
DE
K79
13P
3565
96p
23A
ML
--
LD
omT
NU
P21
4
EG
FR
1956
P00
533
7p12
.3-p
12.1
Glio
ma
--
OD
omA
,O||
-
EIF
4A2
1974
Q14
240
3q27
.3N
HL
--
LD
omT
BC
L6
ELK
S23
085
NP
055
87
912
p13.
3P
apill
ary
thyr
oid
--
ED
omT
RE
T
ELL
8178
P55
199
19p1
3.1
AL
--
LD
omT
MLL
EP
300
2033
Q09
472
22q1
3C
olor
ecta
l, br
east
, pa
ncre
atic
, AM
L
--
L,E
Rec
TM
LL,
RU
NX
BP
2
EP
S15
2060
P42
566
1p32
ALL
--
LD
omT
MLL
ER
BB
220
64P
0462
617
q21.
1B
reas
t, ov
aria
n,
othe
r tu
mou
r ty
pes
--
ED
omA
-
ER
CC
220
68P
1807
419
q13.
2-q1
3.3
-S
kin
basa
l cel
l, sk
in
squa
mou
s ce
ll,
mel
anom
a
Xer
oder
ma
pigm
ento
sum
DE
Rec
M, N
, F,
S-
ER
CC
320
71P
1944
72q
21-
Ski
n ba
sal c
ell,
skin
sq
uam
ous
cell,
m
elan
oma
Xer
oder
ma
pigm
ento
sum
BE
Rec
M, S
-
ER
CC
420
72Q
9288
916
p13.
3--
Ski
n ba
sal c
ell,
skin
sq
uam
ous
cell,
m
elan
oma
Xer
oder
ma
pigm
ento
sum
FE
Rec
M, N
, F-
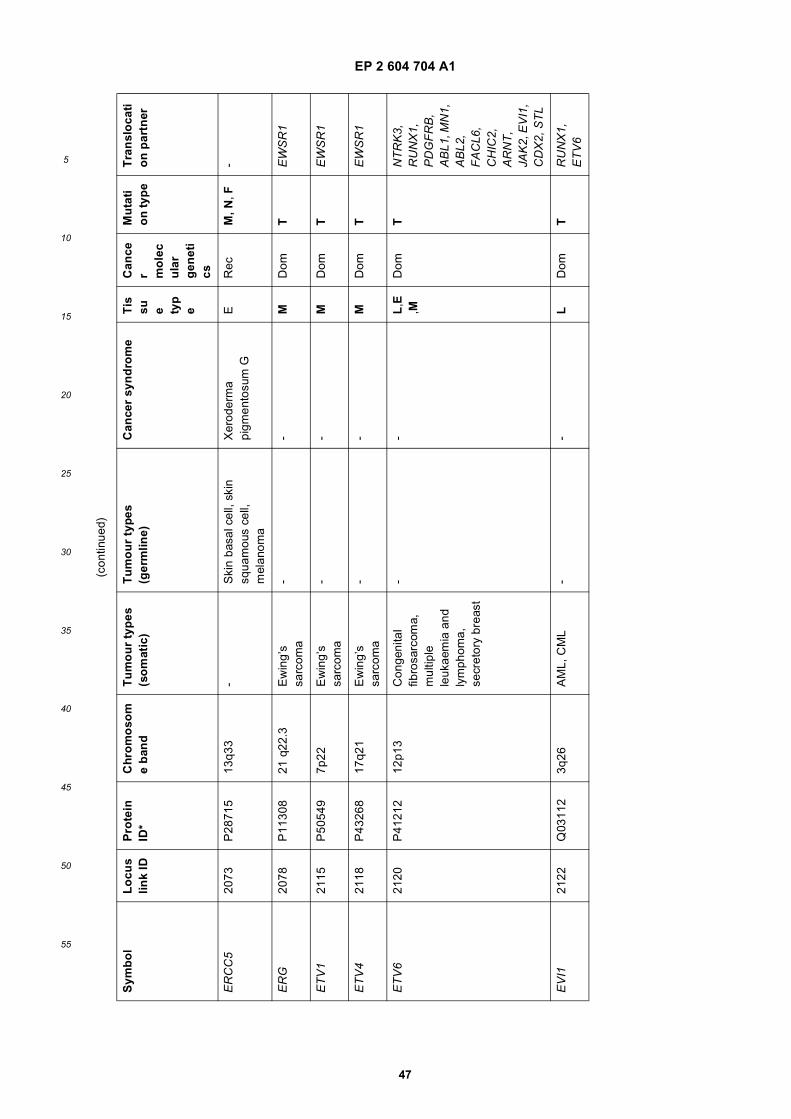
EP 2 604 704 A1
47
5
10
15
20
25
30
35
40
45
50
55
(con
tinue
d)
Sym
bo
lL
ocu
slin
k ID
Pro
tein
ID
*C
hro
mo
som
e b
and
Tu
mo
ur
typ
es
(so
mat
ic)
Tu
mo
ur
typ
es
(ger
mlin
e)C
ance
r sy
nd
rom
eT
issu e ty
pe
Can
cer m
ole
cu
lar
gen
eti
cs
Mu
tati
on
typ
eT
ran
slo
cati
on
par
tner
ER
CC
520
73P
2871
513
q33
-S
kin
basa
l cel
l, sk
in
squa
mou
s ce
ll,
mel
anom
a
Xer
oder
ma
pigm
ento
sum
GE
Rec
M, N
, F-
ER
G20
78P
1130
821
q22
.3E
win
g’s
sarc
oma
--
MD
omT
EW
SR
1
ET
V1
2115
P50
549
7p22
Ew
ing’
s sa
rcom
a-
-M
Dom
TE
WS
R1
ET
V4
2118
P43
268
17q2
1E
win
g’s
sarc
oma
--
MD
omT
EW
SR
1
ET
V6
2120
P41
212
12p1
3C
onge
nita
l fib
rosa
rcom
a,
mul
tiple
le
ukae
mia
and
ly
mph
oma,
se
cret
ory
brea
st
--
L,E
,MD
omT
NT
RK
3,
RU
NX
1,
PD
GF
RB
, A
BL1
, MN
1,
AB
L2,
FA
CL6
, C
HIC
2,
AR
NT
, JA
K2,
EV
I1,
CD
X2,
ST
L
EV
I121
22Q
0311
23q
26A
ML,
CM
L-
-L
Dom
TR
UN
X1,
E
TV
6
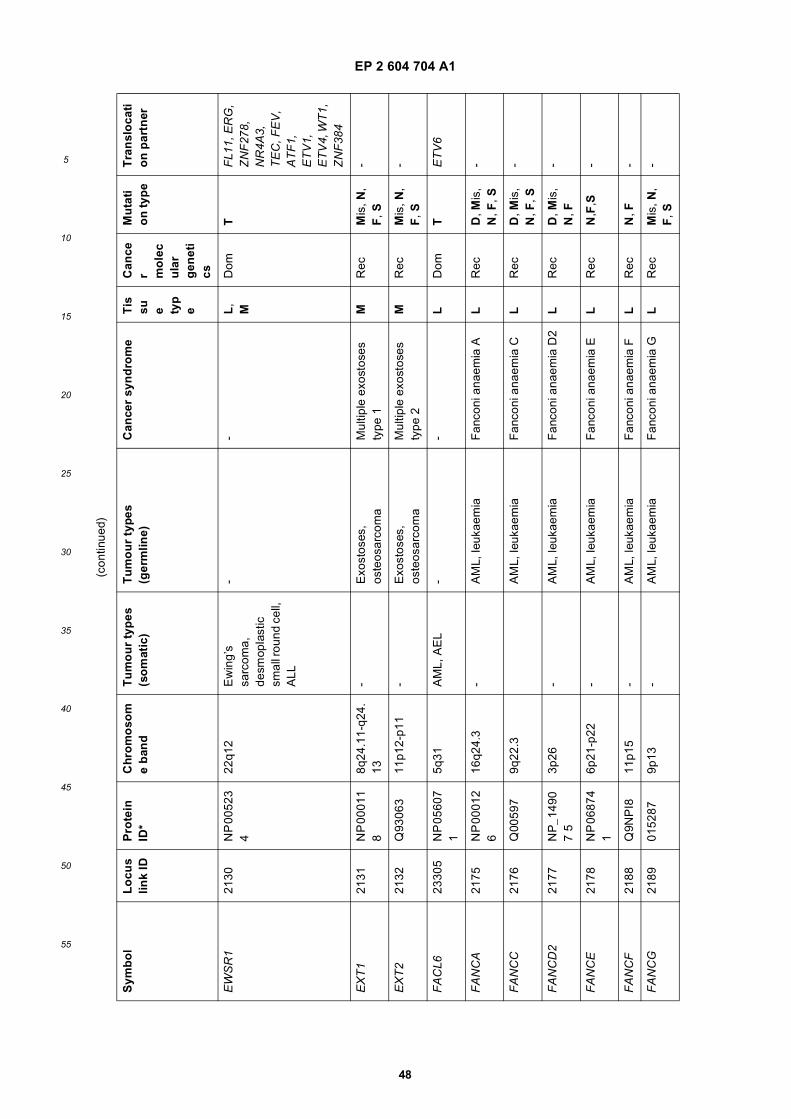
EP 2 604 704 A1
48
5
10
15
20
25
30
35
40
45
50
55
(con
tinue
d)
Sym
bo
lL
ocu
slin
k ID
Pro
tein
ID
*C
hro
mo
som
e b
and
Tu
mo
ur
typ
es
(so
mat
ic)
Tu
mo
ur
typ
es
(ger
mlin
e)C
ance
r sy
nd
rom
eT
issu e ty
pe
Can
cer m
ole
cu
lar
gen
eti
cs
Mu
tati
on
typ
eT
ran
slo
cati
on
par
tner
EW
SR
121
30N
P 0
0523
4
22q1
2E
win
g’s
sarc
oma,
de
smop
last
ic
smal
l rou
nd c
ell,
ALL
--
L,
MD
omT
FL1
1, E
RG
, Z
NF
278,
N
R4A
3,
TE
C, F
EV
, A
TF
1,
ET
V1,
E
TV
4, W
T1,
Z
NF
384
EX
T1
2131
NP
000
11
88q
24.1
1-q2
4.13
-E
xost
oses
, os
teos
arco
ma
Mul
tiple
exo
stos
es
type
1M
Rec
Mis
, N,
F, S
-
EX
T2
2132
Q93
063
11p1
2-p1
1-
Exo
stos
es,
oste
osar
com
aM
ultip
le e
xost
oses
ty
pe 2
MR
ecM
is, N
, F
, S-
FA
CL6
2330
5N
P 0
5607
1
5q31
AM
L, A
EL
--
LD
omT
ET
V6
FA
NC
A21
75N
P 0
0012
6
16q2
4.3
-A
ML,
leuk
aem
iaF
anco
ni a
naem
ia A
LR
ecD
, Mis
, N
, F, S
-
FA
NC
C21
76Q
0059
79q
22.3
AM
L, le
ukae
mia
Fan
coni
ana
emia
CL
Rec
D, M
is,
N, F
, S-
FA
NC
D2
2177
NP
_149
07
53p
26-
AM
L, le
ukae
mia
Fan
coni
ana
emia
D2
LR
ecD
, Mis
, N
, F-
FA
NC
E21
78N
P 0
6874
1
6p21
-p22
-A
ML,
leuk
aem
iaF
anco
ni a
naem
ia E
LR
ecN
,F,S
-
FA
NC
F21
88Q
9NP
I811
p15
-A
ML,
leuk
aem
iaF
anco
ni a
naem
ia F
LR
ecN
, F-
FA
NC
G21
8901
5287
9p13
-A
ML,
leuk
aem
iaF
anco
ni a
naem
ia G
LR
ecM
is, N
, F
, S-
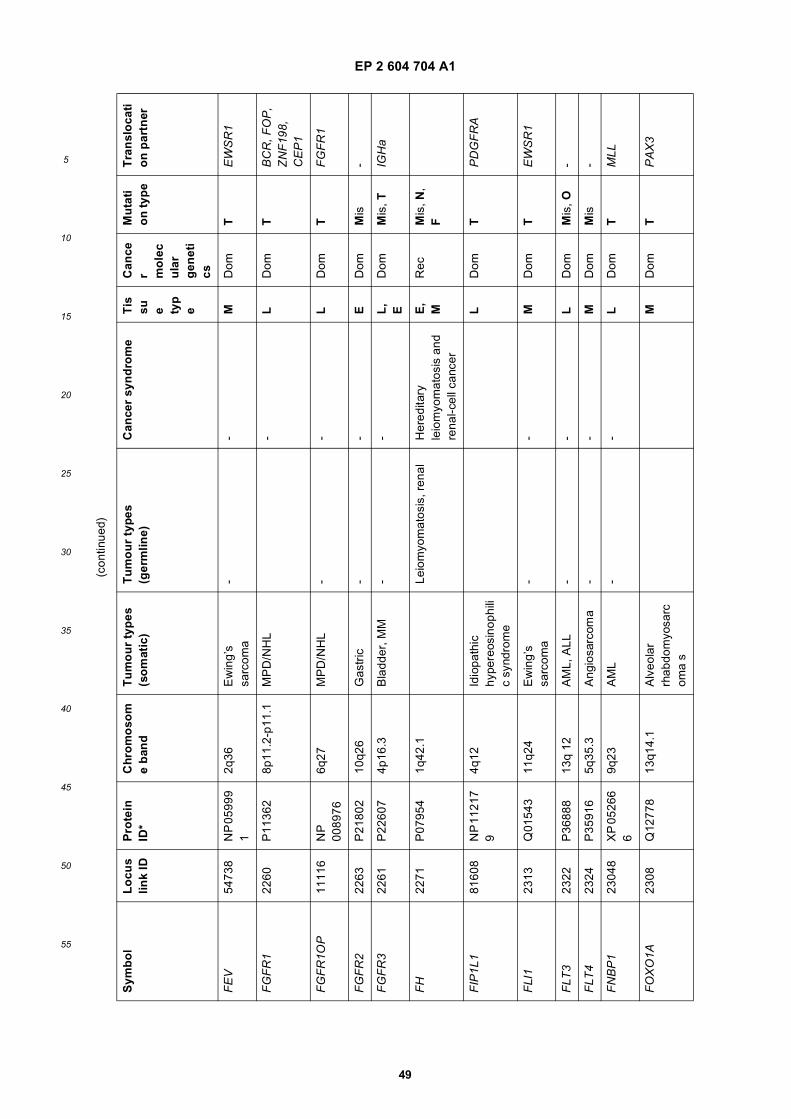
EP 2 604 704 A1
49
5
10
15
20
25
30
35
40
45
50
55
(con
tinue
d)
Sym
bo
lL
ocu
slin
k ID
Pro
tein
ID
*C
hro
mo
som
e b
and
Tu
mo
ur
typ
es
(so
mat
ic)
Tu
mo
ur
typ
es
(ger
mlin
e)C
ance
r sy
nd
rom
eT
issu e ty
pe
Can
cer m
ole
cu
lar
gen
eti
cs
Mu
tati
on
typ
eT
ran
slo
cati
on
par
tner
FE
V54
738
NP
059
99
12q
36E
win
g’s
sarc
oma
--
MD
omT
EW
SR
1
FG
FR
122
60P
1136
28p
11.2
-p11
.1M
PD
/NH
L-
LD
omT
BC
R, F
OP
, Z
NF
198,
C
EP
1
FG
FR
1OP
1111
6N
P
0089
766q
27M
PD
/NH
L-
-L
Dom
TF
GF
R1
FG
FR
222
63P
2180
210
q26
Gas
tric
--
ED
omM
is-
FG
FR
322
61P
2260
74p
16.3
Bla
dder
, MM
--
L,
ED
omM
is, T
IGH
a
FH
2271
P07
954
1q42
.1Le
iom
yom
atos
is, r
enal
Her
edita
ry
leio
myo
mat
osis
and
re
nal-c
ell c
ance
r
E,
MR
ecM
is, N
, F
FIP
1L1
8160
8N
P 1
1217
9
4q12
Idio
path
ic
hype
reos
inop
hili
c sy
ndro
me
LD
omT
PD
GF
RA
FLI
123
13Q
0154
311
q24
Ew
ing’
s sa
rcom
a-
-M
Dom
TE
WS
R1
FLT
323
22P
3688
813
q 12
AM
L, A
LL-
-L
Dom
Mis
, O-
FLT
423
24P
3591
65q
35.3
Ang
iosa
rcom
a-
-M
Dom
Mis
-
FN
BP
123
048
XP
052
66
69q
23A
ML
--
LD
omT
MLL
FO
XO
1A23
08Q
1277
813
q14.
1A
lveo
lar
rhab
dom
yosa
rcom
a s
MD
omT
PA
X3
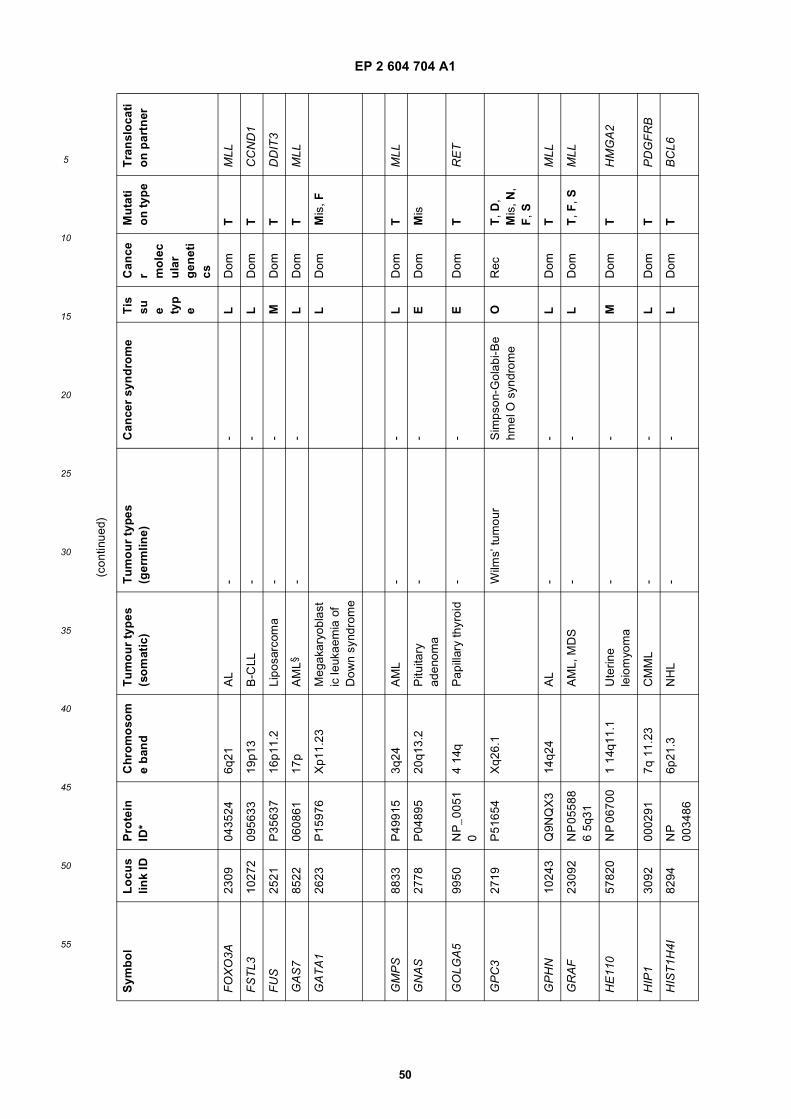
EP 2 604 704 A1
50
5
10
15
20
25
30
35
40
45
50
55
(con
tinue
d)
Sym
bo
lL
ocu
slin
k ID
Pro
tein
ID
*C
hro
mo
som
e b
and
Tu
mo
ur
typ
es
(so
mat
ic)
Tu
mo
ur
typ
es
(ger
mlin
e)C
ance
r sy
nd
rom
eT
issu e ty
pe
Can
cer m
ole
cu
lar
gen
eti
cs
Mu
tati
on
typ
eT
ran
slo
cati
on
par
tner
FO
XO
3A23
0904
3524
6q21
AL
--
LD
omT
MLL
FS
TL3
1027
209
5633
19p1
3B
-CLL
--
LD
omT
CC
ND
1
FU
S25
21P
3563
716
p11.
2Li
posa
rcom
a-
-M
Dom
TD
DIT
3
GA
S7
8522
0608
6117
pA
ML§
--
LD
omT
MLL
GA
TA
126
23P
1597
6X
p11.
23M
egak
aryo
blas
tic
leuk
aem
ia o
f D
own
synd
rom
e
LD
omM
is, F
GM
PS
8833
P49
915
3q24
AM
L-
-L
Dom
TM
LL
GN
AS
2778
P04
895
20q1
3.2
Pitu
itary
ad
enom
a-
-E
Dom
Mis
GO
LGA
599
50N
P_0
051
04
14q
Pap
illar
y th
yroi
d-
-E
Dom
TR
ET
GP
C3
2719
P51
654
Xq2
6.1
Wilm
s’ tu
mou
rS
imps
on-G
olab
i-Be
hmel
O s
yndr
ome
OR
ecT
, D,
Mis
, N,
F, S
GP
HN
1024
3Q
9NQ
X3
14q2
4A
L-
-L
Dom
TM
LL
GR
AF
2309
2N
P 0
5588
6
5q31
AM
L, M
DS
--
LD
omT
, F, S
MLL
HE
110
5782
0N
P 0
6700
1 14
q11.
1U
terin
e le
iom
yom
a-
-M
Dom
TH
MG
A2
HIP
130
9200
0291
7q 1
1.23
CM
ML
--
LD
omT
PD
GF
RB
HIS
T1H
4I82
94N
P
0034
866p
21.3
NH
L-
-L
Dom
TB
CL6
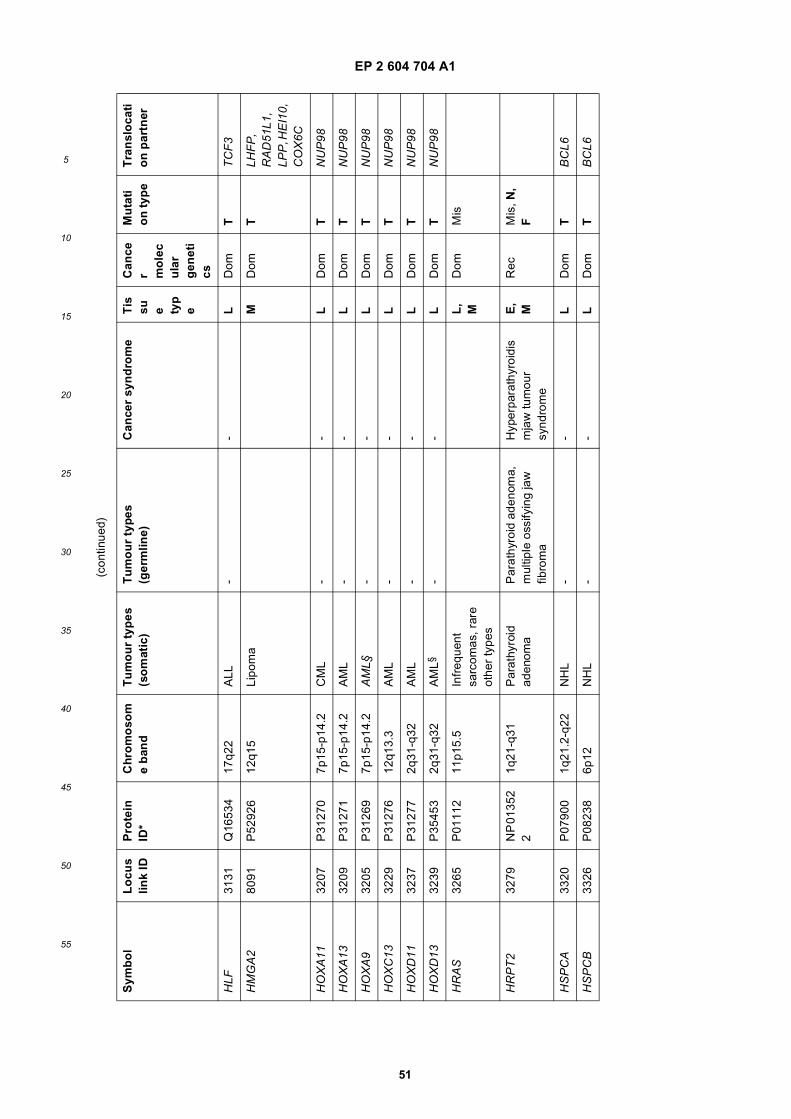
EP 2 604 704 A1
51
5
10
15
20
25
30
35
40
45
50
55
(con
tinue
d)
Sym
bo
lL
ocu
slin
k ID
Pro
tein
ID
*C
hro
mo
som
e b
and
Tu
mo
ur
typ
es
(so
mat
ic)
Tu
mo
ur
typ
es
(ger
mlin
e)C
ance
r sy
nd
rom
eT
issu e ty
pe
Can
cer m
ole
cu
lar
gen
eti
cs
Mu
tati
on
typ
eT
ran
slo
cati
on
par
tner
HLF
3131
Q16
534
17q2
2A
LL-
-L
Dom
TT
CF
3
HM
GA
280
91P
5292
612
q15
Lipo
ma
MD
omT
LHF
P,
RA
D51
L1,
LPP
, HE
I10,
C
OX
6C
HO
XA
1132
07P
3127
07p
15-p
14.2
CM
L-
-L
Dom
TN
UP
98
HO
XA
1332
09P
3127
17p
15-p
14.2
AM
L-
-L
Dom
TN
UP
98
HO
XA
932
05P
3126
97p
15-p
14.2
AM
L§-
-L
Dom
TN
UP
98
HO
XC
1332
29P
3127
612
q13.
3A
ML
--
LD
omT
NU
P98
HO
XD
1132
37P
3127
72q
31-q
32A
ML
--
LD
omT
NU
P98
HO
XD
1332
39P
3545
32q
31-q
32A
ML§
--
LD
omT
NU
P98
HR
AS
3265
P01
112
11p1
5.5
Infr
eque
nt
sarc
omas
, rar
e ot
her
type
s
L,
MD
omM
is
HR
PT
232
79N
P 0
1352
2
1q21
-q31
Par
athy
roid
ad
enom
aP
arat
hyro
id a
deno
ma,
m
ultip
le o
ssify
ing
jaw
fib
rom
a
Hyp
erpa
rath
yroi
dis
mja
w tu
mou
r sy
ndro
me
E,
MR
ecM
is, N
, F
HS
PC
A33
20P
0790
01q
21.2
-q22
NH
L-
-L
Dom
TB
CL6
HS
PC
B33
26P
0823
86p
12N
HL
--
LD
omT
BC
L6
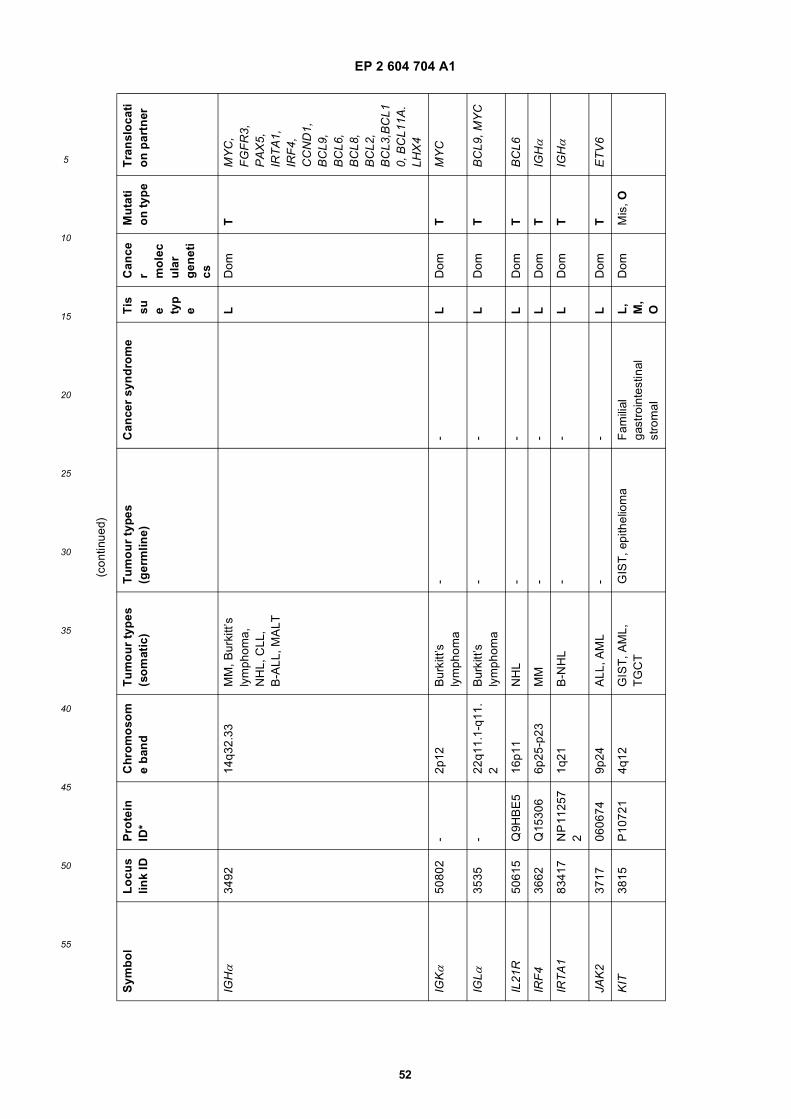
EP 2 604 704 A1
52
5
10
15
20
25
30
35
40
45
50
55
(con
tinue
d)
Sym
bo
lL
ocu
slin
k ID
Pro
tein
ID
*C
hro
mo
som
e b
and
Tu
mo
ur
typ
es
(so
mat
ic)
Tu
mo
ur
typ
es
(ger
mlin
e)C
ance
r sy
nd
rom
eT
issu e ty
pe
Can
cer m
ole
cu
lar
gen
eti
cs
Mu
tati
on
typ
eT
ran
slo
cati
on
par
tner
IGHα
3492
14q3
2.33
MM
, Bur
kitt’
s ly
mph
oma,
N
HL,
CLL
, B
-ALL
, MA
LT
LD
omT
MY
C,
FG
FR
3,
PA
X5,
IR
TA
1,
IRF
4,
CC
ND
1,
BC
L9,
BC
L6,
BC
L8,
BC
L2,
BC
L3,B
CL1
0, B
CL1
1A.
LHX
4
IGKα
5080
2-
2p12
Bur
kitt’
s ly
mph
oma
--
LD
omT
MY
C
IGL α
3535
-22
q11.
1-q1
1.2
Bur
kitt’
s ly
mph
oma
--
LD
omT
BC
L9, M
YC
IL21
R50
615
Q9H
BE
516
p11
NH
L-
-L
Dom
TB
CL6
IRF
436
62Q
1530
66p
25-p
23M
M-
-L
Dom
TIG
Hα
IRT
A1
8341
7N
P 1
1257
2
1q21
B-N
HL
--
LD
omT
IGHα
JAK
237
1706
0674
9p24
ALL
, AM
L-
-L
Dom
TE
TV
6
KIT
3815
P10
721
4q12
GIS
T, A
ML,
T
GC
TG
IST
, epi
thel
iom
aF
amili
al
gast
roin
test
inal
st
rom
al
L,
M,
O
Dom
Mis
, O
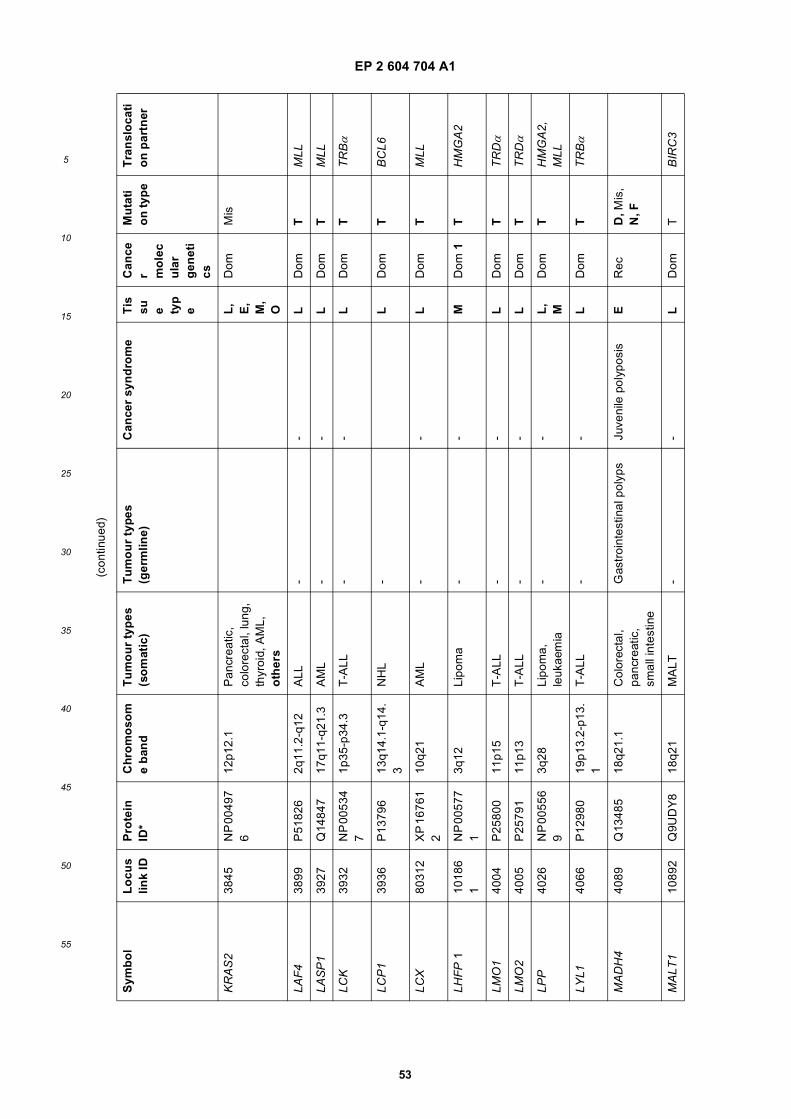
EP 2 604 704 A1
53
5
10
15
20
25
30
35
40
45
50
55
(con
tinue
d)
Sym
bo
lL
ocu
slin
k ID
Pro
tein
ID
*C
hro
mo
som
e b
and
Tu
mo
ur
typ
es
(so
mat
ic)
Tu
mo
ur
typ
es
(ger
mlin
e)C
ance
r sy
nd
rom
eT
issu e ty
pe
Can
cer m
ole
cu
lar
gen
eti
cs
Mu
tati
on
typ
eT
ran
slo
cati
on
par
tner
KR
AS
238
45N
P 0
0497
6
12p1
2.1
Pan
crea
tic,
colo
rect
al, l
ung,
th
yroi
d, A
ML,
o
ther
s
L,
E,
M,
O
Dom
Mis
LAF
438
99P
5182
62q
11.2
-q12
ALL
--
LD
omT
MLL
LAS
P1
3927
Q14
847
17q1
1-q2
1.3
AM
L-
-L
Dom
TM
LL
LCK
3932
NP
005
34
71p
35-p
34.3
T-A
LL-
-L
Dom
TT
RBα
LCP
139
36P
1379
613
q14.
1-q1
4.3
NH
L-
LD
omT
BC
L6
LCX
8031
2X
P 1
6761
2
10q2
1A
ML
--
LD
omT
MLL
LHF
P 1
1018
6 1
NP
005
77
13q
12Li
pom
a-
-M
Dom
1T
HM
GA
2
LMO
140
04P
2580
011
p15
T-A
LL-
-L
Dom
TT
RDα
LMO
240
05P
2579
111
p13
T-A
LL-
-L
Dom
TT
RDα
LPP
4026
NP
005
56
93q
28Li
pom
a,
leuk
aem
ia-
-L
,M
Dom
TH
MG
A2,
M
LL
LYL1
4066
P12
980
19p1
3.2-
p13.
1T
-ALL
--
LD
omT
TR
Bα
MA
DH
440
89Q
1348
518
q21.
1C
olor
ecta
l, pa
ncre
atic
, sm
all i
ntes
tine
Gas
troi
ntes
tinal
pol
yps
Juve
nile
pol
ypos
isE
Rec
D, M
is,
N, F
MA
LT1
1089
2Q
9UD
Y8
18q2
1M
ALT
--
LD
omT
BIR
C3
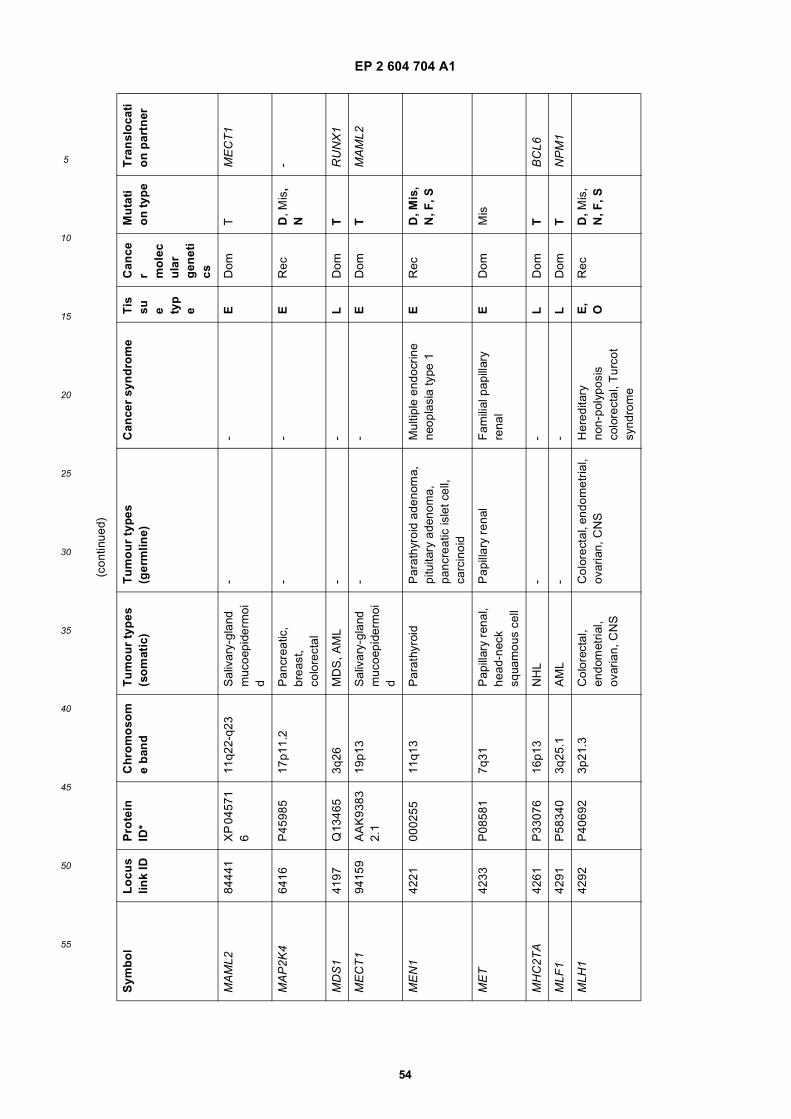
EP 2 604 704 A1
54
5
10
15
20
25
30
35
40
45
50
55
(con
tinue
d)
Sym
bo
lL
ocu
slin
k ID
Pro
tein
ID
*C
hro
mo
som
e b
and
Tu
mo
ur
typ
es
(so
mat
ic)
Tu
mo
ur
typ
es
(ger
mlin
e)C
ance
r sy
nd
rom
eT
issu e ty
pe
Can
cer m
ole
cu
lar
gen
eti
cs
Mu
tati
on
typ
eT
ran
slo
cati
on
par
tner
MA
ML2
8444
1X
P 0
4571
6
11q2
2-q2
3S
aliv
ary-
glan
d m
ucoe
pide
rmoi
d
--
ED
omT
ME
CT
1
MA
P2K
464
16P
4598
517
p11.
2P
ancr
eatic
, br
east
, co
lore
ctal
--
ER
ecD
, Mis
, N
-
MD
S1
4197
Q13
465
3q26
MD
S, A
ML
--
LD
omT
RU
NX
1
ME
CT
194
159
AA
K93
83
2.1
19p1
3S
aliv
ary-
glan
d m
ucoe
pide
rmoi
d
--
ED
omT
MA
ML2
ME
N1
4221
0002
5511
q13
Par
athy
roid
Par
athy
roid
ade
nom
a,
pitu
itary
ade
nom
a,
panc
reat
ic is
let c
ell,
carc
inoi
d
Mul
tiple
end
ocrin
e ne
opla
sia
type
1E
Rec
D, M
is,
N, F
, S
ME
T42
33P
0858
17q
31P
apill
ary
rena
l, he
ad-n
eck
squa
mou
s ce
ll
Pap
illar
y re
nal
Fam
ilial
pap
illar
y re
nal
ED
omM
is
MH
C2T
A42
61P
3307
616
p13
NH
L-
-L
Dom
TB
CL6
MLF
142
91P
5834
03q
25.1
AM
L-
-L
Dom
TN
PM
1
MLH
142
92P
4069
23p
21.3
Col
orec
tal,
endo
met
rial,
ovar
ian,
CN
S
Col
orec
tal,
endo
met
rial,
ovar
ian,
CN
SH
ered
itary
no
n-po
lypo
sis
colo
rect
al, T
urco
t sy
ndro
me
E,
OR
ecD
, Mis
, N
, F, S
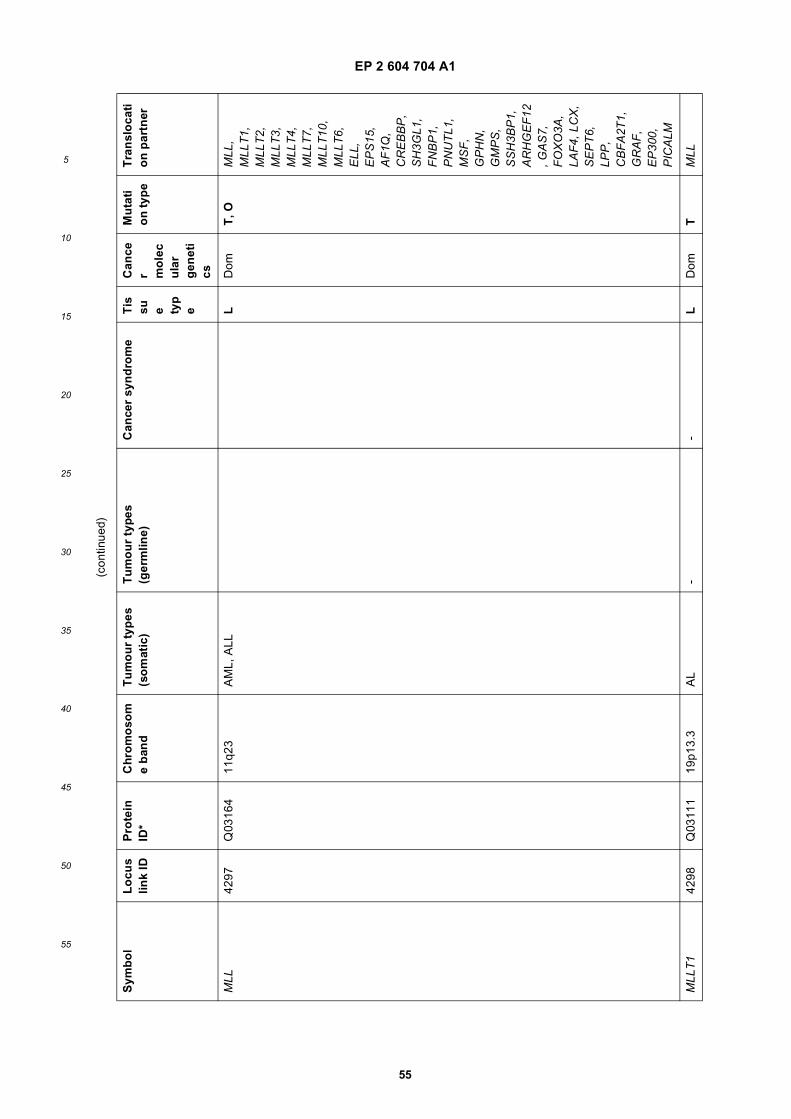
EP 2 604 704 A1
55
5
10
15
20
25
30
35
40
45
50
55
(con
tinue
d)
Sym
bo
lL
ocu
slin
k ID
Pro
tein
ID
*C
hro
mo
som
e b
and
Tu
mo
ur
typ
es
(so
mat
ic)
Tu
mo
ur
typ
es
(ger
mlin
e)C
ance
r sy
nd
rom
eT
issu e ty
pe
Can
cer m
ole
cu
lar
gen
eti
cs
Mu
tati
on
typ
eT
ran
slo
cati
on
par
tner
MLL
4297
Q03
164
11q2
3A
ML,
ALL
LD
omT
, OM
LL,
MLL
T1,
M
LLT
2,
MLL
T3,
M
LLT
4,
MLL
T7,
M
LLT
10,
MLL
T6,
E
LL,
EP
S15
, A
F1Q
, C
RE
BB
P,
SH
3GL1
, F
NB
P1,
P
NU
TL1
, M
SF
, G
PH
N,
GM
PS
, S
SH
3BP
1,
AR
HG
EF
12, G
AS
7,
FO
XO
3A,
LAF
4, L
CX
, S
EP
T6,
LP
P,
CB
FA
2T1,
G
RA
F,
EP
300,
P
ICA
LM
MLL
T1
4298
Q03
111
19p1
3.3
AL
--
LD
omT
MLL
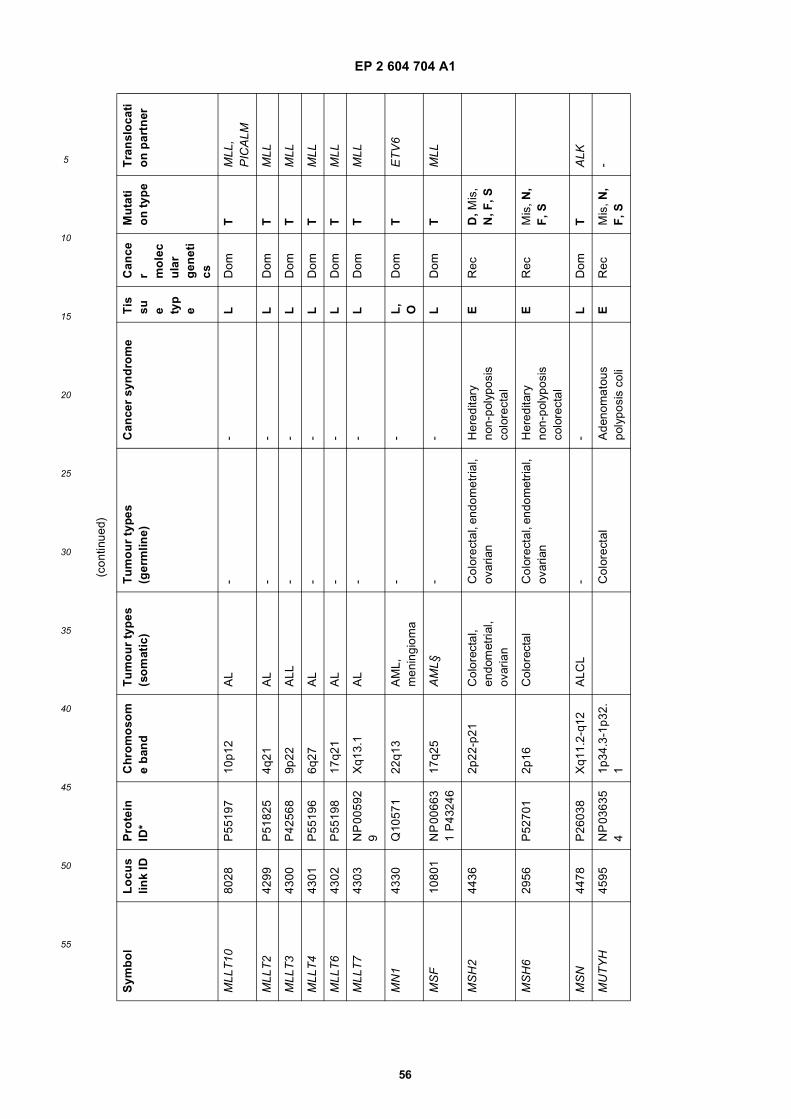
EP 2 604 704 A1
56
5
10
15
20
25
30
35
40
45
50
55
(con
tinue
d)
Sym
bo
lL
ocu
slin
k ID
Pro
tein
ID
*C
hro
mo
som
e b
and
Tu
mo
ur
typ
es
(so
mat
ic)
Tu
mo
ur
typ
es
(ger
mlin
e)C
ance
r sy
nd
rom
eT
issu e ty
pe
Can
cer m
ole
cu
lar
gen
eti
cs
Mu
tati
on
typ
eT
ran
slo
cati
on
par
tner
MLL
T10
8028
P55
197
10p1
2A
L-
-L
Dom
TM
LL,
PIC
ALM
MLL
T2
4299
P51
825
4q21
AL
--
LD
omT
MLL
MLL
T3
4300
P42
568
9p22
ALL
--
LD
omT
MLL
MLL
T4
4301
P55
196
6q27
AL
--
LD
omT
MLL
MLL
T6
4302
P55
198
17q2
1A
L-
-L
Dom
TM
LL
MLL
T7
4303
NP
005
92
9X
q13.
1A
L-
-L
Dom
TM
LL
MN
143
30Q
1057
122
q13
AM
L,
men
ingi
oma
--
L,
OD
omT
ET
V6
MS
F10
801
NP
006
63
1 P
4324
617
q25
AM
L§-
-L
Dom
TM
LL
MS
H2
4436
2p22
-p21
Col
orec
tal,
endo
met
rial,
ovar
ian
Col
orec
tal,
endo
met
rial,
ovar
ian
Her
edita
ry
non-
poly
posi
s co
lore
ctal
ER
ecD
, Mis
, N
, F, S
MS
H6
2956
P52
701
2p16
Col
orec
tal
Col
orec
tal,
endo
met
rial,
ovar
ian
Her
edita
ry
non-
poly
posi
s co
lore
ctal
ER
ecM
is, N
, F
, S
MS
N44
78P
2603
8X
q11.
2-q1
2A
LCL
--
LD
omT
ALK
MU
TY
H45
95N
P 0
3635
4
1p34
.3-1
p32.
1C
olor
ecta
lA
deno
mat
ous
poly
posi
s co
liE
Rec
Mis
, N,
F, S
-
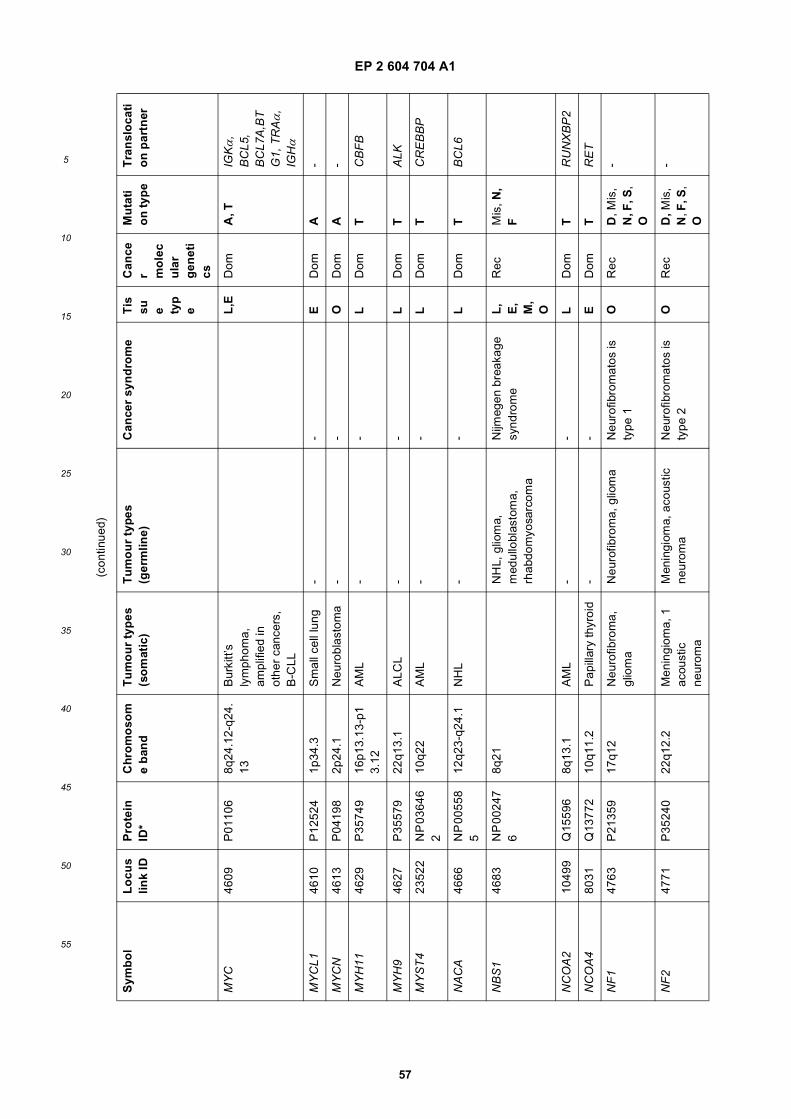
EP 2 604 704 A1
57
5
10
15
20
25
30
35
40
45
50
55
(con
tinue
d)
Sym
bo
lL
ocu
slin
k ID
Pro
tein
ID
*C
hro
mo
som
e b
and
Tu
mo
ur
typ
es
(so
mat
ic)
Tu
mo
ur
typ
es
(ger
mlin
e)C
ance
r sy
nd
rom
eT
issu e ty
pe
Can
cer m
ole
cu
lar
gen
eti
cs
Mu
tati
on
typ
eT
ran
slo
cati
on
par
tner
MY
C46
09P
0110
68q
24.1
2-q2
4.13
Bur
kitt’
s ly
mph
oma,
am
plifi
ed in
ot
her
canc
ers,
B
-CLL
L,E
Dom
A, T
IGKα
, B
CL5
, B
CL7
A,B
TG
1, T
RAα
, IG
Hα
MY
CL1
4610
P12
524
1p34
.3S
mal
l cel
l lun
g-
-E
Dom
A-
MY
CN
4613
P04
198
2p24
.1N
euro
blas
tom
a-
-O
Dom
A-
MY
H11
4629
P35
749
16p1
3.13
-p1
3.12
AM
L-
-L
Dom
TC
BF
B
MY
H9
4627
P35
579
22q1
3.1
ALC
L-
-L
Dom
TA
LK
MY
ST
423
522
NP
036
46
210
q22
AM
L-
-L
Dom
TC
RE
BB
P
NA
CA
4666
NP
005
58
512
q23-
q24.
1N
HL
--
LD
omT
BC
L6
NB
S1
4683
NP
002
47
68q
21N
HL,
glio
ma,
m
edul
lobl
asto
ma,
rh
abdo
myo
sarc
oma
Nijm
egen
bre
akag
e sy
ndro
me
L,
E,
M,
O
Rec
Mis
, N,
F
NC
OA
210
499
Q15
596
8q13
.1A
ML
--
LD
omT
RU
NX
BP
2
NC
OA
480
31Q
1377
210
q11.
2P
apill
ary
thyr
oid
--
ED
omT
RE
T
NF
147
63P
2135
917
q12
Neu
rofib
rom
a,
glio
ma
Neu
rofib
rom
a, g
liom
aN
euro
fibro
mat
os is
ty
pe 1
OR
ecD
, Mis
, N
, F, S
, O
-
NF
247
71P
3524
022
q12.
2M
enin
giom
a, 1
ac
oust
ic
neur
oma
Men
ingi
oma,
aco
ustic
ne
urom
aN
euro
fibro
mat
os is
ty
pe 2
OR
ecD
, Mis
, N
, F, S
, O
-
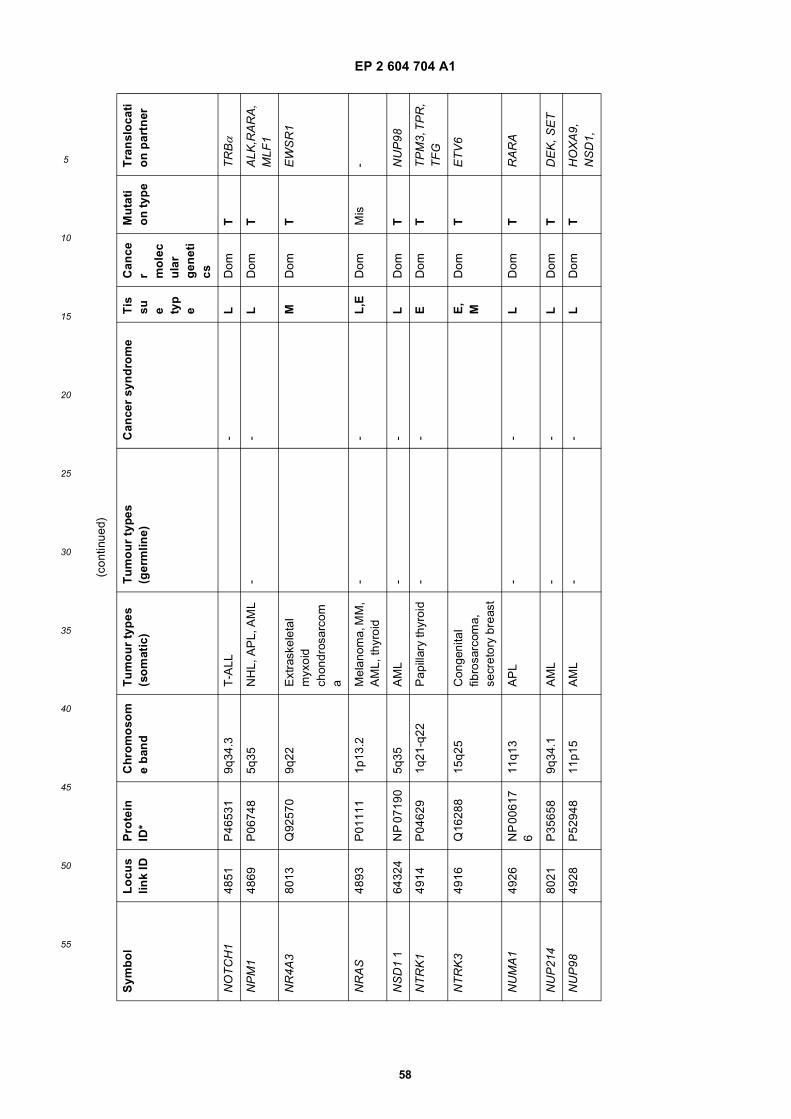
EP 2 604 704 A1
58
5
10
15
20
25
30
35
40
45
50
55
(con
tinue
d)
Sym
bo
lL
ocu
slin
k ID
Pro
tein
ID
*C
hro
mo
som
e b
and
Tu
mo
ur
typ
es
(so
mat
ic)
Tu
mo
ur
typ
es
(ger
mlin
e)C
ance
r sy
nd
rom
eT
issu e ty
pe
Can
cer m
ole
cu
lar
gen
eti
cs
Mu
tati
on
typ
eT
ran
slo
cati
on
par
tner
NO
TC
H1
4851
P46
531
9q34
.3T
-ALL
-L
Dom
TT
RBα
NP
M1
4869
P06
748
5q35
NH
L, A
PL,
AM
L-
-L
Dom
TA
LK,R
AR
A,
MLF
1
NR
4A3
8013
Q92
570
9q22
Ext
rask
elet
al
myx
oid
chon
dros
arco
ma
MD
omT
EW
SR
1
NR
AS
4893
P01
111
1p13
.2M
elan
oma,
MM
, A
ML,
thyr
oid
--
L,E
Dom
Mis
-
NS
D1
164
324
NP
071
905q
35A
ML
--
LD
omT
NU
P98
NT
RK
149
14P
0462
91q
21-q
22P
apill
ary
thyr
oid
--
ED
omT
TP
M3,
TP
R,
TF
G
NT
RK
349
16Q
1628
815
q25
Con
geni
tal
fibro
sarc
oma,
se
cret
ory
brea
st
E,
MD
omT
ET
V6
NU
MA
149
26N
P 0
0617
6
11q1
3A
PL
--
LD
omT
RA
RA
NU
P21
480
21P
3565
89q
34.1
AM
L-
-L
Dom
TD
EK
, SE
T
NU
P98
4928
P52
948
11p1
5A
ML
--
LD
omT
HO
XA
9,
NS
D1,
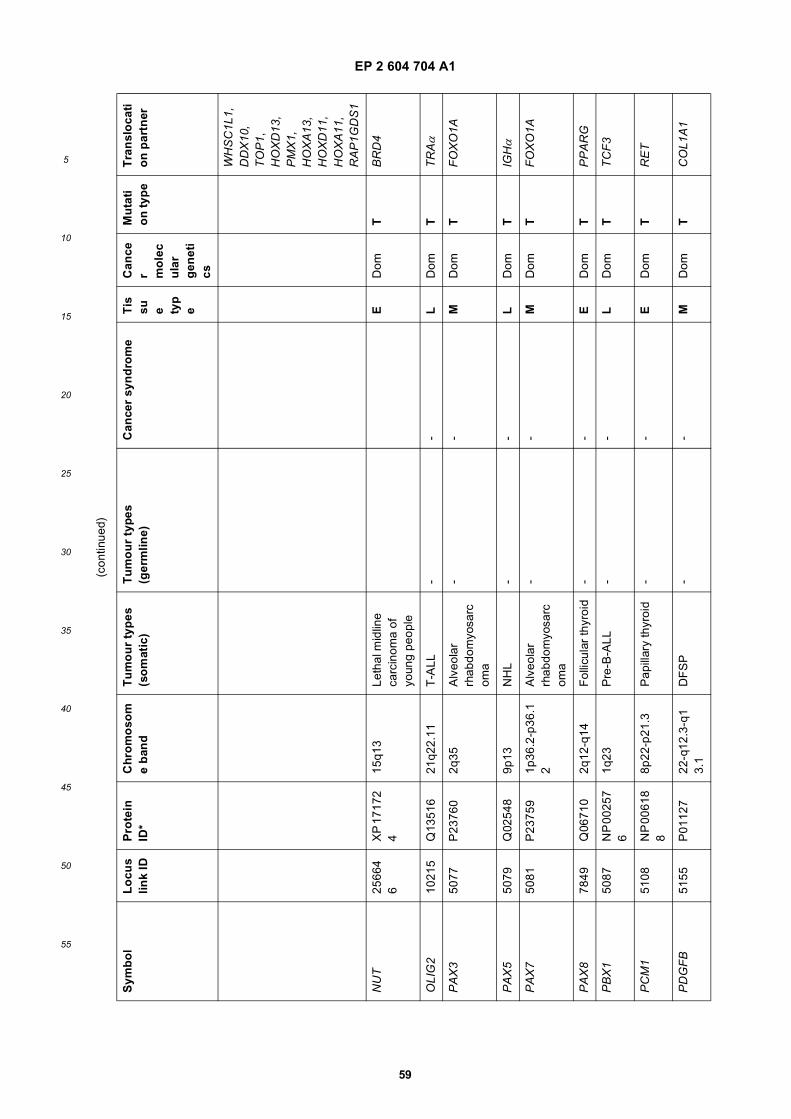
EP 2 604 704 A1
59
5
10
15
20
25
30
35
40
45
50
55
(con
tinue
d)
Sym
bo
lL
ocu
slin
k ID
Pro
tein
ID
*C
hro
mo
som
e b
and
Tu
mo
ur
typ
es
(so
mat
ic)
Tu
mo
ur
typ
es
(ger
mlin
e)C
ance
r sy
nd
rom
eT
issu e ty
pe
Can
cer m
ole
cu
lar
gen
eti
cs
Mu
tati
on
typ
eT
ran
slo
cati
on
par
tner
WH
SC
1L1,
D
DX
10,
TO
P1,
H
OX
D13
, P
MX
1,
HO
XA
13,
HO
XD
11,
HO
XA
11,
RA
P1G
DS
1
NU
T25
664
6X
P 1
7172
4
15q1
3Le
thal
mid
line
carc
inom
a of
yo
ung
peop
le
ED
omT
BR
D4
OLI
G2
1021
5Q
1351
621
q22.
11T
-ALL
--
LD
omT
TR
Aα
PA
X3
5077
P23
760
2q35
Alv
eola
r rh
abdo
myo
sarc
oma
--
MD
omT
FO
XO
1A
PA
X5
5079
Q02
548
9p13
NH
L-
-L
Dom
TIG
Hα
PA
X7
5081
P23
759
1p36
.2-p
36.1
2A
lveo
lar
rhab
dom
yosa
rcom
a
--
MD
omT
FO
XO
1A
PA
X8
7849
Q06
710
2q12
-q14
Fol
licul
ar th
yroi
d-
-E
Dom
TP
PA
RG
PB
X1
5087
NP
002
57
61q
23P
re-B
-ALL
--
LD
omT
TC
F3
PC
M1
5108
NP
006
18
88p
22-p
21.3
Pap
illar
y th
yroi
d-
-E
Dom
TR
ET
PD
GF
B51
55P
0112
722
-q12
.3-q
13.
1D
FS
P-
-M
Dom
TC
OL1
A1
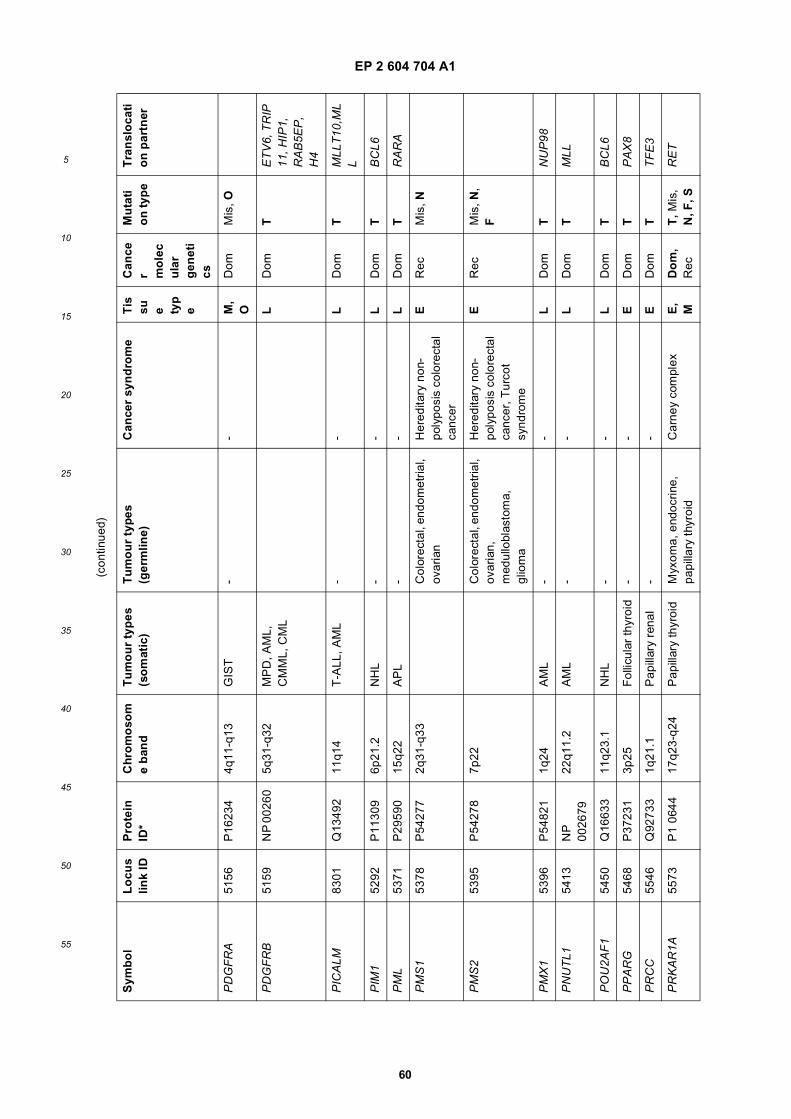
EP 2 604 704 A1
60
5
10
15
20
25
30
35
40
45
50
55
(con
tinue
d)
Sym
bo
lL
ocu
slin
k ID
Pro
tein
ID
*C
hro
mo
som
e b
and
Tu
mo
ur
typ
es
(so
mat
ic)
Tu
mo
ur
typ
es
(ger
mlin
e)C
ance
r sy
nd
rom
eT
issu e ty
pe
Can
cer m
ole
cu
lar
gen
eti
cs
Mu
tati
on
typ
eT
ran
slo
cati
on
par
tner
PD
GF
RA
5156
P16
234
4q11
-q13
GIS
T-
-M
, O
Dom
Mis
, O
PD
GF
RB
5159
NP
002
605q
31-q
32M
PD
, AM
L,
CM
ML,
CM
LL
Dom
TE
TV
6, T
RIP
11
, HIP
1,
RA
B5E
P,
H4
PIC
ALM
8301
Q13
492
11q1
4T
-ALL
, AM
L-
-L
Dom
TM
LLT
10,M
LL
PIM
152
92P
1130
96p
21.2
NH
L-
-L
Dom
TB
CL6
PM
L53
71P
2959
015
q22
AP
L-
-L
Dom
TR
AR
A
PM
S1
5378
P54
277
2q31
-q33
Col
orec
tal,
endo
met
rial,
ovar
ian
Her
edita
ry n
on-
poly
posi
s co
lore
ctal
ca
ncer
ER
ecM
is, N
PM
S2
5395
P54
278
7p22
Col
orec
tal,
endo
met
rial,
ovar
ian,
m
edul
lobl
asto
ma,
gl
iom
a
Her
edita
ry n
on-
poly
posi
s co
lore
ctal
ca
ncer
, Tur
cot
synd
rom
e
ER
ecM
is, N
, F
PM
X1
5396
P54
821
1q24
AM
L-
-L
Dom
TN
UP
98
PN
UT
L154
13N
P
0026
7922
q11.
2A
ML
--
LD
omT
MLL
PO
U2A
F1
5450
Q16
633
11q2
3.1
NH
L-
-L
Dom
TB
CL6
PP
AR
G54
68P
3723
13p
25F
ollic
ular
thyr
oid
--
ED
omT
PA
X8
PR
CC
5546
Q92
733
1q21
.1P
apill
ary
rena
l-
-E
Dom
TT
FE
3
PR
KA
R1A
5573
P1
0644
17q2
3-q2
4P
apill
ary
thyr
oid
Myx
oma,
end
ocrin
e,
papi
llary
thyr
oid
Car
ney
com
plex
E,
MD
om
, R
ecT
, Mis
, N
, F, S
RE
T
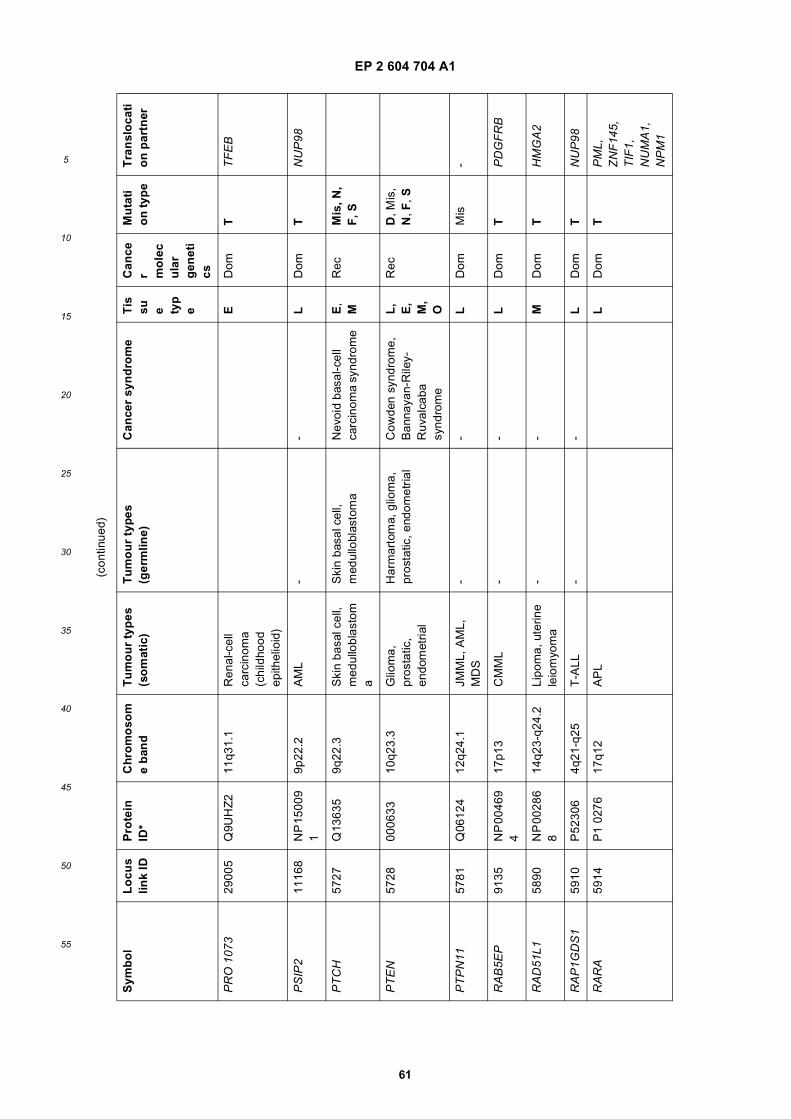
EP 2 604 704 A1
61
5
10
15
20
25
30
35
40
45
50
55
(con
tinue
d)
Sym
bo
lL
ocu
slin
k ID
Pro
tein
ID
*C
hro
mo
som
e b
and
Tu
mo
ur
typ
es
(so
mat
ic)
Tu
mo
ur
typ
es
(ger
mlin
e)C
ance
r sy
nd
rom
eT
issu e ty
pe
Can
cer m
ole
cu
lar
gen
eti
cs
Mu
tati
on
typ
eT
ran
slo
cati
on
par
tner
PR
O 1
073
2900
5Q
9UH
Z2
11q3
1.1
Ren
al-c
ell
carc
inom
a (c
hild
hood
ep
ithel
ioid
)
ED
omT
TF
EB
PS
IP2
1116
8N
P 1
5009
1
9p22
.2A
ML
--
LD
omT
NU
P98
PT
CH
5727
Q13
635
9q22
.3S
kin
basa
l cel
l, m
edul
lobl
asto
ma
Ski
n ba
sal c
ell,
med
ullo
blas
tom
aN
evoi
d ba
sal-c
ell
carc
inom
a sy
ndro
me
E,
MR
ecM
is, N
, F
, S
PT
EN
5728
0006
3310
q23.
3G
liom
a,
pros
tatic
, en
dom
etria
l
Har
mar
tom
a, g
liom
a,
pros
tatic
, end
omet
rial
Cow
den
synd
rom
e,
Ban
naya
n-R
iley-
Ruv
alca
ba
synd
rom
e
L,
E,
M,
O
Rec
D, M
is,
N, F
, S
PT
PN
1157
81Q
0612
412
q24.
1JM
ML,
AM
L,
MD
S-
-L
Dom
Mis
-
RA
B5E
P91
35N
P 0
0469
4
17p1
3C
MM
L-
-L
Dom
TP
DG
FR
B
RA
D51
L158
90N
P 0
0286
8
14q2
3-q2
4.2
Lipo
ma,
ute
rine
leio
myo
ma
--
MD
omT
HM
GA
2
RA
P1G
DS
159
10P
5230
64q
21-q
25T
-ALL
--
LD
omT
NU
P98
RA
RA
5914
P1
0276
17q1
2A
PL
LD
omT
PM
L,
ZN
F14
5,
TIF
1,
NU
MA
1,
NP
M1
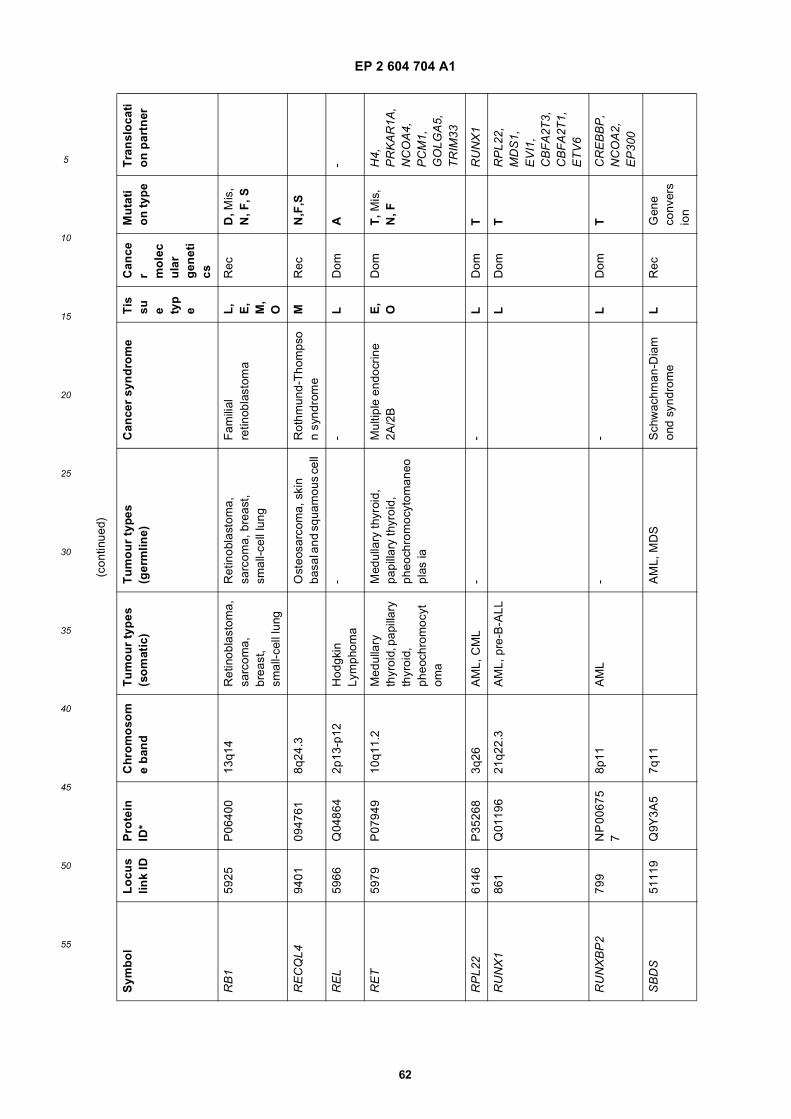
EP 2 604 704 A1
62
5
10
15
20
25
30
35
40
45
50
55
(con
tinue
d)
Sym
bo
lL
ocu
slin
k ID
Pro
tein
ID
*C
hro
mo
som
e b
and
Tu
mo
ur
typ
es
(so
mat
ic)
Tu
mo
ur
typ
es
(ger
mlin
e)C
ance
r sy
nd
rom
eT
issu e ty
pe
Can
cer m
ole
cu
lar
gen
eti
cs
Mu
tati
on
typ
eT
ran
slo
cati
on
par
tner
RB
159
25P
0640
013
q14
Ret
inob
last
oma,
sa
rcom
a,
brea
st,
smal
l-cel
l lun
g
Ret
inob
last
oma,
sa
rcom
a, b
reas
t, sm
all-c
ell l
ung
Fam
ilial
re
tinob
last
oma
L,
E,
M,
O
Rec
D, M
is,
N, F
, S
RE
CQ
L494
0109
4761
8q24
.3O
steo
sarc
oma,
ski
n ba
sal a
nd s
quam
ous
cell
Rot
hmun
d-T
hom
pso
n sy
ndro
me
MR
ecN
,F,S
RE
L59
66Q
0486
42p
13-p
12H
odgk
in
Lym
phom
a-
-L
Dom
A-
RE
T59
79P
0794
910
q11.
2M
edul
lary
th
yroi
d, p
apill
ary
thyr
oid,
ph
eoch
rom
ocyt
oma
Med
ulla
ry th
yroi
d,
papi
llary
thyr
oid,
ph
eoch
rom
ocyt
oman
eopl
as ia
Mul
tiple
end
ocrin
e 2A
/2B
E,
OD
omT
, Mis
, N
, FH
4,
PR
KA
R1A
, N
CO
A4,
P
CM
1,
GO
LGA
5,
TR
IM33
RP
L22
6146
P35
268
3q26
AM
L, C
ML
--
LD
omT
RU
NX
1
RU
NX
186
1Q
0119
621
q22.
3A
ML,
pre
-B-A
LLL
Dom
TR
PL2
2,
MD
S1,
E
VI1
, C
BF
A2T
3,
CB
FA
2T1,
E
TV
6
RU
NX
BP
279
9N
P 0
0675
7
8p11
AM
L-
-L
Dom
TC
RE
BB
P,
NC
OA
2,
EP
300
SB
DS
5111
9Q
9Y3A
57q
11A
ML,
MD
SS
chw
achm
an-D
iam
ond
synd
rom
eL
Rec
Gen
e co
nver
sio
n
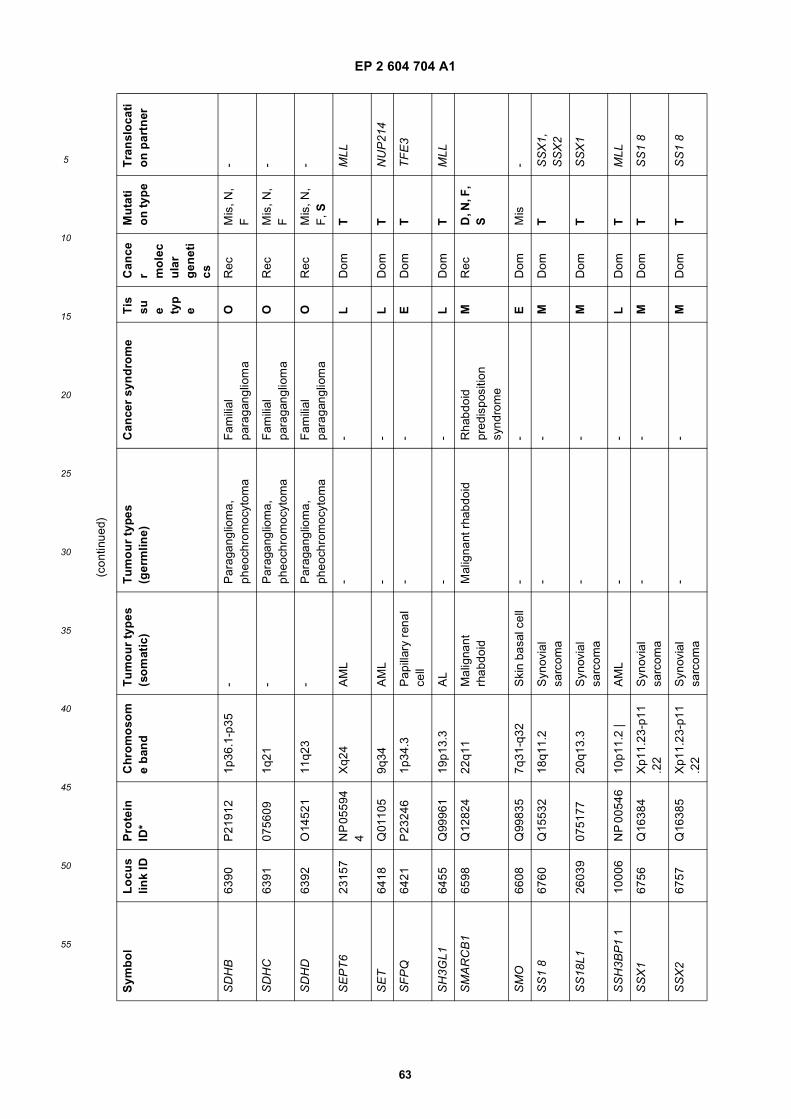
EP 2 604 704 A1
63
5
10
15
20
25
30
35
40
45
50
55
(con
tinue
d)
Sym
bo
lL
ocu
slin
k ID
Pro
tein
ID
*C
hro
mo
som
e b
and
Tu
mo
ur
typ
es
(so
mat
ic)
Tu
mo
ur
typ
es
(ger
mlin
e)C
ance
r sy
nd
rom
eT
issu e ty
pe
Can
cer m
ole
cu
lar
gen
eti
cs
Mu
tati
on
typ
eT
ran
slo
cati
on
par
tner
SD
HB
6390
P21
912
1p36
.1-p
35-
Par
agan
glio
ma,
ph
eoch
rom
ocyt
oma
Fam
ilial
pa
raga
nglio
ma
OR
ecM
is, N
, F
-
SD
HC
6391
0756
091q
21-
Par
agan
glio
ma,
ph
eoch
rom
ocyt
oma
Fam
ilial
pa
raga
nglio
ma
OR
ecM
is, N
, F
-
SD
HD
6392
O14
521
11q2
3-
Par
agan
glio
ma,
ph
eoch
rom
ocyt
oma
Fam
ilial
pa
raga
nglio
ma
OR
ecM
is, N
, F
, S-
SE
PT
623
157
NP
055
94
4X
q24
AM
L-
-L
Dom
TM
LL
SE
T64
18Q
0110
59q
34A
ML
--
LD
omT
NU
P21
4
SF
PQ
6421
P23
246
1p34
.3P
apill
ary
rena
l ce
ll-
-E
Dom
TT
FE
3
SH
3GL1
6455
Q99
961
19p1
3.3
AL
--
LD
omT
MLL
SM
AR
CB
165
98Q
1282
422
q11
Mal
igna
nt
rhab
doid
Mal
igna
nt r
habd
oid
Rha
bdoi
d pr
edis
posi
tion
synd
rom
e
MR
ecD
, N, F
, S
SM
O66
08Q
9983
57q
31-q
32S
kin
basa
l cel
l-
-E
Dom
Mis
-
SS
1 8
6760
Q15
532
18q1
1.2
Syn
ovia
l sa
rcom
a-
-M
Dom
TS
SX
1,
SS
X2
SS
18L1
2603
907
5177
20q1
3.3
Syn
ovia
l sa
rcom
a-
-M
Dom
TS
SX
1
SS
H3B
P1
110
006
NP
005
4610
p11.
2 |
AM
L-
-L
Dom
TM
LL
SS
X1
6756
Q16
384
Xp1
1.23
-p11
.22
Syn
ovia
l sa
rcom
a-
-M
Dom
TS
S1
8
SS
X2
6757
Q16
385
Xp1
1.23
-p11
.22
Syn
ovia
l sa
rcom
a-
-M
Dom
TS
S1
8
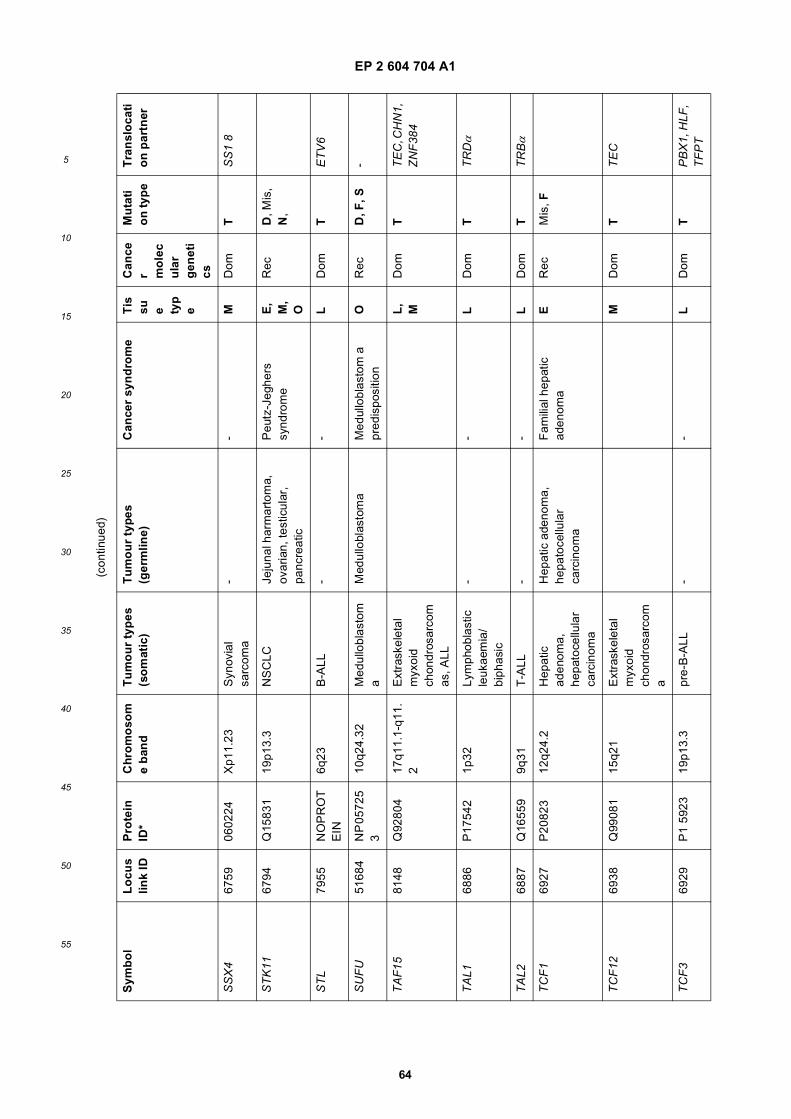
EP 2 604 704 A1
64
5
10
15
20
25
30
35
40
45
50
55
(con
tinue
d)
Sym
bo
lL
ocu
slin
k ID
Pro
tein
ID
*C
hro
mo
som
e b
and
Tu
mo
ur
typ
es
(so
mat
ic)
Tu
mo
ur
typ
es
(ger
mlin
e)C
ance
r sy
nd
rom
eT
issu e ty
pe
Can
cer m
ole
cu
lar
gen
eti
cs
Mu
tati
on
typ
eT
ran
slo
cati
on
par
tner
SS
X4
6759
0602
24X
p11.
23S
ynov
ial
sarc
oma
--
MD
omT
SS
1 8
ST
K11
6794
Q15
831
19p1
3.3
NS
CLC
Jeju
nal h
arm
arto
ma,
ov
aria
n, te
stic
ular
, pa
ncre
atic
Peu
tz-J
eghe
rs
synd
rom
eE
, M
, O
Rec
D, M
is,
N,
ST
L79
55N
OP
RO
TE
IN6q
23B
-ALL
--
LD
omT
ET
V6
SU
FU
5168
4N
P 0
5725
3
10q2
4.32
Med
ullo
blas
tom
aM
edul
lobl
asto
ma
Med
ullo
blas
tom
a
pred
ispo
sitio
nO
Rec
D, F
, S-
TA
F15
8148
Q92
804
17q1
1.1-
q11.
2E
xtra
skel
etal
m
yxoi
d ch
ondr
osar
com
as, A
LL
L,
MD
omT
TE
C, C
HN
1,
ZN
F38
4
TA
L168
86P
1754
21p
32Ly
mph
obla
stic
le
ukae
mia
/ bi
phas
ic
--
LD
omT
TR
Dα
TA
L268
87Q
1655
99q
31T
-ALL
--
LD
omT
TR
Bα
TC
F1
6927
P20
823
12q2
4.2
Hep
atic
ad
enom
a,
hepa
toce
llula
r ca
rcin
oma
Hep
atic
ade
nom
a,
hepa
toce
llula
r ca
rcin
oma
Fam
ilial
hep
atic
ad
enom
aE
Rec
Mis
, F
TC
F12
6938
Q99
081
15q2
1E
xtra
skel
etal
m
yxoi
d ch
ondr
osar
com
a
MD
omT
TE
C
TC
F3
6929
P1
5923
19p1
3.3
pre-
B-A
LL-
-L
Dom
TP
BX
1, H
LF,
TF
PT
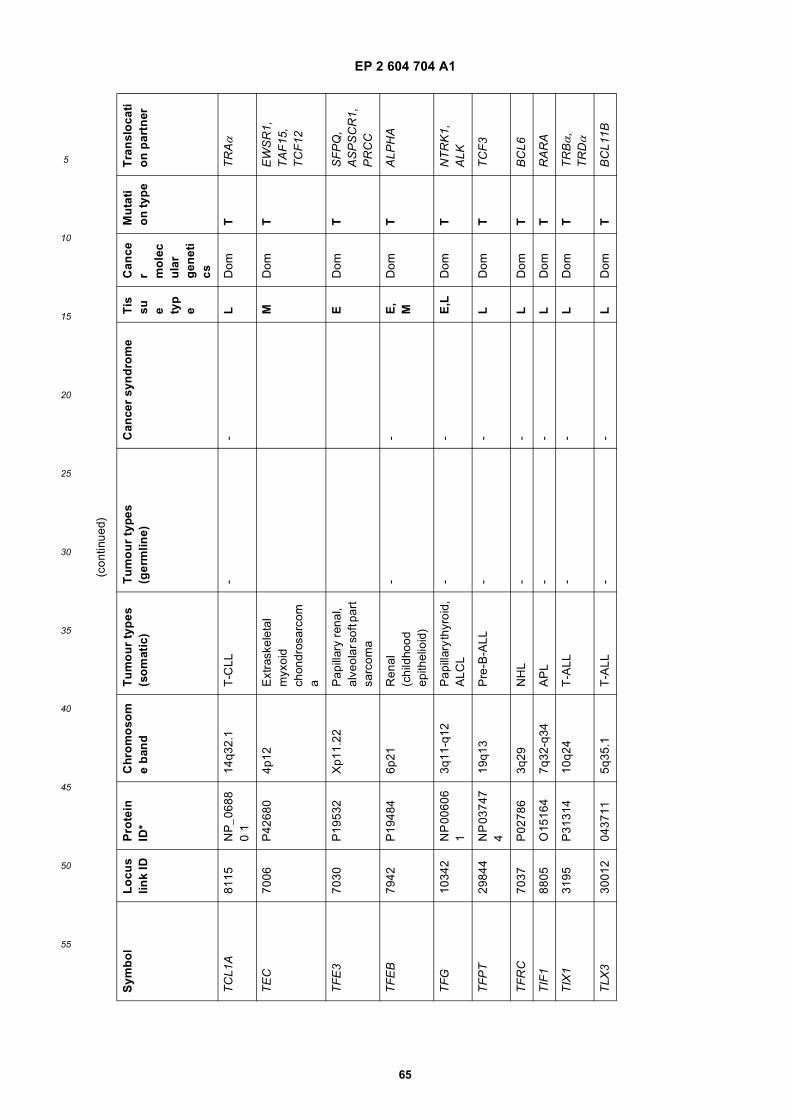
EP 2 604 704 A1
65
5
10
15
20
25
30
35
40
45
50
55
(con
tinue
d)
Sym
bo
lL
ocu
slin
k ID
Pro
tein
ID
*C
hro
mo
som
e b
and
Tu
mo
ur
typ
es
(so
mat
ic)
Tu
mo
ur
typ
es
(ger
mlin
e)C
ance
r sy
nd
rom
eT
issu e ty
pe
Can
cer m
ole
cu
lar
gen
eti
cs
Mu
tati
on
typ
eT
ran
slo
cati
on
par
tner
TC
L1A
8115
NP
_068
80
114
q32.
1T
-CLL
--
LD
omT
TR
Aα
TE
C70
06P
4268
04p
12E
xtra
skel
etal
m
yxoi
d ch
ondr
osar
com
a
MD
omT
EW
SR
1,
TA
F15
, T
CF
12
TF
E3
7030
P19
532
Xp1
1.22
Pap
illar
y re
nal,
alve
olar
sof
t par
t sa
rcom
a
ED
omT
SF
PQ
, A
SP
SC
R1,
P
RC
C
TF
EB
7942
P19
484
6p21
Ren
al
(chi
ldho
od
epith
elio
id)
--
E,
MD
omT
ALP
HA
TF
G10
342
NP
006
06
13q
11-q
12P
apill
ary
thyr
oid,
A
LCL
--
E,L
Dom
TN
TR
K1,
A
LK
TF
PT
2984
4N
P 0
3747
4
19q1
3P
re-B
-ALL
--
LD
omT
TC
F3
TF
RC
7037
P02
786
3q29
NH
L-
-L
Dom
TB
CL6
TIF
188
05O
1516
47q
32-q
34A
PL
--
LD
omT
RA
RA
TIX
131
95P
3131
410
q24
T-A
LL-
-L
Dom
TT
RBα,
T
RDα
TLX
330
012
0437
115q
35.1
T-A
LL-
-L
Dom
TB
CL1
1B
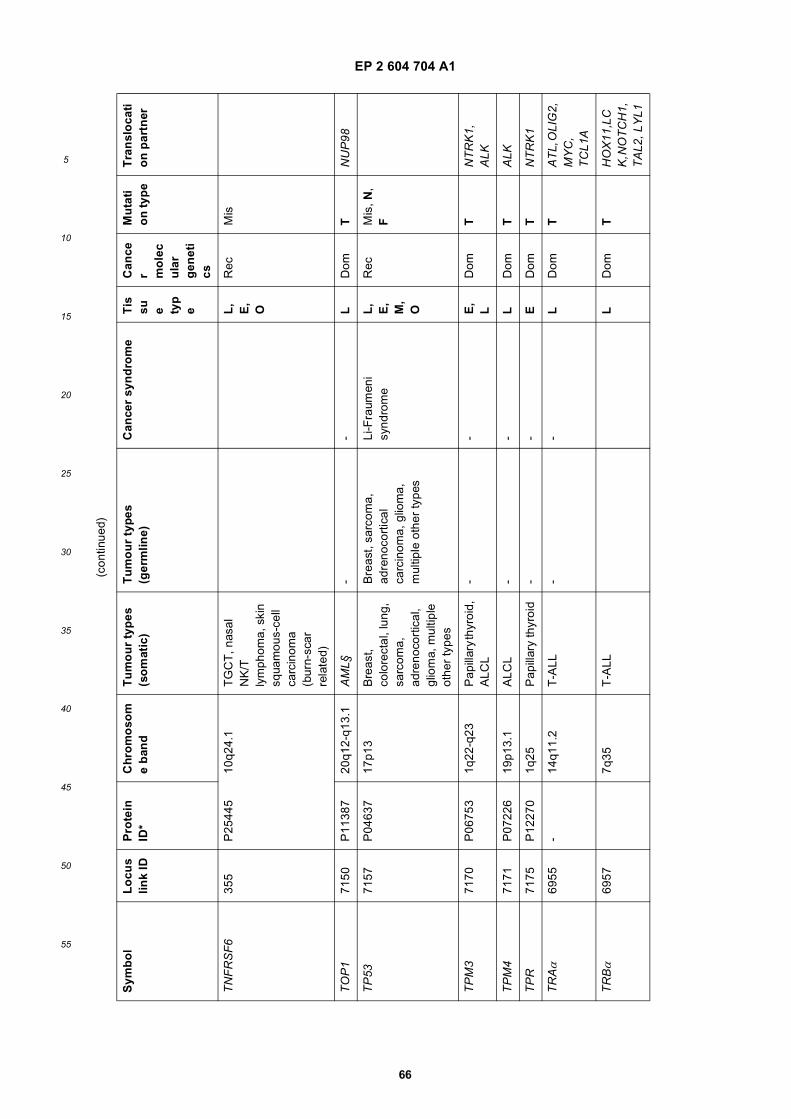
EP 2 604 704 A1
66
5
10
15
20
25
30
35
40
45
50
55
(con
tinue
d)
Sym
bo
lL
ocu
slin
k ID
Pro
tein
ID
*C
hro
mo
som
e b
and
Tu
mo
ur
typ
es
(so
mat
ic)
Tu
mo
ur
typ
es
(ger
mlin
e)C
ance
r sy
nd
rom
eT
issu e ty
pe
Can
cer m
ole
cu
lar
gen
eti
cs
Mu
tati
on
typ
eT
ran
slo
cati
on
par
tner
TN
FR
SF
635
5P
2544
510
q24.
1T
GC
T, n
asal
N
K/T
ly
mph
oma,
ski
n sq
uam
ous-
cell
carc
inom
a (b
urn-
scar
re
late
d)
L,
E,
O
Rec
Mis
TO
P1
7150
P11
387
20q1
2-q1
3.1
AM
L§-
-L
Dom
TN
UP
98
TP
5371
57P
0463
717
p13
Bre
ast,
colo
rect
al, l
ung,
sa
rcom
a,
adre
noco
rtic
al,
glio
ma,
mul
tiple
ot
her
type
s
Bre
ast,
sarc
oma,
ad
reno
cort
ical
ca
rcin
oma,
glio
ma,
m
ultip
le o
ther
type
s
Li-F
raum
eni
synd
rom
eL
, E
, M
, O
Rec
Mis
, N,
F
TP
M3
7170
P06
753
1q22
-q23
Pap
illar
y th
yroi
d,
ALC
L-
-E
, L
Dom
TN
TR
K1,
A
LK
TP
M4
7171
P07
226
19p1
3.1
ALC
L-
-L
Dom
TA
LK
TP
R71
75P
1227
01q
25P
apill
ary
thyr
oid
--
ED
omT
NT
RK
1
TR
Aα
6955
-14
q11.
2T
-ALL
--
LD
omT
AT
L, O
LIG
2,
MY
C,
TC
L1A
TR
Bα
6957
7q35
T-A
LLL
Dom
TH
OX
11,L
CK
, NO
TC
H1,
T
AL2
, LY
L1
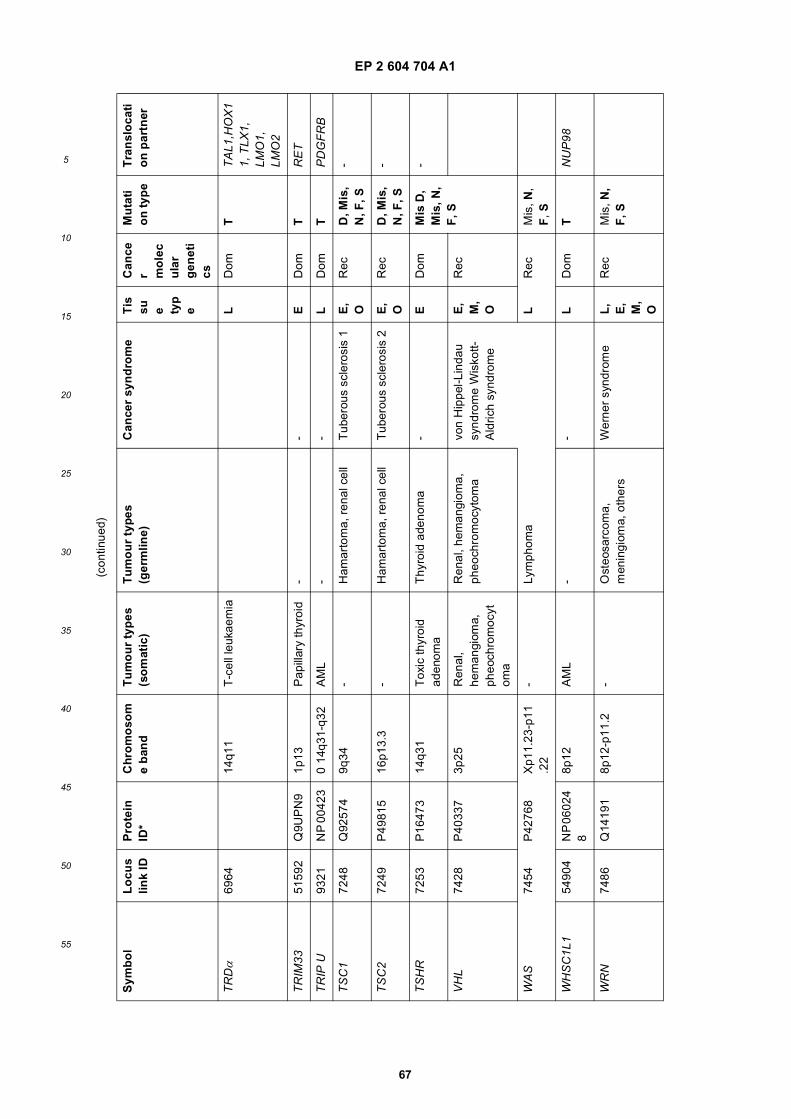
EP 2 604 704 A1
67
5
10
15
20
25
30
35
40
45
50
55
(con
tinue
d)
Sym
bo
lL
ocu
slin
k ID
Pro
tein
ID
*C
hro
mo
som
e b
and
Tu
mo
ur
typ
es
(so
mat
ic)
Tu
mo
ur
typ
es
(ger
mlin
e)C
ance
r sy
nd
rom
eT
issu e ty
pe
Can
cer m
ole
cu
lar
gen
eti
cs
Mu
tati
on
typ
eT
ran
slo
cati
on
par
tner
TR
Dα
6964
14q1
1T
-cel
l leu
kaem
iaL
Dom
TT
AL1
,HO
X1
1, T
LX1,
LM
O1,
LM
O2
TR
IM33
5159
2Q
9UP
N9
1p13
Pap
illar
y th
yroi
d-
-E
Dom
TR
ET
TR
IP U
9321
NP
004
230
14q3
1-q3
2A
ML
--
LD
omT
PD
GF
RB
TS
C1
7248
Q92
574
9q34
-H
amar
tom
a, r
enal
cel
lT
uber
ous
scle
rosi
s 1
E,
OR
ecD
, Mis
, N
, F, S
-
TS
C2
7249
P49
815
16p1
3.3
-H
amar
tom
a, r
enal
cel
lT
uber
ous
scle
rosi
s 2
E,
OR
ecD
, Mis
, N
, F, S
-
TS
HR
7253
P16
473
14q3
1T
oxic
thyr
oid
aden
oma
Thy
roid
ade
nom
a-
ED
omM
is D
, M
is, N
, F
, S
-
VH
L74
28P
4033
73p
25R
enal
, he
man
giom
a,
pheo
chro
moc
ytom
a
Ren
al, h
eman
giom
a,
pheo
chro
moc
ytom
avo
n H
ippe
l-Lin
dau
synd
rom
e W
isko
tt-A
ldric
h sy
ndro
me
E,
M,
O
Rec
WA
S74
54P
4276
8X
p11.
23-p
11.2
2-
Lym
phom
aL
Rec
Mis
, N,
F, S
WH
SC
1L1
5490
4N
P 0
6024
8
8p12
AM
L-
-L
Dom
TN
UP
98
WR
N74
86Q
1419
18p
12-p
11.2
-O
steo
sarc
oma,
m
enin
giom
a, o
ther
sW
erne
r sy
ndro
me
L,
E,
M,
O
Rec
Mis
, N,
F, S
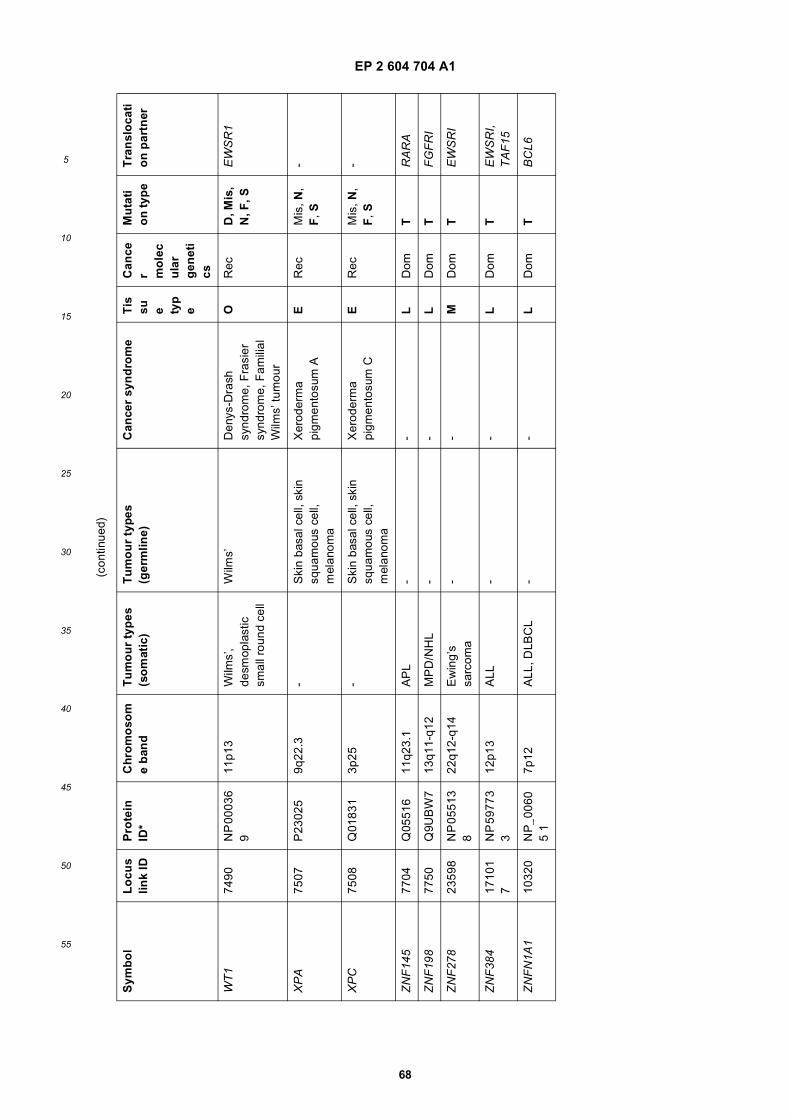
EP 2 604 704 A1
68
5
10
15
20
25
30
35
40
45
50
55
(con
tinue
d)
Sym
bo
lL
ocu
slin
k ID
Pro
tein
ID
*C
hro
mo
som
e b
and
Tu
mo
ur
typ
es
(so
mat
ic)
Tu
mo
ur
typ
es
(ger
mlin
e)C
ance
r sy
nd
rom
eT
issu e ty
pe
Can
cer m
ole
cu
lar
gen
eti
cs
Mu
tati
on
typ
eT
ran
slo
cati
on
par
tner
WT
174
90N
P 0
0036
9
11p1
3W
ilms’
, de
smop
last
ic
smal
l rou
nd c
ell
Wilm
s’D
enys
-Dra
sh
synd
rom
e, F
rasi
er
synd
rom
e, F
amili
al
Wilm
s’ tu
mou
r
OR
ecD
, Mis
, N
, F, S
EW
SR
1
XP
A75
07P
2302
59q
22.3
-S
kin
basa
l cel
l, sk
in
squa
mou
s ce
ll,
mel
anom
a
Xer
oder
ma
pigm
ento
sum
AE
Rec
Mis
, N,
F, S
-
XP
C75
08Q
0183
13p
25-
Ski
n ba
sal c
ell,
skin
sq
uam
ous
cell,
m
elan
oma
Xer
oder
ma
pigm
ento
sum
CE
Rec
Mis
, N,
F, S
-
ZN
F14
577
04Q
0551
611
q23.
1A
PL
--
LD
omT
RA
RA
ZN
F19
877
50Q
9UB
W7
13q1
1-q1
2M
PD
/NH
L-
-L
Dom
TF
GF
RI
ZN
F27
823
598
NP
055
13
822
q12-
q14
Ew
ing’
s sa
rcom
a-
-M
Dom
TE
WS
RI
ZN
F38
417
101
7N
P 5
9773
3
12p1
3A
LL-
-L
Dom
TE
WS
RI,
TA
F15
ZN
FN
1A1
1032
0N
P_0
060
5 1
7p12
ALL
, DLB
CL
--
LD
omT
BC
L6
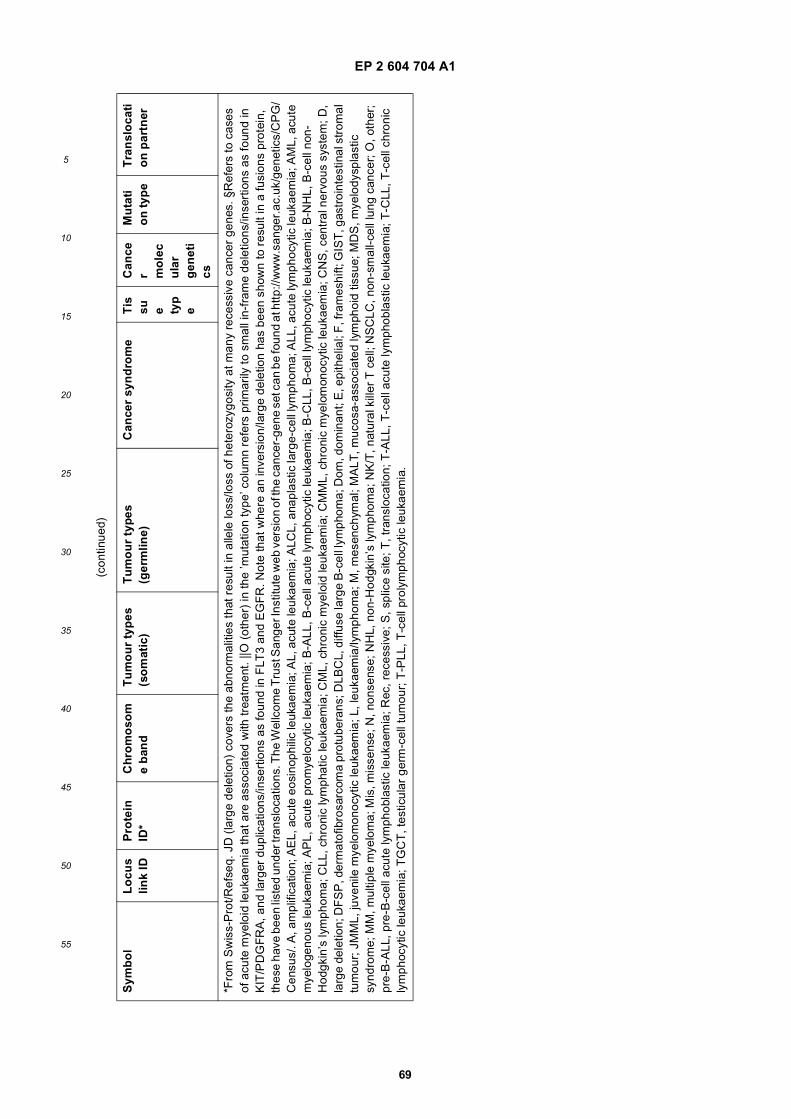
EP 2 604 704 A1
69
5
10
15
20
25
30
35
40
45
50
55
(con
tinue
d)
Sym
bo
lL
ocu
slin
k ID
Pro
tein
ID
*C
hro
mo
som
e b
and
Tu
mo
ur
typ
es
(so
mat
ic)
Tu
mo
ur
typ
es
(ger
mlin
e)C
ance
r sy
nd
rom
eT
issu e ty
pe
Can
cer m
ole
cu
lar
gen
eti
cs
Mu
tati
on
typ
eT
ran
slo
cati
on
par
tner
*Fro
m S
wis
s-P
rot/R
efse
q. J
D (
larg
e de
letio
n) c
over
s th
e ab
norm
aliti
es th
at r
esul
t in
alle
le lo
ss/lo
ss o
f het
eroz
ygos
ity a
t man
y re
cess
ive
canc
er g
enes
. §R
efer
s to
cas
es
of a
cute
mye
loid
leuk
aem
ia th
at a
re a
ssoc
iate
d w
ith tr
eatm
ent.
||O (
othe
r) in
the
’mut
atio
n ty
pe’ c
olum
n re
fers
prim
arily
to s
mal
l in-
fram
e de
letio
ns/in
sert
ions
as
foun
d in
K
IT/P
DG
FR
A, a
nd la
rger
dup
licat
ions
/inse
rtio
ns a
s fo
und
in F
LT3
and
EG
FR
. Not
e th
at w
here
an
inve
rsio
n/la
rge
dele
tion
has
been
sho
wn
to r
esul
t in
a fu
sion
s pr
otei
n,
thes
e ha
ve b
een
liste
d un
der t
rans
loca
tions
. The
Wel
lcom
e T
rust
San
ger I
nstit
ute
web
ver
sion
of t
he c
ance
r-ge
ne s
et c
an b
e fo
und
at h
ttp://
ww
w.s
ange
r.ac
.uk/
gene
tics/
CP
G/
Cen
sus/
. A, a
mpl
ifica
tion;
AE
L, a
cute
eos
inop
hilic
leuk
aem
ia; A
L, a
cute
leuk
aem
ia; A
LCL,
ana
plas
tic la
rge-
cell
lym
phom
a; A
LL, a
cute
lym
phoc
ytic
leuk
aem
ia; A
ML,
acu
te
mye
loge
nous
leuk
aem
ia; A
PL,
acu
te p
rom
yelo
cytic
leuk
aem
ia; B
-ALL
, B-c
ell a
cute
lym
phoc
ytic
leuk
aem
ia; B
-CLL
, B-c
ell l
ymph
ocyt
ic le
ukae
mia
; B-N
HL,
B-c
ell n
on-
Hod
gkin
’s ly
mph
oma;
CLL
, chr
onic
lym
phat
ic le
ukae
mia
; CM
L, c
hron
ic m
yelo
id le
ukae
mia
; CM
ML,
chr
onic
mye
lom
onoc
ytic
leuk
aem
ia; C
NS
, cen
tral
ner
vous
sys
tem
; D,
larg
e de
letio
n; D
FS
P, d
erm
atof
ibro
sarc
oma
prot
uber
ans;
DLB
CL,
diff
use
larg
e B
-cel
l lym
phom
a; D
om, d
omin
ant;
E, e
pith
elia
l; F
, fra
mes
hift;
GIS
T, g
astr
oint
estin
al s
trom
al
tum
our;
JM
ML,
juve
nile
mye
lom
onoc
ytic
leuk
aem
ia; L
, leu
kaem
ia/ly
mph
oma;
M, m
esen
chym
al; M
ALT
, muc
osa-
asso
ciat
ed ly
mph
oid
tissu
e; M
DS
, mye
lody
spla
stic
sy
ndro
me;
MM
, mul
tiple
mye
lom
a; M
is, m
isse
nse;
N, n
onse
nse;
NH
L, n
on-H
odgk
in’s
lym
phom
a; N
K/T
, nat
ural
kill
er T
cel
l; N
SC
LC, n
on-s
mal
l-cel
l lun
g ca
ncer
; O, o
ther
; pr
e-B
-ALL
, pre
-B-c
ell a
cute
lym
phob
last
ic le
ukae
mia
; Rec
, rec
essi
ve; S
, spl
ice
site
; T, t
rans
loca
tion;
T-A
LL, T
-cel
l acu
te ly
mph
obla
stic
leuk
aem
ia; T
-CLL
, T-c
ell c
hron
ic
lym
phoc
ytic
leuk
aem
ia; T
GC
T, t
estic
ular
ger
m-c
ell t
umou
r; T
-PLL
, T-c
ell p
roly
mph
ocyt
ic le
ukae
mia
.
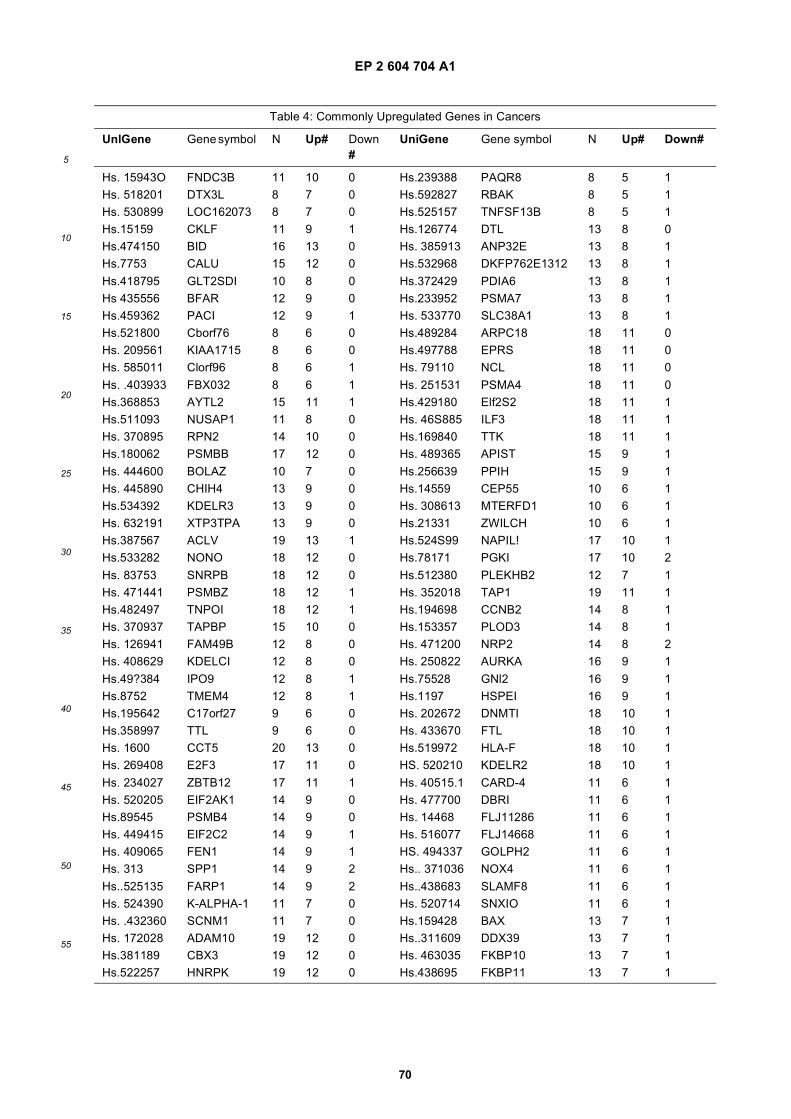
EP 2 604 704 A1
70
5
10
15
20
25
30
35
40
45
50
55
Table 4: Commonly Upregulated Genes in Cancers
UnlGene Gene symbol N Up# Down #
UniGene Gene symbol N Up# Down#
Hs. 15943O FNDC3B 11 10 0 Hs.239388 PAQR8 8 5 1Hs. 518201 DTX3L 8 7 0 Hs.592827 RBAK 8 5 1Hs. 530899 LOC162073 8 7 0 Hs.525157 TNFSF13B 8 5 1Hs.15159 CKLF 11 9 1 Hs.126774 DTL 13 8 0Hs.474150 BID 16 13 0 Hs. 385913 ANP32E 13 8 1Hs.7753 CALU 15 12 0 Hs.532968 DKFP762E1312 13 8 1
Hs.418795 GLT2SDI 10 8 0 Hs.372429 PDIA6 13 8 1Hs 435556 BFAR 12 9 0 Hs.233952 PSMA7 13 8 1Hs.459362 PACI 12 9 1 Hs. 533770 SLC38A1 13 8 1Hs.521800 Cborf76 8 6 0 Hs.489284 ARPC18 18 11 0Hs. 209561 KIAA1715 8 6 0 Hs.497788 EPRS 18 11 0Hs. 585011 Clorf96 8 6 1 Hs. 79110 NCL 18 11 0
Hs. .403933 FBX032 8 6 1 Hs. 251531 PSMA4 18 11 0Hs.368853 AYTL2 15 11 1 Hs.429180 Elf2S2 18 11 1Hs.511093 NUSAP1 11 8 0 Hs. 46S885 ILF3 18 11 1Hs. 370895 RPN2 14 10 0 Hs.169840 TTK 18 11 1Hs.180062 PSMBB 17 12 0 Hs. 489365 APIST 15 9 1
Hs. 444600 BOLAZ 10 7 0 Hs.256639 PPIH 15 9 1Hs. 445890 CHIH4 13 9 0 Hs.14559 CEP55 10 6 1Hs.534392 KDELR3 13 9 0 Hs. 308613 MTERFD1 10 6 1Hs. 632191 XTP3TPA 13 9 0 Hs.21331 ZWILCH 10 6 1Hs.387567 ACLV 19 13 1 Hs.524S99 NAPIL! 17 10 1Hs.533282 NONO 18 12 0 Hs.78171 PGKI 17 10 2
Hs. 83753 SNRPB 18 12 0 Hs.512380 PLEKHB2 12 7 1Hs. 471441 PSMBZ 18 12 1 Hs. 352018 TAP1 19 11 1Hs.482497 TNPOI 18 12 1 Hs.194698 CCNB2 14 8 1Hs. 370937 TAPBP 15 10 0 Hs.153357 PLOD3 14 8 1Hs. 126941 FAM49B 12 8 0 Hs. 471200 NRP2 14 8 2Hs. 408629 KDELCI 12 8 0 Hs. 250822 AURKA 16 9 1
Hs.49?384 IPO9 12 8 1 Hs.75528 GNl2 16 9 1Hs.8752 TMEM4 12 8 1 Hs.1197 HSPEI 16 9 1Hs.195642 C17orf27 9 6 0 Hs. 202672 DNMTI 18 10 1Hs.358997 TTL 9 6 0 Hs. 433670 FTL 18 10 1Hs. 1600 CCT5 20 13 0 Hs.519972 HLA-F 18 10 1Hs. 269408 E2F3 17 11 0 HS. 520210 KDELR2 18 10 1
Hs. 234027 ZBTB12 17 11 1 Hs. 40515.1 CARD-4 11 6 1Hs. 520205 EIF2AK1 14 9 0 Hs. 477700 DBRI 11 6 1Hs.89545 PSMB4 14 9 0 Hs. 14468 FLJ11286 11 6 1Hs. 449415 EIF2C2 14 9 1 Hs. 516077 FLJ14668 11 6 1Hs. 409065 FEN1 14 9 1 HS. 494337 GOLPH2 11 6 1Hs. 313 SPP1 14 9 2 Hs.. 371036 NOX4 11 6 1
Hs..525135 FARP1 14 9 2 Hs..438683 SLAMF8 11 6 1Hs. 524390 K-ALPHA-1 11 7 0 Hs. 520714 SNXIO 11 6 1Hs. .432360 SCNM1 11 7 0 Hs.159428 BAX 13 7 1Hs. 172028 ADAM10 19 12 0 Hs..311609 DDX39 13 7 1Hs.381189 CBX3 19 12 0 Hs. 463035 FKBP10 13 7 1Hs.522257 HNRPK 19 12 0 Hs.438695 FKBP11 13 7 1
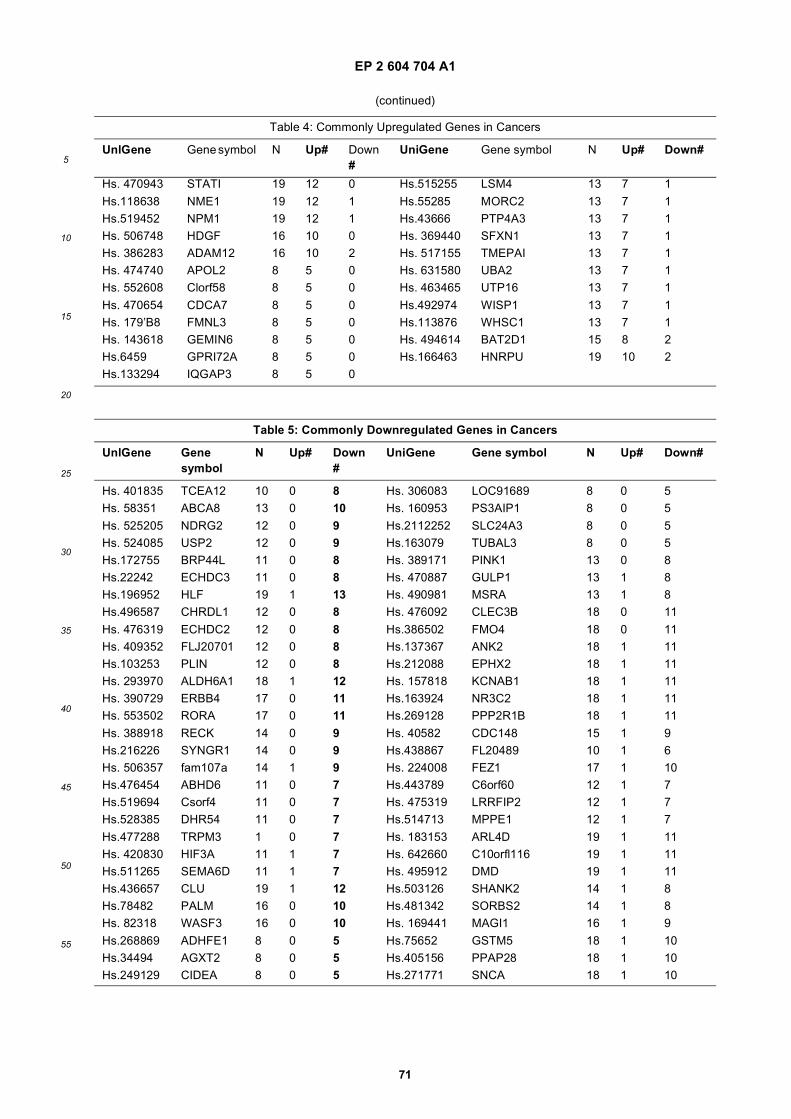
EP 2 604 704 A1
71
5
10
15
20
25
30
35
40
45
50
55
(continued)
Table 4: Commonly Upregulated Genes in Cancers
UnlGene Gene symbol N Up# Down #
UniGene Gene symbol N Up# Down#
Hs. 470943 STATI 19 12 0 Hs.515255 LSM4 13 7 1
Hs.118638 NME1 19 12 1 Hs.55285 MORC2 13 7 1Hs.519452 NPM1 19 12 1 Hs.43666 PTP4A3 13 7 1Hs. 506748 HDGF 16 10 0 Hs. 369440 SFXN1 13 7 1Hs. 386283 ADAM12 16 10 2 Hs. 517155 TMEPAI 13 7 1Hs. 474740 APOL2 8 5 0 Hs. 631580 UBA2 13 7 1Hs. 552608 Clorf58 8 5 0 Hs. 463465 UTP16 13 7 1
Hs. 470654 CDCA7 8 5 0 Hs.492974 WISP1 13 7 1Hs. 179’B8 FMNL3 8 5 0 Hs.113876 WHSC1 13 7 1Hs. 143618 GEMIN6 8 5 0 Hs. 494614 BAT2D1 15 8 2Hs.6459 GPRI72A 8 5 0 Hs.166463 HNRPU 19 10 2Hs.133294 IQGAP3 8 5 0
Table 5: Commonly Downregulated Genes in Cancers
UnlGene Gene symbol
N Up# Down #
UniGene Gene symbol N Up# Down#
Hs. 401835 TCEA12 10 0 8 Hs. 306083 LOC91689 8 0 5Hs. 58351 ABCA8 13 0 10 Hs. 160953 PS3AIP1 8 0 5
Hs. 525205 NDRG2 12 0 9 Hs.2112252 SLC24A3 8 0 5Hs. 524085 USP2 12 0 9 Hs.163079 TUBAL3 8 0 5Hs.172755 BRP44L 11 0 8 Hs. 389171 PINK1 13 0 8Hs.22242 ECHDC3 11 0 8 Hs. 470887 GULP1 13 1 8Hs.196952 HLF 19 1 13 Hs. 490981 MSRA 13 1 8Hs.496587 CHRDL1 12 0 8 Hs. 476092 CLEC3B 18 0 11
Hs. 476319 ECHDC2 12 0 8 Hs.386502 FMO4 18 0 11Hs. 409352 FLJ20701 12 0 8 Hs.137367 ANK2 18 1 11Hs.103253 PLIN 12 0 8 Hs.212088 EPHX2 18 1 11Hs. 293970 ALDH6A1 18 1 12 Hs. 157818 KCNAB1 18 1 11Hs. 390729 ERBB4 17 0 11 Hs.163924 NR3C2 18 1 11Hs. 553502 RORA 17 0 11 Hs.269128 PPP2R1B 18 1 11
Hs. 388918 RECK 14 0 9 Hs. 40582 CDC148 15 1 9Hs.216226 SYNGR1 14 0 9 Hs.438867 FL20489 10 1 6Hs. 506357 fam107a 14 1 9 Hs. 224008 FEZ1 17 1 10Hs.476454 ABHD6 11 0 7 Hs.443789 C6orf60 12 1 7Hs.519694 Csorf4 11 0 7 Hs. 475319 LRRFIP2 12 1 7Hs.528385 DHR54 11 0 7 Hs.514713 MPPE1 12 1 7
Hs.477288 TRPM3 1 0 7 Hs. 183153 ARL4D 19 1 11Hs. 420830 HIF3A 11 1 7 Hs. 642660 C10orfl116 19 1 11Hs.511265 SEMA6D 11 1 7 Hs. 495912 DMD 19 1 11Hs.436657 CLU 19 1 12 Hs.503126 SHANK2 14 1 8Hs.78482 PALM 16 0 10 Hs.481342 SORBS2 14 1 8Hs. 82318 WASF3 16 0 10 Hs. 169441 MAGI1 16 1 9
Hs.268869 ADHFE1 8 0 5 Hs.75652 GSTM5 18 1 10Hs.34494 AGXT2 8 0 5 Hs.405156 PPAP28 18 1 10Hs.249129 CIDEA 8 0 5 Hs.271771 SNCA 18 1 10
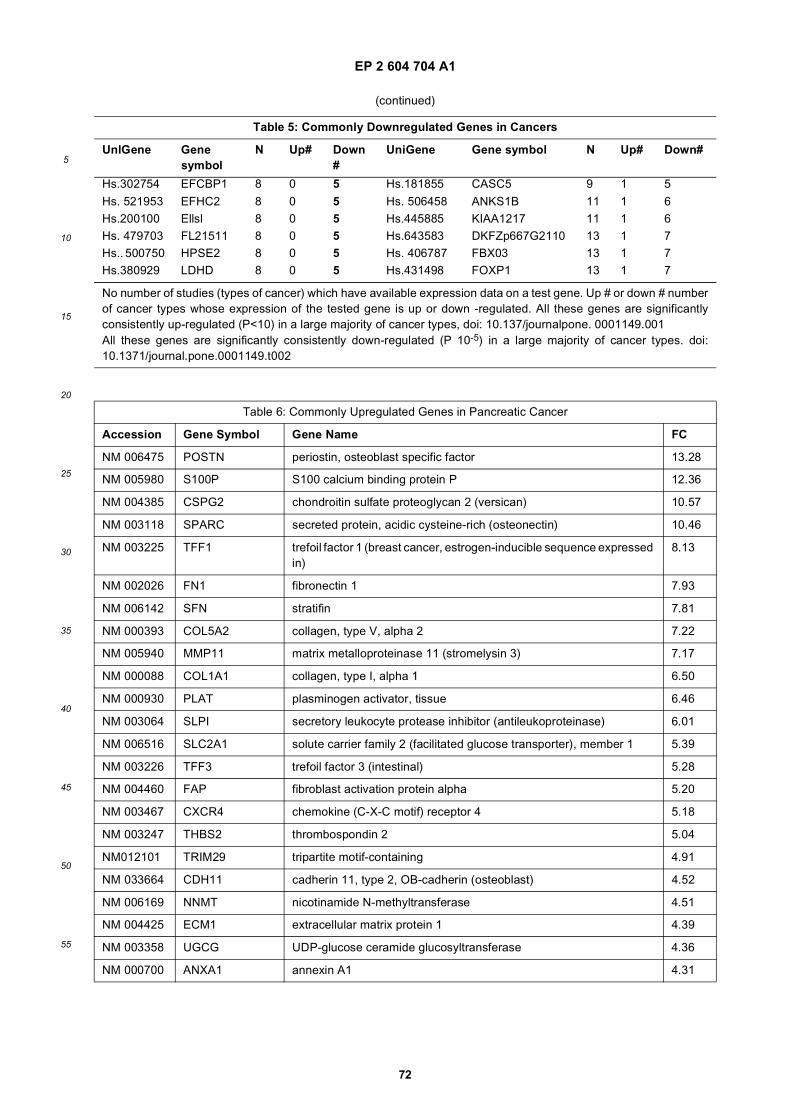
EP 2 604 704 A1
72
5
10
15
20
25
30
35
40
45
50
55
(continued)
Table 5: Commonly Downregulated Genes in Cancers
UnlGene Gene symbol
N Up# Down #
UniGene Gene symbol N Up# Down#
Hs.302754 EFCBP1 8 0 5 Hs.181855 CASC5 9 1 5
Hs. 521953 EFHC2 8 0 5 Hs. 506458 ANKS1B 11 1 6Hs.200100 Ellsl 8 0 5 Hs.445885 KIAA1217 11 1 6Hs. 479703 FL21511 8 0 5 Hs.643583 DKFZp667G2110 13 1 7Hs.. 500750 HPSE2 8 0 5 Hs. 406787 FBX03 13 1 7Hs.380929 LDHD 8 0 5 Hs.431498 FOXP1 13 1 7
No number of studies (types of cancer) which have available expression data on a test gene. Up # or down # numberof cancer types whose expression of the tested gene is up or down -regulated. All these genes are significantlyconsistently up-regulated (P<10) in a large majority of cancer types, doi: 10.137/journalpone. 0001149.001All these genes are significantly consistently down-regulated (P 10-5) in a large majority of cancer types. doi:10.1371/journal.pone.0001149.t002
Table 6: Commonly Upregulated Genes in Pancreatic Cancer
Accession Gene Symbol Gene Name FC
NM 006475 POSTN periostin, osteoblast specific factor 13.28
NM 005980 S100P S100 calcium binding protein P 12.36
NM 004385 CSPG2 chondroitin sulfate proteoglycan 2 (versican) 10.57
NM 003118 SPARC secreted protein, acidic cysteine-rich (osteonectin) 10.46
NM 003225 TFF1 trefoil factor 1 (breast cancer, estrogen-inducible sequence expressed in)
8.13
NM 002026 FN1 fibronectin 1 7.93
NM 006142 SFN stratifin 7.81
NM 000393 COL5A2 collagen, type V, alpha 2 7.22
NM 005940 MMP11 matrix metalloproteinase 11 (stromelysin 3) 7.17
NM 000088 COL1A1 collagen, type I, alpha 1 6.50
NM 000930 PLAT plasminogen activator, tissue 6.46
NM 003064 SLPI secretory leukocyte protease inhibitor (antileukoproteinase) 6.01
NM 006516 SLC2A1 solute carrier family 2 (facilitated glucose transporter), member 1 5.39
NM 003226 TFF3 trefoil factor 3 (intestinal) 5.28
NM 004460 FAP fibroblast activation protein alpha 5.20
NM 003467 CXCR4 chemokine (C-X-C motif) receptor 4 5.18
NM 003247 THBS2 thrombospondin 2 5.04
NM012101 TRIM29 tripartite motif-containing 4.91
NM 033664 CDH11 cadherin 11, type 2, OB-cadherin (osteoblast) 4.52
NM 006169 NNMT nicotinamide N-methyltransferase 4.51
NM 004425 ECM1 extracellular matrix protein 1 4.39
NM 003358 UGCG UDP-glucose ceramide glucosyltransferase 4.36
NM 000700 ANXA1 annexin A1 4.31
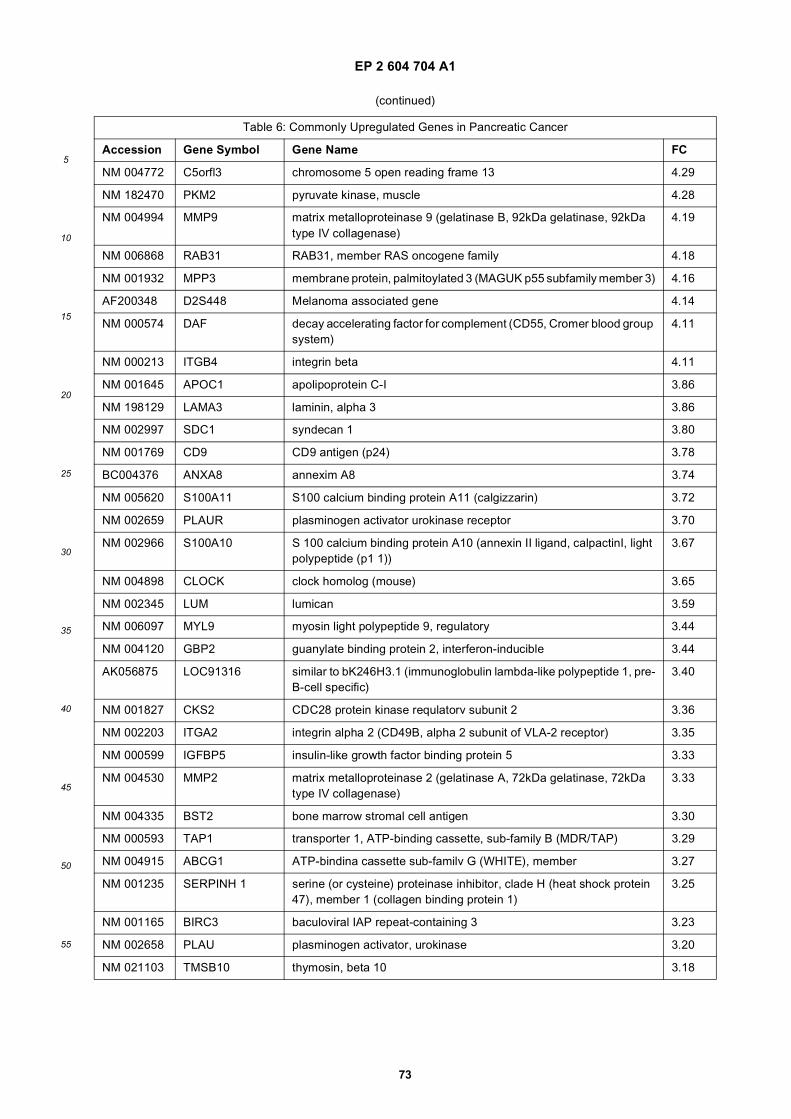
EP 2 604 704 A1
73
5
10
15
20
25
30
35
40
45
50
55
(continued)
Table 6: Commonly Upregulated Genes in Pancreatic Cancer
Accession Gene Symbol Gene Name FC
NM 004772 C5orfl3 chromosome 5 open reading frame 13 4.29
NM 182470 PKM2 pyruvate kinase, muscle 4.28
NM 004994 MMP9 matrix metalloproteinase 9 (gelatinase B, 92kDa gelatinase, 92kDa type IV collagenase)
4.19
NM 006868 RAB31 RAB31, member RAS oncogene family 4.18
NM 001932 MPP3 membrane protein, palmitoylated 3 (MAGUK p55 subfamily member 3) 4.16
AF200348 D2S448 Melanoma associated gene 4.14
NM 000574 DAF decay accelerating factor for complement (CD55, Cromer blood group system)
4.11
NM 000213 ITGB4 integrin beta 4.11
NM 001645 APOC1 apolipoprotein C-I 3.86
NM 198129 LAMA3 laminin, alpha 3 3.86
NM 002997 SDC1 syndecan 1 3.80
NM 001769 CD9 CD9 antigen (p24) 3.78
BC004376 ANXA8 annexim A8 3.74
NM 005620 S100A11 S100 calcium binding protein A11 (calgizzarin) 3.72
NM 002659 PLAUR plasminogen activator urokinase receptor 3.70
NM 002966 S100A10 S 100 calcium binding protein A10 (annexin II ligand, calpactinI, light polypeptide (p1 1))
3.67
NM 004898 CLOCK clock homolog (mouse) 3.65
NM 002345 LUM lumican 3.59
NM 006097 MYL9 myosin light polypeptide 9, regulatory 3.44
NM 004120 GBP2 guanylate binding protein 2, interferon-inducible 3.44
AK056875 LOC91316 similar to bK246H3.1 (immunoglobulin lambda-like polypeptide 1, pre-B-cell specific)
3.40
NM 001827 CKS2 CDC28 protein kinase requlatorv subunit 2 3.36
NM 002203 ITGA2 integrin alpha 2 (CD49B, alpha 2 subunit of VLA-2 receptor) 3.35
NM 000599 IGFBP5 insulin-like growth factor binding protein 5 3.33
NM 004530 MMP2 matrix metalloproteinase 2 (gelatinase A, 72kDa gelatinase, 72kDa type IV collagenase)
3.33
NM 004335 BST2 bone marrow stromal cell antigen 3.30
NM 000593 TAP1 transporter 1, ATP-binding cassette, sub-family B (MDR/TAP) 3.29
NM 004915 ABCG1 ATP-bindina cassette sub-familv G (WHITE), member 3.27
NM 001235 SERPINH 1 serine (or cysteine) proteinase inhibitor, clade H (heat shock protein 47), member 1 (collagen binding protein 1)
3.25
NM 001165 BIRC3 baculoviral IAP repeat-containing 3 3.23
NM 002658 PLAU plasminogen activator, urokinase 3.20
NM 021103 TMSB10 thymosin, beta 10 3.18
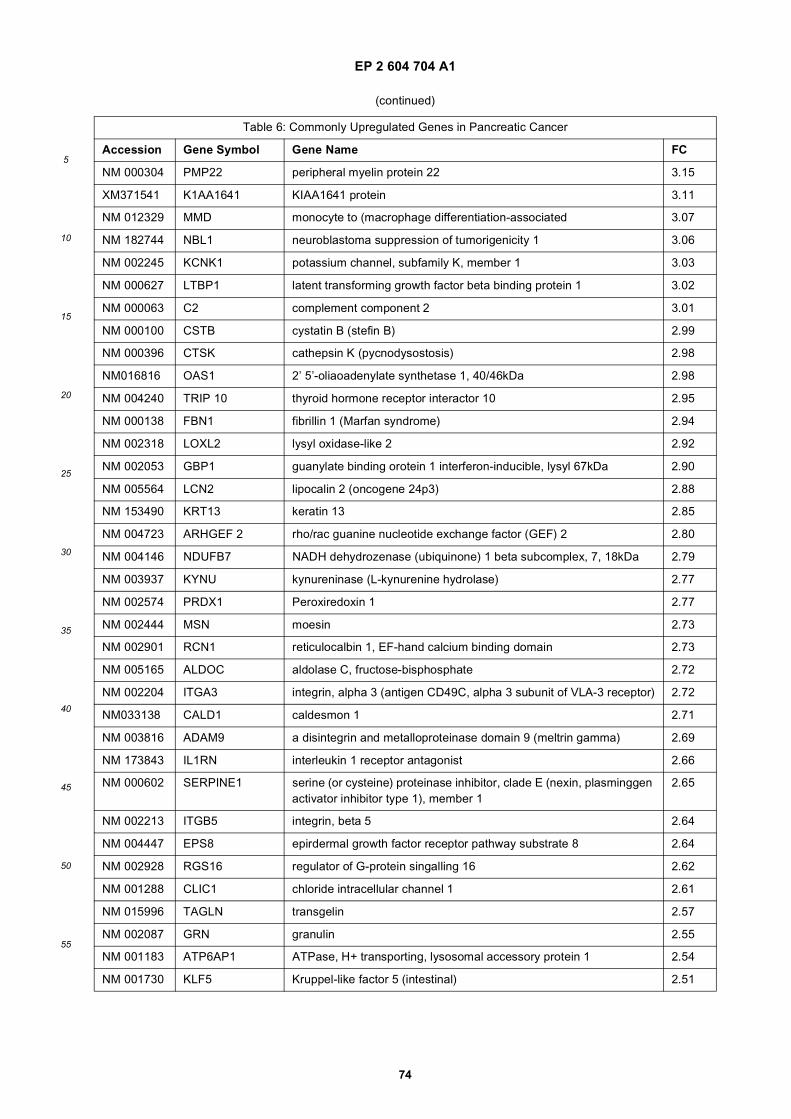
EP 2 604 704 A1
74
5
10
15
20
25
30
35
40
45
50
55
(continued)
Table 6: Commonly Upregulated Genes in Pancreatic Cancer
Accession Gene Symbol Gene Name FC
NM 000304 PMP22 peripheral myelin protein 22 3.15
XM371541 K1AA1641 KIAA1641 protein 3.11
NM 012329 MMD monocyte to (macrophage differentiation-associated 3.07
NM 182744 NBL1 neuroblastoma suppression of tumorigenicity 1 3.06
NM 002245 KCNK1 potassium channel, subfamily K, member 1 3.03
NM 000627 LTBP1 latent transforming growth factor beta binding protein 1 3.02
NM 000063 C2 complement component 2 3.01
NM 000100 CSTB cystatin B (stefin B) 2.99
NM 000396 CTSK cathepsin K (pycnodysostosis) 2.98
NM016816 OAS1 2’ 5’-oliaoadenylate synthetase 1, 40/46kDa 2.98
NM 004240 TRIP 10 thyroid hormone receptor interactor 10 2.95
NM 000138 FBN1 fibrillin 1 (Marfan syndrome) 2.94
NM 002318 LOXL2 lysyl oxidase-like 2 2.92
NM 002053 GBP1 guanylate binding orotein 1 interferon-inducible, lysyl 67kDa 2.90
NM 005564 LCN2 lipocalin 2 (oncogene 24p3) 2.88
NM 153490 KRT13 keratin 13 2.85
NM 004723 ARHGEF 2 rho/rac guanine nucleotide exchange factor (GEF) 2 2.80
NM 004146 NDUFB7 NADH dehydrozenase (ubiquinone) 1 beta subcomplex, 7, 18kDa 2.79
NM 003937 KYNU kynureninase (L-kynurenine hydrolase) 2.77
NM 002574 PRDX1 Peroxiredoxin 1 2.77
NM 002444 MSN moesin 2.73
NM 002901 RCN1 reticulocalbin 1, EF-hand calcium binding domain 2.73
NM 005165 ALDOC aldolase C, fructose-bisphosphate 2.72
NM 002204 ITGA3 integrin, alpha 3 (antigen CD49C, alpha 3 subunit of VLA-3 receptor) 2.72
NM033138 CALD1 caldesmon 1 2.71
NM 003816 ADAM9 a disintegrin and metalloproteinase domain 9 (meltrin gamma) 2.69
NM 173843 IL1RN interleukin 1 receptor antagonist 2.66
NM 000602 SERPINE1 serine (or cysteine) proteinase inhibitor, clade E (nexin, plasminggen activator inhibitor type 1), member 1
2.65
NM 002213 ITGB5 integrin, beta 5 2.64
NM 004447 EPS8 epirdermal growth factor receptor pathway substrate 8 2.64
NM 002928 RGS16 regulator of G-protein singalling 16 2.62
NM 001288 CLIC1 chloride intracellular channel 1 2.61
NM 015996 TAGLN transgelin 2.57
NM 002087 GRN granulin 2.55
NM 001183 ATP6AP1 ATPase, H+ transporting, lysosomal accessory protein 1 2.54
NM 001730 KLF5 Kruppel-like factor 5 (intestinal) 2.51
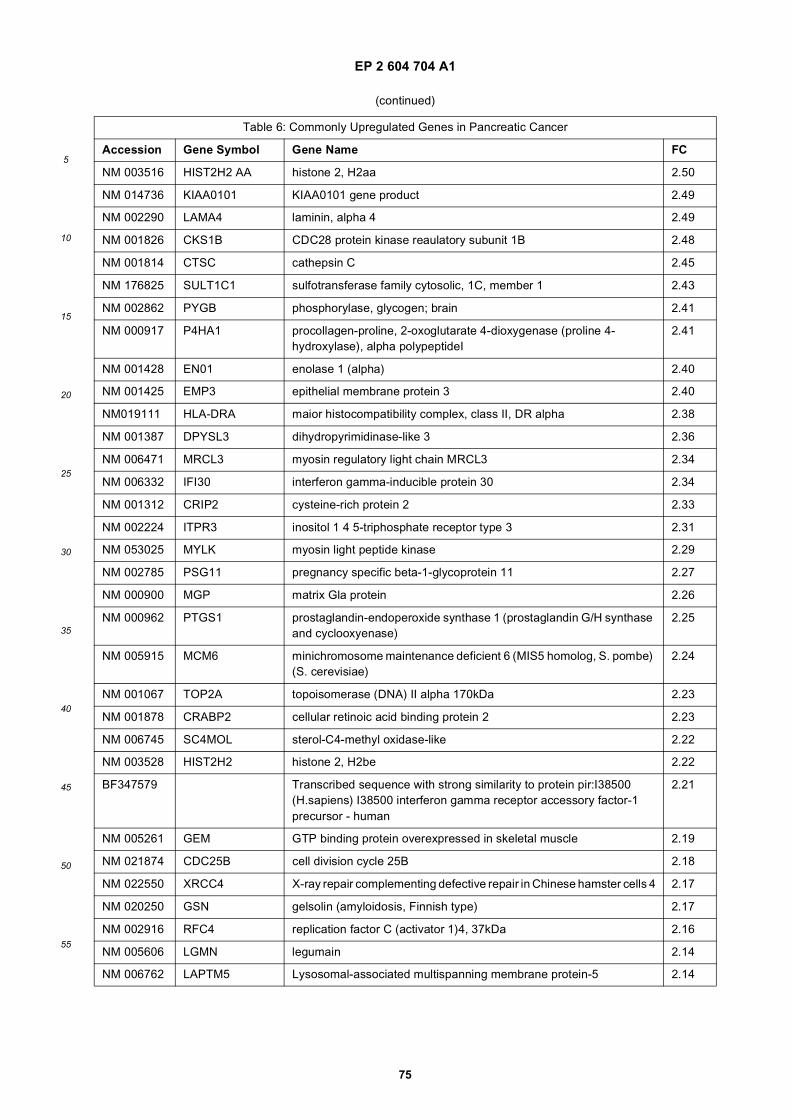
EP 2 604 704 A1
75
5
10
15
20
25
30
35
40
45
50
55
(continued)
Table 6: Commonly Upregulated Genes in Pancreatic Cancer
Accession Gene Symbol Gene Name FC
NM 003516 HIST2H2 AA histone 2, H2aa 2.50
NM 014736 KIAA0101 KIAA0101 gene product 2.49
NM 002290 LAMA4 laminin, alpha 4 2.49
NM 001826 CKS1B CDC28 protein kinase reaulatory subunit 1B 2.48
NM 001814 CTSC cathepsin C 2.45
NM 176825 SULT1C1 sulfotransferase family cytosolic, 1C, member 1 2.43
NM 002862 PYGB phosphorylase, glycogen; brain 2.41
NM 000917 P4HA1 procollagen-proline, 2-oxoglutarate 4-dioxygenase (proline 4- hydroxylase), alpha polypeptideI
2.41
NM 001428 EN01 enolase 1 (alpha) 2.40
NM 001425 EMP3 epithelial membrane protein 3 2.40
NM019111 HLA-DRA maior histocompatibility complex, class II, DR alpha 2.38
NM 001387 DPYSL3 dihydropyrimidinase-like 3 2.36
NM 006471 MRCL3 myosin regulatory light chain MRCL3 2.34
NM 006332 IFI30 interferon gamma-inducible protein 30 2.34
NM 001312 CRIP2 cysteine-rich protein 2 2.33
NM 002224 ITPR3 inositol 1 4 5-triphosphate receptor type 3 2.31
NM 053025 MYLK myosin light peptide kinase 2.29
NM 002785 PSG11 pregnancy specific beta-1-glycoprotein 11 2.27
NM 000900 MGP matrix Gla protein 2.26
NM 000962 PTGS1 prostaglandin-endoperoxide synthase 1 (prostaglandin G/H synthase and cyclooxyenase)
2.25
NM 005915 MCM6 minichromosome maintenance deficient 6 (MIS5 homolog, S. pombe) (S. cerevisiae)
2.24
NM 001067 TOP2A topoisomerase (DNA) II alpha 170kDa 2.23
NM 001878 CRABP2 cellular retinoic acid binding protein 2 2.23
NM 006745 SC4MOL sterol-C4-methyl oxidase-like 2.22
NM 003528 HIST2H2 histone 2, H2be 2.22
BF347579 Transcribed sequence with strong similarity to protein pir:I38500 (H.sapiens) I38500 interferon gamma receptor accessory factor-1 precursor - human
2.21
NM 005261 GEM GTP binding protein overexpressed in skeletal muscle 2.19
NM 021874 CDC25B cell division cycle 25B 2.18
NM 022550 XRCC4 X-ray repair complementing defective repair in Chinese hamster cells 4 2.17
NM 020250 GSN gelsolin (amyloidosis, Finnish type) 2.17
NM 002916 RFC4 replication factor C (activator 1)4, 37kDa 2.16
NM 005606 LGMN legumain 2.14
NM 006762 LAPTM5 Lysosomal-associated multispanning membrane protein-5 2.14
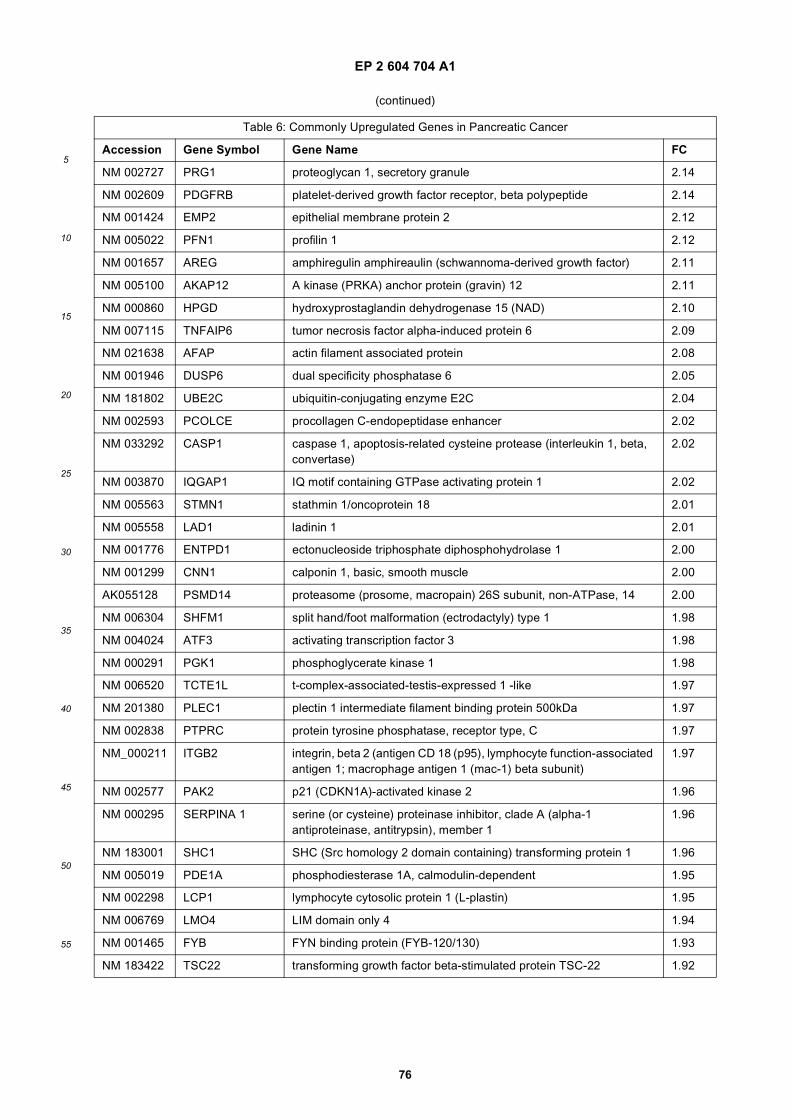
EP 2 604 704 A1
76
5
10
15
20
25
30
35
40
45
50
55
(continued)
Table 6: Commonly Upregulated Genes in Pancreatic Cancer
Accession Gene Symbol Gene Name FC
NM 002727 PRG1 proteoglycan 1, secretory granule 2.14
NM 002609 PDGFRB platelet-derived growth factor receptor, beta polypeptide 2.14
NM 001424 EMP2 epithelial membrane protein 2 2.12
NM 005022 PFN1 profilin 1 2.12
NM 001657 AREG amphiregulin amphireaulin (schwannoma-derived growth factor) 2.11
NM 005100 AKAP12 A kinase (PRKA) anchor protein (gravin) 12 2.11
NM 000860 HPGD hydroxyprostaglandin dehydrogenase 15 (NAD) 2.10
NM 007115 TNFAIP6 tumor necrosis factor alpha-induced protein 6 2.09
NM 021638 AFAP actin filament associated protein 2.08
NM 001946 DUSP6 dual specificity phosphatase 6 2.05
NM 181802 UBE2C ubiquitin-conjugating enzyme E2C 2.04
NM 002593 PCOLCE procollagen C-endopeptidase enhancer 2.02
NM 033292 CASP1 caspase 1, apoptosis-related cysteine protease (interleukin 1, beta, convertase)
2.02
NM 003870 IQGAP1 IQ motif containing GTPase activating protein 1 2.02
NM 005563 STMN1 stathmin 1/oncoprotein 18 2.01
NM 005558 LAD1 ladinin 1 2.01
NM 001776 ENTPD1 ectonucleoside triphosphate diphosphohydrolase 1 2.00
NM 001299 CNN1 calponin 1, basic, smooth muscle 2.00
AK055128 PSMD14 proteasome (prosome, macropain) 26S subunit, non-ATPase, 14 2.00
NM 006304 SHFM1 split hand/foot malformation (ectrodactyly) type 1 1.98
NM 004024 ATF3 activating transcription factor 3 1.98
NM 000291 PGK1 phosphoglycerate kinase 1 1.98
NM 006520 TCTE1L t-complex-associated-testis-expressed 1 -like 1.97
NM 201380 PLEC1 plectin 1 intermediate filament binding protein 500kDa 1.97
NM 002838 PTPRC protein tyrosine phosphatase, receptor type, C 1.97
NM_000211 ITGB2 integrin, beta 2 (antigen CD 18 (p95), lymphocyte function-associated antigen 1; macrophage antigen 1 (mac-1) beta subunit)
1.97
NM 002577 PAK2 p21 (CDKN1A)-activated kinase 2 1.96
NM 000295 SERPINA 1 serine (or cysteine) proteinase inhibitor, clade A (alpha-1 antiproteinase, antitrypsin), member 1
1.96
NM 183001 SHC1 SHC (Src homology 2 domain containing) transforming protein 1 1.96
NM 005019 PDE1A phosphodiesterase 1A, calmodulin-dependent 1.95
NM 002298 LCP1 lymphocyte cytosolic protein 1 (L-plastin) 1.95
NM 006769 LMO4 LIM domain only 4 1.94
NM 001465 FYB FYN binding protein (FYB-120/130) 1.93
NM 183422 TSC22 transforming growth factor beta-stimulated protein TSC-22 1.92
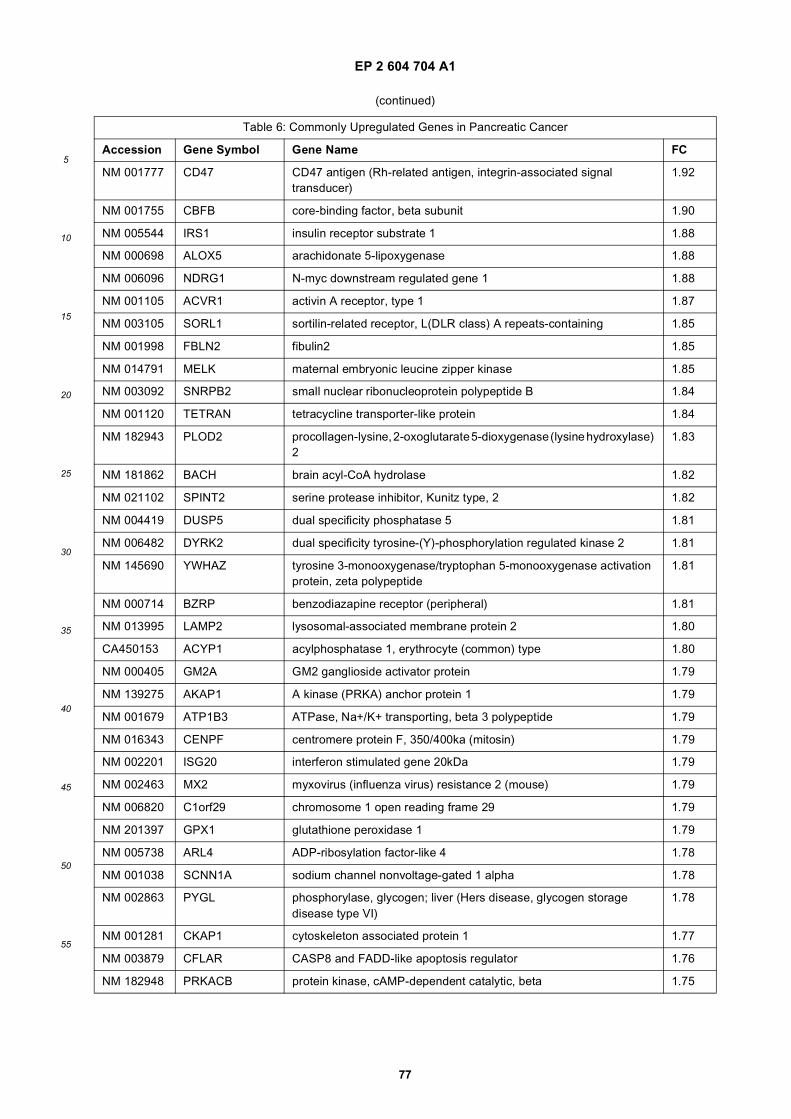
EP 2 604 704 A1
77
5
10
15
20
25
30
35
40
45
50
55
(continued)
Table 6: Commonly Upregulated Genes in Pancreatic Cancer
Accession Gene Symbol Gene Name FC
NM 001777 CD47 CD47 antigen (Rh-related antigen, integrin-associated signal transducer)
1.92
NM 001755 CBFB core-binding factor, beta subunit 1.90
NM 005544 IRS1 insulin receptor substrate 1 1.88
NM 000698 ALOX5 arachidonate 5-lipoxygenase 1.88
NM 006096 NDRG1 N-myc downstream regulated gene 1 1.88
NM 001105 ACVR1 activin A receptor, type 1 1.87
NM 003105 SORL1 sortilin-related receptor, L(DLR class) A repeats-containing 1.85
NM 001998 FBLN2 fibulin2 1.85
NM 014791 MELK maternal embryonic leucine zipper kinase 1.85
NM 003092 SNRPB2 small nuclear ribonucleoprotein polypeptide B 1.84
NM 001120 TETRAN tetracycline transporter-like protein 1.84
NM 182943 PLOD2 procollagen-lysine, 2-oxoglutarate 5-dioxygenase (lysine hydroxylase) 2
1.83
NM 181862 BACH brain acyl-CoA hydrolase 1.82
NM 021102 SPINT2 serine protease inhibitor, Kunitz type, 2 1.82
NM 004419 DUSP5 dual specificity phosphatase 5 1.81
NM 006482 DYRK2 dual specificity tyrosine-(Y)-phosphorylation regulated kinase 2 1.81
NM 145690 YWHAZ tyrosine 3-monooxygenase/tryptophan 5-monooxygenase activation protein, zeta polypeptide
1.81
NM 000714 BZRP benzodiazapine receptor (peripheral) 1.81
NM 013995 LAMP2 lysosomal-associated membrane protein 2 1.80
CA450153 ACYP1 acylphosphatase 1, erythrocyte (common) type 1.80
NM 000405 GM2A GM2 ganglioside activator protein 1.79
NM 139275 AKAP1 A kinase (PRKA) anchor protein 1 1.79
NM 001679 ATP1B3 ATPase, Na+/K+ transporting, beta 3 polypeptide 1.79
NM 016343 CENPF centromere protein F, 350/400ka (mitosin) 1.79
NM 002201 ISG20 interferon stimulated gene 20kDa 1.79
NM 002463 MX2 myxovirus (influenza virus) resistance 2 (mouse) 1.79
NM 006820 C1orf29 chromosome 1 open reading frame 29 1.79
NM 201397 GPX1 glutathione peroxidase 1 1.79
NM 005738 ARL4 ADP-ribosylation factor-like 4 1.78
NM 001038 SCNN1A sodium channel nonvoltage-gated 1 alpha 1.78
NM 002863 PYGL phosphorylase, glycogen; liver (Hers disease, glycogen storage disease type VI)
1.78
NM 001281 CKAP1 cytoskeleton associated protein 1 1.77
NM 003879 CFLAR CASP8 and FADD-like apoptosis regulator 1.76
NM 182948 PRKACB protein kinase, cAMP-dependent catalytic, beta 1.75
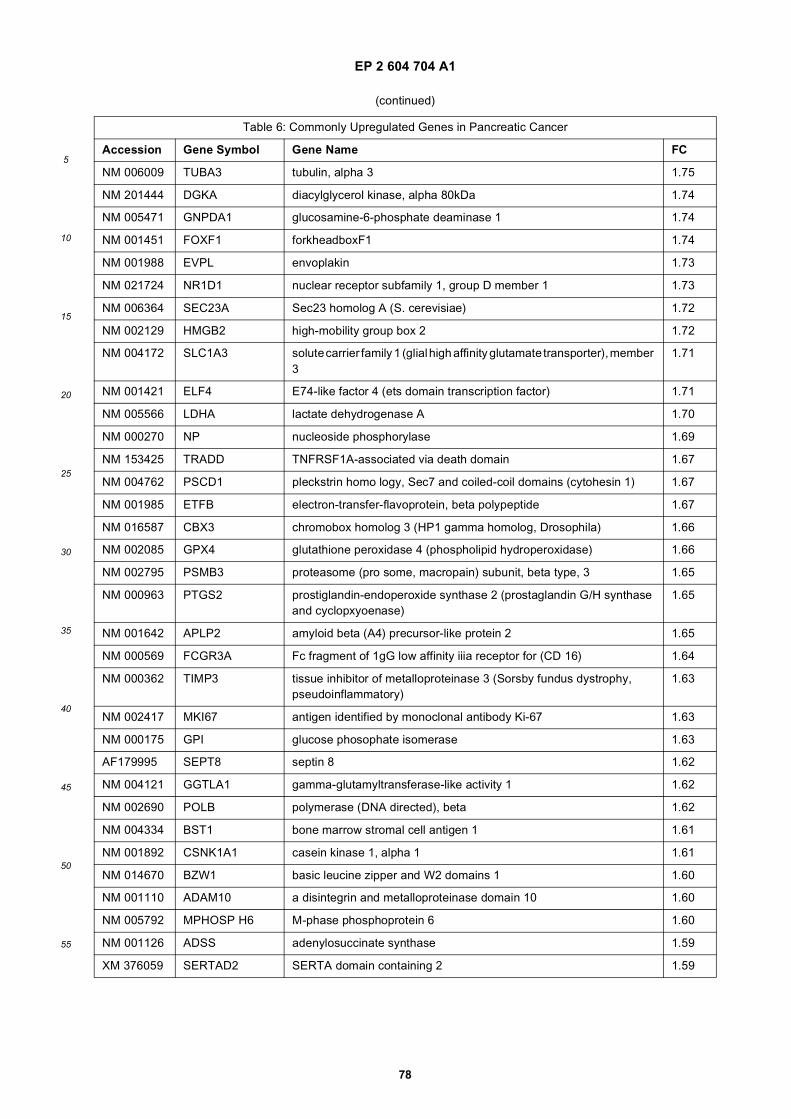
EP 2 604 704 A1
78
5
10
15
20
25
30
35
40
45
50
55
(continued)
Table 6: Commonly Upregulated Genes in Pancreatic Cancer
Accession Gene Symbol Gene Name FC
NM 006009 TUBA3 tubulin, alpha 3 1.75
NM 201444 DGKA diacylglycerol kinase, alpha 80kDa 1.74
NM 005471 GNPDA1 glucosamine-6-phosphate deaminase 1 1.74
NM 001451 FOXF1 forkheadboxF1 1.74
NM 001988 EVPL envoplakin 1.73
NM 021724 NR1D1 nuclear receptor subfamily 1, group D member 1 1.73
NM 006364 SEC23A Sec23 homolog A (S. cerevisiae) 1.72
NM 002129 HMGB2 high-mobility group box 2 1.72
NM 004172 SLC1A3 solute carrier family 1 (glial high affinity glutamate transporter), member 3
1.71
NM 001421 ELF4 E74-like factor 4 (ets domain transcription factor) 1.71
NM 005566 LDHA lactate dehydrogenase A 1.70
NM 000270 NP nucleoside phosphorylase 1.69
NM 153425 TRADD TNFRSF1A-associated via death domain 1.67
NM 004762 PSCD1 pleckstrin homo logy, Sec7 and coiled-coil domains (cytohesin 1) 1.67
NM 001985 ETFB electron-transfer-flavoprotein, beta polypeptide 1.67
NM 016587 CBX3 chromobox homolog 3 (HP1 gamma homolog, Drosophila) 1.66
NM 002085 GPX4 glutathione peroxidase 4 (phospholipid hydroperoxidase) 1.66
NM 002795 PSMB3 proteasome (pro some, macropain) subunit, beta type, 3 1.65
NM 000963 PTGS2 prostiglandin-endoperoxide synthase 2 (prostaglandin G/H synthase and cyclopxyoenase)
1.65
NM 001642 APLP2 amyloid beta (A4) precursor-like protein 2 1.65
NM 000569 FCGR3A Fc fragment of 1gG low affinity iiia receptor for (CD 16) 1.64
NM 000362 TIMP3 tissue inhibitor of metalloproteinase 3 (Sorsby fundus dystrophy, pseudoinflammatory)
1.63
NM 002417 MKI67 antigen identified by monoclonal antibody Ki-67 1.63
NM 000175 GPI glucose phosophate isomerase 1.63
AF179995 SEPT8 septin 8 1.62
NM 004121 GGTLA1 gamma-glutamyltransferase-like activity 1 1.62
NM 002690 POLB polymerase (DNA directed), beta 1.62
NM 004334 BST1 bone marrow stromal cell antigen 1 1.61
NM 001892 CSNK1A1 casein kinase 1, alpha 1 1.61
NM 014670 BZW1 basic leucine zipper and W2 domains 1 1.60
NM 001110 ADAM10 a disintegrin and metalloproteinase domain 10 1.60
NM 005792 MPHOSP H6 M-phase phosphoprotein 6 1.60
NM 001126 ADSS adenylosuccinate synthase 1.59
XM 376059 SERTAD2 SERTA domain containing 2 1.59
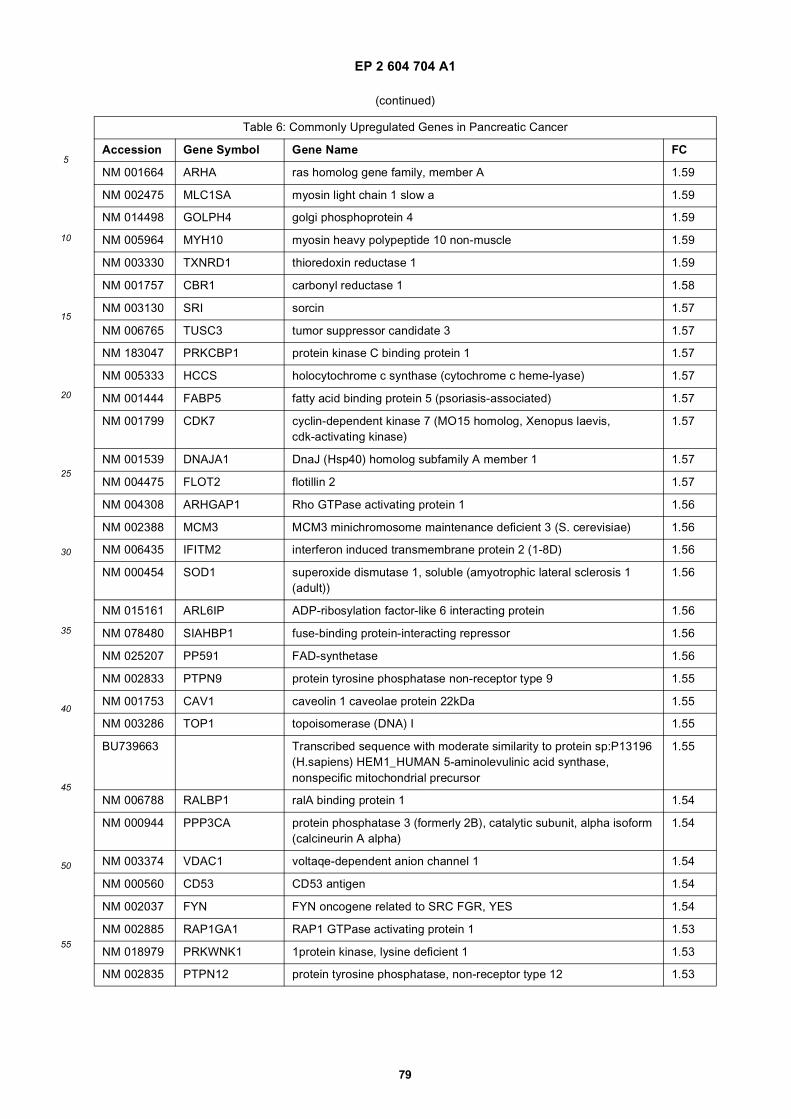
EP 2 604 704 A1
79
5
10
15
20
25
30
35
40
45
50
55
(continued)
Table 6: Commonly Upregulated Genes in Pancreatic Cancer
Accession Gene Symbol Gene Name FC
NM 001664 ARHA ras homolog gene family, member A 1.59
NM 002475 MLC1SA myosin light chain 1 slow a 1.59
NM 014498 GOLPH4 golgi phosphoprotein 4 1.59
NM 005964 MYH10 myosin heavy polypeptide 10 non-muscle 1.59
NM 003330 TXNRD1 thioredoxin reductase 1 1.59
NM 001757 CBR1 carbonyl reductase 1 1.58
NM 003130 SRI sorcin 1.57
NM 006765 TUSC3 tumor suppressor candidate 3 1.57
NM 183047 PRKCBP1 protein kinase C binding protein 1 1.57
NM 005333 HCCS holocytochrome c synthase (cytochrome c heme-lyase) 1.57
NM 001444 FABP5 fatty acid binding protein 5 (psoriasis-associated) 1.57
NM 001799 CDK7 cyclin-dependent kinase 7 (MO15 homolog, Xenopus laevis, cdk-activating kinase)
1.57
NM 001539 DNAJA1 DnaJ (Hsp40) homolog subfamily A member 1 1.57
NM 004475 FLOT2 flotillin 2 1.57
NM 004308 ARHGAP1 Rho GTPase activating protein 1 1.56
NM 002388 MCM3 MCM3 minichromosome maintenance deficient 3 (S. cerevisiae) 1.56
NM 006435 IFITM2 interferon induced transmembrane protein 2 (1-8D) 1.56
NM 000454 SOD1 superoxide dismutase 1, soluble (amyotrophic lateral sclerosis 1 (adult))
1.56
NM 015161 ARL6IP ADP-ribosylation factor-like 6 interacting protein 1.56
NM 078480 SIAHBP1 fuse-binding protein-interacting repressor 1.56
NM 025207 PP591 FAD-synthetase 1.56
NM 002833 PTPN9 protein tyrosine phosphatase non-receptor type 9 1.55
NM 001753 CAV1 caveolin 1 caveolae protein 22kDa 1.55
NM 003286 TOP1 topoisomerase (DNA) I 1.55
BU739663 Transcribed sequence with moderate similarity to protein sp:P13196 (H.sapiens) HEM1_HUMAN 5-aminolevulinic acid synthase, nonspecific mitochondrial precursor
1.55
NM 006788 RALBP1 ralA binding protein 1 1.54
NM 000944 PPP3CA protein phosphatase 3 (formerly 2B), catalytic subunit, alpha isoform (calcineurin A alpha)
1.54
NM 003374 VDAC1 voltaqe-dependent anion channel 1 1.54
NM 000560 CD53 CD53 antigen 1.54
NM 002037 FYN FYN oncogene related to SRC FGR, YES 1.54
NM 002885 RAP1GA1 RAP1 GTPase activating protein 1 1.53
NM 018979 PRKWNK1 1protein kinase, lysine deficient 1 1.53
NM 002835 PTPN12 protein tyrosine phosphatase, non-receptor type 12 1.53
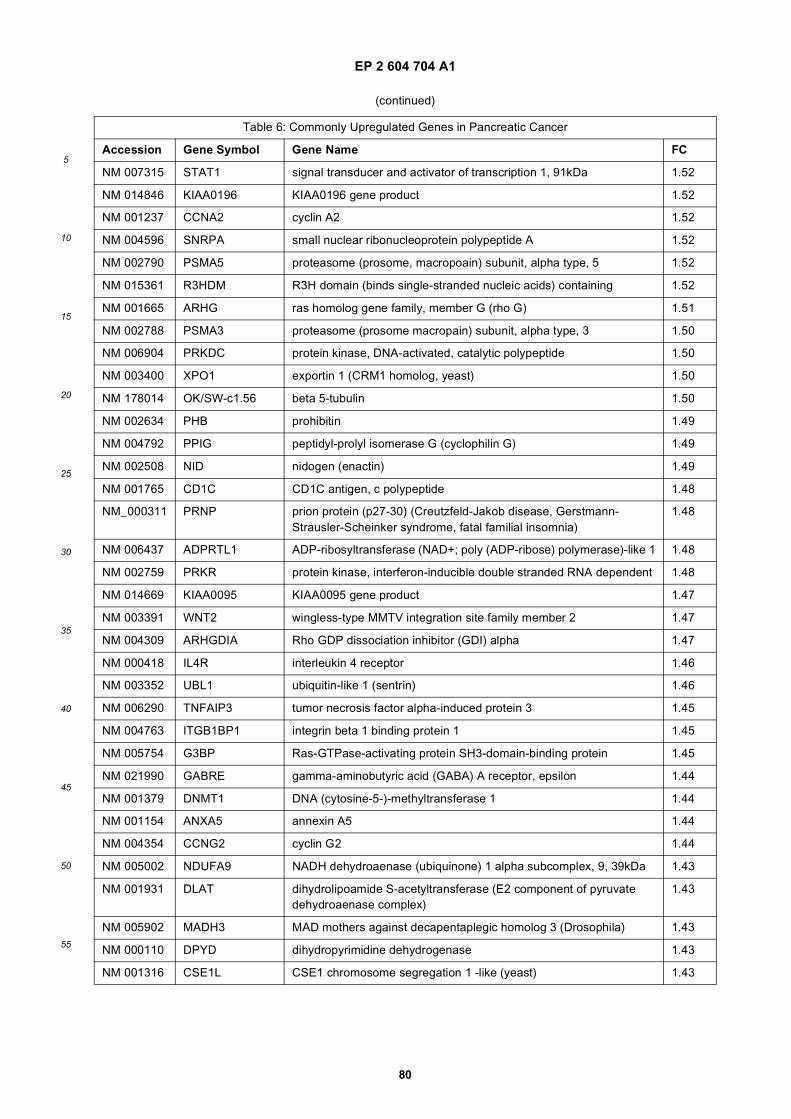
EP 2 604 704 A1
80
5
10
15
20
25
30
35
40
45
50
55
(continued)
Table 6: Commonly Upregulated Genes in Pancreatic Cancer
Accession Gene Symbol Gene Name FC
NM 007315 STAT1 signal transducer and activator of transcription 1, 91kDa 1.52
NM 014846 KIAA0196 KIAA0196 gene product 1.52
NM 001237 CCNA2 cyclin A2 1.52
NM 004596 SNRPA small nuclear ribonucleoprotein polypeptide A 1.52
NM 002790 PSMA5 proteasome (prosome, macropoain) subunit, alpha type, 5 1.52
NM 015361 R3HDM R3H domain (binds single-stranded nucleic acids) containing 1.52
NM 001665 ARHG ras homolog gene family, member G (rho G) 1.51
NM 002788 PSMA3 proteasome (prosome macropain) subunit, alpha type, 3 1.50
NM 006904 PRKDC protein kinase, DNA-activated, catalytic polypeptide 1.50
NM 003400 XPO1 exportin 1 (CRM1 homolog, yeast) 1.50
NM 178014 OK/SW-c1.56 beta 5-tubulin 1.50
NM 002634 PHB prohibitin 1.49
NM 004792 PPIG peptidyl-prolyl isomerase G (cyclophilin G) 1.49
NM 002508 NID nidogen (enactin) 1.49
NM 001765 CD1C CD1C antigen, c polypeptide 1.48
NM_000311 PRNP prion protein (p27-30) (Creutzfeld-Jakob disease, Gerstmann-Strausler-Scheinker syndrome, fatal familial insomnia)
1.48
NM 006437 ADPRTL1 ADP-ribosyltransferase (NAD+; poly (ADP-ribose) polymerase)-like 1 1.48
NM 002759 PRKR protein kinase, interferon-inducible double stranded RNA dependent 1.48
NM 014669 KIAA0095 KIAA0095 gene product 1.47
NM 003391 WNT2 wingless-type MMTV integration site family member 2 1.47
NM 004309 ARHGDIA Rho GDP dissociation inhibitor (GDI) alpha 1.47
NM 000418 IL4R interleukin 4 receptor 1.46
NM 003352 UBL1 ubiquitin-like 1 (sentrin) 1.46
NM 006290 TNFAIP3 tumor necrosis factor alpha-induced protein 3 1.45
NM 004763 ITGB1BP1 integrin beta 1 binding protein 1 1.45
NM 005754 G3BP Ras-GTPase-activating protein SH3-domain-binding protein 1.45
NM 021990 GABRE gamma-aminobutyric acid (GABA) A receptor, epsilon 1.44
NM 001379 DNMT1 DNA (cytosine-5-)-methyltransferase 1 1.44
NM 001154 ANXA5 annexin A5 1.44
NM 004354 CCNG2 cyclin G2 1.44
NM 005002 NDUFA9 NADH dehydroaenase (ubiquinone) 1 alpha subcomplex, 9, 39kDa 1.43
NM 001931 DLAT dihydrolipoamide S-acetyltransferase (E2 component of pyruvate dehydroaenase complex)
1.43
NM 005902 MADH3 MAD mothers against decapentaplegic homolog 3 (Drosophila) 1.43
NM 000110 DPYD dihydropyrimidine dehydrogenase 1.43
NM 001316 CSE1L CSE1 chromosome segregation 1 -like (yeast) 1.43
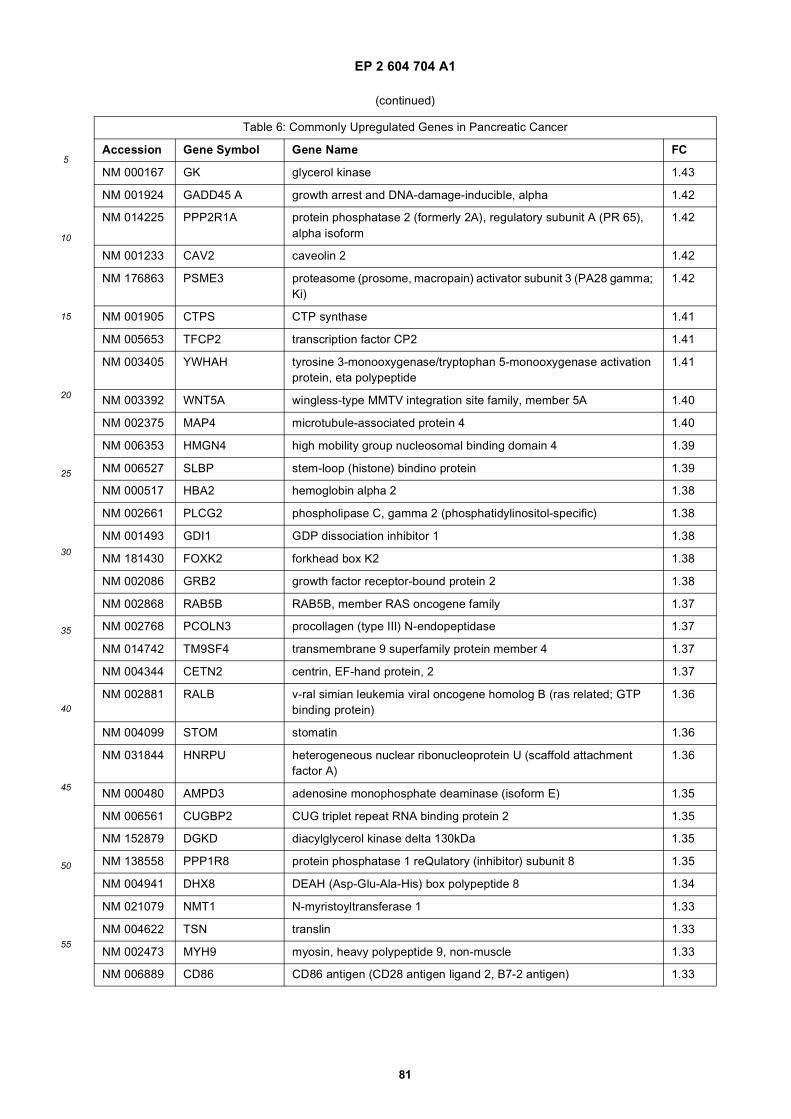
EP 2 604 704 A1
81
5
10
15
20
25
30
35
40
45
50
55
(continued)
Table 6: Commonly Upregulated Genes in Pancreatic Cancer
Accession Gene Symbol Gene Name FC
NM 000167 GK glycerol kinase 1.43
NM 001924 GADD45 A growth arrest and DNA-damage-inducible, alpha 1.42
NM 014225 PPP2R1A protein phosphatase 2 (formerly 2A), regulatory subunit A (PR 65), alpha isoform
1.42
NM 001233 CAV2 caveolin 2 1.42
NM 176863 PSME3 proteasome (prosome, macropain) activator subunit 3 (PA28 gamma; Ki)
1.42
NM 001905 CTPS CTP synthase 1.41
NM 005653 TFCP2 transcription factor CP2 1.41
NM 003405 YWHAH tyrosine 3-monooxygenase/tryptophan 5-monooxygenase activation protein, eta polypeptide
1.41
NM 003392 WNT5A wingless-type MMTV integration site family, member 5A 1.40
NM 002375 MAP4 microtubule-associated protein 4 1.40
NM 006353 HMGN4 high mobility group nucleosomal binding domain 4 1.39
NM 006527 SLBP stem-loop (histone) bindino protein 1.39
NM 000517 HBA2 hemoglobin alpha 2 1.38
NM 002661 PLCG2 phospholipase C, gamma 2 (phosphatidylinositol-specific) 1.38
NM 001493 GDI1 GDP dissociation inhibitor 1 1.38
NM 181430 FOXK2 forkhead box K2 1.38
NM 002086 GRB2 growth factor receptor-bound protein 2 1.38
NM 002868 RAB5B RAB5B, member RAS oncogene family 1.37
NM 002768 PCOLN3 procollagen (type III) N-endopeptidase 1.37
NM 014742 TM9SF4 transmembrane 9 superfamily protein member 4 1.37
NM 004344 CETN2 centrin, EF-hand protein, 2 1.37
NM 002881 RALB v-ral simian leukemia viral oncogene homolog B (ras related; GTP binding protein)
1.36
NM 004099 STOM stomatin 1.36
NM 031844 HNRPU heterogeneous nuclear ribonucleoprotein U (scaffold attachment factor A)
1.36
NM 000480 AMPD3 adenosine monophosphate deaminase (isoform E) 1.35
NM 006561 CUGBP2 CUG triplet repeat RNA binding protein 2 1.35
NM 152879 DGKD diacylglycerol kinase delta 130kDa 1.35
NM 138558 PPP1R8 protein phosphatase 1 reQulatory (inhibitor) subunit 8 1.35
NM 004941 DHX8 DEAH (Asp-Glu-Ala-His) box polypeptide 8 1.34
NM 021079 NMT1 N-myristoyltransferase 1 1.33
NM 004622 TSN translin 1.33
NM 002473 MYH9 myosin, heavy polypeptide 9, non-muscle 1.33
NM 006889 CD86 CD86 antigen (CD28 antigen ligand 2, B7-2 antigen) 1.33
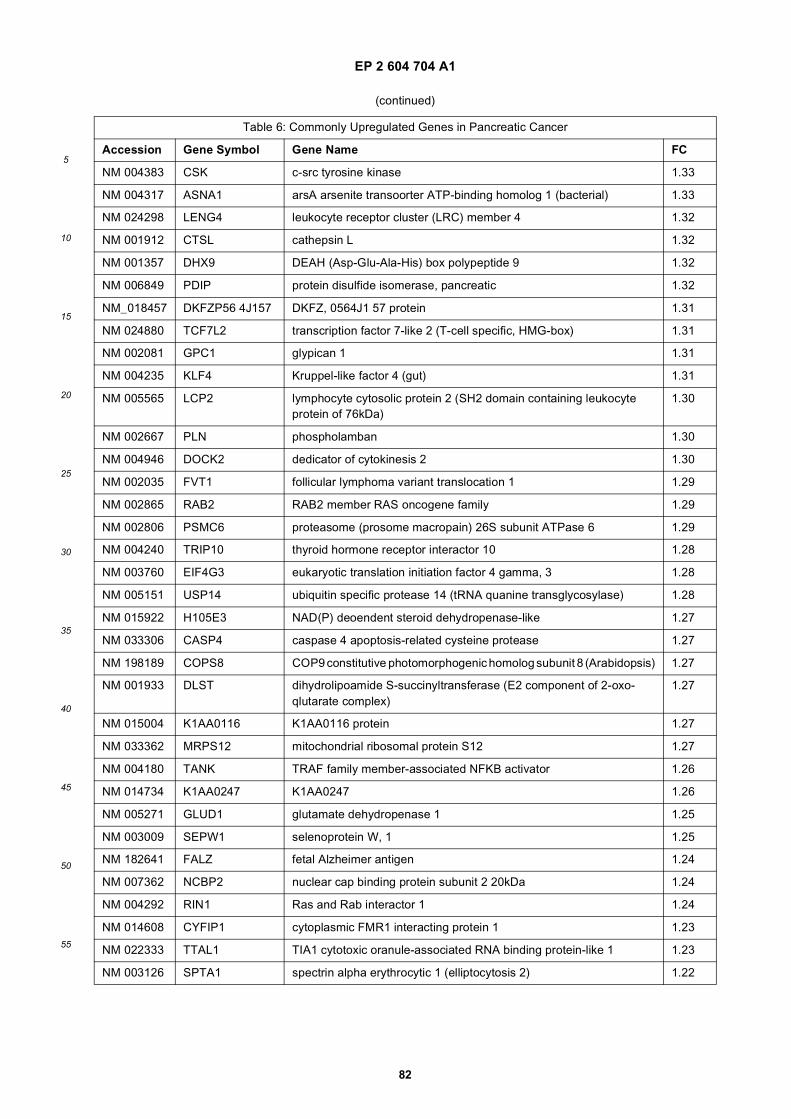
EP 2 604 704 A1
82
5
10
15
20
25
30
35
40
45
50
55
(continued)
Table 6: Commonly Upregulated Genes in Pancreatic Cancer
Accession Gene Symbol Gene Name FC
NM 004383 CSK c-src tyrosine kinase 1.33
NM 004317 ASNA1 arsA arsenite transoorter ATP-binding homolog 1 (bacterial) 1.33
NM 024298 LENG4 leukocyte receptor cluster (LRC) member 4 1.32
NM 001912 CTSL cathepsin L 1.32
NM 001357 DHX9 DEAH (Asp-Glu-Ala-His) box polypeptide 9 1.32
NM 006849 PDIP protein disulfide isomerase, pancreatic 1.32
NM_018457 DKFZP56 4J157 DKFZ, 0564J1 57 protein 1.31
NM 024880 TCF7L2 transcription factor 7-like 2 (T-cell specific, HMG-box) 1.31
NM 002081 GPC1 glypican 1 1.31
NM 004235 KLF4 Kruppel-like factor 4 (gut) 1.31
NM 005565 LCP2 lymphocyte cytosolic protein 2 (SH2 domain containing leukocyte protein of 76kDa)
1.30
NM 002667 PLN phospholamban 1.30
NM 004946 DOCK2 dedicator of cytokinesis 2 1.30
NM 002035 FVT1 follicular lymphoma variant translocation 1 1.29
NM 002865 RAB2 RAB2 member RAS oncogene family 1.29
NM 002806 PSMC6 proteasome (prosome macropain) 26S subunit ATPase 6 1.29
NM 004240 TRIP10 thyroid hormone receptor interactor 10 1.28
NM 003760 EIF4G3 eukaryotic translation initiation factor 4 gamma, 3 1.28
NM 005151 USP14 ubiquitin specific protease 14 (tRNA quanine transglycosylase) 1.28
NM 015922 H105E3 NAD(P) deoendent steroid dehydropenase-like 1.27
NM 033306 CASP4 caspase 4 apoptosis-related cysteine protease 1.27
NM 198189 COPS8 COP9 constitutive photomorphogenic homolog subunit 8 (Arabidopsis) 1.27
NM 001933 DLST dihydrolipoamide S-succinyltransferase (E2 component of 2-oxo-qlutarate complex)
1.27
NM 015004 K1AA0116 K1AA0116 protein 1.27
NM 033362 MRPS12 mitochondrial ribosomal protein S12 1.27
NM 004180 TANK TRAF family member-associated NFKB activator 1.26
NM 014734 K1AA0247 K1AA0247 1.26
NM 005271 GLUD1 glutamate dehydropenase 1 1.25
NM 003009 SEPW1 selenoprotein W, 1 1.25
NM 182641 FALZ fetal Alzheimer antigen 1.24
NM 007362 NCBP2 nuclear cap binding protein subunit 2 20kDa 1.24
NM 004292 RIN1 Ras and Rab interactor 1 1.24
NM 014608 CYFIP1 cytoplasmic FMR1 interacting protein 1 1.23
NM 022333 TTAL1 TIA1 cytotoxic oranule-associated RNA binding protein-like 1 1.23
NM 003126 SPTA1 spectrin alpha erythrocytic 1 (elliptocytosis 2) 1.22
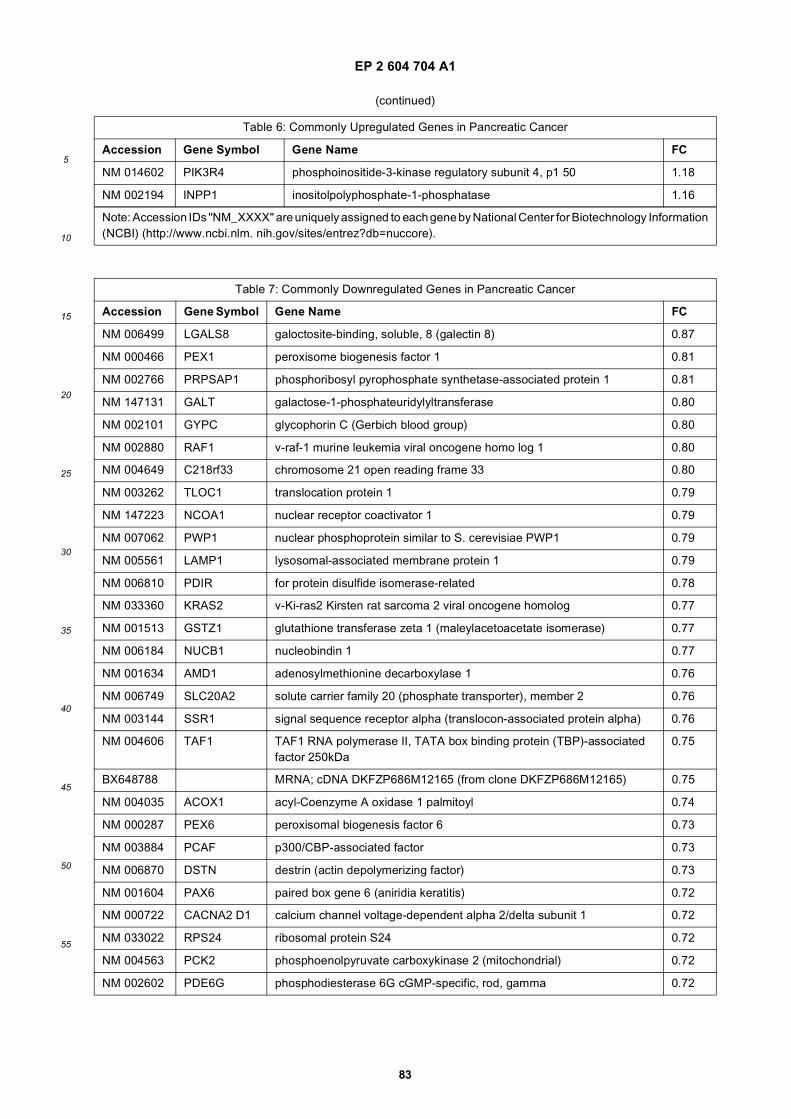
EP 2 604 704 A1
83
5
10
15
20
25
30
35
40
45
50
55
(continued)
Table 6: Commonly Upregulated Genes in Pancreatic Cancer
Accession Gene Symbol Gene Name FC
NM 014602 PIK3R4 phosphoinositide-3-kinase regulatory subunit 4, p1 50 1.18
NM 002194 INPP1 inositolpolyphosphate-1-phosphatase 1.16
Note: Accession IDs "NM_XXXX" are uniquely assigned to each gene by National Center for Biotechnology Information(NCBI) (http://www.ncbi.nlm. nih.gov/sites/entrez?db=nuccore).
Table 7: Commonly Downregulated Genes in Pancreatic Cancer
Accession Gene Symbol Gene Name FC
NM 006499 LGALS8 galoctosite-binding, soluble, 8 (galectin 8) 0.87
NM 000466 PEX1 peroxisome biogenesis factor 1 0.81
NM 002766 PRPSAP1 phosphoribosyl pyrophosphate synthetase-associated protein 1 0.81
NM 147131 GALT galactose-1-phosphateuridylyltransferase 0.80
NM 002101 GYPC glycophorin C (Gerbich blood group) 0.80
NM 002880 RAF1 v-raf-1 murine leukemia viral oncogene homo log 1 0.80
NM 004649 C218rf33 chromosome 21 open reading frame 33 0.80
NM 003262 TLOC1 translocation protein 1 0.79
NM 147223 NCOA1 nuclear receptor coactivator 1 0.79
NM 007062 PWP1 nuclear phosphoprotein similar to S. cerevisiae PWP1 0.79
NM 005561 LAMP1 lysosomal-associated membrane protein 1 0.79
NM 006810 PDIR for protein disulfide isomerase-related 0.78
NM 033360 KRAS2 v-Ki-ras2 Kirsten rat sarcoma 2 viral oncogene homolog 0.77
NM 001513 GSTZ1 glutathione transferase zeta 1 (maleylacetoacetate isomerase) 0.77
NM 006184 NUCB1 nucleobindin 1 0.77
NM 001634 AMD1 adenosylmethionine decarboxylase 1 0.76
NM 006749 SLC20A2 solute carrier family 20 (phosphate transporter), member 2 0.76
NM 003144 SSR1 signal sequence receptor alpha (translocon-associated protein alpha) 0.76
NM 004606 TAF1 TAF1 RNA polymerase II, TATA box binding protein (TBP)-associated factor 250kDa
0.75
BX648788 MRNA; cDNA DKFZP686M12165 (from clone DKFZP686M12165) 0.75
NM 004035 ACOX1 acyl-Coenzyme A oxidase 1 palmitoyl 0.74
NM 000287 PEX6 peroxisomal biogenesis factor 6 0.73
NM 003884 PCAF p300/CBP-associated factor 0.73
NM 006870 DSTN destrin (actin depolymerizing factor) 0.73
NM 001604 PAX6 paired box gene 6 (aniridia keratitis) 0.72
NM 000722 CACNA2 D1 calcium channel voltage-dependent alpha 2/delta subunit 1 0.72
NM 033022 RPS24 ribosomal protein S24 0.72
NM 004563 PCK2 phosphoenolpyruvate carboxykinase 2 (mitochondrial) 0.72
NM 002602 PDE6G phosphodiesterase 6G cGMP-specific, rod, gamma 0.72
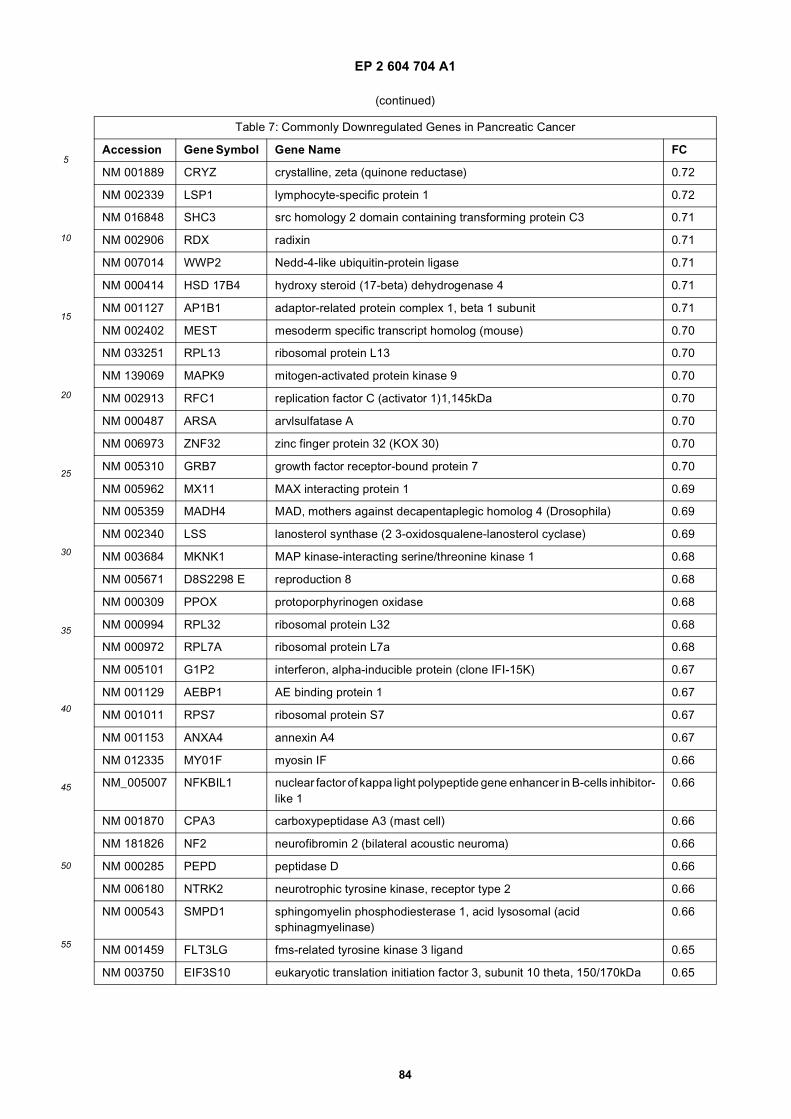
EP 2 604 704 A1
84
5
10
15
20
25
30
35
40
45
50
55
(continued)
Table 7: Commonly Downregulated Genes in Pancreatic Cancer
Accession Gene Symbol Gene Name FC
NM 001889 CRYZ crystalline, zeta (quinone reductase) 0.72
NM 002339 LSP1 lymphocyte-specific protein 1 0.72
NM 016848 SHC3 src homology 2 domain containing transforming protein C3 0.71
NM 002906 RDX radixin 0.71
NM 007014 WWP2 Nedd-4-like ubiquitin-protein ligase 0.71
NM 000414 HSD 17B4 hydroxy steroid (17-beta) dehydrogenase 4 0.71
NM 001127 AP1B1 adaptor-related protein complex 1, beta 1 subunit 0.71
NM 002402 MEST mesoderm specific transcript homolog (mouse) 0.70
NM 033251 RPL13 ribosomal protein L13 0.70
NM 139069 MAPK9 mitogen-activated protein kinase 9 0.70
NM 002913 RFC1 replication factor C (activator 1)1,145kDa 0.70
NM 000487 ARSA arvlsulfatase A 0.70
NM 006973 ZNF32 zinc finger protein 32 (KOX 30) 0.70
NM 005310 GRB7 growth factor receptor-bound protein 7 0.70
NM 005962 MX11 MAX interacting protein 1 0.69
NM 005359 MADH4 MAD, mothers against decapentaplegic homolog 4 (Drosophila) 0.69
NM 002340 LSS lanosterol synthase (2 3-oxidosqualene-lanosterol cyclase) 0.69
NM 003684 MKNK1 MAP kinase-interacting serine/threonine kinase 1 0.68
NM 005671 D8S2298 E reproduction 8 0.68
NM 000309 PPOX protoporphyrinogen oxidase 0.68
NM 000994 RPL32 ribosomal protein L32 0.68
NM 000972 RPL7A ribosomal protein L7a 0.68
NM 005101 G1P2 interferon, alpha-inducible protein (clone IFI-15K) 0.67
NM 001129 AEBP1 AE binding protein 1 0.67
NM 001011 RPS7 ribosomal protein S7 0.67
NM 001153 ANXA4 annexin A4 0.67
NM 012335 MY01F myosin IF 0.66
NM_005007 NFKBIL1 nuclear factor of kappa light polypeptide gene enhancer in B-cells inhibitor-like 1
0.66
NM 001870 CPA3 carboxypeptidase A3 (mast cell) 0.66
NM 181826 NF2 neurofibromin 2 (bilateral acoustic neuroma) 0.66
NM 000285 PEPD peptidase D 0.66
NM 006180 NTRK2 neurotrophic tyrosine kinase, receptor type 2 0.66
NM 000543 SMPD1 sphingomyelin phosphodiesterase 1, acid lysosomal (acid sphinagmyelinase)
0.66
NM 001459 FLT3LG fms-related tyrosine kinase 3 ligand 0.65
NM 003750 EIF3S10 eukaryotic translation initiation factor 3, subunit 10 theta, 150/170kDa 0.65
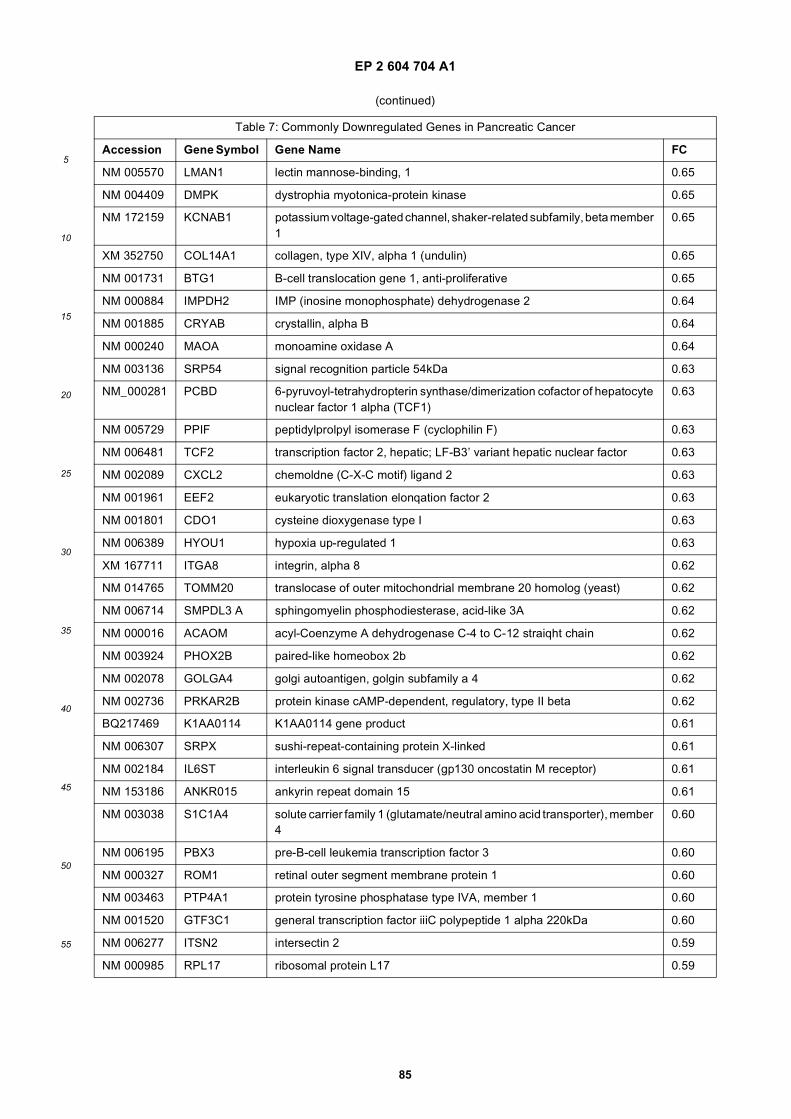
EP 2 604 704 A1
85
5
10
15
20
25
30
35
40
45
50
55
(continued)
Table 7: Commonly Downregulated Genes in Pancreatic Cancer
Accession Gene Symbol Gene Name FC
NM 005570 LMAN1 lectin mannose-binding, 1 0.65
NM 004409 DMPK dystrophia myotonica-protein kinase 0.65
NM 172159 KCNAB1 potassium voltage-gated channel, shaker-related subfamily, beta member 1
0.65
XM 352750 COL14A1 collagen, type XIV, alpha 1 (undulin) 0.65
NM 001731 BTG1 B-cell translocation gene 1, anti-proliferative 0.65
NM 000884 IMPDH2 IMP (inosine monophosphate) dehydrogenase 2 0.64
NM 001885 CRYAB crystallin, alpha B 0.64
NM 000240 MAOA monoamine oxidase A 0.64
NM 003136 SRP54 signal recognition particle 54kDa 0.63
NM_000281 PCBD 6-pyruvoyl-tetrahydropterin synthase/dimerization cofactor of hepatocyte nuclear factor 1 alpha (TCF1)
0.63
NM 005729 PPIF peptidylprolpyl isomerase F (cyclophilin F) 0.63
NM 006481 TCF2 transcription factor 2, hepatic; LF-B3’ variant hepatic nuclear factor 0.63
NM 002089 CXCL2 chemoldne (C-X-C motif) ligand 2 0.63
NM 001961 EEF2 eukaryotic translation elonqation factor 2 0.63
NM 001801 CDO1 cysteine dioxygenase type I 0.63
NM 006389 HYOU1 hypoxia up-regulated 1 0.63
XM 167711 ITGA8 integrin, alpha 8 0.62
NM 014765 TOMM20 translocase of outer mitochondrial membrane 20 homolog (yeast) 0.62
NM 006714 SMPDL3 A sphingomyelin phosphodiesterase, acid-like 3A 0.62
NM 000016 ACAOM acyl-Coenzyme A dehydrogenase C-4 to C-12 straiqht chain 0.62
NM 003924 PHOX2B paired-like homeobox 2b 0.62
NM 002078 GOLGA4 golgi autoantigen, golgin subfamily a 4 0.62
NM 002736 PRKAR2B protein kinase cAMP-dependent, regulatory, type II beta 0.62
BQ217469 K1AA0114 K1AA0114 gene product 0.61
NM 006307 SRPX sushi-repeat-containing protein X-linked 0.61
NM 002184 IL6ST interleukin 6 signal transducer (gp130 oncostatin M receptor) 0.61
NM 153186 ANKR015 ankyrin repeat domain 15 0.61
NM 003038 S1C1A4 solute carrier family 1 (glutamate/neutral amino acid transporter), member 4
0.60
NM 006195 PBX3 pre-B-cell leukemia transcription factor 3 0.60
NM 000327 ROM1 retinal outer segment membrane protein 1 0.60
NM 003463 PTP4A1 protein tyrosine phosphatase type IVA, member 1 0.60
NM 001520 GTF3C1 general transcription factor iiiC polypeptide 1 alpha 220kDa 0.60
NM 006277 ITSN2 intersectin 2 0.59
NM 000985 RPL17 ribosomal protein L17 0.59
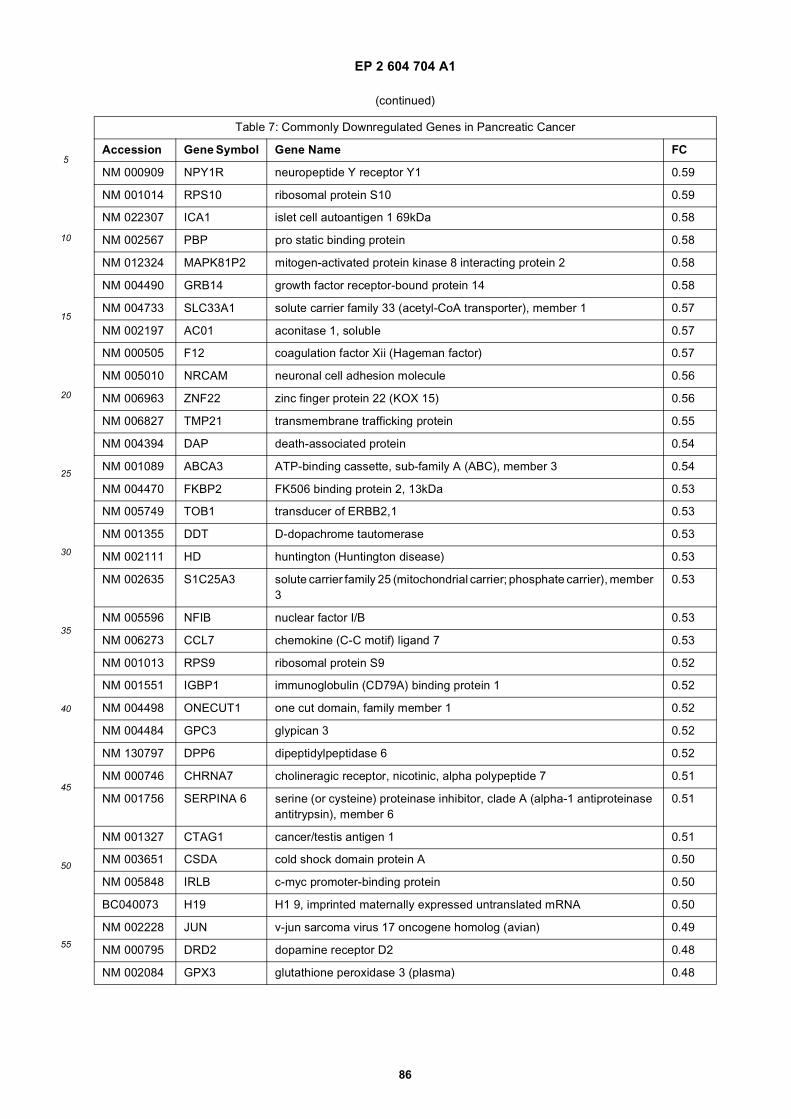
EP 2 604 704 A1
86
5
10
15
20
25
30
35
40
45
50
55
(continued)
Table 7: Commonly Downregulated Genes in Pancreatic Cancer
Accession Gene Symbol Gene Name FC
NM 000909 NPY1R neuropeptide Y receptor Y1 0.59
NM 001014 RPS10 ribosomal protein S10 0.59
NM 022307 ICA1 islet cell autoantigen 1 69kDa 0.58
NM 002567 PBP pro static binding protein 0.58
NM 012324 MAPK81P2 mitogen-activated protein kinase 8 interacting protein 2 0.58
NM 004490 GRB14 growth factor receptor-bound protein 14 0.58
NM 004733 SLC33A1 solute carrier family 33 (acetyl-CoA transporter), member 1 0.57
NM 002197 AC01 aconitase 1, soluble 0.57
NM 000505 F12 coagulation factor Xii (Hageman factor) 0.57
NM 005010 NRCAM neuronal cell adhesion molecule 0.56
NM 006963 ZNF22 zinc finger protein 22 (KOX 15) 0.56
NM 006827 TMP21 transmembrane trafficking protein 0.55
NM 004394 DAP death-associated protein 0.54
NM 001089 ABCA3 ATP-binding cassette, sub-family A (ABC), member 3 0.54
NM 004470 FKBP2 FK506 binding protein 2, 13kDa 0.53
NM 005749 TOB1 transducer of ERBB2,1 0.53
NM 001355 DDT D-dopachrome tautomerase 0.53
NM 002111 HD huntington (Huntington disease) 0.53
NM 002635 S1C25A3 solute carrier family 25 (mitochondrial carrier; phosphate carrier), member 3
0.53
NM 005596 NFIB nuclear factor I/B 0.53
NM 006273 CCL7 chemokine (C-C motif) ligand 7 0.53
NM 001013 RPS9 ribosomal protein S9 0.52
NM 001551 IGBP1 immunoglobulin (CD79A) binding protein 1 0.52
NM 004498 ONECUT1 one cut domain, family member 1 0.52
NM 004484 GPC3 glypican 3 0.52
NM 130797 DPP6 dipeptidylpeptidase 6 0.52
NM 000746 CHRNA7 cholineragic receptor, nicotinic, alpha polypeptide 7 0.51
NM 001756 SERPINA 6 serine (or cysteine) proteinase inhibitor, clade A (alpha-1 antiproteinase antitrypsin), member 6
0.51
NM 001327 CTAG1 cancer/testis antigen 1 0.51
NM 003651 CSDA cold shock domain protein A 0.50
NM 005848 IRLB c-myc promoter-binding protein 0.50
BC040073 H19 H1 9, imprinted maternally expressed untranslated mRNA 0.50
NM 002228 JUN v-jun sarcoma virus 17 oncogene homolog (avian) 0.49
NM 000795 DRD2 dopamine receptor D2 0.48
NM 002084 GPX3 glutathione peroxidase 3 (plasma) 0.48
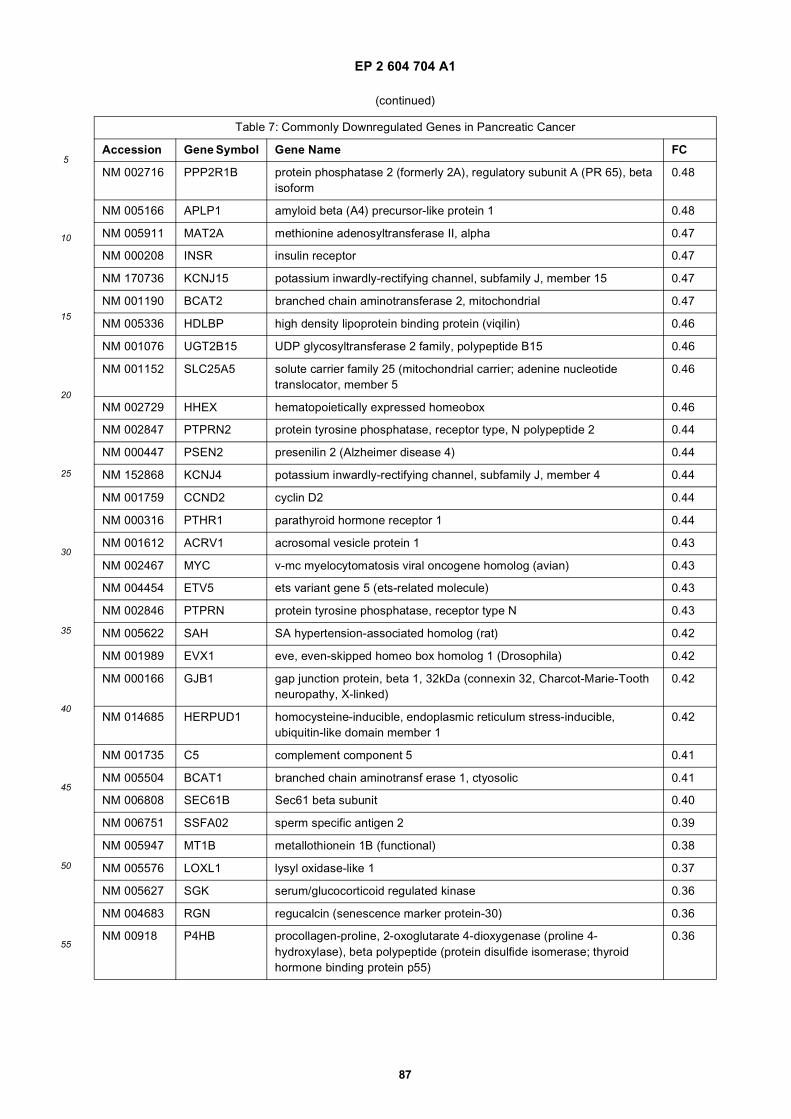
EP 2 604 704 A1
87
5
10
15
20
25
30
35
40
45
50
55
(continued)
Table 7: Commonly Downregulated Genes in Pancreatic Cancer
Accession Gene Symbol Gene Name FC
NM 002716 PPP2R1B protein phosphatase 2 (formerly 2A), regulatory subunit A (PR 65), beta isoform
0.48
NM 005166 APLP1 amyloid beta (A4) precursor-like protein 1 0.48
NM 005911 MAT2A methionine adenosyltransferase II, alpha 0.47
NM 000208 INSR insulin receptor 0.47
NM 170736 KCNJ15 potassium inwardly-rectifying channel, subfamily J, member 15 0.47
NM 001190 BCAT2 branched chain aminotransferase 2, mitochondrial 0.47
NM 005336 HDLBP high density lipoprotein binding protein (viqilin) 0.46
NM 001076 UGT2B15 UDP glycosyltransferase 2 family, polypeptide B15 0.46
NM 001152 SLC25A5 solute carrier family 25 (mitochondrial carrier; adenine nucleotide translocator, member 5
0.46
NM 002729 HHEX hematopoietically expressed homeobox 0.46
NM 002847 PTPRN2 protein tyrosine phosphatase, receptor type, N polypeptide 2 0.44
NM 000447 PSEN2 presenilin 2 (Alzheimer disease 4) 0.44
NM 152868 KCNJ4 potassium inwardly-rectifying channel, subfamily J, member 4 0.44
NM 001759 CCND2 cyclin D2 0.44
NM 000316 PTHR1 parathyroid hormone receptor 1 0.44
NM 001612 ACRV1 acrosomal vesicle protein 1 0.43
NM 002467 MYC v-mc myelocytomatosis viral oncogene homolog (avian) 0.43
NM 004454 ETV5 ets variant gene 5 (ets-related molecule) 0.43
NM 002846 PTPRN protein tyrosine phosphatase, receptor type N 0.43
NM 005622 SAH SA hypertension-associated homolog (rat) 0.42
NM 001989 EVX1 eve, even-skipped homeo box homolog 1 (Drosophila) 0.42
NM 000166 GJB1 gap junction protein, beta 1, 32kDa (connexin 32, Charcot-Marie-Tooth neuropathy, X-linked)
0.42
NM 014685 HERPUD1 homocysteine-inducible, endoplasmic reticulum stress-inducible, ubiquitin-like domain member 1
0.42
NM 001735 C5 complement component 5 0.41
NM 005504 BCAT1 branched chain aminotransf erase 1, ctyosolic 0.41
NM 006808 SEC61B Sec61 beta subunit 0.40
NM 006751 SSFA02 sperm specific antigen 2 0.39
NM 005947 MT1B metallothionein 1B (functional) 0.38
NM 005576 LOXL1 lysyl oxidase-like 1 0.37
NM 005627 SGK serum/glucocorticoid regulated kinase 0.36
NM 004683 RGN regucalcin (senescence marker protein-30) 0.36
NM 00918 P4HB procollagen-proline, 2-oxoglutarate 4-dioxygenase (proline 4-hydroxylase), beta polypeptide (protein disulfide isomerase; thyroid hormone binding protein p55)
0.36
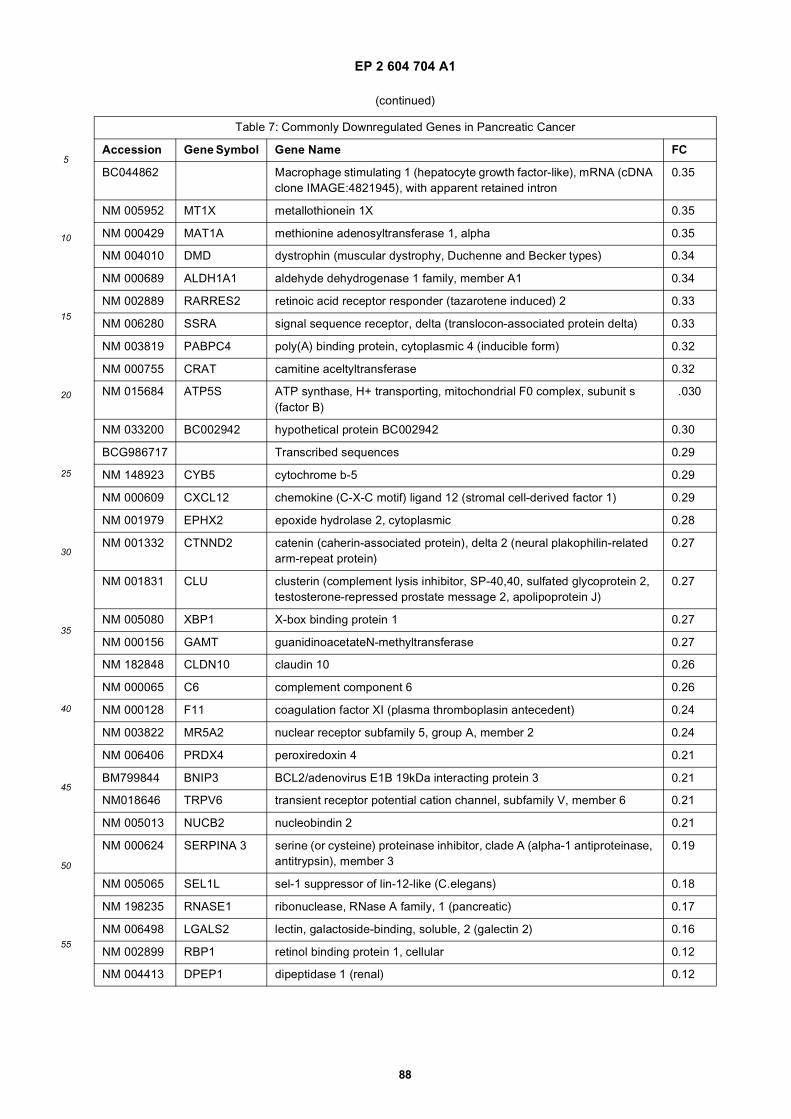
EP 2 604 704 A1
88
5
10
15
20
25
30
35
40
45
50
55
(continued)
Table 7: Commonly Downregulated Genes in Pancreatic Cancer
Accession Gene Symbol Gene Name FC
BC044862 Macrophage stimulating 1 (hepatocyte growth factor-like), mRNA (cDNA clone IMAGE:4821945), with apparent retained intron
0.35
NM 005952 MT1X metallothionein 1X 0.35
NM 000429 MAT1A methionine adenosyltransferase 1, alpha 0.35
NM 004010 DMD dystrophin (muscular dystrophy, Duchenne and Becker types) 0.34
NM 000689 ALDH1A1 aldehyde dehydrogenase 1 family, member A1 0.34
NM 002889 RARRES2 retinoic acid receptor responder (tazarotene induced) 2 0.33
NM 006280 SSRA signal sequence receptor, delta (translocon-associated protein delta) 0.33
NM 003819 PABPC4 poly(A) binding protein, cytoplasmic 4 (inducible form) 0.32
NM 000755 CRAT camitine aceltyltransferase 0.32
NM 015684 ATP5S ATP synthase, H+ transporting, mitochondrial F0 complex, subunit s (factor B)
.030
NM 033200 BC002942 hypothetical protein BC002942 0.30
BCG986717 Transcribed sequences 0.29
NM 148923 CYB5 cytochrome b-5 0.29
NM 000609 CXCL12 chemokine (C-X-C motif) ligand 12 (stromal cell-derived factor 1) 0.29
NM 001979 EPHX2 epoxide hydrolase 2, cytoplasmic 0.28
NM 001332 CTNND2 catenin (caherin-associated protein), delta 2 (neural plakophilin-related arm-repeat protein)
0.27
NM 001831 CLU clusterin (complement lysis inhibitor, SP-40,40, sulfated glycoprotein 2, testosterone-repressed prostate message 2, apolipoprotein J)
0.27
NM 005080 XBP1 X-box binding protein 1 0.27
NM 000156 GAMT guanidinoacetateN-methyltransferase 0.27
NM 182848 CLDN10 claudin 10 0.26
NM 000065 C6 complement component 6 0.26
NM 000128 F11 coagulation factor XI (plasma thromboplasin antecedent) 0.24
NM 003822 MR5A2 nuclear receptor subfamily 5, group A, member 2 0.24
NM 006406 PRDX4 peroxiredoxin 4 0.21
BM799844 BNIP3 BCL2/adenovirus E1B 19kDa interacting protein 3 0.21
NM018646 TRPV6 transient receptor potential cation channel, subfamily V, member 6 0.21
NM 005013 NUCB2 nucleobindin 2 0.21
NM 000624 SERPINA 3 serine (or cysteine) proteinase inhibitor, clade A (alpha-1 antiproteinase, antitrypsin), member 3
0.19
NM 005065 SEL1L sel-1 suppressor of lin-12-like (C.elegans) 0.18
NM 198235 RNASE1 ribonuclease, RNase A family, 1 (pancreatic) 0.17
NM 006498 LGALS2 lectin, galactoside-binding, soluble, 2 (galectin 2) 0.16
NM 002899 RBP1 retinol binding protein 1, cellular 0.12
NM 004413 DPEP1 dipeptidase 1 (renal) 0.12
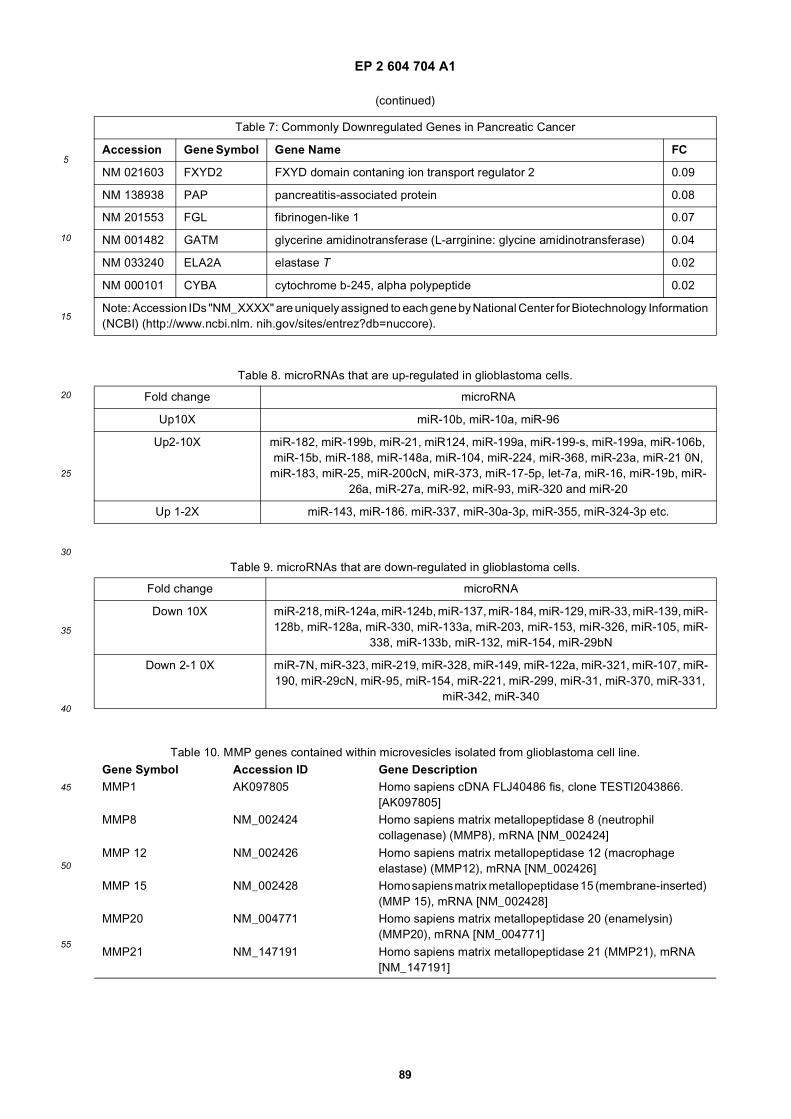
EP 2 604 704 A1
89
5
10
15
20
25
30
35
40
45
50
55
(continued)
Table 7: Commonly Downregulated Genes in Pancreatic Cancer
Accession Gene Symbol Gene Name FC
NM 021603 FXYD2 FXYD domain contaning ion transport regulator 2 0.09
NM 138938 PAP pancreatitis-associated protein 0.08
NM 201553 FGL fibrinogen-like 1 0.07
NM 001482 GATM glycerine amidinotransferase (L-arrginine: glycine amidinotransferase) 0.04
NM 033240 ELA2A elastase T 0.02
NM 000101 CYBA cytochrome b-245, alpha polypeptide 0.02
Note: Accession IDs "NM_XXXX" are uniquely assigned to each gene by National Center for Biotechnology Information(NCBI) (http://www.ncbi.nlm. nih.gov/sites/entrez?db=nuccore).
Table 8. microRNAs that are up-regulated in glioblastoma cells.
Fold change microRNA
Up10X miR-10b, miR-10a, miR-96
Up2-10X miR-182, miR-199b, miR-21, miR124, miR-199a, miR-199-s, miR-199a, miR-106b, miR-15b, miR-188, miR-148a, miR-104, miR-224, miR-368, miR-23a, miR-21 0N,
miR-183, miR-25, miR-200cN, miR-373, miR-17-5p, let-7a, miR-16, miR-19b, miR-26a, miR-27a, miR-92, miR-93, miR-320 and miR-20
Up 1-2X miR-143, miR-186. miR-337, miR-30a-3p, miR-355, miR-324-3p etc.
Table 9. microRNAs that are down-regulated in glioblastoma cells.
Fold change microRNA
Down 10X miR-218, miR-124a, miR-124b, miR-137, miR-184, miR-129, miR-33, miR-139, miR-128b, miR-128a, miR-330, miR-133a, miR-203, miR-153, miR-326, miR-105, miR-
338, miR-133b, miR-132, miR-154, miR-29bN
Down 2-1 0X miR-7N, miR-323, miR-219, miR-328, miR-149, miR-122a, miR-321, miR-107, miR-190, miR-29cN, miR-95, miR-154, miR-221, miR-299, miR-31, miR-370, miR-331,
miR-342, miR-340
Table 10. MMP genes contained within microvesicles isolated from glioblastoma cell line.Gene Symbol Accession ID Gene DescriptionMMP1 AK097805 Homo sapiens cDNA FLJ40486 fis, clone TESTI2043866.
[AK097805]MMP8 NM_002424 Homo sapiens matrix metallopeptidase 8 (neutrophil
collagenase) (MMP8), mRNA [NM_002424]
MMP 12 NM_002426 Homo sapiens matrix metallopeptidase 12 (macrophage elastase) (MMP12), mRNA [NM_002426]
MMP 15 NM_002428 Homo sapiens matrix metallopeptidase 15 (membrane-inserted) (MMP 15), mRNA [NM_002428]
MMP20 NM_004771 Homo sapiens matrix metallopeptidase 20 (enamelysin) (MMP20), mRNA [NM_004771]
MMP21 NM_147191 Homo sapiens matrix metallopeptidase 21 (MMP21), mRNA [NM_147191]
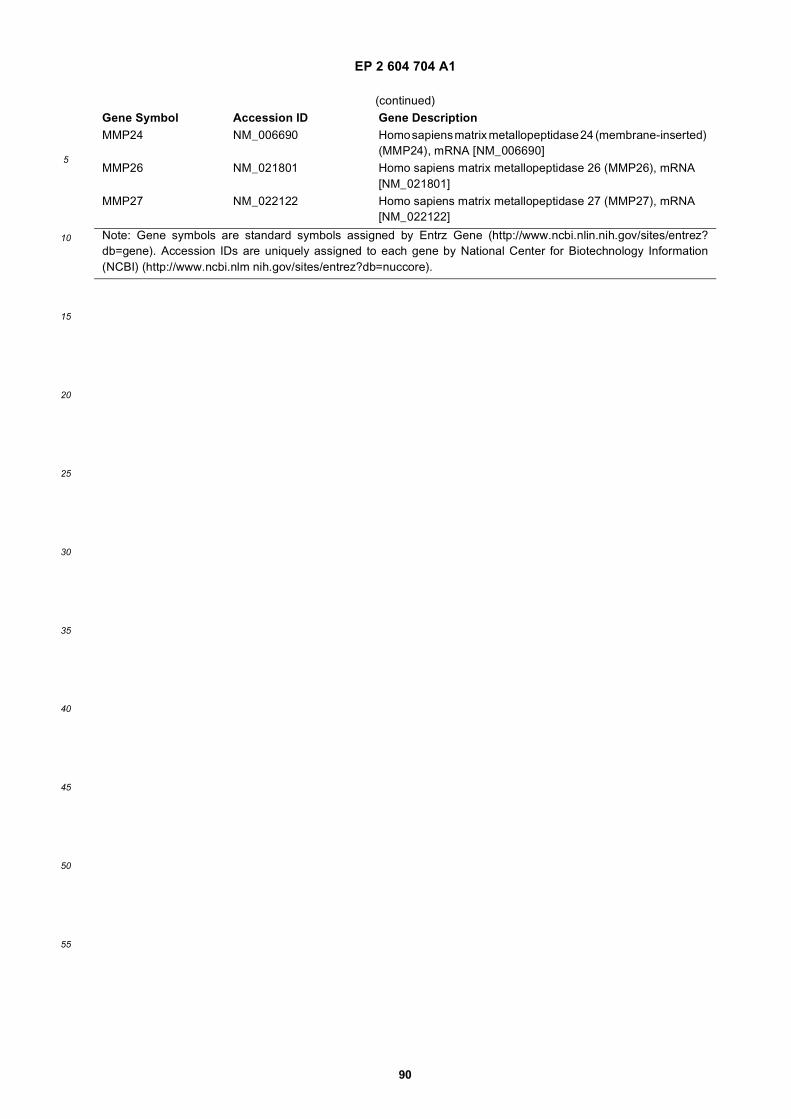
EP 2 604 704 A1
90
5
10
15
20
25
30
35
40
45
50
55
(continued)Gene Symbol Accession ID Gene DescriptionMMP24 NM_006690 Homo sapiens matrix metallopeptidase 24 (membrane-inserted)
(MMP24), mRNA [NM_006690]MMP26 NM_021801 Homo sapiens matrix metallopeptidase 26 (MMP26), mRNA
[NM_021801]MMP27 NM_022122 Homo sapiens matrix metallopeptidase 27 (MMP27), mRNA
[NM_022122]
Note: Gene symbols are standard symbols assigned by Entrz Gene (http://www.ncbi.nlin.nih.gov/sites/entrez?db=gene). Accession IDs are uniquely assigned to each gene by National Center for Biotechnology Information(NCBI) (http://www.ncbi.nlm nih.gov/sites/entrez?db=nuccore).
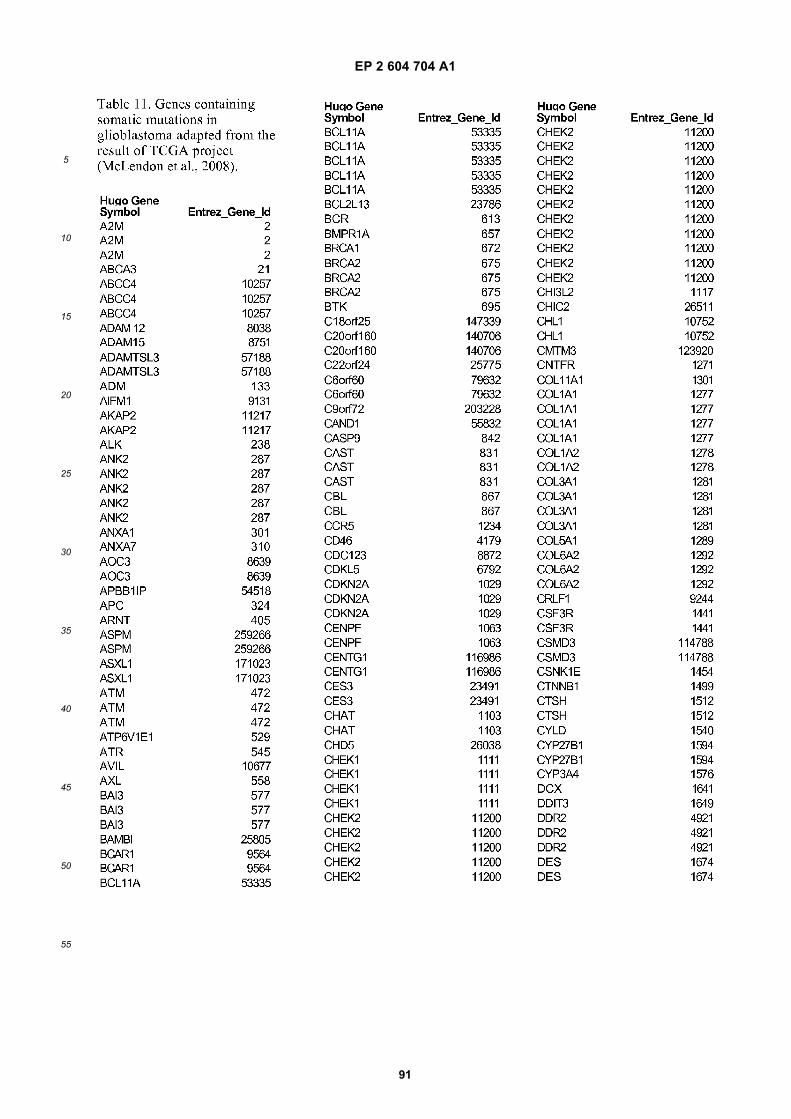
EP 2 604 704 A1
91
5
10
15
20
25
30
35
40
45
50
55
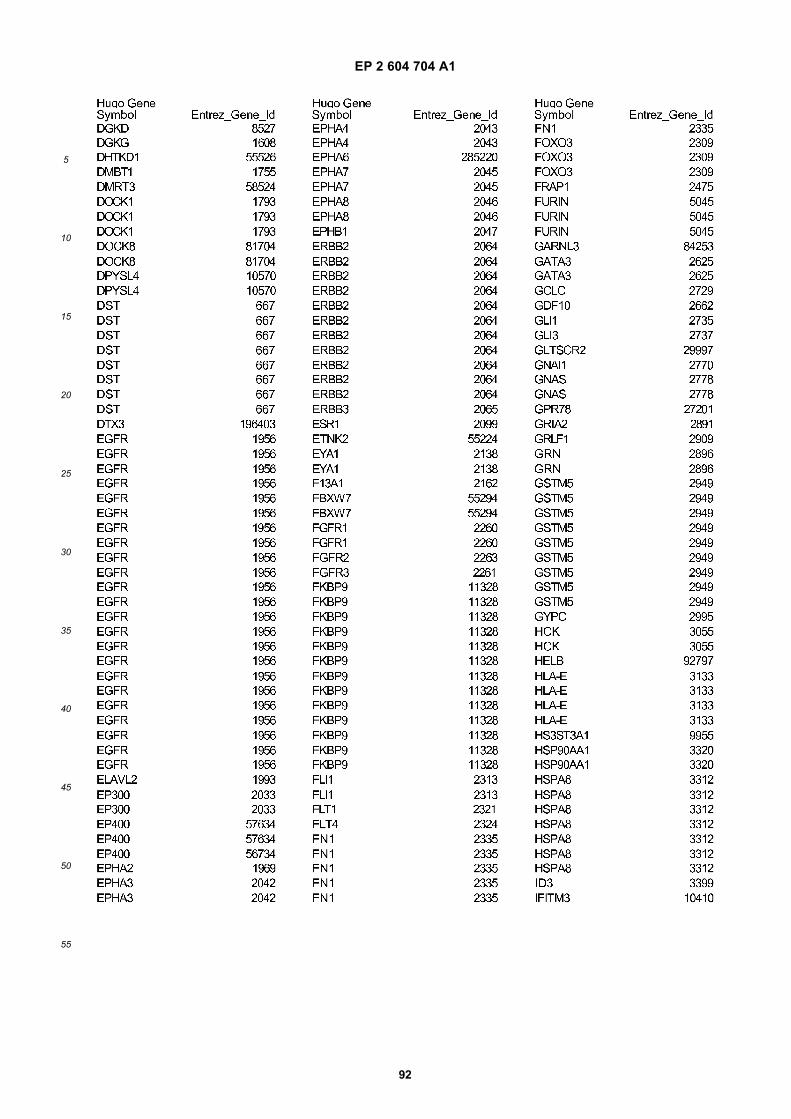
EP 2 604 704 A1
92
5
10
15
20
25
30
35
40
45
50
55
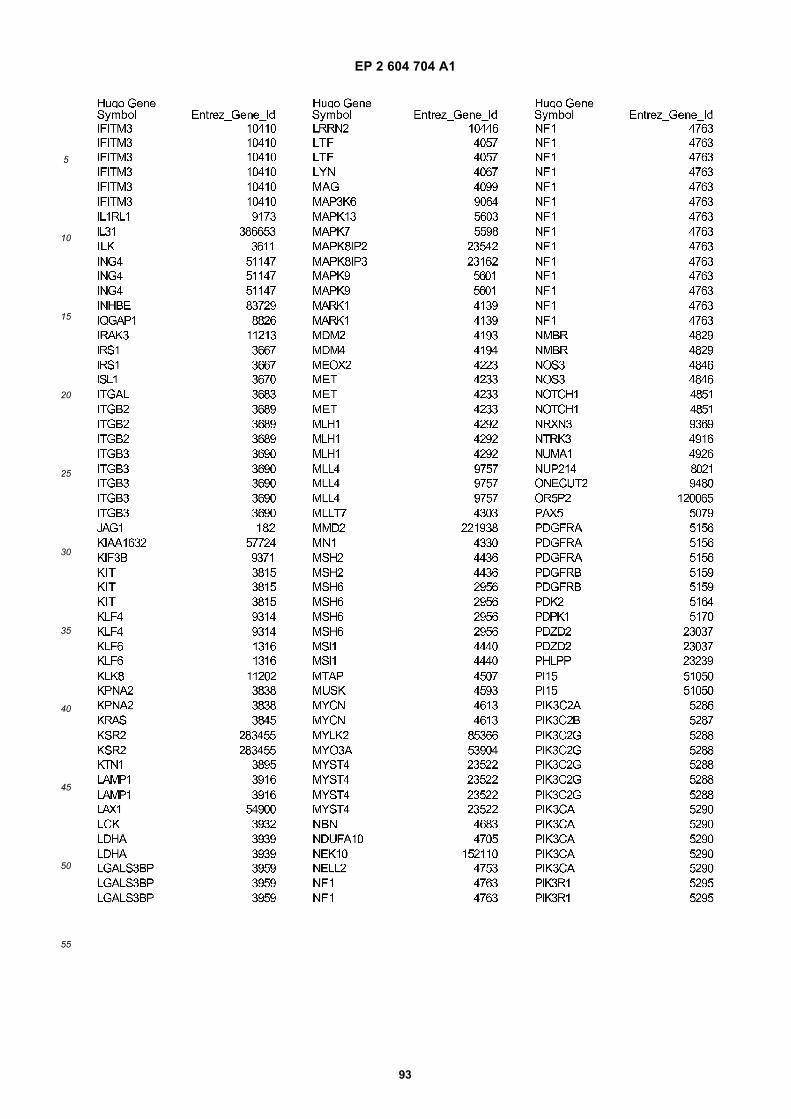
EP 2 604 704 A1
93
5
10
15
20
25
30
35
40
45
50
55
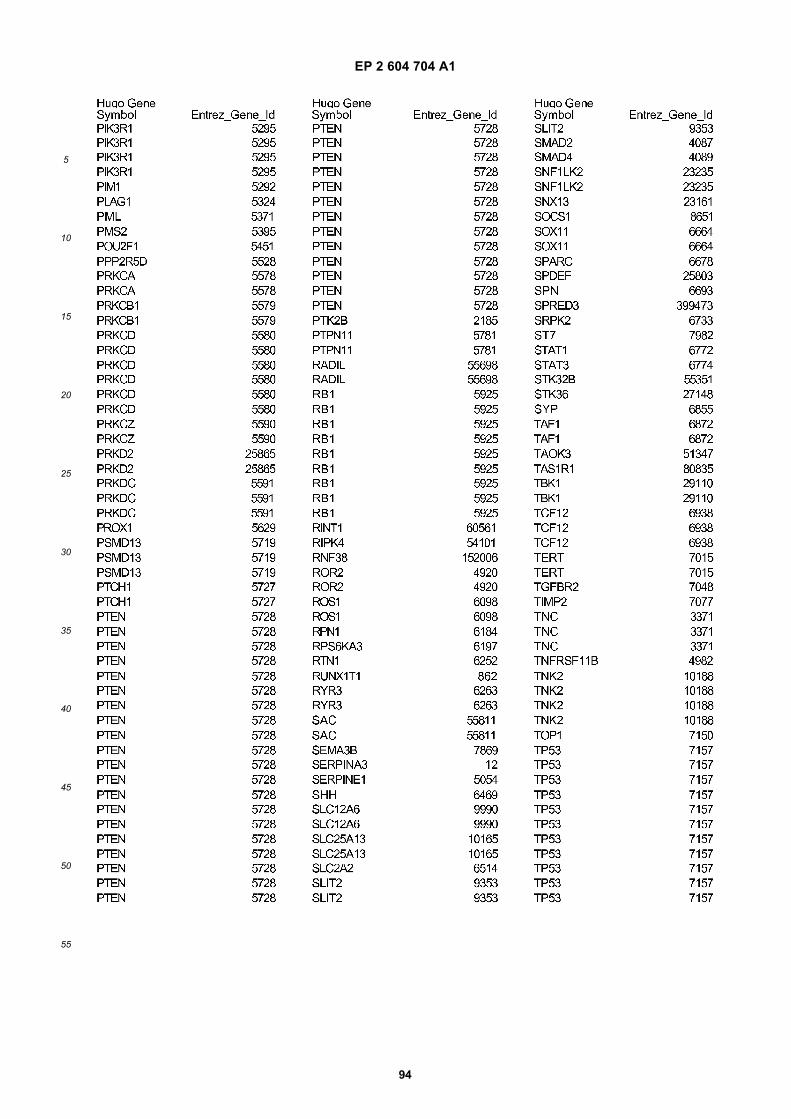
EP 2 604 704 A1
94
5
10
15
20
25
30
35
40
45
50
55
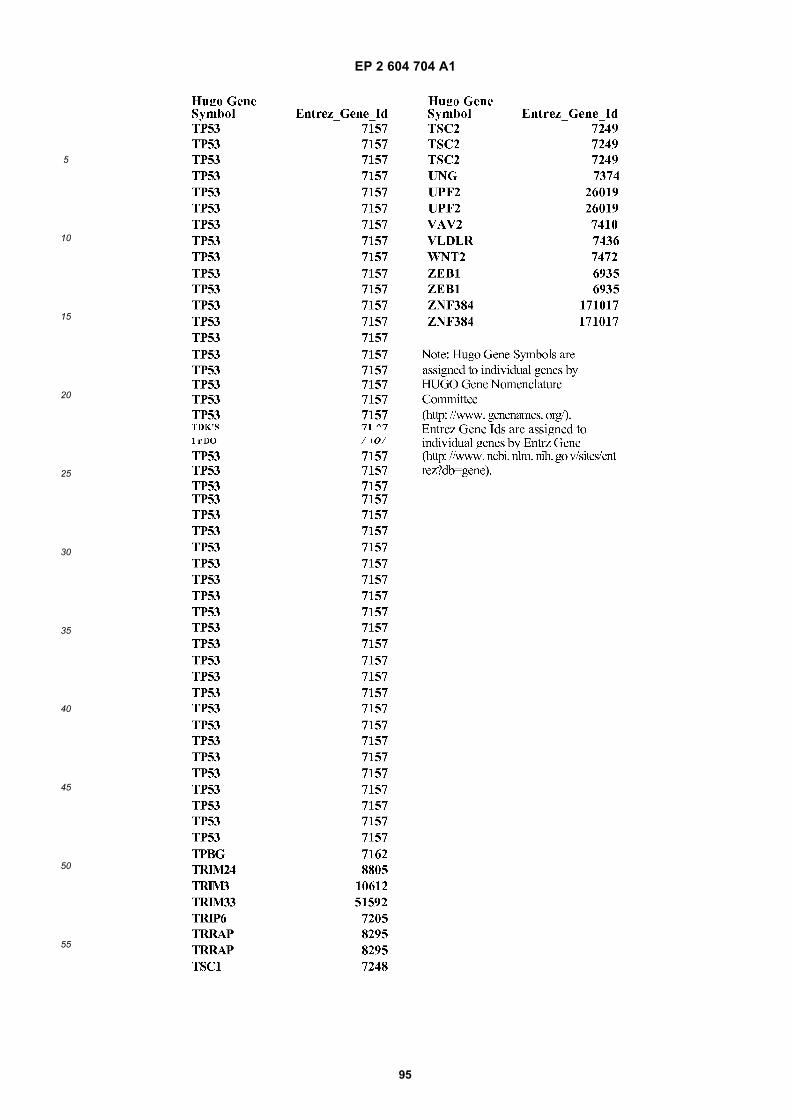
EP 2 604 704 A1
95
5
10
15
20
25
30
35
40
45
50
55
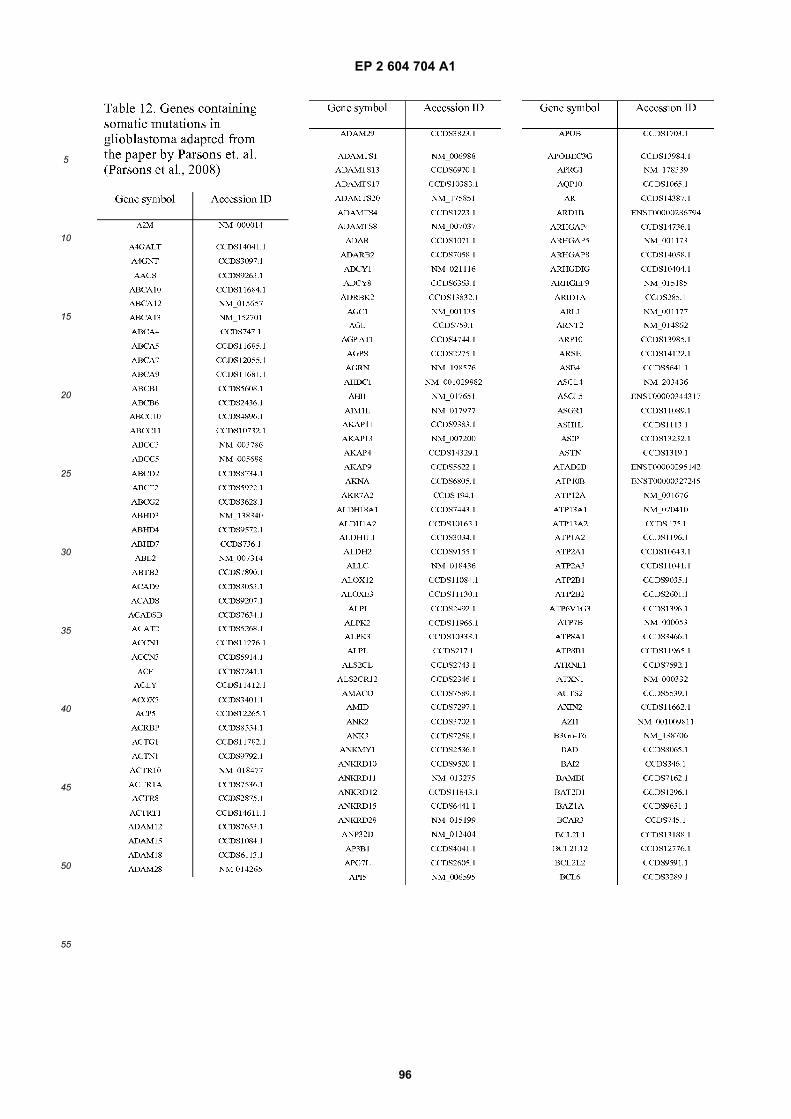
EP 2 604 704 A1
96
5
10
15
20
25
30
35
40
45
50
55
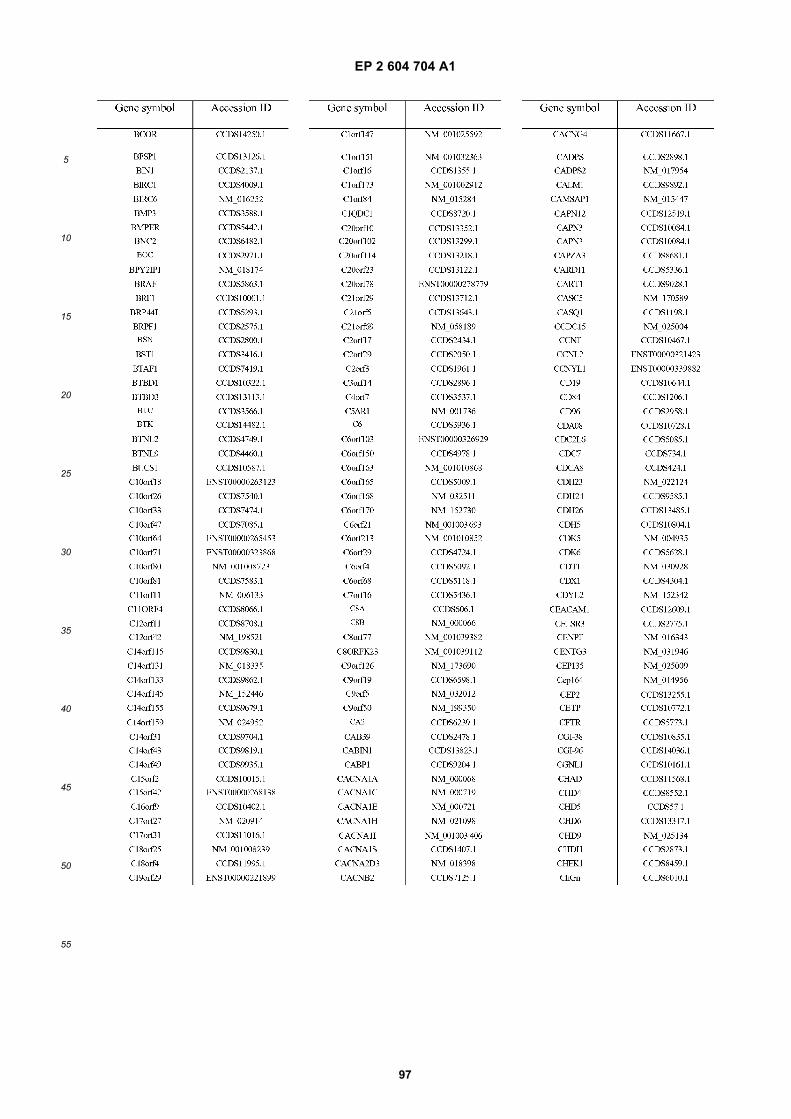
EP 2 604 704 A1
97
5
10
15
20
25
30
35
40
45
50
55
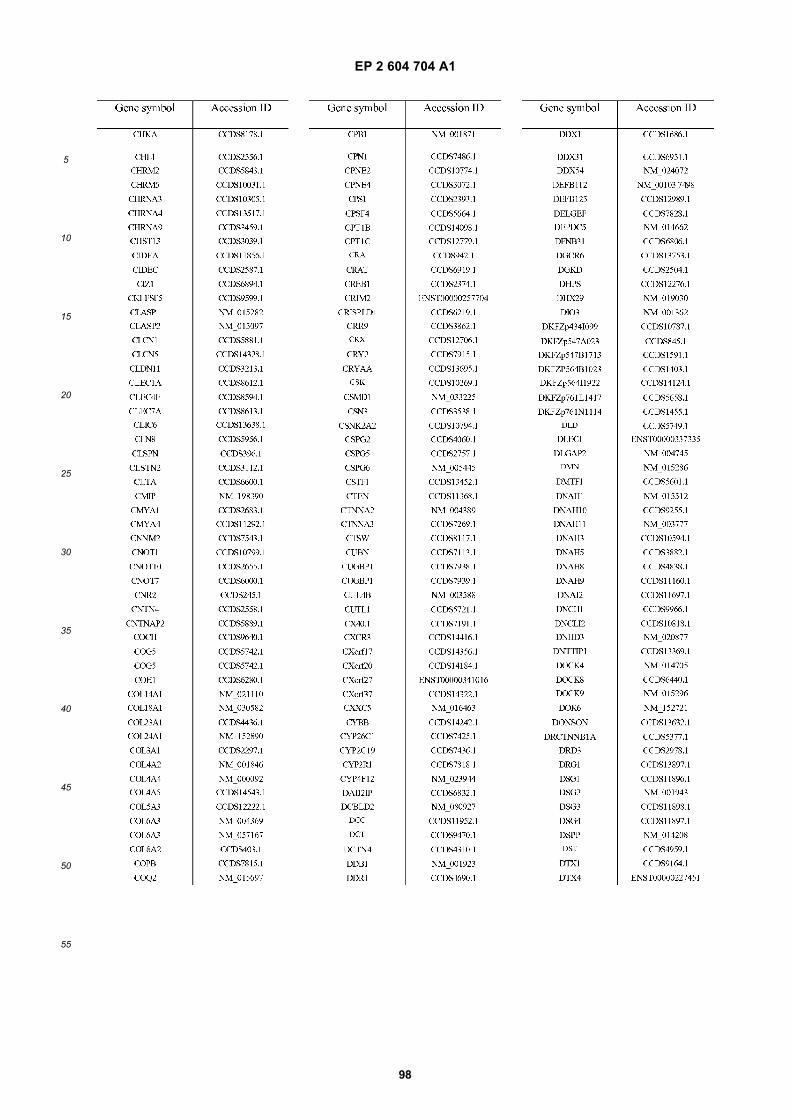
EP 2 604 704 A1
98
5
10
15
20
25
30
35
40
45
50
55
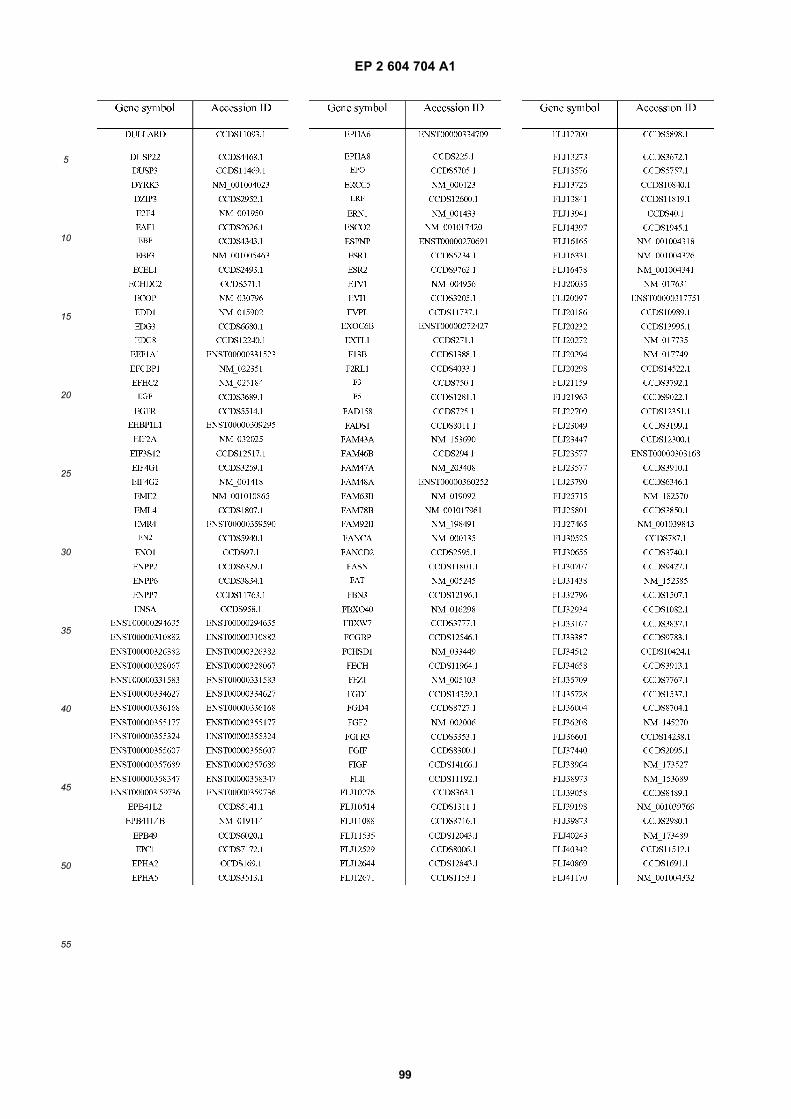
EP 2 604 704 A1
99
5
10
15
20
25
30
35
40
45
50
55
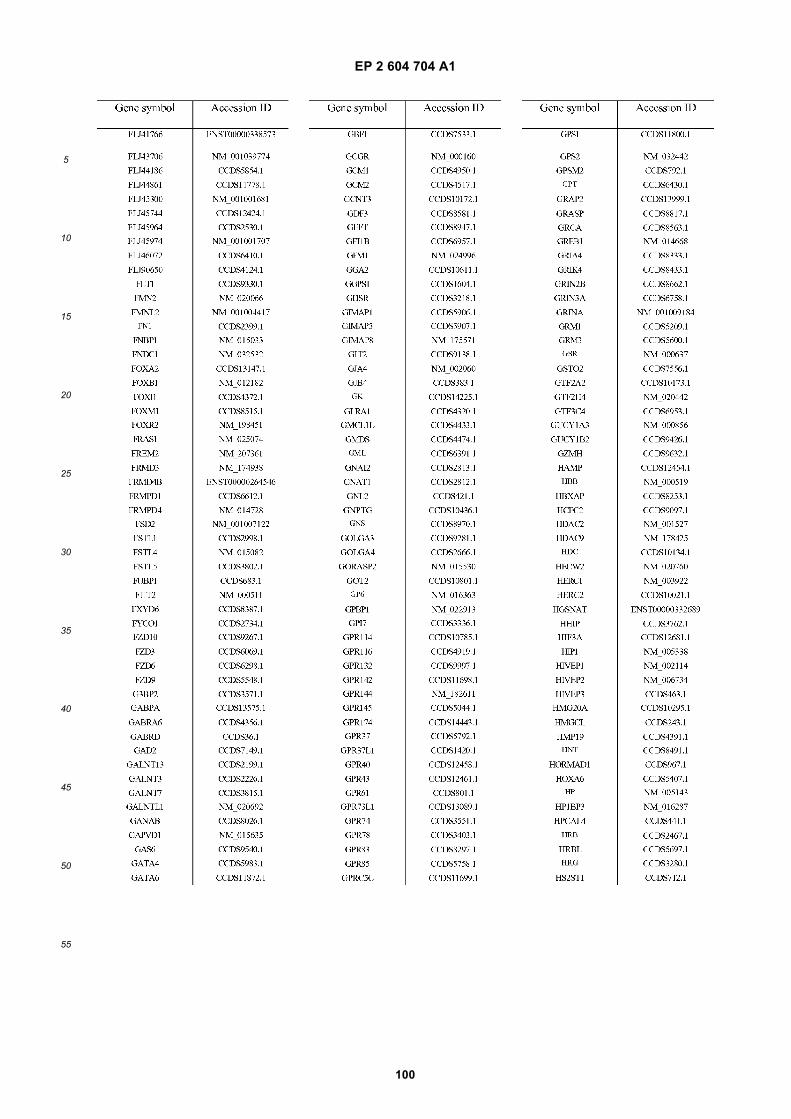
EP 2 604 704 A1
100
5
10
15
20
25
30
35
40
45
50
55
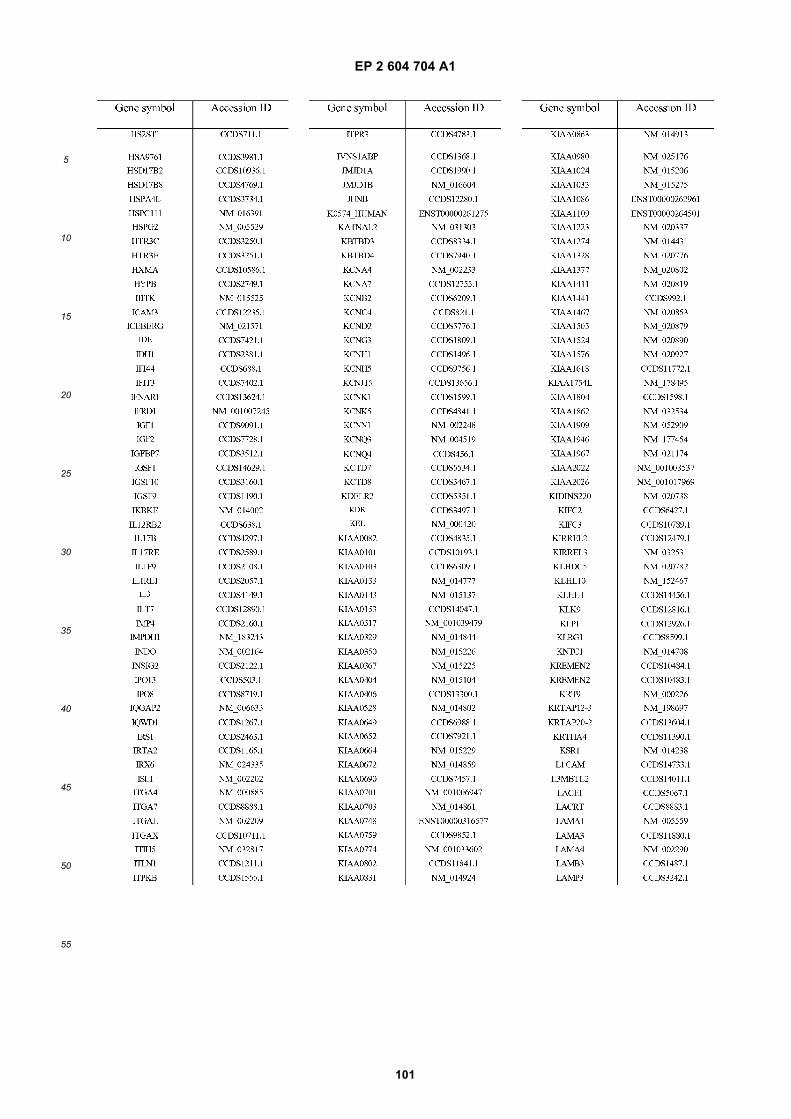
EP 2 604 704 A1
101
5
10
15
20
25
30
35
40
45
50
55
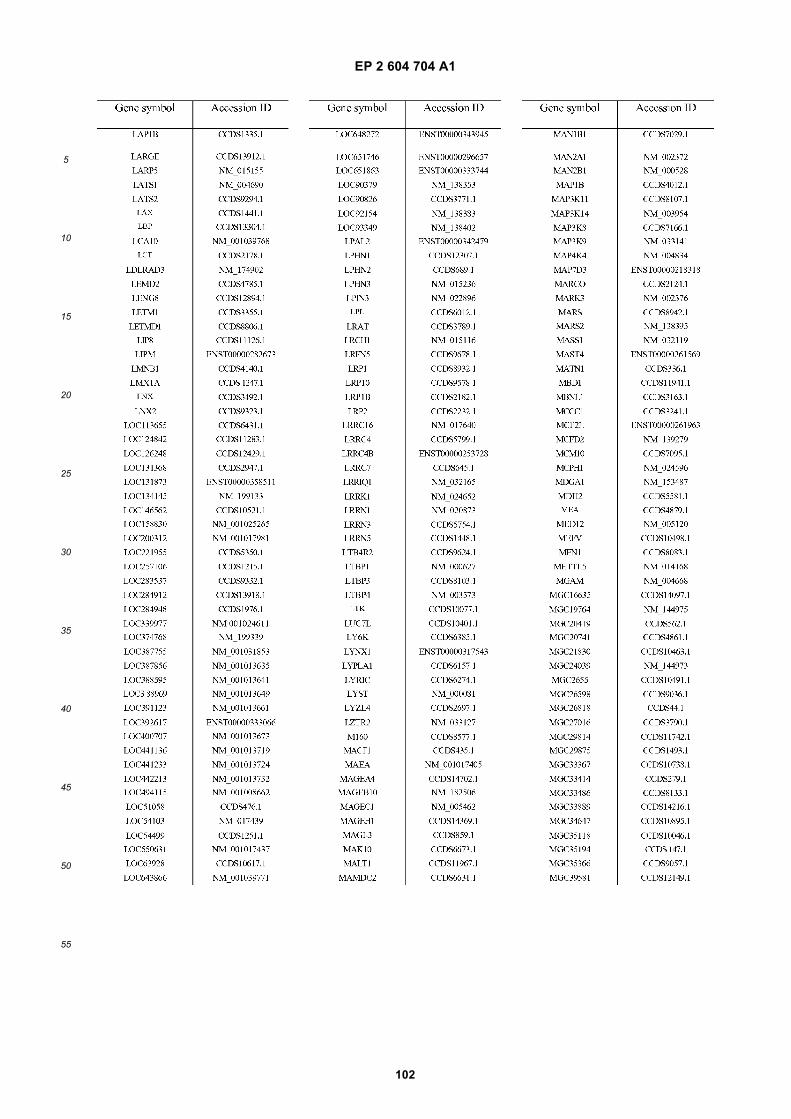
EP 2 604 704 A1
102
5
10
15
20
25
30
35
40
45
50
55
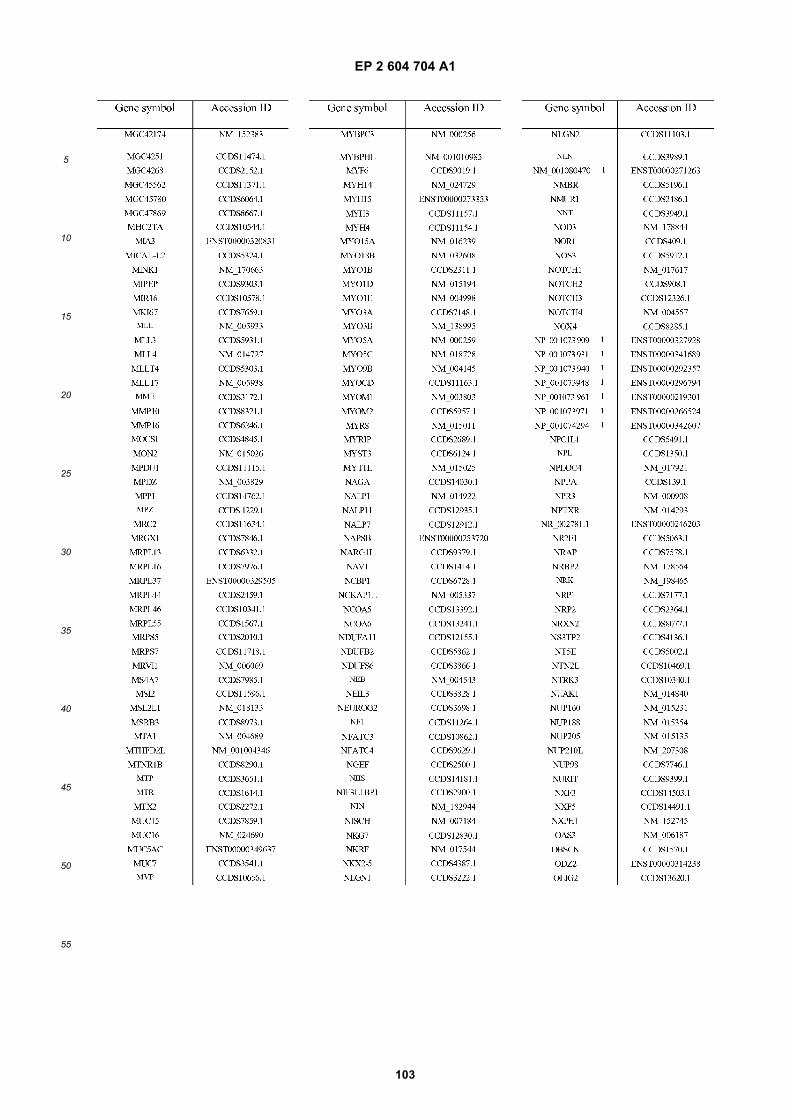
EP 2 604 704 A1
103
5
10
15
20
25
30
35
40
45
50
55
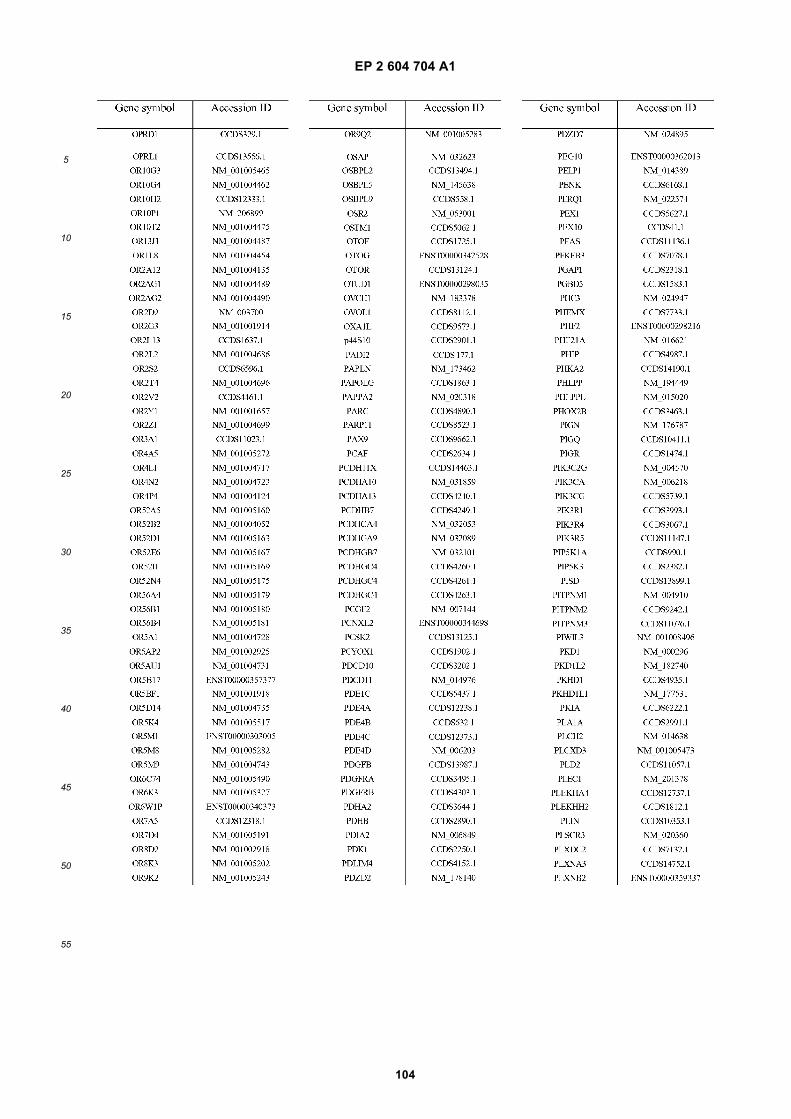
EP 2 604 704 A1
104
5
10
15
20
25
30
35
40
45
50
55
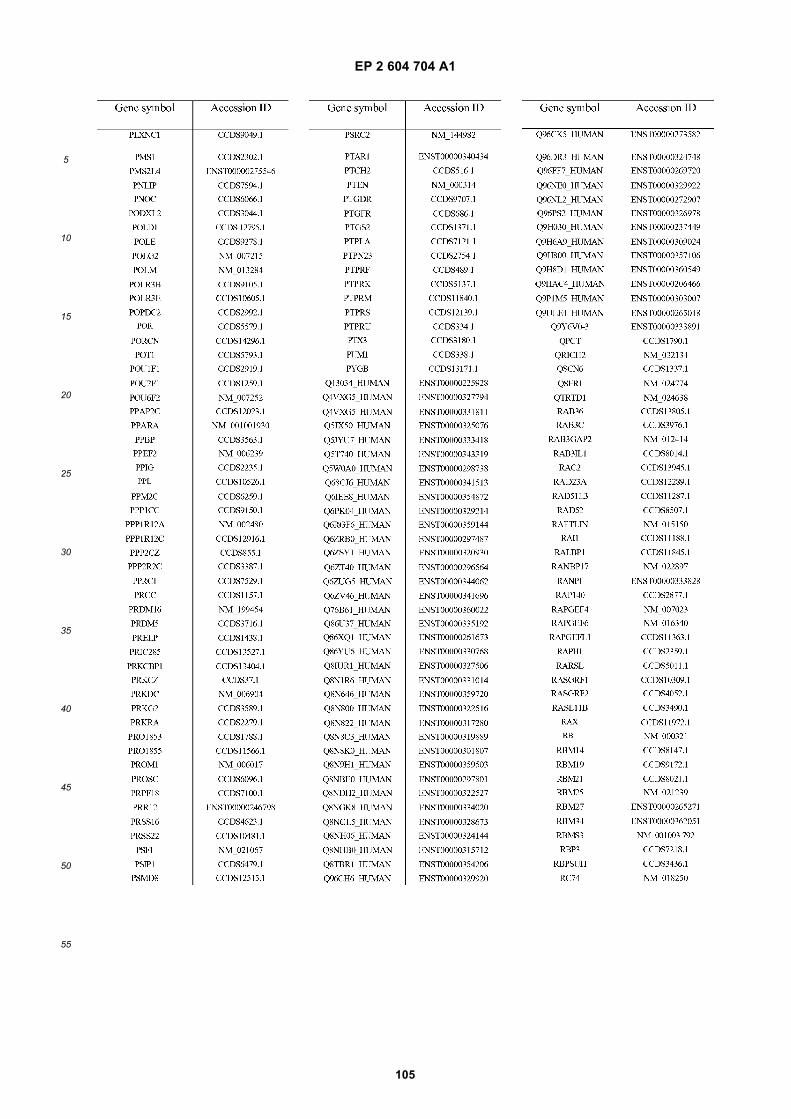
EP 2 604 704 A1
105
5
10
15
20
25
30
35
40
45
50
55
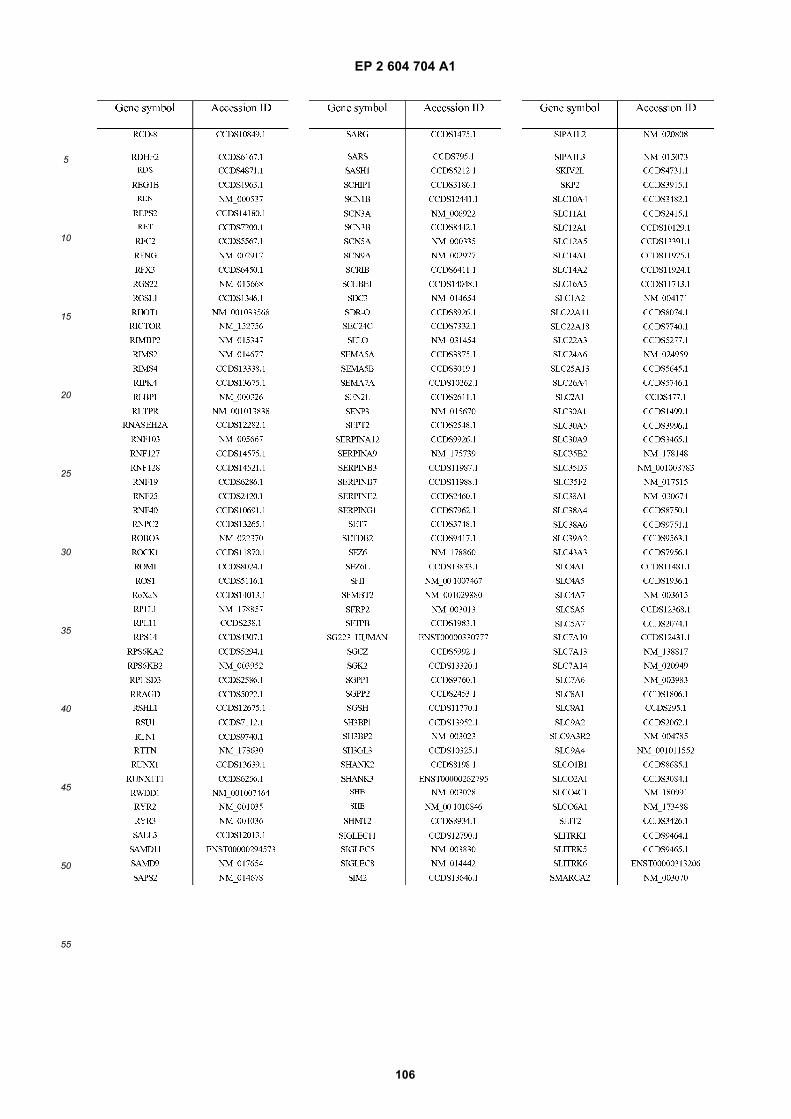
EP 2 604 704 A1
106
5
10
15
20
25
30
35
40
45
50
55
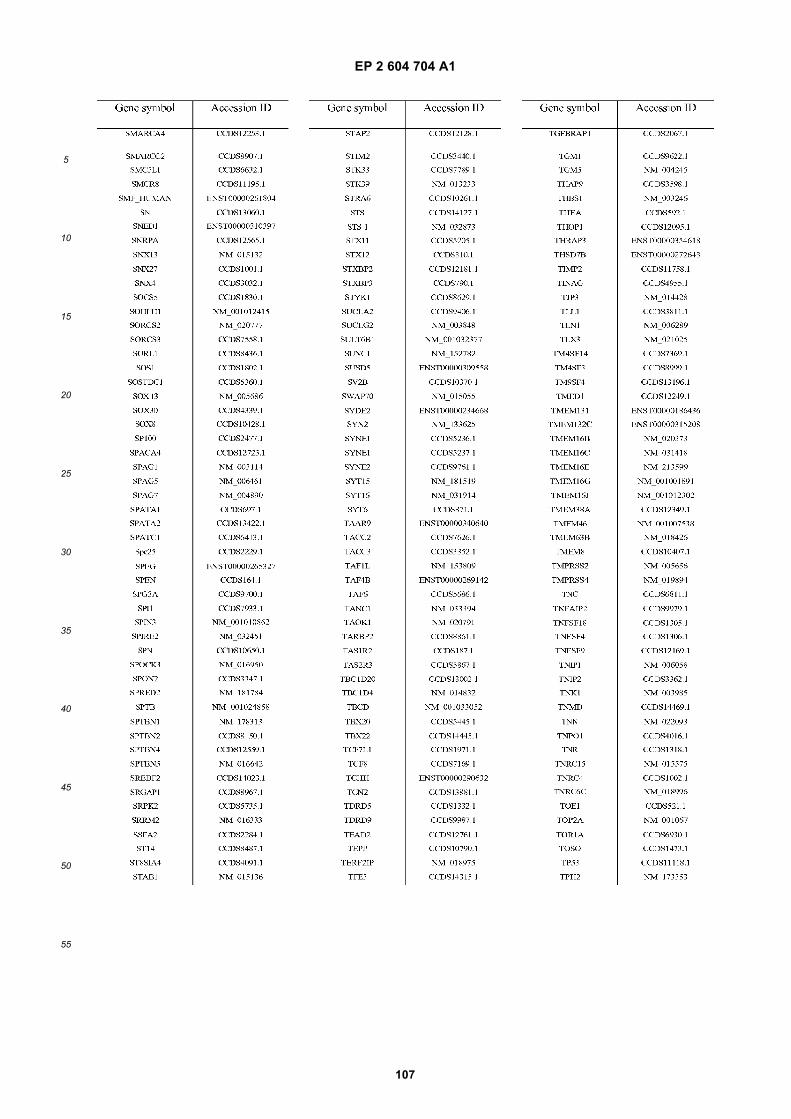
EP 2 604 704 A1
107
5
10
15
20
25
30
35
40
45
50
55
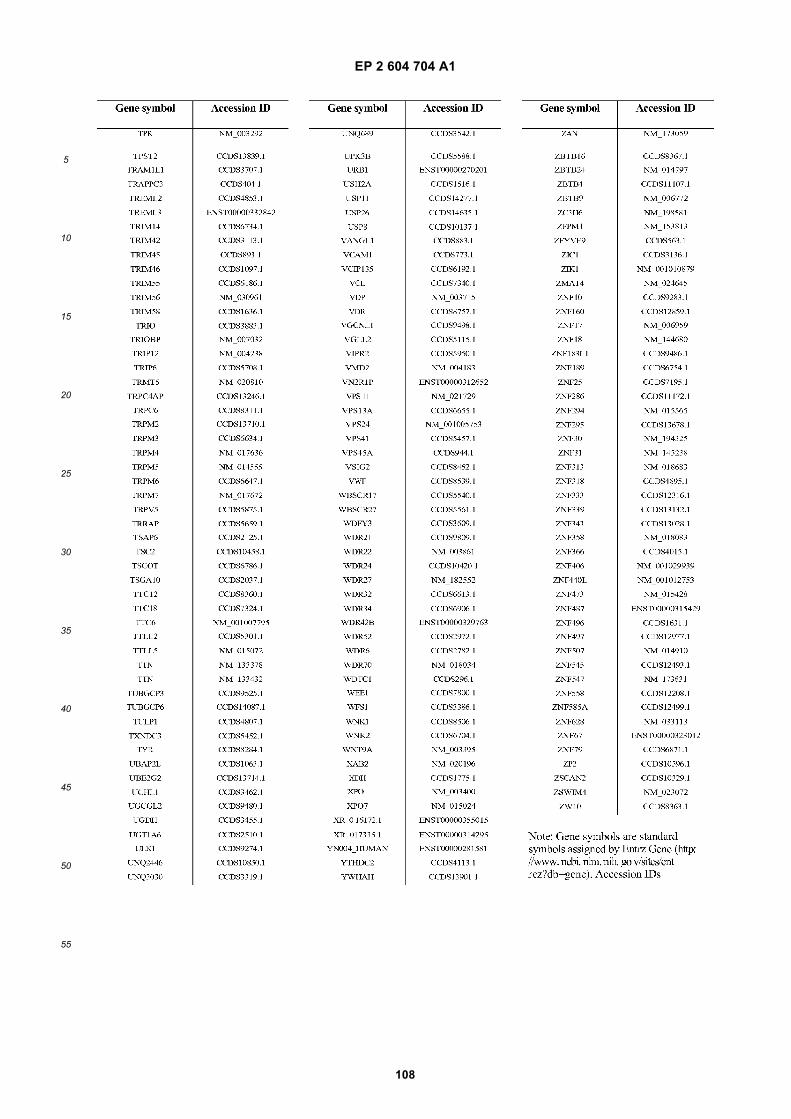
EP 2 604 704 A1
108
5
10
15
20
25
30
35
40
45
50
55
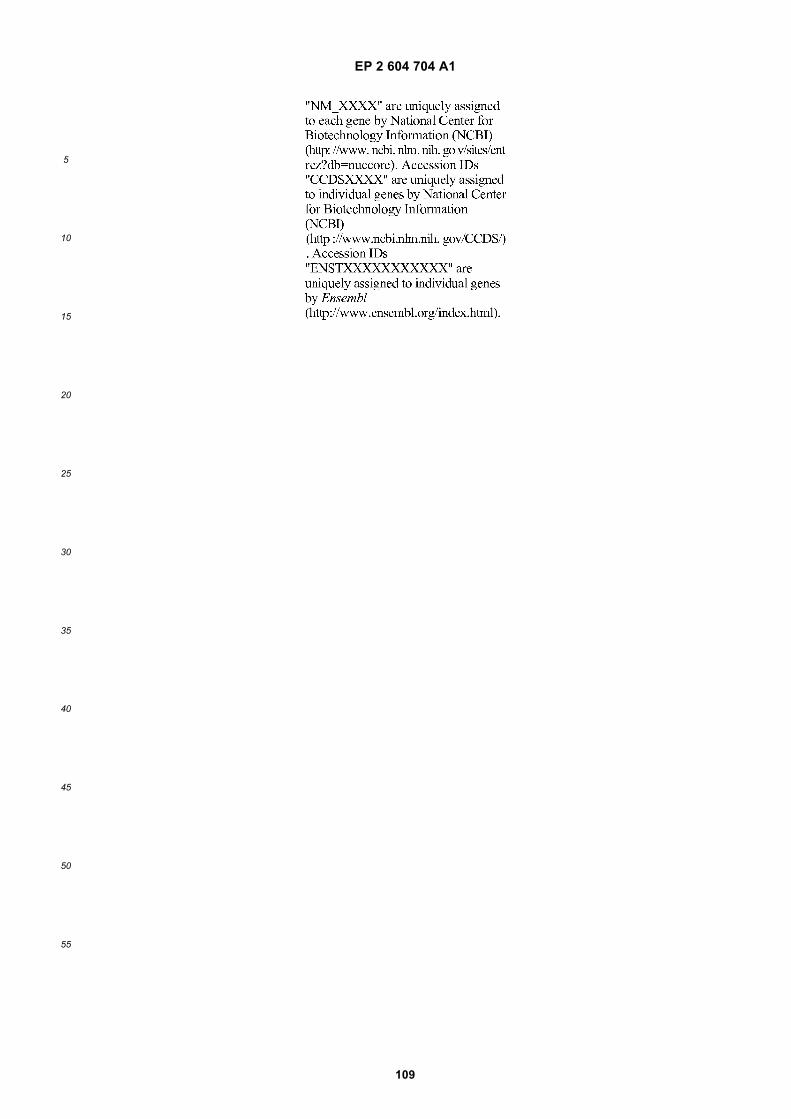
EP 2 604 704 A1
109
5
10
15
20
25
30
35
40
45
50
55
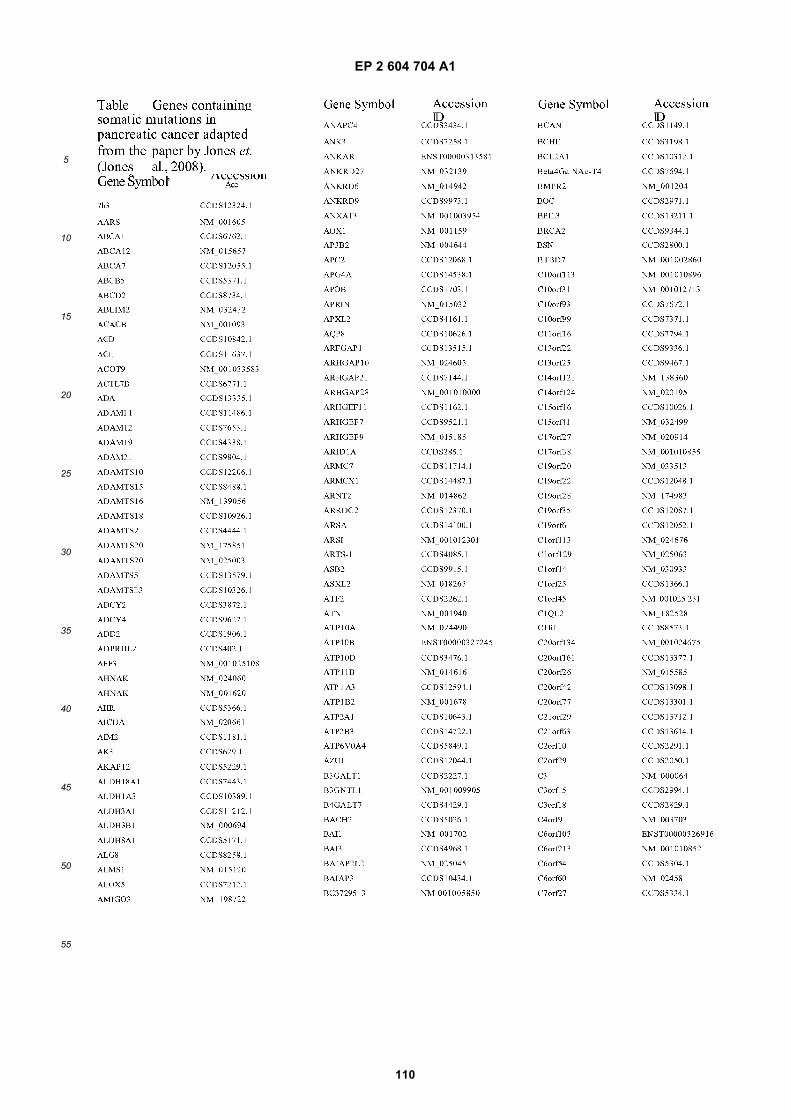
EP 2 604 704 A1
110
5
10
15
20
25
30
35
40
45
50
55
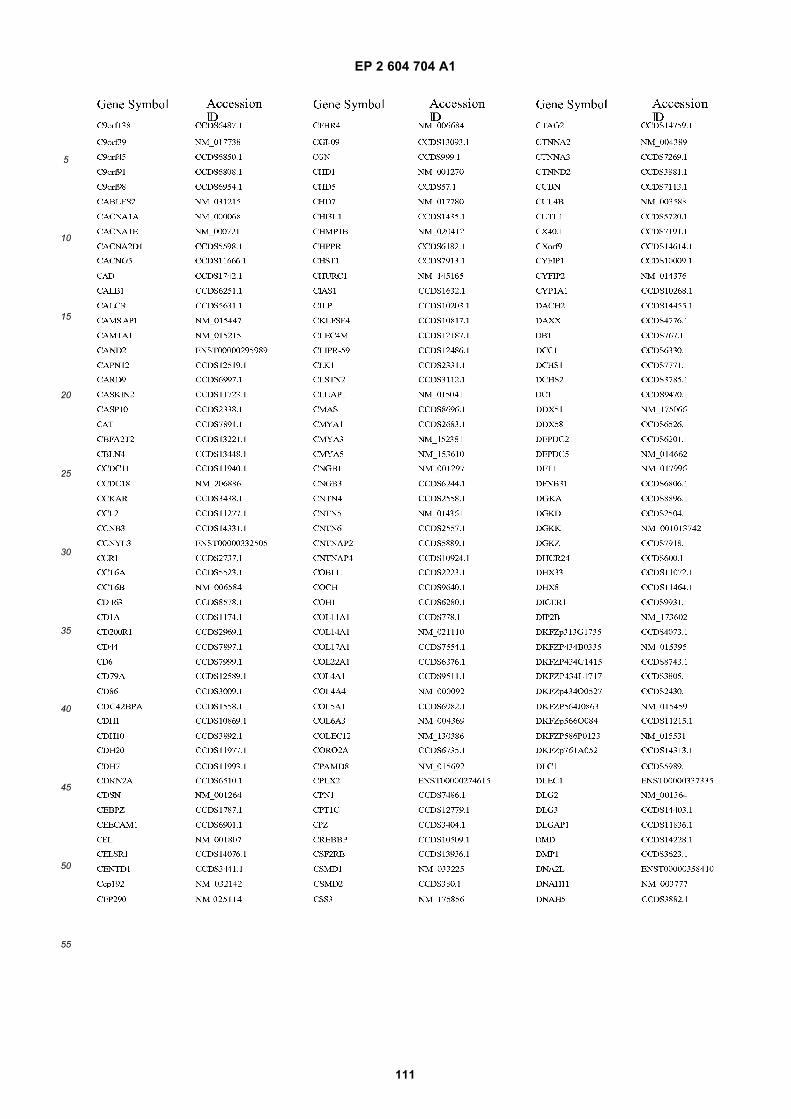
EP 2 604 704 A1
111
5
10
15
20
25
30
35
40
45
50
55
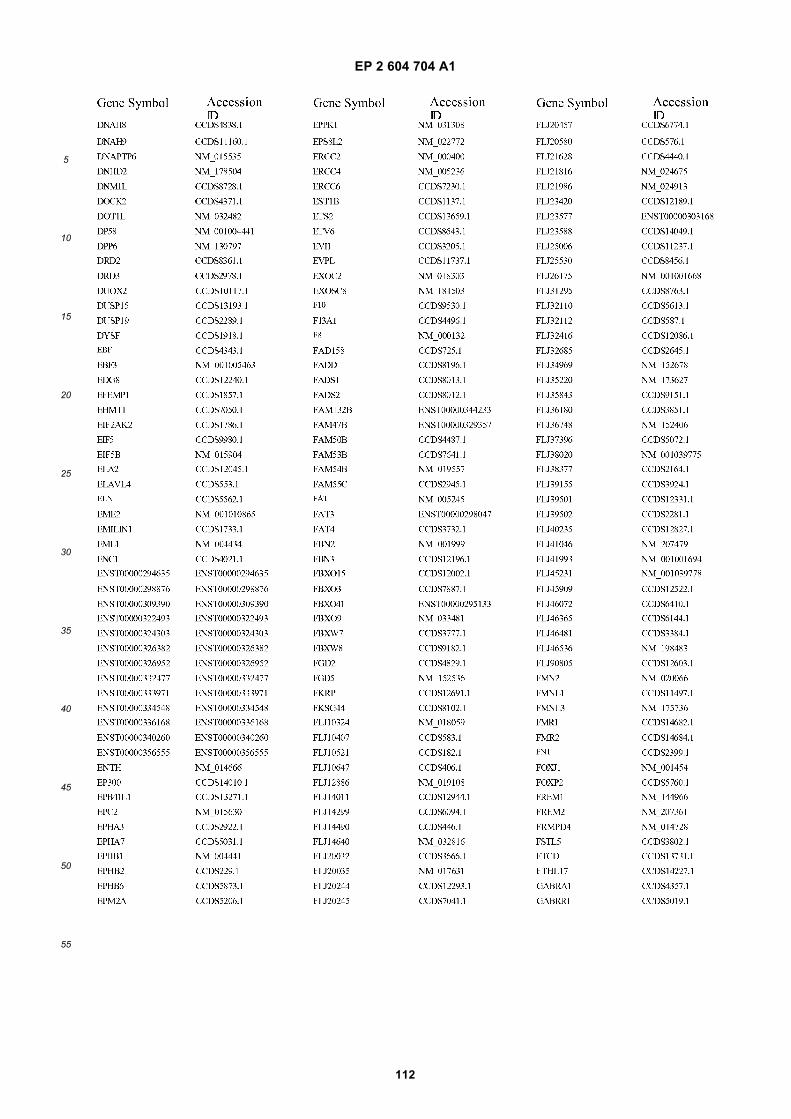
EP 2 604 704 A1
112
5
10
15
20
25
30
35
40
45
50
55
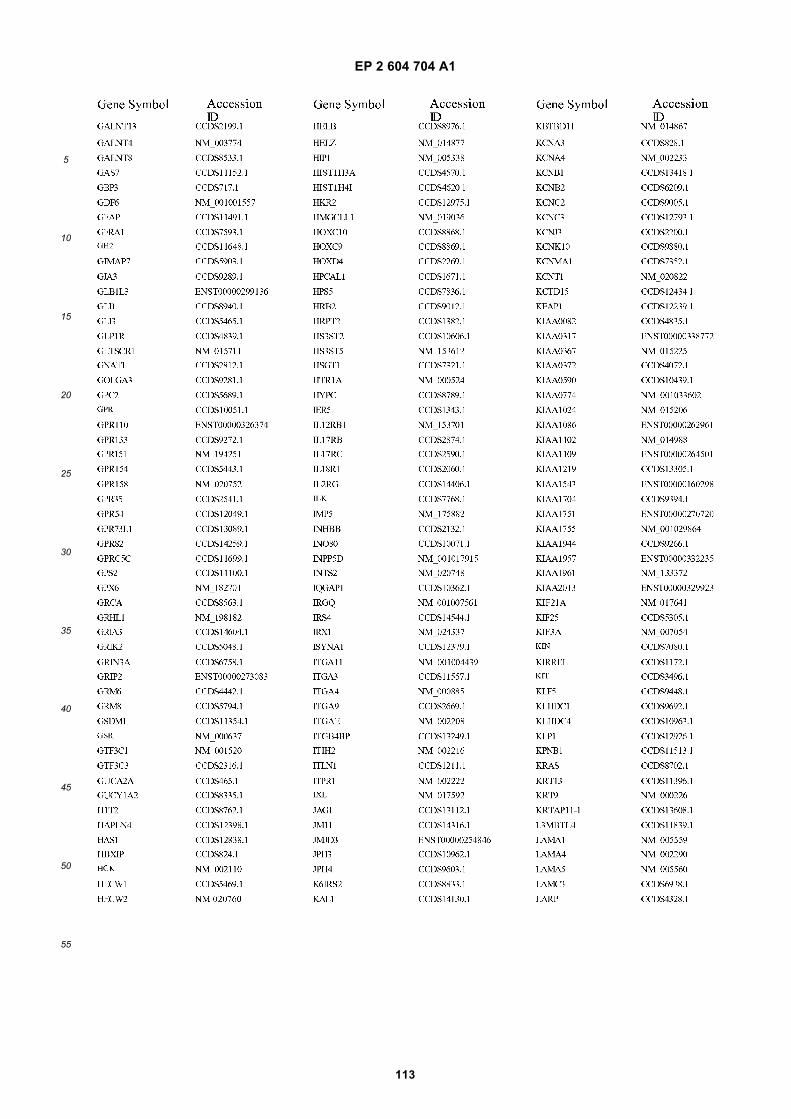
EP 2 604 704 A1
113
5
10
15
20
25
30
35
40
45
50
55
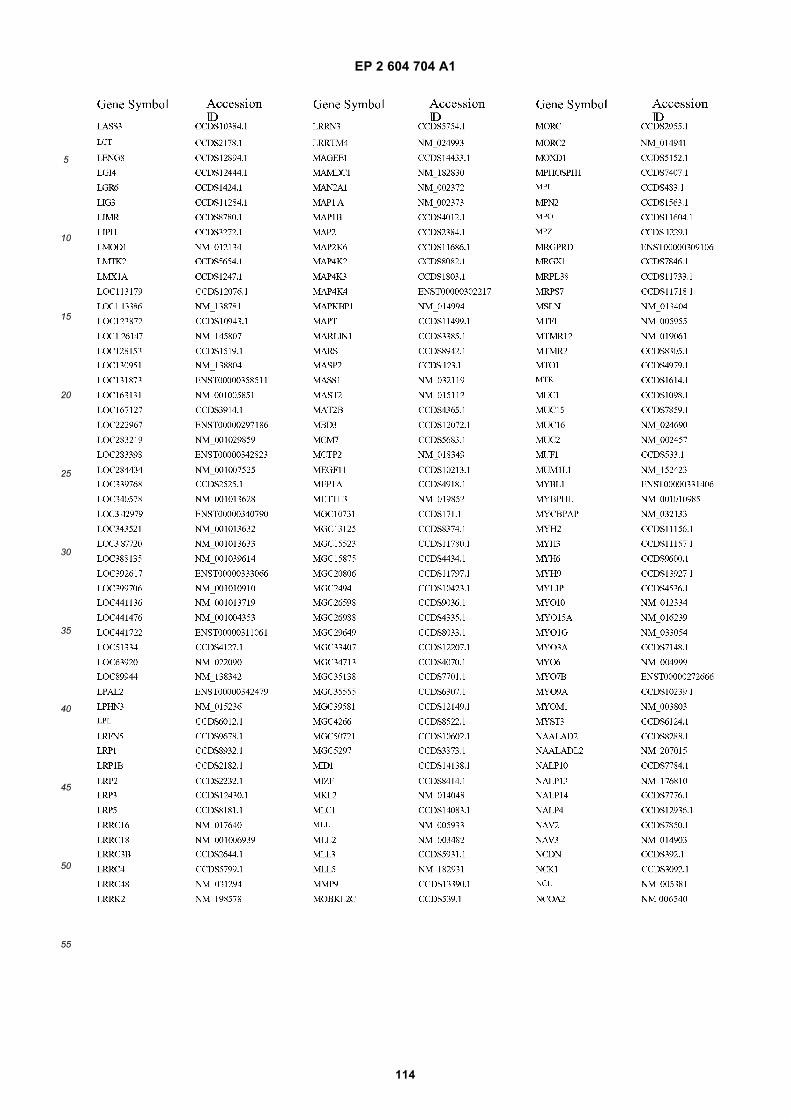
EP 2 604 704 A1
114
5
10
15
20
25
30
35
40
45
50
55
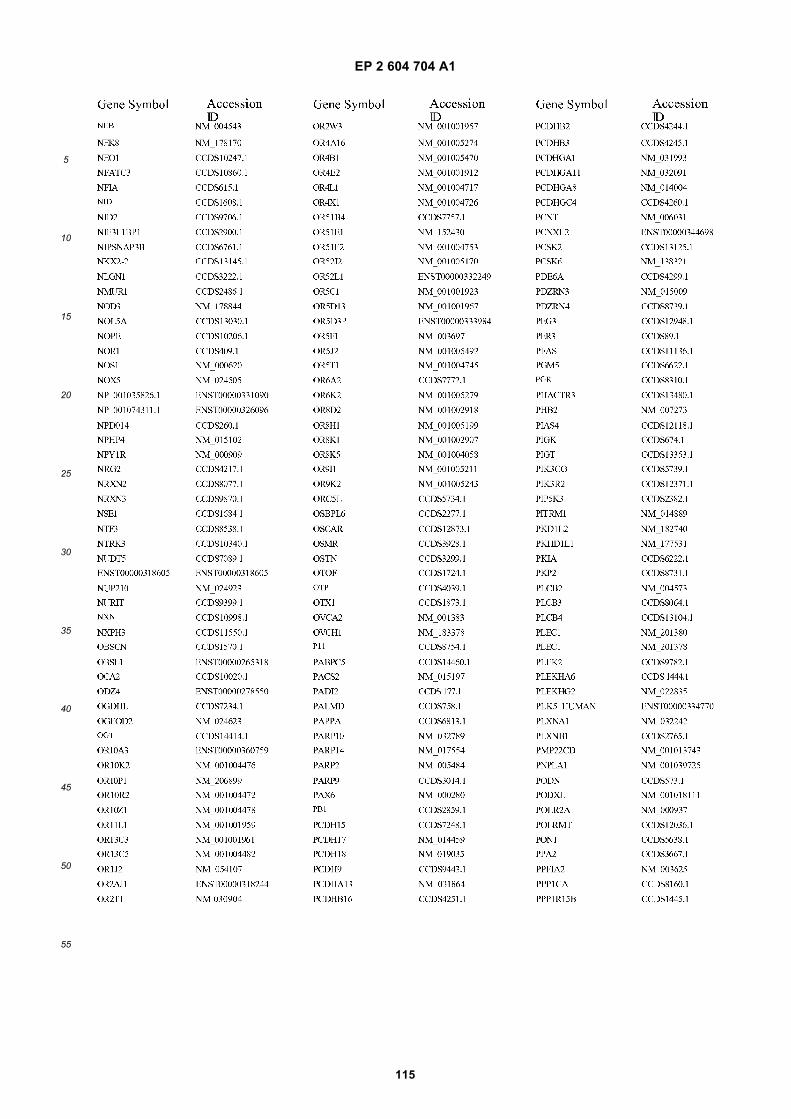
EP 2 604 704 A1
115
5
10
15
20
25
30
35
40
45
50
55
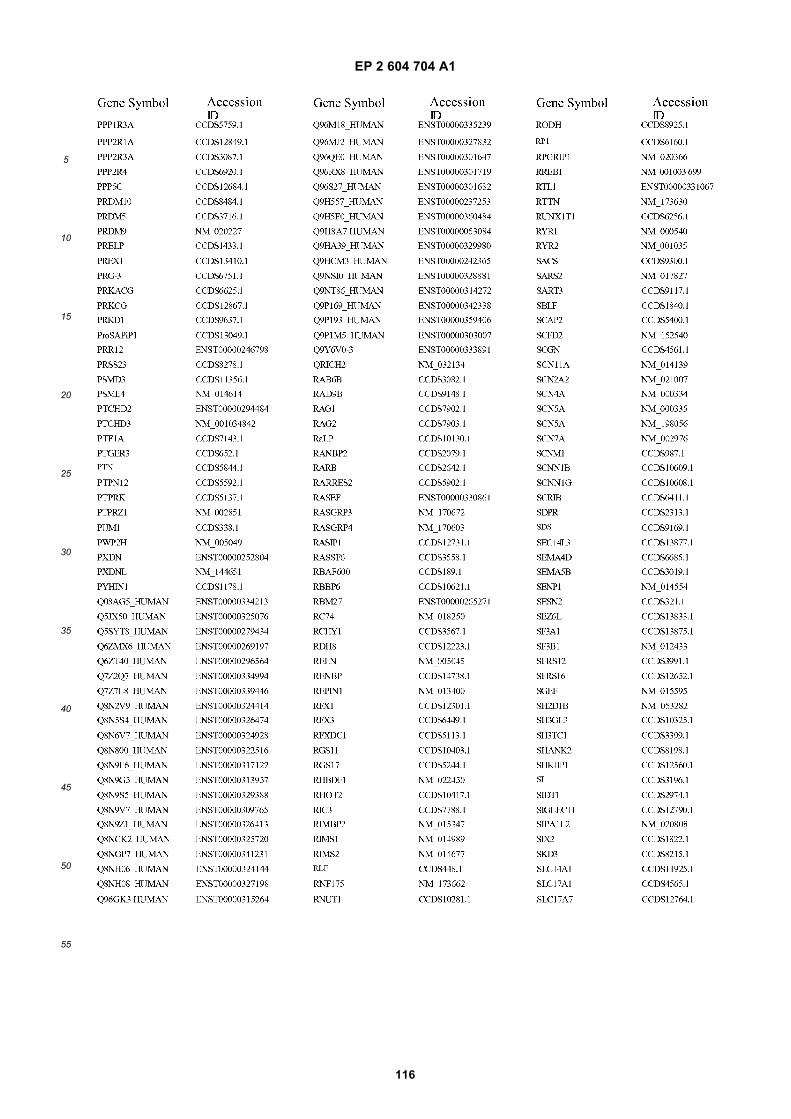
EP 2 604 704 A1
116
5
10
15
20
25
30
35
40
45
50
55
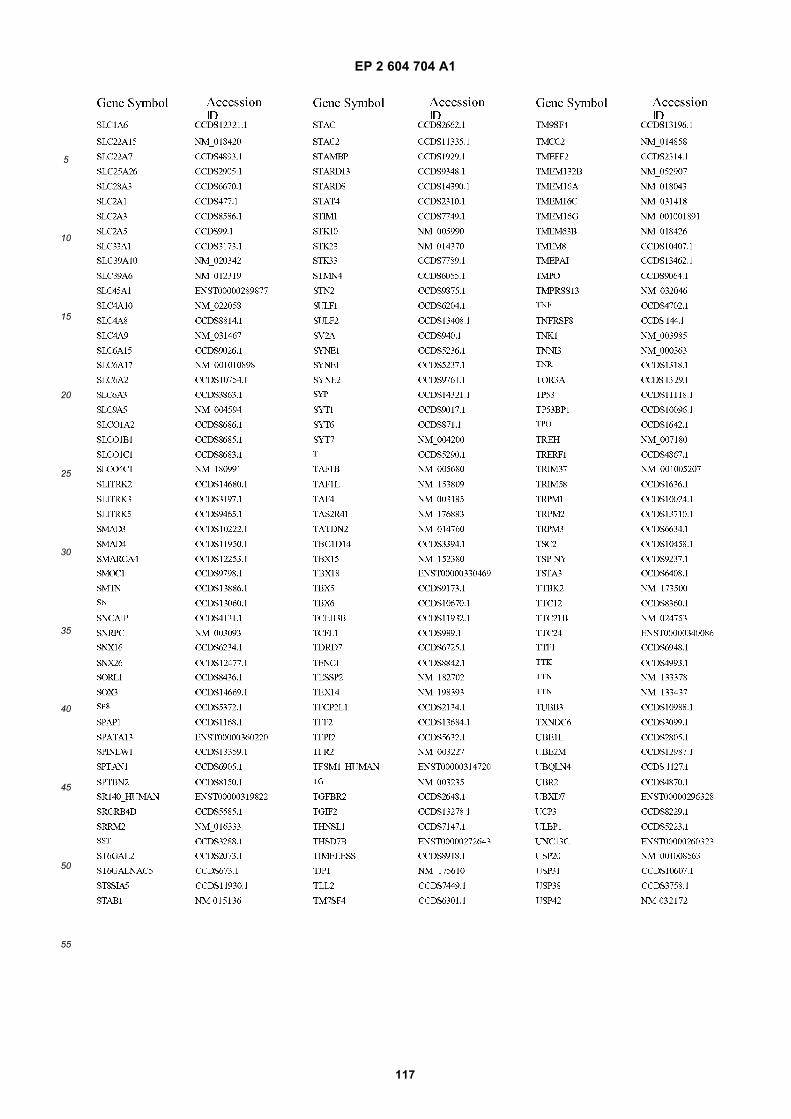
EP 2 604 704 A1
117
5
10
15
20
25
30
35
40
45
50
55
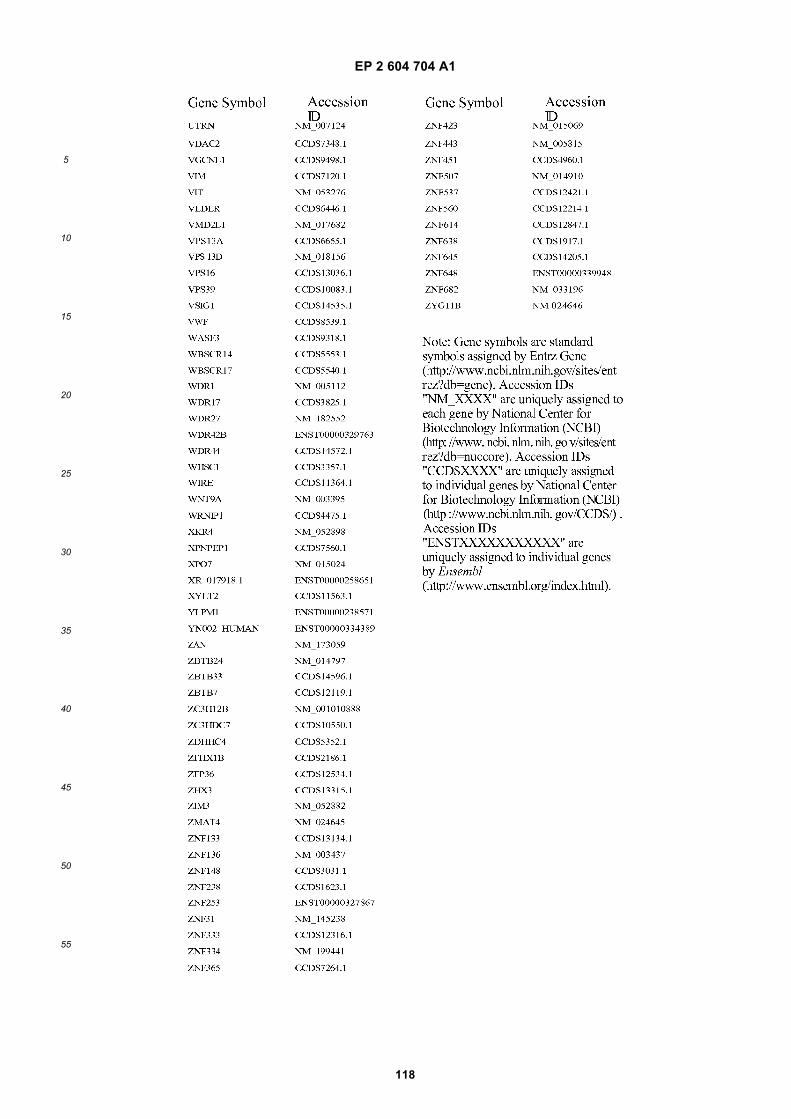
EP 2 604 704 A1
118
5
10
15
20
25
30
35
40
45
50
55
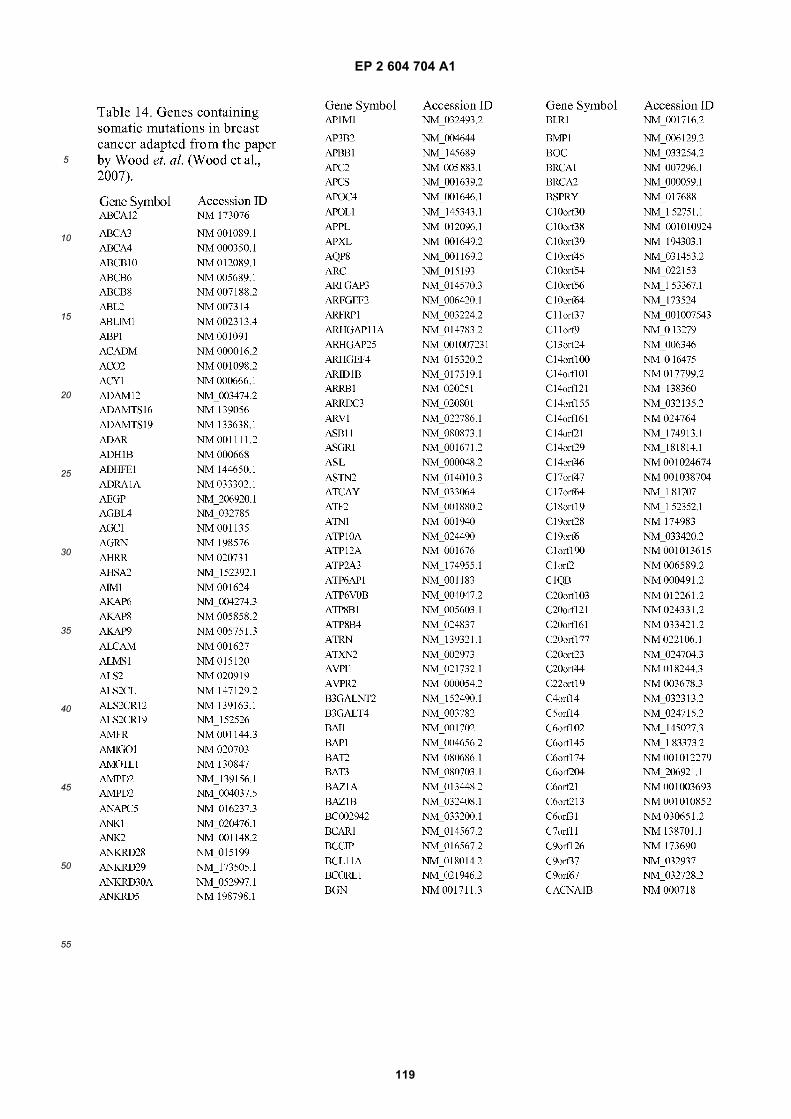
EP 2 604 704 A1
119
5
10
15
20
25
30
35
40
45
50
55
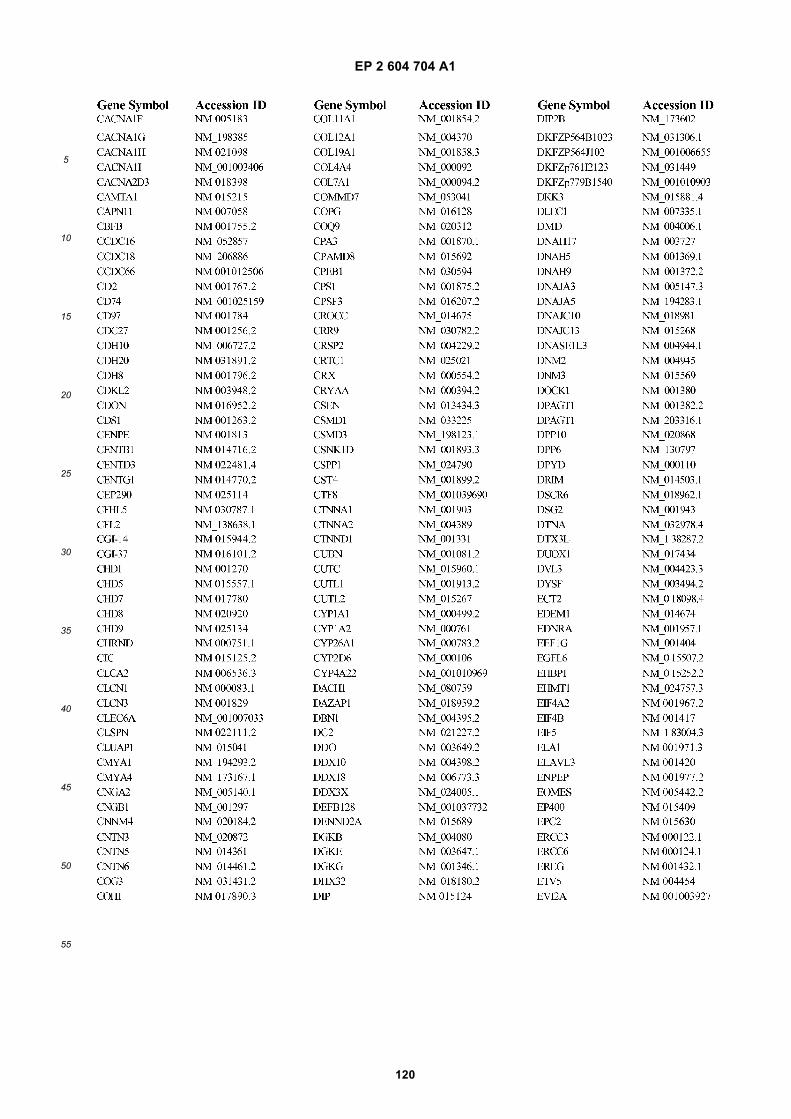
EP 2 604 704 A1
120
5
10
15
20
25
30
35
40
45
50
55
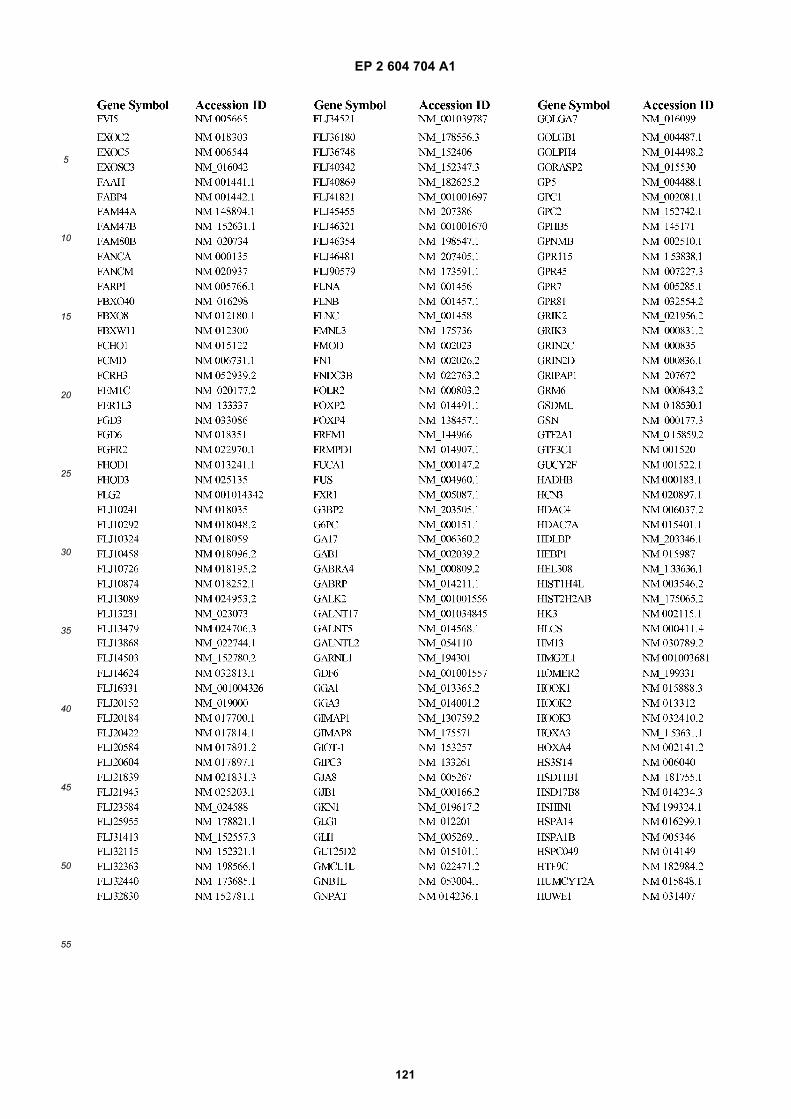
EP 2 604 704 A1
121
5
10
15
20
25
30
35
40
45
50
55
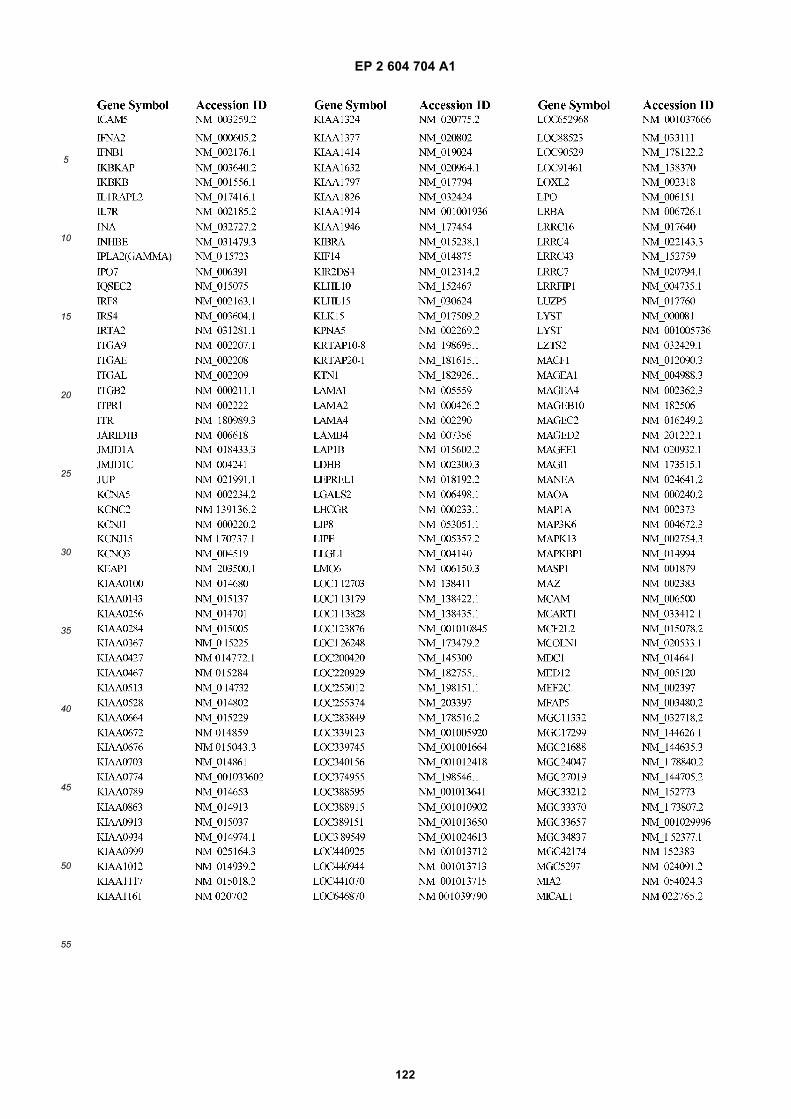
EP 2 604 704 A1
122
5
10
15
20
25
30
35
40
45
50
55
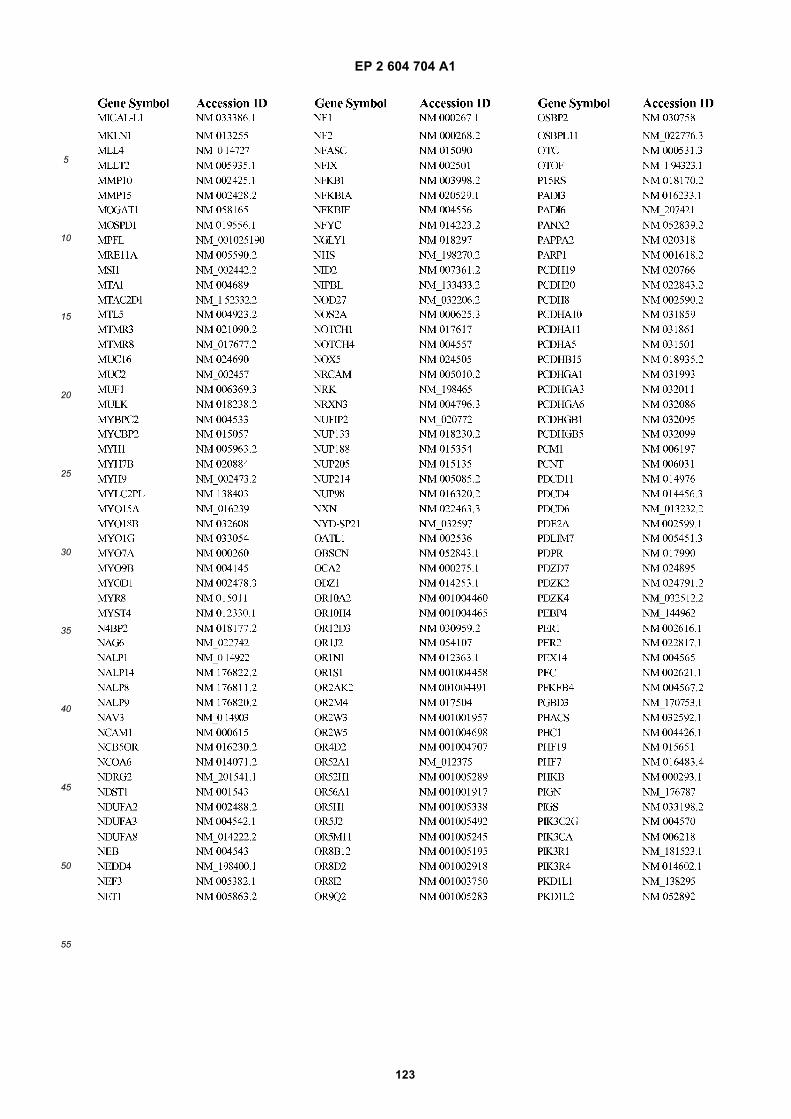
EP 2 604 704 A1
123
5
10
15
20
25
30
35
40
45
50
55
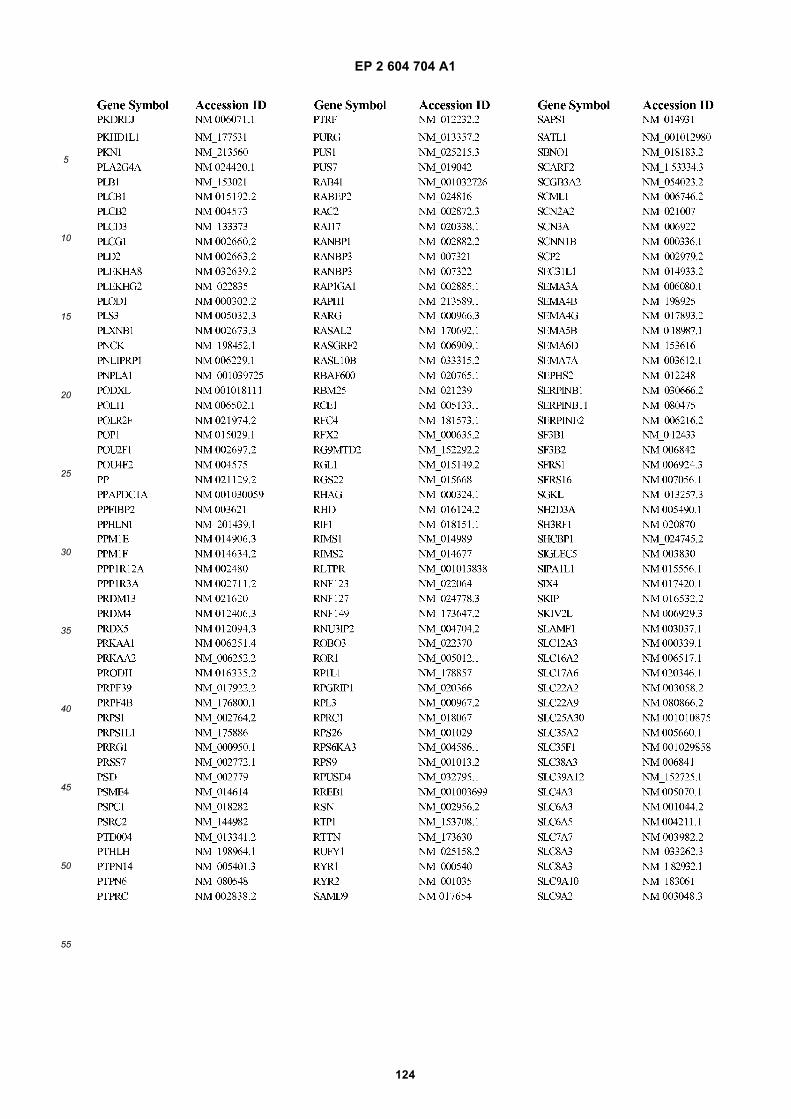
EP 2 604 704 A1
124
5
10
15
20
25
30
35
40
45
50
55
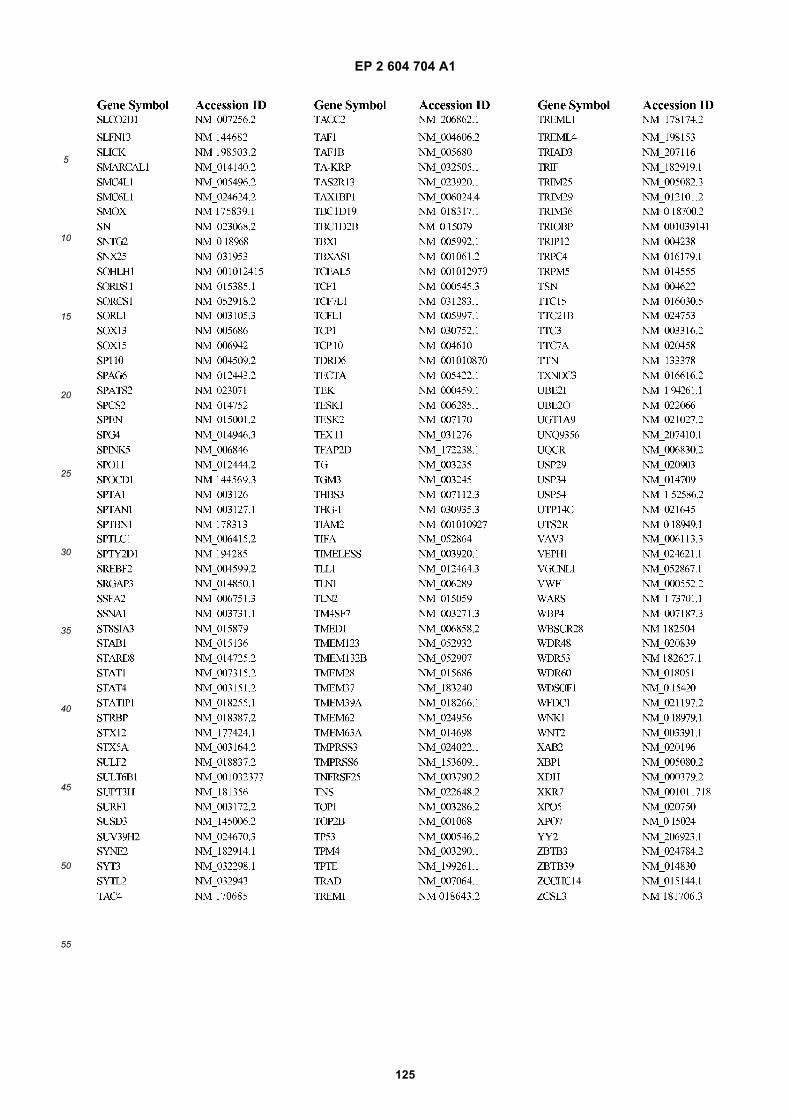
EP 2 604 704 A1
125
5
10
15
20
25
30
35
40
45
50
55
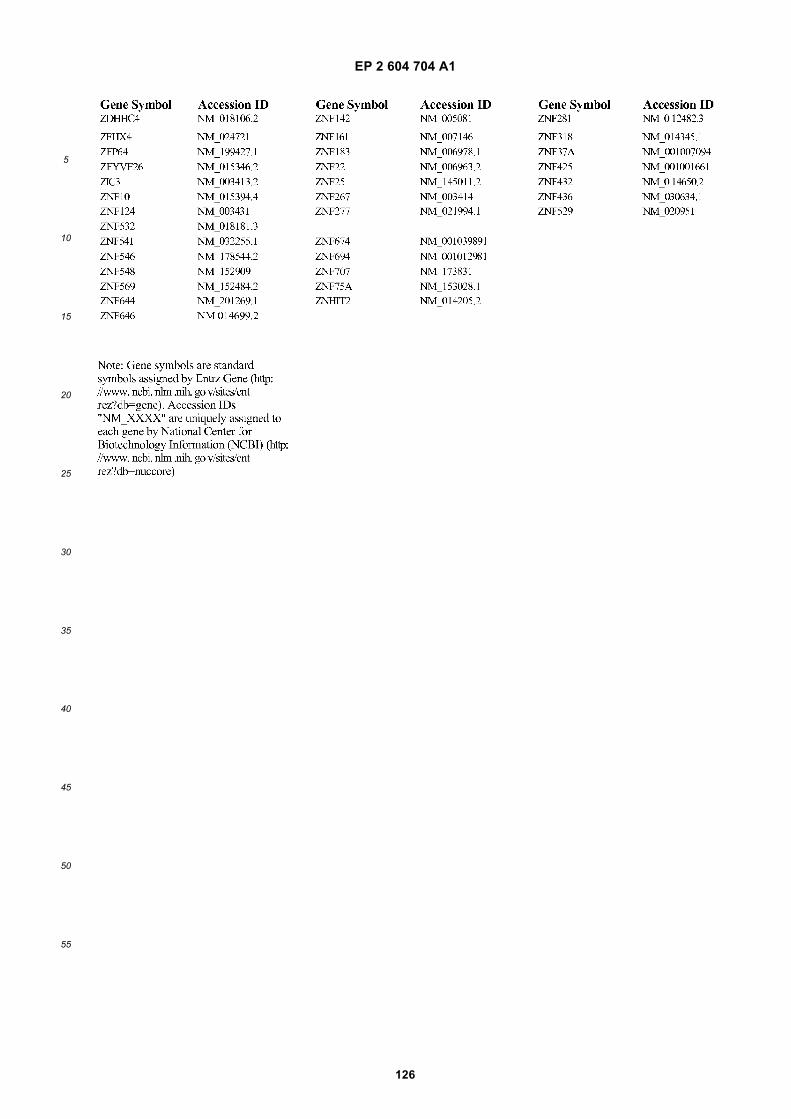
EP 2 604 704 A1
126
5
10
15
20
25
30
35
40
45
50
55
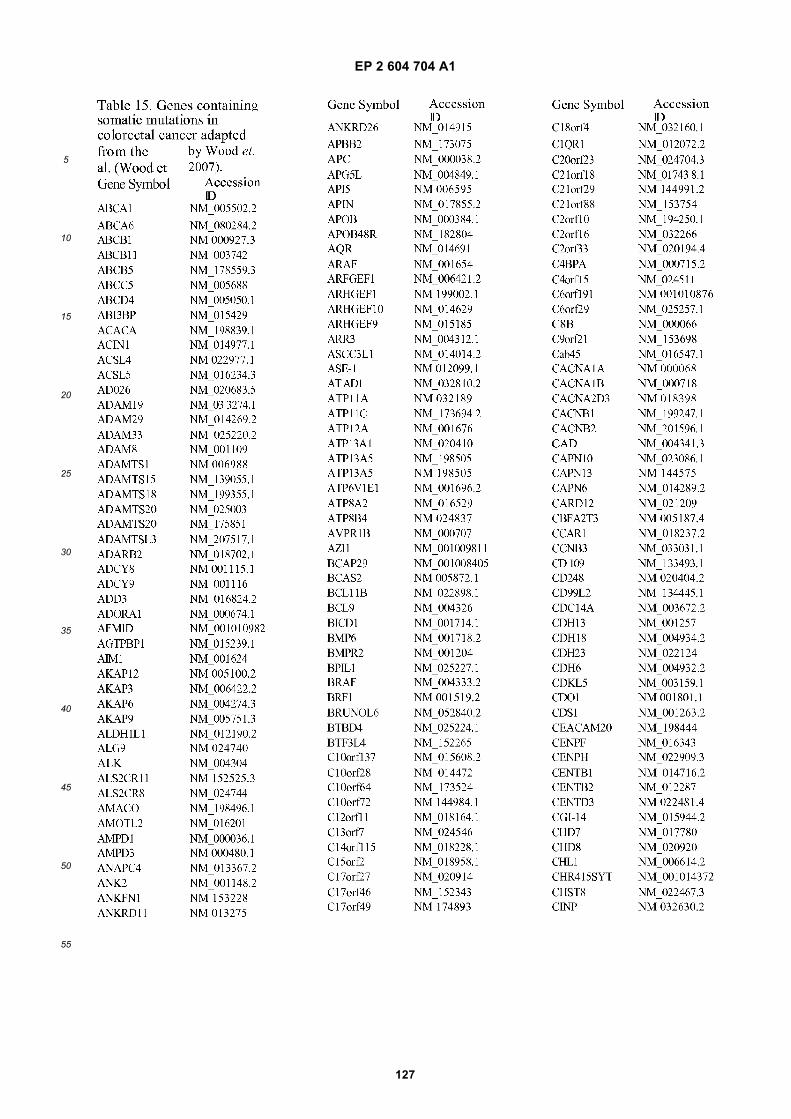
EP 2 604 704 A1
127
5
10
15
20
25
30
35
40
45
50
55
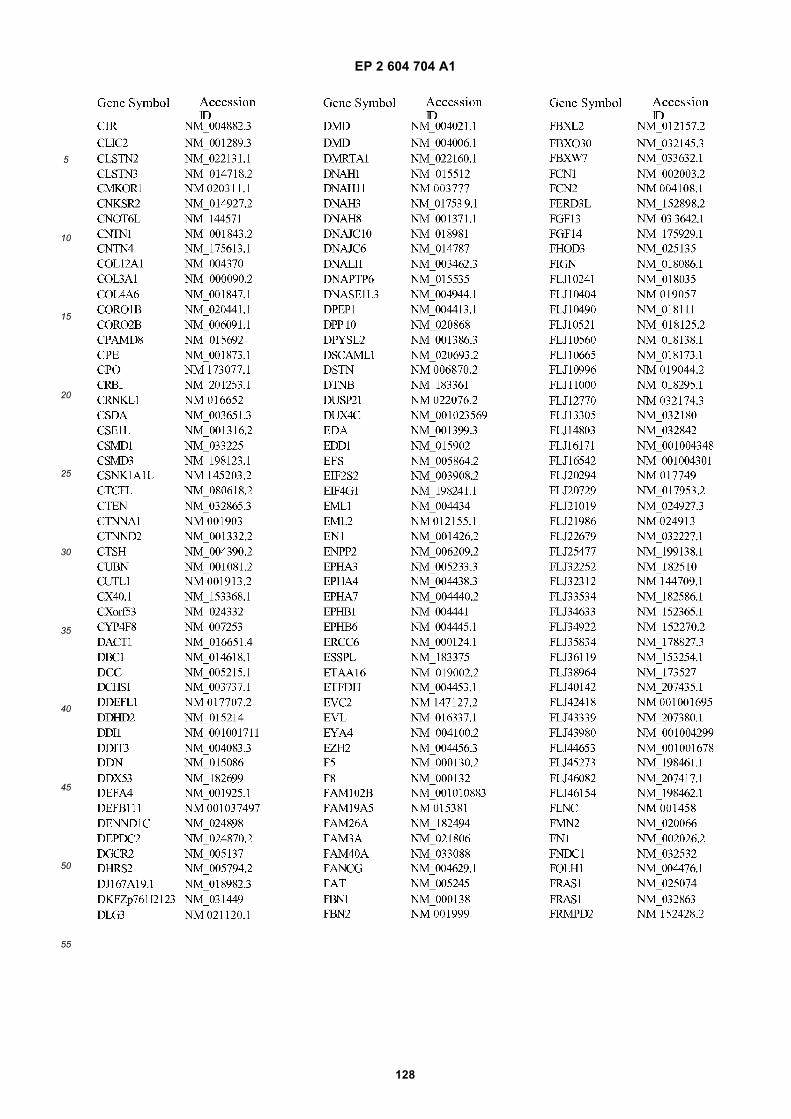
EP 2 604 704 A1
128
5
10
15
20
25
30
35
40
45
50
55
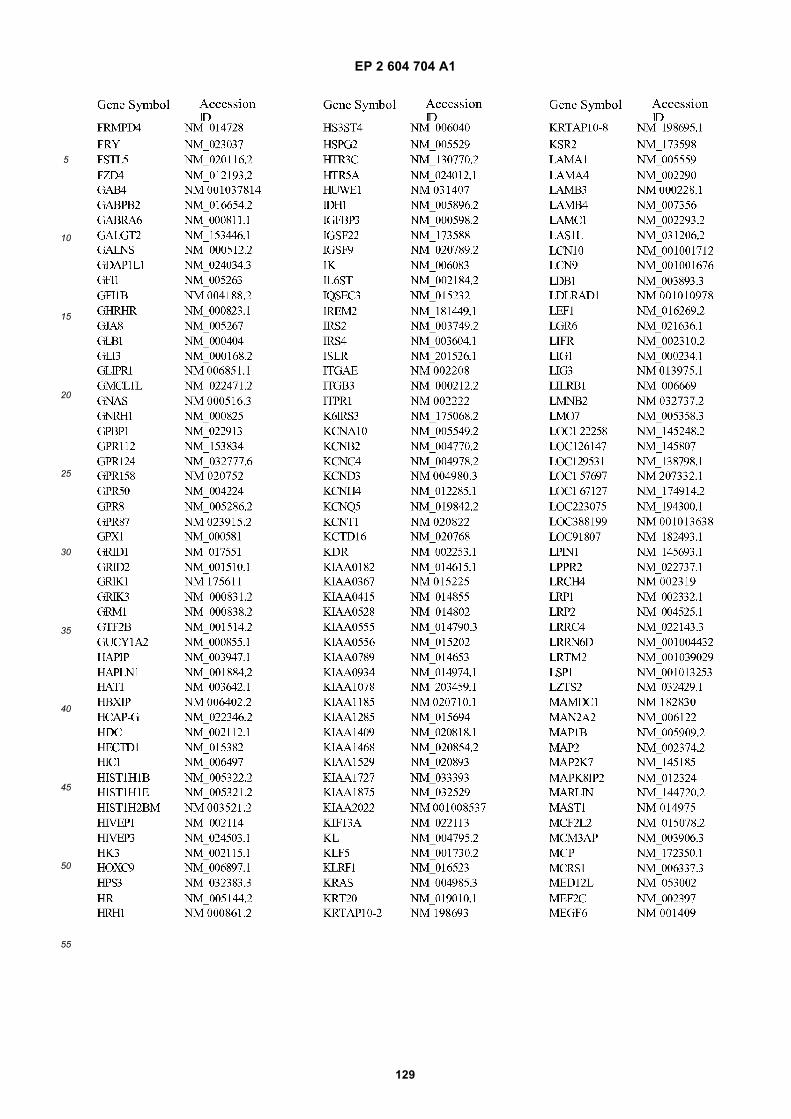
EP 2 604 704 A1
129
5
10
15
20
25
30
35
40
45
50
55
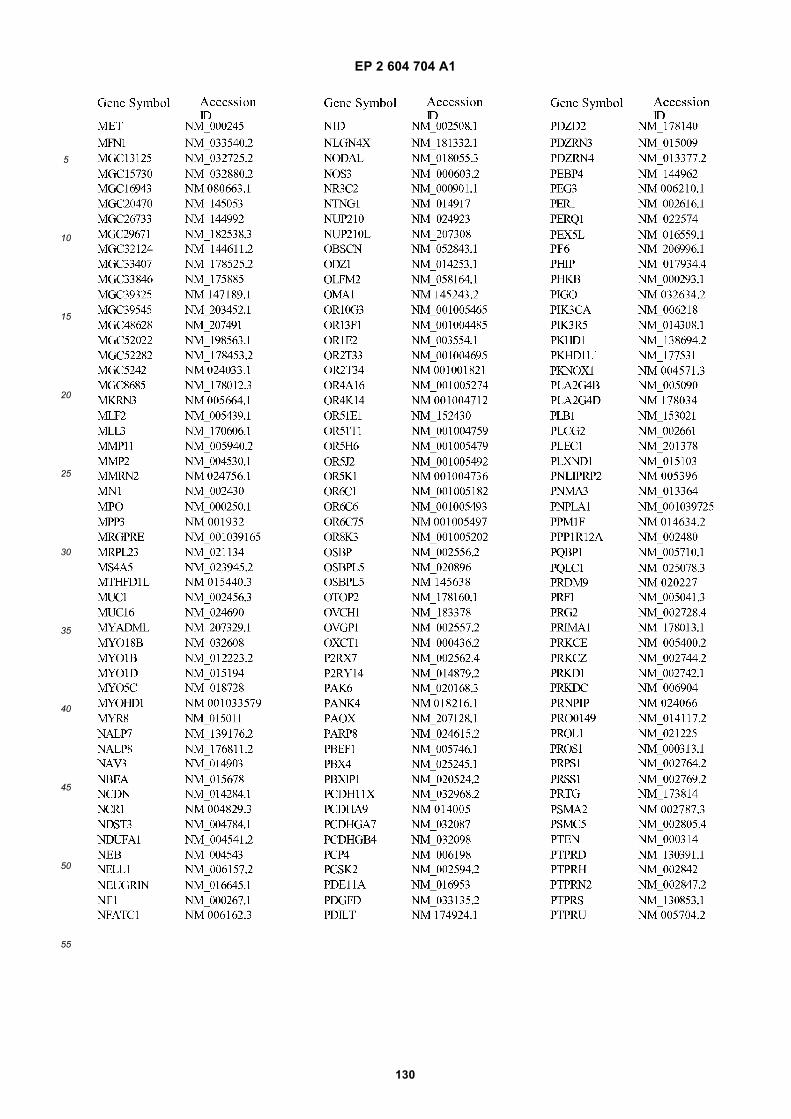
EP 2 604 704 A1
130
5
10
15
20
25
30
35
40
45
50
55
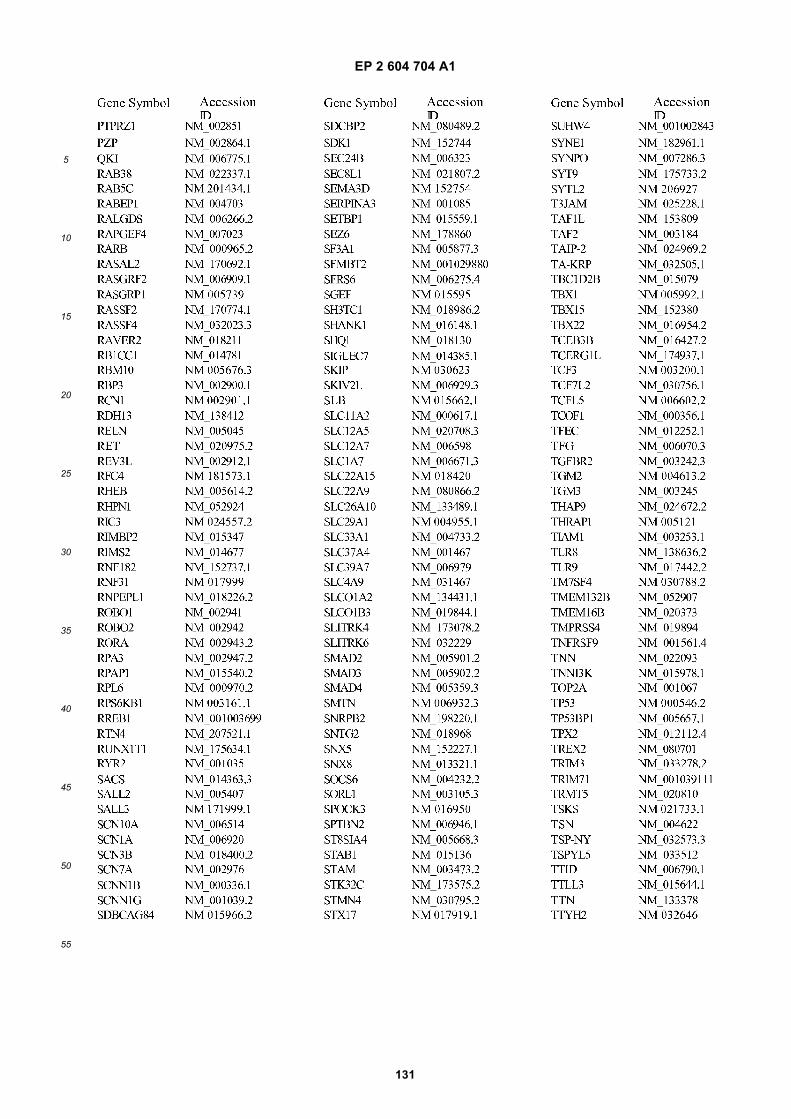
EP 2 604 704 A1
131
5
10
15
20
25
30
35
40
45
50
55
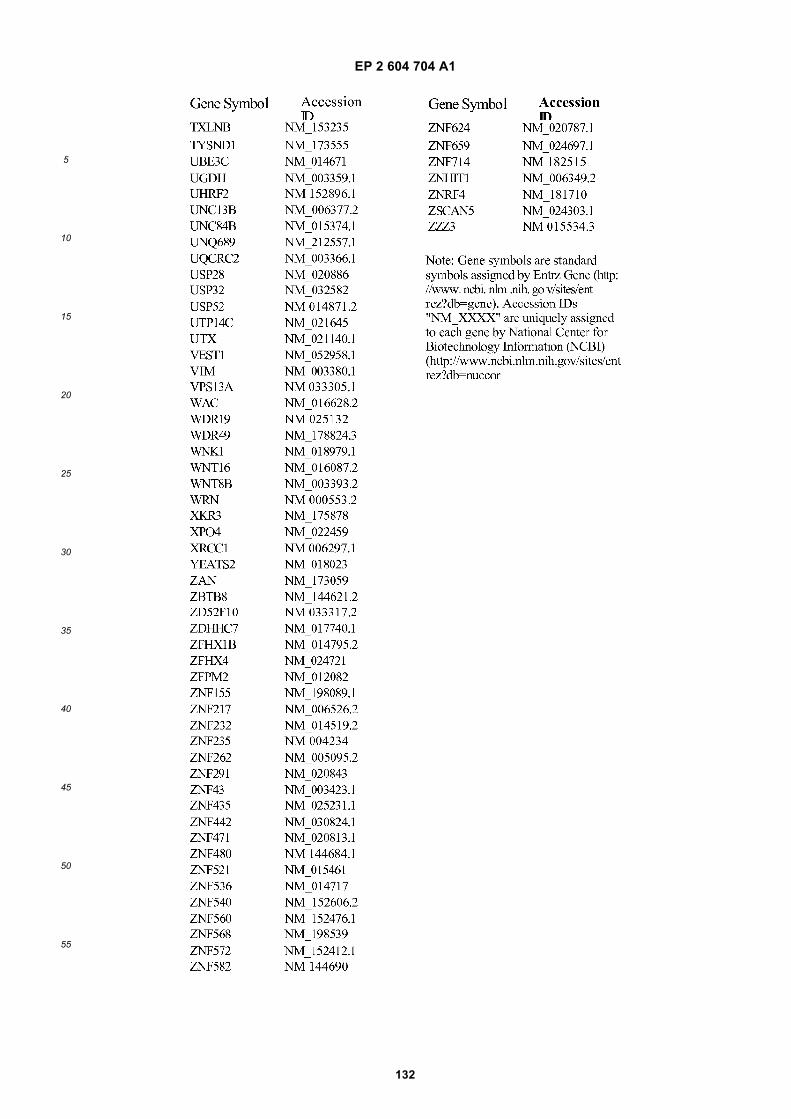
EP 2 604 704 A1
132
5
10
15
20
25
30
35
40
45
50
55
EP 2 604 704 A1
133
5
10
15
20
25
30
35
40
45
50
55
EP 2 604 704 A1
134
5
10
15
20
25
30
35
40
45
50
55
EP 2 604 704 A1
135
5
10
15
20
25
30
35
40
45
50
55
EP 2 604 704 A1
136
5
10
15
20
25
30
35
40
45
50
55
EP 2 604 704 A1
137
5
10
15
20
25
30
35
40
45
50
55
EP 2 604 704 A1
138
5
10
15
20
25
30
35
40
45
50
55
EP 2 604 704 A1
139
5
10
15
20
25
30
35
40
45
50
55
EP 2 604 704 A1
140
5
10
15
20
25
30
35
40
45
50
55
EP 2 604 704 A1
141
5
10
15
20
25
30
35
40
45
50
55
EP 2 604 704 A1
142
5
10
15
20
25
30
35
40
45
50
55
EP 2 604 704 A1
143
5
10
15
20
25
30
35
40
45
50
55
EP 2 604 704 A1
144
5
10
15
20
25
30
35
40
45
50
55
Claims
1. A method for aiding in the diagnosis of a disease or other medical condition in a subject, comprising the steps of:
(a) isolating a microvesicle fraction from a subject; and(b) detecting the presence or absence of a biomarker within the microvesicle fraction;wherein the biomarker is a genetic aberration, and wherein the biomarker is associated with a disease or othermedical condition.
2. A method for aiding in the evaluation of treatment efficacy for a subject having a disease or other medical condition,comprising the steps of:
(a) Isolating a microvesicle fraction from a biological sample from a subject;(b) detecting the presence or absence of a biomarker within the microvesicle fraction,wherein the biomarker is associated with treatment efficacy for the disease or other medical condition.
3. A monitoring method, wherein said method aids in monitoring the status of a disease or other medical condition ina subject, comprising the steps of:
(a) isolating a microvesicle fraction from a biological sample from the subject;(b) detecting the presence or absence of a biomarker within the microvesicle fraction, wherein the biomarkeris associated with the disease or other medical condition; and(c) optionally repeating steps (a) and (b) periodically over time to monitor the progression or regression of thedisease, or to determine recurrence of the disease.
4. The method of any of claims 1, 2 or 3, wherein the biomarker is:
(i) a species of nucleic acid;(ii) the level of expression of a nucleic acid;(iii) a nucleic acid variant; or(iv) a combination thereof.
5. A method for aiding in the diagnosis of a disease or other medical condition in a subject, comprising the steps of:
(a) isolating a microvesicle fraction from a subject; and(b) detecting the presence or absence of a biomarker within the microvesicle fraction; wherein the biomarkeris RNA, and wherein the biomarker is associated with a disease orother medical condition.
6. The method of any of claims 1 to 5, wherein the biological sample is a sample of bodily fluid.
7. The method of any of claims 1 to 5, wherein the biomarker comprises RNA, including messenger RNA, microRNA,siRNA or shRNA.
8. The method of any of claims 1 to 4 and 6, wherein the biomarker comprises DNA, including single stranded DNA,complementary DNA, or noncoding DNA.
9. The method of any previous claim, wherein step (a) is performed by size exclusion chromatography, density gradientcentrifugation, differential centrifugation, nanomembrane ultrafiltration, immunoabsorbent capture, affinity purifica-tion, microfluidic separation, or combinations thereof.
10. The method of any previous claim, wherein the detecting step b) is performed by microarray analysis, PCR, hybrid-ization with allele-specific probes, enzymatic mutation detection, ligation chain reaction (LCR), oligonucleotide liga-tion assay (OLA), flow-cytometric heteroduplex analysis, chemical cleavage of mismatches, mass spectrometry,nucleic acid sequencing, single strand conformation polymorphism (SSCP), denaturing gradient gel electrophoresis(DGGE), temperature gradient gel electrophoresis (TGGE), restriction fragment polymorphisms, serial analysis ofgene expression (SAGE), or combinations thereof.
EP 2 604 704 A1
145
5
10
15
20
25
30
35
40
45
50
55
11. The method of any previous claim, further comprising comparing the microvesicle biomarker profile of the micro-vesicle fraction of step (b) to a control profile and selecting potential new biomarkers based on one or more differencesbetween the microvesicle profile and the control profile.
12. A kit for use in a method of any of claims 1 to 7 and 9 to 11, for the extraction of microvesicular RNA, comprisingthe following components:
(a) RNase;(b) lysis buffer;(c) RNA purification reagent; and optionally,(d) instructions for using the foregoing reagents in the extraction of RNA from microvesicles.
13. A kit for use in a method of any of claims 1 to 4, 6, and 8-11 for the extraction of microvesicular DNA, comprisingthe following components:
(a) DNase;(b) lysis buffer;(c) DNA purification reagent; and optionally,(d) instructions for using the foregoing reagents in the extraction of DNA from exosomes.
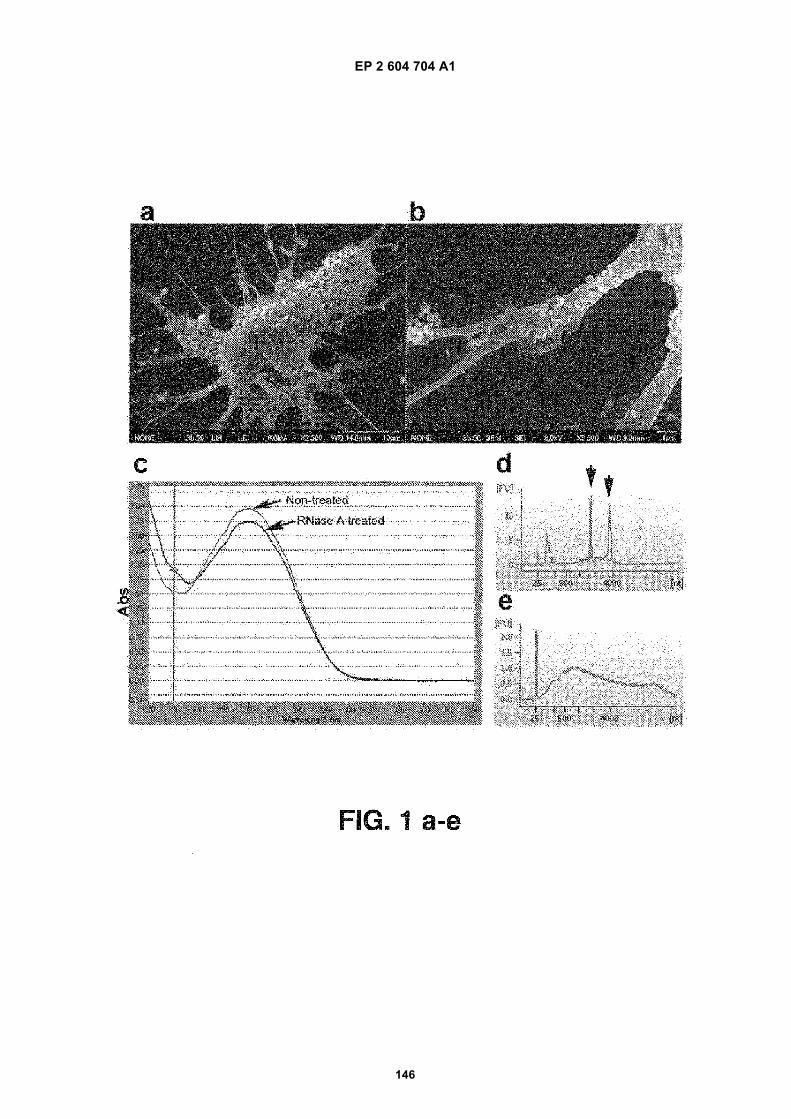
EP 2 604 704 A1
146
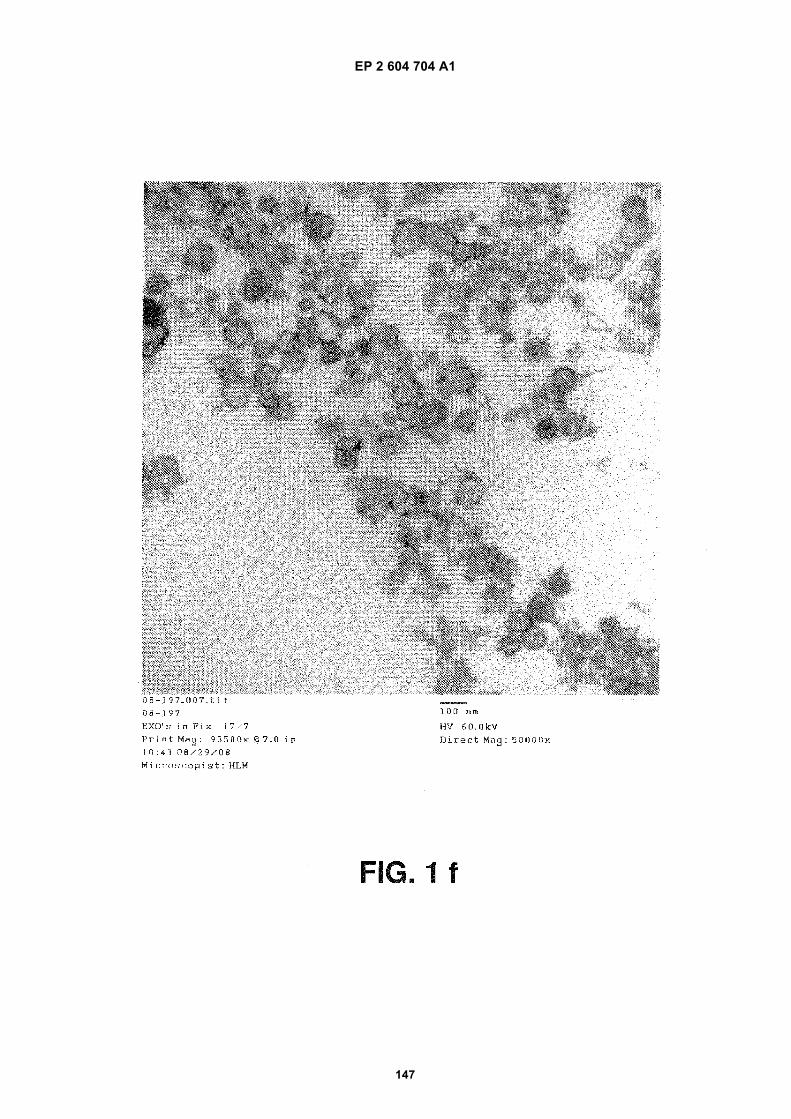
EP 2 604 704 A1
147
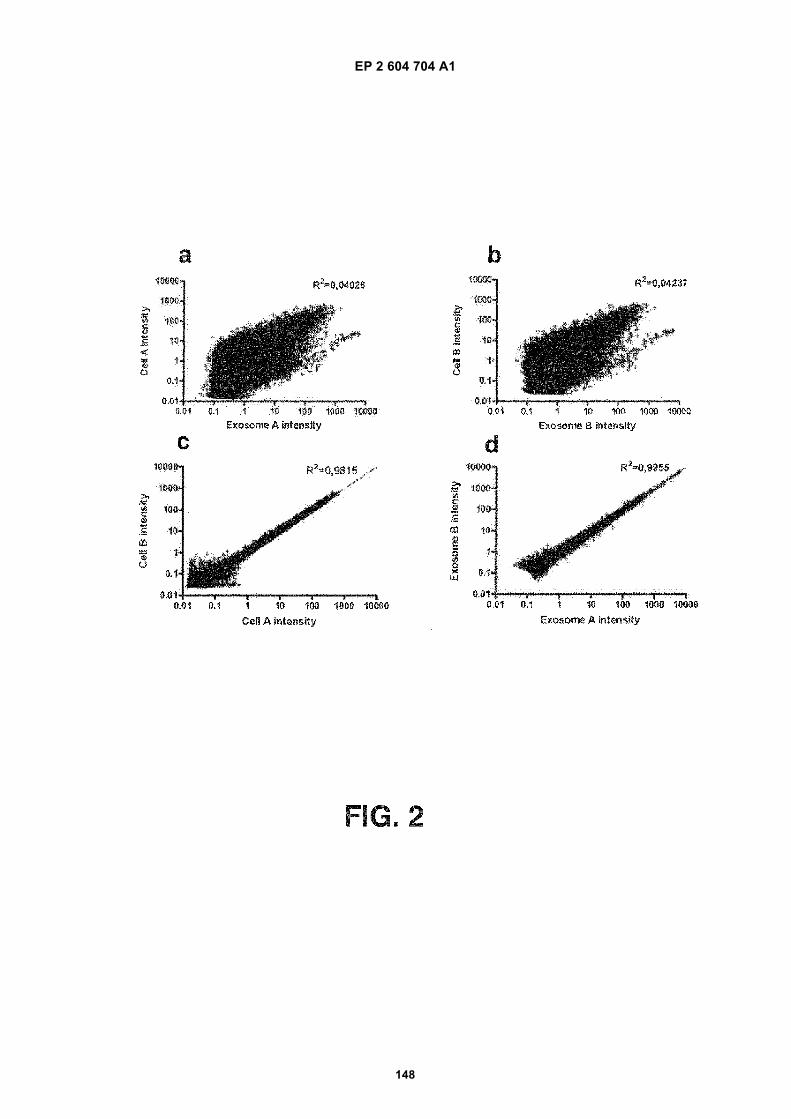
EP 2 604 704 A1
148
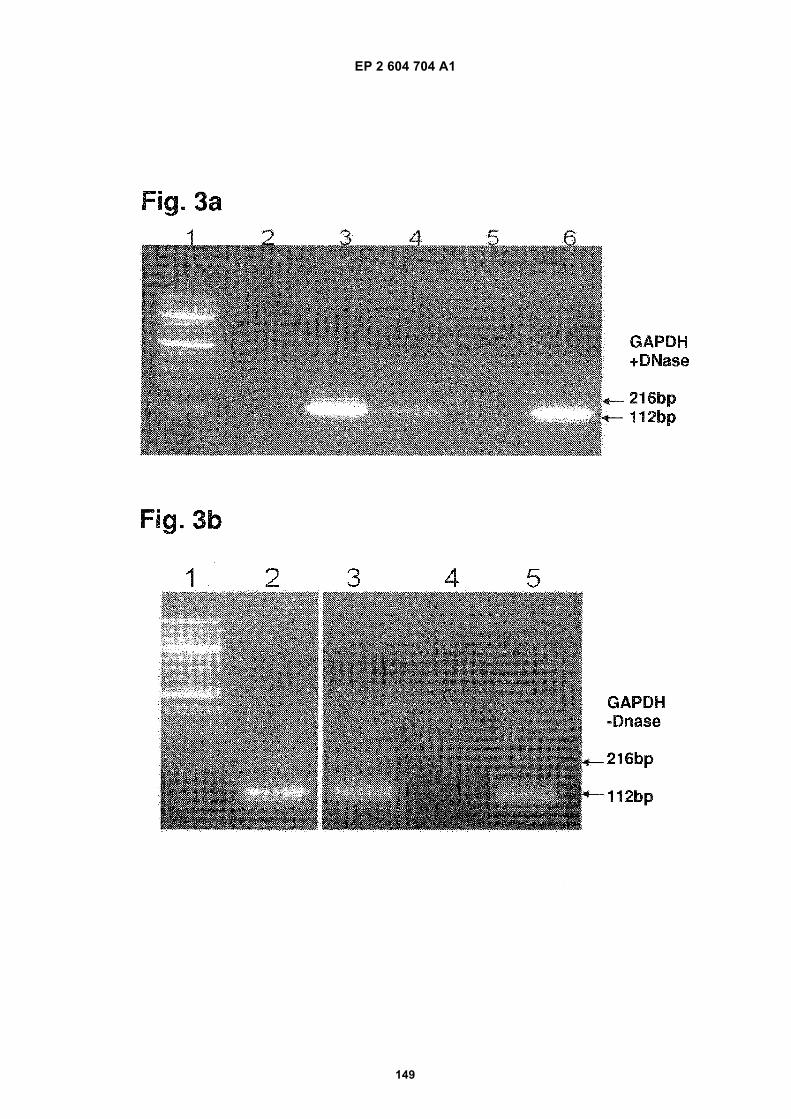
EP 2 604 704 A1
149
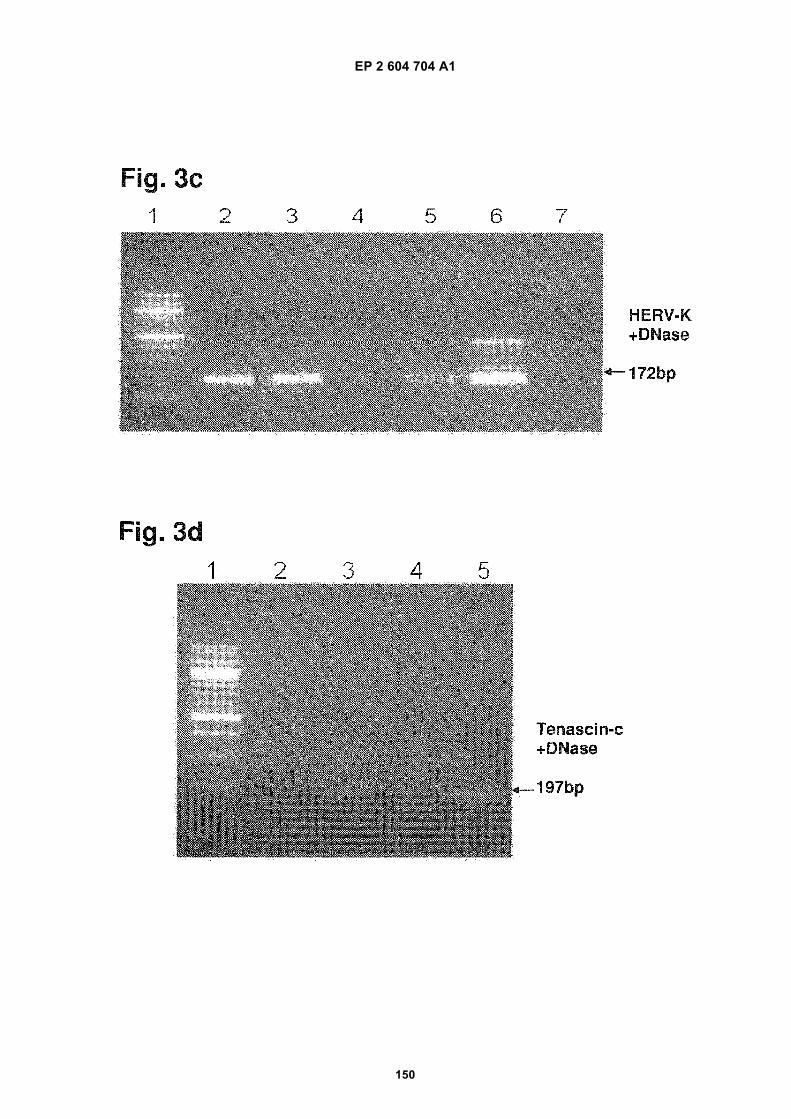
EP 2 604 704 A1
150
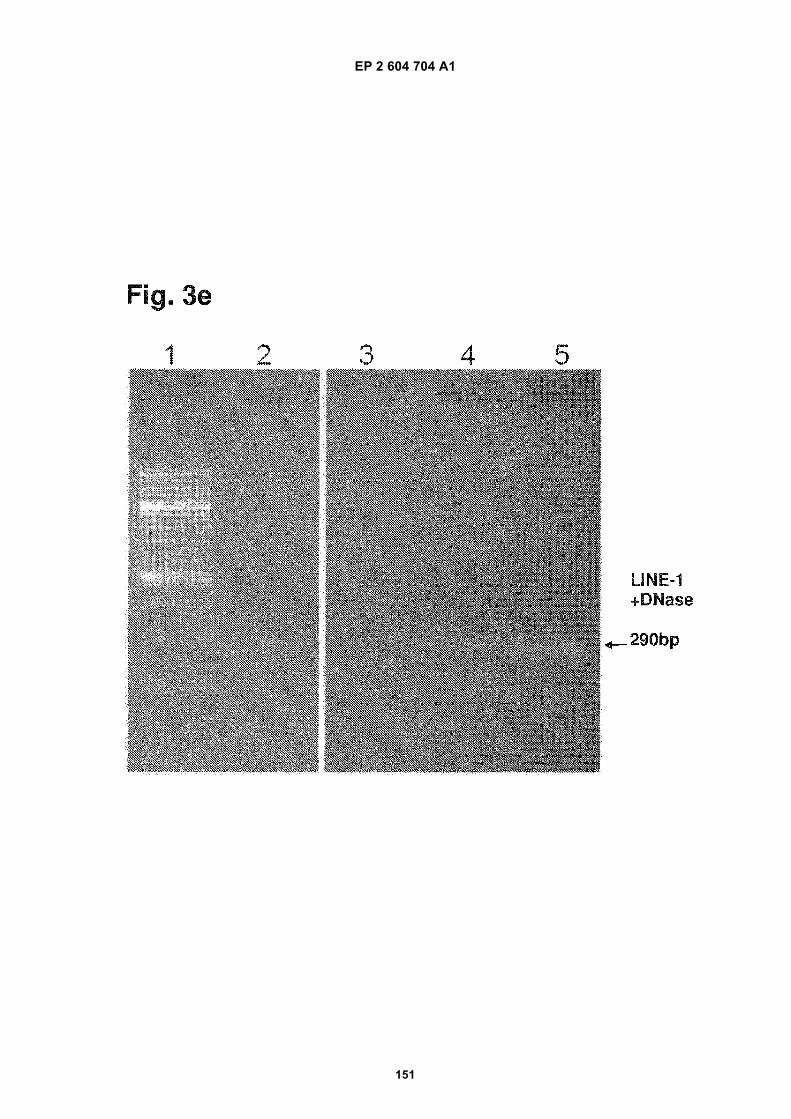
EP 2 604 704 A1
151
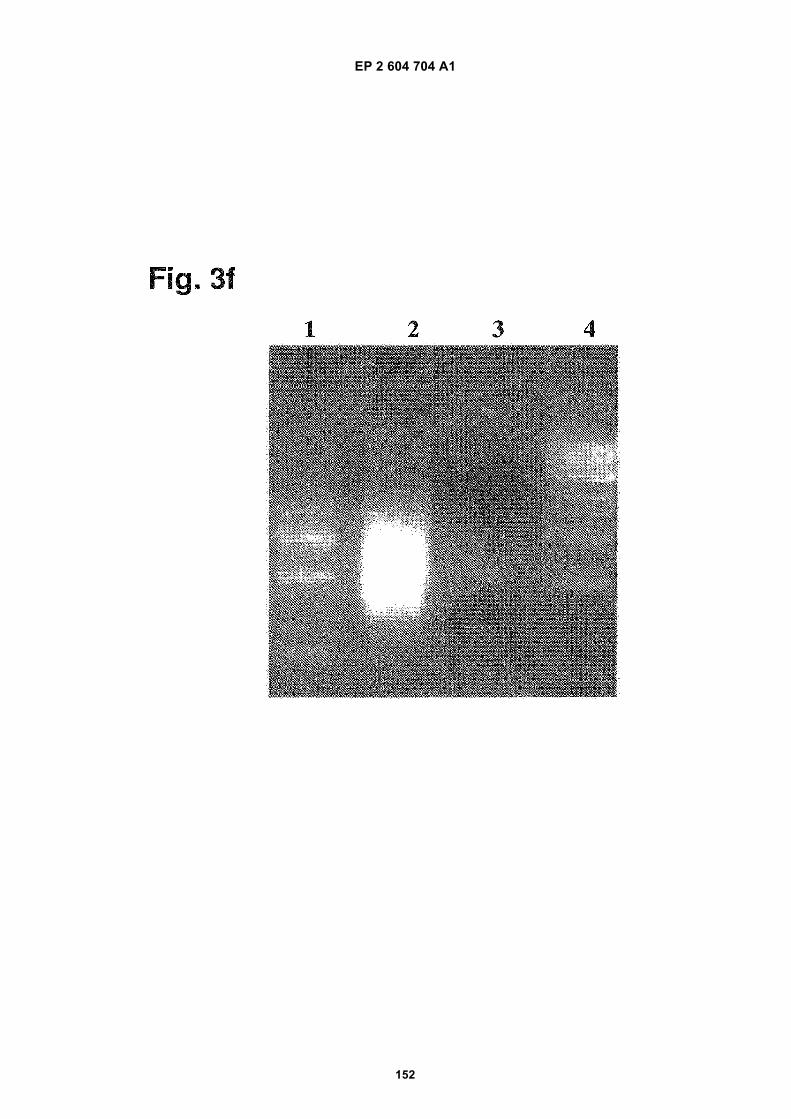
EP 2 604 704 A1
152
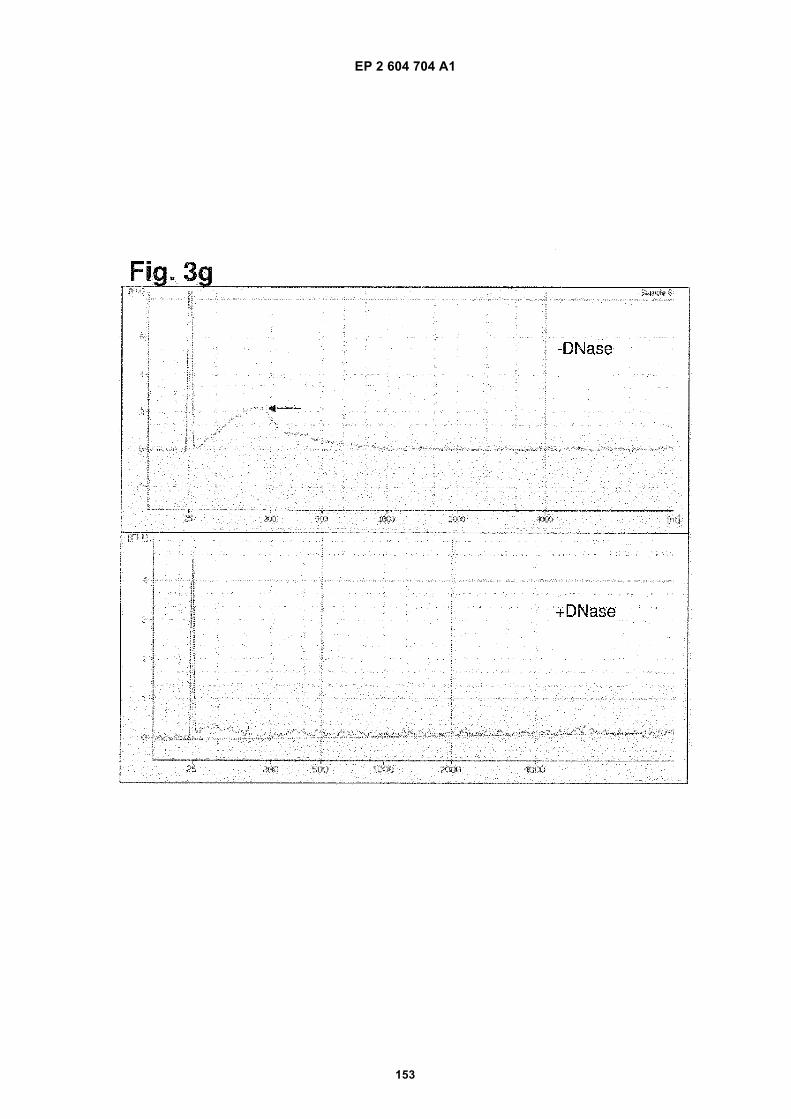
EP 2 604 704 A1
153
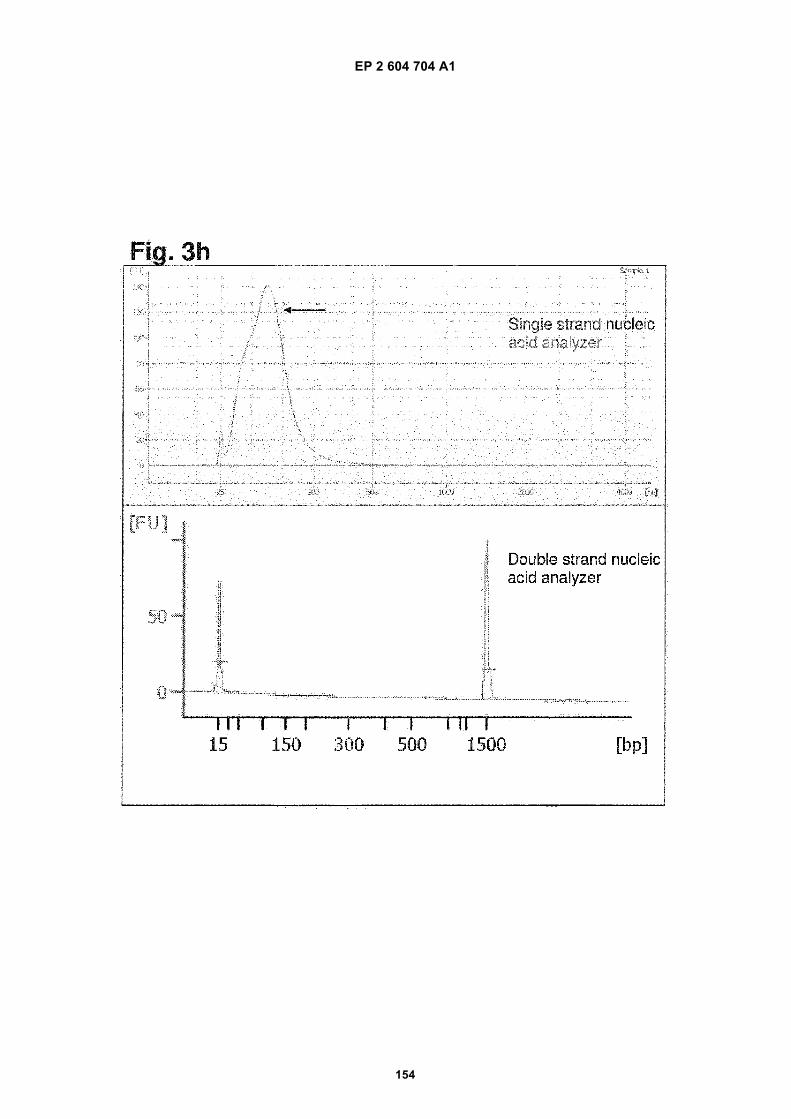
EP 2 604 704 A1
154
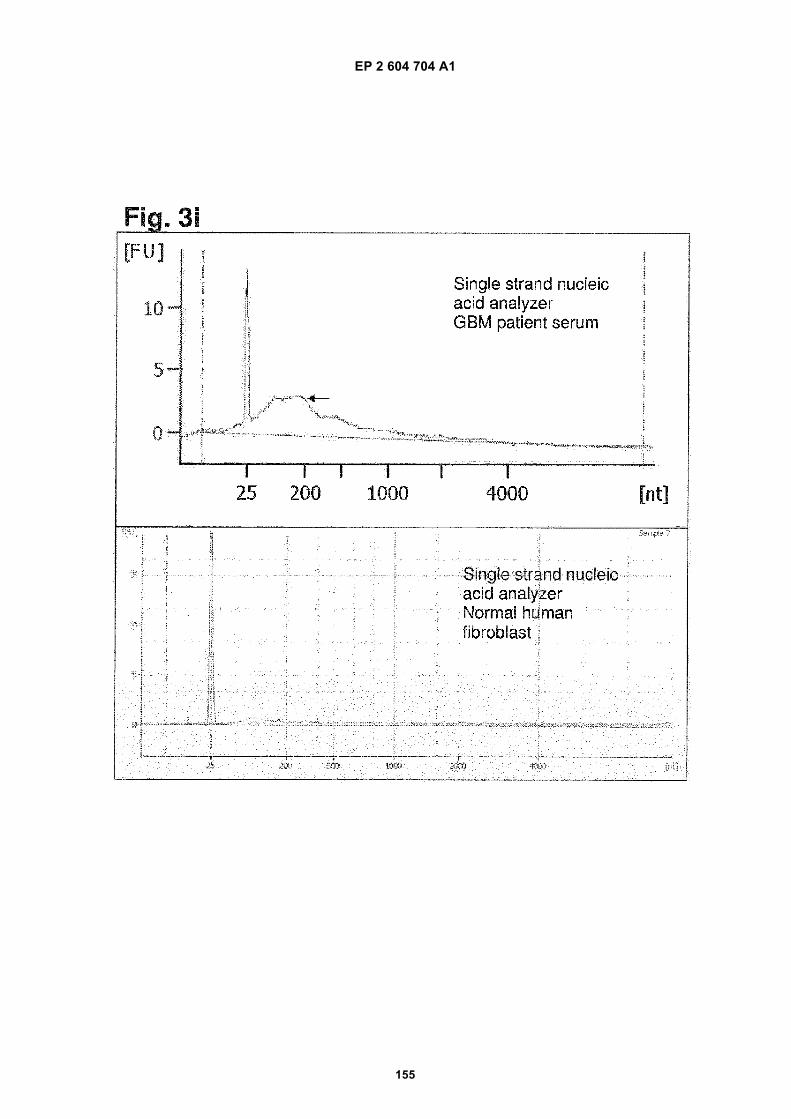
EP 2 604 704 A1
155
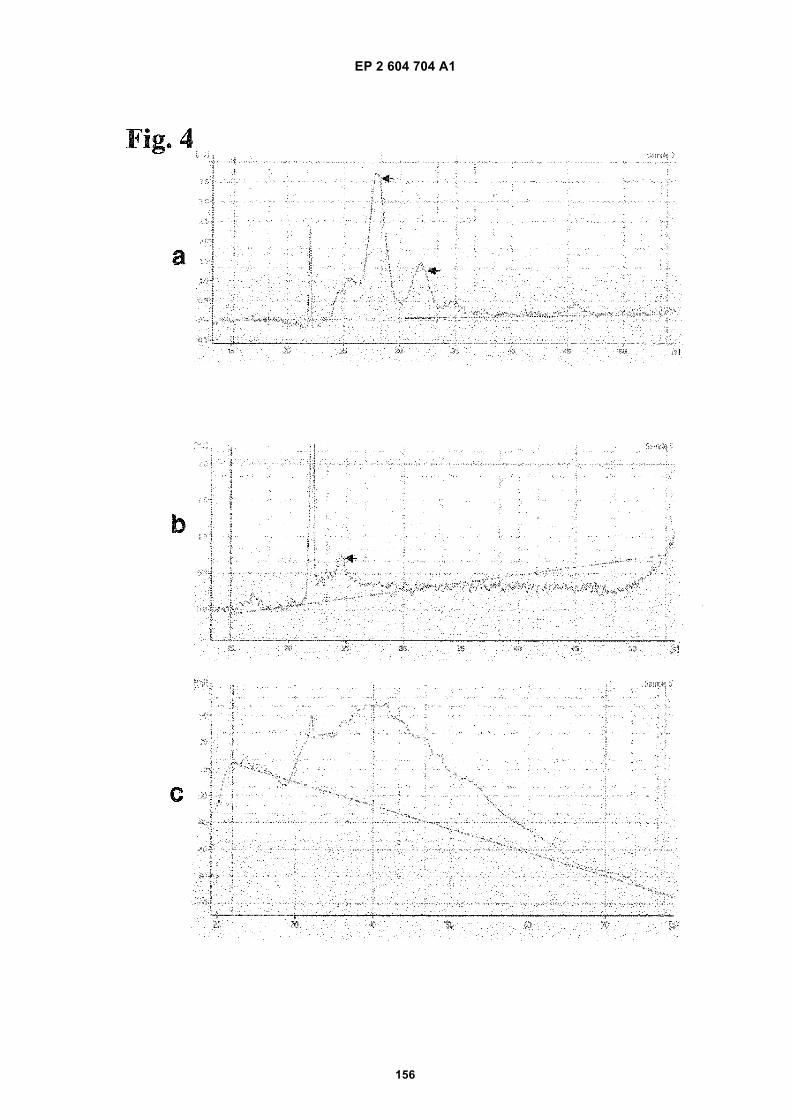
EP 2 604 704 A1
156
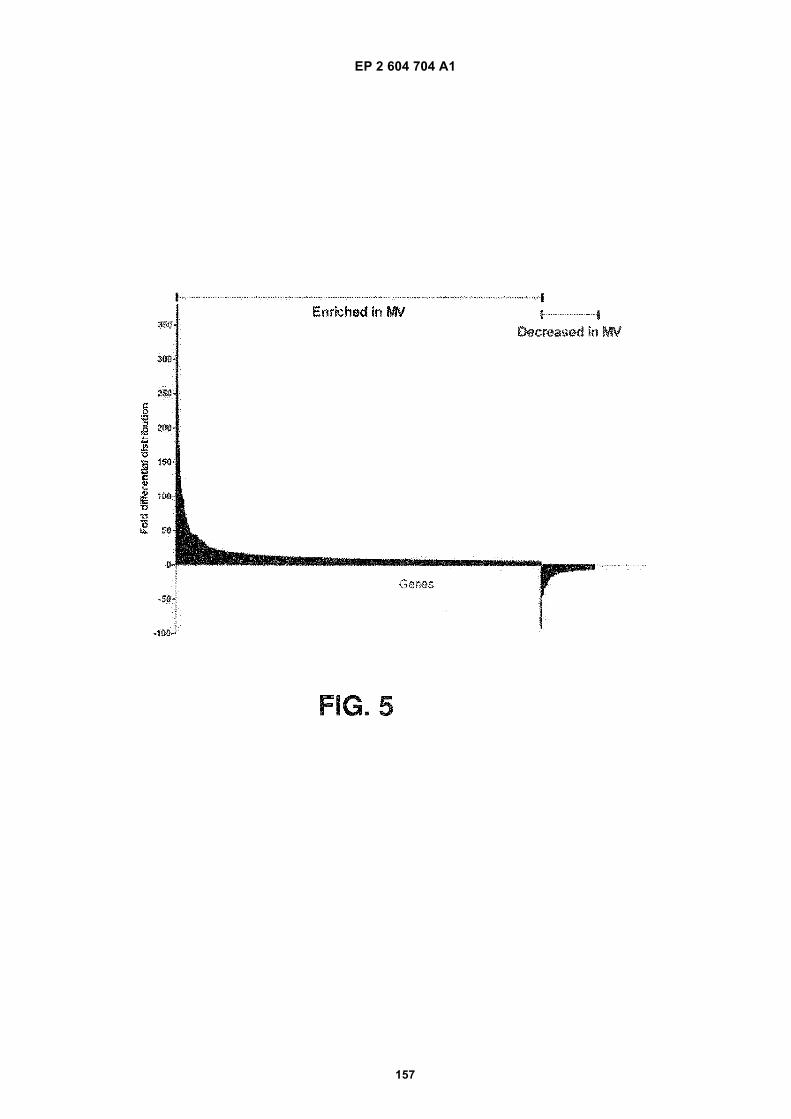
EP 2 604 704 A1
157
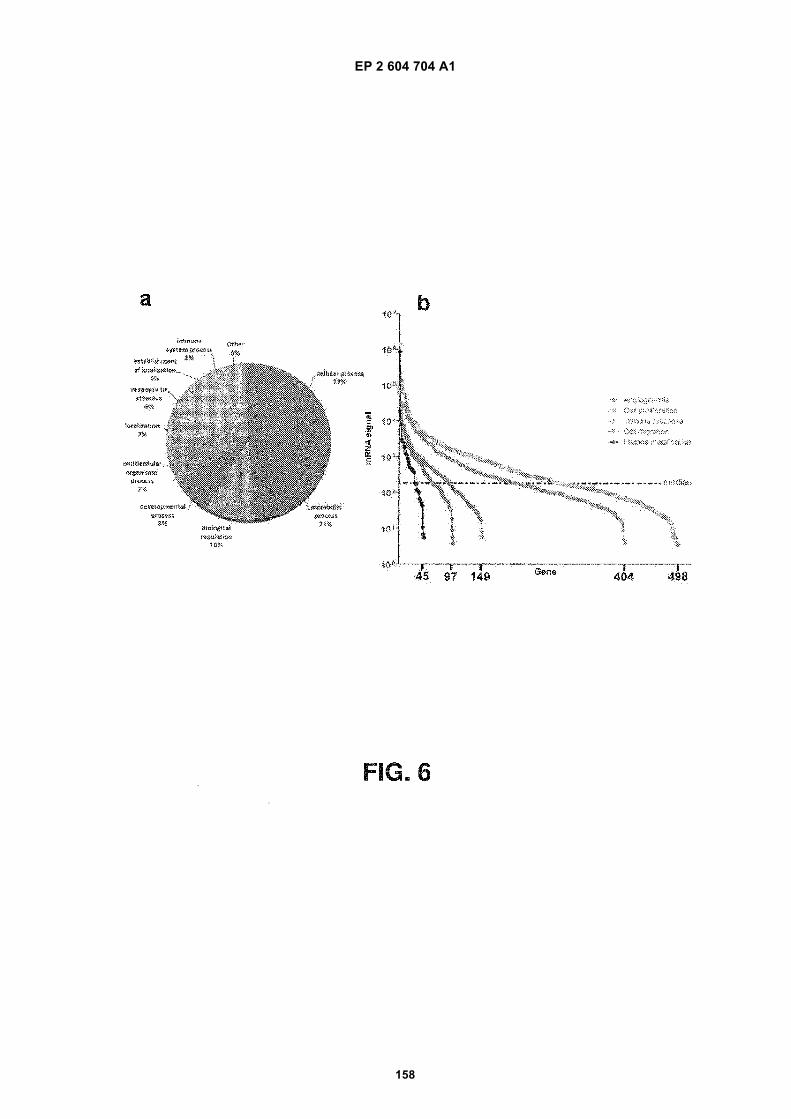
EP 2 604 704 A1
158
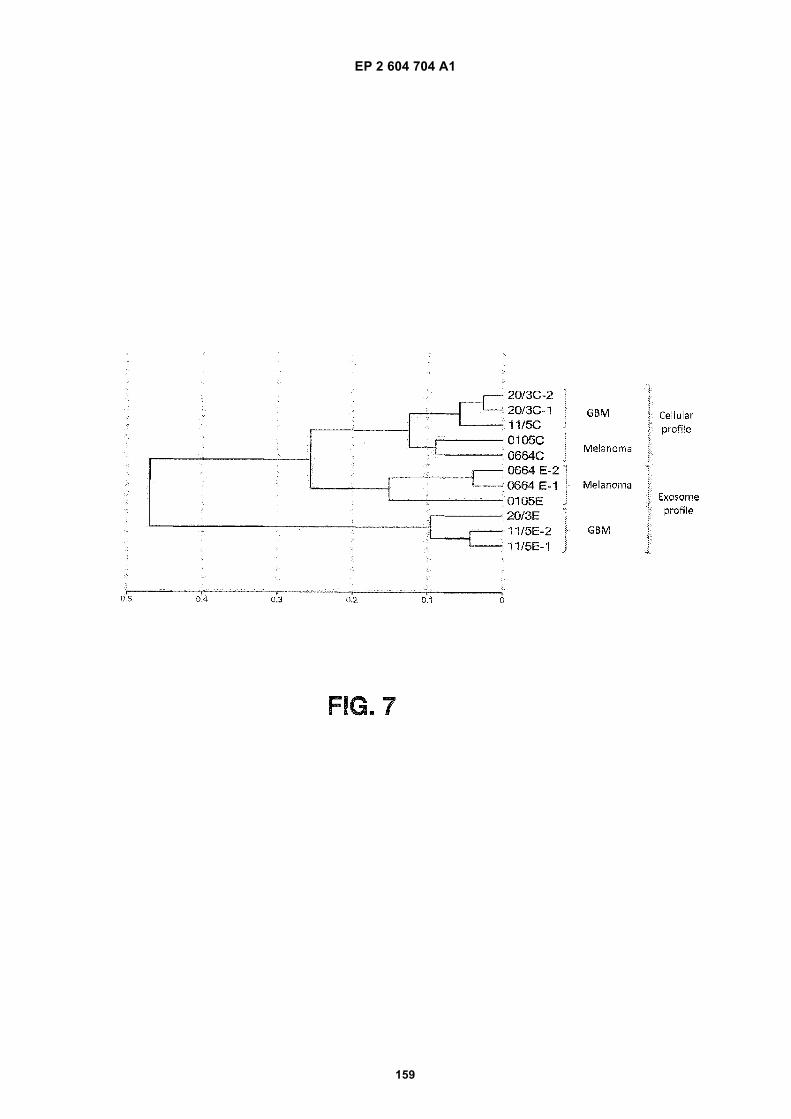
EP 2 604 704 A1
159
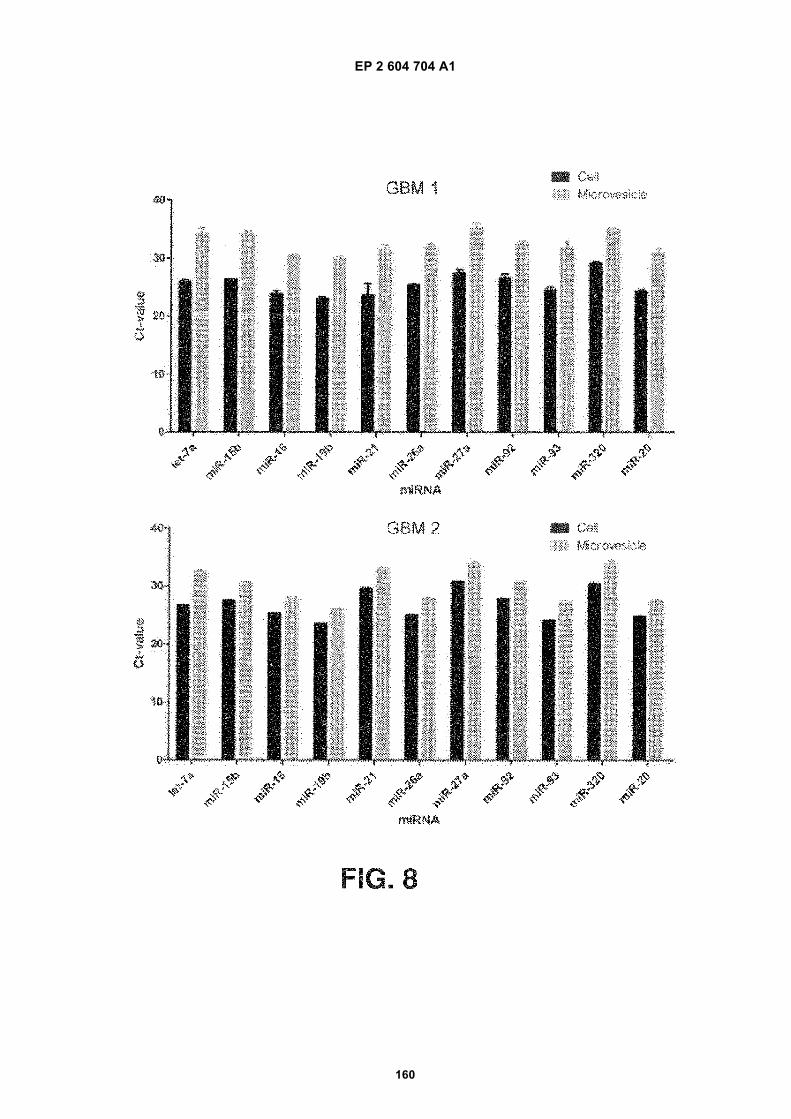
EP 2 604 704 A1
160
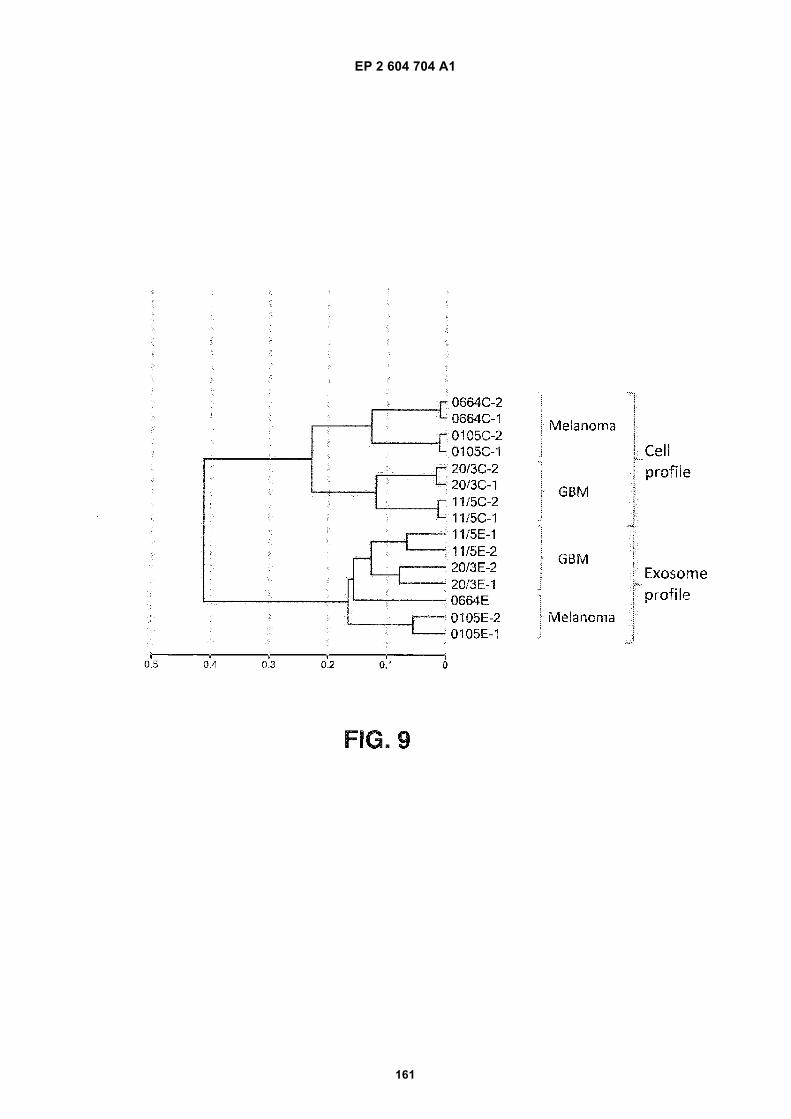
EP 2 604 704 A1
161
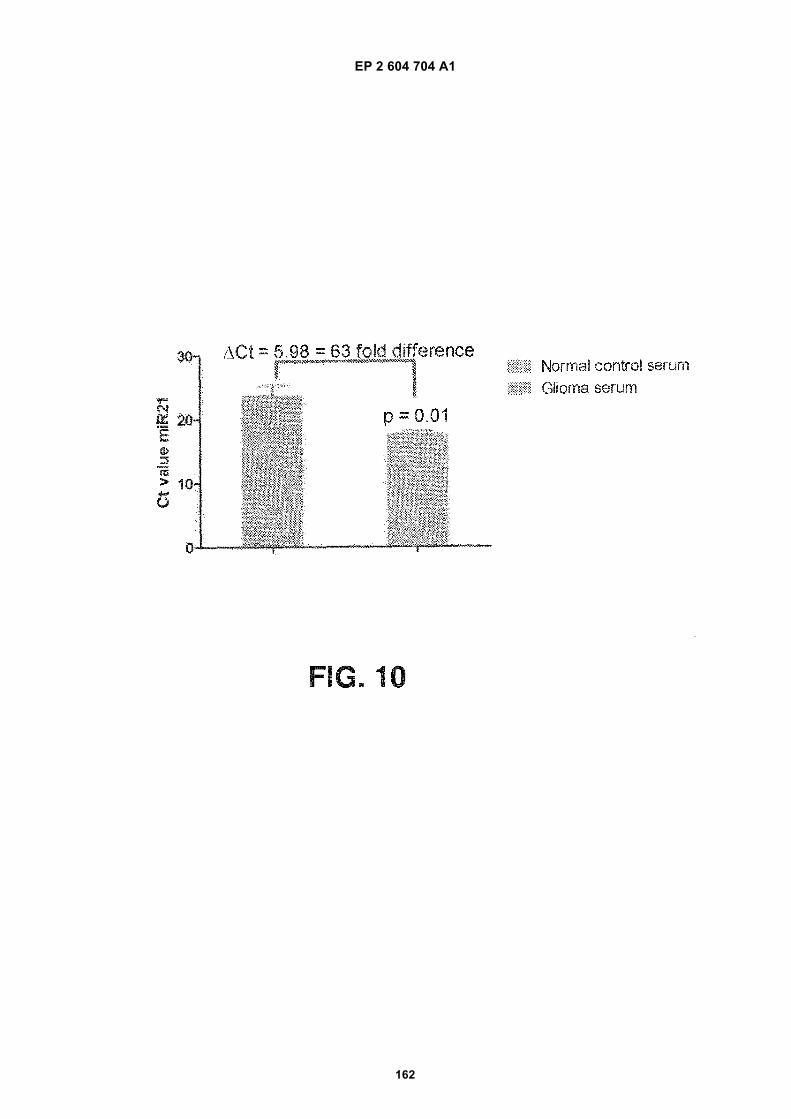
EP 2 604 704 A1
162
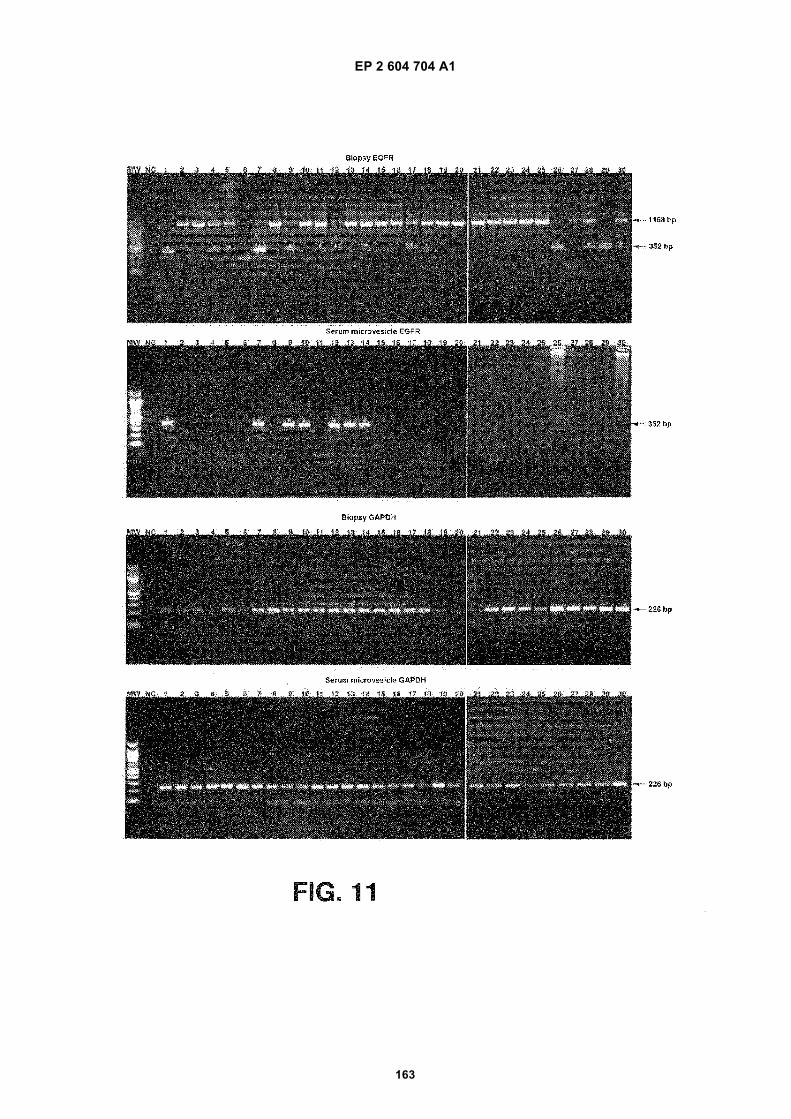
EP 2 604 704 A1
163
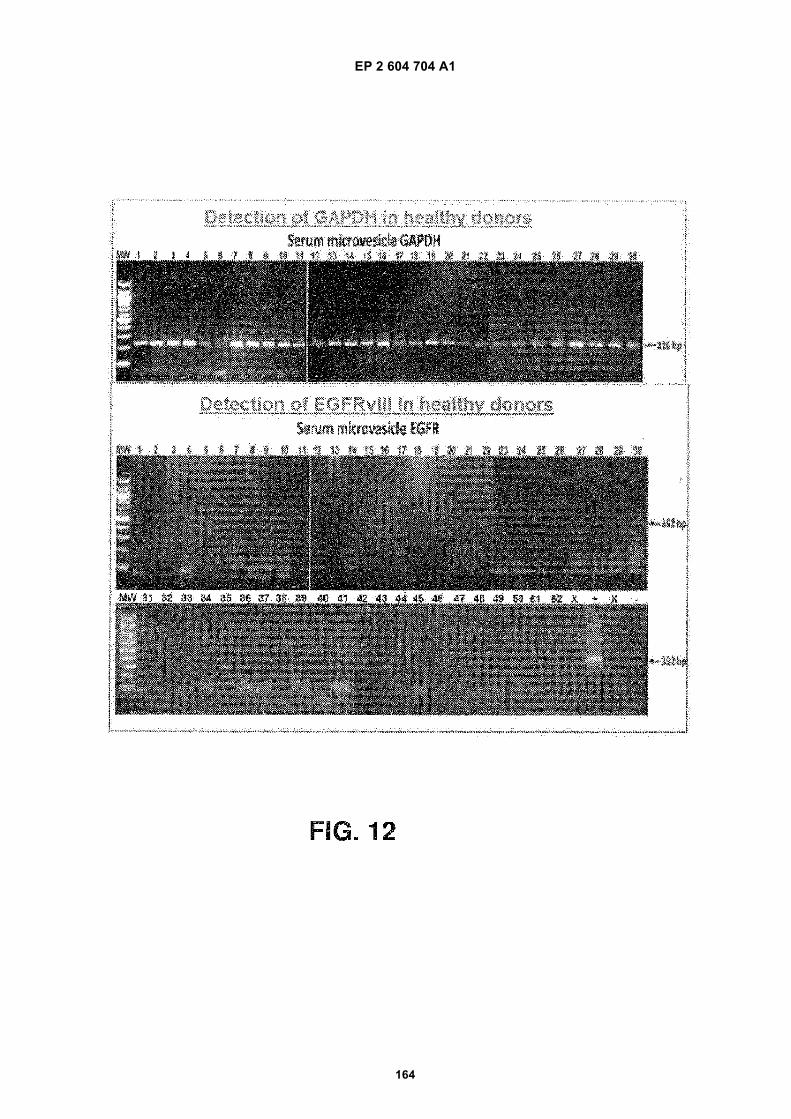
EP 2 604 704 A1
164
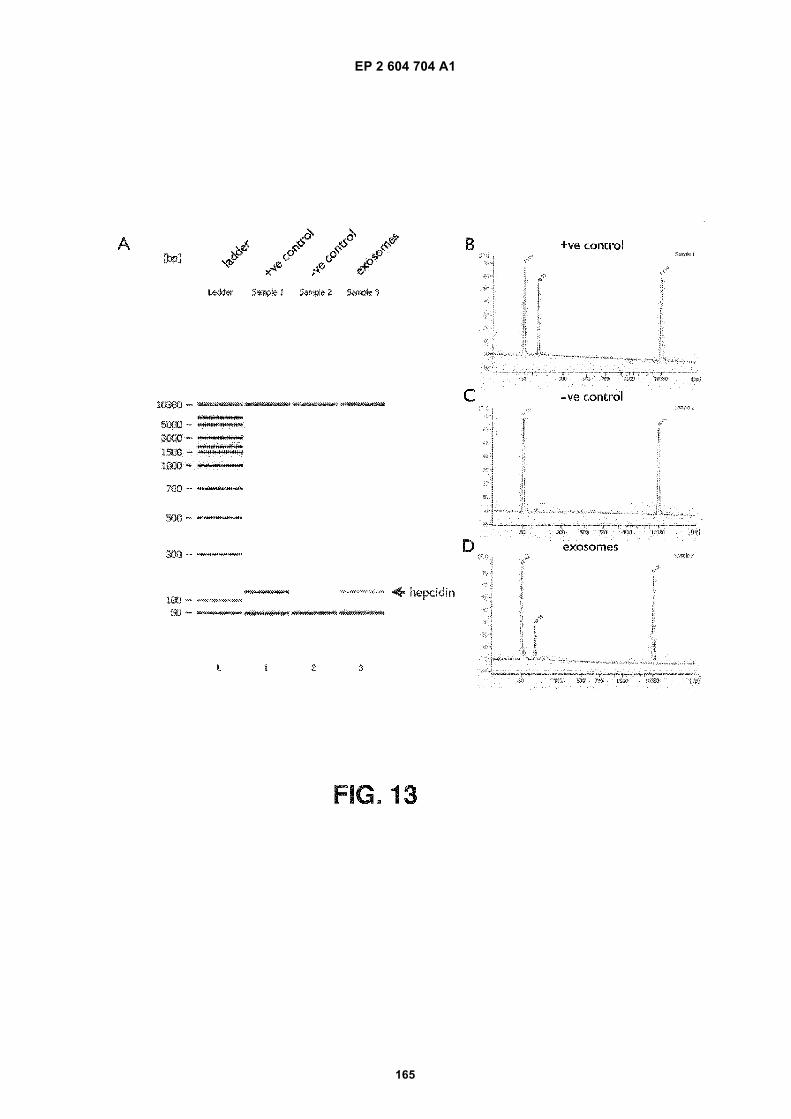
EP 2 604 704 A1
165
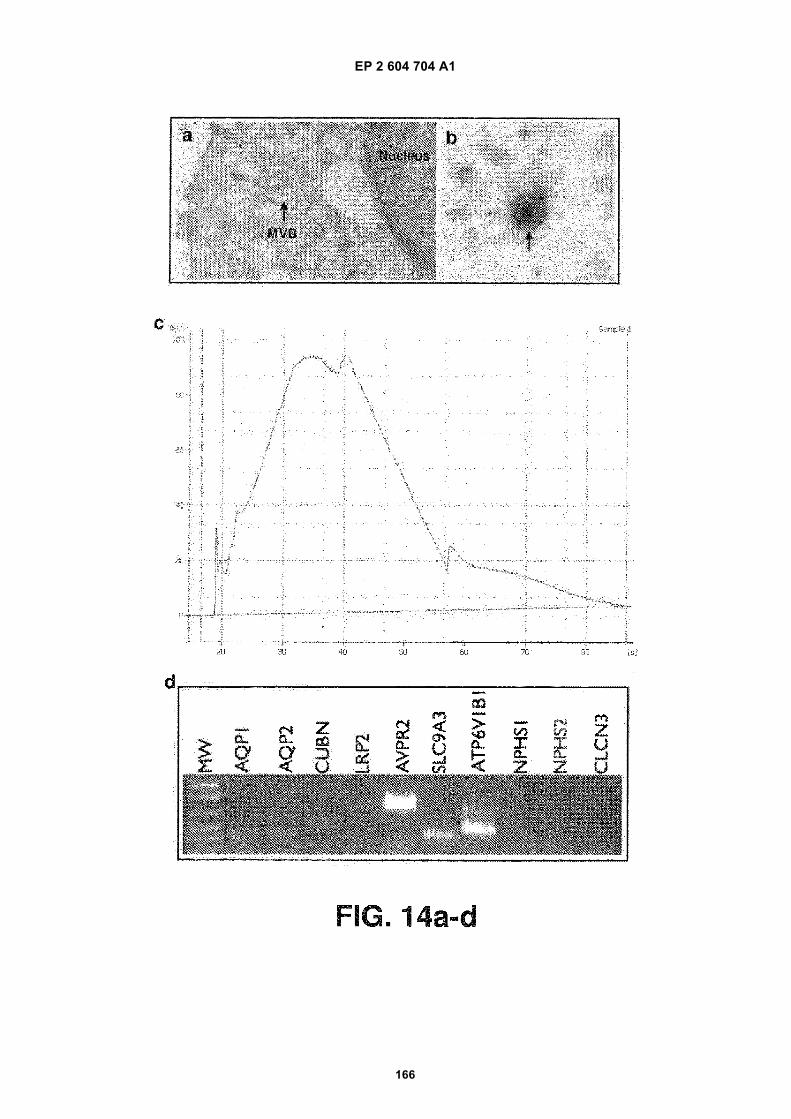
EP 2 604 704 A1
166
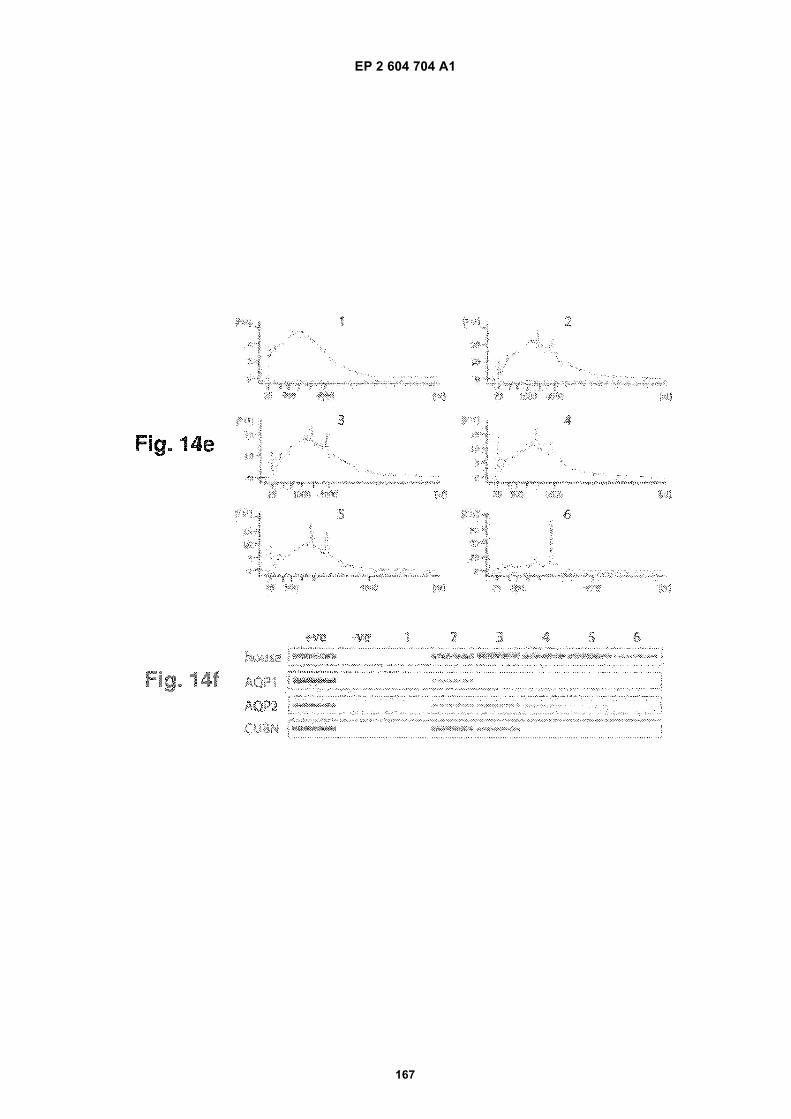
EP 2 604 704 A1
167
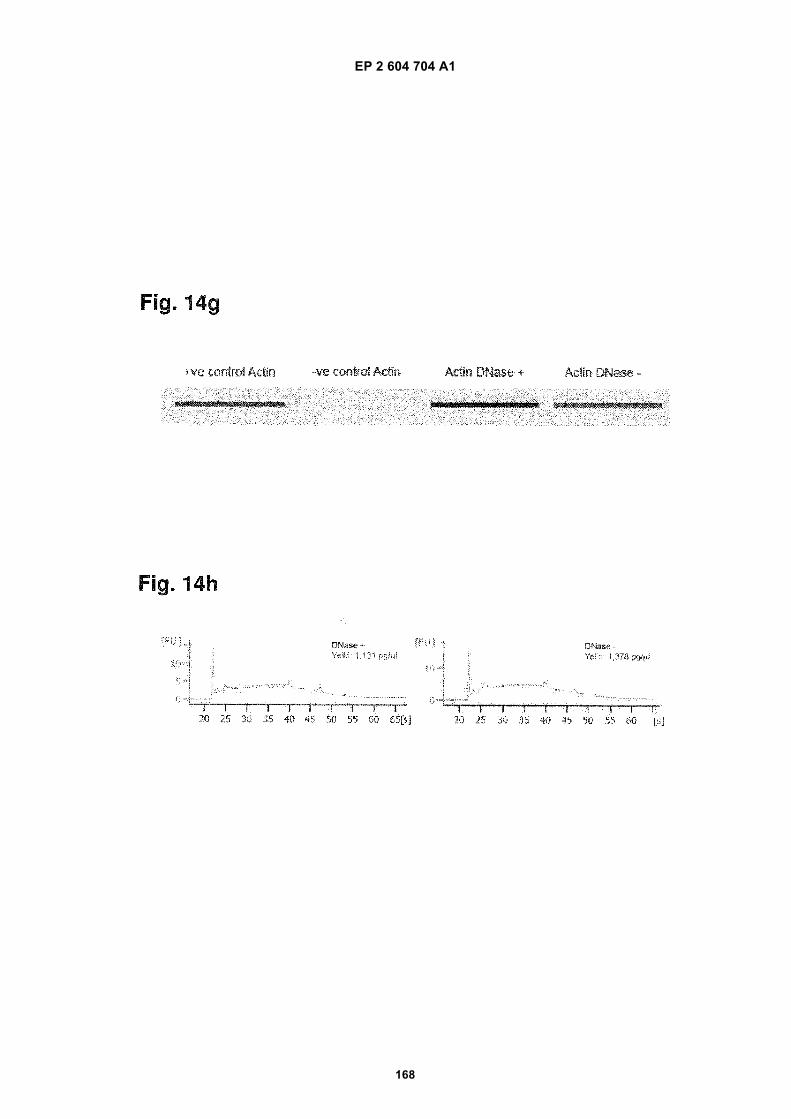
EP 2 604 704 A1
168
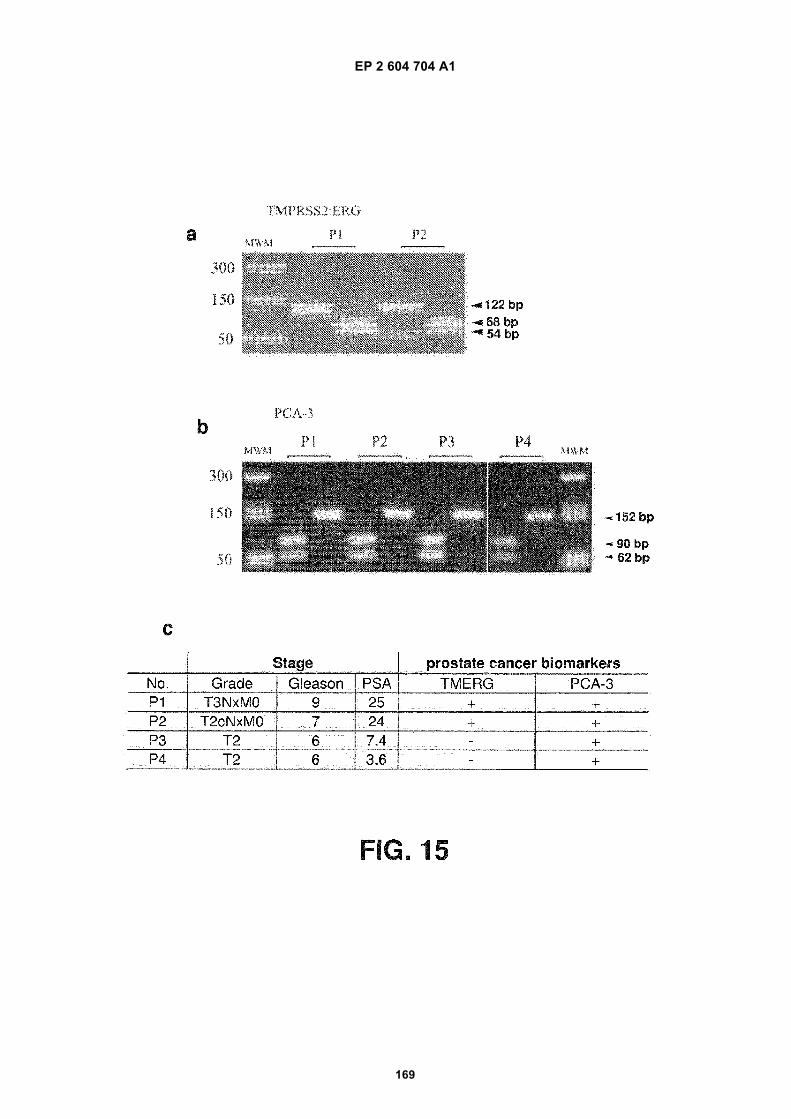
EP 2 604 704 A1
169
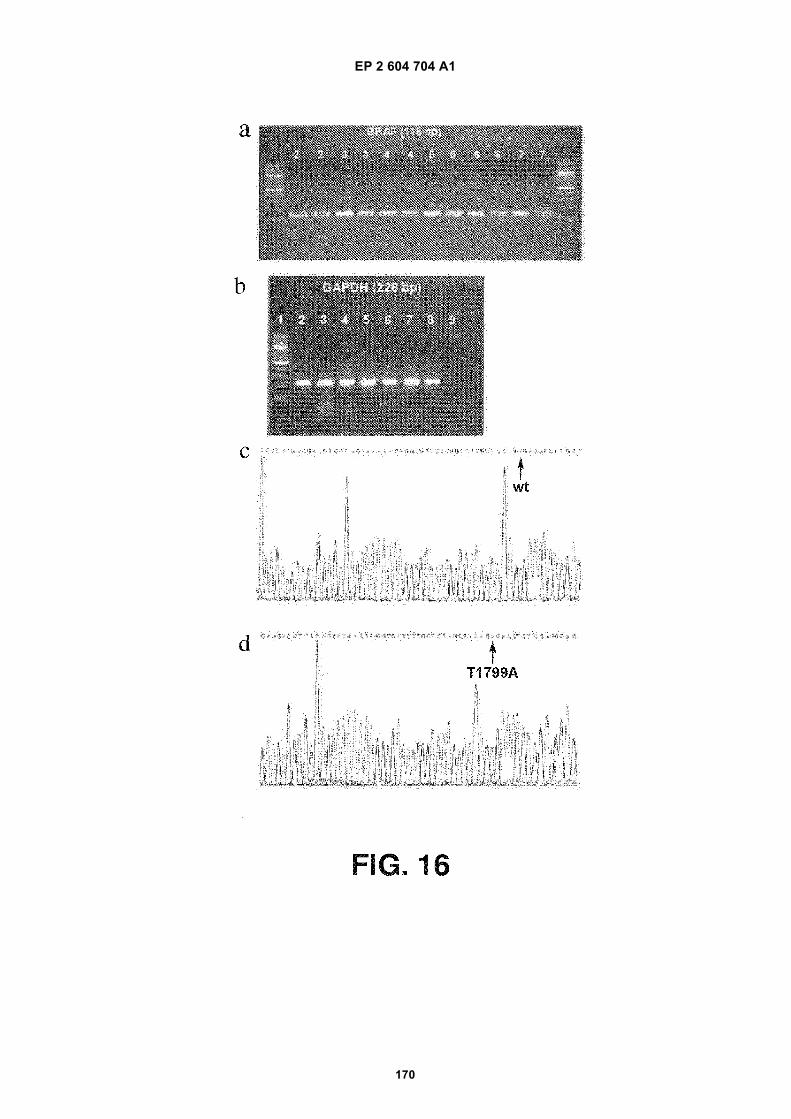
EP 2 604 704 A1
170
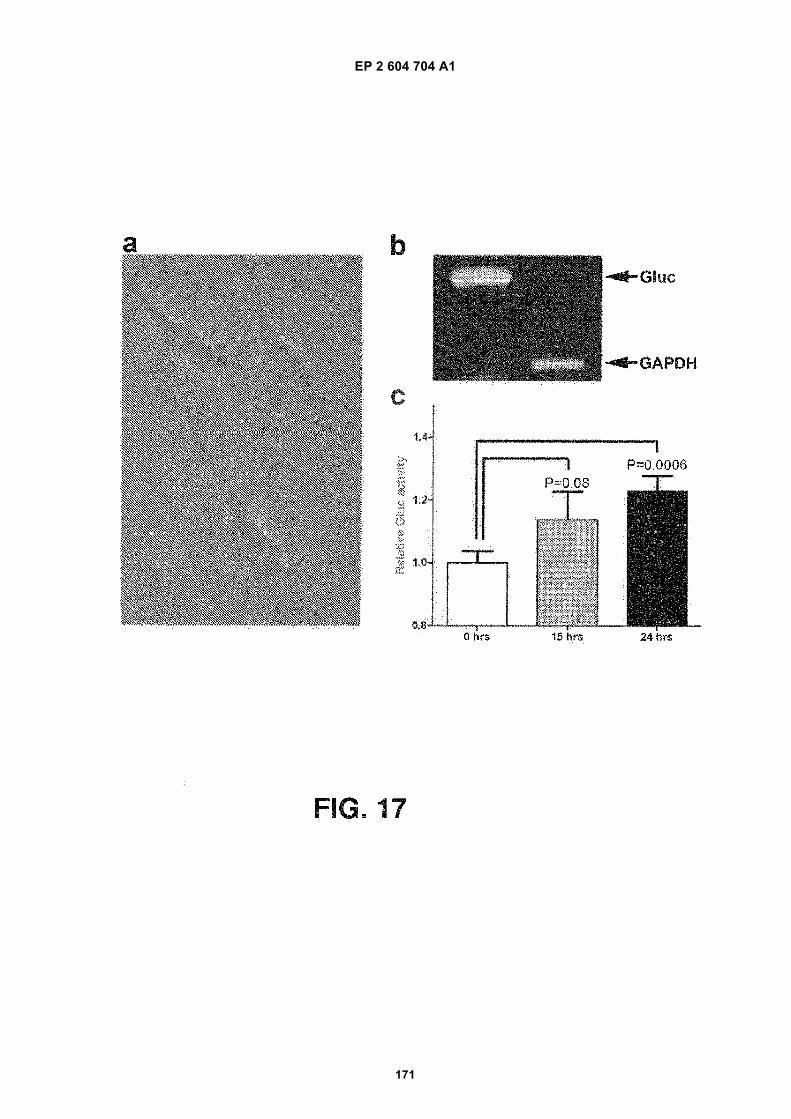
EP 2 604 704 A1
171
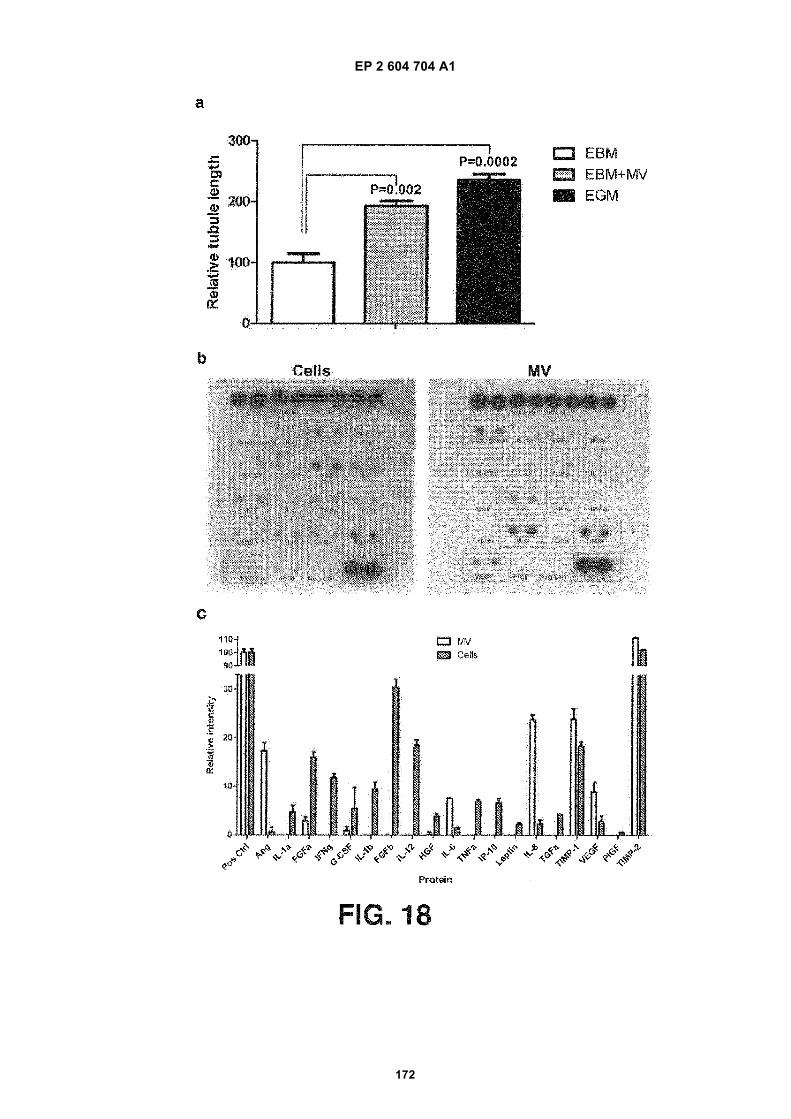
EP 2 604 704 A1
172
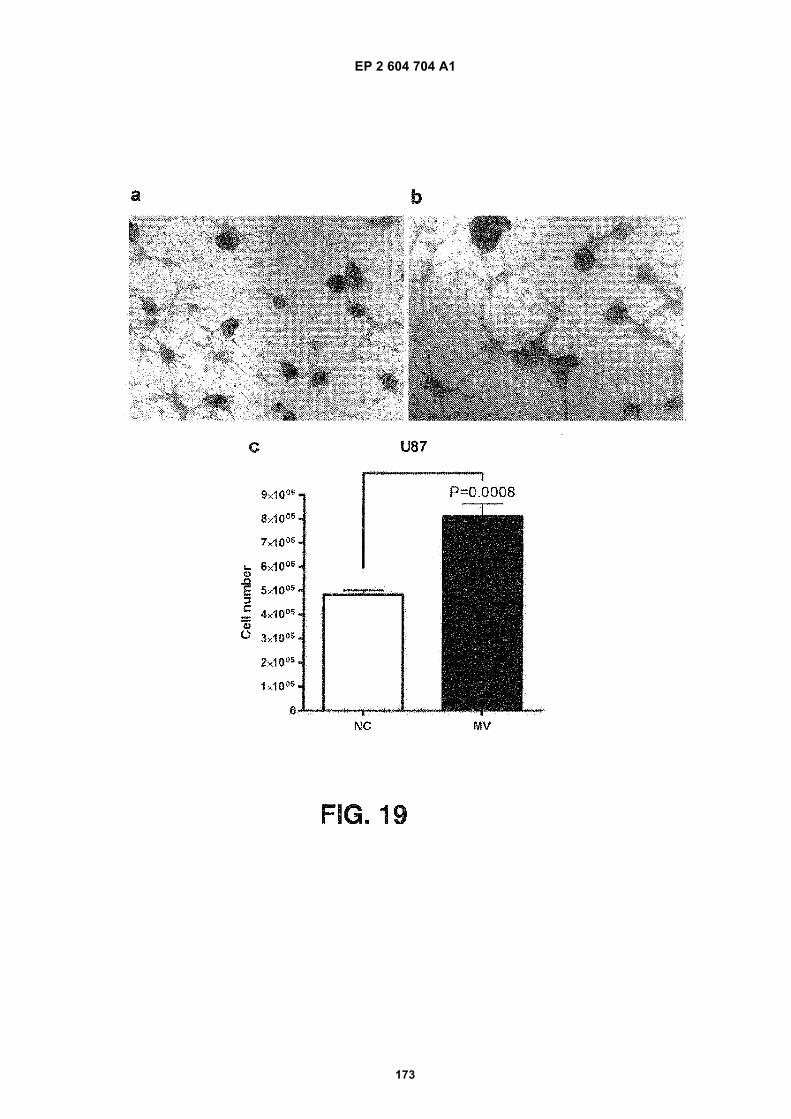
EP 2 604 704 A1
173
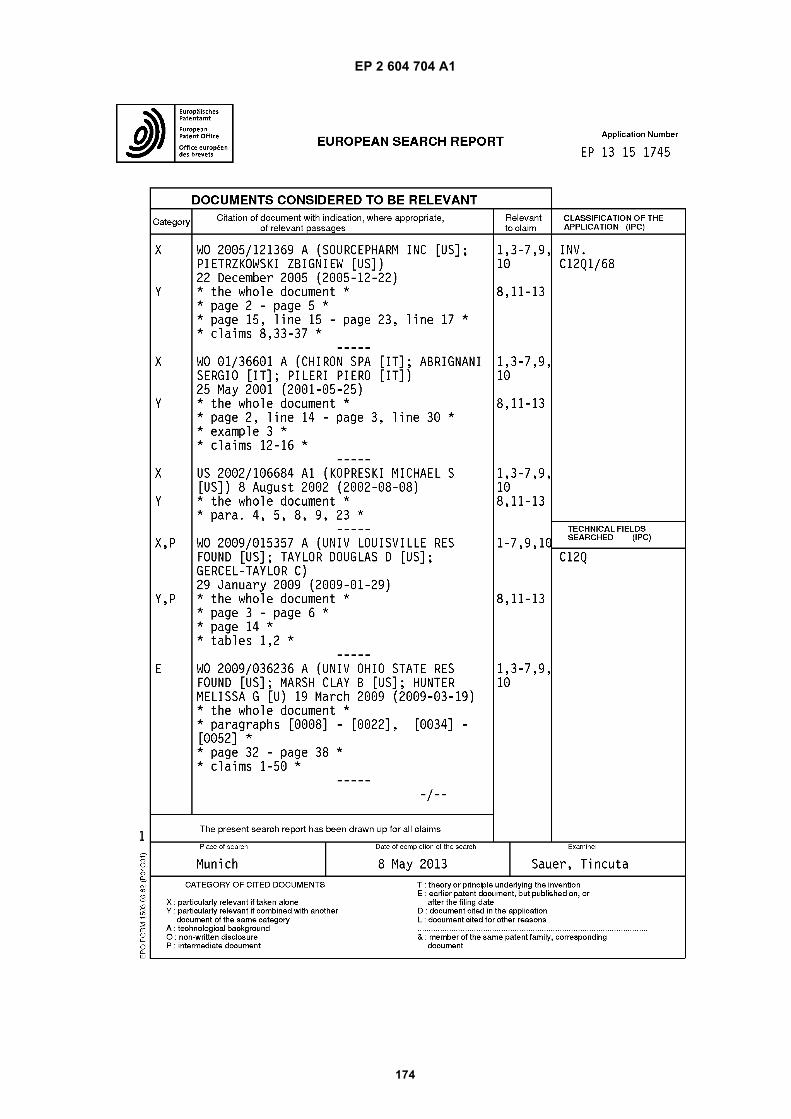
EP 2 604 704 A1
174
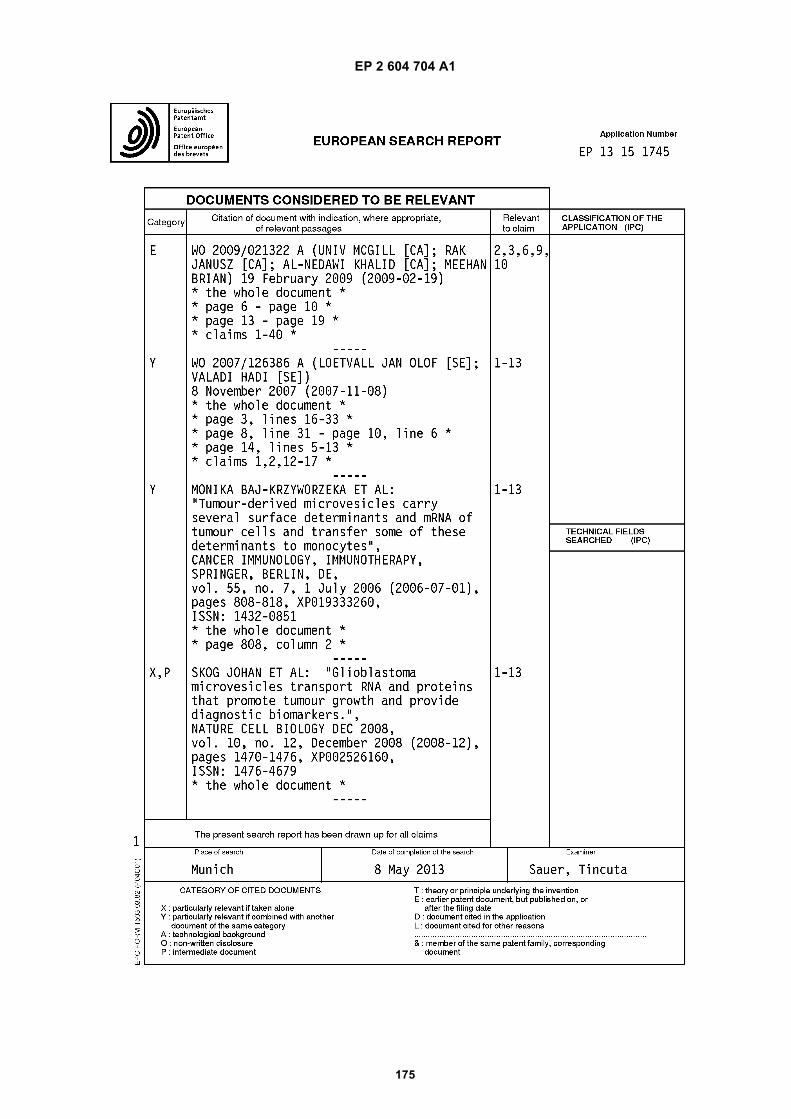
EP 2 604 704 A1
175
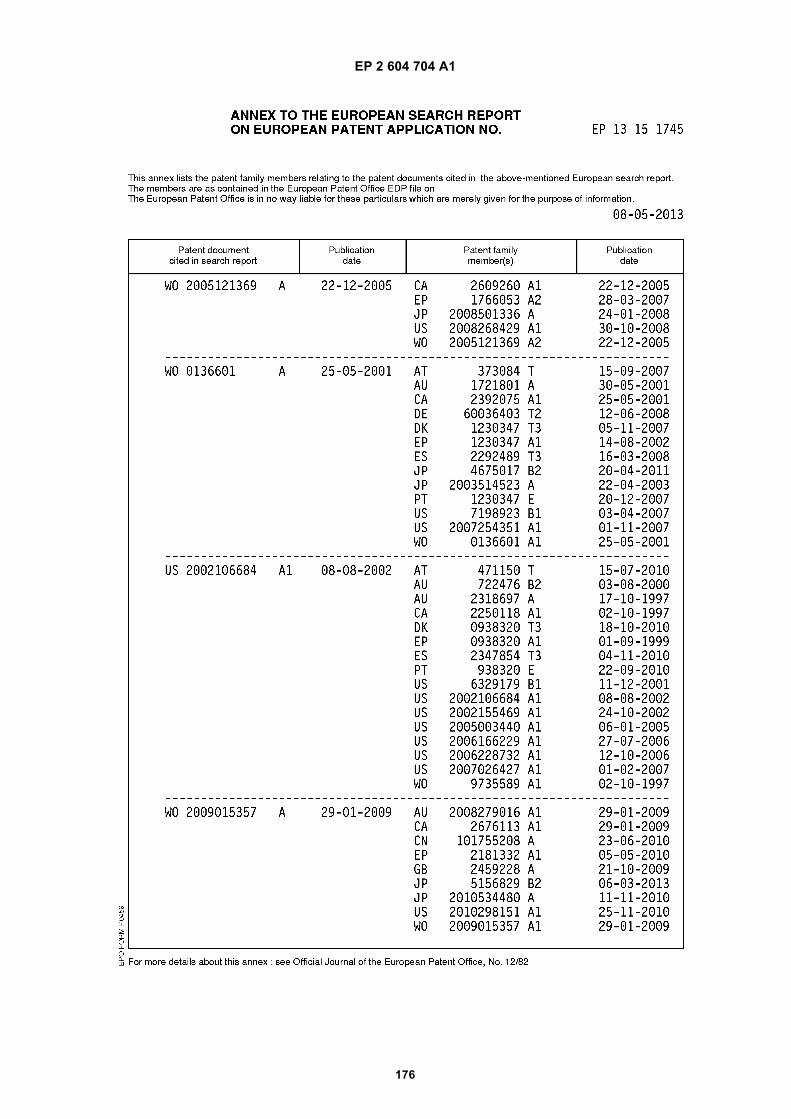
EP 2 604 704 A1
176
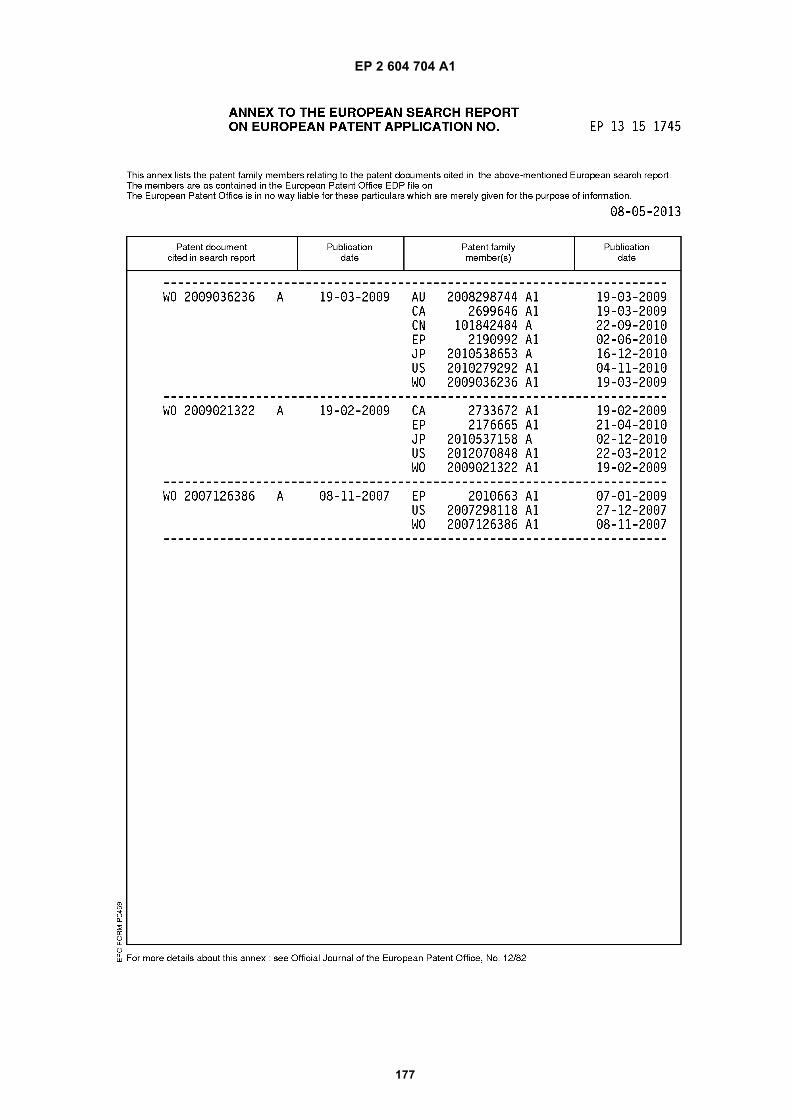
EP 2 604 704 A1
177
EP 2 604 704 A1
178
REFERENCES CITED IN THE DESCRIPTION
This list of references cited by the applicant is for the reader’s convenience only. It does not form part of the Europeanpatent document. Even though great care has been taken in compiling the references, errors or omissions cannot beexcluded and the EPO disclaims all liability in this regard.
Patent documents cited in the description
• US 61025536 B [0001]• US 61100293 B [0001]• US 6899863 B [0034]• US 6812023 B [0034]• US 7198923 B [0034] [0036]• US 5840867 A [0036]• US 5582981 A [0036]• WO 2003050290 A [0036]• US 6525154 B [0036]• US 7332553 B [0036]• US 7384589 B [0036]• US 5639606 A [0040]• US 5219727 A [0041]• US 5538871 A [0041]• US 5556773 A [0041]
• US 6913879 B [0044]• US 7364848 B [0044]• US 7378245 B [0044]• US 6893837 B [0044]• US 6004755 A [0044]• US 7186512 B [0044]• WO 2003023065 A [0044]• US 6994960 B [0044]• US 7074563 B [0044]• US 7198893 B [0044]• US 5639611 A [0044]• WO 2006113590 A [0044]• WO 0004194 A [0053] [0054]• US 5547859 A [0054]• US 20060147959 A [0060]
Non-patent literature cited in the description
• Molecular Cloning: A Laboratory Manual. Cold SpringHarbor Laboratory, 15 January 2001, vol. 3 [0058]
• PCR Basics: From Background to Bench. SpringerVerlag, 15 October 2000 [0058]
• ABRAVAYA, K. ; J.J. CARRINO ; S. MULDOON ;H.H. LEE. Detection of point mutations with a modi-fied ligase chain reaction (Gap-LCR. Nucleic AcidsRes., vol. 23, 675-82 [0165]
• AL-NEDAWI, K. ; B. MEEHAN ; J. MICALLEF ; V.LHOTAK ; L. MAY ; A. GUHA ; J. RAK. Intercellulartransfer of the oncogenic receptor EGFRvIII by mi-crovesicles derived from tumour cells. Nat Cell Biol.,2008, vol. 10, 619-24 [0165]
• BAJ-KRZYWORZEKA, M. ; R. SZATANEK ; K.WEGLARCZYK ; J. BARAN ; B. URBANOWICZ ;P. BRANSKI ; M.Z. RATAJCZAK ; M. ZEMBALA.Tumour-derived microvesicles carry several surfacedeterminants and mRNA of tumour cells and transfersome of these determinants to monocytes. CancerImmunol Immunother, 2006, vol. 55, 808-18 [0165]
• BALZAR, M. ; M.J. WINTER ; C.J. DE BOER ; S.V.LITVINOV. The biology of the 17-1A antigen(Ep-CAM. J Mol Med., 1999, vol. 77, 699-712 [0165]
• BOOTH, A.M. ; Y. FANG ; J.K. FALLON ; J.M.YANG ; J.E. HILDRETH ; S.J. GOULD. Exosomesand HIV Gag bud from endosome-like domains of theT cell plasma membrane. J Cell Biol., 2006, vol. 172,923-35 [0165]
• BOSSI, A. ; F. BONINI ; A.P. TURNER ; S.A. PILET-SKY. Molecularly imprinted polymers for the recog-nition of proteins: the state of the art. Biosens Bioe-lectron, 2007, vol. 22, 1131-7 [0165]
• BROOKES, M.J. ; N.K. SHARMA ; C. TSELEPIS ;T.H. IQBAL. Serum pro-hepcidin: measuring activehepcidin or a non-functional precursor?. Gut, 2005,vol. 54, 169-70 [0165]
• CARMELIET, P. ; R.K. JAIN. Angiogenesis in cancerand other diseases. Nature, 2000, vol. 407, 249-57[0165]
• CARPENTER, G. Receptors for epidermal growthfactor and other polypeptide mitogens. Annu Rev Bi-ochem., 1987, vol. 56, 881-914 [0165]
• CHANG, H.R. ; W.H. KUO ; Y.S. HSIEH ; S.F.YANG ; C.C. LIN ; M.L. LEE ; J.D. LIAN ; S.C. CHU.Circulating matrix metalloproteinase-2 is associatedwith cystatin C level, posttransplant duration, and di-abetes mellitus in kidney transplant recipients. TranslRes., 2008, vol. 151, 217-23 [0165]
• CHAPUT, N. ; J. TAIEB ; F. ANDRE ; L. ZITVOGEL.The potential of exosomes in immunotherapy. ExpertOpin Biol Ther., 2005, vol. 5, 737-47 [0165]
• CHERUVANKY, A. ; H. ZHOU ; T. PISITKUN ; J.B.KOPP ; M.A. KNEPPER ; P.S. YUEN ; R.A. STAR.Rapid isolation of urinary exosomal biomarkers usinga nanomembrane ultrafiltration concentrator. AmJPhysiol Renal Physiol., 2007, vol. 292, F1657-61[0165]
EP 2 604 704 A1
179
• CLAYTON, A. ; J.P. MITCHELL ; J. COURT ; M.D.MASON ; Z. TABI. Human tumor-derived exosomesselectively impair lymphocyte responses to inter-leukin-2. Cancer Res., 2007, vol. 67, 7458-66 [0165]
• COTTON, R.G. ; N.R. RODRIGUES ; R.D. CAMP-BELL. Reactivity of cytosine and thymine in sin-gle-base-pair mismatches with hydroxylamine andosmium tetroxide and its application to the study ofmutations. Proc Natl Acad Sci USA., 1988, vol. 85,4397-401 [0165]
• DELVES, G.H. ; A.B. STEWART ; A.J. COOPER ;B.A. LWALEED. Prostasomes, angiogenesis, andtissue factor. Semin Thromb Hemost., 2007, vol. 33,75-9 [0165]
• DIEHL, F. ; K. SCHMIDT ; M.A. CHOTI ; K.ROMANS ; S. GOODMAN ; M. LI ; K. THORNTON ;N. AGRAWAL ; L. SOKOLL ; S.A. SZABO. Circu-lating mutant DNA to assess tumor dynamics. NatMed., 2008, vol. 14, 985-90 [0165]
• FIORENTINO, F. ; M.C. MAGLI ; D. PODINI ; A.P.FERRARETTI ; A. NUCCITELLI ; N. VITALE ; M.BALDI ; L. GIANAROLI. The minisequencing meth-od: an alternative strategy for preimplantation geneticdiagnosis of single gene disorders. Mol Hum Reprod.,2003, vol. 9, 399-410 [0165]
• FISCHER, S.G. ; L.S. LERMAN. Length-independ-ent separation of DNA restriction fragments in two-di-mensional gel electrophoresis. Cell, 1979, vol. 16,191-200 [0165]
• FISCHER, S.G. ; L.S. LERMAN. Two-dimensionalelectrophoretic separation of restriction enzyme frag-ments of DNA. Methods Enzymol., 1979, vol. 68,183-91 [0165]
• FURNARI, F.B. ; T. FENTON ; R.M. BACHOO ; A.MUKASA ; J.M. STOMMEL ; A. STEGH ; W.C.HAHN ; K.L. LIGON ; D.N. LOUIS ; C. BRENNAN.Malignant astrocytic glioma: genetics, biology, andpaths to treatment. Genes Dev., 2007, vol. 21,2683-710 [0165]
• GABRILOVICH, D.I. Molecular mechanisms andtherapeutic reversal of immune suppression in can-cer. Curr Cancer Drug Targets, 2007, vol. 7, 1 [0165]
• GEISS, G.K. ; R.E. BUMGARNER ; B. BIRDITT ; T.DAHL ; N. DOWIDAR ; D.L. DUNAWAY ; H.P.FELL ; S. FERREE ; R.D. GEORGE ; T. GROGAN.Direct multiplexed measurement of gene expressionwith color-coded probe pairs. Nat Biotechnol., 2008,vol. 26, 317-25 [0165]
• GOESSL, C. ; H. KRAUSE ; M. MULLER ; R.HEICAPPELL ; M. SCHRADER ; J.SACHSINGER ; K. MILLER. Fluorescent methyla-tion-specific polymerase chain reaction forDNA-based detection of prostate cancer in bodily flu-ids. Cancer Res., 2000, vol. 60, 5941-5 [0165]
• GONZALGO, M.L. ; M. NAKAYAMA ; S.M. LEE ;A.M. DE MARZO ; W.G. NELSON. Detection ofGSTP1 methylation in prostatic secretions usingcombinatorial MSP analysis. Urology, 2004, vol. 63,414-8 [0165]
• GORMALLY, E. ; E. CABOUX ; P. VINEIS ; P. HAI-NAUT. Circulating free DNA in plasma or serum asbiomarker of carcinogenesis: practical aspects andbiological significance. Mutat Res., 2007, vol. 635,105-17 [0165]
• GRECO, V. ; M. HANNUS ; S. EATON. Argosomes:a potential vehicle for the spread of morphogensthrough epithelia. Cell, 2001, vol. 106, 633-45 [0165]
• GROSKOPF, J. ; S.M. AUBIN ; I.L. DERAS ; A.BLASE ; S. BODRUG ; C. CLARK ; S.BRENTANO ; J. MATHIS ; J. PHAM ; T. MEYER.APTIMA PCA3 molecular urine test: development ofa method to aid in the diagnosis of prostate cancer.Clin Chem., 2006, vol. 52, 1089-95 [0165]
• GUATELLI, J.C. ; K.M. WHITFIELD ; D.Y. KWOH ;K.J. BARRINGER ; D.D. RICHMAN ; T.R. GIN-GERAS. Isothermal, in vitro amplification of nucleicacids by a multienzyme reaction modeled after retro-viral replication. Proc Natl Acad Sci USA., 1990, vol.87, 1874-8 [0165]
• HAHN, P.J. Molecular biology of double-minute chro-mosomes. Bioessays, 1993, vol. 15, 477-84 [0165]
• HUBNER, R.H. ; S. MEFFERT ; U. MUNDT ; H.BOTTCHER ; S. FREITAG ; N.E. EL MOKHTARI ;T. PUFE ; S. HIRT ; U.R. FOLSCH ; B. BEWIG. Ma-trix metalloproteinase-9 in bronchiolitis obliteranssyndrome after lung transplantation. Eur Respir J,2005, vol. 25, 494-501 [0165]
• JANOWSKA-WIECZOREK, A. ; M.WYSOCZYNSKI ; J. KIJOWSKI ; L.MARQUEZ-CURTIS ; B. MACHALINSKI ; J.RATAJCZAK ; M.Z. RATAJCZAK. Microvesiclesderived from activated platelets induce metastasisand angiogenesis in lung cancer. Int J Cancer, 2005,vol. 113, 752-60 [0165]
• JOHNSON, S. ; D. EVANS ; S. LAURENSON ; D.PAUL ; A.G. DAVIES ; P.K. FERRIGNO ; C. WALTI.Surface-immobilized peptide aptamers as probe mol-ecules for protein detection. Anal Chem., 2008, vol.80, 978-83 [0165]
• JONES, S. ; X. ZHANG ; D.W. PARSONS ; J.C.LIN ; R.J. LEARY ; P. ANGENENDT ; P. MANKOO ;H. CARTER ; H. KAMIYAMA ; A. JIMENO. Core Sig-naling Pathways in Human Pancreatic Cancers Re-vealed by Global Genomic Analyses. Science, 2008[0165]
• KAN, Y.W. ; A.M. DOZY. Antenatal diagnosis of sick-le-cell anaemia by D.N.A. analysis of amniotic-fluidcells. Lancet, 1978, vol. 2, 910-2 [0165]
• KAN, Y.W. ; A.M. DOZY. Polymorphism of DNA se-quence adjacent to human beta-globin structuralgene: relationship to sickle mutation. Proc Natl AcadSci U S A., 1978, vol. 75, 5631-5 [0165]
EP 2 604 704 A1
180
• KELLER, S. ; C. RUPP ; A. STOECK ; S. RUNZ ; M.FOGEL ; S. LUGERT ; H.D. HAGER ; M.S.ABDEL-BAKKY ; P. GUTWEIN ; P. ALTEVOGT.CD24 is a marker of exosomes secreted into urineand amniotic fluid. Kidney Int., 2007, vol. 72,1095-102 [0165]
• KEMNA, E. ; P. PICKKERS ; E. NEMETH ; H. VANDER HOEVEN ; D. SWINKELS. Time-course anal-ysis of hepcidin, serum iron, and plasma cytokine lev-els in humans injected with LPS. Blood, 2005, vol.106, 1864-6 [0165]
• KEMNA, E.H. ; H. TJALSMA ; V.N. PODUST ; D.W.SWINKELS. Mass spectrometry-based hepcidinmeasurements in serum and urine: analytical aspectsand clinical implications. Clin Chem., 2007, vol. 53,620-8 [0165]
• KEMNA, E.H. ; H. TJALSMA ; H.L. WILLEMS ;D.W. SWINKELS. Hepcidin: from discovery to differ-ential diagnosis. Haematologica, 2008, vol. 93, 90-7[0165]
• KISLAUSKIS, E.H. ; X. ZHU ; R.H. SINGER. Se-quences responsible for intracellular localization ofbeta-actin messenger RNA also affect cell pheno-type. J Cell Biol., vol. 127, 441-51 [0165]
• KWOH, D.Y. ; G.R. DAVIS ; K.M. WHITFIELD ; H.L.CHAPPELLE ; L.J. DIMICHELE ; T.R. GINGERAS.Transcription-based amplification system and detec-tion of amplified human immunodeficiency virus type1 with a bead-based sandwich hybridization format.Proc Natl Acad Sci USA., 1989, vol. 86, 1173-7 [0165]
• LANDEGREN, U. ; R. KAISER ; J. SANDERS ; L.HOOD. A ligase-mediated gene detection technique.Science, 1988, vol. 241, 1077-80 [0165]
• LI, J. ; L. WANG ; H. MAMON ; M.H. KULKE ; R.BERBECO ; G.M. MAKRIGIORGOS. ReplacingPCR with COLD-PCR enriches variant DNA se-quences and redefines the sensitivity of genetic test-ing. Nat Med., 2008, vol. 14, 579-84 [0165]
• LIU, C. ; S. YU ; K. ZINN ; J. WANG ; L. ZHANG ;Y. JIA ; J.C. KAPPES ; S. BARNES ; R.P.KIMBERLY ; W.E. GRIZZLE. Murine mammary car-cinoma exosomes promote tumor growth by suppres-sion of NK cell function. J Immunol., 2006, vol. 176,1375-85 [0165]
• LIU, Q. ; J.C. GREIMANN ; C.D. LIMA. Reconstitu-tion, activities, and structure of the eukaryotic RNAexosome. Cell, 2006, vol. 127, 1223-37 [0165]
• LO, Y.M. ; N.B. TSUI ; R.W. CHIU ; T.K. LAU ; T.N.LEUNG ; M.M. HEUNG ; A. GEROVASSILI ; Y. JIN ;K.H. NICOLAIDES ; C.R. CANTOR. Plasma placen-tal RNA allelic ratio permits noninvasive prenatalchromosomal aneuploidy detection. Nat Med., 2007,vol. 13, 218-23 [0165]
• LOUIS, D.N. ; H. OHGAKI ; O.D. WIESTLER ; W.K.CAVENEE ; P.C. BURGER ; A. JOUVET ; B.W.SCHEITHAUER ; P. KLEIHUES. The 2007 WHOclassification of tumours of the central nervous sys-tem. Acta Neuropathol., 2007, vol. 114, 97-109[0165]
• MACK, M. ; A. KLEINSCHMIDT ; H. BRUHL ; C.KLIER ; P.J. NELSON ; J. CIHAK ; J. PLACHY ; M.STANGASSINGER ; V. ERFLE ; D. SCHLON-DORFF. Transfer of the chemokine receptor CCR5between cells by membrane-derived microparticles:a mechanism for cellular human immunodeficiencyvirus 1 infection. Nat Med., 2000, vol. 6, 769-75[0165]
• MALLARDO, M. ; A. DEITINGHOFF ; J. MULLER ;B. GOETZE ; P. MACCHI ; C. PETERS ; M.A. KIE-BLER. Isolation and characterization of Staufen-con-taining ribonucleoprotein particles from rat brain.Proc Natl Acad Sci USA., 2003, vol. 100, 2100-5[0165]
• MARON, J.L. ; K.L. JOHNSON ; D. SLONIM ; C.Q.LAI ; M. RAMONI ; G. ALTEROVITZ ; Z. JARRAH ;Z. YANG ; D.W. BIANCHI. Gene expression analysisin pregnant women and their infants identifies uniquefetal biomarkers that circulate in maternal blood. JClin Invest., 2007, vol. 117, 3007-19 [0165]
• MAZZOCCA, A. ; R. COPPARI ; R. DE FRANCO ;J.Y. CHO ; T.A. LIBERMANN ; M. PINZANI ; A.TOKER. A secreted form of ADAM9 promotes carci-noma invasion through tumor-stromal interactions.Cancer Res., 2005, vol. 65, 4728-38 [0165]
• MCLENDON, R. ; A. FRIEDMAN ; D. BIGNER ; E.G.VAN MEIR ; D.J. BRAT ; G. MARIEMASTROGIANAKIS ; J.J. OLSON ; T.MIKKELSEN ; N. LEHMAN ; K. ALDAPE. Compre-hensive genomic characterization defines humanglioblastoma genes and core pathways. Nature, 2008[0165]
• MELLINGHOFF, I.K. ; M.Y. WANG ; I. VIVANCO ;D.A. HAAS-KOGAN ; S. ZHU ; E.Q. DIA ; K.V. LU ;K. YOSHIMOTO ; J.H. HUANG ; D.J. CHUTE. Mo-lecular determinants of the response of glioblastomasto EGFR kinase inhibitors. N Engl J Med., 2005, vol.353, 2012-24 [0165]
• MIELE, E.A. ; D.R. MILLS ; F.R. KRAMER. Autocat-alytic replication of a recombinant RNA. J Mol Biol.,1983, vol. 171, 281-95 [0165]
• MILLIMAGGI, D. ; M. MARI ; S. D’ASCENZO ; E.CAROSA ; E.A. JANNINI ; S. ZUCKER ; G.CARTA ; A. PAVAN ; V. DOLO. Tumor vesicle-as-sociated CD147 modulates the angiogenic capabilityof endothelial cells. Neoplasia, 2007, vol. 9, 349-57[0165]
• MOSSE, Y.P. ; M. LAUDENSLAGER ; L. LONGO ;K.A. COLE ; A. WOOD ; E.F. ATTIYEH ; M.J.LAQUAGLIA ; R. SENNETT ; J.E. LYNCH ; P. PER-RI. Identification of ALK as a major familial neurob-lastoma predisposition gene. Nature, 2008 [0165]
EP 2 604 704 A1
181
• MUERKOSTER, S. ; K. WEGEHENKEL ; A. ARLT ;M. WITT ; B. SIPOS ; M.L. KRUSE ; T. SEBENS ;G. KLOPPEL ; H. KALTHOFF ; U.R. FOLSCH. Tu-mor stroma interactions induce chemoresistance inpancreatic ductal carcinoma cells involving increasedsecretion and paracrine effects of nitric oxide and in-terleukin-1beta. Cancer Res., 2004, vol. 64, 1331-7[0165]
• MYERS, R.M. ; Z. LARIN ; T. MANIATIS. Detectionof single base substitutions by ribonuclease cleavageat mismatches in RNA:DNA duplexes. Science,1985, vol. 230, 1242-6 [0165]
• NAGRATH, S. ; L.V. SEQUIST ; S.MAHESWARAN ; D.W. BELL ; D. IRIMIA ; L.ULKUS ; M.R. SMITH ; E.L. KWAK ; S.DIGUMARTHY ; A. MUZIKANSKY. Isolation of rarecirculating tumour cells in cancer patients by micro-chip technology. Nature, 2007, vol. 450, 1235-9[0165]
• NAKANISHI, H. ; J. GROSKOPF ; H.A. FRITSCHE ;V. BHADKAMKAR ; A. BLASE ; S.V. KUMAR ;J.W. DAVIS ; P. TRONCOSO ; H. RITTENHOUSE ;R.J. BABAIAN. PCA3 molecular urine assay corre-lates with prostate cancer tumor volume: implicationin selecting candidates for active surveillance. J Urol.,2008, vol. 179, 1804-9 [0165]
• NAKAZAWA, H. ; D. ENGLISH ; P.L. RANDELL ;K. NAKAZAWA ; N. MARTEL ; B.K.ARMSTRONG ; H. YAMASAKI. UV and skin cancer:specific p53 gene mutation in normal skin as a bio-logically relevant exposure measurement. Proc NatlAcad Sci USA., 1994, vol. 91, 360-4 [0165]
• NG, E.K. ; T.N. LEUNG ; N.B. TSUI ; T.K. LAU ; N.S.PANESAR ; R.W. CHIU ; Y.M. LO. The concentra-tion of circulating corticotropin-releasing hormonemRNA in maternal plasma is increased in preeclamp-sia. Clin Chem., 2003, vol. 49, 727-31 [0165]
• NG, E.K. ; N.B. TSUI ; T.K. LAU ; T.N. LEUNG ;R.W. CHIU ; N.S. PANESAR ; L.C. LIT ; K.W.CHAN ; Y.M. LO. mRNA of placental origin is readilydetectable in maternal plasma. Proc Natl Acad SciUSA., 2003, vol. 100, 4748-53 [0165]
• NISHIKAWA, R. ; T. SUGIYAMA ; Y. NARITA ; F.FURNARI ; W.K. CAVENEE ; M. MATSUTANI. Im-munohistochemical analysis of the mutant epidermalgrowth factor, deltaEGFR, in glioblastoma. Brain Tu-mor Pathol., 2004, vol. 21, 53-6 [0165]
• ORITA, M. ; H. IWAHANA ; H. KANAZAWA ; K.HAYASHI ; T. SEKIYA. Detection of polymorphismsof human DNA by gel electrophoresis as sin-gle-strand conformation polymorphisms. Proc NatlAcad Sci USA., 1989, vol. 86, 2766-70 [0165]
• PAN, B.T. ; R.M. JOHNSTONE. Fate of the transfer-rin receptor during maturation of sheep reticulocytesin vitro: selective externalization of the receptor. Cell,1983, vol. 33, 967-78 [0165]
• PARSONS, D.W. ; S. JONES ; X. ZHANG ; J.C.LIN ; R.J. LEARY ; P. ANGENENDT ; P. MANKOO ;H. CARTER ; I.M. SIU ; G.L. GALLIA. An IntegratedGenomic Analysis of Human Glioblastoma Multi-forme. Science, 2008 [0165]
• PELLOSKI, C.E. ; K.V. BALLMAN ; A.F. FURTH ;L. ZHANG ; E. LIN ; E.P. SULMAN ; K. BHAT ; J.M.MCDONALD ; W.K. YUNG ; H. COLMAN. Epider-mal growth factor receptor variant III status definesclinically distinct subtypes of glioblastoma. J Clin On-col., 2007, vol. 25, 2288-94 [0165]
• RAPOSO, G. ; H.W. NIJMAN ; W. STOORVOGEL ;R. LIEJENDEKKER ; C.V. HARDING ; C.J.MELIEF ; H.J. GEUZE. B lymphocytes secrete anti-gen-presenting vesicles. J Exp Med., 1996, vol. 183,1161-72 [0165]
• ROE, M.A. ; C. SPINKS ; A.L. HEATH ; L.J.HARVEY ; R. FOXALL ; J. WIMPERIS ; C. WOLF ;S.J. FAIRWEATHER-TAIT. Serum prohepcidin con-centration: no association with iron absorption inhealthy men; and no relationship with iron status inmen carrying HFE mutations, hereditary haemochro-matosis patients undergoing phlebotomy treatment,or pregnant women. Br J Nutr., 2007, vol. 97, 544-9[0165]
• SCHETTER, A.J. ; S.Y. LEUNG ; J.J. SOHN ; K.A.ZANETTI ; E.D. BOWMAN ; N. YANAIHARA ; S.T.YUEN ; T.L. CHAN ; D.L. KWONG ; G.K. AU. Micro-RNA expression profiles associated with prognosisand therapeutic outcome in colon adenocarcinoma.JAMA, 2008, vol. 299, 425-36 [0165]
• SINGER, C.F. ; D. GSCHWANTLER-KAULICH ; A.FINK-RETTER ; C. HAAS ; G. HUDELIST ; K.CZERWENKA ; E. KUBISTA. Differential gene ex-pression profile in breast cancer-derived stromal fi-broblasts. Breast Cancer Res Treat., 2007 [0165]
• STEEMERS, F.J. ; W. CHANG ; G. LEE ; D.L.BARKER ; R. SHEN ; K.L. GUNDERSON.Whole-genome genotyping with the single-base ex-tension assay. Nat Methods, 2006, vol. 3, 31-3 [0165]
• STUPP, R. ; W.P. MASON ; M.J. VAN DEN BENT ;M. WELLER ; B. FISHER ; M.J. TAPHOORN ; K.BELANGER ; A.A. BRANDES ; C. MAROSI ; U.BOGDAHN. Radiotherapy plus concomitant and ad-juvant temozolomide for glioblastoma. N Engl J Med.,2005, vol. 352, 987-96 [0165]
• TAYLOR, D.D. ; C. GERCEL-TAYLOR. MicroRNAsignatures of tumor-derived exosomes as diagnosticbiomarkers of ovarian cancer. Gynecol Oncol., 2008,vol. 110, 13-21 [0165]
• Isolation and characterization of exosomes from cellculture supernatants and biological fluids. THERY,C. ; S. AMIGORENA ; G. RAPOSO ; A. CLAYTON.Curr Protoc Cell Biol. 2006 [0165]
• THERY, C. ; L. ZITVOGEL ; S. AMIGORENA. Exo-somes: composition, biogenesis and function. NatRev Immunol., 2002, vol. 2, 569-79 [0165]
EP 2 604 704 A1
182
• TOMLINS, S.A. ; D.R. RHODES ; S. PERNER ; S.M.DHANASEKARAN ; R. MEHRA ; X.W. SUN ; S.VARAMBALLY ; X. CAO ; J. TCHINDA ; R.KUEFER. Recurrent fusion of TMPRSS2 and ETStranscription factor genes in prostate cancer. Sci-ence, 2005, vol. 310, 644-8 [0165]
• VALADI, H. ; K. EKSTROM ; A. BOSSIOS ; M.SJOSTRAND ; J.J. LEE ; J.O. LOTVALL. Exo-some-mediated transfer of mRNAs and microRNAsis a novel mechanism of genetic exchange betweencells. Nat Cell Biol., vol. 9, 654-9 [0165]
• VAN DIJK, E.L. ; G. SCHILDERS ; G.J. PRUIJN.Human cell growth requires a functional cytoplasmicexosome, which is involved in various mRNA decaypathways. RNA, 2007, vol. 13, 1027-35 [0165]
• VELCULESCU, V.E. ; L. ZHANG ; B.VOGELSTEIN ; K.W. KINZLER. Serial analysis ofgene expression. Science, 1995, vol. 270, 484-7[0165]
• WEISS, G. ; L.T. GOODNOUGH. Anemia of chronicdisease. N Engl J Med., 2005, vol. 352, 1011-23[0165]
• WENT, P.T. ; A. LUGLI ; S. MEIER ; M. BUNDI ; M.MIRLACHER ; G. SAUTER ; S. DIRNHOFER. Fre-quent EpCam protein expression in human carcino-mas. Hum Pathol., 2004, vol. 35, 122-8 [0165]
• WIECKOWSKI, E. ; T.L. WHITESIDE. Human tu-mor-derived vs dendritic cell-derived exosomes havedistinct biologic roles and molecular profiles. ImmunolRes., 2006, vol. 36, 247-54 [0165]
• WONG, B.C. ; R.W. CHIU ; N.B. TSUI ; K.C. CHAN ;L.W. CHAN ; T.K. LAU ; T.N. LEUNG ; Y.M. LO. Cir-culating placental RNA in maternal plasma is asso-ciated with a preponderance of 5’mRNA fragments:implications for noninvasive prenatal diagnosis andmonitoring. Clin Chem., 2005, vol. 51, 1786-95[0165]
• WOOD, L.D. ; D.W. PARSONS ; S. JONES ; J. LIN ;T. SJOBLOM ; R.J. LEARY ; D. SHEN ; S.M.BOCA ; T. BARBER ; J. PTAK. The genomic land-scapes of human breast and colorectal cancers. Sci-ence, 2007, vol. 318, 1108-13 [0165]
• WRIGHT, J.L. ; P.H. LANGE. Newer potential bi-omarkers in prostate cancer. Rev Urol., 2007, vol. 9,207-13 [0165]
• ZEHENTNER, B.K. ; H. SECRIST ; X. ZHANG ; D.C.HAYES ; R. OSTENSON ; G. GOODMAN ; J. XU ;M. KIVIAT ; N. KIVIAT ; D.H. PERSING. Detectionof alpha-methylacyl-coenzyme-A racemase tran-scripts in blood and urine samples of prostate cancerpatients. Mol Diagn Ther., 2006, vol. 10, 397-403[0165]
• ZIELIE, P.J. ; J.A. MOBLEY ; R.G. EBB ; Z. JIANG ;R.D. BLUTE ; S.M. HO. A novel diagnostic test forprostate cancer emerges from the determination ofalpha-methylacyl-coenzyme a racemase in prostaticsecretions. J Urol., 2004, vol. 172, 1130-3 [0165]
Related Documents