TEPPC Study Report: 2026 PC1 Common Case WECC Staff Draft: January 13, 2017 155 North 400 West, Suite 200 Salt Lake City, Utah 84103‐1114

Welcome message from author
This document is posted to help you gain knowledge. Please leave a comment to let me know what you think about it! Share it to your friends and learn new things together.
Transcript

TEPPC Study Report: 2026 PC1 Common Case
WECC Staff
Draft: January 13, 2017
155 North 400 West, Suite 200
Salt Lake City, Utah 84103‐1114

2026 PC1 Common Case ii
W E S T E R N E L E C T R I C I T Y C O O R D I N A T I N G C O U N C I L
Overview
This document is for technical review purposes only. It has not been endorsed or approved by the
WECC Board of Directors, the Transmission Expansion Planning Policy Committee (TEPPC), the TEPPC
Scenario Planning Steering Group (SPSG), or WECC Management.
The current results are from the PC1 version 1.7 dataset. The detailed input assumptions are available
in the release notes.1
1 2026 Common Case & Release Notes v1.5

2026 PC1 Common Case Report ‐ DRAFT iii
W E S T E R N E L E C T R I C I T Y C O O R D I N A T I N G C O U N C I L
Table of Contents
Introduction ........................................................................................................................................ 1
Abstract of Case .................................................................................................................................. 2
Key Inputs and Results from TEPCC 2026 Common Case Version 1.7 ................................................... 5
Load ..................................................................................................................................................... 5
Generation .......................................................................................................................................... 6
CO2 Emissions ...................................................................................................................................... 9
Transmission congestion .................................................................................................................... 9
Additional Discussion of Input Assumptions and Study Results ......................................................... 11
Study Limitations .................................................................................................................................. 11
Dataset Updates ................................................................................................................................... 11
Summary Inputs and Assumptions ....................................................................................................... 12
Load Topology ................................................................................................................................... 12
Changes in Load ................................................................................................................................ 13
Transmission Network ...................................................................................................................... 13
Generation Resources ....................................................................................................................... 14
Load Modifiers .................................................................................................................................. 17
Overriding Assumptions .................................................................................................................... 17
Key Data and Modeling Improvements ............................................................................................ 18
Additional Study Results ....................................................................................................................... 18
Generation by State/Province .......................................................................................................... 19
Peak Hour Breakdown ...................................................................................................................... 20
Transmission Path Flows ................................................................................................................... 21
Conclusions and Observations ........................................................................................................... 28
Appendix A ....................................................................................................................................... 31
2026 PC1 Common Case 1
W E S T E R N E L E C T R I C I T Y C O O R D I N A T I N G C O U N C I L
Introduction
The 2026 Common Case is a production cost model (PCM) dataset that serves as an “expected future”
of loads, resources and transmission topology in 2026 for the Transmission Expansion Planning Policy
Committee (TEPPC). The case represents the compilation of recent Western Interconnection planning
information, developments and policies looking out 10 years to the year 2026.
A primary goal in developing a Common Case is to define a reasonable foundation for the other
resource mix and transmission planning studies (year‐10 time frame) that are conducted as part of the
2016 TEPPC Study Program. The case is also used throughout the Western Interconnection for a
number of purposes, including: FERC Order 890 and 1000 planning studies by regional planning groups,
subregional planning member‐entities, independent developer studies, market studies (e.g., Energy
Imbalance Market) and integration studies, as well as many other uses.
Many stakeholder groups provided valuable input and effort in developing the thousands of
assumptions that depict the Western Interconnection and how it is expected to change over the next
10 years. The development of a WECC‐wide production cost dataset would not be possible without the
huge contribution of all of the TEPPC stakeholders. The TEPPC and WECC staff wishes to express
appreciation to everyone who contributed to this effort.
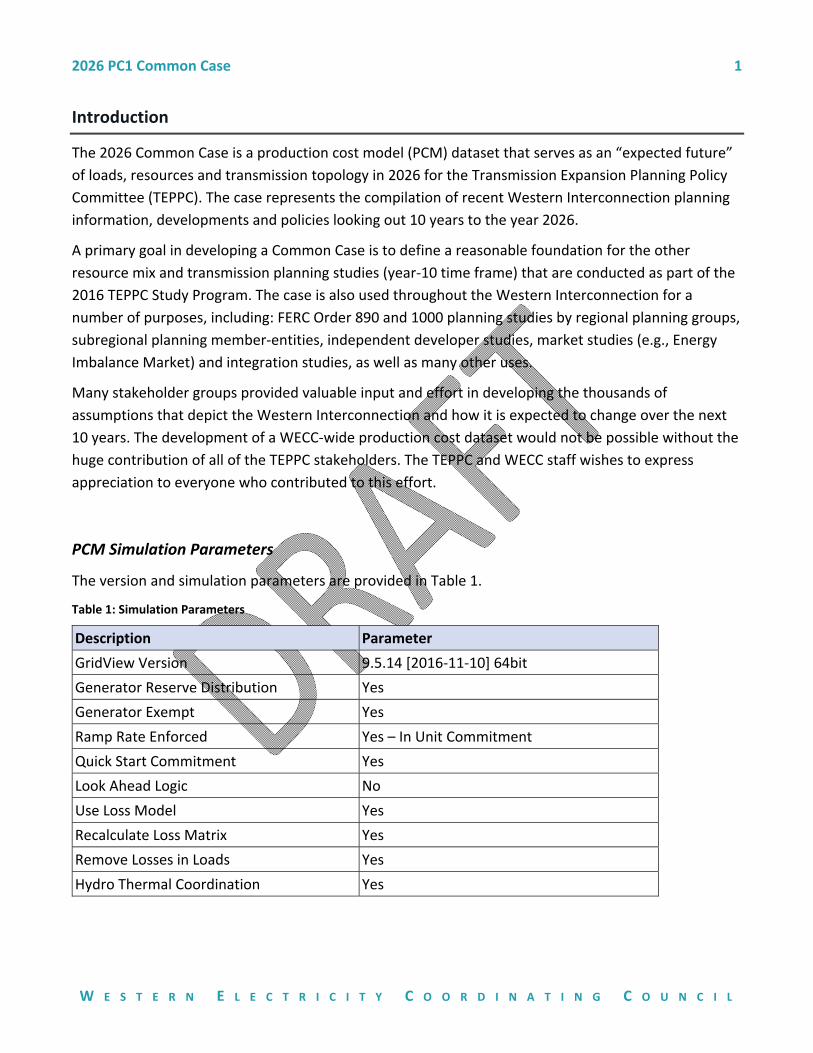
PCM Simulation Parameters
The version and simulation parameters are provided in Table 1.
Table 1: Simulation Parameters
Description Parameter
GridView Version 9.5.14 [2016‐11‐10] 64bit
Generator Reserve Distribution Yes
Generator Exempt Yes
Ramp Rate Enforced Yes – In Unit Commitment
Quick Start Commitment Yes
Look Ahead Logic No
Use Loss Model Yes
Recalculate Loss Matrix Yes
Remove Losses in Loads Yes
Hydro Thermal Coordination Yes
2026 PC1 Common Case Report ‐ DRAFT 2
W E S T E R N E L E C T R I C I T Y C O O R D I N A T I N G C O U N C I L
Abstract of Case
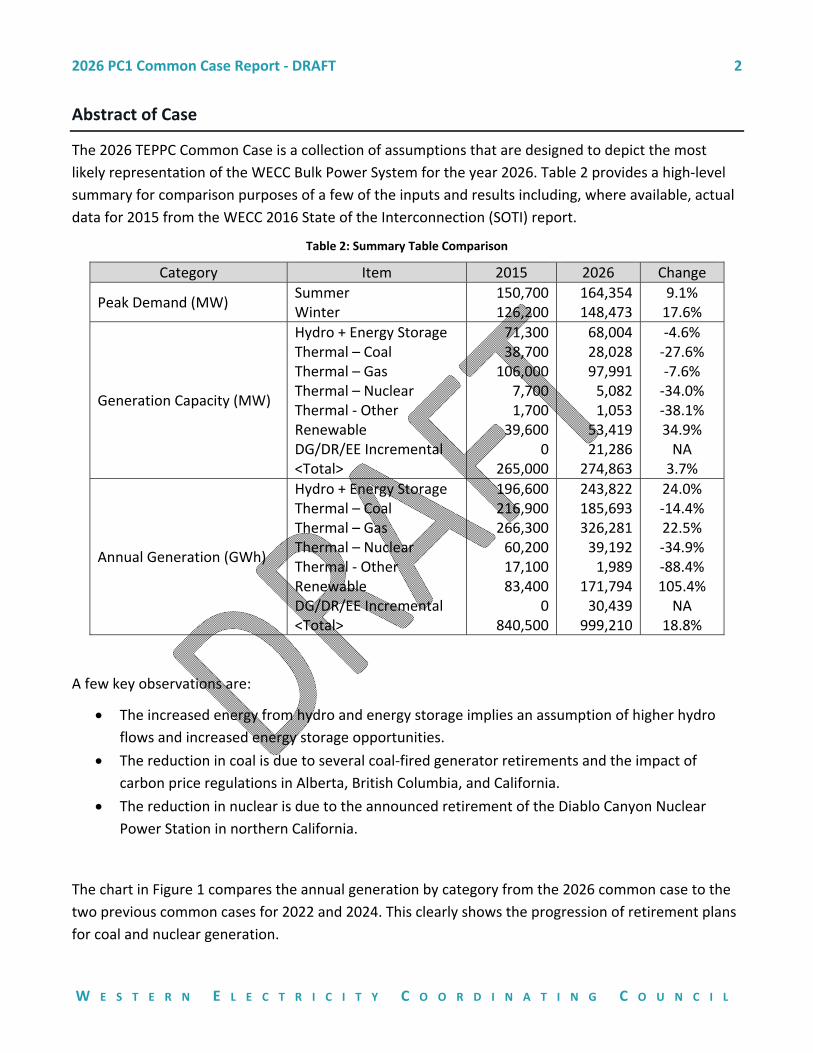
The 2026 TEPPC Common Case is a collection of assumptions that are designed to depict the most
likely representation of the WECC Bulk Power System for the year 2026. Table 2 provides a high‐level
summary for comparison purposes of a few of the inputs and results including, where available, actual
data for 2015 from the WECC 2016 State of the Interconnection (SOTI) report.
Table 2: Summary Table Comparison
Category Item 2015 2026 Change
Peak Demand (MW) Summer Winter
150,700126,200
164,354 148,473
9.1% 17.6%
Generation Capacity (MW)
Hydro + Energy Storage Thermal – Coal Thermal – Gas Thermal – Nuclear Thermal ‐ Other Renewable DG/DR/EE Incremental <Total>
71,30038,700106,000
7,7001,700
39,6000
265,000
68,004 28,028 97,991 5,082 1,053
53,419 21,286 274,863
‐4.6% ‐27.6% ‐7.6% ‐34.0% ‐38.1% 34.9% NA 3.7%
Annual Generation (GWh)
Hydro + Energy Storage Thermal – Coal Thermal – Gas Thermal – Nuclear Thermal ‐ Other Renewable DG/DR/EE Incremental <Total>
196,600216,900266,30060,20017,10083,400
0840,500
243,822 185,693 326,281 39,192 1,989
171,794 30,439 999,210
24.0% ‐14.4% 22.5% ‐34.9% ‐88.4% 105.4% NA
18.8%
A few key observations are:
The increased energy from hydro and energy storage implies an assumption of higher hydro
flows and increased energy storage opportunities.
The reduction in coal is due to several coal‐fired generator retirements and the impact of
carbon price regulations in Alberta, British Columbia, and California.
The reduction in nuclear is due to the announced retirement of the Diablo Canyon Nuclear
Power Station in northern California.
The chart in Figure 1 compares the annual generation by category from the 2026 common case to the
two previous common cases for 2022 and 2024. This clearly shows the progression of retirement plans
for coal and nuclear generation.

2026 PC1 Common Case Report ‐ DRAFT 3
W E S T E R N E L E C T R I C I T Y C O O R D I N A T I N G C O U N C I L
Figure 1: Comparison of Annual Generation
Figure 2: Comparison of Total Generation
It is not clear from Figure 1 that the amount of
load to be served fluctuates between common
cases, as apparent in Figure 2. A few of the
factors driving the fluctuations are load forecast
variances, energy storage impacts, and varying
flows between BA’s.
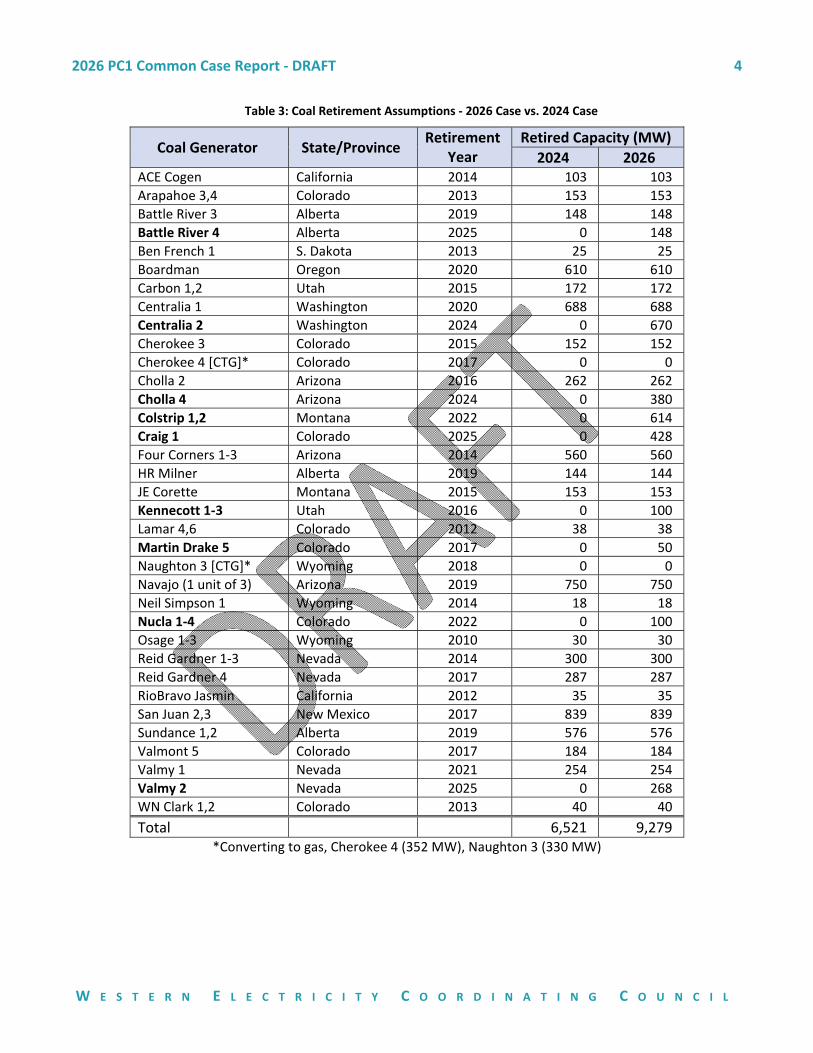
Coal Retirement Assumptions
The retirement of coal‐fired generation has been a key focus area during the last few years. In the 2026
dataset, WECC has reflected the actual retirements and the announced future retirements as plans are
finalized. These assumptions are provided in Table 3.
0 50,000 100,000 150,000 200,000 250,000 300,000 350,000
Conventional Hydro
Energy Storage
Steam ‐ Coal
Steam ‐ Other
Nuclear
Combined Cycle
Combustion Turbine
IC
Other
DG/DR/EE ‐ Incremental
Biomass RPS
Geothermal
Small Hydro RPS
Solar
Wind
Annual Generation (GWh) by Category
2022 PC1 Final 2024 PC1 v1.5 2026 WECC v1.7
960,000
980,000
1,000,000
1,020,000
1,040,000
1,060,000
2022 PC1 Final 2024 PC1 v1.5 2026 WECC v1.7
Total Generation (GWh)
2026 PC1 Common Case Report ‐ DRAFT 4
W E S T E R N E L E C T R I C I T Y C O O R D I N A T I N G C O U N C I L
Table 3: Coal Retirement Assumptions ‐ 2026 Case vs. 2024 Case
Coal Generator State/Province Retirement
Year Retired Capacity (MW)
2024 2026 ACE Cogen California 2014 103 103
Arapahoe 3,4 Colorado 2013 153 153
Battle River 3 Alberta 2019 148 148
Battle River 4 Alberta 2025 0 148
Ben French 1 S. Dakota 2013 25 25
Boardman Oregon 2020 610 610
Carbon 1,2 Utah 2015 172 172
Centralia 1 Washington 2020 688 688
Centralia 2 Washington 2024 0 670
Cherokee 3 Colorado 2015 152 152
Cherokee 4 [CTG]* Colorado 2017 0 0
Cholla 2 Arizona 2016 262 262
Cholla 4 Arizona 2024 0 380
Colstrip 1,2 Montana 2022 0 614
Craig 1 Colorado 2025 0 428
Four Corners 1‐3 Arizona 2014 560 560
HR Milner Alberta 2019 144 144
JE Corette Montana 2015 153 153
Kennecott 1‐3 Utah 2016 0 100
Lamar 4,6 Colorado 2012 38 38
Martin Drake 5 Colorado 2017 0 50
Naughton 3 [CTG]* Wyoming 2018 0 0
Navajo (1 unit of 3) Arizona 2019 750 750
Neil Simpson 1 Wyoming 2014 18 18
Nucla 1‐4 Colorado 2022 0 100
Osage 1‐3 Wyoming 2010 30 30
Reid Gardner 1‐3 Nevada 2014 300 300
Reid Gardner 4 Nevada 2017 287 287
RioBravo Jasmin California 2012 35 35
San Juan 2,3 New Mexico 2017 839 839
Sundance 1,2 Alberta 2019 576 576
Valmont 5 Colorado 2017 184 184
Valmy 1 Nevada 2021 254 254
Valmy 2 Nevada 2025 0 268
WN Clark 1,2 Colorado 2013 40 40
Total 6,521 9,279 *Converting to gas, Cherokee 4 (352 MW), Naughton 3 (330 MW)

2026 PC1 Common Case Report ‐ DRAFT 5
W E S T E R N E L E C T R I C I T Y C O O R D I N A T I N G C O U N C I L
Key Inputs and Results from TEPCC 2026 Common Case Version 1.7
A few key inputs and results of the 2026 Common Case are provided here. Additional results and a
description of the input assumptions are presented in later sections.
Load
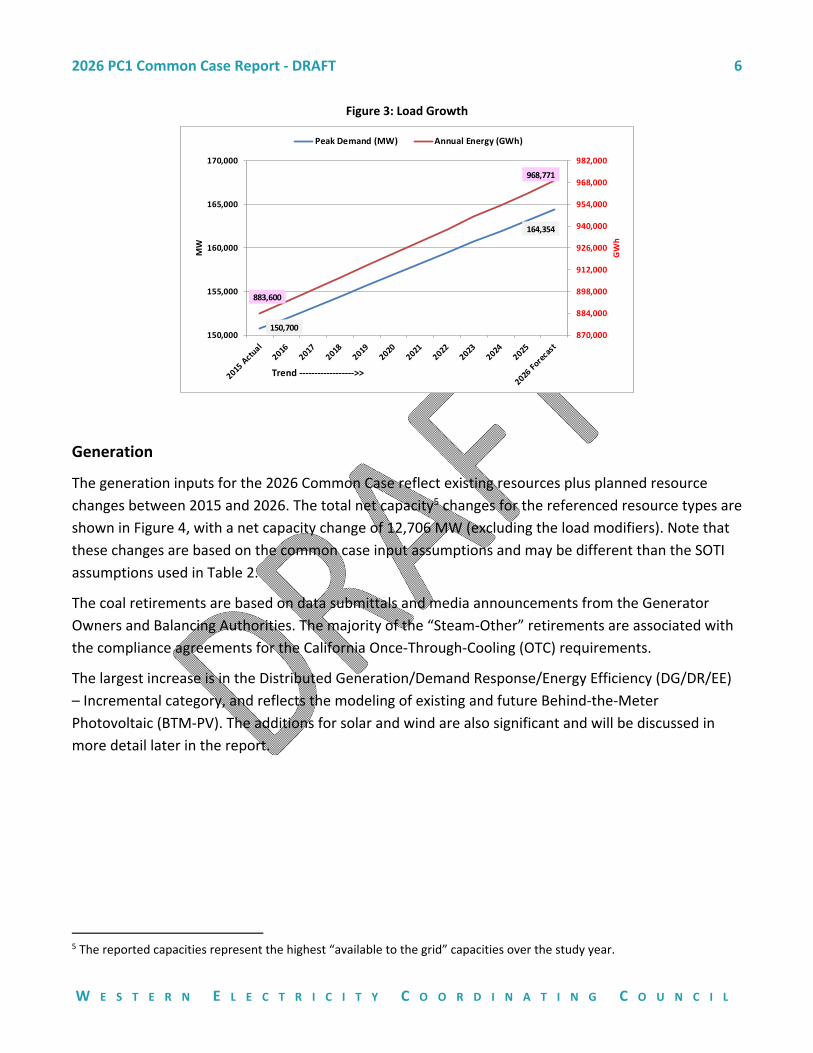
The components of the projected WECC peak demand and energy load2 in the 2026 Common Case are
provided in Table 4 and compared to the 2015 actual values in Figure 3. The summer and winter peak
values represent the common case inputs and results during the hour in which the summer and winter
peaks occurred, namely, July 27 at 4:00 pm, and December 8 at 7:00 pm.
Table 4: Load Forecast Components
Load Components 2026 Forecast and Load modifiers3
Summer Peak (MW)
Winter Peak (MW)
Annual Energy (GWh)
Native Load4 Base 170,020 148,871 991,732
Native Load Pumping 537 504 7,511
Energy Storage Pumping 2 17 4,482
Exports 0 0 0
Losses Netted from Load ‐779 ‐768 ‐4,515
Served Load Subtotal 169,780 148,624 999,210
(DG/DR/EE Incremental) ‐5,426 ‐151 ‐30,439
Total Net Energy Load 164,354 148,473 968,771
The peak demand in the 2026 common case is estimated to be 13,654 MW higher than the 2015 actual
peak demand.
2 For modeling purposes the incremental distributed generation (DG), demand response (DR), and energy efficiency (EE) are represented as generators. In reality these components would decrease the load by the amounts in Table 4. 3 Load Modifiers refer to DG, DR, and EE, which can be modeled as a direct load reduction or as generators. 4 Native Load is the collection of end‐use customers that the Load‐Serving Entity is obligated to serve.
2026 PC1 Common Case Report ‐ DRAFT 6
W E S T E R N E L E C T R I C I T Y C O O R D I N A T I N G C O U N C I L
Figure 3: Load Growth
Generation
The generation inputs for the 2026 Common Case reflect existing resources plus planned resource
changes between 2015 and 2026. The total net capacity5 changes for the referenced resource types are
shown in Figure 4, with a net capacity change of 12,706 MW (excluding the load modifiers). Note that
these changes are based on the common case input assumptions and may be different than the SOTI
assumptions used in Table 2.
The coal retirements are based on data submittals and media announcements from the Generator
Owners and Balancing Authorities. The majority of the “Steam‐Other” retirements are associated with
the compliance agreements for the California Once‐Through‐Cooling (OTC) requirements.
The largest increase is in the Distributed Generation/Demand Response/Energy Efficiency (DG/DR/EE)
– Incremental category, and reflects the modeling of existing and future Behind‐the‐Meter
Photovoltaic (BTM‐PV). The additions for solar and wind are also significant and will be discussed in
more detail later in the report.
5 The reported capacities represent the highest “available to the grid” capacities over the study year.
150,700
164,354
883,600
968,771
870,000
884,000
898,000
912,000
926,000
940,000
954,000
968,000
982,000
150,000
155,000
160,000
165,000
170,000
GWh
MW
Peak Demand (MW) Annual Energy (GWh)
Trend ‐‐‐‐‐‐‐‐‐‐‐‐‐‐‐‐‐‐>>

2026 PC1 Common Case Report ‐ DRAFT 7
W E S T E R N E L E C T R I C I T Y C O O R D I N A T I N G C O U N C I L
Figure 4: Key Resource Net Capacity Change (MW) between 1/1/2015 and 1/1/2026
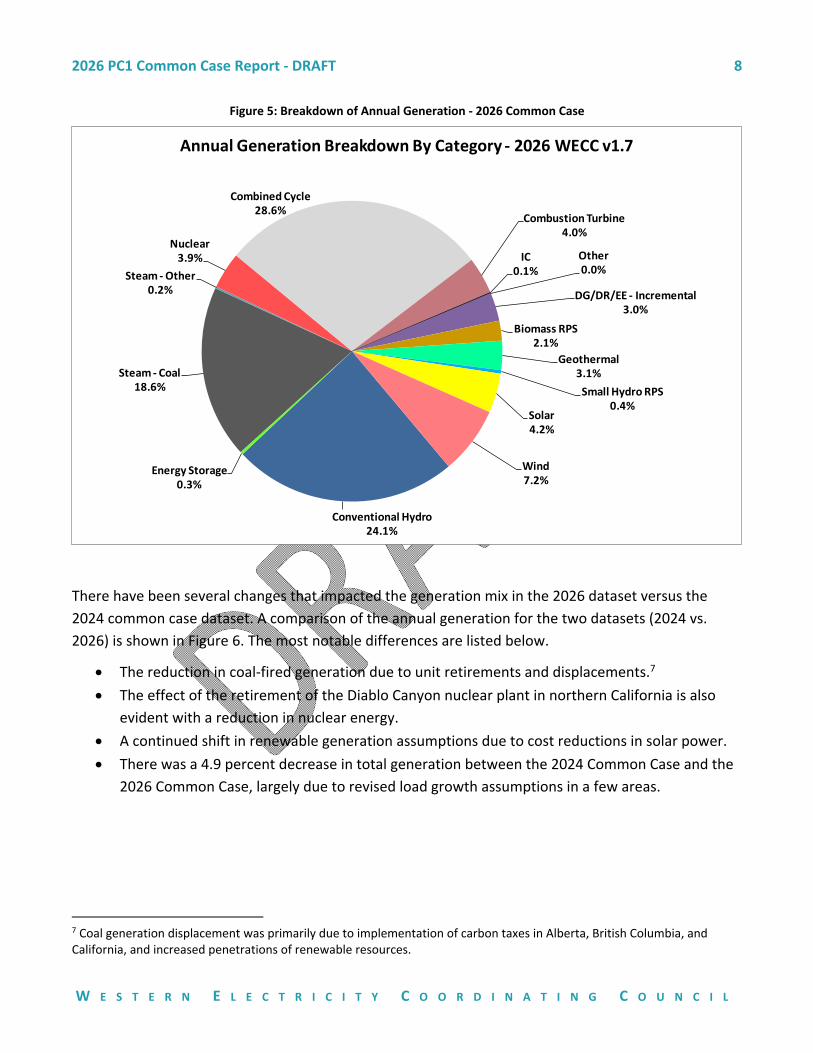
The 2026 Common Case was modeled using a production cost model6 to obtain a load/resource
solution for each hour of 2026. A breakdown of the resulting annual generation by category based on
the input and modeling assumptions is shown in Figure 5. The largest shares of production were from
combined cycle generation (28.6 percent) and conventional hydro (24.1 percent). The share from
renewable generation (including incremental DG) was 17.0 percent.
6 WECC uses ABB GridView for their PCM studies.
‐15,000 ‐10,000 ‐5,000 0 5,000 10,000 15,000 20,000 25,000
Conventional Hydro
Energy Storage
Steam ‐ Coal
Steam ‐ Other
Nuclear
Combined Cycle
Combustion Turbine
IC
Other
DG/DR/EE ‐ Incremental
Biomass RPS
Geothermal
Small Hydro RPS
Solar
Wind
2026 PC1 Common Case Report ‐ DRAFT 8
W E S T E R N E L E C T R I C I T Y C O O R D I N A T I N G C O U N C I L
Figure 5: Breakdown of Annual Generation ‐ 2026 Common Case
There have been several changes that impacted the generation mix in the 2026 dataset versus the
2024 common case dataset. A comparison of the annual generation for the two datasets (2024 vs.
2026) is shown in Figure 6. The most notable differences are listed below.
The reduction in coal‐fired generation due to unit retirements and displacements.7
The effect of the retirement of the Diablo Canyon nuclear plant in northern California is also
evident with a reduction in nuclear energy.
A continued shift in renewable generation assumptions due to cost reductions in solar power.
There was a 4.9 percent decrease in total generation between the 2024 Common Case and the
2026 Common Case, largely due to revised load growth assumptions in a few areas.
7 Coal generation displacement was primarily due to implementation of carbon taxes in Alberta, British Columbia, and California, and increased penetrations of renewable resources.
Conventional Hydro24.1%
Energy Storage0.3%
Steam ‐ Coal18.6%
Steam ‐Other0.2%
Nuclear3.9%
Combined Cycle28.6%
Combustion Turbine4.0%
IC0.1%
Other0.0%
DG/DR/EE ‐ Incremental3.0%
Biomass RPS2.1%
Geothermal3.1%
Small Hydro RPS0.4%
Solar4.2%
Wind7.2%
Annual Generation Breakdown By Category ‐ 2026 WECC v1.7

2026 PC1 Common Case Report ‐ DRAFT 9
W E S T E R N E L E C T R I C I T Y C O O R D I N A T I N G C O U N C I L
Figure 6: Annual Generation by Category (2024 vs 2026)
CO2 Emissions
The annual CO2 emissions in the 2026 common case were 12 percent (44 million metric tons) lower
than in the 2024 common case. Some of the obvious drivers are listed below:
1. The retirement of additional coal‐fired generation
2. Carbon prices added for Alberta and British Columbia, and increased in California.
3. The reduced overall energy load.
4. The increased amount of renewable generation.
Transmission congestion8
There was minimal transmission congestion in the 2026 Common Case. The paths with reduced
congestion relative to historical or interesting flow variations are:
Northwest to California: The flows on paths 65 (PDCI) and 66 (COI) decreased due in part to the
implementation of the California Global Warming Solutions Act (AB32) that places a financial
8 Congestion refers to a condition where the flow may have been higher if not for a defined limit.
0 50,000 100,000 150,000 200,000 250,000 300,000 350,000
Conventional Hydro
Energy Storage
Steam ‐ Coal
Steam ‐ Other
Nuclear
Combined Cycle
Combustion Turbine
IC
Other
DG/DR/EE ‐ Incremental
Biomass RPS
Geothermal
Small Hydro RPS
Solar
Wind
Annual Generation by Category (GWh)
2024 PC1 v1.5 2026 WECC v1.7
2026 PC1 Common Case Report ‐ DRAFT 10
W E S T E R N E L E C T R I C I T Y C O O R D I N A T I N G C O U N C I L
penalty on imports of electrical power to California, except for surplus hydro generation from
Bonneville Power Authority (BPA).
Utah to California: The primary delivery path between Utah and California is the path 27 HVDC
line. This was originally built to deliver the output from the Intermountain Power Project (IPP)
to the California participants. In the 2026 Common Case, the CO2 cost penalties from AB32 have
a substantial impact on the dispatch of the IPP units and on the utilization of path 27.
In the ten‐year horizon for the 2026 Common Case, the changes in load and generation were not
expected to create congestion on the major WECC paths due to:
The inclination for developers to build gas‐fired generation near the load centers, and renewable
resources in‐state with access to local transmission.
The projected transmission build‐out in the CCTA (see Figure 8).
2026 PC1 Common Case Report ‐ DRAFT 11
W E S T E R N E L E C T R I C I T Y C O O R D I N A T I N G C O U N C I L
Additional Discussion of Input Assumptions and Study Results
A more detailed accounting of the study limitations, input assumptions, and results from the 2026
Common Case is presented in the following sections.
Study Limitations
PCM Solution: The solution from the PCM is subject to the input assumptions and overriding least‐
cost objective. The case provides a high‐level view of generation dispatch and transmission
utilization that can be compared to other study cases and sensitivity cases to formulate hypotheses
and conclusions.
Local Dispatch: The TEPPC study work is designed to investigate transmission utilization across the
entire Western Interconnection, with a focus on interregional transmission. A production cost
simulation that converges to a least‐cost WECC‐wide solution within the constraints and
assumptions may not produce the expected results for an individual area or region.
Local Congestion: There is a potential to create local congestion on area branches when adding
generation to an area. A portion of the generator’s output can become undeliverable and create
dump energy.9 There are a few instances where this has occurred in the common case, and these
may be addressed in a future release.
Load Shapes: The hourly load shapes for each load area are based on the actual hourly loads from
2009. This may overlook the more recent impacts from demand response, energy efficiency,
electric vehicle charging and behind‐the‐meter (BTM) generation such as rooftop solar.
Dataset Updates
The TEPPC PCM datasets are used by several stakeholders for conducting their own studies. There was
agreement during the initial stages of the 2026 common case development for the dataset to be
released at different phases of development. Each subsequent release included improvements and
changes that were identified by the various stakeholder groups. This process may continue such that it
will be necessary to reference the version number of the common case in all relevant communications
regarding the TEPPC 2026 Common Case.
9 Dump energy is generation that would have been dispatched if not for a constraint such as a transmission limit.

2026 PC1 Common Case Report ‐ DRAFT 12
W E S T E R N E L E C T R I C I T Y C O O R D I N A T I N G C O U N C I L
Summary Inputs and Assumptions
The detailed input assumptions are provided in a separate document of release notes. 10 A few of the
assumptions are listed in relevant sections below to provide a basis for the enclosed results.
Load Topology
Each of the WECC Balancing Authorities (BA) provides a ten‐year forecast of their monthly peak and
energy loads each year. A few of the BAs provide a more granular breakdown to support the TEPPC
load topology as shown in Figure 7. The forecasts that were submitted in March 2015 were used for
the 2026 Common Case, except for Alberta Electric System Operator (AESO) and the California
Independent System Operator (CAISO) which provided key updates to their forecasts.
Figure 7: TEPPC Load Area Topology
10 2026 Common Case & Release Notes

2026 PC1 Common Case Report ‐ DRAFT 13
W E S T E R N E L E C T R I C I T Y C O O R D I N A T I N G C O U N C I L
Changes in Load
The primary factors driving the reduction in the overall energy load of the 2026 common case
compared to the 2024 common case are:
Factors for load reduction (2024 → 2026) Amount (MWh)
Decreases in load forecasts, especially in California and Alberta ‐27,061,139
Increase in Distributed Generation, Demand Response, and Energy Efficiency ‐12,522,889
Reduced forecasts of exports to MRO and SPP in the Eastern Interconnection ‐5,364,720
Reduced energy storage load (charging, compressing, pumping) ‐3,432,610
One less day as 2024 was a leap year ‐2,750,585
Total ‐51,131,943
Transmission Network
The transmission network was derived from the TSS 2025‐HS1 heavy summer power flow base case
and updated as described in the release notes. The future projects that were either retained from the
base case or added per stakeholder review are listed in Figure 8. Note that 3 out of the 16 projects are
under construction.

2026 PC1 Common Case Report ‐ DRAFT 14
W E S T E R N E L E C T R I C I T Y C O O R D I N A T I N G C O U N C I L
Figure 8: 2026 Common Case Transmission Projects
Other study specific transmission projects will be added or removed as requested in the studies
outlined in the 2016 Study Program.
Generation Resources
There have been several changes to the generation assumptions since the 2024 case was developed in 2014. A few examples are highlighted below.
Decision by Pacific Gas & Electric to retire the Diablo Canyon nuclear power plant in 2025.
Revised retirement plans for coal‐fired generation that removed over 2700 MW of additional coal‐fired capacity.
Revised OTC compliance schedule and replacement plan for California.
True‐up of the renewable generation to ensure compliance with state Renewable Portfolio Standards (RPS) requirements as a function of the new annual energy loads for 2026.
2026 PC1 Common Case Report ‐ DRAFT 15
W E S T E R N E L E C T R I C I T Y C O O R D I N A T I N G C O U N C I L
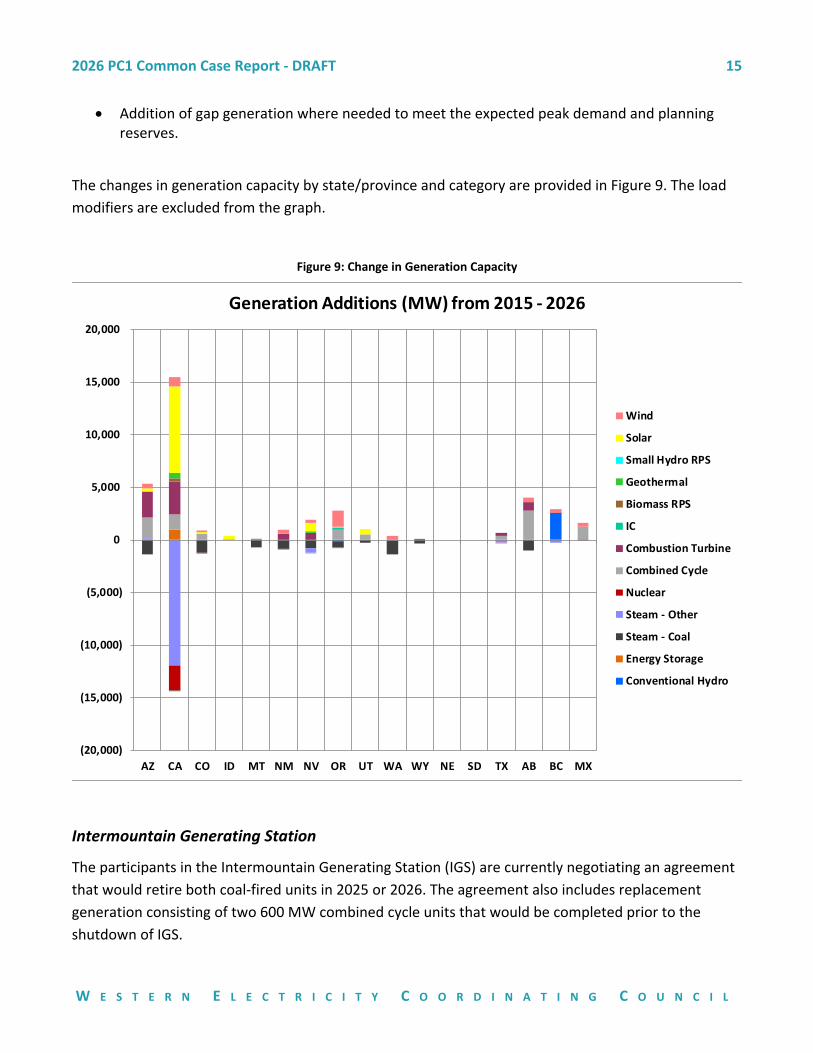
Addition of gap generation where needed to meet the expected peak demand and planning reserves.
The changes in generation capacity by state/province and category are provided in Figure 9. The load
modifiers are excluded from the graph.
Figure 9: Change in Generation Capacity
Intermountain Generating Station
The participants in the Intermountain Generating Station (IGS) are currently negotiating an agreement
that would retire both coal‐fired units in 2025 or 2026. The agreement also includes replacement
generation consisting of two 600 MW combined cycle units that would be completed prior to the
shutdown of IGS.
(20,000)
(15,000)
(10,000)
(5,000)
0
5,000
10,000
15,000
20,000
AZ CA CO ID MT NM NV OR UT WA WY NE SD TX AB BC MX
Generation Additions (MW) from 2015 ‐ 2026
Wind
Solar
Small Hydro RPS
Geothermal
Biomass RPS
IC
Combustion Turbine
Combined Cycle
Nuclear
Steam ‐ Other
Steam ‐ Coal
Energy Storage
Conventional Hydro
2026 PC1 Common Case Report ‐ DRAFT 16
W E S T E R N E L E C T R I C I T Y C O O R D I N A T I N G C O U N C I L
In the 2026 Common Case the IGS coal‐fired generation is not retired, and assumed to be available for
commitment and dispatch. Provided that the required State Implementation Plan (SIP) agreements are
in place, the IGS plans will be incorporated into the common case used for the 2017 TEPPC study
program.
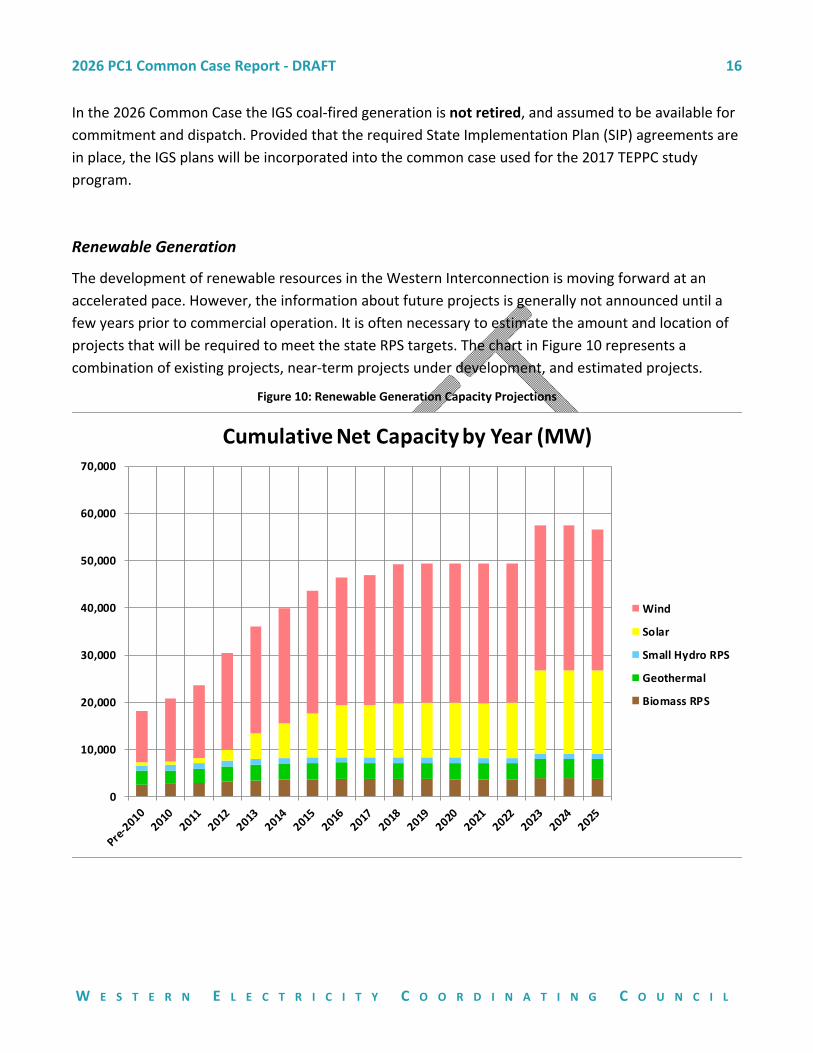
Renewable Generation
The development of renewable resources in the Western Interconnection is moving forward at an
accelerated pace. However, the information about future projects is generally not announced until a
few years prior to commercial operation. It is often necessary to estimate the amount and location of
projects that will be required to meet the state RPS targets. The chart in Figure 10 represents a
combination of existing projects, near‐term projects under development, and estimated projects.
Figure 10: Renewable Generation Capacity Projections
0
10,000
20,000
30,000
40,000
50,000
60,000
70,000
Cumulative Net Capacity by Year (MW)
Wind
Solar
Small Hydro RPS
Geothermal
Biomass RPS
2026 PC1 Common Case Report ‐ DRAFT 17
W E S T E R N E L E C T R I C I T Y C O O R D I N A T I N G C O U N C I L
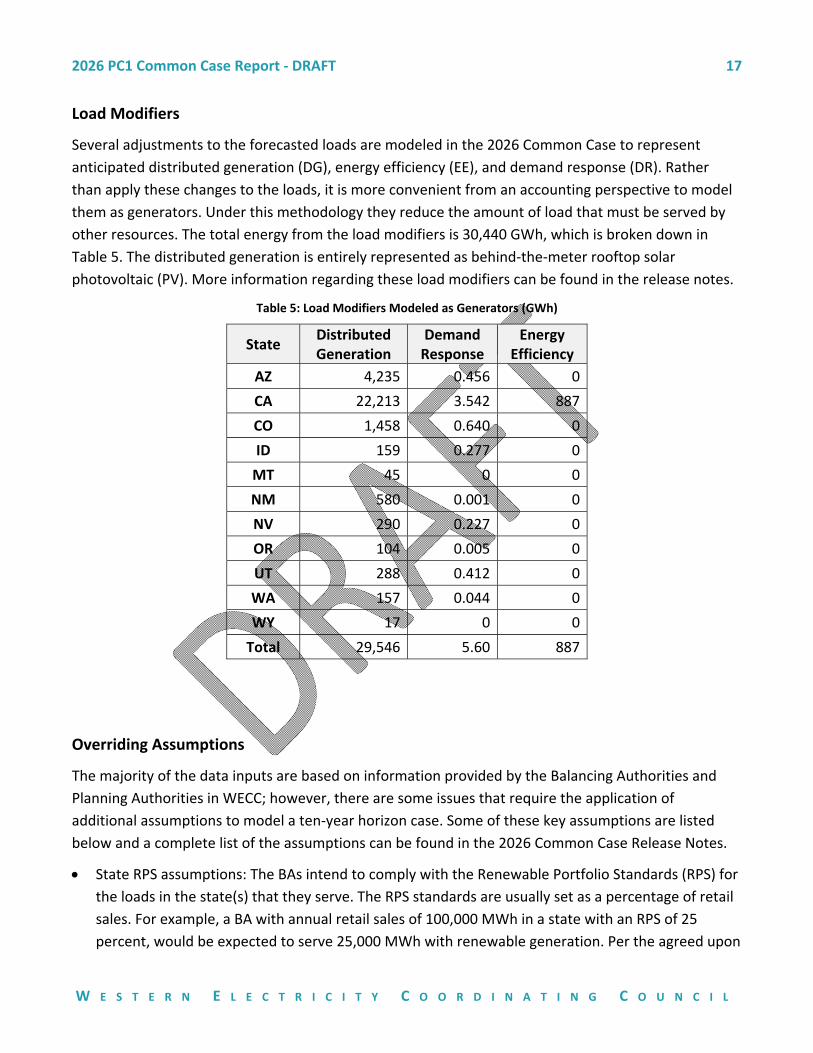
Load Modifiers
Several adjustments to the forecasted loads are modeled in the 2026 Common Case to represent
anticipated distributed generation (DG), energy efficiency (EE), and demand response (DR). Rather
than apply these changes to the loads, it is more convenient from an accounting perspective to model
them as generators. Under this methodology they reduce the amount of load that must be served by
other resources. The total energy from the load modifiers is 30,440 GWh, which is broken down in
Table 5. The distributed generation is entirely represented as behind‐the‐meter rooftop solar
photovoltaic (PV). More information regarding these load modifiers can be found in the release notes.
Table 5: Load Modifiers Modeled as Generators (GWh)
State Distributed Generation
Demand Response
Energy Efficiency
AZ 4,235 0.456 0
CA 22,213 3.542 887
CO 1,458 0.640 0
ID 159 0.277 0
MT 45 0 0
NM 580 0.001 0
NV 290 0.227 0
OR 104 0.005 0
UT 288 0.412 0
WA 157 0.044 0
WY 17 0 0
Total 29,546 5.60 887
Overriding Assumptions
The majority of the data inputs are based on information provided by the Balancing Authorities and
Planning Authorities in WECC; however, there are some issues that require the application of
additional assumptions to model a ten‐year horizon case. Some of these key assumptions are listed
below and a complete list of the assumptions can be found in the 2026 Common Case Release Notes.
State RPS assumptions: The BAs intend to comply with the Renewable Portfolio Standards (RPS) for
the loads in the state(s) that they serve. The RPS standards are usually set as a percentage of retail
sales. For example, a BA with annual retail sales of 100,000 MWh in a state with an RPS of 25
percent, would be expected to serve 25,000 MWh with renewable generation. Per the agreed upon

2026 PC1 Common Case Report ‐ DRAFT 18
W E S T E R N E L E C T R I C I T Y C O O R D I N A T I N G C O U N C I L
process, if the qualifying renewable generation in a state is deficient, additional resources are
selected from the generation in the next class(es)11 of generation.
BA Reserve Requirements: The BAs intend to meet their projected loads and reserve requirements.
Resources are selected from the class portfolios in order of class, until the RPS requirement is met
and the load and reserve are met.
Bilateral and Multi‐lateral power contractual arrangements: Although many of the of the
contractual arrangements between Generator Owners and Load‐Serving Entities (LSE) are modeled,
there is a significant portion that are not modeled.
Operating conditions: Several operating constraints that restrict certain aspects of the transmission
system are modeled using nomograms.
Key Data and Modeling Improvements
A summary of the key data and modeling improvements for the 2026 Common Case is provided below.
The complete list of improvements with detailed explanations can be found in the release notes.
Reserve Topology: The FERC 789 rules for reserve requirements were incorporated into the 2026
common case.
Minimum Local Generation: A recommendation from the CAISO was implemented that models a
requirement that certain combined cycle units be committed to provide frequency response for the
CAISO footprint. Nomograms are used to implement this requirement.
Back‐to‐Back DC Ties: The expected interchange with the Eastern Interconnection via the DC ties
was assumed to be zero at all locations.
Generator Cost Parameters: Volunteers from the California Energy Commission and ColumbiaGrid
used publicly available data to develop new heat rate curves for many of the key thermal
generators in WECC.
Additional Study Results
Other results of interest from the 2026 Common Case study are provided below, including generation
results by state/province for the whole year and for the peak hour, transmission path utilization, and
an analysis of California imports.
11 The established classes are: existing, under‐construction, approved and/or financed, and future conceptual.

2026 PC1 Common Case Report ‐ DRAFT 19
W E S T E R N E L E C T R I C I T Y C O O R D I N A T I N G C O U N C I L
Generation by State/Province
The generation results are reported here by their geographical location. The annual (geographical)
generation by state/province and fuel is provided in Figure 11.
Figure 11: Annual Generation by State and Fuel
Clearly, the generation from many resources is contractually12 committed to LSEs in other states or
provinces; however, the associated contracts and their details are often not publicly available to
provide a complete representation.
Renewable Energy Targets
There are ten states/provinces in WECC that have Renewable Portfolio Standards (RPS), namely,
Alberta, Arizona, California, Colorado, Montana, New Mexico, Oregon, Utah, and Washington. The
estimated amount of renewable energy that would be required for the RPS requirements in 2026 is
roughly 200,000 GWh.
As explained in the release notes, several of the RPS states have set limits on how much of the RPS
energy must be produced locally, versus how much can be imported in the form of energy delivered or
Renewable Energy Credits (REC). Two primary goals behind the limits are to protect in‐state
employment and generate tax revenue.
12 Data for known contracts is represented in the dataset and the associated units are exempted from wheeling charges.
0
50,000
100,000
150,000
200,000
250,000
300,000
AB AZ BC CA CO ID MT MX NE NM NV OR SD TX UT WA WY
Annual Generation (GWh) by State and Fuel ‐ 2026 WECC v1.7
Other Thermal
Energy Storage
Other Renewable
Wind
Solar
Nuclear
Hydro
Gas
Coal
2026 PC1 Common Case Report ‐ DRAFT 20
W E S T E R N E L E C T R I C I T Y C O O R D I N A T I N G C O U N C I L
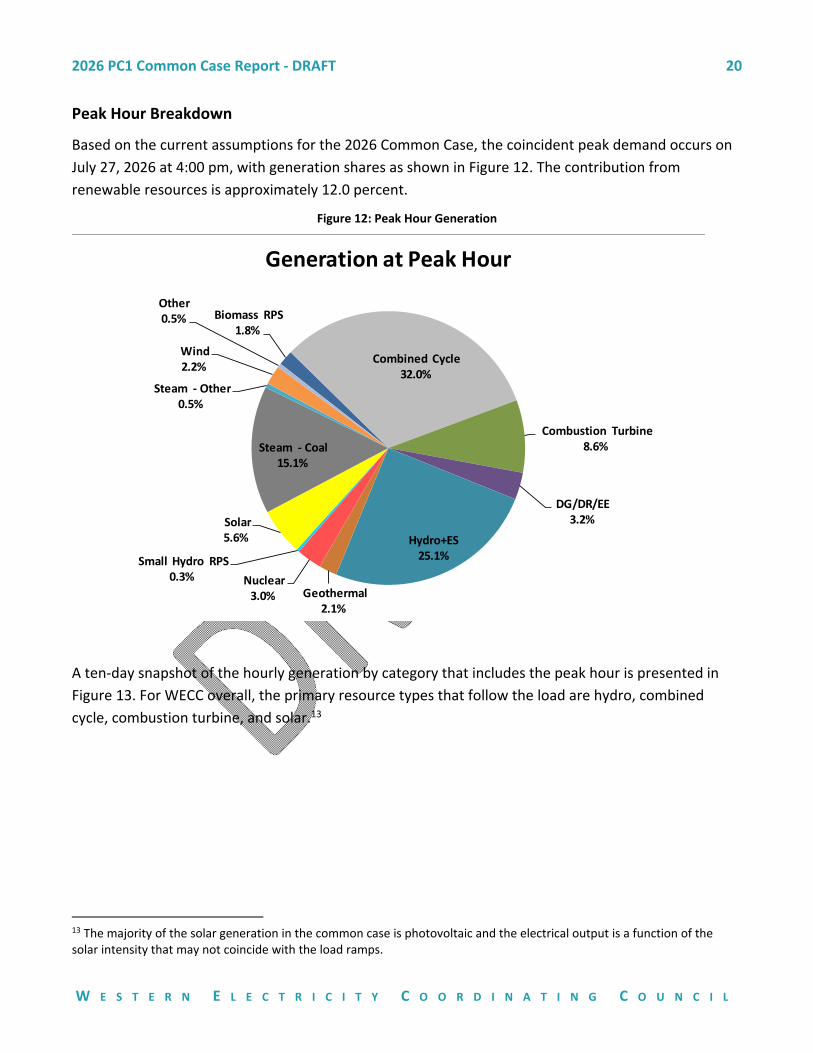
Peak Hour Breakdown
Based on the current assumptions for the 2026 Common Case, the coincident peak demand occurs on
July 27, 2026 at 4:00 pm, with generation shares as shown in Figure 12. The contribution from
renewable resources is approximately 12.0 percent.
Figure 12: Peak Hour Generation
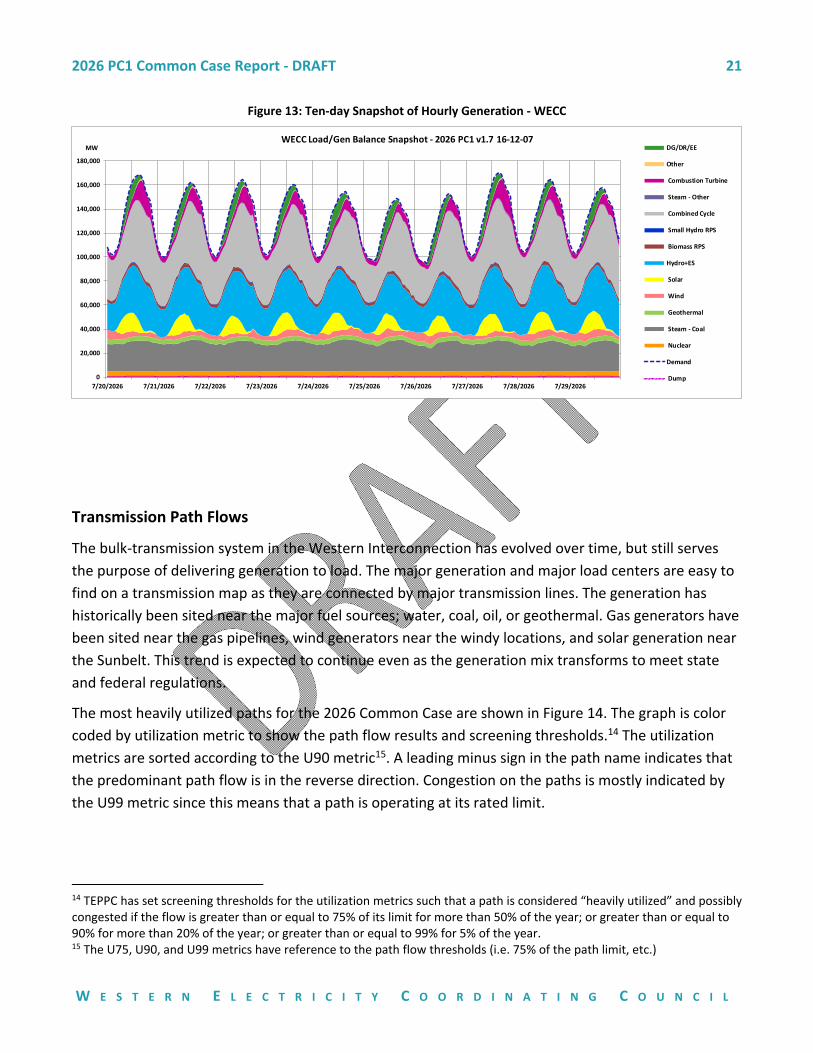
A ten‐day snapshot of the hourly generation by category that includes the peak hour is presented in
Figure 13. For WECC overall, the primary resource types that follow the load are hydro, combined
cycle, combustion turbine, and solar.13
13 The majority of the solar generation in the common case is photovoltaic and the electrical output is a function of the solar intensity that may not coincide with the load ramps.
Biomass RPS 1.8%
Combined Cycle 32.0%
Combustion Turbine 8.6%
DG/DR/EE3.2%
Hydro+ES25.1%
Geothermal 2.1%
Nuclear 3.0%
Small Hydro RPS 0.3%
Solar 5.6%
Steam ‐ Coal 15.1%
Steam ‐ Other 0.5%
Wind 2.2%
Other0.5%
Generation at Peak Hour
2026 PC1 Common Case Report ‐ DRAFT 21
W E S T E R N E L E C T R I C I T Y C O O R D I N A T I N G C O U N C I L
Figure 13: Ten‐day Snapshot of Hourly Generation ‐ WECC
Transmission Path Flows
The bulk‐transmission system in the Western Interconnection has evolved over time, but still serves
the purpose of delivering generation to load. The major generation and major load centers are easy to
find on a transmission map as they are connected by major transmission lines. The generation has
historically been sited near the major fuel sources; water, coal, oil, or geothermal. Gas generators have
been sited near the gas pipelines, wind generators near the windy locations, and solar generation near
the Sunbelt. This trend is expected to continue even as the generation mix transforms to meet state
and federal regulations.
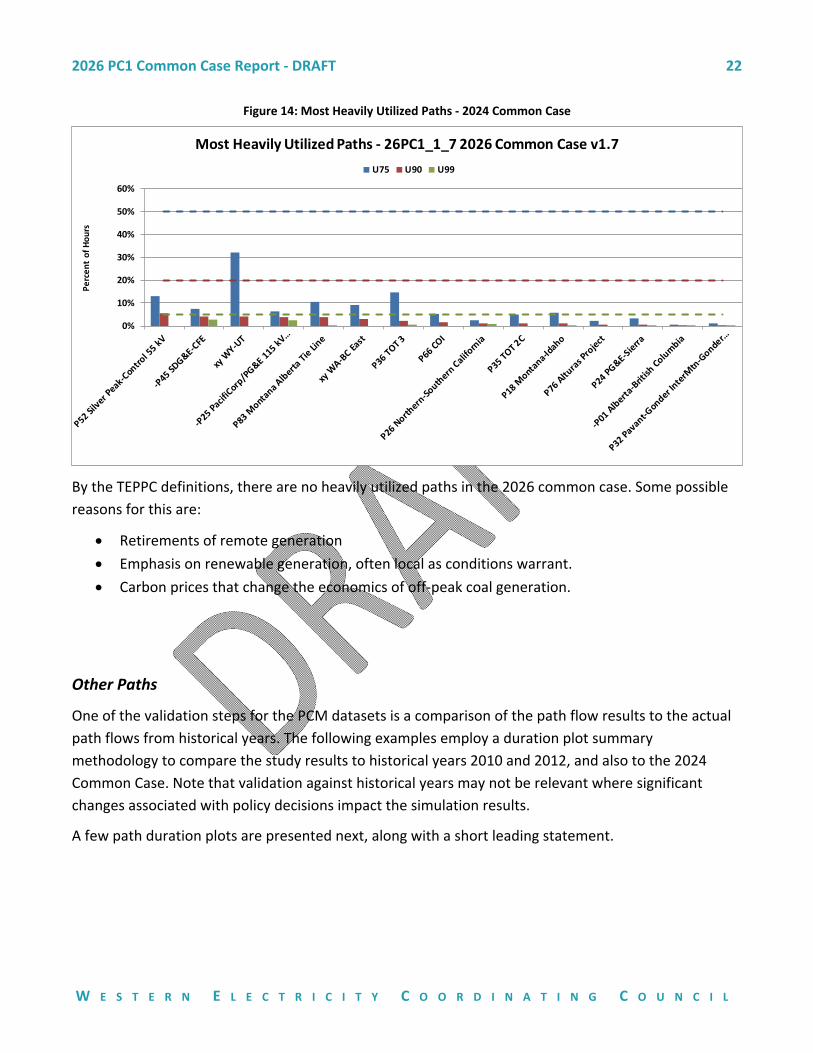
The most heavily utilized paths for the 2026 Common Case are shown in Figure 14. The graph is color
coded by utilization metric to show the path flow results and screening thresholds.14 The utilization
metrics are sorted according to the U90 metric15. A leading minus sign in the path name indicates that
the predominant path flow is in the reverse direction. Congestion on the paths is mostly indicated by
the U99 metric since this means that a path is operating at its rated limit.
14 TEPPC has set screening thresholds for the utilization metrics such that a path is considered “heavily utilized” and possibly congested if the flow is greater than or equal to 75% of its limit for more than 50% of the year; or greater than or equal to 90% for more than 20% of the year; or greater than or equal to 99% for 5% of the year. 15 The U75, U90, and U99 metrics have reference to the path flow thresholds (i.e. 75% of the path limit, etc.)
0
20,000
40,000
60,000
80,000
100,000
120,000
140,000
160,000
180,000
7/20/2026 7/21/2026 7/22/2026 7/23/2026 7/24/2026 7/25/2026 7/26/2026 7/27/2026 7/28/2026 7/29/2026
WECC Load/Gen Balance Snapshot ‐ 2026 PC1 v1.7 16‐12‐07DG/DR/EE
Other
Combustion Turbine
Steam ‐ Other
Combined Cycle
Small Hydro RPS
Biomass RPS
Hydro+ES
Solar
Wind
Geothermal
Steam ‐ Coal
Nuclear
Demand
Dump
MW
2026 PC1 Common Case Report ‐ DRAFT 22
W E S T E R N E L E C T R I C I T Y C O O R D I N A T I N G C O U N C I L
Figure 14: Most Heavily Utilized Paths ‐ 2024 Common Case
By the TEPPC definitions, there are no heavily utilized paths in the 2026 common case. Some possible
reasons for this are:
Retirements of remote generation
Emphasis on renewable generation, often local as conditions warrant.
Carbon prices that change the economics of off‐peak coal generation.
Other Paths
One of the validation steps for the PCM datasets is a comparison of the path flow results to the actual
path flows from historical years. The following examples employ a duration plot summary
methodology to compare the study results to historical years 2010 and 2012, and also to the 2024
Common Case. Note that validation against historical years may not be relevant where significant
changes associated with policy decisions impact the simulation results.
A few path duration plots are presented next, along with a short leading statement.
0%
10%
20%
30%
40%
50%
60%
Percent of Hours
Most Heavily Utilized Paths ‐ 26PC1_1_7 2026 Common Case v1.7
U75 U90 U99

2026 PC1 Common Case Report ‐ DRAFT 23
W E S T E R N E L E C T R I C I T Y C O O R D I N A T I N G C O U N C I L
The results for path 3 in Figure 15 show a good correlation to historic flows.
Figure 15: Path 3
The results for path 26 show a good match to historical.
Figure 16: Path 26
The impact of the California Global Warming Solutions Act (AB32) is evident in the path flow results for
path 27 in Figure 17. The carbon price adder reduces the economics of the Intermountain coal plant.
‐4000
‐3000
‐2000
‐1000
0
1000
2000
3000
4000
Meg
awat
ts
P03 Northwest‐British Columbia Path Duration Plots
2010 2012 2024_PC1_1_5 2026_PC1_1_7
Net GWh: 4827 ‐2545 ‐4134 ‐3392
‐4000
‐3000
‐2000
‐1000
0
1000
2000
3000
4000
5000
Meg
awat
ts
P26 Northern‐Southern California Path Duration Plots
2010 2012 2024_PC1_1_5 2026_PC1_1_7
Net GWh: 5752 7348 11725 3530

2026 PC1 Common Case Report ‐ DRAFT 24
W E S T E R N E L E C T R I C I T Y C O O R D I N A T I N G C O U N C I L
Figure 17: Path 27
The energy deliveries on path 46 were lower than historical, likely impacted by the renewable build‐
out in California as well as the effects of AB32.
Figure 18: Path 46
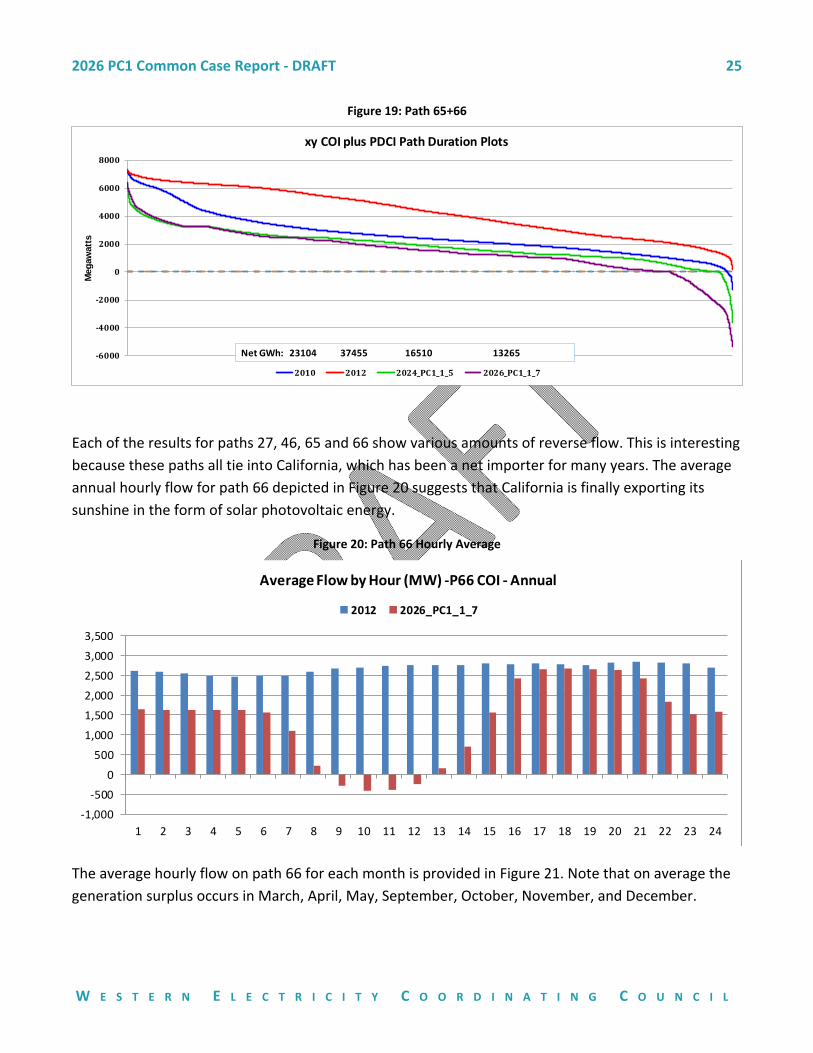
The results for the combination of Path 65 (PDCI) and Path 66 (COI) in Figure 19 have raised some
concerns because the flows are lower than historical and also flow south to north for 10 percent of the
year.
‐2000
‐1500
‐1000
‐500
0
500
1000
1500
2000
2500
3000
Meg
awat
ts
P27 Intermountain Power Project DC Line Path Duration Plots
2010 2012 2024_PC1_1_5 2026_PC1_1_7
Net GWh: 12471 11076 8287 6604
‐15000
‐10000
‐5000
0
5000
10000
15000
Meg
awat
ts
P46 West of Colorado River (WOR) Path Duration Plots
2010 2012 2024_PC1_1_5 2026_PC1_1_7
Net GWh: 44091 44955 33554 30172
2026 PC1 Common Case Report ‐ DRAFT 25
W E S T E R N E L E C T R I C I T Y C O O R D I N A T I N G C O U N C I L
Figure 19: Path 65+66
Each of the results for paths 27, 46, 65 and 66 show various amounts of reverse flow. This is interesting
because these paths all tie into California, which has been a net importer for many years. The average
annual hourly flow for path 66 depicted in Figure 20 suggests that California is finally exporting its
sunshine in the form of solar photovoltaic energy.
Figure 20: Path 66 Hourly Average
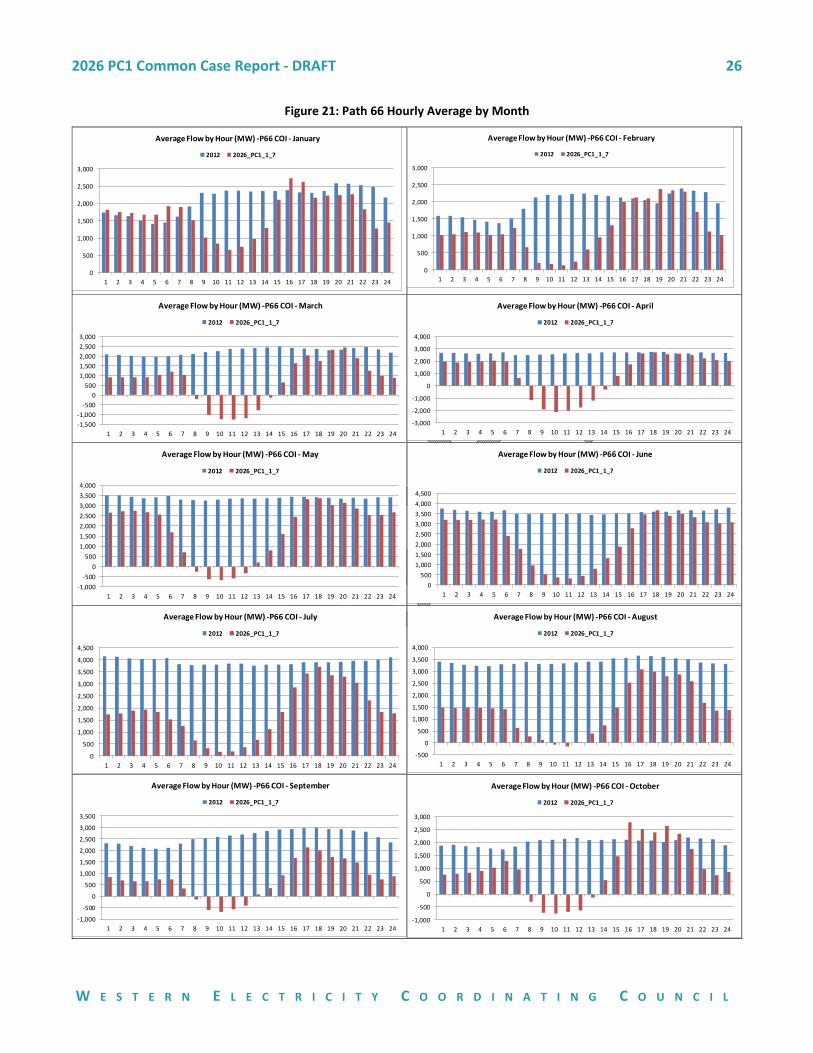
The average hourly flow on path 66 for each month is provided in Figure 21. Note that on average the
generation surplus occurs in March, April, May, September, October, November, and December.
‐6000
‐4000
‐2000
0
2000
4000
6000
8000
Meg
awat
ts
xy COI plus PDCI Path Duration Plots
2010 2012 2024_PC1_1_5 2026_PC1_1_7
Net GWh: 23104 37455 16510 13265
‐1,000
‐500
0
500
1,000
1,500
2,000
2,500
3,000
3,500
1 2 3 4 5 6 7 8 9 10 11 12 13 14 15 16 17 18 19 20 21 22 23 24
Average Flow by Hour (MW) ‐P66 COI ‐Annual
2012 2026_PC1_1_7
2026 PC1 Common Case Report ‐ DRAFT 26
W E S T E R N E L E C T R I C I T Y C O O R D I N A T I N G C O U N C I L
Figure 21: Path 66 Hourly Average by Month
0
500
1,000
1,500
2,000
2,500
3,000
1 2 3 4 5 6 7 8 9 10 11 12 13 14 15 16 17 18 19 20 21 22 23 24
Average Flow by Hour (MW) ‐P66 COI ‐ January
2012 2026_PC1_1_7
0
500
1,000
1,500
2,000
2,500
3,000
1 2 3 4 5 6 7 8 9 10 11 12 13 14 15 16 17 18 19 20 21 22 23 24
Average Flow by Hour (MW) ‐P66 COI ‐ February
2012 2026_PC1_1_7
‐1,500
‐1,000
‐500
0
500
1,000
1,500
2,000
2,500
3,000
1 2 3 4 5 6 7 8 9 10 11 12 13 14 15 16 17 18 19 20 21 22 23 24
Average Flow by Hour (MW) ‐P66 COI ‐March
2012 2026_PC1_1_7
‐3,000
‐2,000
‐1,000
0
1,000
2,000
3,000
4,000
1 2 3 4 5 6 7 8 9 10 11 12 13 14 15 16 17 18 19 20 21 22 23 24
Average Flow by Hour (MW) ‐P66 COI ‐April
2012 2026_PC1_1_7
‐1,000
‐500
0
500
1,000
1,500
2,000
2,500
3,000
3,500
4,000
1 2 3 4 5 6 7 8 9 10 11 12 13 14 15 16 17 18 19 20 21 22 23 24
Average Flow by Hour (MW) ‐P66 COI ‐May
2012 2026_PC1_1_7
0
500
1,000
1,500
2,000
2,500
3,000
3,500
4,000
4,500
1 2 3 4 5 6 7 8 9 10 11 12 13 14 15 16 17 18 19 20 21 22 23 24
Average Flow by Hour (MW) ‐P66 COI ‐ June
2012 2026_PC1_1_7
0
500
1,000
1,500
2,000
2,500
3,000
3,500
4,000
4,500
1 2 3 4 5 6 7 8 9 10 11 12 13 14 15 16 17 18 19 20 21 22 23 24
Average Flow by Hour (MW) ‐P66 COI ‐ July
2012 2026_PC1_1_7
‐500
0
500
1,000
1,500
2,000
2,500
3,000
3,500
4,000
1 2 3 4 5 6 7 8 9 10 11 12 13 14 15 16 17 18 19 20 21 22 23 24
Average Flow by Hour (MW) ‐P66 COI ‐August
2012 2026_PC1_1_7
‐1,000
‐500
0
500
1,000
1,500
2,000
2,500
3,000
3,500
1 2 3 4 5 6 7 8 9 10 11 12 13 14 15 16 17 18 19 20 21 22 23 24
Average Flow by Hour (MW) ‐P66 COI ‐ September
2012 2026_PC1_1_7
‐1,000
‐500
0
500
1,000
1,500
2,000
2,500
3,000
1 2 3 4 5 6 7 8 9 10 11 12 13 14 15 16 17 18 19 20 21 22 23 24
Average Flow by Hour (MW) ‐P66 COI ‐October
2012 2026_PC1_1_7
2026 PC1 Common Case Report ‐ DRAFT 27
W E S T E R N E L E C T R I C I T Y C O O R D I N A T I N G C O U N C I L
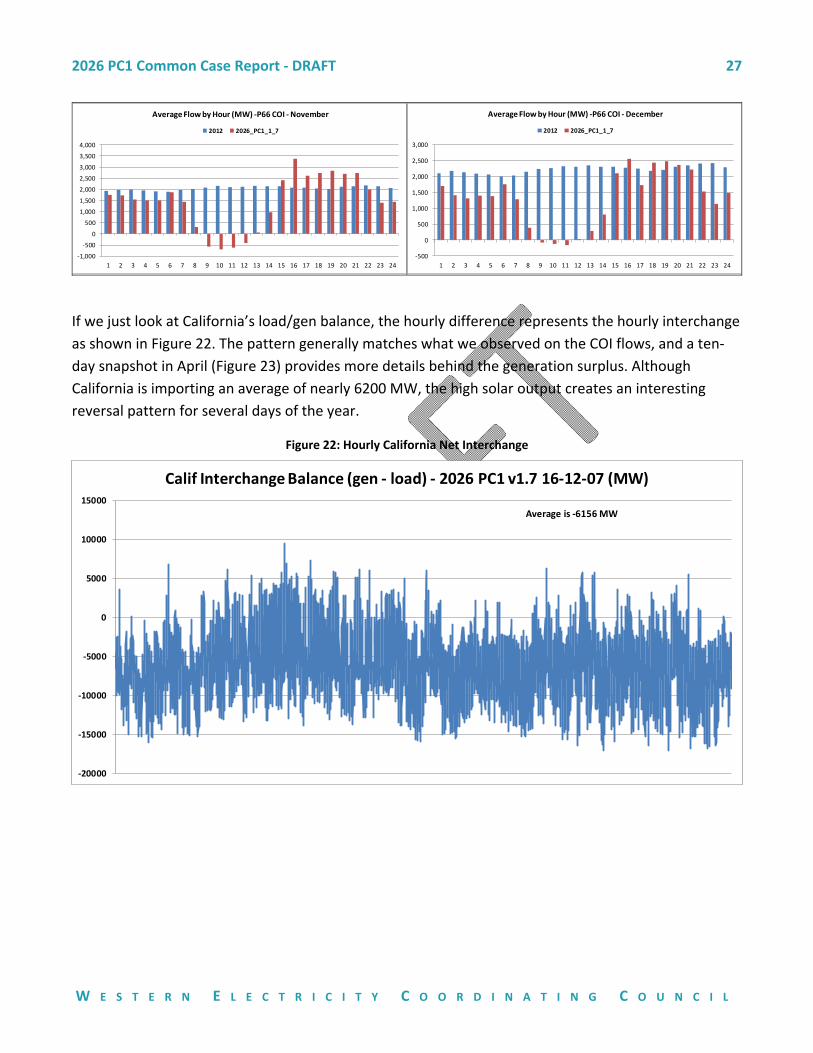
If we just look at California’s load/gen balance, the hourly difference represents the hourly interchange
as shown in Figure 22. The pattern generally matches what we observed on the COI flows, and a ten‐
day snapshot in April (Figure 23) provides more details behind the generation surplus. Although
California is importing an average of nearly 6200 MW, the high solar output creates an interesting
reversal pattern for several days of the year.
Figure 22: Hourly California Net Interchange
‐1,000
‐500
0
500
1,000
1,500
2,000
2,500
3,000
3,500
4,000
1 2 3 4 5 6 7 8 9 10 11 12 13 14 15 16 17 18 19 20 21 22 23 24
Average Flow by Hour (MW) ‐P66 COI ‐November
2012 2026_PC1_1_7
‐500
0
500
1,000
1,500
2,000
2,500
3,000
1 2 3 4 5 6 7 8 9 10 11 12 13 14 15 16 17 18 19 20 21 22 23 24
Average Flow by Hour (MW) ‐P66 COI ‐December
2012 2026_PC1_1_7
‐20000
‐15000
‐10000
‐5000
0
5000
10000
15000
Calif Interchange Balance (gen ‐ load) ‐ 2026 PC1 v1.7 16‐12‐07 (MW)
Average is ‐6156 MW

2026 PC1 Common Case Report ‐ DRAFT 28
W E S T E R N E L E C T R I C I T Y C O O R D I N A T I N G C O U N C I L
Figure 23: April Snapshot for California
The California imports include output from several jointly‐owned projects and large‐scale purchases,
including shares of Agua Caliente, Apex, Arlington Valley, Arlington Wind, Big Horn, Copper Mountain
Solar, Desert Star, Dixie Valley, Don A. Campbell Geothermal, ESJ Wind, Glacier Wind, Hoover,
Horseshoe Bend, Hurlburt Wind, Intermountain Generating Station, Klondike Wind, La Rosita, Leaning
Juniper Wind, Linden Wind, Mesquite Solar, Milford Wind, Palo Verde, Parker Dam, Pebble Springs
Wind, Simpson Tacoma, Star Point Wind, Termo Mexicali, Tuolumne Wind, Vantage Wind, Willow
Creek Wind, and Windy Flats.
The delivery of a few of these projects is encouraged in the PCM by exempting them from wheeling
charges and assigning the participants in the reserve distribution table. However, the commitment and
dispatch in California does require sufficient local resources to provide frequency response, inertia, and
voltage support.
Conclusions and Observations
The portion of the annual WECC generation by renewable resources in the 2026 Common Case was
19.9 percent, including the incremental distributed solar resources. This represents an increase of
2.6 percent from the 2024 Common Case.
The model seems to manage the “duck curve” in California quite easily, perhaps by using imports to
supplement the morning and evening ramps. Operational challenges are making it difficult for
some owners of large combined cycle facilities to remain profitable, and more power market
related issues like Sutter and La Paloma could be coming.
0
5,000
10,000
15,000
20,000
25,000
30,000
35,000
40,000
45,000
4/6/2026 4/7/2026 4/8/2026 4/9/2026 4/10/2026 4/11/2026 4/12/2026 4/13/2026 4/14/2026 4/15/2026
Calif Load/Gen Balance Snapshot ‐ 2026 PC1 v1.7 16‐12‐07DG/DR/EE
Other
Combustion Turbine
Steam ‐ Other
Combined Cycle
Small Hydro RPS
Biomass RPS
Hydro+ES
Solar
Wind
Geothermal
Steam ‐ Coal
Nuclear
Demand
Dump
MW

2026 PC1 Common Case Report ‐ DRAFT 29
W E S T E R N E L E C T R I C I T Y C O O R D I N A T I N G C O U N C I L
Currently the development of hourly load forecasts for each load area involves the application of
historical hourly shapes from a single year to the firm16 monthly peak and energy forecasts. The
process introduces some errors due to changes in long‐term trends (2009 vs. 2026) and actual year
anomalies, although the tool has different options that can correct some of the errors. The failure
of the process often leads to “clipping” of the peaks or valleys, shifts up or down, abnormal load
factors, and/or large daily swings (see Figure 25 for an example). In the future, stakeholders may
want to consider other methodologies for adding hourly shapes to the monthly peak and energy
forecasts. Perhaps something that is more in line with how load forecasts are actually developed by
the BA’s and LSE’s, where multiple years of data are used and random anomalies are filtered out.
As mentioned at the beginning of the report, the GridView Look‐ahead logic was not turned on for
this case. While there are advantages to using this capability, the calculations are impacted by the
generator cost parameters that have not been reviewed since 2012. One of the expected
improvements of using the look ahead logic is better utilization of the energy storage resources. In
the example in Figure 24, the energy storage appears to be supporting the afternoon ramps as the
solar output falls. Perhaps the look ahead would increase the storage, and provide for additional
displacement of combustion turbine units.
Figure 24: Energy Storage ‐ Peak Week
The concerns about the south to north flows on path 66 are hopefully alleviated by some of the
analysis presented above. The periods of surplus generation in California are associated with the
daily ramp‐up of solar generation, and a region with very few solar resources such as the northwest
is a good market for any surplus.
16 The forecasts include firm and non‐firm components of demand and energy. By only using the firm component WECC is assuming that the non‐firm customers will not be served.
‐3,000
‐2,000
‐1,000
0
1,000
2,000
3,000
4,000
7/20/2026 7/21/2026 7/22/2026 7/23/2026 7/24/2026 7/25/2026 7/26/2026 7/27/2026 7/28/2026 7/29/2026
Energy Storage (MW) ‐WECC

2026 PC1 Common Case Report ‐ DRAFT 30
W E S T E R N E L E C T R I C I T Y C O O R D I N A T I N G C O U N C I L

2026 PC1 Common Case 31
W E S T E R N E L E C T R I C I T Y C O O R D I N A T I N G C O U N C I L
Appendix A
Additional Tables and Charts
Table 6: Cumulative Capacities (MW) by Type and Year
Pre‐2011
2011 2012 2013 2014 2015 2016 2017 2018 2019 2020 2021 2022 2023 2024 2025 2026
Conventional Hydro
64,031 64,188 64,346 64,720 65,585 66,807 67,134 67,168 67,080 67,017 66,919 66,901 66,901 68,015 68,005 68,005 68,005
Energy Storage 4,738 4,758 4,778 4,943 4,943 4,943 6,228 6,228 6,228 6,228 6,228 6,228 6,228 6,228 6,228 5,864 5,864
Steam ‐ Coal 37,927 38,569 38,505 37,730 37,312 36,858 36,498 34,822 34,492 32,874 31,619 31,365 30,651 30,651 29,601 28,757 27,989
Steam ‐ Other 19,020 18,860 18,389 16,853 15,792 14,463 14,392 10,730 10,947 10,947 4,826 4,713 4,639 3,479 3,269 2,939 2,939
Nuclear 9,632 9,632 9,632 7,482 7,482 7,482 7,482 7,482 7,482 7,482 7,482 7,482 7,482 7,482 7,482 5,082 5,082
Combined Cycle
50,475 51,277 52,331 53,725 55,270 58,666 59,600 60,623 62,151 62,710 63,994 64,504 64,798 65,075 64,955 64,955 64,955
Combustion Turbine
20,526 21,643 22,393 25,186 26,172 27,610 30,167 30,934 31,933 32,002 32,032 32,132 32,132 34,336 34,336 34,198 33,958
IC 760 809 809 809 828 1,048 1,048 1,048 1,048 1,048 1,048 1,048 1,048 1,048 1,048 1,048 1,048
Other 1,330 1,330 1,330 1,330 1,330 1,330 1,330 1,330 1,330 1,330 1,330 1,330 1,330 1,330 1,330 0 0
DG/DR/EE ‐ Incremental
0 0 0 0 0 0 294 294 294 294 294 294 294 21,286 21,286 21,286 21,286
Biomass RPS 2,643 2,847 3,150 3,291 3,490 3,602 3,637 3,637 3,637 3,637 3,613 3,513 3,513 3,834 3,834 3,794 3,794
Geothermal 2,908 3,043 3,181 3,408 3,448 3,483 3,518 3,494 3,475 3,475 3,501 3,501 3,501 4,050 4,050 4,085 4,085
Small Hydro RPS
1,159 1,174 1,174 1,174 1,174 1,181 1,181 1,181 1,181 1,181 1,116 1,116 1,116 1,116 1,116 1,116 1,116
Solar 741 1,036 2,335 5,569 7,280 9,282 10,949 11,028 11,437 11,517 11,597 11,625 11,639 17,758 17,773 17,765 17,745
Wind 13,227 15,498 20,555 22,462 24,522 25,934 27,019 27,499 29,321 29,521 29,521 29,520 29,520 30,587 30,587 29,725 29,725

2026 PC1 Common Case Report ‐ DRAFT 32
W E S T E R N E L E C T R I C I T Y C O O R D I N A T I N G C O U N C I L
Figure 25: Failure of Load Shaping
1500
2000
2500
3000
3500
4000
4500
5000
5500
1
141
281
421
561
701
841
981
1121
1261
1401
1541
1681
1821
1961
2101
2241
2381
2521
2661
2801
2941
3081
3221
3361
3501
3641
3781
3921
4061
4201
4341
4481
4621
4761
4901
5041
5181
5321
5461
5601
5741
5881
6021
6161
6301
6441
6581
6721
6861
7001
7141
7281
7421
7561
7701
7841
7981
8121
8261
8401
8541
8681
PSEI ‐ 2009 actual PSEI ‐ 2026 v1.5
Related Documents