TephraNet: Wireless Self-Organizing Network Platform for Environmental Sensing By Andrew J. Wheeler Submitted to the Department of Electrical Engineering and Computer Science in Partial Fulfillment of the Requirements for the Degree of Master of Engineering in Electrical Engineering and Computer Science at the MASSACHUSETTS INSTITUTE OF TECHNOLOGY August 2001 © Massachusetts Institute of Technology. All Rights Reserved. Author___________________________________________________________ ______ Department of Electrical Engineering and Computer Science August 10, 2001 Certified by_____________________________________________________________ Michael J. Hawley Assistant Professor of Media Arts and Sciences Thesis Supervisor Accepted by____________________________________________________________ Arthur C. Smith Chairman, Department Committee on Graduate Theses

Welcome message from author
This document is posted to help you gain knowledge. Please leave a comment to let me know what you think about it! Share it to your friends and learn new things together.
Transcript
TephraNet: Wireless Self-Organizing Network Platform for Environmental Sensing
By
Andrew J. Wheeler
Submitted to the Department of Electrical Engineering and Computer Science in Partial Fulfillment of the Requirements for the Degree of
Master of Engineering in Electrical Engineering and Computer Science
at the
MASSACHUSETTS INSTITUTE OF TECHNOLOGY
August 2001
© Massachusetts Institute of Technology. All Rights Reserved.
Author_________________________________________________________________
Department of Electrical Engineering and Computer Science August 10, 2001
Certified by_____________________________________________________________
Michael J. Hawley Assistant Professor of Media Arts and Sciences
Thesis Supervisor
Accepted by____________________________________________________________
Arthur C. Smith Chairman, Department Committee on Graduate Theses
2
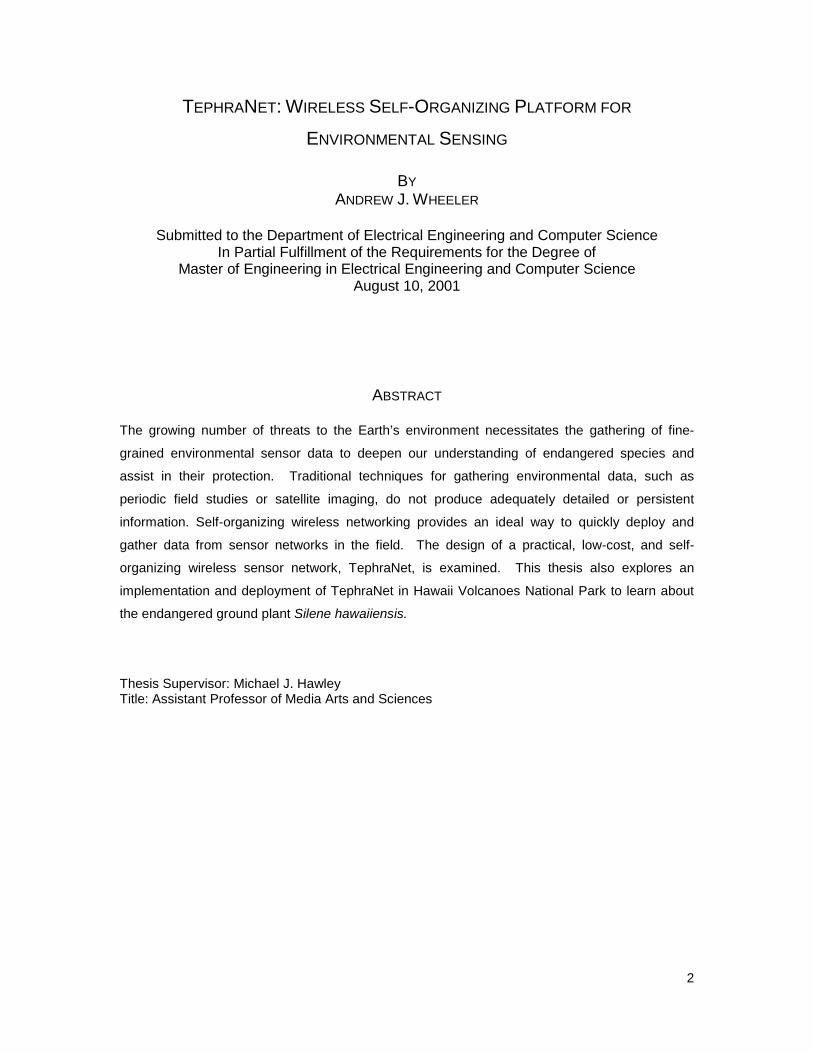
TEPHRANET: WIRELESS SELF-ORGANIZING PLATFORM FOR
ENVIRONMENTAL SENSING
BY ANDREW J. WHEELER
Submitted to the Department of Electrical Engineering and Computer Science
In Partial Fulfillment of the Requirements for the Degree of Master of Engineering in Electrical Engineering and Computer Science
August 10, 2001
ABSTRACT
The growing number of threats to the Earth’s environment necessitates the gathering of fine-
grained environmental sensor data to deepen our understanding of endangered species and
assist in their protection. Traditional techniques for gathering environmental data, such as
periodic field studies or satellite imaging, do not produce adequately detailed or persistent
information. Self-organizing wireless networking provides an ideal way to quickly deploy and
gather data from sensor networks in the field. The design of a practical, low-cost, and self-
organizing wireless sensor network, TephraNet, is examined. This thesis also explores an
implementation and deployment of TephraNet in Hawaii Volcanoes National Park to learn about
the endangered ground plant Silene hawaiiensis.
Thesis Supervisor: Michael J. Hawley Title: Assistant Professor of Media Arts and Sciences

3
Acknowledgements
No project as large and ambitious as the design and deployment of TephraNet would be possible without the support of many people. The author would like to extend a special thanks to the following people and organizations.
Prof. Michael Hawley for encouraging me to do things and go places I wouldn’t have even imagined a few years ago and for building such a diverse and talented group of people to work with in PIA. Also thanks for the many great pictures of this project that appear in this thesis.
Prof. Kim Bridges and the rest of University of Hawaii PODS Team for providing a real application for TephraNet, and for their limitless patience with its multiple revisions and field test failures.
Dr. Robert Poor, for taking a leap of faith in me when I was an undergraduate sophomore with the Everest Project, getting me interested in this whole wireless self-organizing thing, and for all his work, support, and guidance through this project.
Roshan Baliga, Ben Brown, Paul Pham, my amazing UROPs, who dedicated crazy amounts of time to this, and made it possible- porting operating systems, hacking assembly code, and doing lots of hardware design and debugging, even while the Waikiki Beach was calling.
Chris Newell, for providing a superhuman amount of administrative support and encouragement and generally making everything happen- and going way beyond the call of duty to assist in any way.
Paul Covell, for taking time out of his job and life to help out on this project, and for coming out to Hawaii and keeping me sane.
Matt Reynolds for putting up with my many RF questions, all the design advice he gave, and the generous use of his RF test gear.
Charlotte Burgess Auburn for her encouragement throughout this project, and all her many hours of assistance in editing this thesis.
The generous support of Dr. Sri Kumar and the SensIT program at DARPA, who provided much of the funding for this project and provided a collaborative environment in which this joint University of Hawaii/MIT Media Lab project could occur.
The National Park Service and US Geological Survey Hawaiian Volcano Observatory for their interest in this project and for providing the wonderful facilities, internet connections, and study site that we used while in the field.
My parents, Dr. James and Prof. Erlinda Wheeler, for all their support throughout my life, putting education first, and for always encouraging me to do my best at anything I did.
4
Table of Contents
CHAPTER 1 OVERVIEW............................................................................................................ 8
1.1 Introduction ..................................................................................................................... 8
1.2 Motivation ....................................................................................................................... 9
1.2.1 Platform for the study of Self-Organizing Wireless Networks ........................... 9 1.2.2 Proof of concept for self-organizing wireless networks applied to environmental sensing ................................................................................................... 10 1.2.3 Validation of GRAd Routing Algorithm ............................................................ 10 1.2.4 Scope............................................................................................................... 11
1.3 Thesis Structure............................................................................................................ 11
CHAPTER 2 BACKGROUND RESEARCH AND CONTEXT ................................................... 12
2.1 Existing Environmental Sensing Technologies ............................................................ 12
2.2 Self-Organizing Wireless Network Research ............................................................... 14
CHAPTER 3 TEPHRANET SYSTEM DESIGN......................................................................... 17
3.1 Functional Description .................................................................................................. 17
3.1.1 TephraNet as Sensor Network Demonstration................................................ 17 3.1.2 TephraNet as Networking Algorithm Testbed ................................................. 17
3.2 Design Goals ................................................................................................................ 18
3.2.1 Manufacturability.............................................................................................. 18 3.2.2 Low Power ....................................................................................................... 18 3.2.3 Ease of Development and Software Flexibility ................................................ 18 3.2.4 Autonomous..................................................................................................... 19
3.3 Hardware Platform Description..................................................................................... 19
3.3.1 Radio ............................................................................................................... 21 3.3.2 Radio Baseband Processor............................................................................. 22 3.3.3 Main Microprocessor ....................................................................................... 22 3.3.4 Memory............................................................................................................ 23 3.3.5 Expansion I/O .................................................................................................. 23 3.3.6 Power Supply................................................................................................... 24
3.4 Software Overview........................................................................................................ 24
3.4.1 Node Lifecycle ................................................................................................. 25 3.4.2 Radio Baseband Software............................................................................... 26 3.4.3 Operating System............................................................................................ 27 3.4.4 Packet Transmission and Reception ............................................................... 27 3.4.5 GRAd Routing Service .................................................................................... 29 3.4.6 Synchronization Service and Power Management.......................................... 29 3.4.7 Network Configuration and Statistics Gathering.............................................. 30
3.5 Summary ...................................................................................................................... 31

5
CHAPTER 4 IMPLEMENTATION AND DEPLOYMENT .......................................................... 32
4.1 Problem Background .................................................................................................... 32
4.2 Deployment Specific System Design............................................................................ 34
4.2.1 Sensors............................................................................................................ 34 4.2.2 Power Source .................................................................................................. 36 4.2.3 Gateway Node Antenna .................................................................................. 36 4.2.4 Enclosures ....................................................................................................... 37 4.2.5 Software........................................................................................................... 39
4.3 Deployment Plan .......................................................................................................... 41
4.3.1 Base Station .................................................................................................... 42 4.3.2 Node Placement .............................................................................................. 43
4.4 Hawaii Deployment 1.................................................................................................... 44
4.4.1 Overview.......................................................................................................... 44 4.4.2 Problems Encountered .................................................................................... 45 4.4.3 What Went Right.............................................................................................. 47
4.5 Hawaii Deployment 2.................................................................................................... 47
4.5.1 Overview.......................................................................................................... 47 4.5.2 Problems Encountered .................................................................................... 48 4.5.3 Ease of Deployment ........................................................................................ 48 4.5.4 Synchronization and Routing Algorithm Problems.......................................... 49
4.6 Summary ...................................................................................................................... 50
CHAPTER 5 RESULTS AND CONCLUSIONS ........................................................................ 51
5.1 Analysis ........................................................................................................................ 51
5.1.1 Ease of Use- The End User Perspective......................................................... 51 5.1.2 Sensor Network Demonstration....................................................................... 52 5.1.3 Network Algorithm Testbed ............................................................................. 53 5.1.4 System Goal Analysis...................................................................................... 53 5.1.5 Routing Algorithm Performance Analysis........................................................ 54 5.1.6 Synchronization System Review ..................................................................... 58
5.2 Future work................................................................................................................... 59
5.2.1 Redesign of Hardware Platform ...................................................................... 59 5.2.2 Long Term Deployment and Other Deployments............................................ 59 5.2.3 Use as a Test Platform .................................................................................... 59 5.2.4 Software Toolkit Refinements.......................................................................... 60 5.2.5 Refinement of Software Algorithms................................................................. 60
5.3 Contributions and Conclusions..................................................................................... 60
APPENDIX A: HARDWARE DESIGN............................................................................................ 61
APPENDIX B: SOURCE CODE LISTINGS ................................................................................... 67
REFERENCES............................................................................................................................. 125

6
7
Table of Figures
Figure 1.1 Silene hawaiiensis in Hawaii........................................................................................... 8 Figure 1.2 TephraNet Weather Rock ............................................................................................... 9 Figure 1.3 ArborNet........................................................................................................................ 11 Figure 2.1 Gathering Data in the Field........................................................................................... 12 Figure 2.2 Everest Weather Probe ................................................................................................ 13 Figure 2.3 Satellite Weather Map .................................................................................................. 13 Figure 2.4 COTS SmartDust Platform ........................................................................................... 15 Figure 3.1 TephraNodes ................................................................................................................ 17 Figure 3.2 TephraNode Hardware ................................................................................................. 20 Figure 3.3 TephraNode Hardware ................................................................................................. 20 Figure 3.4 TephraNode Software................................................................................................... 25 Figure 3.5 Node Lifecycle .............................................................................................................. 25 Figure 3.6 Baseband Functions ..................................................................................................... 26 Figure 4.1 Joint Project .................................................................................................................. 32 Figure 4.2 Nene Birds .................................................................................................................... 32 Figure 4.3 Hawaii Volcanoes National Park .................................................................................. 33 Figure 4.4 Silene hawaiiensis in SW Rift Zone.............................................................................. 33 Figure 4.5 Humidity Sensor in Rock .............................................................................................. 35 Figure 4.6 Wind Sensor showing sail............................................................................................. 35 Figure 4.7 Light Sensor Embedded in Fake Rock ......................................................................... 36 Figure 4.8 Rock Enclosure Drawing .............................................................................................. 37 Figure 4.9 Rocks at U of Hawaii Awaiting Deployment ................................................................. 38 Figure 4.10 Ohia Branch Assembly ............................................................................................... 38 Figure 4.11 Ohia Branch Enclosure in Tree .................................................................................. 39 Figure 4.12 Author Logs into a TephraNode ................................................................................. 41 Figure 4.13 Author in Volcano Observatory................................................................................... 42 Figure 4.14 Ohia Branches Awaiting Deployment ......................................................................... 42 Figure 4.15 Node Placement Plan ................................................................................................. 43 Figure 4.16 Overlapping Radio Ranges......................................................................................... 44 Figure 4.17 Deployed Node Positions ........................................................................................... 47 Figure 4.18 Placing Node in Ohia Tree.......................................................................................... 49 Figure 5.1 Difficulty with Placement............................................................................................... 52 Figure 5.2 Probability of Multi-hop Success .................................................................................. 55 Figure 5.3 Long Distance RF Communcations.............................................................................. 56 Figure 5.4 Unreliable Link Selection .............................................................................................. 57

8
Chapter 1 Overview
1.1 Introduction
Researchers at the University of Hawaii Botany Department would love to
understand the ecology of the rare Silene hawaiiensis plant. Existing only
in a tiny microclimate region at the edge of a volcano crater in Hawaii
Volcanoes National Park, little is known about this plant or its habitat. In
an age of satellites and weather stations everywhere, it is hard to believe
that so little could be known about the climate this plant lives in. The
details of its habitat are too small to be noticed by satellites. The nearest
weather station, a mere 3.5 miles away, is in a rainforest, while the Silene
plant appears to be growing in a desert.
Figure 1.1 Silene hawaiiensis in Hawaii
The lack of knowledge about the Silene plant and its habitat is just one
example of a much broader problem. The environment of the earth is
under siege. Pollution from industrial processes are reaching even the
most remote points of the earth and affecting the complex ecosystem in
ways that are barely understood. We have no time lapse view of the
earth’s environment. Tools that can capture a fine grained picture must be
developed — and must be self-maintaining if there is to be any hope of
blanketing the earth with them. The TephraNet system provides one
example of a tool that can be used to assist in gathering long term sensory
Little is known about the hardy Silene plant. It is found
only in one microclimate zone
on the Big Island of Hawaii.
Pho
to b
y K
im B
ridge
s
9
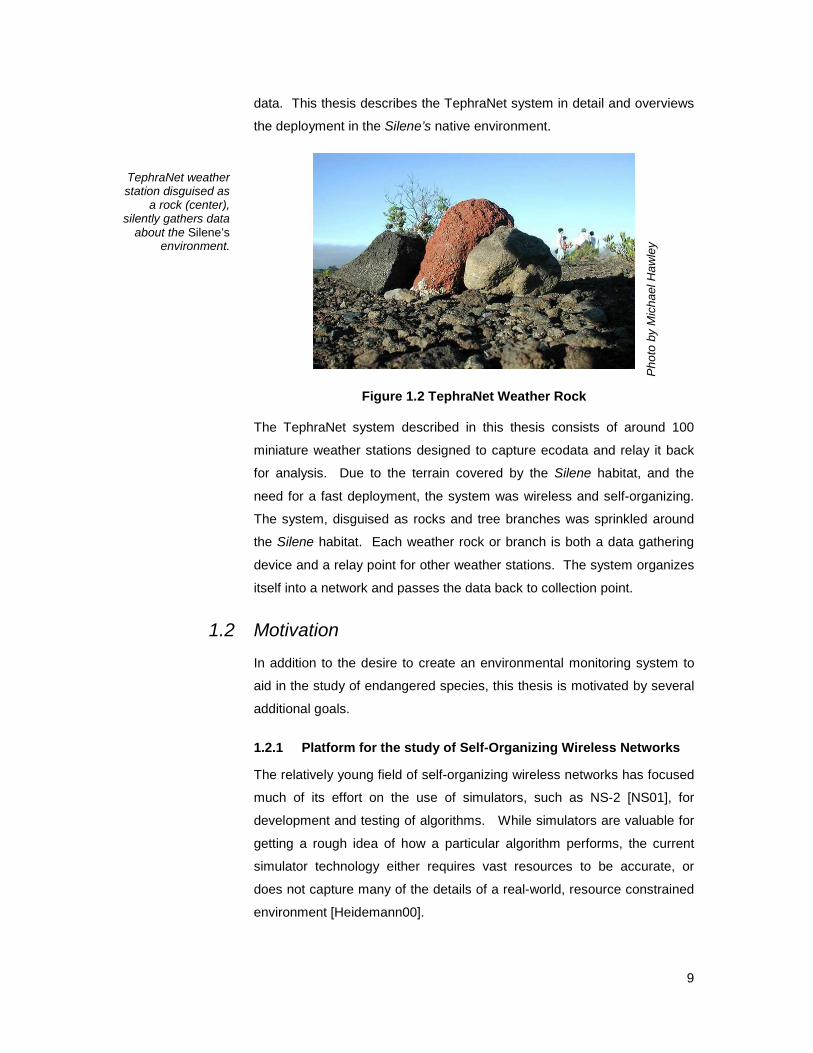
data. This thesis describes the TephraNet system in detail and overviews
the deployment in the Silene’s native environment.
Figure 1.2 TephraNet Weather Rock
The TephraNet system described in this thesis consists of around 100
miniature weather stations designed to capture ecodata and relay it back
for analysis. Due to the terrain covered by the Silene habitat, and the
need for a fast deployment, the system was wireless and self-organizing.
The system, disguised as rocks and tree branches was sprinkled around
the Silene habitat. Each weather rock or branch is both a data gathering
device and a relay point for other weather stations. The system organizes
itself into a network and passes the data back to collection point.
1.2 Motivation
In addition to the desire to create an environmental monitoring system to
aid in the study of endangered species, this thesis is motivated by several
additional goals.
1.2.1 Platform for the study of Self-Organizing Wireless Networks
The relatively young field of self-organizing wireless networks has focused
much of its effort on the use of simulators, such as NS-2 [NS01], for
development and testing of algorithms. While simulators are valuable for
getting a rough idea of how a particular algorithm performs, the current
simulator technology either requires vast resources to be accurate, or
does not capture many of the details of a real-world, resource constrained
environment [Heidemann00].
TephraNet weather station disguised as
a rock (center), silently gathers data
about the Silene’s environment.
Pho
to b
y M
icha
el H
awle
y
10
Since simulators alone are not adequate for detailed testing of self-
organizing wireless networks, a standard physical platform is needed to
complete the testing suite used. The few testing platforms that have been
built to date are primarily high cost and therefore prohibitive for research
on large networks [Cerpa01] [Rockwell01]. This suggests the need for a
low-cost, readily manufactured platform to serve as a standard testing
environment for self-organizing wireless networks.
1.2.2 Proof of concept for self-organizing wireless networks
applied to environmental sensing
An additional goal of this thesis is to demonstrate the viability of self-
organizing wireless networks as a tool for use in environmental sensing.
Current approaches, which are detailed below in Chapter 2, often yield
only a brief snapshot of an area, or a high level view that misses out on
important micro-climate details. Self-organizing wireless networks offer
one possible approach towards filling in the gap in the current set of tools.
The wireless and self-organizing network approach to these tools offers
potential advantages in setup and maintenance costs over traditional wired
approaches. Through the field deployment of a TephraNet system, this
thesis aims to show the usefulness of this technology as an environmental
research tool.
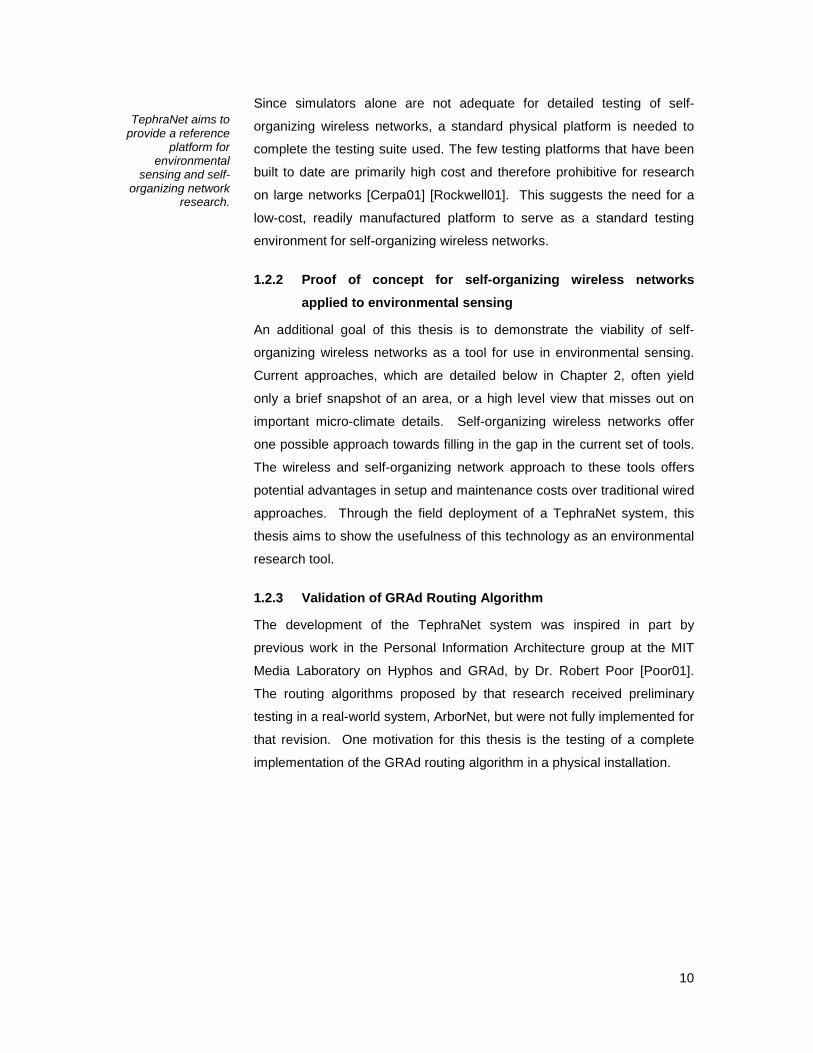
1.2.3 Validation of GRAd Routing Algorithm
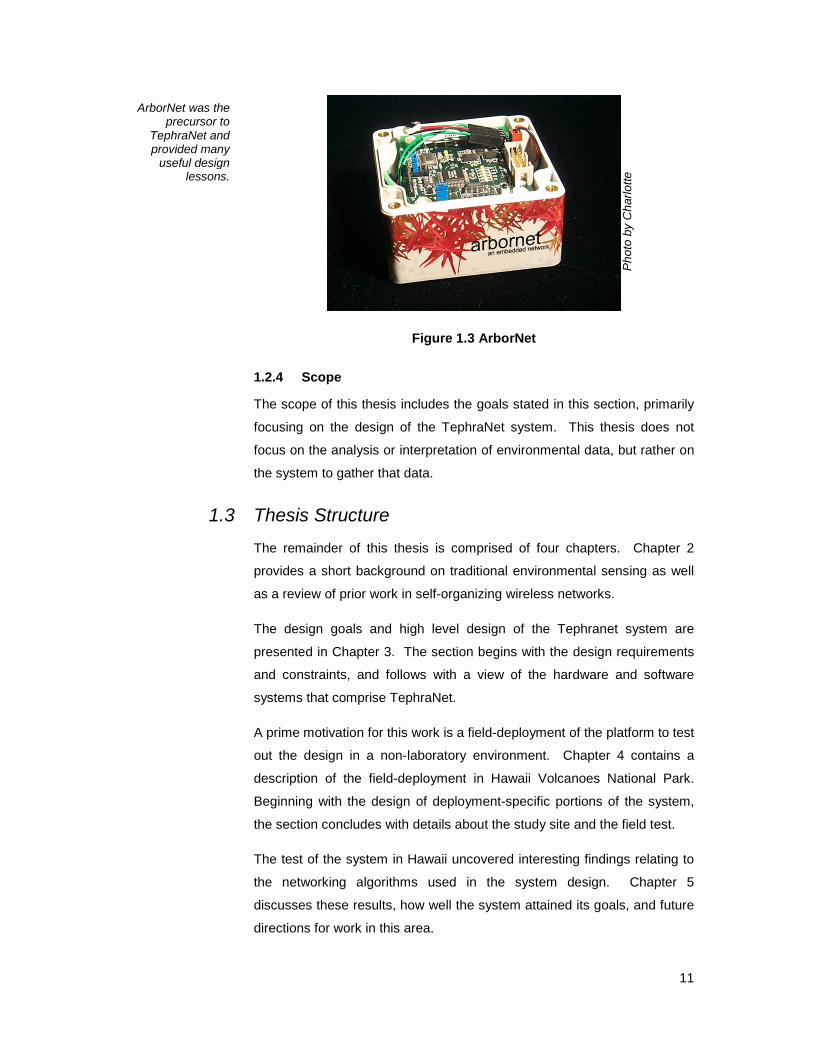
The development of the TephraNet system was inspired in part by
previous work in the Personal Information Architecture group at the MIT
Media Laboratory on Hyphos and GRAd, by Dr. Robert Poor [Poor01].
The routing algorithms proposed by that research received preliminary
testing in a real-world system, ArborNet, but were not fully implemented for
that revision. One motivation for this thesis is the testing of a complete
implementation of the GRAd routing algorithm in a physical installation.
TephraNet aims to provide a reference
platform for environmental
sensing and self-organizing network
research.
11
Figure 1.3 ArborNet
1.2.4 Scope
The scope of this thesis includes the goals stated in this section, primarily
focusing on the design of the TephraNet system. This thesis does not
focus on the analysis or interpretation of environmental data, but rather on
the system to gather that data.
1.3 Thesis Structure
The remainder of this thesis is comprised of four chapters. Chapter 2
provides a short background on traditional environmental sensing as well
as a review of prior work in self-organizing wireless networks.
The design goals and high level design of the Tephranet system are
presented in Chapter 3. The section begins with the design requirements
and constraints, and follows with a view of the hardware and software
systems that comprise TephraNet.
A prime motivation for this work is a field-deployment of the platform to test
out the design in a non-laboratory environment. Chapter 4 contains a
description of the field-deployment in Hawaii Volcanoes National Park.
Beginning with the design of deployment-specific portions of the system,
the section concludes with details about the study site and the field test.
The test of the system in Hawaii uncovered interesting findings relating to
the networking algorithms used in the system design. Chapter 5
discusses these results, how well the system attained its goals, and future
directions for work in this area.
ArborNet was the precursor to
TephraNet and provided many
useful design lessons.
Pho
to b
y C
harlo
tte
Bur
gess

12
Chapter 2 Background Research and Context
2.1 Existing Environmental Sensing Technologies
A review of the existing methods used for the collection of environmental
data for scientific research reveals a gap in the selection of tools that
motivated the design of the TephraNet system.
Existing methods for gathering environmental data about a study area fall
primarily into two categories. The first is what could be termed traditional
field measurement techniques, including scientists in the field, and
individual sensor devices, such as weather stations. The second primary
category is satellite imagery.
Figure 2.1 Gathering Data in the Field
Traditional field measurement techniques rely on researchers in the field
using hand-held and portable instrumentation to gather data about a
specific site. This works well for isolated or small regions, and for
measurements that do not need to be taken with frequency. However,
once a measurement is required with a frequency greater than weeks or
days, scientists usually turn to automated equipment, such as remote
weather probes.
Traditional field research involves
manual gathering of information in the
field.
Pho
to b
y M
icha
el H
awle
y
13
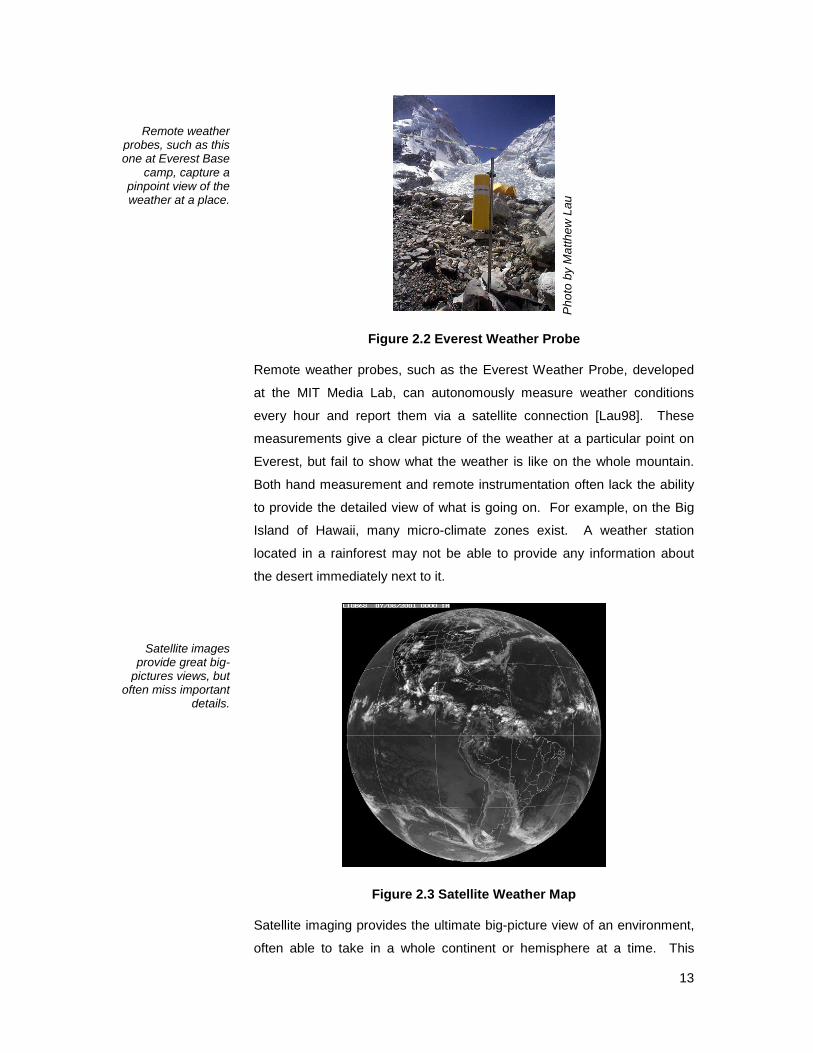
Figure 2.2 Everest Weather Probe
Remote weather probes, such as the Everest Weather Probe, developed
at the MIT Media Lab, can autonomously measure weather conditions
every hour and report them via a satellite connection [Lau98]. These
measurements give a clear picture of the weather at a particular point on
Everest, but fail to show what the weather is like on the whole mountain.
Both hand measurement and remote instrumentation often lack the ability
to provide the detailed view of what is going on. For example, on the Big
Island of Hawaii, many micro-climate zones exist. A weather station
located in a rainforest may not be able to provide any information about
the desert immediately next to it.
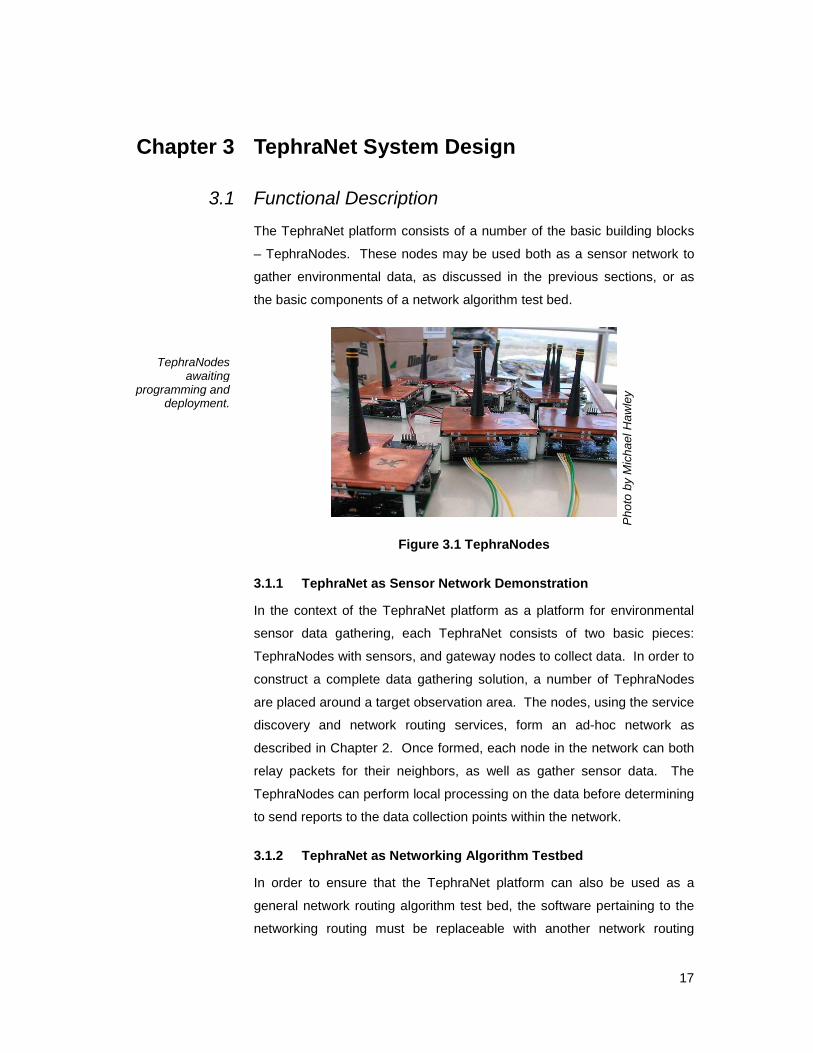
Figure 2.3 Satellite Weather Map
Satellite imaging provides the ultimate big-picture view of an environment,
often able to take in a whole continent or hemisphere at a time. This
Remote weather probes, such as this one at Everest Base
camp, capture a pinpoint view of the weather at a place.
Satellite images provide great big-
pictures views, but often miss important
details.
Pho
to b
y M
atth
ew L
au

14
overview image is useful for capturing geographically large trends, such as
the movements of a large storm. What satellite imagery is often lacking is
the fine grained detail that can captures the most important events or
trends in a small environment. A botanist wishing to learn about the
pollination mechanisms for a particular flower may wish to know the wind
characteristics right next to the plant- a level of detail beyond what a
weather satellite captures.
A new type of observation tool is required that can measure and record
detailed and long term information about an environment in a cost effective
manner. Consider the scenario where an animal researcher wishes to
learn what sort of sounds a particular animal makes when a very rare even
occurs. Traditional observation techniques such as a few hidden
microphones or a researcher in the field may take an unacceptable
amount of time or money to record the sound. If the habitat of the animal
could be blanketed with miniature sound recorders in a cost effective
manner, then the answer could be heard sooner.
2.2 Self-Organizing Wireless Network Research
One field of research in the networking and defense communities has
great potential for application to the environmental sensing problem. Self-
organizing (or ad-hoc) wireless sensor networking is an area that until
recently existed almost entirely in simulation. The research in this field
centers on the development of routing algorithms that allow a random
collection of wireless nodes to form a data network. Each node in the
network is not only a potential sensor or data source, but also a relay
node. The network is like a bucket brigade, where messages are passed
along from neighbor to neighbor on the way to the final destination.
These networks offer many advantages over traditional wireless
networking, including spatial frequency reuse, increased reliability, and low
setup and maintenance overhead. [Poor01] presents a good overview of
the advantages of this type of networking. An overview of the types of
routing algorithms present in the research field can be found in [Broch98]
and [Johansson99]. Readers interested in a comparison of the GRAd
routing algorithm used in the TephraNet implementation and other more
mainstream algorithms, such as AODV and DSR, should refer to
[Wheeler00].
Self-organizing wireless network
research presents an ideal match for many
of the needs of the environmental
sensing community.

15
To date, most of the research in the field has been performed in
simulators, most notably in NS-2 (network simulator 2) [NS01]. While
network simulation provides a reasonable first pass at simulating the
characteristics of an algorithm, it does not capture many real world
characteristics of wireless networks. In particular, the NS-2 simulator does
not provide a particularly accurate wireless simulation environment. It is
missing key elements such as simulation of external interference and
changing noise floors. An evaluation of the make up a self-organizing
sensor network beyond the routing algorithms is difficult to do without a
physical platform. A few university and military research groups, notably
[Cerpa01] and [Rockwell01] have created physical platforms for ad-hoc
networking research. These platforms have not been scaled to large
numbers, primarily because of prohibitive cost, and are not common
between the various groups, making result comparison difficult. A low cost
sensor platform, COTS SmartDust, suitable for field deployment is
presented in [Hollar01]. Although this platform is low cost and has been
released to the community, it has very limited computing and memory
resources, and runs a custom operating system, making it unlikely to be a
good general purpose research platform.
Figure 2.4 COTS SmartDust Platform
The TephraNet platform, described in detail in the next chapter, provides a
solution for both environmental sensing and self-organizing wireless
network research. It provides environmental researchers with a prototype
sensing platform, while also providing ad-hoc networking researchers a
common physical platform on which to test out algorithms.
The ad-hoc networking research community needs a
hardware platform to compliment the currently used
software simulators.
Current platforms for sensor network
study tend to either be prohibitively
expensive or very resource
constrained.
Pho
to fr
om S
eth
Hol
lar

16
17
Chapter 3 TephraNet System Design
3.1 Functional Description
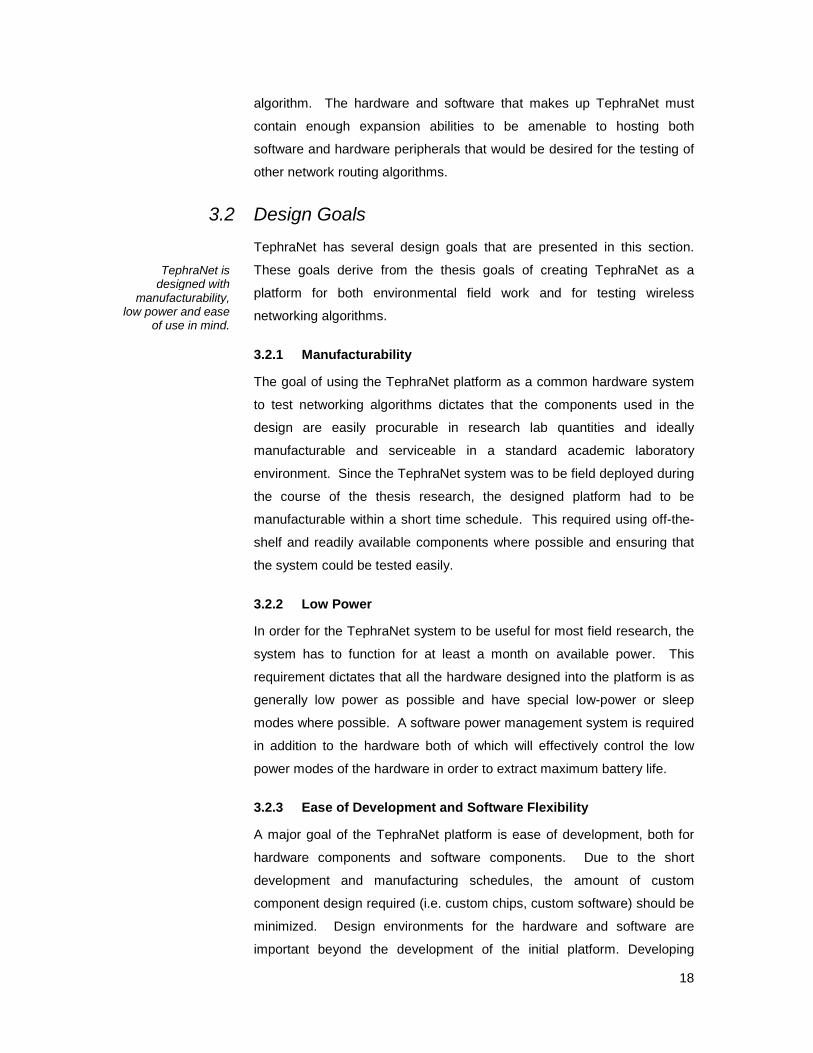
The TephraNet platform consists of a number of the basic building blocks
– TephraNodes. These nodes may be used both as a sensor network to
gather environmental data, as discussed in the previous sections, or as
the basic components of a network algorithm test bed.
Figure 3.1 TephraNodes
3.1.1 TephraNet as Sensor Network Demonstration
In the context of the TephraNet platform as a platform for environmental
sensor data gathering, each TephraNet consists of two basic pieces:
TephraNodes with sensors, and gateway nodes to collect data. In order to
construct a complete data gathering solution, a number of TephraNodes
are placed around a target observation area. The nodes, using the service
discovery and network routing services, form an ad-hoc network as
described in Chapter 2. Once formed, each node in the network can both
relay packets for their neighbors, as well as gather sensor data. The
TephraNodes can perform local processing on the data before determining
to send reports to the data collection points within the network.
3.1.2 TephraNet as Networking Algorithm Testbed
In order to ensure that the TephraNet platform can also be used as a
general network routing algorithm test bed, the software pertaining to the
networking routing must be replaceable with another network routing
TephraNodes awaiting
programming and deployment.
Pho
to b
y M
icha
el H
awle
y
18
algorithm. The hardware and software that makes up TephraNet must
contain enough expansion abilities to be amenable to hosting both
software and hardware peripherals that would be desired for the testing of
other network routing algorithms.
3.2 Design Goals
TephraNet has several design goals that are presented in this section.
These goals derive from the thesis goals of creating TephraNet as a
platform for both environmental field work and for testing wireless
networking algorithms.
3.2.1 Manufacturability
The goal of using the TephraNet platform as a common hardware system
to test networking algorithms dictates that the components used in the
design are easily procurable in research lab quantities and ideally
manufacturable and serviceable in a standard academic laboratory
environment. Since the TephraNet system was to be field deployed during
the course of the thesis research, the designed platform had to be
manufacturable within a short time schedule. This required using off-the-
shelf and readily available components where possible and ensuring that
the system could be tested easily.
3.2.2 Low Power
In order for the TephraNet system to be useful for most field research, the
system has to function for at least a month on available power. This
requirement dictates that all the hardware designed into the platform is as
generally low power as possible and have special low-power or sleep
modes where possible. A software power management system is required
in addition to the hardware both of which will effectively control the low
power modes of the hardware in order to extract maximum battery life.
3.2.3 Ease of Development and Software Flexibility
A major goal of the TephraNet platform is ease of development, both for
hardware components and software components. Due to the short
development and manufacturing schedules, the amount of custom
component design required (i.e. custom chips, custom software) should be
minimized. Design environments for the hardware and software are
important beyond the development of the initial platform. Developing
TephraNet is designed with
manufacturability, low power and ease
of use in mind.

19
additional software and hardware components for the finished system
should be easy. Those who wish to use TephraNet as an environmental
platform should have to do minimal work to add sensors and configure
reporting characteristics, while those who use TephraNet as a test
platform should have a well designed and open software environment in
which to test their algorithms.
3.2.4 Autonomous
The TephraNet system needs to be autonomous and easy to use in order
to cater to people not familia with the field of networking. Beyond the
ability of the system to route data without configuration, this includes the
setup and on-going maintenance of the network. As new nodes are
placed into the network during initial deployment and any future
expansions, they should integrate with a minimum of effort. The network
should also be able to automatically adjust to new services and data
collection points placed into the network.
3.3 Hardware Platform Description
This section presents a high level view of the hardware, showing block
diagrams of the system and noting rationale for specific hardware
component choices. Readers interested in obtaining detailed schematics
and parts listings should refer to Appendix A: Hardware Design.
20
BasebandProcessor
Node Hardware
RF Circuitry
MemoryFlash/SRAM
PowerSupply
SensorIface
ARMCore
Serial RTCA/D
Timers
Main Pocessor
Radio Board Processor Board
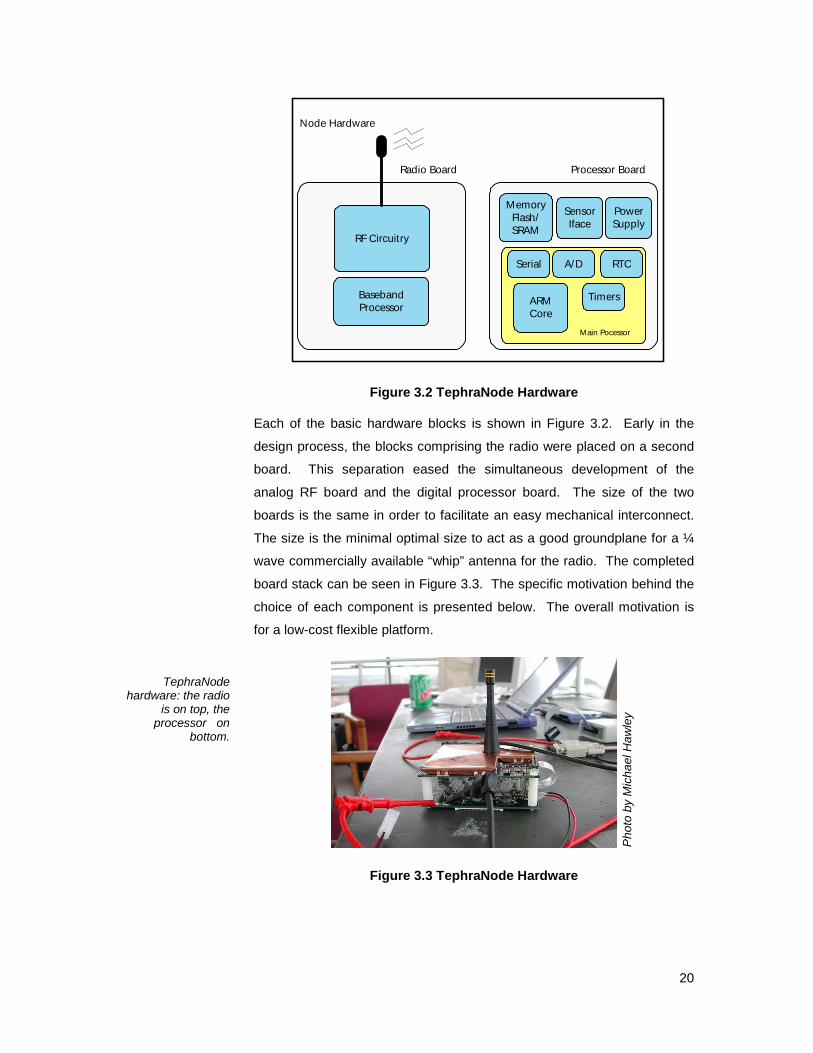
Figure 3.2 TephraNode Hardware
Each of the basic hardware blocks is shown in Figure 3.2. Early in the
design process, the blocks comprising the radio were placed on a second
board. This separation eased the simultaneous development of the
analog RF board and the digital processor board. The size of the two
boards is the same in order to facilitate an easy mechanical interconnect.
The size is the minimal optimal size to act as a good groundplane for a ¼
wave commercially available “whip” antenna for the radio. The completed
board stack can be seen in Figure 3.3. The specific motivation behind the
choice of each component is presented below. The overall motivation is
for a low-cost flexible platform.
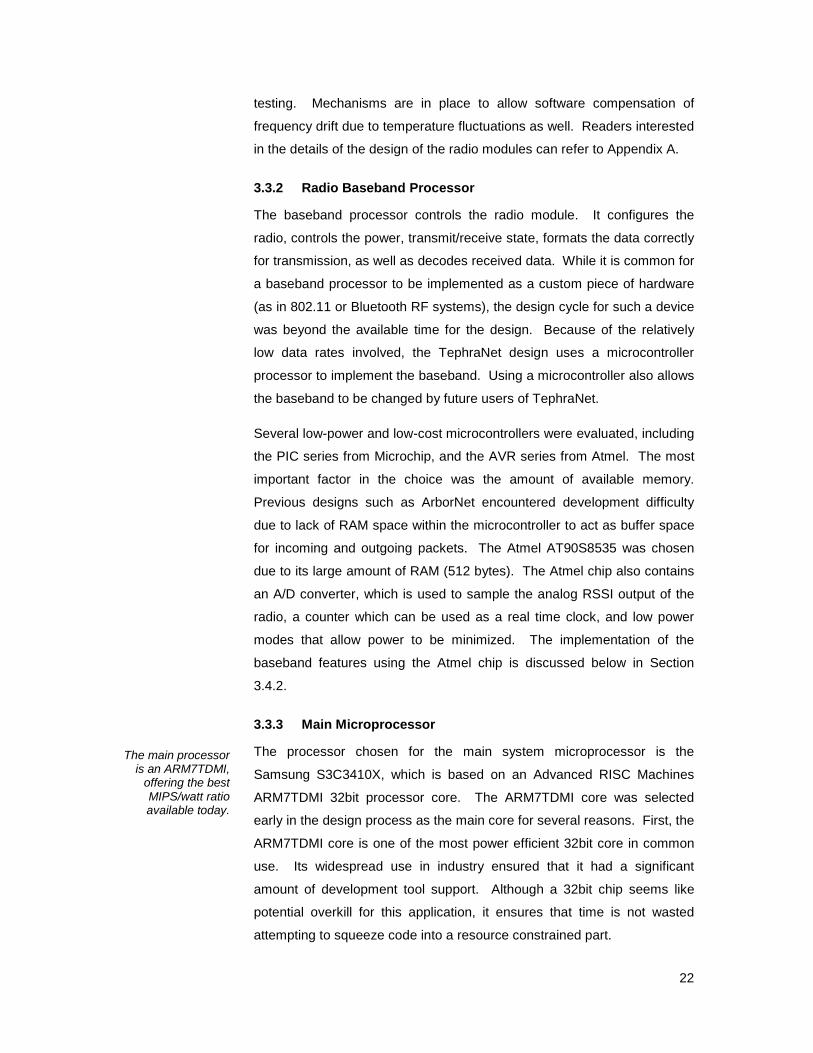
Figure 3.3 TephraNode Hardware
TephraNode hardware: the radio
is on top, the processor on
bottom.
Pho
to b
y M
icha
el H
awle
y

21
3.3.1 Radio
Several factors motivated the choice of radio for this design. First is the
need to operate in an unlicensed band (also known as an ISM band-
Industrial, Scientific, and Medical). The regulatory issues surrounding
licensed bands, as well as the lack of tightly integrated RF components for
bands other than SM or cellular bands, dictated the choice of an ISM band
system. The ArborNet system [Poor01], which provided several design
lessons used in this design, was build around an ISM band 915MHz single
channel radio. Having only a single channel simplifies design, although it
is desirable to be frequency agile in order to avoid interference. Most RF
systems operating in unlicensed bands (or ISM bands) use some spread
spectrum technique in order to comply with FCC Part 15 regulations. The
ability to use a spread spectrum technique was therefore also a
consideration in the design of the radio. Also, since some networking
algorithms make use of received signal strength indicator (RSSI) to
determine link quality and also adjust output power, an RSSI output and
adjustable transmit power are required. Some commercial RF systems,
such as 802.11 meet these requirements, although their power
consumption is too high for use in the TephraNet system given the lifetime
required.
The radio module is designed around the Texas Instruments TRF6900
ISM band transceiver. This IC contains much of the circuitry required to
produce a radio module, which simplifies design and minimizes size. It
also has substantially lower power consumption than other available radio
IC’s, as well as all of the features required above. The radio module is
designed to operate at a raw channel data rate of 100kbps in the 902-
936MHz band. Transmit power is controllable between approximately -
20dBm and +4.5dBm. The radio module is attached to a ¼ wave whip
antenna manufactured by Lynx Technologies, selected for its good
performance, reasonable size, and low cost. The module has a measured
range of approximately 150-300ft in open space.
One unusual feature in the radio design is its low cost crystal reference.
Traditionally, highly accurate, expensive frequency references are required
for RF systems. Since this radio is frequency agile, the software
compensates for any inaccuracy in the crystal by adjusting the PLL in the
radio based on a stored measurement of the crystal frequency from
The radio was selected to operate
in a license free band and be
frequency agile.
22
testing. Mechanisms are in place to allow software compensation of
frequency drift due to temperature fluctuations as well. Readers interested
in the details of the design of the radio modules can refer to Appendix A.
3.3.2 Radio Baseband Processor
The baseband processor controls the radio module. It configures the
radio, controls the power, transmit/receive state, formats the data correctly
for transmission, as well as decodes received data. While it is common for
a baseband processor to be implemented as a custom piece of hardware
(as in 802.11 or Bluetooth RF systems), the design cycle for such a device
was beyond the available time for the design. Because of the relatively
low data rates involved, the TephraNet design uses a microcontroller
processor to implement the baseband. Using a microcontroller also allows
the baseband to be changed by future users of TephraNet.
Several low-power and low-cost microcontrollers were evaluated, including
the PIC series from Microchip, and the AVR series from Atmel. The most
important factor in the choice was the amount of available memory.
Previous designs such as ArborNet encountered development difficulty
due to lack of RAM space within the microcontroller to act as buffer space
for incoming and outgoing packets. The Atmel AT90S8535 was chosen
due to its large amount of RAM (512 bytes). The Atmel chip also contains
an A/D converter, which is used to sample the analog RSSI output of the
radio, a counter which can be used as a real time clock, and low power
modes that allow power to be minimized. The implementation of the
baseband features using the Atmel chip is discussed below in Section
3.4.2.
3.3.3 Main Microprocessor
The processor chosen for the main system microprocessor is the
Samsung S3C3410X, which is based on an Advanced RISC Machines
ARM7TDMI 32bit processor core. The ARM7TDMI core was selected
early in the design process as the main core for several reasons. First, the
ARM7TDMI core is one of the most power efficient 32bit core in common
use. Its widespread use in industry ensured that it had a significant
amount of development tool support. Although a 32bit chip seems like
potential overkill for this application, it ensures that time is not wasted
attempting to squeeze code into a resource constrained part.
The main processor is an ARM7TDMI,
offering the best MIPS/watt ratio available today.
23
The Samsung chip was chosen out of the many chips designed around the
ARM7TDMI core for its high level of integration and availability. Targeted
at MP3 players and handheld devices, this chip integrates many essential
peripherals, such as serial ports, memory controllers, a real time clock,
and a high resolution (10 bit), high speed (500K samples/sec) A/D
converter. The chip also contains several useful reduced power modes,
including sleep and reduced speed. The high level of integration also
ensures a more power efficient design than using separate chips to
implement each function [Samsung01].
3.3.4 Memory
The TephraNet design ensures that there is a reasonable amount of
memory to work with for the same reasons that a 32bit processor was
chosen. Both program space as well as data space are maximized to
avoid wasting development effort on minimizing resource use and to allow
debug status to be maintained. Flash memory was selected as the
memory technology for the program space since it can be programmed by
the processor without the high voltage requirements of standard EEPROM
and does not have the current draw or mechanical parts a hard drive
would. SRAM is the choice for system memory technology because of its
static nature. No power is used to refresh the memory, and SRAM can
retain data even while the system is asleep.
The original design specified the use of an Intel stacked chip SRAM and
flash component that combined 256KB SRAM and 2MB flash components
into a single chip. However, subsequent availability problems led to the
selection of separate 512KB Toshiba SRAM and a 4MB Intel flash chips.
Unfortunately, availability also dictated the choice of a uBGA packaged for
the Intel flash chips, which proved to be a large hurdle in manufacturing.
Many smaller manufacturers and most academic labs are not set up for
this miniature package, and future revisions should select a more standard
package.
3.3.5 Expansion I/O
The TephraNode processor board contains over 100 pins of I/O, listed in
Table 3.1.
Serial Port 4 pins
Standard RS232 port, primarily for debugging
24
JTAG Connector
20 pins
Used for programming and debugging the processor
Radio Interface
18 pins
Synchronous serial data and radio control signals
Analog Sensor Port
20 pins
Provided access to 5 A/D ports
Memory Bus Connector
60 pins
Access to memory and data bus of processor
Table 3.1 TephraNode I/O
The analog sensor port connects internally to an array of resistor pads that
can be configured to attach to a large family of analog sensors without
additional external hardware (all resistive or voltage out sensors). The
memory bus connector allows more complicated modules to be added
onto the TephraNode that provide additional services or features not in the
base system. For example, a digital camera or high speed radio (such as
802.11) could make use of this port. All of the I/O ports mentioned are
discussed in further detail in Appendix A.
3.3.6 Power Supply
A power supply was placed on the TephraNode to reduce the number of
boards, although this could potentially reduce the flexibility of the system
by forcing the user to use only certain battery configurations. The power
supply can be bypassed to minimize this problem. The power supply is
based on the Maxim MAX639 switching power supply controller IC. This
controller was selected primarily for its very low (~10uA) quiescent current
(current drawn when no load is present) and high efficiency (>90%)
[Maxim97]. The low quiescent current simplifies the design significantly by
allowing the power supply to stand alone without a special sleep control
signal from the processor. A low dropout voltage and high efficiency
ensure maximum utilization of the power stored in the power source.
3.4 Software Overview
The software running on the TephraNet system provides numerous
services related to forming and maintaining a network, sending and
receiving data, and managing power consumption at nodes. A diagram
showing the various software components present in TephraNet is shown
in Figure 3.4. This section presents a functional view of the software in the
TephraNet system. Implementation details are located in Appendix B:
Source Code Listing.

25
RadioBaseband
MACService
uC/OS-II
Sync
GRAdRouting
Radio Iface
PingStatistics G
atherin
g
SensorIface Param
eter Setting
s
Node Software
ACK
ApplicationCode
Sys Man
ager/Pow
er Man
ager
Figure 3.4 TephraNode Software
3.4.1 Node Lifecycle
bootup/ timesync
awake(RF and main proc
on)
asleep(RF and main proc
powered off)
Figure 3.5 Node Lifecycle
A TephraNode progresses through several states during its lifecycle.
When a node starts up, it goes through a bootup phase. During this period
of time, the operating system is booted, and hardware peripherals are
configured. The node then enters a synchronization period, where it
attempts to synchronize its network time with any neighbor nodes that may
be present. Once synchronization has been obtained, the node enters
normal operation. During this period of time, the node alternates between
being awake, and being asleep. All nodes in a TephraNet follow the same
waking and sleeping schedule due to their synchronization. While awake,
a node can run application level software which can generate and receive
packets from the network, or it can simply act as a repeater. The node
After bootup, nodes alternate between an awake mode, where
they can operate fully, and a low-
power asleep mode, where all
components are off except a clock.

26
can also forward on packets for other nodes. While asleep, the node
powers down all peripherals and the processor in order to conserve power.
3.4.2 Radio Baseband Software
The software running on the Atmel AT90S8535 chip forms the baseband
processing system for the radio module. The tasks of the radio baseband
are shown in Figure 3.6. The majority of the software written for this
section was written in Atmel AVR assembly code. The precise timing
requirements required for data transmission and reception precluded the
use of a higher-level language. A partial listing of source code can be
found in Appendix B.
PowerControl
ProcessorInterfaceRadio Control
Packet TX/RX
TXEncoding
RXDecoding
FEC Checksum
To/FromRF
ToMain
Processor
RSSIMeasurement
FromRF
Figure 3.6 Baseband Functions
3.4.2.1 Power Control
The baseband software provides power down control of the RF section of
the circuit as well as the baseband processor. When instructed to do so
by the main processor, the baseband software can power down the RF
section of the circuit and then suspend its own operation. Operation
continues upon reception of the proper signal from the main processor.
3.4.2.2 Processor Interface
The baseband software controls the interface to the main system
processor. This interface consists of signals that allow each processor to
send an interrupt signal to the other. Packet and configuration data is
exchanged over a synchronous serial port. The interface to the main
processor is detailed further in Section 3.4.4.3 as well as Appendix A.
27
3.4.2.3 Packet Transmission and Reception
The primary job of the baseband processor is to provide the mechanism
by which packets are exchanged “over the air”. During transmission, the
baseband processor takes a packet from the main processor, prepends
the RF level header (composed of a synchronization sequence and start
symbol), and sends the data in a DC balanced format. The final version of
the code utilized Manchester encoding, which uses 2 bits per symbol to
ensure a DC balance [Rappaport96]. The transmission also includes a
simple forward error correcting code (FEC). When in receive mode, the
processor monitors the incoming data stream watching for valid packet
data, which is decoded and checked for validity before transmission to the
system processor.
3.4.3 Operating System
The software running on the Samsung ARM7TDMI (main) processor
requires an operating system in order to ease development for those
wishing to use TephraNet as a platform. uC/OS-II was selected as the
operating system after evaluating several commercial and free embedded
operating systems. uC/OS-II is open source, well documented, and
provides all the services that are required for development. Other
operating systems evaluated required licensing fees that are prohibitive for
most academic environments. Many others contain features considered
unnecessary, increasing the code size with no benefit, and were not as
well documented as uC/OS-II. Additionally, this OS had previously been
ported to a close relative of the Samsung chip used as the main processor
in TephraNet, easing the job of porting the operating system to the
TephraNode hardware. Details about uC/OS-II can be found in
[Labrosse99].
3.4.4 Packet Transmission and Reception
3.4.4.1 Packet Types
During normal waking operation, the node constantly waits for incoming
packets. When a packet is received, it is examined to discover what types
of data are contained within. Packet types are shown in Table 3.2.
Multiple segments of different types can be contained within a single “over
the air” packet. Each segment is sent off to the corresponding “handler”
for that type. For example, all packets that contain a GRAd routing header
28
are handed over to the GRAd service (described below) for routing. Many
of the packet types here are related to services described in subsequent
sections.
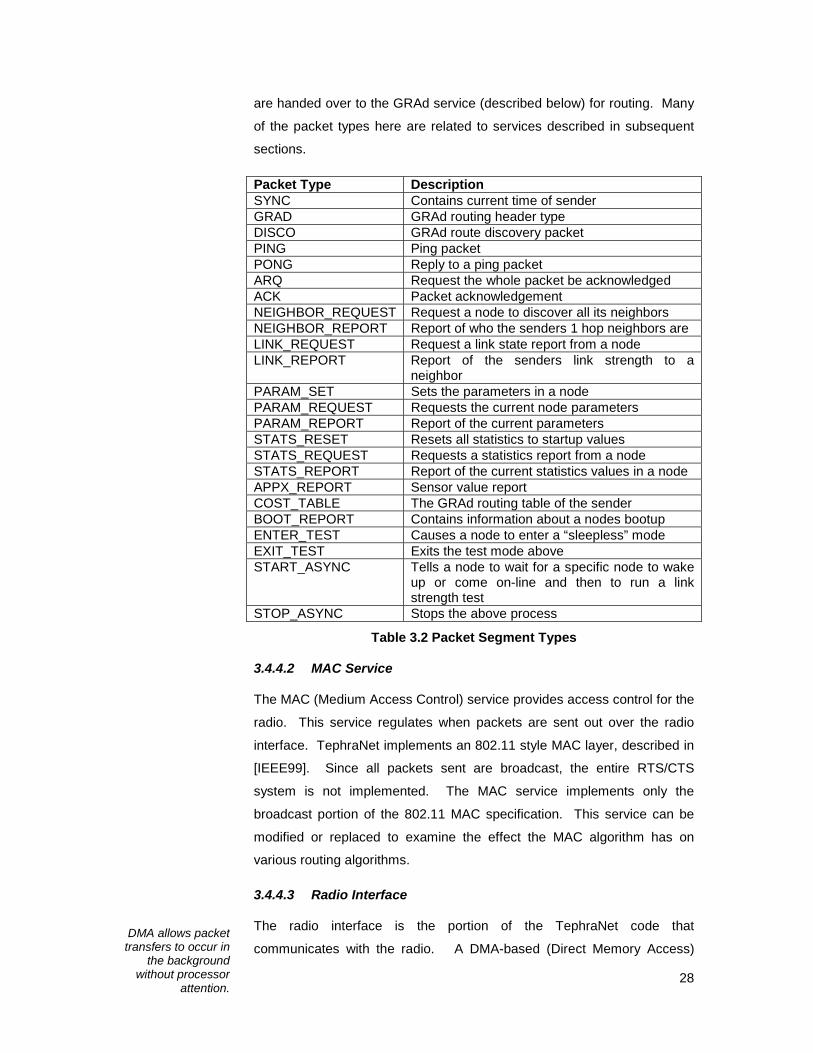
Packet Type Description SYNC Contains current time of sender GRAD GRAd routing header type DISCO GRAd route discovery packet PING Ping packet PONG Reply to a ping packet ARQ Request the whole packet be acknowledged ACK Packet acknowledgement NEIGHBOR_REQUEST Request a node to discover all its neighbors NEIGHBOR_REPORT Report of who the senders 1 hop neighbors are LINK_REQUEST Request a link state report from a node LINK_REPORT Report of the senders link strength to a
neighbor PARAM_SET Sets the parameters in a node PARAM_REQUEST Requests the current node parameters PARAM_REPORT Report of the current parameters STATS_RESET Resets all statistics to startup values STATS_REQUEST Requests a statistics report from a node STATS_REPORT Report of the current statistics values in a node APPX_REPORT Sensor value report COST_TABLE The GRAd routing table of the sender BOOT_REPORT Contains information about a nodes bootup ENTER_TEST Causes a node to enter a “sleepless” mode EXIT_TEST Exits the test mode above START_ASYNC Tells a node to wait for a specific node to wake
up or come on-line and then to run a link strength test
STOP_ASYNC Stops the above process
Table 3.2 Packet Segment Types
3.4.4.2 MAC Service
The MAC (Medium Access Control) service provides access control for the
radio. This service regulates when packets are sent out over the radio
interface. TephraNet implements an 802.11 style MAC layer, described in
[IEEE99]. Since all packets sent are broadcast, the entire RTS/CTS
system is not implemented. The MAC service implements only the
broadcast portion of the 802.11 MAC specification. This service can be
modified or replaced to examine the effect the MAC algorithm has on
various routing algorithms.
3.4.4.3 Radio Interface
The radio interface is the portion of the TephraNet code that
communicates with the radio. A DMA-based (Direct Memory Access) DMA allows packet transfers to occur in
the background without processor
attention.

29
interface to the radio baseband was developed to ease the main processor
overhead of processing incoming or outgoing packets. Normally, the radio
module code sits idle, waiting for the radio baseband to indicate that a
packet has been received. When the baseband receives a valid packet, it
transfers the data via a synchronous serial port directly into the main
processor memory space (using the DMA controller on the Samsung
processor). The processor is then interrupted, and the radio module
comes to the foreground to parse the packet. The parsed packet is then
handed up to the routing service and the application software for
processing.
When a software module is ready to transmit, it calls an access function in
the radio module that sets up the transmission. First the radio baseband is
interrupted to indicate the beginning of transmission. The radio baseband
then uses the DMA interface to read the packet to send directly out of the
processor memory without further main processor intervention. The
packet is then sent by the baseband as described in Section 3.4.2.3.
3.4.5 GRAd Routing Service
TephraNet implemented the GRAd routing algorithm for this revision. In
order to use TephraNet as a general network algorithm testbed, the GRAd
algorithm can be replaced with another algorithm, such as AODV (Ad-hoc
On-demand Distance Vector) or DSR (Dynamic Source Routing). All of
the main GRAd feature set was implemented for this revision as described
in [Poor01]. This implementation parameterized several GRAd settings.
These are shown along with other parameterized system settings below in
Table 3.3. These parameters can be adjusted during the course of
network operation.
3.4.6 Synchronization Service and Power Management
The synchronization service (SYNC) is responsible for ensuring that the
time at each node in the network is uniform. This plays a central role in
power management. The largest source of power consumption in a low
power network is the power used for reception [Wheeler00]. Although high
power radios consume far more power during transmission than reception
(due to the power amplifier), current low transmit power radios consume
the same or more power during receive than transmit. A major goal for
minimizing power consumption is reducing the amount of time the receiver
The synchronization service is used to
power manage the network by sleeping
all nodes simultaneously.

30
is on. In traditional base-station architectures where a single high power
base station can communicate with all nodes (such as in a cellular
network), the receiver at each node can be controlled by the base station,
who schedules all network traffic. In an ad-hoc network, one approach to
distributed synchronization, with the goal of being able to turn off radio
receivers, is presented in [Xu00].
The basic description of the synchronization system is that a packet
describing a node’s current time is sent out periodically. Every node
receiving this packet averages their internal time with the time heard. In
this way, the time across all the nodes in the network converges to a
common time. This system is based on the distributed synchronization
system proposed by Poor in [Poor01].
This basic concept was implemented in the TephraNet system, with some
modifications. The first is a bootup phase. During this period of time, they
do not send any packets indicating their current time. Instead, they listen
to all incoming timing packets and set their time to the network time they
hear. This assumes that the network time has already previously settled.
If no packets are heard during this period, or if times vary widely, then the
node enters normal operation with the time it currently has set.
Once in a steady state, the network has a duty cycle of awake and asleep
that can be adjusted to control the average power consumed by the
network. The timing used in TephraNet is nine minutes asleep followed by
one minute of awake time. While the network is awake, each node
broadcasts a timing packet approximately every four to six seconds.
When a node is asleep, it wakes up approximately every thirty seconds
and sends out a timing packet to help nodes that are far off the network
time (i.e. awake when they should be asleep) converge to the correct time.
3.4.7 Network Configuration and Statistics Gathering
The PARAM module stores TephraNet system settings that can be altered
during network operation. These parameters are meant to provide an
easy way to change the way the network operates and behaves without
having to recompile and reinstall software on each of the nodes. Alterable
settings are shown in Table 3.3.
Parameter Description PING_SEARCH_COUNT Number of pings to send when searching

31
for neighbors PING_LINK_TEST_COUNT Number of pings sent in a link test PING_LINK_TEST_DELAY Time to wait between pings ARQ_DELAY Timeout while waiting for an ACK ARQ_RETRY Number of time to resend a packet COST_TTL Lifetime of a GRAd routing cost table
entry COST_AGE_QUANTUM How often routing table is purged GRAD_DISCOVERY_COUNT How large the initial GRAd discovery cost
is GRAD_ENABLE_RELAY Enables relaying by this node MAC_TICKS_PER_BACKOFF Quantization of MAC backoff timer AWAKE_TIME How long to stay awake for in a cycle SLEEP_TIME How long to sleep for in a cycle BASESTATION_ADDR Address of node that is the current
gateway ARQ_REPORTS Indicates sensor reports should be ack’d
Table 3.3 Parameters in a TephraNode
The STATS module provides a repository for network and node
performance statistics. During normal operation, each TephraNode
records information about internal statistics (shown in Table 3.4).
Summary information is routinely sent to the gateway node for display and
processing.
Statistic Description maxTimeDiffThisPeriod Largest difference between internal time and
received time broadcasts this waking cycle uptime Uptime of node in OS scheduling ticks badPackets Number of corrupted packets seen by radio goodPackets Number of valid packets seen by radio duplicatePackets Number of duplicate packets seen gradOriginated Number of routed packets (not ping or timing)
originated by this node gradFlooded Number of route discovery floods from this node gradRelayed Number of packets relayed for other nodes arqPktsSent Number of packets sent with an ack requested arqPktsRcvd Number of ACKs received arqPktsDropped Number of packets that never got an ack
Table 3.4 Statistics Gathered
3.5 Summary
This chapter described the goals and design of the TephraNet system.
Further design and implementation details are available in the various
appendices. The next chapter shows the additional elements added to the
TephraNet system that are specific to the Hawaii deployments. The
deployments are also reviewed.

32
Chapter 4 Implementation and Deployment
Figure 4.1 Joint Project
The TephraNet system design was motivated in large part by the desire to
use the system in an actual field deployment for detailed environmental
sensing. In collaboration with the Botany department of the University of
Hawaii, Manoa campus, the TephraNet system was deployed in Hawaii to
study environmental conditions. This section describes the joint project.
4.1 Problem Background
Figure 4.2 Nene Birds
Hawaii Volcanoes National Park on the Big Island of Hawaii contains
numerous micro-climate zones. In the space of several miles, the climate
zone can change from rainforest to desert. These steep weather gradients
are home to many endangered plant and animal species, such as the
endangered Nene bird, Hawaii’s state bird. One of the goals of the
deployment is the measurement of one of these gradients.
Nene birds, the state bird of Hawaii, are
just one of many endangered species
living in Hawaii Volcanoes National
Park.
Pho
to b
y M
icha
el H
awle
y P
hoto
by
Mic
hael
Haw
ley

33
Figure 4.3 Hawaii Volcanoes National Park
In one of these microclimate zones, near the crater of Halemaumau, is an
area known as the Southwest Rift Zone. The Southwest Rift Zone is
thought to be the fastest moving piece of land on the planet. This desert-
like zone is home to the Silene hawaiiensis, a diminutive endangered
plant, usually not taller than half a meter [Bridges01]. Little is known about
this plant, or its habitat. Only a few pictures exist of its flowers, and its
flowering schedule is unknown. The plant is considered an endangered
species.
Figure 4.4 Silene hawaiiensis in SW Rift Zone
A detailed picture of the plants’ habitat is needed in order to understand
their reproductive mechanisms and lifecycle. Knowledge of details about
wind speed and patterns can give clues about pollination vectors. For
example, if the area is subjected to high winds 24 hours a day, then
insects can be ruled out as the pollination mechanism. Data about the
amount of rainfall and moisture in the air can help uncover how the plant
acquires water. Although the area is thought to be a desert (defined as
less than 15” of rainfall a year), this has yet to be confirmed [Bridges01].
The Silene plant in its native habitat.
Hawaii Volcanoes National Park (dotted
region on map) contains numerous
microclimate zones, home to many
endangered species.
Pho
to b
y M
icha
el H
awle
y P
hoto
by
Mic
hael
Haw
ley
34
The nearest weather station is only 3.5 miles away, but it is in a rainforest
and provides little useful information about the climate these plants exist
in.
This particular situation presents an ideal example of environmental
measurement where TephraNet is needed. The weather patterns in the
Southwest Rift Zone require samples at intervals on the order of a few
hundred feet in order to gain a useful understanding of how those patterns
act on the Silene hawaiiensis. Traditional measurement such as periodic
weather stations can not capture this detailed information, and constant
human observation is both prohibitively expensive and lacks the
granularity required. A dense network of weather stations which will
observe the area and continuously report their findings back to botanists
studying the area is the ideal solution.
4.2 Deployment Specific System Design
In order to deploy the TephraNet system as a weather gathering network
in the Southwest Rift Zone several additional hardware and packaging
components had to be designed.
4.2.1 Sensors
The sensors added to the TephraNet system transform the generic
platform into the weather stations necessary for this research. This
section discusses the main characteristics of each sensor. Details on the
settings used on the TephraNode board analog inputs and any additional
hardware used to attach the sensors can be found in the Hardware Design
Appendix A.
4.2.1.1 Temperature
The temperature sensor used was a RL1005, manufactured by
Thermometrics [Thermometrics01]. It has the ability to measure
temperature with 1 degree accuracy from 0 to 150 degrees Celsius. The
sensor is of the thermistor class of temperature sensors. The sensor
appears as a resistor whose resistance varies inversely with the ambient
temperature.
35
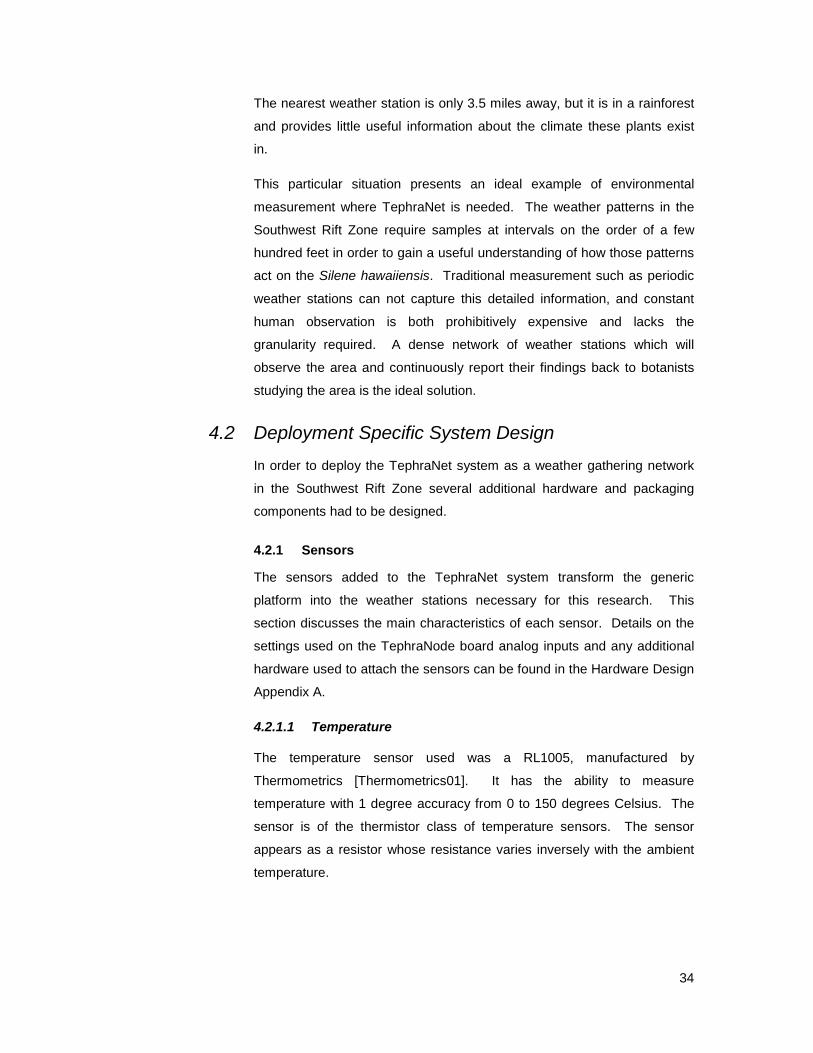
4.2.1.2 Humidity
Figure 4.5 Humidity Sensor in Rock
Humidity was measured by a capacitive humidity sensor from
Panametrics, the MC-2 [Panametrics01]. The sensor can measure from
0% to 100% relative humidity with approximately 15% accuracy
uncalibrated. This sensor appears as a capacitor whose capacitance
varies with humidity. Because the basic TephraNet sensor interface only
provides the ability to measure analog voltages or resistive values, this
sensor required additional hardware to convert the capacitive variance into
an analog signal (see Appendix A for details). The humidity level provides
an important indicator about the region and can point to the how the Silene
obtains water.
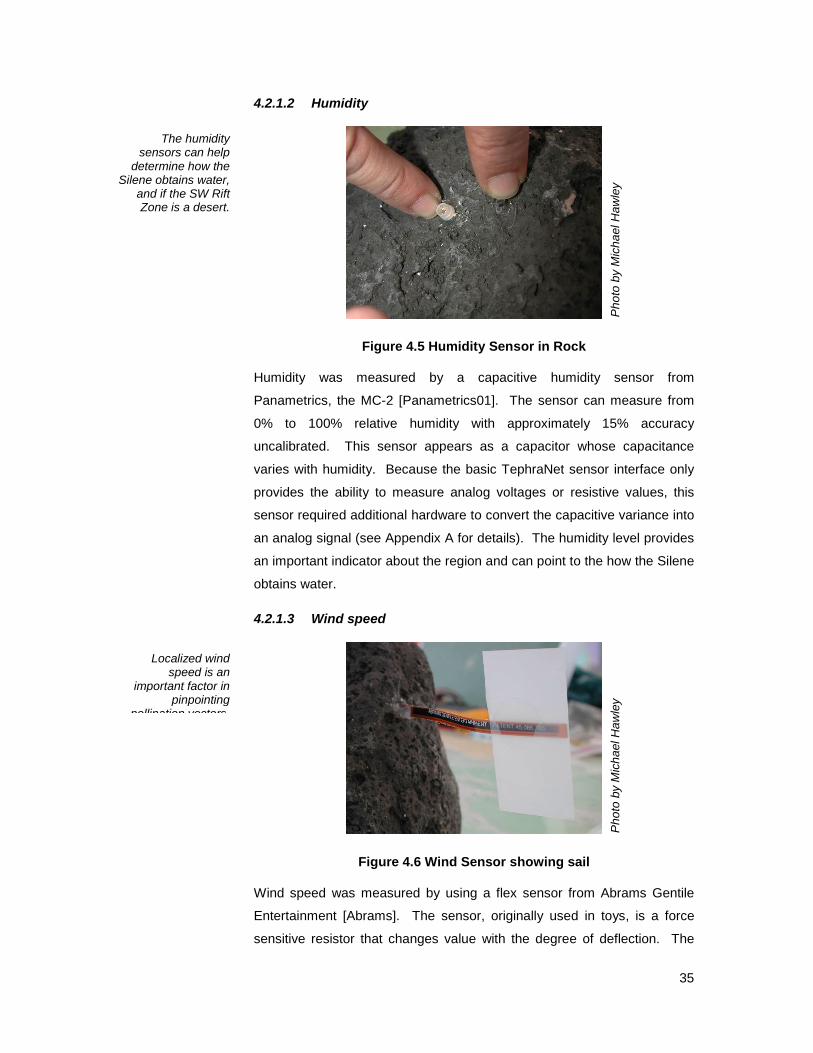
4.2.1.3 Wind speed
Figure 4.6 Wind Sensor showing sail
Wind speed was measured by using a flex sensor from Abrams Gentile
Entertainment [Abrams]. The sensor, originally used in toys, is a force
sensitive resistor that changes value with the degree of deflection. The
The humidity sensors can help
determine how the Silene obtains water,
and if the SW Rift Zone is a desert.
Localized wind speed is an
important factor in pinpointing
pollination vectors.
Pho
to b
y M
icha
el H
awle
y P
hoto
by
Mic
hael
Haw
ley
36
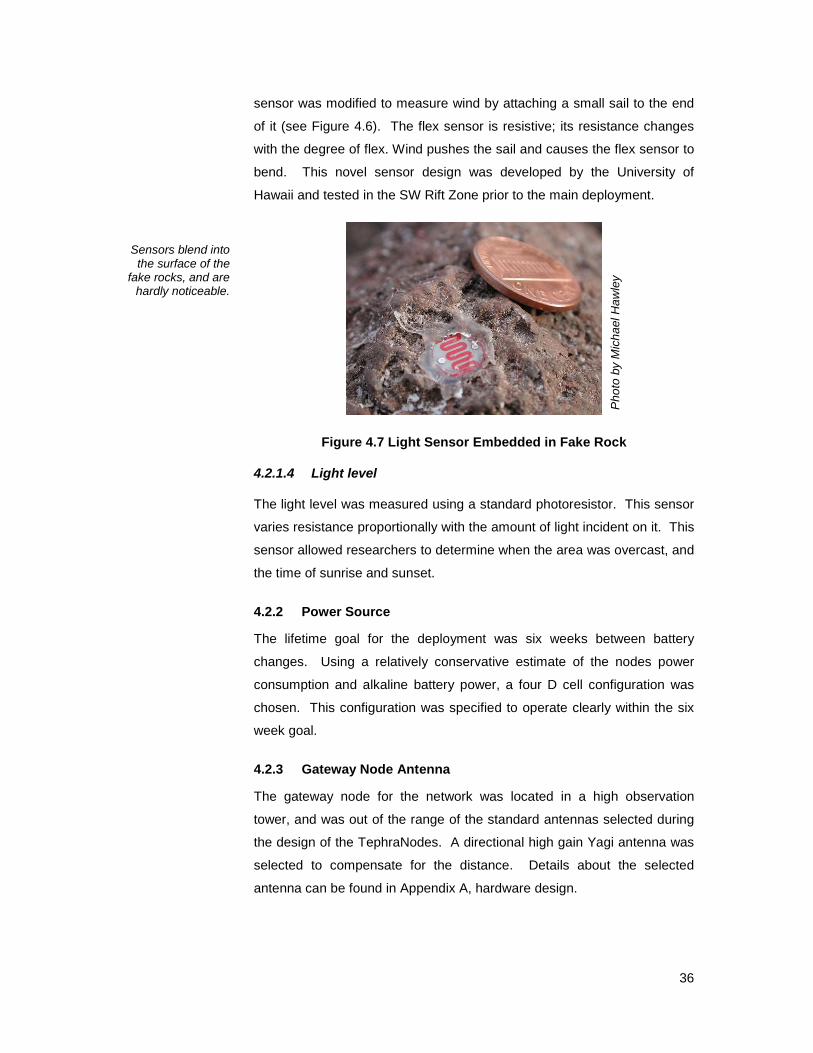
sensor was modified to measure wind by attaching a small sail to the end
of it (see Figure 4.6). The flex sensor is resistive; its resistance changes
with the degree of flex. Wind pushes the sail and causes the flex sensor to
bend. This novel sensor design was developed by the University of
Hawaii and tested in the SW Rift Zone prior to the main deployment.
Figure 4.7 Light Sensor Embedded in Fake Rock
4.2.1.4 Light level
The light level was measured using a standard photoresistor. This sensor
varies resistance proportionally with the amount of light incident on it. This
sensor allowed researchers to determine when the area was overcast, and
the time of sunrise and sunset.
4.2.2 Power Source
The lifetime goal for the deployment was six weeks between battery
changes. Using a relatively conservative estimate of the nodes power
consumption and alkaline battery power, a four D cell configuration was
chosen. This configuration was specified to operate clearly within the six
week goal.
4.2.3 Gateway Node Antenna
The gateway node for the network was located in a high observation
tower, and was out of the range of the standard antennas selected during
the design of the TephraNodes. A directional high gain Yagi antenna was
selected to compensate for the distance. Details about the selected
antenna can be found in Appendix A, hardware design.
Sensors blend into the surface of the
fake rocks, and are hardly noticeable.
Pho
to b
y M
icha
el H
awle
y
37
4.2.4 Enclosures
The National Park Service does not permit exposed scientific equipment to
be left out in the Southwest Rift Zone. This necessitated the design of
camouflaged enclosures to hide the TephraNodes. Mike Lurvey at the
University of Hawaii designed fake rocks and tree branches to place the
nodes in.
4.2.4.1 Lava Rocks
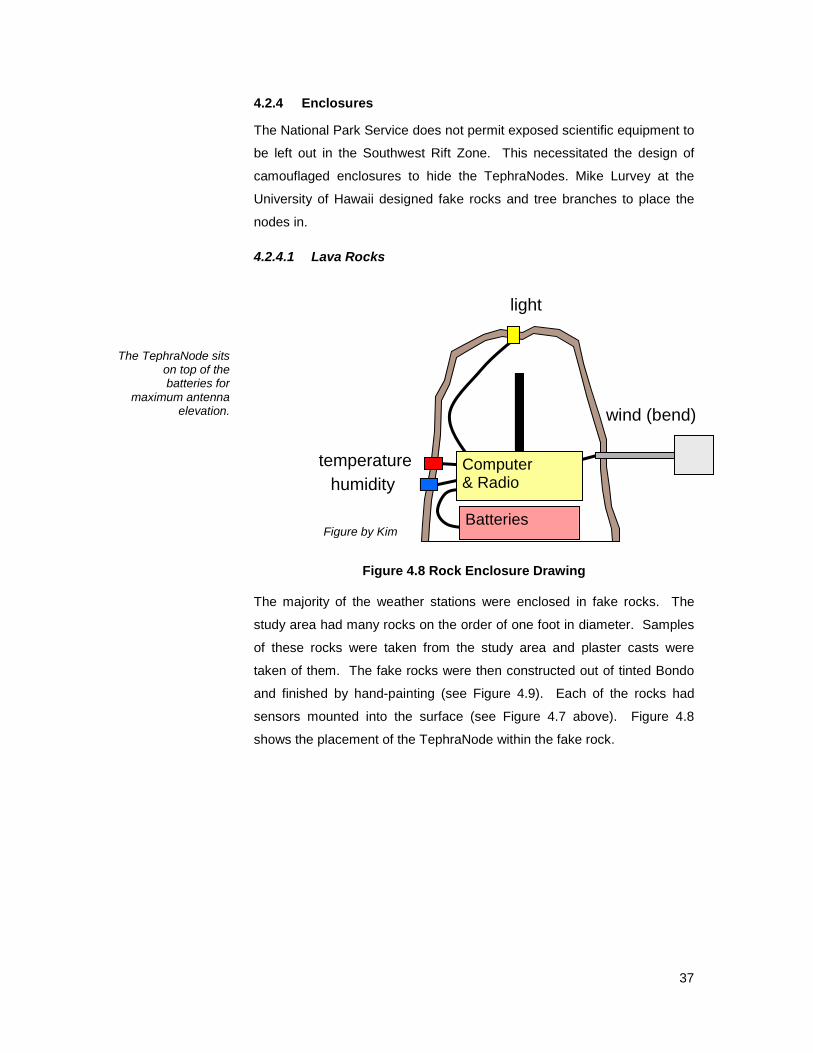
Figure 4.8 Rock Enclosure Drawing
The majority of the weather stations were enclosed in fake rocks. The
study area had many rocks on the order of one foot in diameter. Samples
of these rocks were taken from the study area and plaster casts were
taken of them. The fake rocks were then constructed out of tinted Bondo
and finished by hand-painting (see Figure 4.9). Each of the rocks had
sensors mounted into the surface (see Figure 4.7 above). Figure 4.8
shows the placement of the TephraNode within the fake rock.
temperature humidity
light
wind (bend)
Computer & Radio
Batteries
The TephraNode sits on top of the batteries for
maximum antenna elevation.
Figure by Kim Bridges

38
Figure 4.9 Rocks at U of Hawaii Awaiting Deployment
4.2.4.2 Ohia Tree Branches
Figure 4.10 Ohia Branch Assembly
The Ohia tree is a native Hawaiian tree that is found near the study area.
The fake tree branches were constructed from PVC tubing. The exterior
was covered with a printout of bark pattern of the Ohia tree and sprayed
with a waterproof coating. A top cap was constructed out of Bondo and
color matched. The bottom cap held the batteries and was constructed
out of Styrofoam. The bottom cap could be inserted while in the field just
prior to deployment. This design held only a temperature and light sensor.
It was strapped into Ohia trees for deployment using plastic cinch straps.
light
Batteries
Computer & Radio
foam spacer temperature
Pho
to b
y K
im B
ridge
s
Figure by Kim Bridges
39
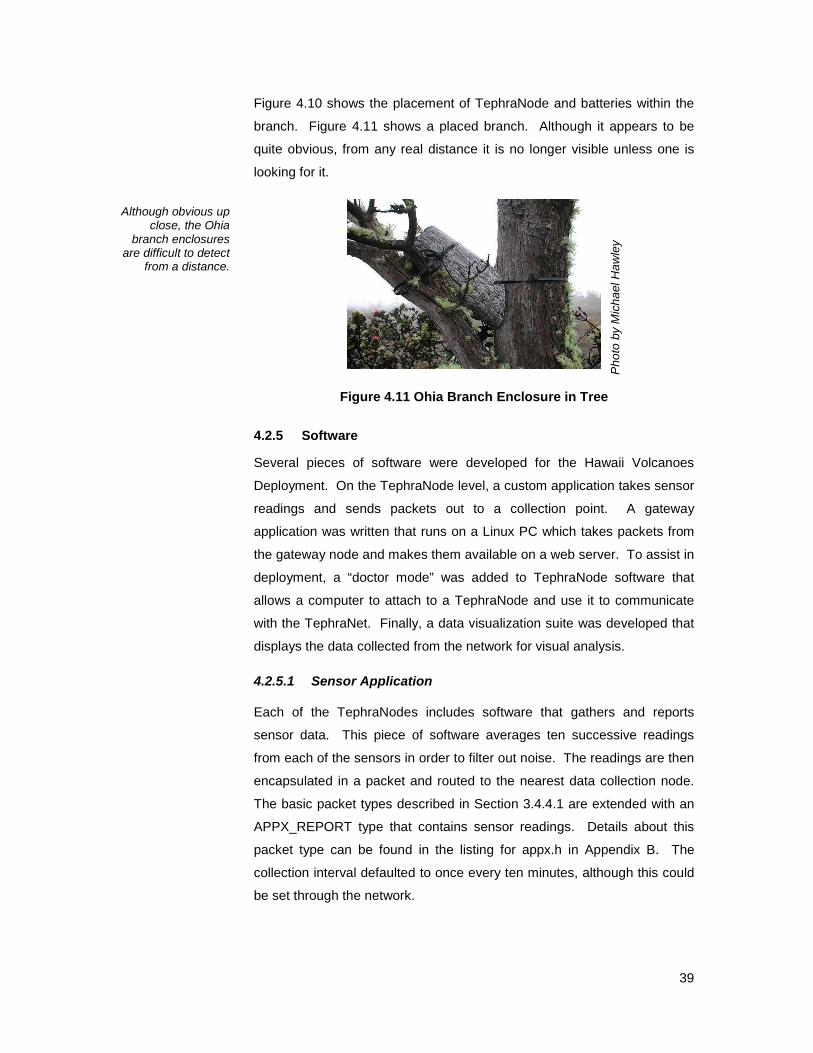
Figure 4.10 shows the placement of TephraNode and batteries within the
branch. Figure 4.11 shows a placed branch. Although it appears to be
quite obvious, from any real distance it is no longer visible unless one is
looking for it.
Figure 4.11 Ohia Branch Enclosure in Tree
4.2.5 Software
Several pieces of software were developed for the Hawaii Volcanoes
Deployment. On the TephraNode level, a custom application takes sensor
readings and sends packets out to a collection point. A gateway
application was written that runs on a Linux PC which takes packets from
the gateway node and makes them available on a web server. To assist in
deployment, a “doctor mode” was added to TephraNode software that
allows a computer to attach to a TephraNode and use it to communicate
with the TephraNet. Finally, a data visualization suite was developed that
displays the data collected from the network for visual analysis.
4.2.5.1 Sensor Application
Each of the TephraNodes includes software that gathers and reports
sensor data. This piece of software averages ten successive readings
from each of the sensors in order to filter out noise. The readings are then
encapsulated in a packet and routed to the nearest data collection node.
The basic packet types described in Section 3.4.4.1 are extended with an
APPX_REPORT type that contains sensor readings. Details about this
packet type can be found in the listing for appx.h in Appendix B. The
collection interval defaulted to once every ten minutes, although this could
be set through the network.
Although obvious up close, the Ohia
branch enclosures are difficult to detect
from a distance.
Pho
to b
y M
icha
el H
awle
y

40
Each node includes software additions to the bootup code. This software
runs on startup to run tests and broadcast messages to anyone within
radio range about the bootup status. Immediately on boot, the System
Manager begins the Synchronization (SYNC) service and broadcasts a
message when the node has acquired sync with the network. If sync can
not be obtained after some time, the software broadcasts an error
message and proceeds. The boot software also listens for neighbors and
runs link strength tests to assist in the placement of the node in the
network. The results of these tests are broadcast out in informational
packets.
4.2.5.2 Doctor Mode
In order to facilitate deployment, a special doctor mode was designed for
the TephraNode software. A node placed into doctor mode communicates
with a terminal (such as a Palm Pilot or a laptop) over a serial port,
allowing the terminal to monitor information coming from the network and
to communicate with nodes in the TephraNet.
Function Description Target Node
Selects a node in the network for tests
Collect Neighbors
Collects the single hop neighbors of the target node
Neighbor Strength
Tests link reliability between the target and another node
All Neighbor Strength
Tests link reliability between target and all its one hop neighbors
Test Mode
Causes a node to enter or exit a mode where it never sleeps
Async Ping
Runs a link test to a node the next time it wakes up
Node Existence
Checks if a node (even if asleep) is within radio range
Update Params
Updates the configurable parameters of the target node
Table 4.1 Doctor Mode Functions
Doctor mode contained several functions, listed in Table 4.1. Functions
such as the async ping and the node existence tests rely on the fact that
nodes send a time synchronization packet a few times a minute. During
the period of time that the nodes send the synchronization packet, they
wake up long enough to process pings. The ping and synchronization
mechanisms are described in more detail in Section 3.4 and in Appendix
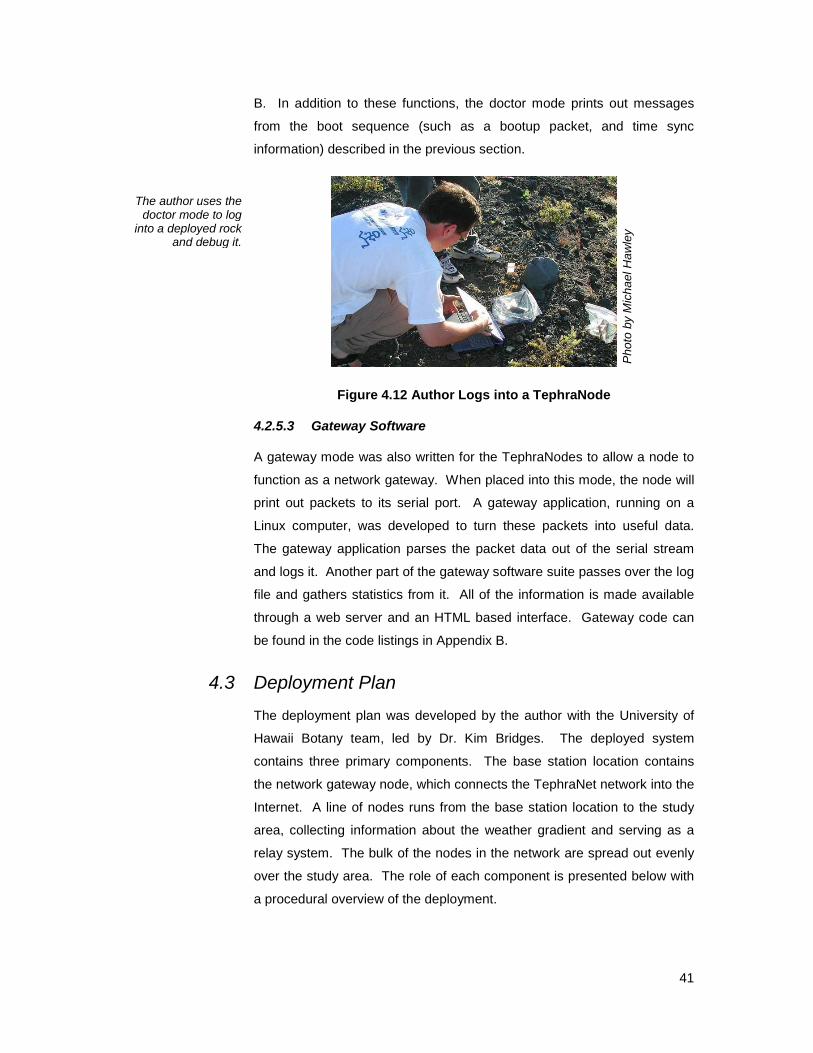
41
B. In addition to these functions, the doctor mode prints out messages
from the boot sequence (such as a bootup packet, and time sync
information) described in the previous section.
Figure 4.12 Author Logs into a TephraNode
4.2.5.3 Gateway Software
A gateway mode was also written for the TephraNodes to allow a node to
function as a network gateway. When placed into this mode, the node will
print out packets to its serial port. A gateway application, running on a
Linux computer, was developed to turn these packets into useful data.
The gateway application parses the packet data out of the serial stream
and logs it. Another part of the gateway software suite passes over the log
file and gathers statistics from it. All of the information is made available
through a web server and an HTML based interface. Gateway code can
be found in the code listings in Appendix B.
4.3 Deployment Plan
The deployment plan was developed by the author with the University of
Hawaii Botany team, led by Dr. Kim Bridges. The deployed system
contains three primary components. The base station location contains
the network gateway node, which connects the TephraNet network into the
Internet. A line of nodes runs from the base station location to the study
area, collecting information about the weather gradient and serving as a
relay system. The bulk of the nodes in the network are spread out evenly
over the study area. The role of each component is presented below with
a procedural overview of the deployment.
The author uses the doctor mode to log
into a deployed rock and debug it.
Pho
to b
y M
icha
el H
awle
y

42
4.3.1 Base Station
The gateway node was placed in the USGS Volcano Observatory that sits
on the rim of the Halemaumau crater (shown in Figure 4.13). The
observatory has a high speed Internet connection that allows the data to
be reviewed in real time.
Figure 4.13 Author in Volcano Observatory
On the top of the observatory is a glass walled “situation” room that served
as the headquarters of the deployment operation and also continues to
house the base station. This room was used for the final programming of
nodes and assembly of Ohia branches and rock packages before being
taken into the field. A computer running the gateway software discussed
above in Section 4.2.5.3 was located in the observatory. This base station
computer allowed remote access to the network, facilitating both data
retrieval as well as sending packets into the network.
Figure 4.14 Ohia Branches Awaiting Deployment
The Halemaumau crater is visible
through the observatory window.
Pho
to b
y K
im B
ridge
s
Pho
to b
y M
icha
el H
awle
y
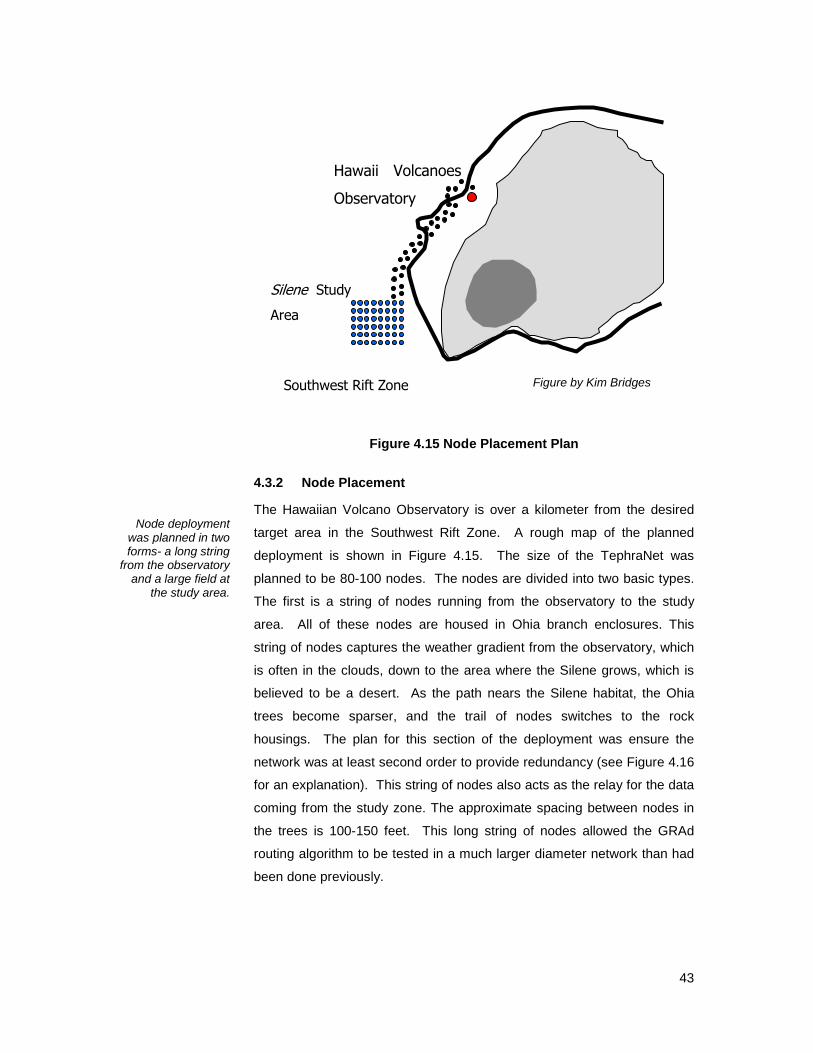
43
Figure 4.15 Node Placement Plan
4.3.2 Node Placement
The Hawaiian Volcano Observatory is over a kilometer from the desired
target area in the Southwest Rift Zone. A rough map of the planned
deployment is shown in Figure 4.15. The size of the TephraNet was
planned to be 80-100 nodes. The nodes are divided into two basic types.
The first is a string of nodes running from the observatory to the study
area. All of these nodes are housed in Ohia branch enclosures. This
string of nodes captures the weather gradient from the observatory, which
is often in the clouds, down to the area where the Silene grows, which is
believed to be a desert. As the path nears the Silene habitat, the Ohia
trees become sparser, and the trail of nodes switches to the rock
housings. The plan for this section of the deployment was ensure the
network was at least second order to provide redundancy (see Figure 4.16
for an explanation). This string of nodes also acts as the relay for the data
coming from the study zone. The approximate spacing between nodes in
the trees is 100-150 feet. This long string of nodes allowed the GRAd
routing algorithm to be tested in a much larger diameter network than had
been done previously.
Silene Study
Area
Hawaii Volcanoes
Observatory
Southwest Rift Zone Figure by Kim Bridges
Node deployment was planned in two forms- a long string
from the observatory and a large field at
the study area.
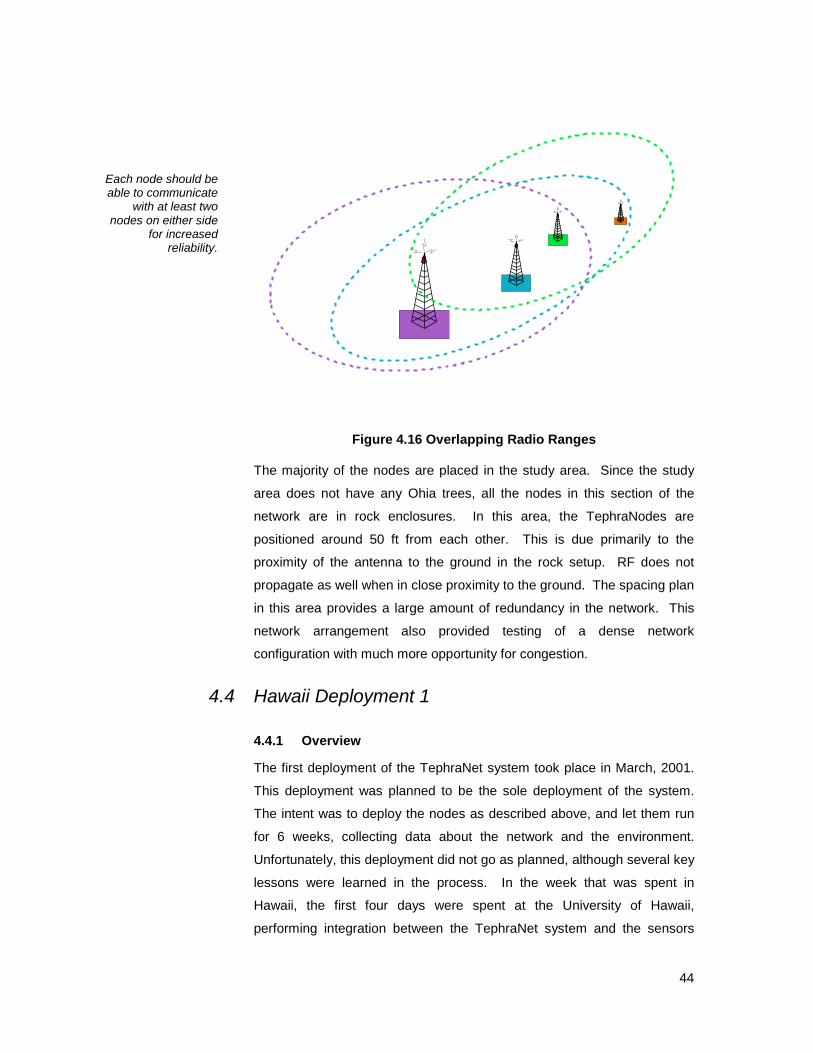
44
Figure 4.16 Overlapping Radio Ranges
The majority of the nodes are placed in the study area. Since the study
area does not have any Ohia trees, all the nodes in this section of the
network are in rock enclosures. In this area, the TephraNodes are
positioned around 50 ft from each other. This is due primarily to the
proximity of the antenna to the ground in the rock setup. RF does not
propagate as well when in close proximity to the ground. The spacing plan
in this area provides a large amount of redundancy in the network. This
network arrangement also provided testing of a dense network
configuration with much more opportunity for congestion.
4.4 Hawaii Deployment 1
4.4.1 Overview
The first deployment of the TephraNet system took place in March, 2001.
This deployment was planned to be the sole deployment of the system.
The intent was to deploy the nodes as described above, and let them run
for 6 weeks, collecting data about the network and the environment.
Unfortunately, this deployment did not go as planned, although several key
lessons were learned in the process. In the week that was spent in
Hawaii, the first four days were spent at the University of Hawaii,
performing integration between the TephraNet system and the sensors
Each node should be able to communicate
with at least two nodes on either side
for increased reliability.
45
and software testing. The last three days were spent at the park
performing layout planning for the node deployment and testing out nodes.
While in the field, the base station node was set up and the directional
antenna was aimed out at the first outdoor node position. Three Ohia
branch nodes were deployed into their planned positions, and radio
performance was measured with these nodes. After encountering
software problems in the nodes that were not correctable in the field most
of the remaining time was spent surveying the site and determining the
layout of nodes for a future deployment.
4.4.2 Problems Encountered
4.4.2.1 Software Reliability
The most difficult problem encountered during the Hawaii deployment
centered on software reliability. On the first field deployment day four
nodes were placed into the field. An unknown bug would cause the nodes
to crash after forty five minutes to several hours. After eight hours all of
the nodes were non-functioning. Due to the time necessary for the error to
manifest, the error could not be corrected during the field trial.
Upon return from Hawaii, the node software was analyzed to uncover the
source of the instability. The operating system port was found to be at
fault. An obscure nested interrupt problem would caused the stack in the
operating system to be corrupted when two particular interrupts (such as a
packet arrival and a timer) occurred at the same time. The frequency of
this occurrence was dependant on the amount of radio traffic. Under
heavily loaded conditions, it would usually occur within two hours.
4.4.2.2 Hardware Problems
Several problems relating to the hardware also appeared during the
deployment. The first was with the base station. As mentioned in the
deployment plan, a directional Yagi antenna was used at the base station
node in order to provide long range. Even with this antenna, the
measured reliability of the link never exceeded 75% (roundtrip packet
throughput), which was not reasonable performance. The best guess
made in the field was that the antenna was not properly grounded (since it
was in the tower room) or that temperature differentials from inside to
outside were adversely affecting the radio. After the deployment exercise

46
completed, the problem was found to be the small AC power supply brick
that had been substituted for the battery pack in this node. The power
supply generated an extremely noisy power signal, and much of the noise
passed through the voltage regulator and negatively affected RF
performance.
The RF hardware also acted unreliably in the field, occasionally the radio
would get stuck in a mode where it would not output any valid data.
Further investigation revealed that human error in the field caused all the
radio boards to be programmed repeatedly at a voltage nearly twice the
specified programming voltage. Due to this error, the RF transceiver was
permanently damaged, and a new run of radio boards were fabricated
prior to performing a second deployment.
The power consumption of the hardware platform was also much higher
than the expected consumption. Post-field-test examination of the system
revealed an undocumented setting in the Atmel microcontroller which
accounted for most of the difference between measured and expected
power consumption.
4.4.2.3 Misc. Problems
Even in the medium volume of one hundred nodes, many little design
issues become huge headaches. One such issue relates to the stacking
of the boards. The radio and processor board are stacked and attached
using nylon spacers and screws (see Figure 3.1). The design precluded
inserting the programming header for the main processor when the boards
are stacked. This added a prohibitive amount of assembly overhead in the
field and made field corrections of software mistakes difficult. Requiring
the boards to be screwed together also added hours of assembly
overhead.
A final problem encountered was with the connectors between the battery
packs and the TephraNode hardware. A mismatch in parts went
undetected until assembly in Hawaii. The part problem required the power
supply wires to be soldered directly to the nodes instead of using a
connector.

47
4.4.3 What Went Right
Despite all of the problems encountered on the first deployment, several
positive things came out of the experience. Perhaps the most valuable
was the ability to verify that the pieces designed with each team
interoperated. The sensors successfully attached to the TephraNodes and
sensor readings were taken. The TephraNode hardware fit successfully
within the rock and Ohia branch housings. The time in the field was also
an excellent opportunity for the MIT and University of Hawaii teams to
meet in person and communicate.
4.5 Hawaii Deployment 2
4.5.1 Overview
After the software stability issues were corrected and new radio hardware
was manufactured, a second deployment was performed in June of 2001.
This second deployment, although still not entirely successful, provided
great insight into the performance of the GRAd routing algorithm and the
usability of the TephraNet platform for field work.
Figure 4.17 Deployed Node Positions
The string of nodes headed toward the SW Rift Zone were
deployed successfully.

48
During this deployment, the entire line of nodes running out to the study
site was deployed (see Figure 4.17). In addition, a Silene hawaiiensis
population was discovered near the Volcano Observatory, off of the
planned deployment track. The team decided to take advantage of this
monitoring opportunity, and deployed the first TephraNodes in rock
enclosures in this area. Around three days was spent in the park
deploying both the nodes going to the study site, and those around the
Observatory.
4.5.2 Problems Encountered
4.5.2.1 Power Supply Noise
As mentioned in the description of the first deployment, the link from the
base station node out to the first outdoor node functioned poorly.
Experimentation during the first day of the second deployment revealed
that the source of the poor performance was noise generated from the
power supply. It was replaced by a clean power supply. In addition to this
problem, a problem with the power regulator on each node was also
discovered after several nodes were deployed on the first day. The nodes
demonstrated packet reliability on the order of 50% even over moderate
distances. Experimentation uncovered noise in the power supply as the
main problem. Work done in the laboratory had often bypassed the on-
board power supply in favor of an external one that could source the
current necessary for all the programmers, and so the problem was not
detected prior to field work.
This problem was partially overcome by implementing a simple FEC
(forward error correcting) code in the radio. An FEC achieves higher
reliability at the expense of bandwidth by sending redundant information.
The code used was a simple block code where each byte of data is sent
three times, and the receiver uses the three bits received to vote on the
value (i.e. if two zeros and a one arrive for a particular bit, the receiver
decides that the bit is a zero). This technique improved the bit error rates
to over 90% in the 100 ft distance range.
4.5.3 Ease of Deployment
One unanticipated problem faced during this deployment was the ease of
deployment. The actual placement of the nodes took much longer than
expected, and the correction of any errors once a node was placed was
Power supply noise negatively impacted radio performance.

49
difficult. Most nodes placed were of the Ohia branch type, which often
involved climbing a tree with the branch and securing it with plastic zip-
ties. Once a tree was identified as the node location, the node was
powered up and the author stood by with a doctor mode system as
described in Section 4.2.5.2 to watch the node boot. Obtaining link tests
to neighbors to assure a reliable positioning consumed the majority of
deployment time. The branch was often high in the tree, and someone
had to hold the branch in place while the tests ran. Since deployed nodes
were usually in their sleep cycle, and woke only every thirty seconds or so,
running several link tests took minutes. Adjusting the branch slightly and
running more tests was extremely time consuming. As a result of the
difficulty of the deployment, nodes were often placed in sub-optimal
locations and not enough time was available to deploy all nodes.
Figure 4.18 Placing Node in Ohia Tree
Another major issue surrounding the ease of deployment was the difficulty
making any changes to the deployed system. Although a mechanism was
present to change certain parameters of the deployed system, the main
body of the software could not be modified without taking the nodes out of
the trees, disassembling them, and reprogramming them by physically
attaching to them. For an experimental system intended to be a testbed,
this is not acceptable.
4.5.4 Synchronization and Routing Algorithm Problems
The TephraNet system suffered from several synchronization and routing
problems after deployment. Once deployed, the system appeared to have
major problems settling in on a common time. The time at each node
determines when it is awake and asleep. If all the nodes in the network do
Mike Lurvey of the University of Hawaii
places an Ohia branch node into a
tree.
Pho
to b
y M
icha
el H
awle
y
50
not wake up at the same time, a packet can not be relayed through the
network. The time synchronization thus prevented packets from being
routed successfully through the network. A complete analysis of the
synchronization problem is provided below in Chapter 5.
The GRAd routing algorithm itself also suffered from performance issues.
Data indicated that very few packets from further than 3 or 4 hops away
was successfully reaching the base node, despite the fact that over 20
hops worth of nodes were deployed. This low reliability was seen even
with end-to-end per-packet acknowledgements in place. A detailed
analysis of the data collected relating to the routing problem is presented
below in the analysis section.
Overall, these algorithmic problems prevented the deployment from being
fully successful.
4.6 Summary
This section illustrated what was required to use the basic TephraNet
platform in an environmental sensing application. The Hawaii Volcanoes
specific implementation was detailed and a plan for deployment was
presented. The two deployment activities in Hawaii were reviewed. The
next section presents the lessons learned on the deployment and draws
conclusions about how the project met its goals.
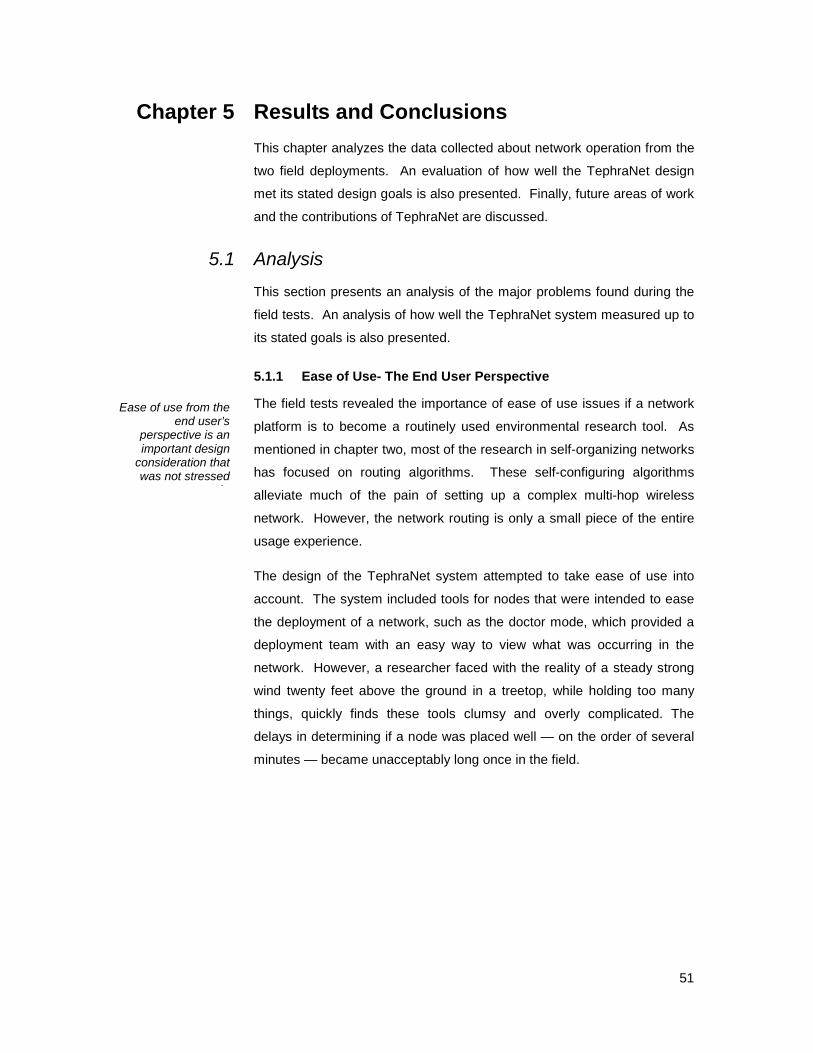
51
Chapter 5 Results and Conclusions
This chapter analyzes the data collected about network operation from the
two field deployments. An evaluation of how well the TephraNet design
met its stated design goals is also presented. Finally, future areas of work
and the contributions of TephraNet are discussed.
5.1 Analysis
This section presents an analysis of the major problems found during the
field tests. An analysis of how well the TephraNet system measured up to
its stated goals is also presented.
5.1.1 Ease of Use- The End User Perspective
The field tests revealed the importance of ease of use issues if a network
platform is to become a routinely used environmental research tool. As
mentioned in chapter two, most of the research in self-organizing networks
has focused on routing algorithms. These self-configuring algorithms
alleviate much of the pain of setting up a complex multi-hop wireless
network. However, the network routing is only a small piece of the entire
usage experience.
The design of the TephraNet system attempted to take ease of use into
account. The system included tools for nodes that were intended to ease
the deployment of a network, such as the doctor mode, which provided a
deployment team with an easy way to view what was occurring in the
network. However, a researcher faced with the reality of a steady strong
wind twenty feet above the ground in a treetop, while holding too many
things, quickly finds these tools clumsy and overly complicated. The
delays in determining if a node was placed well — on the order of several
minutes — became unacceptably long once in the field.
Ease of use from the end user’s
perspective is an important design
consideration that was not stressed
enough.
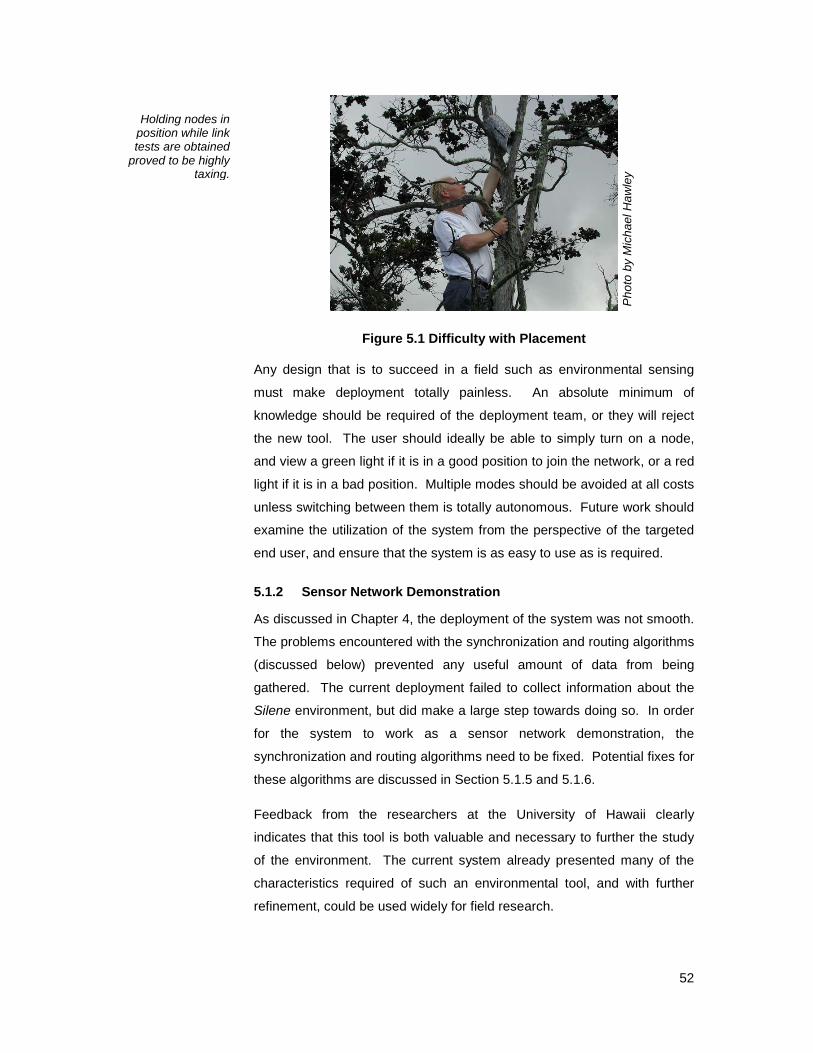
52
Figure 5.1 Difficulty with Placement
Any design that is to succeed in a field such as environmental sensing
must make deployment totally painless. An absolute minimum of
knowledge should be required of the deployment team, or they will reject
the new tool. The user should ideally be able to simply turn on a node,
and view a green light if it is in a good position to join the network, or a red
light if it is in a bad position. Multiple modes should be avoided at all costs
unless switching between them is totally autonomous. Future work should
examine the utilization of the system from the perspective of the targeted
end user, and ensure that the system is as easy to use as is required.
5.1.2 Sensor Network Demonstration
As discussed in Chapter 4, the deployment of the system was not smooth.
The problems encountered with the synchronization and routing algorithms
(discussed below) prevented any useful amount of data from being
gathered. The current deployment failed to collect information about the
Silene environment, but did make a large step towards doing so. In order
for the system to work as a sensor network demonstration, the
synchronization and routing algorithms need to be fixed. Potential fixes for
these algorithms are discussed in Section 5.1.5 and 5.1.6.
Feedback from the researchers at the University of Hawaii clearly
indicates that this tool is both valuable and necessary to further the study
of the environment. The current system already presented many of the
characteristics required of such an environmental tool, and with further
refinement, could be used widely for field research.
Holding nodes in position while link tests are obtained
proved to be highly taxing.
Pho
to b
y M
icha
el H
awle
y
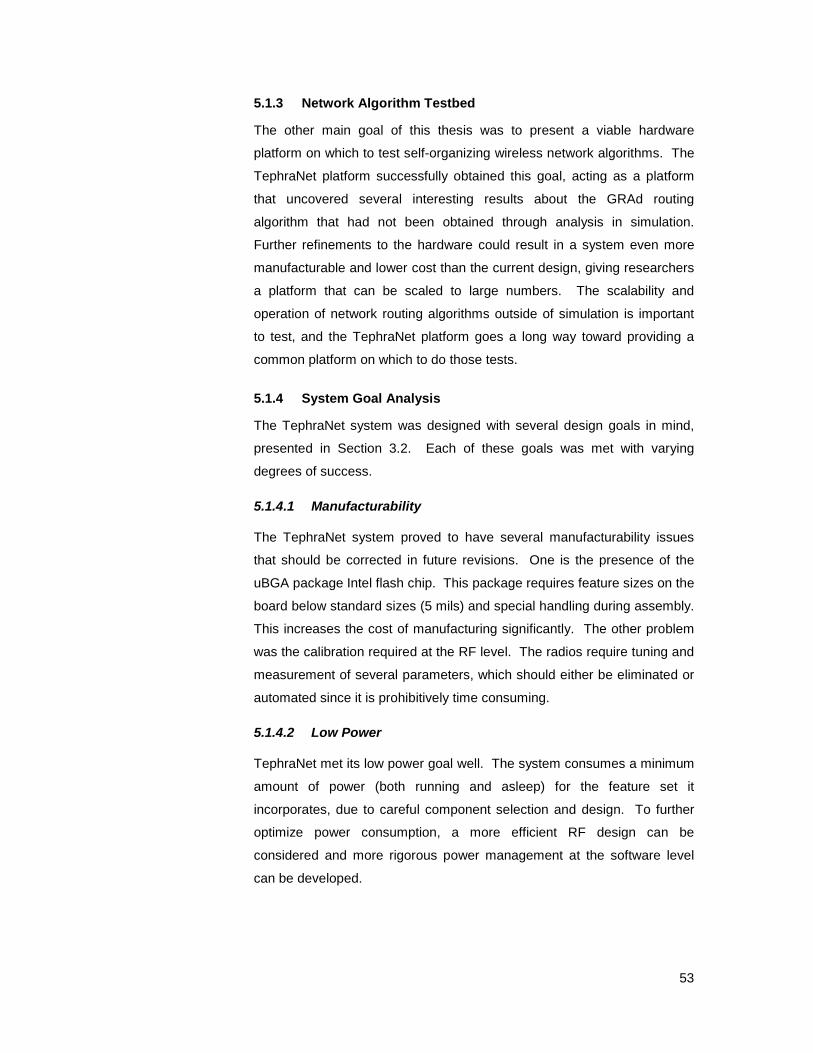
53
5.1.3 Network Algorithm Testbed
The other main goal of this thesis was to present a viable hardware
platform on which to test self-organizing wireless network algorithms. The
TephraNet platform successfully obtained this goal, acting as a platform
that uncovered several interesting results about the GRAd routing
algorithm that had not been obtained through analysis in simulation.
Further refinements to the hardware could result in a system even more
manufacturable and lower cost than the current design, giving researchers
a platform that can be scaled to large numbers. The scalability and
operation of network routing algorithms outside of simulation is important
to test, and the TephraNet platform goes a long way toward providing a
common platform on which to do those tests.
5.1.4 System Goal Analysis
The TephraNet system was designed with several design goals in mind,
presented in Section 3.2. Each of these goals was met with varying
degrees of success.
5.1.4.1 Manufacturability
The TephraNet system proved to have several manufacturability issues
that should be corrected in future revisions. One is the presence of the
uBGA package Intel flash chip. This package requires feature sizes on the
board below standard sizes (5 mils) and special handling during assembly.
This increases the cost of manufacturing significantly. The other problem
was the calibration required at the RF level. The radios require tuning and
measurement of several parameters, which should either be eliminated or
automated since it is prohibitively time consuming.
5.1.4.2 Low Power
TephraNet met its low power goal well. The system consumes a minimum
amount of power (both running and asleep) for the feature set it
incorporates, due to careful component selection and design. To further
optimize power consumption, a more efficient RF design can be
considered and more rigorous power management at the software level
can be developed.
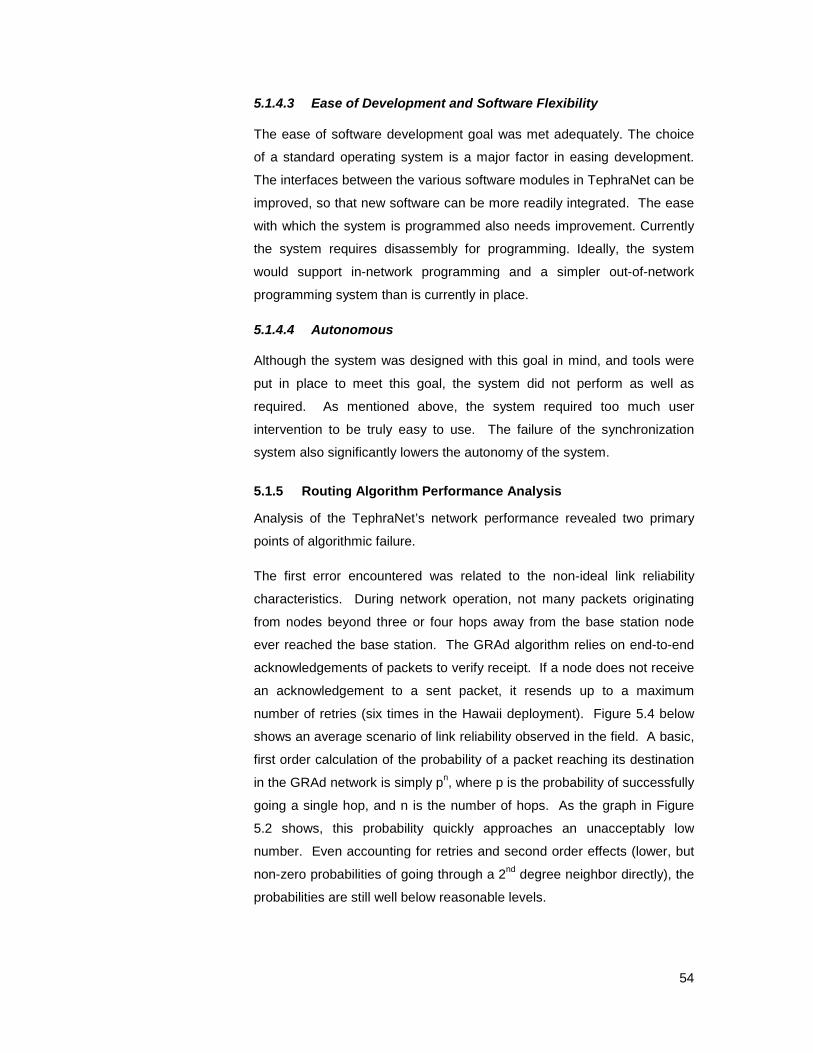
54
5.1.4.3 Ease of Development and Software Flexibility
The ease of software development goal was met adequately. The choice
of a standard operating system is a major factor in easing development.
The interfaces between the various software modules in TephraNet can be
improved, so that new software can be more readily integrated. The ease
with which the system is programmed also needs improvement. Currently
the system requires disassembly for programming. Ideally, the system
would support in-network programming and a simpler out-of-network
programming system than is currently in place.
5.1.4.4 Autonomous
Although the system was designed with this goal in mind, and tools were
put in place to meet this goal, the system did not perform as well as
required. As mentioned above, the system required too much user
intervention to be truly easy to use. The failure of the synchronization
system also significantly lowers the autonomy of the system.
5.1.5 Routing Algorithm Performance Analysis
Analysis of the TephraNet’s network performance revealed two primary
points of algorithmic failure.
The first error encountered was related to the non-ideal link reliability
characteristics. During network operation, not many packets originating
from nodes beyond three or four hops away from the base station node
ever reached the base station. The GRAd algorithm relies on end-to-end
acknowledgements of packets to verify receipt. If a node does not receive
an acknowledgement to a sent packet, it resends up to a maximum
number of retries (six times in the Hawaii deployment). Figure 5.4 below
shows an average scenario of link reliability observed in the field. A basic,
first order calculation of the probability of a packet reaching its destination
in the GRAd network is simply pn, where p is the probability of successfully
going a single hop, and n is the number of hops. As the graph in Figure
5.2 shows, this probability quickly approaches an unacceptably low
number. Even accounting for retries and second order effects (lower, but
non-zero probabilities of going through a 2nd degree neighbor directly), the
probabilities are still well below reasonable levels.
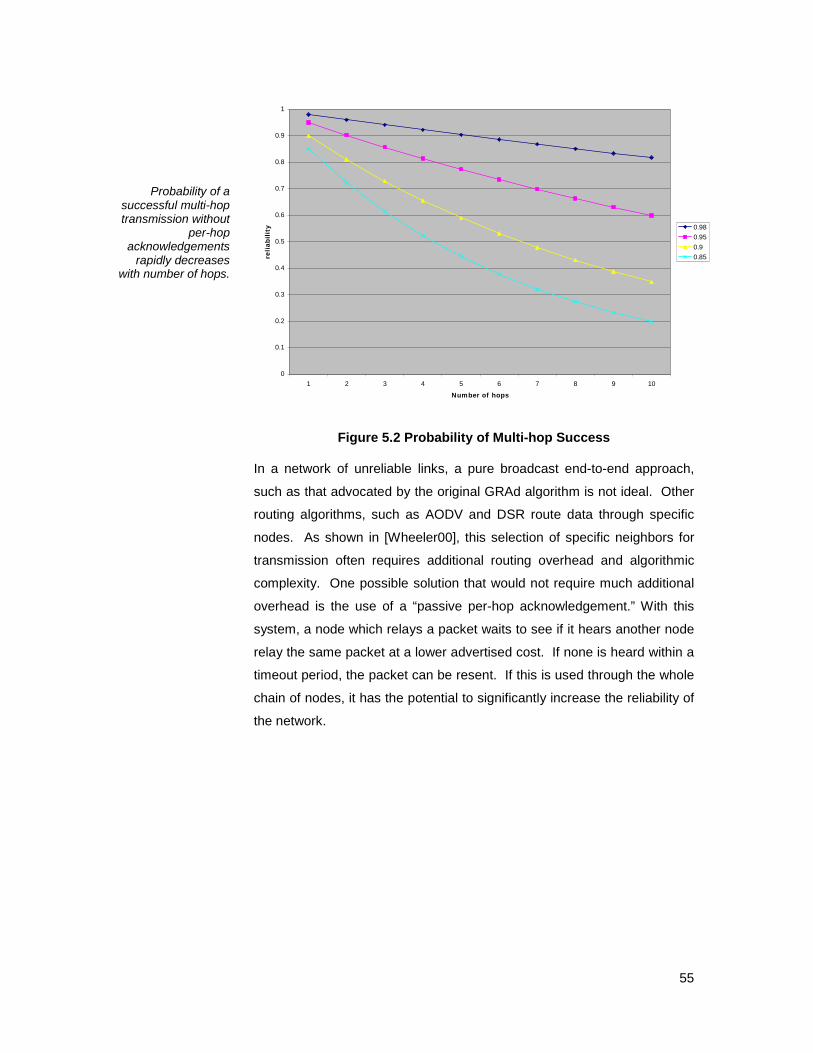
55
0
0.1
0.2
0.3
0.4
0.5
0.6
0.7
0.8
0.9
1
1 2 3 4 5 6 7 8 9 10
Number of hops
reli
ab
ilit
y 0.98
0.95
0.9
0.85
Figure 5.2 Probability of Multi-hop Success
In a network of unreliable links, a pure broadcast end-to-end approach,
such as that advocated by the original GRAd algorithm is not ideal. Other
routing algorithms, such as AODV and DSR route data through specific
nodes. As shown in [Wheeler00], this selection of specific neighbors for
transmission often requires additional routing overhead and algorithmic
complexity. One possible solution that would not require much additional
overhead is the use of a “passive per-hop acknowledgement.” With this
system, a node which relays a packet waits to see if it hears another node
relay the same packet at a lower advertised cost. If none is heard within a
timeout period, the packet can be resent. If this is used through the whole
chain of nodes, it has the potential to significantly increase the reliability of
the network.
Probability of a successful multi-hop transmission without
per-hop acknowledgements
rapidly decreases with number of hops.
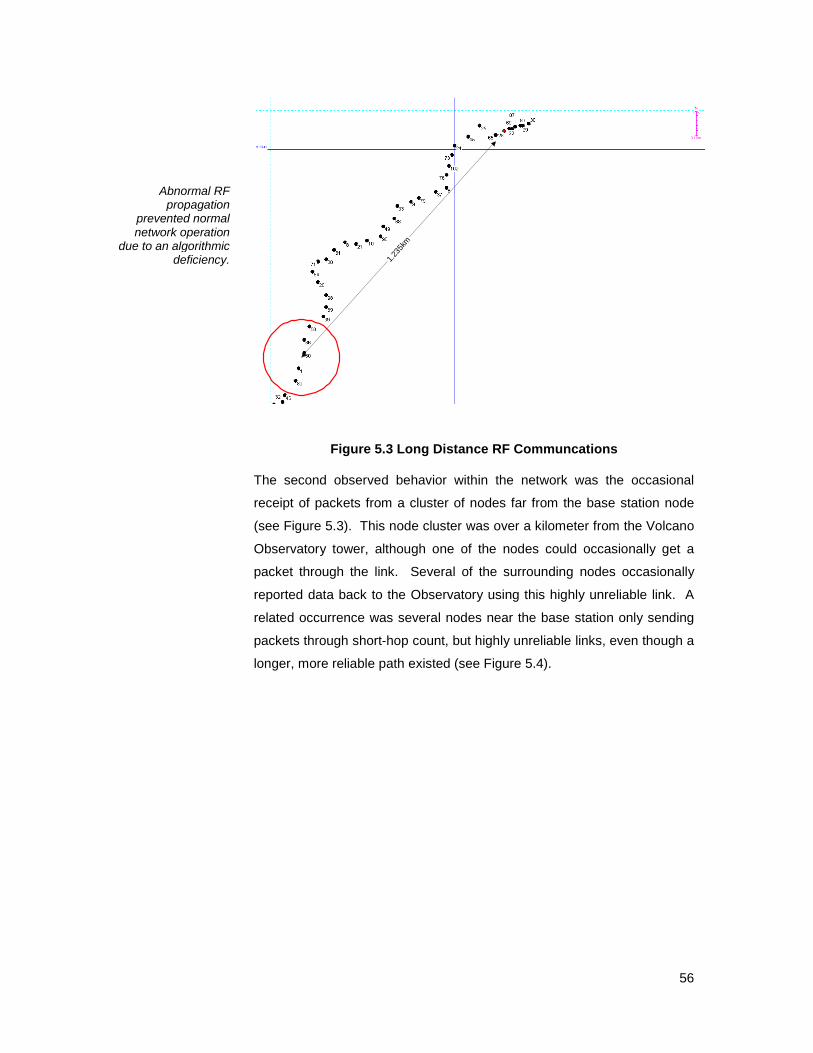
56
1.23
5km
Figure 5.3 Long Distance RF Communcations
The second observed behavior within the network was the occasional
receipt of packets from a cluster of nodes far from the base station node
(see Figure 5.3). This node cluster was over a kilometer from the Volcano
Observatory tower, although one of the nodes could occasionally get a
packet through the link. Several of the surrounding nodes occasionally
reported data back to the Observatory using this highly unreliable link. A
related occurrence was several nodes near the base station only sending
packets through short-hop count, but highly unreliable links, even though a
longer, more reliable path existed (see Figure 5.4).
Abnormal RF propagation
prevented normal network operation
due to an algorithmic deficiency.

57
1
2
3
4
5
.93
.92.98
.90
.45
.55
P(1-5, through 2,3,4) = .75P(1-5, through 3) = .25
Figure 5.4 Unreliable Link Selection
Both of these occurrences are related to the same underlying problem.
GRAd, and most other ad-hoc networking algorithms use a hop count as
the sole metric for determining the distance of a route through a network.
In the case of the Hawaii TephraNet deployment, the unreliable links
caused the network to resend packets many times. Probabilistically, every
once in a while a packet will traverse the shorter, less reliable link. When
this occurs, an artificially low distance is recorded by the algorithm. When
the nodes attempt to communicate again, they will specify the low hop-
count path as the distance, and the packets will almost certainly fail to
arrive at the destination.
This problem affects not only the GRAd algorithm, but the entire class of
algorithms that use only hop count as the metric for route selection.
Several possibilities exist for correcting this problem. One is to weight the
hop count by some factor that takes into account link reliability. This
requires that some method of measuring link reliability be found. Sending
explicit ping packets could work, but would add a large amount of
overhead to the network operation. One possibility would be to use the
RSSI (received signal strength indicator) to judge the approximate RF
quality of the link. Most radio systems, including the TephraNet system,
have this output available.
58
5.1.6 Synchronization System Review
The synchronization system (described in Section 3.4.6) was responsible
for keeping network time consistent through the network. The time in turn
controlled sleeping and waking cycles in the system for power
management purposes. Analysis of the exact causes of the failure of the
synchronization system is difficult because detailed timing data was not
sent back to the base station node through the network and when the
synchronization system failed, the whole network often failed. Observation
of the system revealed several problems that were corrected in the field,
and point to a further problem that was not corrected.
Early revisions implemented the algorithm exactly as proposed by Poor in
[Poor01]. This quickly proved to require a large settling time and had a
hard time recovering from the constant addition of new nodes to the
network (each of them injected a new time that had to be averaged in). A
startup period was added that listened to timing packets and simply set the
internal time to the time heard instead of averaging. This alleviated most
of the settling time issues.
The next problem encountered was that the sleep cycle of a node has nine
times as much sleeping time as waking time. If a node somehow is off of
the network time enough that its waking time is while the other nodes are
asleep, the node never hears the correct time, and cannot recover. This
was fixed by causing each node to wake up briefly several times during its
sleeping time to broadcast a timing packet.
Even with the above corrections, the network appeared to get into
situations where synchronization was lost. Analysis of the data reveals
that even with the broadcast of timing packets while asleep, the system did
not recover once a node was no longer awake when other nodes were.
Since the degree of connectivity in the network was poor, the settling time
of the network was large— each node only averaged time with a neighbor
or two on each side. Once timing is off, a situation can arise where a node
is directly between its two neighbors in time, but far enough away in timing
that it is never awake at the same time as either of its neighbors. When
this happens the node in the center does not actually adjust its time at all,
and the nodes on the side will take many sleep cycles to adjust their time,
and may also fail to adjust it meaningfully.

59
These stability problems with the algorithm indicate it is not appropriate for
use in a network like TephraNet. Previous simulation of the algorithm
failed to simulate static networks and networks that alternate between a
sleeping and waking period.
5.2 Future work
The work started in TephraNet made a large step forward in establishing
self-organizing wireless networks as a valuable research tool for
environmental research, and toward establishing a common platform on
which to test these network algorithms. However, much additional work
remains to improve on what has been started.
5.2.1 Redesign of Hardware Platform
The hardware platform should be redesigned in order to increase its
manufacturability. The current platform contains certain components, such
as the uBGA packaged flash chip that significantly increase the complexity
and cost of the system. The 2 board design should also be revisited,
either finding a new stacking method, or condensing onto a single board.
This will ease the programmability and handling of the platform in the field.
5.2.2 Long Term Deployment and Other Deployments
In order to fully prove the usefulness of this technology in the field of
environmental research, a long term deployment should be done.
Additional information about the performance of the routing algorithms and
system could potentially be uncovered if tested for a longer time period.
The TephraNet system should also be deployed into other areas besides
the Hawaii Volcanoes site to determine its general usefulness.
5.2.3 Use as a Test Platform
In order to further evaluate the usefulness of the TephraNet platform as a
test bed for network routing algorithms, more of these algorithms should
be implemented on the system. Continued detailed analysis of the
differences between results seen in simulation and on the platform should
be conducted to uncover potential problems in the design of the platform
or the simulator.
60
5.2.4 Software Toolkit Refinements
The software portion of the TephraNet system can benefit from several
additional features. In order for the system to be a viable test platform, it
should be easy to gather data about the operating network and to make
changes to the running code. This points to the need for software on the
platform to be interchangeable with a minimum amount of effort. Ideally,
this could be done directly through the network and also through a back-
channel, such as a wired network attached to each node.
5.2.5 Refinement of Software Algorithms
The synchronization and routing algorithms play key roles in the operation
of TephraNet for environmental sensing. Since these two components did
not function correctly, they should be reworked. The suggestions posed in
the analysis (Section 5.1.5) should be tested out as possible solutions to
the algorithmic problems.
5.3 Contributions and Conclusions
The TephraNet system made several contributions to the areas of self-
organizing network research and to environmental sensing tools. The
TephraNet system introduced self-organizing networks as a tool for
environmental research and made a significant step towards
demonstrating a working system for that application. The system also
presents a first revision of a common hardware and software toolkit for
both environmental sensing and the testing of ad-hoc network routing
algorithms. Significant problems with the current formulation of both
GRAd and other hop-count based algorithms were also uncovered. Future
work with the TephraNet platform should help advance both the fields of
environmental sensing and ad-hoc wireless networking.

61
Appendix A: Hardware Design
12
34
ABCD
43
21
D C B AT
itle
Num
ber
Rev
isio
nSi
ze Let
ter
Dat
e:8-
Aug
-200
1Sh
eet
ofFi
le:
D:\a
jwhe
ele\
cons
tella
tion2
\con
stel
latio
n2.d
dbD
raw
nB
y:
LN
A_G
ND
1
LN
A2
LN
A_G
ND
3
PA_V
CC
4
PA_O
UT
5
PA_G
ND
6
PLL
_GN
D7
PD_S
ET
8
PD_O
UT
29
PD_O
UT
110
LO
CK
DE
T11
PLL
_VC
C12
VCO_TANK113
VCO_TANK2 14
DDS_GND 15
_STDBY 16
MODE 17
DDS_VCC 18
TX_DATA 19
DIG_VCC 20
DIG_GND21
GND22
XOSC123
XOSC224
STR
OB
E25
CL
OC
K26
S_D
AT
A27
RX
_DA
TA
28
S&H
_CA
P29
AM
P_O
UT
30
AM
P_C
AP
31
AM
P_IN
32
RSS
I_O
UT
33
DE
M_T
AN
K1
34D
EM
_TA
NK
235
DE
M_V
CC
36
VREF37
DEM_GND38
IF2_IN39
IF_GND40
IF1_OUT41IF1_IN42
MIX_GND43
MIX_OUT44MIX_VCC45
MIX_IN46LNA_OUT47
LNA_VCC48
U1
TR
F690
0
C3
.1uF
C11
10pF
C2
.1uF
C4
.1uF
C6
.1uF
C15
100p
FC
22D
NP
C23
100p
F
C14
27pF
C7
?
C35
DN
P
C10
.1uF
C27
4pF
C26
4pF
C8
.1uF
C25
18pF
C5
.1uF
C18
1nF
C17
1nF
C12
4.7p
F
C13
100p
F
VC
C
L3
10nH
L5
4.7n
H
VC
C
R14
100K
R12
30K
R9
10K
R10
10K
C24
180p
F
VC
C
L4
10nH
D1
SMV
1247
D2
SMV
1247
VC
C
R15
100
R16
1MC
34
12pF
Y1
25.6
MH
z
_STDBYRFMODE
TX_DATA
R11
39K
VC
C
R7
7.5K
L6
2.2u
H
BPF
1
10.7
MH
z(2
30K
Hz
BW
)
L2
18nH
L1
8.2n
H
VC
C
C1
.1uF
VC
C R1
10
R2
10
R3
10
R6
10
C28 D
NP
C16 3.
3pF
C19
47pF
C21
47pF
C20
47pF
RSS
I_O
UT
RX
_DA
TA
RF_
PDA
TA
RF_
PCL
KR
F_PS
TR
OB
EL
OC
KD
ET
JP4
RF_
CO
AX
R18
10
R19
10
VC
C
C36
.1uF
Rad
iov2
.1.3
chec
kva
ls(r
=55K
)
idea
l167
pF
OU
T1
1
GN
D2
OU
T2
3V
C2
4IN
5V
C1
6
U3
UPG
152T
A
C32
1000
pF
C9
1000
pFRFS
CT
L1
RFS
CT
L2
C42
CA
PVA
R
C43
4pF
C33
4pF
Radio Schematic, part 1/2
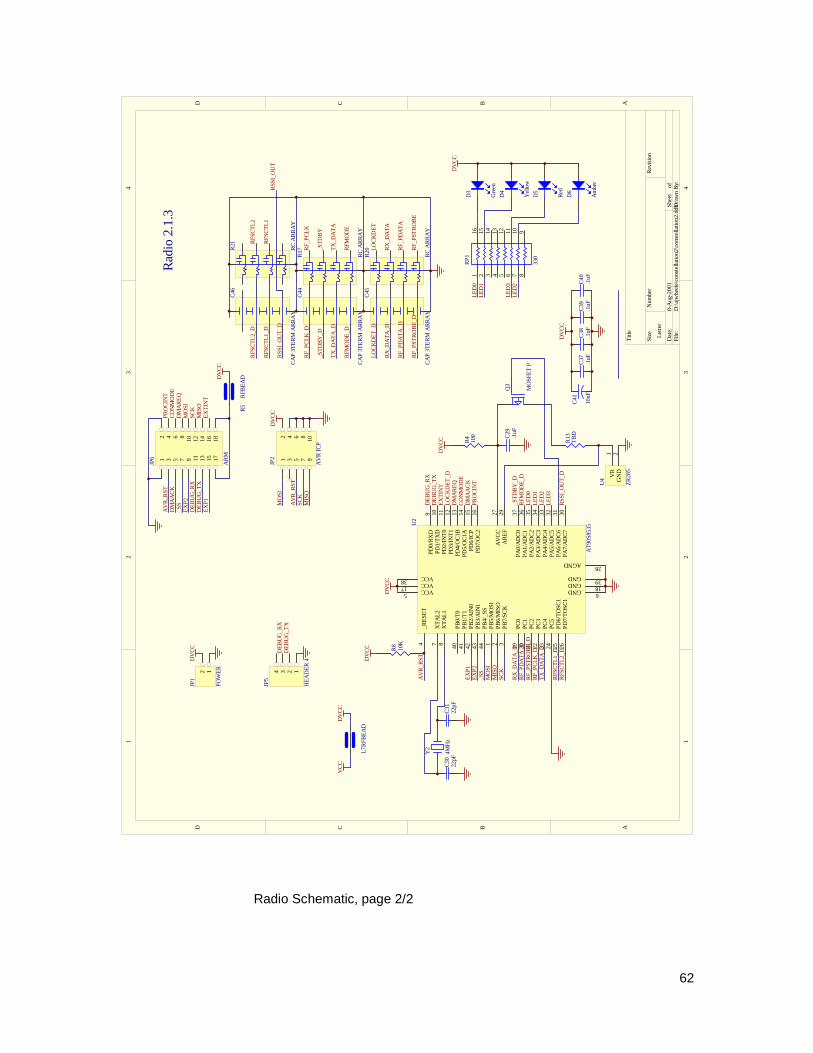
62
12
34
ABCD
43
21
D C B AT
itle
Num
ber
Rev
isio
nSi
ze Let
ter
Dat
e:8-
Aug
-200
1Sh
eet
ofFi
le:
D:\a
jwhe
ele\
cons
tella
tion2
\con
stel
latio
n2.d
dbD
raw
nB
y:
PB5/
MO
SI1
PB6/
MIS
O2
PB7/
SCK
3
_RE
SET
4
VCC5 GND 6
XT
AL
27
XT
AL
18
PD0/
RX
D9
PD1/
TX
D10
PD2/
INT
011
PD3/
INT
112
PD4/
OC
1B13
PD5/
OC
1A14
PD6/
ICP
15
PD7/
OC
216
VCC17 GND 18
PC0
19
PC1
20
PC2
21
PC3
22
PC4
23
PC5
24
PD6/
TO
SC1
25
PD7/
TO
SC1
26
AV
CC
27AGND 28
AR
EF
29
PA7/
AD
C7
30PA
6/A
DC
631
PA5/
AD
C5
32PA
4/A
DC
433
PA3/
AD
C3
34PA
2/A
DC
235
PA1/
AD
C1
36PA
0/A
DC
037
VCC38 GND 39
PB0/
T0
40
PB1/
T1
41
PB2/
AIN
042
PB3/
AIN
143
PB4/
_SS
44
U2
AT
90S8
535
Y2
4MH
zC
3022
pFC
3122
pF
DV
CC
R8
10K
DV
CC
EX
TIN
T
C29
.1uF
R4
100
DV
CC
RFM
OD
E_D
LO
CK
DE
T_D
_ST
DB
Y_D
RX
_DA
TA
_DR
F_PD
AT
A_D
RF_
PCL
K_D
RF_
PST
RO
BE
_D
RSS
I_O
UT
_D
GN
D2
VR
1U
4
ZR
285
R13
TB
D
AV
R_R
ST
12
34
56
78
910
JP2
AV
RIC
P
DE
BU
G_T
XD
EB
UG
_RX
TX
_DA
TA
_D
12
JP1
POW
ER
DV
CC
DV
CC
AV
R_R
ST
CO
NM
OD
E
DE
BU
G_T
X
DM
AR
EQ
DE
BU
G_R
X
DM
AA
CK
1234
JP5
HE
AD
ER
4
_SS
LE
D3
MO
SI
LE
D2
MIS
O
LE
D1
SCK
LE
D0
LE
D0
LE
D1
LE
D2
LE
D3
DV
CC
D3
Gre
en
D6
Am
ber
D5
Red
D4
Yel
low
1 2 3 4 5 6 7 8
16 15 14 13 12 11 10 9
RP1
330
PRO
CIN
T
MO
SI
MIS
OSC
K
12
34
56
78
910
1112
1314
1516
1718
JP6
AR
M
PRO
CIN
T
DM
AR
EQ
CO
NM
OD
E
EX
TIN
T
SCK
MIS
O
MO
SI_S
S
C37
.1uF
C38
.1uF
C39
.1uF
C40
.1uF
DV
CC
Rad
io2.
1.3
RFS
CT
L1_
DR
FSC
TL
2_D
AV
R_R
STD
MA
AC
K
EX
P1E
XP2
DE
BU
G_R
XD
EB
UG
_TX
EX
P1
EX
P2
C41
10uF
R5
RFB
EA
DDV
CC
Q3
MO
SFE
TP
L7R
FBE
AD
VC
CD
VC
C
C45
CA
P3T
ER
MA
RR
AY
C44
CA
P3T
ER
MA
RR
AY
R20
RC
AR
RA
Y
R17
RC
AR
RA
Y
LO
CK
DE
T_D
RX
_DA
TA
_D
RF_
PDA
TA
_DR
F_PD
AT
A
RX
_DA
TA
LO
CK
DE
T
RF_
PST
RO
BE
_DR
F_PS
TR
OB
E
RF_
PCL
K_D
RF_
PCL
K
_ST
DB
Y_D
_ST
DB
Y
TX
_DA
TA
_DT
X_D
AT
A
RFM
OD
E_D
RFM
OD
E
C46
CA
P3T
ER
MA
RR
AY
R21
RC
AR
RA
Y
RFS
CT
L2_
DR
FSC
TL
2
RFS
CT
L1
RFS
CT
L1_
D
RSS
I_O
UT
_DR
SSI_
OU
T
Radio Schematic, page 2/2
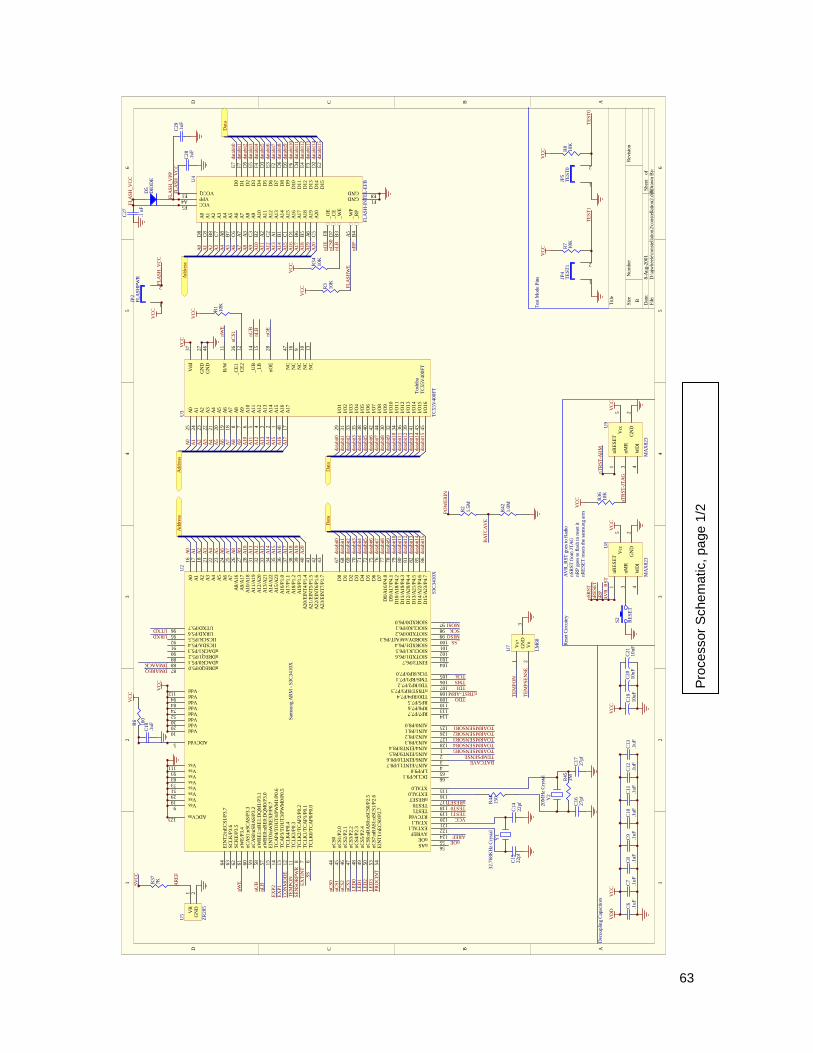
63
12
34
56
ABCD
65
43
21
D C B A
Titl
e
Num
ber
Rev
isio
nSi
ze B Dat
e:8-
Aug
-200
1Sh
eet
ofFi
le:
D:\a
jwhe
ele\
cons
tella
tion2
\con
stel
latio
n2.d
dbD
raw
nB
y:
VC
C
AIN4/EINT8/P8.4 1AIN5/EINT9/P8.5 2AIN6/EINT10/P8.6 3AIN7/EINT11/P8.7 4
ADCVdd5T
CL
K0/
TC
AP0
/P0.
06
TC
LK
1/T
CA
P1/P
0.1
7T
CL
K2/
TC
AP2
/P0.
28
Vss9
Vdd10
TC
LK
3/P0
.311
TC
LK
4/P0
.412
TC
AP3
/TO
UT
3/PW
M0/
P0.5
13T
CA
P4/T
OU
T4/
PWM
1/P0
.614
EIN
T0/
nWR
EX
P/P0
.715
A0
16
A1
17
A2
18
Vss19
Vdd20
A3
21
A4
22
A5
23
A6
24
A7
25
A8/
A16
26
A9/
A17
27
A10
/A18
28
Vss29
Vdd30
A11
/A19
31
A12
/A20
32
A13
/A21
33
A14
/A22
34
A15
/A23
35
A16
/P1.
036
A17
/P1.
137
A18
/P1.
238
A19
/P1.
339
A20
/EIN
T4/
P1.4
40
A21
/EIN
T5/
P1.5
41
A22
/EIN
T6/
P1.6
42
A23
/EIN
T7/
P1.7
43
nCS0
44
nCS1
/P2.
045
nCS2
/P2.
146
nCS3
/P2.
247
nCS4
/P2.
348
nCS5
/P2.
449
nCS6
:nR
AS0
:nSC
S0/P
2.5
50
Vss51
Vdd52
nCS7
:nR
AS1
:nSC
S1/P
2.6
53
EIN
T1/
nEC
S0/P
2.7
54
nOE 55nAS 56nWB
E0:
nBE
0:D
QM
0/P3
.057
nWB
E1:
nBE
1:D
QM
1/P3
.158
nCA
S0:n
SRA
S/P3
.259
nCA
S1:n
SCA
S/P3
.360
nWE
/P3.
461
SCK
E/P
3.5
62SC
LK
/P3.
663
EIN
T2/
nEC
S1/P
3.7
64
LP/P9.0 65DCLK/P9.1 66
D0
67
D1
68
D2
69
D3
70
D4
71
D5
72
Vss73
Vdd74
D6
75
D7
76
D8/
A16
/P4.
077
D9/
A17
/P4.
178
D10
/A18
/P4.
279
D11
/A19
/P4.
380
D12
/A20
/P4.
481
D13
/A21
/P4.
582
Vss83
Vdd84
D14
/A22
/P4.
685
D15
/A23
/P4.
786
nDREQ0/P5.087
nDACK0/P5.188
nDREQ1/P5.289
nDACK1/P5.390
IICSDA/P5.491
IICSCK/P5.592
Vss93
Vdd94
URXD/P5.695
UTXD/P5.796
SIORXD0/P6.0 97SIOCLK0/P6.1 98SIOTXD0/P6.2 99SIORDY/nWAIT/P6.3 100SIORXD1/P6.4 101SIOCLK1/P6.5 102SIOTXD1/P6.6 103EINT3/P6.7 104
TCK/RP0/P7.0 105TMS/RP1/P7.1 106TDI/RP2/P7.2 107nTRST/RP3/P7.3 108TD0/RP4/P7.4 109RP5/P7.5 110
Vss111
Vdd112
RP6/P7.6 113RP7/P7.7 114
XTAL0 115EXTAL0 116nRESET 117TEST0 118TEST1 119RTCVdd 120XTAL1 121EXTAL1 122
ADCVss123
AVREF 124
AIN0/P8.0 125AIN1/P8.1 126AIN2/P8.2 127AIN3/P8.3 128
Sam
sung
AR
M-S
3C34
10X
U2
S3C
3410
X
A15
1A
142
A13
3A
124
A11
5A
106
A9
7A
88
NC
9
NC
10
R/W
11
CE
212
NC
13
_UB
14
_LB
15
NC
16A
1717
A7
18A
619
A5
20A
421
A3
22A
223
A1
24A
025
_CE
126
GN
D27
nOE
28
I/O1
29
I/O9
30
I/O2
31
I/O10
32
I/O3
33
I/O11
34
I/O4
35
I/O12
36
Vdd
37
I/O5
38
I/O13
39
I/O6
40
I/O14
41
I/O7
42
I/O15
43
I/O8
44
I/O16
45
GN
D46
NC
47A
1648
Tos
hiba
TC
55V
400F
T
U3
TC
55V
400F
T
VC
C
C6
.1uF
C7
.1uF
C8
.1uF
C9
.1uF
C10
.1uF
C11
.1uF
C12
.1uF
C13
.1uF
VD
D
Dec
oupl
ing
Cap
acito
rs
nWE
nUB
nLB
nWE
nUB
nLB
VC
CA
0A
1A
2A
3A
4A
5A
6A
7A
8A
9A
10A
11A
12A
13A
14A
15A
16A
17
Add
ress
A0
A1
A2
A3
A4
A5
A6
A7
A8
A9
A10
A11
A12
A13
A14
A15
A16
A17
Add
ress
nOE
nOE
data
bit0
data
bit1
data
bit2
data
bit3
data
bit4
data
bit5
data
bit6
data
bit7
data
bit8
data
bit9
data
bit1
0da
tabi
t11
data
bit1
2da
tabi
t13
data
bit1
4da
tabi
t15
data
bit0
data
bit1
data
bit2
data
bit3
data
bit4
data
bit5
data
bit6
data
bit7
data
bit8
data
bit9
data
bit1
0da
tabi
t11
data
bit1
2da
tabi
t13
data
bit1
4da
tabi
t15
Dat
aD
ata
nCS1
nCS0
VC
C
nCS1
R1
10K
A0
D8
A1
C8
A2
B8
A3
C7
A4
A8
A5
B7
A6
C6
A7
A7
A8
A3
A9
C3
A10
B2
A11
A2
A12
C2
A13
A1
A14
B1
A15
C1
A16
D1
A17
B6
A18
B5
A19
A6
A20
C5
_OE
F8
_CE
D7
_WE
B3
_WP
A5
_RP
B4
GND F1
GND E8
D0
E7
D1
F7
D2
D5
D3
E5
D4
F4
D5
D3
D6
E3
D7
F2
D8
D6
D9
E6
D10
F6
D11
D4
D12
E4
D13
F3
D14
D2
D15
E2
VCCF5
VPPA4
VCCQE1
U4
FLA
SH-I
NT
EL
-EFB
A0
A1
A2
A3
A4
A5
A6
A7
A8
A9
A10
A11
A12
A13
A14
A15
A16
A17
Add
ress
data
bit0
data
bit1
data
bit2
data
bit3
data
bit4
data
bit5
data
bit6
data
bit7
data
bit8
data
bit9
data
bit1
0da
tabi
t11
data
bit1
2da
tabi
t13
data
bit1
4da
tabi
t15
Dat
a
VC
C
nCS0
nLB
nOE
R3
10K
VC
CA
18A
19A
20
A18
A19
A20
Y2
20M
Hz
Cry
stal
Y1
32.7
68K
Hz
Cry
stal
C14
22pf
C15
22pf
C16
27pf
C17
27pf
URXDUTXD
C19
10uF
C20
10uF
C21
10uF
VC
C
LE
D0
LE
D1
LE
D2
LE
D3
nRESET
nRE
SET
nRP
nRP
R34
10K
VC
C
DMAREQ
_SS
_SS
MOSISCK
PRO
CIN
T
DMAACK
EX
TIN
T
MISO
TEST1TEST0
1
2
JP4
TE
ST1
1
2
JP5
TE
ST0
TE
ST0
TE
ST1
R7
10K
R8
10K
VC
CV
CC
Tes
tMod
ePi
ns
Res
etC
ircui
try
nTRST-ARM
TMSTCK
TDI
TDO
R6
100
C18
.1uF
VC
C
nRE
SET
rese
tsth
esa
msu
ngar
mnR
Pgo
esto
flash
tore
seti
t
R36
10K
VC
C
S2 RE
SET
nSR
ST
nTR
ST-J
TA
G
nSR
STfr
omJT
AG
SEN
SOR
PWR
TOARMSENSOR1TOARMSENSOR2TOARMSENSOR3TOARMSENSOR4TOARMSENSOR5
_FL
ASH
WE
nCS2
nCS3
TEMPSENSE
Vs+
1
Vo
2G
ND
3
U7
LM
60
TE
MPS
EN
SE
TE
MPO
N
TE
MPO
N
R2
1.5M
R42
1.0M
BATCAVE
BA
TC
AV
E
CO
NM
OD
EE
XP1
EX
P2
AV
R_R
ST
nRE
SET
1
GN
D2
nMR
3
WD
I4
Vcc
5
U8
MA
X82
3
nRE
SET
1
GN
D2
nMR
3
WD
I4
Vcc
5
U9
MA
X82
3
VC
CV
CC
nTR
ST-A
RM
AV
R_R
STgo
esto
Rad
io
VCC
D5
DIO
DE
C27
.1uF
FLA
SH_V
CC
FLA
SH_V
CC
1
2
JP2
FLA
SHPW
R
FLA
SH_V
CC
FLA
SH_V
PP
GN
D2
VR
1U
5
ZR
285
R37
?K AR
EF
AREF
R45
1M
R44
150
C29
.1uF
C28
.1uF
POW
ER
IN
SVC
C
Pro
cess
or S
chem
atic
, pag
e 1/
2

64
12
34
56
ABCD
65
43
21
D C B A
Titl
e
Num
ber
Rev
isio
nSi
ze B Dat
e:8-
Aug
-200
1Sh
eet
ofFi
le:
D:\a
jwhe
ele\
cons
tella
tion2
\con
stel
latio
n2.d
dbD
raw
nB
y:
Thi
sis
whe
reth
eas
sloa
dsof
conn
ecto
rsgo
.
VC
C
databit0
databit1
databit2
databit3
databit4
databit5
databit6
databit7
databit8
databit9
databit10
databit11
databit12
databit13
databit14
databit15
VC
C
A0A1A2A3A4A5A6A7A8A9A10A11A12A13A14A15A16A17A18A19A20
UTXDURXD
LE
D3
LE
D2
LE
D1
LE
D0
VC
C
D1
Red
D4
Gre
en
D3
Am
ber
D2
Yel
low
1 2 3 4 5 6 7 8
16 15 14 13 12 11 10 9
RP1
330
C1
0.1
uF
C2
0.1
uF
C3
0.1
uF
C4
0.1
uF
C5
10uF
R_O
UT
115
T_I
N1
13T
_OU
T1
17
R_I
N1
16
C1+
2
C1-
4
C2+
5
C2-
6
V+
3
V-
7
VCC19 GND 18
T_I
N2
12
R_O
UT
210
T_O
UT
28
R_I
N2
9
nIN
VA
LID
11
nFO
RC
EO
FF20
RE
AD
Y1
FOR
CE
ON
14
U1
MA
X32
25
VC
C
UT
XD
UR
XD
GN
DG
ND
VC
C
1 2
JP1
Hiro
seSM
2pi
n
PRO
CIN
T
DM
AR
EQ
CO
NM
OD
E
EX
TIN
T
SCK
MIS
O
MO
SI
_SS
VC
C
12
34
56
78
910
1112
1314
1516
1718
1920
JP7
JTA
GH
EA
DE
R
1 2 3 4
JP12
Hiro
seSM
4pi
n
R5
10K
VC
C
R4
10KV
CC
shut
sof
faut
omat
ical
ly
12
34
56
78
910
1112
1314
1516
1718
1920
JP11
SEN
SOR
HE
AD
ER
Q9
MO
SFE
TP
VC
C
SEN
SOR
PWR
SVC
C
R9
78.7
K
R10
RE
S1
SVC
C
GN
D
GN
D
GN
DG
ND
GN
D
SEN
SOR
1A
R11
200K
R12
RE
S1
SVC
C
R13
RE
S1
R14
RE
S1
SVC
C
R15
RE
S1
R16
RE
S1
SVC
C
R17
RE
S1
R18
RE
S1
SVC
C
SEN
SOR
2ASE
NSO
R3A
SEN
SOR
4ASE
NSO
R5A
SEN
SOR
1A
SEN
SOR
2A
SEN
SOR
3A
SEN
SOR
4A
SEN
SOR
5A
R19
RE
S1
R20
0.0
SVC
C
SEN
SOR
1BR
21
100
TOARMSENSOR1
R22
RE
S1
R23
0.0
SVC
C
SEN
SOR
2BR
24
100
R25
RE
S1
R26
RE
S1
SVC
C
SEN
SOR
3BR
27
100
R28
RE
S1
R29
RE
S1
SVC
C
SEN
SOR
4BR
30
100
R31
RE
S1
R32
RE
S1
SVC
C
SEN
SOR
5BR
33
100
TOARMSENSOR2
TOARMSENSOR3
TOARMSENSOR4
TOARMSENSOR5
SEN
SOR
1B
SEN
SOR
2B
SEN
SOR
3B
SEN
SOR
4B
SEN
SOR
5B
Seria
lPor
tStu
ff
Rad
ioC
ontr
ol
LE
Ds
Sens
orIn
terf
ace
nRPnWEnRESET
nCS0nCS1
nUBnLB
nOE
GN
D
GN
DG
ND
GN
D
GN
D
1
JP8
GN
DT
EST
1
JP10
VC
CT
EST
D6
1ASC
HT
KY
DIO
DE
Vou
t1
LB
O2
LBI 3
GND 4
LX
5V
+6
VFB
7
nSH
DN
8
U6
MA
X63
9
R35
348K
R41
200K
L1
220u
H
C25
47uF
C24
47uF
C22
.1uF
C23
.1uF
C26
150u
F
POW
ER
IN
POW
ER
INV
CC
1 2 3 4 5 6 7 8 9 10 11 12 13 14 15 16 17 18
JP6
Rad
ioH
eade
r
123456789101112131415161718192021222324252627282930
J1 Exp
ansi
on-D
ata
123456789101112131415161718192021222324252627282930
J2 Exp
ansi
on-A
ddre
ss
nCS2nCS3
EX
P1
EX
P2
AV
R_R
ST
DM
AA
CK
VC
C
nTR
ST-J
TA
GT
DI
TM
ST
CK
TD
OnS
RST
VC
CV
TR
EF
DB
GR
QD
BG
AC
K
R43
10K
R40
10K
R39
10K
R38
10K
VC
C
VC
CV
CC
VC
C
RT
CK
FLASH_VPPFLASH_VCC
VC
C
C30
.1uF
The
rmph
oto
flex
The
rmph
oto
flex
Pro
cess
or S
chem
atic
, pag
e 2/
2
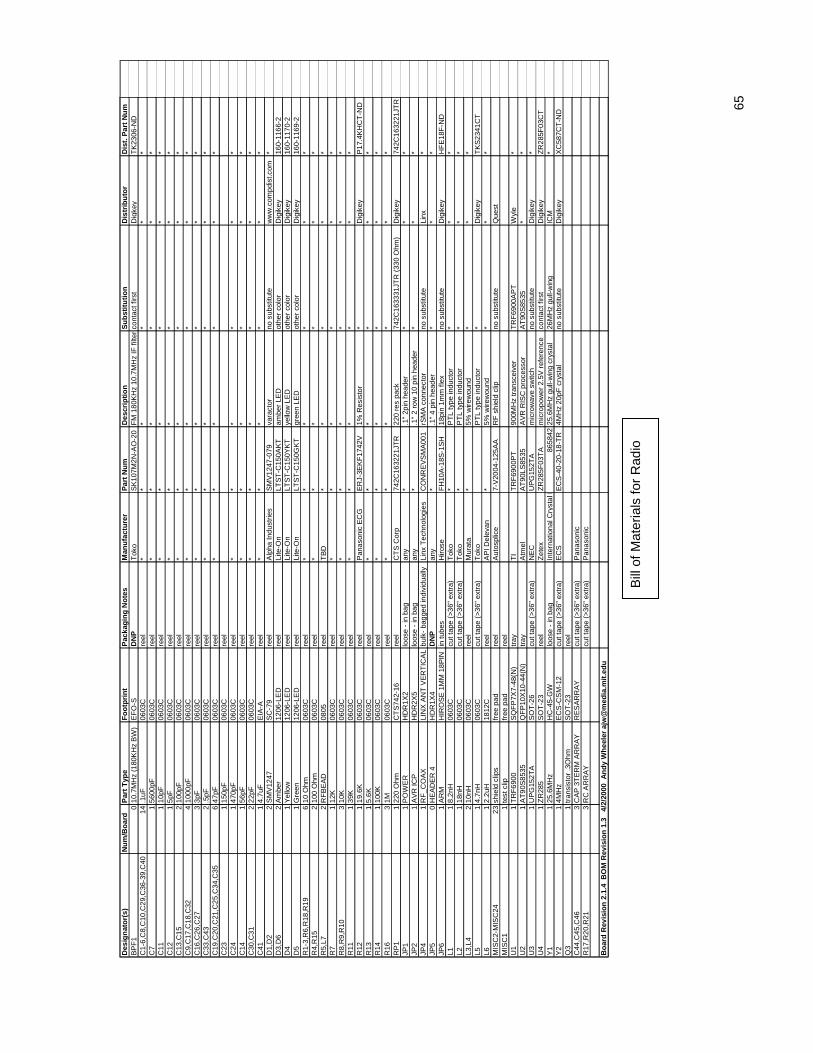
65
Des
ign
ato
r(s)
Nu
m/B
oar
dP
art
Typ
eF
oo
tpri
nt
Pac
kag
ing
No
tes
Man
ufa
ctu
rer
Par
t N
um
Des
crip
tio
nS
ub
stit
uti
on
Dis
trib
uto
rD
ist.
Par
t N
um
BP
F1
010
.7M
Hz
(180
KH
z B
W)
EF
O-S
DN
PT
oko
SK
107M
2N-A
O-2
0F
M 1
80K
Hz
10.7
MH
z IF
filte
rco
ntac
t firs
tD
igke
yT
K23
06-N
DC
1-6,
C8,
C10
,C29
,C36
-39,
C40
14.1
uF06
03C
reel
**
**
**
C7
156
00pF
0603
Cre
el*
**
**
*C
111
10pF
0603
Cre
el*
**
**
*C
121
5pF
0603
Cre
el*
**
**
*C
13,C
152
100p
F06
03C
reel
**
**
**
C9,
C17
,C18
,C32
410
00pF
0603
Cre
el*
**
**
*C
16,C
26,C
273
3pF
0603
Cre
el*
**
**
*C
33,C
432
.5pF
0603
Cre
el*
**
**
*C
19,C
20,C
21,C
25,C
34,C
356
47pF
0603
Cre
el*
**
**
*C
231
150p
F06
03C
reel
C24
147
0pF
0603
Cre
el*
**
**
*C
141
56pF
0603
Cre
el*
**
**
*C
30,C
312
22pF
0603
Cre
el*
**
**
*C
411
4.7u
FE
IA-A
reel
**
**
**
D1,
D2
2S
MV
1247
SC
-79
reel
Alp
ha In
dust
ries
SM
V12
47-0
79va
ract
orno
sub
stitu
tew
ww
.com
pdis
t.com
*D
3,D
62
Am
ber
1206
-LE
Dre
elLi
te-O
nLT
ST
-C15
0AK
Tam
ber
LED
othe
r co
lor
Dig
ikey
160-
1166
-2D
41
Yel
low
1206
-LE
Dre
elLi
te-O
nLT
ST
-C15
0YK
Tye
llow
LE
Dot
her
colo
rD
igik
ey16
0-11
70-2
D5
1G
reen
1206
-LE
Dre
elLi
te-O
nLT
ST
-C15
0GK
Tgr
een
LED
othe
r co
lor
Dig
ikey
160-
1169
-2R
1-3,
R6,
R18
,R19
610
Ohm
0603
Cre
el*
**
**
*R
4,R
152
100
Ohm
0603
Cre
el*
**
**
*R
5,L7
2R
FB
EA
D08
05re
elT
BD
**
**
*R
71
12K
0603
Cre
el*
**
**
*R
8,R
9,R
103
10K
0603
Cre
el*
**
**
*R
111
39K
0603
Cre
el*
**
**
*R
121
19.6
K06
03C
reel
Pan
ason
ic E
CG
ER
J-3E
KF
1742
V1%
Res
isto
r*
Dig
ikey
P17
.4K
HC
T-N
DR
131
5.6K
0603
Cre
el*
**
**
*R
141
100K
0603
Cre
el*
**
**
*R
163
1M06
03C
reel
**
**
**
RP
11
220
Ohm
CT
S74
2-16
reel
CT
S C
orp
742C
1632
21JT
R22
0 re
s pa
ck74
2C16
3331
JTR
(33
0 O
hm)
Dig
ikey
742C
1632
21JT
RJP
11
PO
WE
RH
DR
1X2
loos
e -
in b
agan
y*
.1"
2pin
hea
der
**
*JP
21
AV
R IC
PH
DR
2X5
loos
e -
in b
agan
y*
.1"
2 ro
w 1
0 pi
n he
ader
**
*JP
41
RF
_CO
AX
LIN
X A
NT
VE
RT
ICA
Lbu
lk-
bagg
ed in
divi
dual
lyLi
nx T
echn
olog
ies
CO
NR
EV
SM
A00
1rS
MA
con
nect
orno
sub
stitu
teLi
nx*
JP5
0H
EA
DE
R 4
HD
R1X
4D
NP
any
*.1
" 4
pin
head
er*
**
JP6
1A
RM
HIR
OS
E 1
MM
18P
INin
tube
sH
irose
FH
10A
-18S
-1S
H18
pin
1mm
flex
no s
ubst
itute
Dig
ikey
HF
E18
F-N
DL1
18.
2nH
0603
Ccu
t tap
e (>
36"
extr
a)T
oko
*P
TL
type
indu
ctor
**
*L2
118
nH06
03C
cut t
ape
(>36
" ex
tra)
Tok
o*
PT
L ty
pe in
duct
or*
**
L3,L
42
10nH
0603
Cre
elM
urat
a*
5% w
irew
ound
**
*L5
14.
7nH
0603
Ccu
t tap
e (>
36"
extr
a)T
oko
PT
L ty
pe in
duct
or*
Dig
ikey
TK
S23
41C
TL6
12.
2uH
1812
Cre
elA
PI D
elev
an*
5% w
irew
ound
**
*M
ISC
2-M
ISC
2423
shie
ld c
lips
free
pad
reel
Aut
ospl
ice
7-V
2004
-125
AA
RF
shi
eld
clip
no s
ubst
itute
Que
stM
ISC
11
test
clip
free
pad
reel
U1
1T
RF
6900
SQ
FP
7X7-
48(N
)tr
ayT
IT
RF
6900
PT
900M
Hz
tran
scei
ver
TR
F69
00A
PT
Wyl
e*
U2
1A
T90
S85
35Q
FP
10X
10-4
4(N
)tr
ayA
tmel
AT
90LS
8535
AV
R R
ISC
pro
cess
orA
T90
S85
35*
*U
31
UP
G15
2TA
SO
T-2
6cu
t tap
e (>
36"
extr
a)N
EC
UP
G15
2TA
mic
row
ave
switc
hno
sub
stitu
teD
igik
ey*
U4
1Z
R28
5S
OT
-23
reel
Zet
exZ
R28
5F03
TA
mic
ropo
wer
2.5
V r
efer
ence
cont
act f
irst
Dig
ikey
ZR
285F
03C
TY
11
25.6
MH
zH
C-4
5-G
Wlo
ose
- in
bag
Inte
rnat
iona
l Cry
stal
M86
5842
25.6
MH
z gu
ll-w
ing
crys
tal
26M
Hz
gull-
win
gIC
M*
Y2
14M
Hz
EC
S-C
SM
-12
cut t
ape
(>36
" ex
tra)
EC
SE
CS
-40-
20-1
8-T
R4M
Hz
20pF
cry
stal
no s
ubst
itute
Dig
ikey
XC
587C
T-N
DQ
31
tran
sist
or .3
Ohm
SO
T-2
3re
elC
44,C
45,C
463
CA
P 3
TE
RM
AR
RA
YR
ES
AR
RA
Ycu
t tap
e (>
36"
extr
a)P
anas
onic
R17
,R20
,R21
3R
C A
RR
AY
cut t
ape
(>36
" ex
tra)
Pan
ason
ic
Bo
ard
Rev
isio
n 2
.1.4
BO
M R
evis
ion
1.3
4/
2/20
00 A
nd
y W
hee
ler
ajw
@m
edia
.mit
.ed
u
Bill
of M
ater
ials
for
Rad
io

66
Des
ign
ator
# p
er b
oard
Par
t T
ype
Fo
otp
rin
tN
otes
Man
ufa
ctu
rer
Par
t #
Des
crip
tio
nS
ub
stitu
tio
nD
istr
ibut
or
Dis
trib
#C
14, C
152
22pf
0603
C*
*22
pf C
apac
itor
Dig
ikey
PC
C22
0AC
VC
T-N
DC
1-4,
C6-
C13
, C18
, C22
, C23
, C27
-C30
19.1
uF06
03C
**
.1 u
F C
apac
itor
Dig
ikey
PC
C17
88C
T-N
DC
16, C
172
27pf
0603
C*
*27
pf c
apac
itor
Dig
ikey
311-
1063
-1-N
DC
5, C
19-2
14
10uF
EIA
-A*
**
**
C24
, C25
247
uFP
AN
AS
ON
IC T
E C
AP
DP
anas
onic
- E
CG
EC
S-T
1AD
476R
47uF
Cap
10V
Tan
talu
mD
igik
eyP
CS
2476
CT
-ND
C26
115
0uF
PA
NA
SO
NIC
UE
CA
PP
anas
onic
- E
CG
EE
F-U
E0J
151R
150u
F C
ap 6
.3V
Spe
c P
olym
erD
igik
eyP
CE
3269
CT
-ND
D1
1R
ed12
06-L
ED
Lite
-on
LTS
T-C
230C
KT
red
led
1206
foot
prin
tD
igik
ey16
0-11
86-1
D2
1Y
ello
w12
06-L
ED
Lite
-On
LTS
T-C
190E
KT
oran
ge L
ED
120
6 fo
otpr
int
Dig
ikey
160-
1182
-1D
31
Am
ber
1206
-LE
DLi
te-O
nLT
ST
-C23
0AK
TA
mbe
r LE
D 1
206
foot
prin
tD
igik
ey16
0-11
85-1
D4
1G
reen
1206
-LE
DLi
te-O
nLT
ST
-C23
0GK
TG
reen
LE
D 1
206
foot
prin
tdi
gike
y16
0-11
88-1
D5
1D
IOD
ES
C-7
0*
**
**
D6
11A
SC
HT
KY
DIO
DE
SM
AD
iode
s, In
cB
130-
131A
Sch
ottk
y D
iode
, 30
V S
MA
Dig
ikey
B13
0DIC
T-N
DJ1
, J2
2E
xpan
sion
- D
ata/
Add
rH
IRO
SE
1M
M 3
0PIN
FLE
Xhi
rose
fh10
a-30
s-1s
h1m
m 3
0 pi
n fle
x rib
bon
cabl
e he
ader
digi
key
HF
E30
F-N
DJP
11
Hiro
se S
M 2
pin
HIR
OS
E S
M R
A 2
PIN
HIR
OS
Edf
3-2p
-2h
(20)
2 pi
n rig
ht a
ngle
2m
m h
eade
rdi
gike
yH
2127
-ND
JP11
1S
EN
SO
R H
EA
DE
RH
IRO
SE
20P
IN 2
MM
RA
HD
Rhi
rose
df11
som
ethi
ng*
Dig
ikey
*JP
121
Hiro
se S
M 4
pin
HIR
OS
E S
M R
A 4
PIN
hiro
sedf
3-4p
-2h
(20)
4 pi
n rig
ht a
ngle
2m
m h
eade
rD
igik
eyH
2129
-ND
JP2,
JP
4, J
P5
3JU
MP
ER
SR
AD
0.1
any
*.1
inch
hea
der
1x2
Dig
ikey
WM
4000
-ND
JP6
1R
adio
Hea
der
HIR
OS
E 1
MM
18P
IN F
LEX
hiro
sefh
10a-
18s-
1sh
1mm
18
pin
flexi
ble
ribbo
n ca
ble
head
erdi
gike
yhf
e18f
-nd
JP7
1JT
AG
HE
AD
ER
LOG
IC A
NA
LYZ
ER
HE
AD
ER
3M.0
5 in
ch h
eade
r 2x
10D
igke
yM
HB
20K
-ND
JP8
1G
ND
TE
ST
IRO
NK
eyst
one
Ele
cP
C te
st p
oint
*D
igik
ey50
16K
CT
-ND
L11
220u
HD
T33
16C
oilc
raft
DT
3316
220
uH in
duct
orC
oilc
raft
DT
3316
Q9
1M
OS
FE
T P
SO
T-2
3-T
Fai
rchi
ldN
DS
356P
pfet
Dig
ikey
ND
S35
6PC
TR
1, R
3-R
5, R
7, R
8, R
34, R
36, R
38, R
39, R
40, R
4312
10K
0603
C*
**
Dig
ikey
P10
KG
CT
-ND
R11
120
0K06
03C
orde
red
200
arr
2.5.
01P
hyco
mp
9C06
031A
2003
FK
HF
TR
ES
200
K O
HM
1/1
6W 1
% 0
603
Dig
ikey
311-
200K
HC
T-N
DR
21
1.5M
0603
C*
1.50
M O
HM
1%
060
3D
igik
eyP
1.50
MH
CT
-ND
R20
, R23
20
0603
C*
*0.
0 O
hm 1
/16W
D
igik
ey31
1-0.
0GC
T-N
DR
21, R
24, R
27, R
30, R
335
100
0603
Cor
dere
d 10
00 a
rr 2
.5.0
1Phy
com
p9C
0603
1A10
00JL
HF
T10
0 O
HM
5%
060
3di
gike
y31
1-10
0GC
T-N
DR
351
348K
805
**
348K
080
5 R
esis
tor
Dig
ikey
P34
8KC
CT
-ND
R41
120
0K80
5*
*20
0K 0
805
Res
isto
rD
igik
eyP
200K
CC
T-N
DR
42, R
452
1.0M
0603
C*
*R
esis
tor
1.00
ohm
1%
060
3D
igik
ey31
1-1.
00M
HC
T-N
DR
441
150
0603
C*
**
Dig
ikey
P15
0GC
T-N
DR
61
100
0603
C*
**
Dig
ikey
*R
91
78.7
K06
03C
orde
red
200
arr2
.5.0
1P
hyco
mp
9C06
031A
7872
FK
HF
TR
ES
78.
7K O
HM
1/1
6W 1
% 0
603
SM
DD
igik
ey31
1-78
.7K
HC
T-N
DR
P1
133
0C
TS
742-
16C
TS
742c
1633
31j
8 re
sist
or p
ack
330
ohm
Dig
ikey
742c
1633
31jc
t-N
DS
21
RE
SE
TP
US
HS
WIT
CH
-P80
58S
-ND
Pan
ason
icE
VQ
PJB
04K
mom
enta
ry p
ush
butto
n sw
itch
Dig
ikey
P80
58S
-ND
U1
1M
AX
3225
MA
X32
25C
AP
orde
red
30 a
rr 2
.5.0
1M
axim
max
3225
cap
max
im r
s232
con
vert
erm
axim
MA
X63
9CA
PU
21
S3C
3410
XS
3C34
10X
Sam
sung
S3C
3410
XS
amsu
ng 3
2bit
AR
M p
roce
ssor
Har
borT
ech
*U
31
TC
55V
400F
TT
C55
V40
0FT
Tos
hiba
TC
55V
400F
T25
6K x
16b
it S
RA
M lo
w p
ower
Cal
tech
ele
ctro
nics
*U
41
FLA
SH
-IN
TE
L-E
FB
28F
320C
3 U
BG
AIn
tel
RD
28F
320C
3In
tel F
lash
uB
GA
.75m
mIn
tel
*U
51
ZR
285
SO
T-2
3Z
etek
ZR
285F
03T
AIC
vol
tage
RE
F 2
.5V
SM
D s
ot-2
3di
gike
yZ
R28
5F03
CT
-ND
U6
1M
AX
639
SO
-8M
axim
MA
X63
9CS
Ast
ep d
own
DC
-DC
sw
itchi
ng c
onve
rter
Max
imM
AX
639C
SA
U7
1LM
60S
OT
-23
Nat
iona
lLM
60C
IM3
2.7V
SO
T-2
3 T
empe
ratu
re S
enso
rN
ewar
k E
lect
roni
cs92
F31
7U
8, U
92
MA
X82
3S
OT
23-5
Max
imM
AX
823T
EU
K-T
5 pi
n M
icro
proc
esso
r S
uper
viso
ry C
ircui
tS
emiX
chan
geM
AX
823T
EU
KY
11
32.7
68K
Hz
Cry
stal
CM
202_
XT
AL
Citi
zen
CM
202-
32.7
68K
DZ
FT
32.7
28 K
Hz
crys
tal
Dig
ikey
300-
1006
-2-N
DY
21
20M
Hz
Cry
stal
XC
620_
XT
AL
EC
SE
CS
-200
-20-
20A
20 M
Hz
crys
tal
digi
key
XC
620C
TJP
101
DO
NO
T P
LAC
EIR
ON
DO
NO
T P
LAC
EK
eyst
one
Ele
cP
C te
st p
oint
Dig
ikey
5016
KC
T-N
DR
101
TB
D06
03C
DO
NO
T P
LAC
E*
**
**
R12
1T
BD
0603
CD
O N
OT
PLA
CE
**
**
*R
131
TB
D06
03C
DO
NO
T P
LAC
E*
**
**
R14
1T
BD
0603
CD
O N
OT
PLA
CE
**
**
*R
151
TB
D06
03C
DO
NO
T P
LAC
E*
**
**
R16
1T
BD
0603
CD
O N
OT
PLA
CE
**
**
*R
171
TB
D06
03C
DO
NO
T P
LAC
E*
**
**
R18
1T
BD
0603
CD
O N
OT
PLA
CE
**
**
*R
191
TB
D06
03C
DO
NO
T P
LAC
E*
**
**
R22
1T
BD
0603
CD
O N
OT
PLA
CE
**
**
*R
251
TB
D06
03C
DO
NO
T P
LAC
E*
**
**
R26
1T
BD
0603
CD
O N
OT
PLA
CE
**
**
*R
281
TB
D06
03C
DO
NO
T P
LAC
E*
**
**
R29
1T
BD
0603
CD
O N
OT
PLA
CE
**
**
*R
311
TB
D06
03C
DO
NO
T P
LAC
E*
**
**
R32
1T
BD
0603
CD
O N
OT
PLA
CE
**
**
*R
371
TB
D06
03C
DO
NO
T P
LAC
E*
**
**
Bill
of M
ater
ials
for
Pro
cess
or
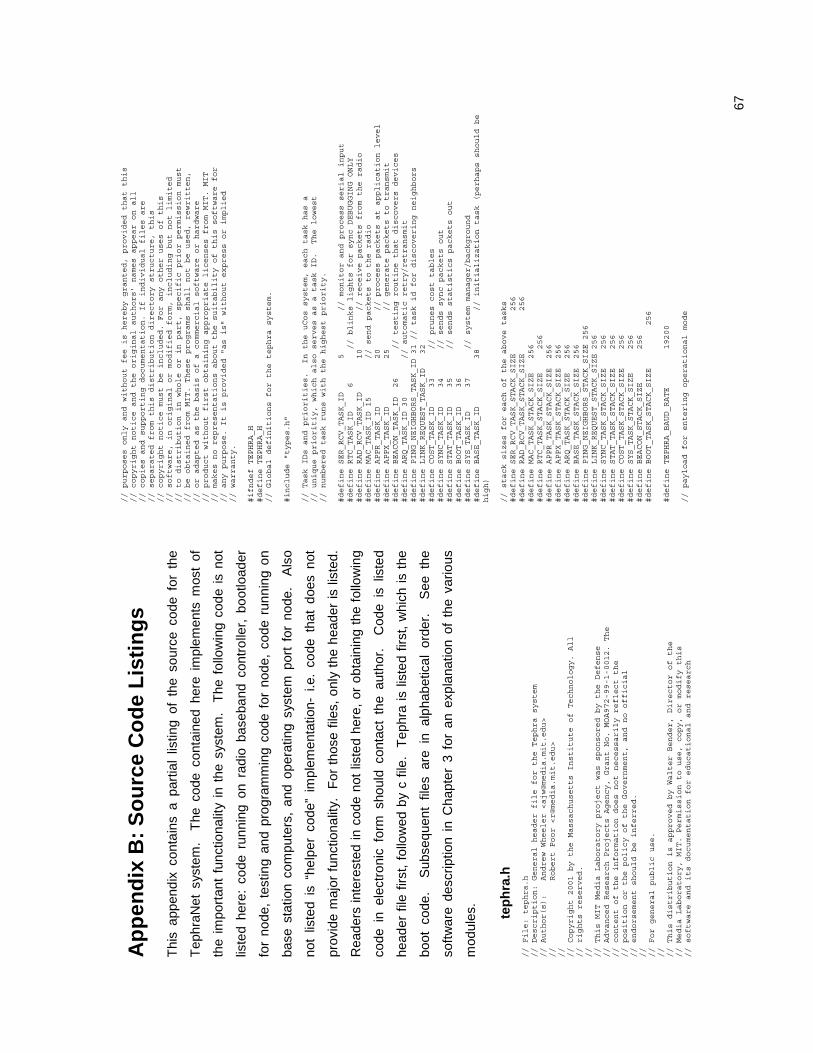
67
Ap
pen
dix
B:
So
urc
e C
od
e L
isti
ng
s
Thi
s ap
pend
ix c
onta
ins
a pa
rtia
l lis
ting
of t
he s
ourc
e co
de f
or t
he
Tep
hraN
et s
yste
m.
The
cod
e co
ntai
ned
here
im
plem
ents
mos
t of
the
impo
rtan
t fu
nctio
nalit
y in
the
sys
tem
. T
he f
ollo
win
g co
de i
s no
t
liste
d he
re:
code
run
ning
on
radi
o ba
seba
nd c
ontr
olle
r, b
ootlo
ader
for
node
, te
stin
g an
d pr
ogra
mm
ing
code
for
nod
e, c
ode
runn
ing
on
base
sta
tion
com
pute
rs,
and
oper
atin
g sy
stem
por
t fo
r no
de.
Als
o
not
liste
d is
“he
lper
cod
e” i
mpl
emen
tatio
n- i
.e.
code
tha
t do
es n
ot
prov
ide
maj
or f
unct
iona
lity.
F
or t
hose
file
s, o
nly
the
head
er is
list
ed.
Rea
ders
inte
rest
ed in
cod
e no
t lis
ted
here
, or
obt
aini
ng t
he f
ollo
win
g
code
in
elec
tron
ic f
orm
sho
uld
cont
act
the
auth
or.
Cod
e is
lis
ted
head
er f
ile f
irst,
follo
wed
by
c fil
e.
Tep
hra
is li
sted
firs
t, w
hich
is t
he
boot
cod
e.
Sub
sequ
ent
files
are
in
alph
abet
ical
ord
er.
See
the
softw
are
desc
riptio
n in
Cha
pter
3 f
or a
n ex
plan
atio
n of
the
var
ious
mod
ules
.
tep
hra
.h
// File: tephra.h
// Description: General header file for the Tephra system
// Author(s): Andrew Wheeler <[email protected]>
// Robert Poor <[email protected]>
//
// Copyright 2001 by the Massachusetts Institute of Technology. All
// rights reserved.
//
// This MIT Media Laboratory project was sponsored by the Defense
// Advanced Research Projects Agency, Grant No. MOA972-99-1-0012. The
// content of the information does not necessarily reflect the
// position or the policy of the Government, and no official
// endorsement should be inferred.
//
// For general public use.
//
// This distribution is approved by Walter Bender, Director of the
// Media Laboratory, MIT. Permission to use, copy, or modify this
// software and its documentation for educational and research
// purposes only and without fee is hereby granted, provided that this
// copyright notice and the original authors' names appear on all
// copies and supporting documentation. If individual files are
// separated from this distribution directory structure, this
// copyright notice must be included. For any other uses of this
// software, in original or modified form, including but not limited
// to distribution in whole or in part, specific prior permission must
// be obtained from MIT. These programs shall not be used, rewritten,
// or adapted as the basis of a commercial software or hardware
// product without first obtaining appropriate licenses from MIT. MIT
// makes no representations about the suitability of this software for
// any purpose. It is provided "as is" without express or implied
// warranty.
#ifndef TEPHRA_H
#define TEPHRA_H
// Global definitions for the tephra system.
#include "types.h"
// Task IDs and priorities. In the uCos system, each task has a
// unique prioritiy, which also serves as a task ID. The lowest
// numbered task runs with the highest priority.
#define SER_RCV_TASK_ID
5
// monitor and process serial input
#define RTC_TASK_ID 6 // blinks lights for sync DEBUGGING ONLY
#define RAD_RCV_TASK_ID
10
// receive packets from the radio
#define MAC_TASK_ID 15
// send packets to the radio
#define APPR_TASK_ID
20
// process packets at application level
#define APPX_TASK_ID
25
// generate packets to transmit
#define BEACON_TASK_ID 26 // testing routine that discovers devices
#define ARQ_TASK_ID 30
// automatic retry/retransmit
#define PING_NEIGHBORS_TASK_ID 31 // task id for discovering neighbors
#define LINK_REQUEST_TASK_ID 32
#define COST_TASK_ID 33 // prunes cost tables
#define SYNC_TASK_ID 34 // sends sync packets out
#define STAT_TASK_ID 35 // sends statistics packets out
#define BOOT_TASK_ID 36
#define SYS_TASK_ID 37 // system manager/background
#define BASE_TASK_ID
38
// initialization task (perhaps should be
high)
// stack sizes for each of the above tasks
#define SER_RCV_TASK_STACK_SIZE
256
#define RAD_RCV_TASK_STACK_SIZE
256
#define MAC_TASK_STACK_SIZE
256
#define RTC_TASK_STACK_SIZE 256
#define APPR_TASK_STACK_SIZE 256
#define APPX_TASK_STACK_SIZE 256
#define ARQ_TASK_STACK_SIZE
256
#define BASE_TASK_STACK_SIZE 256
#define PING_NEIGHBORS_STACK_SIZE 256
#define LINK_REQUEST_STACK_SIZE 256
#define SYNC_TASK_STACK_SIZE 256
#define STAT_TASK_STACK_SIZE 256
#define COST_TASK_STACK_SIZE 256
#define SYS_TASK_STACK_SIZE 256
#define BEACON_STACK_SIZE 256
#define BOOT_TASK_STACK_SIZE 256
#define TEPHRA_BAUD_RATE 19200
// payload for entering operational mode
68
typedef struct
{ uint8_t unused; // c doesn't like empty structures
} setOperationalPayload;
/*void SetOperationalMode( bool );
bool GetOperationalMode( void );
void SetSleeplessMode(bool val);
*/
#endif
tep
hra
.c
// File: tephra.c
// Description: main() and main processing thread for Tephra system.
// Author(s): Andrew Wheeler <[email protected]>
//
//
// Copyright 2001 by the Massachusetts Institute of Technology. All
// rights reserved.
//
// This MIT Media Laboratory project was sponsored by the Defense
// Advanced Research Projects Agency, Grant No. MOA972-99-1-0012. The
// content of the information does not necessarily reflect the
// position or the policy of the Government, and no official
// endorsement should be inferred.
//
// For general public use.
//
// This distribution is approved by Walter Bender, Director of the
// Media Laboratory, MIT. Permission to use, copy, or modify this
// software and its documentation for educational and research
// purposes only and without fee is hereby granted, provided that this
// copyright notice and the original authors' names appear on all
// copies and supporting documentation. If individual files are
// separated from this distribution directory structure, this
// copyright notice must be included. For any other uses of this
// software, in original or modified form, including but not limited
// to distribution in whole or in part, specific prior permission must
// be obtained from MIT. These programs shall not be used, rewritten,
// or adapted as the basis of a commercial software or hardware
// product without first obtaining appropriate licenses from MIT. MIT
// makes no representations about the suitability of this software for
// any purpose. It is provided "as is" without express or implied
// warranty.
#include "tephra.h"
#include "types.h"
#include "includes.h"
#include "rad.h"
#include "mac.h"
#include "pseg.h"
#include "param.h"
#include "appr.h"
#include "appx.h"
#include "ping.h"
#include "sync.h"
#include "grad.h"
#include "rtc.h"
#include "cost.h"
#include "arq.h"
#include "util.h"
#include "serial.h"
#include "stats.h"
#include "sysmanager.h"
#include <stdlib.h>
#ifndef BIT
#define BIT(x)
(1 << (x))
#endif
// tephra.c defines the main() routine, including any one-time
// initialization (TephraInit()) and the main processing thread
// (TephraMain()). The main processing thread runs at the lowest
// priority.
static unsigned int _mainStack[BASE_TASK_STACK_SIZE];
//static bool _systemAsleep;
//static bool _sleeplessMode; // set to true if the system should not sleep
//static bool _operationalMode; // set to true of the system is in operation
void tephraSWI(int);
extern void ResetHandler( void );
static void TephraInit() {
#ifdef DEBUG_BUFFER
debug_buffer(1);
#endif
// cold-start initialization of hardware and software.
LED_1_OFF();
LED_2_OFF();
LED_3_OFF();
LED_4_OFF();
ParamInit();
SysInit();
StatsInit();
RTCInit();
RadInit();
PSegInit();
MACInit();
AppRInit();
AppXInit();
PingInit();
SyncInit();
CostInit();
ARQInit();
SerialInit();
// starts the OS timer... should be last thing in this function...
StartSystemTimer();
}
static void _TephraMain(void *args)
{
TephraInit();
OSTimeDly(OS_TICKS_PER_SEC);
// start the system manager and then exit
SysStart();
OSTaskDel(BASE_TASK_ID);

69
} int main()
{ #ifdef DEBUG_BUFFER
debug_buffer(3);
#endif
// NOTE: when we reach here, all I/O directions are already setup (init.s)
// low level peripheral inits
// Delay(0); //calibrate Delay()
Uart_Init(TEPHRA_BAUD_RATE);
// begin target initialization
ARMTargetInit();
ISR_SWI = (unsigned)tephraSWI;
ISR_UNDEF = (unsigned)HaltUndef;
ISR_PABORT = (unsigned)HaltPabort;
ISR_DABORT = (unsigned)HaltDabort;
// initialize uCOS
OSInit();
OSTimeSet(0);
// create the system task
OSTaskCreate(_TephraMain, NULL,
(void *)&_mainStack[BASE_TASK_STACK_SIZE-1], BASE_TASK_ID);
// start the OS...
OSStart();
// never reached
return 0;
} void tephraSWI(int swiNum)
{ #ifdef DEBUG_BUFFER
debug_buffer(8);
#endif
INTPND = 0;
while (true)
{
Uart_Printf("SWI: %d\n", swiNum);
Delay(10000);
}
/* _rebooted = true; */
/* Uart_Printf("got bad interrupt, restarting\n"); */
/* ResetHandler(); */
}
app
r.h
// File: appr.h
// Description: Application-level support for incoming packets
// Author(s): Andrew Wheeler <[email protected]>
// Robert Poor <[email protected]>
//
// Copyright 2001 by the Massachusetts Institute of Technology. All
// rights reserved.
//
// This MIT Media Laboratory project was sponsored by the Defense
// Advanced Research Projects Agency, Grant No. MOA972-99-1-0012. The
// content of the information does not necessarily reflect the
// position or the policy of the Government, and no official
// endorsement should be inferred.
//
// For general public use.
//
// This distribution is approved by Walter Bender, Director of the
// Media Laboratory, MIT. Permission to use, copy, or modify this
// software and its documentation for educational and research
// purposes only and without fee is hereby granted, provided that this
// copyright notice and the original authors' names appear on all
// copies and supporting documentation. If individual files are
// separated from this distribution directory structure, this
// copyright notice must be included. For any other uses of this
// software, in original or modified form, including but not limited
// to distribution in whole or in part, specific prior permission must
// be obtained from MIT. These programs shall not be used, rewritten,
// or adapted as the basis of a commercial software or hardware
// product without first obtaining appropriate licenses from MIT. MIT
// makes no representations about the suitability of this software for
// any purpose. It is provided "as is" without express or implied
// warranty.
#ifndef APPR_H
#define APPR_H
#include "types.h"
#include "pseg.h"
// The application receive task accepts packets from the high priority
// radio receive task and processes each incoming packet, dispatching
// it to appropriate software modules according to the contents of
// each packet segment.
#define APPR_QUEUE_SIZE 20
// Sets the maximum number of packets that can be installed in the
// application receive queue. Above this number, the oldest packets
// will be discarded.
void AppRInit(void);
// cold-start initialization
void AppRReset(void);
// wake-up reinitialization
void AppRStart(void);
// Start the application receive thread
void AppRReceivePkt(pseg_t *pkt);
// Install a packet in the application receive queue and notify
// the receive task.
bool AppRGetIsPrinting(void);
void AppRSetIsPrinting(bool b);
// get/set the state of packet printing. When true, every packet
// received is printed (in hex) to serial output.
#endif
70
app
r.c
// File: appr.c
// Description: Application-level support for incoming packets
// Author(s): Andrew Wheeler <[email protected]>
// Robert Poor <[email protected]>
//
// Copyright 2001 by the Massachusetts Institute of Technology. All
// rights reserved.
//
// This MIT Media Laboratory project was sponsored by the Defense
// Advanced Research Projects Agency, Grant No. MOA972-99-1-0012. The
// content of the information does not necessarily reflect the
// position or the policy of the Government, and no official
// endorsement should be inferred.
//
// For general public use.
//
// This distribution is approved by Walter Bender, Director of the
// Media Laboratory, MIT. Permission to use, copy, or modify this
// software and its documentation for educational and research
// purposes only and without fee is hereby granted, provided that this
// copyright notice and the original authors' names appear on all
// copies and supporting documentation. If individual files are
// separated from this distribution directory structure, this
// copyright notice must be included. For any other uses of this
// software, in original or modified form, including but not limited
// to distribution in whole or in part, specific prior permission must
// be obtained from MIT. These programs shall not be used, rewritten,
// or adapted as the basis of a commercial software or hardware
// product without first obtaining appropriate licenses from MIT. MIT
// makes no representations about the suitability of this software for
// any purpose. It is provided "as is" without express or implied
// warranty.
#include "appr.h"
#include "appx.h"
#include "arq.h"
#include "cost.h"
#include "grad.h"
#include "param.h"
#include "ping.h"
#include "pseg.h"
#include "serial.h"
#include "sync.h"
#include "tephra.h"
#include "types.h"
#include "vector.h"
#include "includes.h"
#include "stats.h"
#include "sysmanager.h"
// stack for the appr task
static unsigned int _apprStack[APPR_TASK_STACK_SIZE];
// Define the raw storage for the receive queue
static DEFINE_VECTOR(_apprQueue, APPR_QUEUE_SIZE);
// when true, prints out the contents of each received packet.
static bool _isPrinting;
static void _AppRTask(void *args);
static void _AppRServicePkt(pseg_t *pkt, pseg_t *gradSeg);
void AppRInit(void)
{
#ifdef DEBUG_BUFFER
debug_buffer(12);
#endif
// initialize the receive queue
VectorInit(VECTOR(_apprQueue), APPR_QUEUE_SIZE);
AppRSetIsPrinting(false);
}
void AppRReset(void)
{
#ifdef DEBUG_BUFFER
debug_buffer(13);
#endif
// launch the application receive task. Called from INIT_TASK.
VectorClear(VECTOR(_apprQueue));
}
void AppRStart(void)
{
#ifdef DEBUG_BUFFER
debug_buffer(14);
#endif
OSTaskCreate(_AppRTask, NULL, (void *)&_apprStack[APPR_TASK_STACK_SIZE-1],
APPR_TASK_ID);
}
void AppRReceivePkt(pseg_t *pkt)
{
#ifdef DEBUG_BUFFER
debug_buffer(15);
#endif
// install a packet in the receive queue and notify the receive thread.
// If the queue filled up as a result of enqueuing a new packet, remove
// and free the oldest.
PSegFree(VectorShove(VECTOR(_apprQueue), pkt));
OSTaskResume(APPR_TASK_ID);
}
bool AppRGetIsPrinting(void)
{
#ifdef DEBUG_BUFFER
debug_buffer(16);
#endif
return _isPrinting;
}
void AppRSetIsPrinting(bool b)
{
#ifdef DEBUG_BUFFER
debug_buffer(17);
#endif
_isPrinting = b;
}
static void _AppRTask(void *args) {
// Application Receive Task. Wait for a packet to come available,
// then dispactch according to packet segment types.
pseg_t* pkt;
71
pseg_t* gradSeg;
while (true)
{
#ifdef DEBUG_BUFFER
debug_buffer(18);
#endif
//
Uart_Printf("AppRTask\n");
while ((pkt = (pseg_t *)VectorDequeue(VECTOR(_apprQueue))) == NULL)
{
OSTaskSuspend(APPR_TASK_ID);
}
// pkt now refers to a successfully dequeued packet. Look for a
// grad header segment.
gradSeg = GRAdFindSegment(pkt);
if (gradSeg == NULL)
{
// No grad routing header found. Unconditionally process and
// free the packet.
_AppRServicePkt(pkt, NULL);
PSegFree(pkt);
}
else if (!CostUpdate(gradSeg))
{
// pkt has already been seen - check if it is for us and has an ACK
if (GRAdIsForMe(gradSeg) && (ARQFindSegment(pkt) != NULL)) {
// an ACK must not have gone through earlier- send one now
ARQServiceARQ(ARQFindSegment(pkt), gradSeg);
}
/*
Uart_Printf(" grad dropping stale packet dst %d, src %d, seq
%d\n",
((gradPayload *)PSegPayload(gradSeg))->fDestination,
((gradPayload *)PSegPayload(gradSeg))->fOriginator,
((gradPayload *)PSegPayload(gradSeg))->fSequence);*/
PSegFree(pkt);
}
else
{
// pkt has a valid GRAd routing header. Process it locally
// if destined for this node.
if (GRAdIsForMe(gradSeg))
{
_AppRServicePkt(pkt, gradSeg);
/*
Uart_Printf(" grad processing my packet
dst %d, src %d, seq %d\n",
((gradPayload *)PSegPayload(gradSeg))->fDestination,
((gradPayload *)PSegPayload(gradSeg))->fOriginator,
((gradPayload *)PSegPayload(gradSeg))->fSequence);*/
GRAdRelayIfNeeded(pkt, gradSeg);
}
else
{
// relay the message if needed, free it regardless.
/*
Uart_Printf(" grad checking relay dst %d, src %d, seq %d\n",
((gradPayload *)PSegPayload(gradSeg))->fDestination,
((gradPayload *)PSegPayload(gradSeg))->fOriginator,
((gradPayload *)PSegPayload(gradSeg))->fSequence);
*/
GRAdRelayIfNeeded(pkt, gradSeg);
}
}
}
}
void _AppRServicePkt(pseg_t *pkt, pseg_t *gradSeg)
{
pseg_t *seg = pkt;
#ifdef DEBUG_BUFFER
debug_buffer(19);
#endif
if (AppRGetIsPrinting() && SerialGatewayMode())
{
PSegPrint(pkt);
}
// dispactch according to each segment type
while (seg != NULL)
{
switch (PSegType(seg))
{
case PSEG_TYPE_EOP:
break;
case PSEG_TYPE_SYNC:
// inter-node synchronization info
SyncServicePkt(seg);
PingCheckSync(seg);
SerialCheckSync(seg);
break;
case PSEG_TYPE_GRAD:
// gradient routing info
break;
case PSEG_TYPE_DISCO:
// discovery routing request
break;
case PSEG_TYPE_PING:
// ping packet, request for pong
PingServicePing(seg, gradSeg);
break;
case PSEG_TYPE_PONG:
// reply to a ping
PingServicePong(seg);
break;
case PSEG_TYPE_ARQ:
// received and ARQ: send and ACK
ARQServiceARQ(seg, gradSeg);
break;
case PSEG_TYPE_ACK:
// received and ACK: prune retry queue
ARQServiceACK(seg);
break;
case PSEG_TYPE_PARAM_SET:
// set parameters from payload
ParamServiceSet(seg);
break;
case PSEG_TYPE_PARAM_REQUEST: // request current parameters
ParamServiceRequest(gradSeg);
break;
case PSEG_TYPE_PARAM_REPORT: // here are my current parameters
break;
case PSEG_TYPE_STATS_RESET:
// clear current logging stats
StatsClearData();
break;
case PSEG_TYPE_STATS_REQUEST: // request logging statistics
SendStatsPkt(gradSeg);
break;
case PSEG_TYPE_STATS_REPORT_A: // here are my logging statistics
break;

72
case PSEG_TYPE_STATS_REPORT_B: // here are my logging statistics
break;
case PSEG_TYPE_APPX_REPORT: // receive a report..?
break;
case PSEG_TYPE_NEIGHBOR_REPORT: // a neighbor report has arrived (doctor)
SerialServiceNeighborReport(seg);
break;
case PSEG_TYPE_LINK_REPORT:
SerialServiceNeighborLinkReport(seg);
break;
case PSEG_TYPE_NEIGHBOR_REQUEST:
PingServiceNeighborsRequest(seg, gradSeg);
break;
case PSEG_TYPE_LINK_REQUEST:
PingServiceLinkRequest(seg, gradSeg);
break;
case PSEG_TYPE_SET_IN_OPERATION:
//
SetOperationalMode(TRUE);
break;
case PSEG_TYPE_SDP_REQUEST:
//SDPServiceRequest(seg, gradSeg);
break;
case PSEG_TYPE_SDP_REPLY:
//SDPServiceReply(seg, gradSeg);
break;
case PSEG_TYPE_BOOT_REPORT:
SerialServiceBootReport(seg);
break;
case PSEG_TYPE_ENTER_TEST:
Uart_Printf(" enter test pkt\n");
SysSetTestMode(true);
break;
case PSEG_TYPE_EXIT_TEST:
Uart_Printf(" exit test pkt\n");
// sets a keepalive
SysRequestNoSleep(500);
SysSetTestMode(false);
break;
case PSEG_TYPE_START_ASYNC:
OSTaskDel(BOOT_TASK_ID);
SysSetTestMode(true);
PingStartAsyncLinkTest();
break;
case PSEG_TYPE_STOP_ASYNC:
PingStopAsyncLinkTest();
OSTaskDel(BOOT_TASK_ID);
SysSetTestMode(false);
break;
default:
break;
}
seg = PSegNext(seg);
}
}
app
x.h
// File: appx.h
// Description: Application-level support for incoming packets
// Author(s): Andy Wheeler <[email protected]>
//
// Copyright 2001 by the Massachusetts Institute of Technology. All
// rights reserved.
//
// This MIT Media Laboratory project was sponsored by the Defense
// Advanced Research Projects Agency, Grant No. MOA972-99-1-0012. The
// content of the information does not necessarily reflect the
// position or the policy of the Government, and no official
// endorsement should be inferred.
//
// For general public use.
//
// This distribution is approved by Walter Bender, Director of the
// Media Laboratory, MIT. Permission to use, copy, or modify this
// software and its documentation for educational and research
// purposes only and without fee is hereby granted, provided that this
// copyright notice and the original authors' names appear on all
// copies and supporting documentation. If individual files are
// separated from this distribution directory structure, this
// copyright notice must be included. For any other uses of this
// software, in original or modified form, including but not limited
// to distribution in whole or in part, specific prior permission must
// be obtained from MIT. These programs shall not be used, rewritten,
// or adapted as the basis of a commercial software or hardware
// product without first obtaining appropriate licenses from MIT. MIT
// makes no representations about the suitability of this software for
// any purpose. It is provided "as is" without express or implied
// warranty.
#ifndef APPX_H
#define APPX_H
#include "types.h"
#include "pseg.h"
typedef struct {
// need to decide what info is carried in APPX_REQUEST messages
uint16_t fInternal_temperature;
uint16_t fBattery;
uint16_t fTemperature;
uint16_t fLight;
uint16_t fWind;
uint16_t fHumidity;
} appXRequestPayload;
// The application transmit thread sits in a loop and periodically
// generates packets for transmission. This can be thought of as
// a "push" model for sending data to a remote node.
void AppXInit(void);
// cold-start initialization
void AppXReset(void);
// wake-up reinitialization
void AppXStart(void);
// Start the application transmit thread
void AppXServiceRequest(pseg_t *seg, pseg_t *gradSeg);
// A segment of type PSEG_TYPE_APPX_REQUEST specifies what information
// the AppX thread should send, to whom, and how often. This is the
// function that receives such a request packet (from the AppR module).
#endif
app
x.c
73
// File: appx.c
// Description: Application-level support for incoming packets
// Author(s): Andy Wheeler <[email protected]>
// Ben Brown <[email protected]>
//
// Copyright 2001 by the Massachusetts Institute of Technology. All
// rights reserved.
//
// This MIT Media Laboratory project was sponsored by the Defense
// Advanced Research Projects Agency, Grant No. MOA972-99-1-0012. The
// content of the information does not necessarily reflect the
// position or the policy of the Government, and no official
// endorsement should be inferred.
//
// For general public use.
//
// This distribution is approved by Walter Bender, Director of the
// Media Laboratory, MIT. Permission to use, copy, or modify this
// software and its documentation for educational and research
// purposes only and without fee is hereby granted, provided that this
// copyright notice and the original authors' names appear on all
// copies and supporting documentation. If individual files are
// separated from this distribution directory structure, this
// copyright notice must be included. For any other uses of this
// software, in original or modified form, including but not limited
// to distribution in whole or in part, specific prior permission must
// be obtained from MIT. These programs shall not be used, rewritten,
// or adapted as the basis of a commercial software or hardware
// product without first obtaining appropriate licenses from MIT. MIT
// makes no representations about the suitability of this software for
// any purpose. It is provided "as is" without express or implied
// warranty.
#include "appx.h"
#include "arq.h"
#include "grad.h"
#include "mac.h"
#include "param.h"
#include "pseg.h"
#include "tephra.h"
#include "types.h"
#include "vector.h"
#include "includes.h"
#include "ucos_ii.h"
#include <stdlib.h>
#ifndef BIT
#define BIT(x)
(1 << (x))
#endif
// stack for the appx task
static unsigned int _appxStack[APPX_TASK_STACK_SIZE];
static void _AppXTask(void *args);
void AppXInit(void)
{ #ifdef DEBUG_BUFFER
debug_buffer(20);
#endif
} void AppXReset(void)
{
#ifdef DEBUG_BUFFER
debug_buffer(21);
#endif
}
void AppXStart(void)
{
#ifdef DEBUG_BUFFER
debug_buffer(22);
#endif
OSTaskCreate(_AppXTask,
NULL,
(void *)&_appxStack[APPX_TASK_STACK_SIZE-1],
APPX_TASK_ID);
}
void AppXServiceRequest(pseg_t *pkt, pseg_t *gradSeg) {
#ifdef DEBUG_BUFFER
debug_buffer(23);
#endif
// ## do something with the contents of pkt, then notify the
// ## (presumably waiting) AppX task
// OSTaskResume(APPX_TASK_ID);
}
static void _AppXTask(void *args)
{
uint16_t humidity_data[11];
// Averaged data will be stored in array_data[10]
uint16_t wind_data[11];
uint16_t light_data[11];
uint16_t temperature_data[11];
uint16_t internal_temperature_data[11];
uint16_t battery_data[11];
uint16_t i;
uint16_t min_data;
uint16_t max_data;
uint32_t array_total;
pseg_t *pkt;
appXRequestPayload *pp;
// Application Transmit Task.
// if (ParamGet(PARAM_BASESTATION_ADDR) == BROADCAST_ID) {
// OSTaskDel(APPX_TASK_ID);
// return; // Basestation address has not been initialized
// }
while (true)
{
#ifdef DEBUG_BUFFER
debug_buffer(24);
#endif
//
Uart_Printf("AppXTask\n");
PDAT0 &= ~BIT(2); // turns SENSORPWR on (inverse logic)
PDAT0 |= BIT(3); // turns TEMPON (internal temperature sensor)
// on (positive logic)
OSTimeDly(OS_TICKS_PER_SEC);
#ifdef DEBUG_BUFFER
74
debug_buffer(198);
#endif
for (i = 0; i < 10; i++) // takes 10 readings from each sensor
{
ADCCON = ADCCON_AIN0 |
ADCCON_MCLK_DIV_16 |
ADCCON_10_BITS;
OSTimeDly(1);
ADCCON |= ADCCON_START;
OSTimeDly(1);
#ifdef DEBUG_BUFFER
debug_buffer(199);
#endif
while (ADCCON_BUSY());
humidity_data[i] = ADCDAT;
ADCCON = ADCCON_AIN2 |
ADCCON_MCLK_DIV_16 |
ADCCON_10_BITS;
OSTimeDly(1);
ADCCON |= ADCCON_START;
OSTimeDly(1);
#ifdef DEBUG_BUFFER
debug_buffer(200);
#endif
while (ADCCON_BUSY());
wind_data[i] = ADCDAT;
ADCCON = ADCCON_AIN3 |
ADCCON_MCLK_DIV_16 |
ADCCON_10_BITS;
OSTimeDly(1);
ADCCON |= ADCCON_START;
OSTimeDly(1);
#ifdef DEBUG_BUFFER
debug_buffer(201);
#endif
while(ADCCON_BUSY());
light_data[i] = ADCDAT;
ADCCON = ADCCON_AIN4 |
ADCCON_MCLK_DIV_16 |
ADCCON_10_BITS;
OSTimeDly(1);
ADCCON |= ADCCON_START;
OSTimeDly(1);
#ifdef DEBUG_BUFFER
debug_buffer(202);
#endif
while(ADCCON_BUSY());
temperature_data[i] = ADCDAT;
ADCCON = ADCCON_AIN5 |
ADCCON_MCLK_DIV_16 |
ADCCON_10_BITS;
OSTimeDly(1);
ADCCON |= ADCCON_START;
OSTimeDly(1);
#ifdef DEBUG_BUFFER
debug_buffer(203);
#endif
while (ADCCON_BUSY());
internal_temperature_data[i] = ADCDAT;
ADCCON = ADCCON_AIN6 |
ADCCON_MCLK_DIV_16 |
ADCCON_10_BITS;
OSTimeDly(1);
ADCCON |= ADCCON_START;
OSTimeDly(1);
#ifdef DEBUG_BUFFER
debug_buffer(204);
#endif
while (ADCCON_BUSY());
battery_data[i] = ADCDAT;
}
// turn off ADC
ADCCON = ADCCON_STANDBY_MODE;
max_data = humidity_data[0];
min_data = max_data;
array_total = max_data;
for (i = 1; i < 10; i++)
{
if (humidity_data[i] < min_data)
min_data = humidity_data[i];
else if (humidity_data[i] > max_data)
max_data = humidity_data[i];
array_total += humidity_data[i];
}
array_total = (array_total - min_data - max_data);
humidity_data[10] = (uint16_t)(array_total / 8);
array_total = 0;
#ifdef DEBUG_BUFFER
debug_buffer(205);
#endif
max_data = light_data[0];
min_data = max_data;
array_total = max_data;
for (i = 1; i < 10; i++)
{
if (light_data[i] < min_data)
min_data = light_data[i];
else if (light_data[i] > max_data)
max_data = light_data[i];
array_total += light_data[i];
}
array_total = (array_total - min_data - max_data);
light_data[10] = (uint16_t)(array_total / 8);
array_total = 0;
#ifdef DEBUG_BUFFER
debug_buffer(206);
#endif
max_data = temperature_data[0];
min_data = max_data;
array_total = max_data;
for (i = 1; i < 10; i++)
{
if (temperature_data[i] < min_data)
min_data = temperature_data[i];
else if (temperature_data[i] > max_data)
max_data = temperature_data[i];

75
array_total += temperature_data[i];
}
array_total = (array_total - min_data - max_data);
temperature_data[10] = (uint16_t)(array_total / 8);
array_total = 0;
#ifdef DEBUG_BUFFER
debug_buffer(207);
#endif
max_data = internal_temperature_data[0];
min_data = max_data;
array_total = max_data;
for (i = 1; i < 10; i++)
{
if (internal_temperature_data[i] < min_data)
min_data = internal_temperature_data[i];
else if (internal_temperature_data[i] > max_data)
max_data = internal_temperature_data[i];
array_total += internal_temperature_data[i];
}
array_total = (array_total - min_data - max_data);
internal_temperature_data[10] = (uint16_t)(array_total / 8);
array_total = 0;
#ifdef DEBUG_BUFFER
debug_buffer(208);
#endif
max_data = battery_data[0];
min_data = max_data;
array_total = max_data;
for (i = 1; i < 10; i++)
{
if (battery_data[i] < min_data)
min_data = battery_data[i];
else if (battery_data[i] > max_data)
max_data = battery_data[i];
array_total += battery_data[i];
}
array_total = (array_total - min_data - max_data);
battery_data[10] = (uint16_t)(array_total / 8);
#ifdef DEBUG_BUFFER
debug_buffer(209);
#endif
max_data = wind_data[0];
for (i = 1; i < 10; i++)
{
if (humidity_data[i] > max_data)
max_data = humidity_data[i];
}
wind_data[10] = max_data;
#ifdef DEBUG_BUFFER
debug_buffer(210);
#endif
PDAT0 |= BIT(2); // turns SENSORPWR off (inverse logic)
PDAT0 &= ~BIT(3); // turns TEMPON (internal temperature sensor)
// off (positive logic)
pkt = PSegAlloc(PSEG_TYPE_APPX_REPORT, sizeof(appXRequestPayload),
NULL);
pp = PSegPayload(pkt);
pp->fInternal_temperature = internal_temperature_data[10];
pp->fBattery = battery_data[10];
pp->fTemperature = temperature_data[10];
pp->fLight = light_data[10];
pp->fWind = wind_data[10];
pp->fHumidity = humidity_data[10];
LED_2_ON();
OSTimeDly((OS_TICKS_PER_SEC*5) + (rand()%(OS_TICKS_PER_SEC*12)));
#ifdef DEBUG_BUFFER
debug_buffer(211);
#endif
// delay for between 3 and 15 seconds
// if (ParamGet(PARAM_ARQ_REPORTS)) {
if (ParamGet(PARAM_BASESTATION_ADDR) != BROADCAST_ID)
{
MACXmitPkt(GRAdMakePkt(ARQMakeARQ(pkt),
ParamGet(PARAM_BASESTATION_ADDR)));
} else {
PSegFree(pkt);
}
LED_2_OFF();
OSTimeDly((OS_TICKS_PER_SEC * 120));
/* } else {
// while (1) {
pkt2 = PSegCopy(pkt); // save a copy
MACXmitPkt(GRAdMakePkt(pkt, ParamGet(PARAM_BASESTATION_ADDR)));
// sends the packet
OSTimeDly((OS_TICKS_PER_SEC*3) + (rand()%(OS_TICKS_PER_SEC*5)));
pkt = pkt2;
}
}*/
}
}
arq
.h
// File: arq.h
// Description: support for Automatic Retry reQuest services
// Author(s): Robert Poor <[email protected]>
//
// Copyright 2001 by the Massachusetts Institute of Technology. All
// rights reserved.
//
// This MIT Media Laboratory project was sponsored by the Defense
// Advanced Research Projects Agency, Grant No. MOA972-99-1-0012. The
// content of the information does not necessarily reflect the
// position or the policy of the Government, and no official
// endorsement should be inferred.
//
// For general public use.
//
// This distribution is approved by Walter Bender, Director of the
// Media Laboratory, MIT. Permission to use, copy, or modify this
// software and its documentation for educational and research
// purposes only and without fee is hereby granted, provided that this
// copyright notice and the original authors' names appear on all
// copies and supporting documentation. If individual files are
// separated from this distribution directory structure, this
// copyright notice must be included. For any other uses of this
// software, in original or modified form, including but not limited
// to distribution in whole or in part, specific prior permission must

76
// be obtained from MIT. These programs shall not be used, rewritten,
// or adapted as the basis of a commercial software or hardware
// product without first obtaining appropriate licenses from MIT. MIT
// makes no representations about the suitability of this software for
// any purpose. It is provided "as is" without express or implied
// warranty.
#ifndef ARQ_H
#define ARQ_H
#include "types.h"
#include "pseg.h"
// The Automatic Retry reQuest module keeps a copy of each
// outgoing packet and attempts periodic retransmission of
// the packet until it receives an acknowlegement that the
// packet has been received at the destination.
#define ARQ_QUEUE_SIZE 10
// Sets the maximum number of different packets that will
// be queued for retransmission.
typedef struct {
uint8_t fReference;
// reference number for the ack
uint8_t fRetries;
// number of times we will attempt retransmit
} arqPayload;
typedef struct {
uint8_t fReference;
// reference number for the arq
} ackPayload;
void ARQInit(void);
// initialize the ARQ system
void ARQReset(void);
// warm restart
void ARQStart(void);
// Start the ARQ thread
void ARQDidXmit(pseg_t *pkt);
// Note that MAC layer sent a packet. If it has an ARQ segment
// and the retry hasn't expired, queue a copy of the packet for
// subsequent retransmission. Called from the MAC task.
pseg_t *ARQMakeARQ(pseg_t *pkt);
// Tack an ARQ segment on the front of this packet. This has the
// effect that [1] a copy of the message will be queued for possible
// retransmission and [2] an ACK will be returned by the recipient.
void ARQServiceACK(pseg_t *seg);
// Handle an incoming ACK packet. If there is a packet in the ARQ
// retry queue with matching reference number, delete it from the
// queue.
void ARQServiceARQ(pseg_t *arqSeg, pseg_t *gradSeg);
// Handle an incoming ARQ packet. Respond by creating an ACK packet
// and returning it to the orginator of the ARQ.
pseg_t *ARQFindSegment(pseg_t *pkt);
// search for an ARQ segment and return it if found, otherwise return null
#endif
arq
.c
// File: arq.c
// Description: support for Automatic Retry reQuest services
// Author(s): Robert Poor <[email protected]>
// Andrew Wheeler <[email protected]>
//
// Copyright 2001 by the Massachusetts Institute of Technology. All
// rights reserved.
//
// This MIT Media Laboratory project was sponsored by the Defense
// Advanced Research Projects Agency, Grant No. MOA972-99-1-0012. The
// content of the information does not necessarily reflect the
// position or the policy of the Government, and no official
// endorsement should be inferred.
//
// For general public use.
//
// This distribution is approved by Walter Bender, Director of the
// Media Laboratory, MIT. Permission to use, copy, or modify this
// software and its documentation for educational and research
// purposes only and without fee is hereby granted, provided that this
// copyright notice and the original authors' names appear on all
// copies and supporting documentation. If individual files are
// separated from this distribution directory structure, this
// copyright notice must be included. For any other uses of this
// software, in original or modified form, including but not limited
// to distribution in whole or in part, specific prior permission must
// be obtained from MIT. These programs shall not be used, rewritten,
// or adapted as the basis of a commercial software or hardware
// product without first obtaining appropriate licenses from MIT. MIT
// makes no representations about the suitability of this software for
// any purpose. It is provided "as is" without express or implied
// warranty.
#include "arq.h"
#include "grad.h"
#include "mac.h"
#include "node_id.h"
#include "param.h"
#include "pseg.h"
#include "tephra.h"
#include "types.h"
#include "vector.h"
#include "includes.h"
#include "stats.h"
#include "serial.h"
#undef ARQ_PRINTFS
static unsigned int _arqStack[ARQ_TASK_STACK_SIZE];
// stack area for arq task
static DEFINE_VECTOR(_retryQueue, ARQ_QUEUE_SIZE);
// Define the raw storage for the ARQ queue.
static void _ARQTask(void *args);
static void _retransmitPkt(pseg_t *pkt);
static uint8_t _reference;

77
// ================================================================
void ARQInit(void)
{ #ifdef DEBUG_BUFFER
debug_buffer(25);
#endif
_reference = 0;
VectorInit(VECTOR(_retryQueue), ARQ_QUEUE_SIZE);
} void ARQReset(void)
{ #ifdef DEBUG_BUFFER
debug_buffer(26);
#endif
VectorClear(VECTOR(_retryQueue));
} void ARQStart(void)
{ #ifdef DEBUG_BUFFER
debug_buffer(27);
#endif
OSTaskCreate(_ARQTask, NULL, (void *)&_arqStack[ARQ_TASK_STACK_SIZE-1],
ARQ_TASK_ID);
} vector_t *ARQQueue(void)
{ #ifdef DEBUG_BUFFER
debug_buffer(28);
#endif
// return a reference to the underlying ARQ queue. Use with care.
return VECTOR(_retryQueue);
} void ARQDidXmit(pseg_t *pkt) {
// Note that MAC layer sent a packet. If it has an ARQ segment
// and the retry hasn't expired, queue a copy of the packet for
// subsequent retransmission. Called from the MAC task.
pseg_t *as, *gs;
arqPayload *ap;
#ifdef DEBUG_BUFFER
debug_buffer(29);
#endif
// quit if we're not the originator
if (((gs = GRAdFindSegment(pkt)) == NULL) ||
(((gradPayload *)PSegPayload(gs))->fOriginator != NodeGetID()))
{
return;
}
// quit if the packet lacks an ARQ segment
if ((as = PSegFindType(pkt, PSEG_TYPE_ARQ)) == NULL) return;
// quit if the retry count in the ARQ segment has expired
ap = PSegPayload(as);
if (ap->fRetries++ == ParamGet(PARAM_ARQ_RETRY))
{
StatsIncARQPktsDropped();
return;
}
// Make a copy of the packet (with incremented retries) and
// queue it for deferred transmission. If enqueing the packet
// causes the queue to fill up, remove and free the oldest.
StatsIncARQPktsSent();
PSegFree(VectorShove(VECTOR(_retryQueue), PSegCopy(pkt)));
OSTaskResume(ARQ_TASK_ID);
}
// ================================================================
// Tack an ARQ segment on the front of this packet. This has the
// effect that [1] a copy of the message will be queued for possible
// retransmission and [2] an ACK will be returned by the recipient.
pseg_t *ARQMakeARQ(pseg_t *pkt)
{
pseg_t *arqSeg = PSegAlloc(PSEG_TYPE_ARQ, sizeof(arqPayload), pkt);
arqPayload *ap = PSegPayload(arqSeg);
#ifdef DEbuG_BUFFER
debug_buffer(30);
#endif
ap->fReference = _reference++;
ap->fRetries = 0;
return arqSeg;
}
// ================================================================
// servicing ACKs.
// When an ACK message is received, the messages pending in the
// retry queue are searched for a matching ARQ. If a match is
// found, it means the ARQ has been acknowleged, and can be
// deleted from the queue.
void ARQServiceACK(pseg_t *seg)
{
// seg is known to be of type SEG_TYPE_ACK and part of a packet
// targeted for this node. Search the retry queue for a matching
// ARQ packet, and if found, delete it.
ackPayload *ackp = PSegPayload(seg);
uint8_t i = VectorCount(VECTOR(_retryQueue));
#ifdef DEBUG_BUFFER
debug_buffer(31);
#endif
while (i--)
{
pseg_t *retryPkt, *arqSeg;
retryPkt = VectorFastRef(VECTOR(_retryQueue), i);
arqSeg = PSegFindType(retryPkt, PSEG_TYPE_ARQ);
if (arqSeg != NULL)
{
arqPayload *arqp = PSegPayload(arqSeg);
if (arqp->fReference == ackp->fReference)
{
// Found the ARQ that is ACKed by this ACK. Remove the ARQ
// packet from the retry queue so it won't be retransmitted.
if (SerialDoctorMode())
{
78
// Call back into the doctor so that we know the packet has
// been received.
SerialServiceAck(retryPkt);
}
PSegFree(VectorFastRemove(VECTOR(_retryQueue), i));
StatsIncARCPktsRcvd();
#ifdef ARQ_PRINTFS
Uart_Printf(" ARQ got ACK ref %d removing packet\n",
arqp->fReference);
#endif
return;
}
#ifdef ARQ_PRINTFS
Uart_Printf(" ARQ got ACK ref %d\n",arqp->fReference);
#endif
}
}
} // ================================================================
// servicing ARQ packets.
// Handle an incoming ARQ packet. Respond by creating an ACK packet
// and returning it to the orginator of the ARQ. seg argument is
// known to be of type SEG_TYPE_ARQ, grad argument (if non null) is
// known to be of type SEG_TYPE_GRAD.
void ARQServiceARQ(pseg_t *arqSeg, pseg_t *gradSeg)
{ pseg_t *ackSeg;
arqPayload *ap;
gradPayload *gp;
#ifdef DEBUG_BUFFER
debug_buffer(32);
#endif
// can't handle a packet with no return address
if (gradSeg == NULL)
{
return;
}
ap = PSegPayload(arqSeg);
gp = PSegPayload(gradSeg);
ackSeg = PSegAlloc(PSEG_TYPE_ACK, sizeof(ackPayload), NULL);
((ackPayload *)PSegPayload(ackSeg))->fReference = ap->fReference;
#ifdef ARQ_PRINTFS
Uart_Printf(" ARQ sending ACK ref %d to %d\n",
ap->fReference, gp->fOriginator);
#endif
MACXmitPkt(GRAdMakePkt(ackSeg, gp->fOriginator));
} pseg_t *ARQFindSegment(pseg_t *pkt) {
// search the list of segments for a packet that contains an ARQ
while (pkt != NULL) {
pseg_type t = PSegType(pkt);
if ((t == PSEG_TYPE_ARQ)) {
return pkt;
}
pkt = PSegNext(pkt);
}
return NULL;
}
// ================================================================
// The ARQ thread.
// Wait for a packet to become available in the retry queue. When
// a packet is queued, wait for a holdoff period before attempting
// transmission. If, after the holdoff period, the packet hasn't
// been ACKd, send it to the MAC layer for retransmission.
static void _ARQTask(void *args)
{
while (true)
{
pseg_t *pkt;
#ifdef DEBUG_BUFFER
debug_buffer(33);
#endif
//
Uart_Printf("ARQTask\n");
// Wait for a packet to appear in the queue (but don't dequeue yet)
while (VectorCount(VECTOR(_retryQueue)) == 0)
{
OSTaskSuspend(ARQ_TASK_ID);
}
// Defer for ARQ_DELAY tics
OSTimeDly(ParamGet(PARAM_ARQ_DELAY));
#ifdef DEBUG_BUFFER
debug_buffer(212);
#endif
// Now see if the packet is still in the queue -- it might have been
// removed by serviceAck() while we were waiting. (Small bug here:
// if the head packet was removed in the interim, the second packet
// in line will be retransmitted before its full PARAM_ARQ_DELAY
// has elapsed. Typically not a problem.)
if ((pkt = (pseg_t *)VectorDequeue(VECTOR(_retryQueue))) != NULL)
{
// Got a packet for retransmission. Send it.
_retransmitPkt(pkt);
}
} // while (1)...
}
static void _retransmitPkt(pseg_t *pkt)
{
// Re-transmit pkt. Before sending it, update the GRAd header in
// the packet, boosting the fCostBudget by one for each time this
// packet has been retransmitted. This makes network try
// progressively harder to get the packet to its destination.
pseg_t *arqSeg = PSegFindType(pkt, PSEG_TYPE_ARQ);
#ifdef DEBUG_BUFFER
debug_buffer(34);
#endif
if (arqSeg != NULL)
{
arqPayload *arqp = PSegPayload(arqSeg);
// boost fCostBudget by one for each retry

79
GRAdUpdateSeg(pkt, arqp->fRetries);
#ifdef ARQ_PRINTFS
Uart_Printf(" ARQ retransmitting ref %d w/ boost %d\n",
arqp->fReference, arqp->fRetries);
#endif
}
MACXmitPkt(pkt);
}
bo
ott
est.
h
// File: boottest.h
// Description: node boot testing proceedure
// Author(s): Andrew Wheeler <[email protected]>
//
// Copyright 2001 by the Massachusetts Institute of Technology. All
// rights reserved.
//
// This MIT Media Laboratory project was sponsored by the Defense
// Advanced Research Projects Agency, Grant No. MOA972-99-1-0012. The
// content of the information does not necessarily reflect the
// position or the policy of the Government, and no official
// endorsement should be inferred.
//
// For general public use.
//
// This distribution is approved by Walter Bender, Director of the
// Media Laboratory, MIT. Permission to use, copy, or modify this
// software and its documentation for educational and research
// purposes only and without fee is hereby granted, provided that this
// copyright notice and the original authors' names appear on all
// copies and supporting documentation. If individual files are
// separated from this distribution directory structure, this
// copyright notice must be included. For any other uses of this
// software, in original or modified form, including but not limited
// to distribution in whole or in part, specific prior permission must
// be obtained from MIT. These programs shall not be used, rewritten,
// or adapted as the basis of a commercial software or hardware
// product without first obtaining appropriate licenses from MIT. MIT
// makes no representations about the suitability of this software for
// any purpose. It is provided "as is" without express or implied
// warranty.
#ifndef BOOTTEST_H
#define BOOTTEST_H
#include "types.h"
#include "pseg.h"
typedef enum {
BOOT_BOOTING,
BOOT_GOT_SYNC,
BOOT_STANDALONE,
BOOT_FOUNDNEIGHBOR,
BOOT_FINISHED
} bootcode_t;
typedef struct {
node_id node;
bootcode_t bootCode;
uint8_t bootData;
} bootPayload;
void BootInit(void);
void BootStart(void);
void BootSendPkt(bootcode_t code, uint8_t data);
#endif
bo
ott
est.
c // File: boottest.c
// Description: node boot proceedures
// Author(s): Andrew Wheeler <[email protected]>
//
// Copyright 2001 by the Massachusetts Institute of Technology. All
// rights reserved.
//
// This MIT Media Laboratory project was sponsored by the Defense
// Advanced Research Projects Agency, Grant No. MOA972-99-1-0012. The
// content of the information does not necessarily reflect the
// position or the policy of the Government, and no official
// endorsement should be inferred.
//
// For general public use.
//
// This distribution is approved by Walter Bender, Director of the
// Media Laboratory, MIT. Permission to use, copy, or modify this
// software and its documentation for educational and research
// purposes only and without fee is hereby granted, provided that this
// copyright notice and the original authors' names appear on all
// copies and supporting documentation. If individual files are
// separated from this distribution directory structure, this
// copyright notice must be included. For any other uses of this
// software, in original or modified form, including but not limited
// to distribution in whole or in part, specific prior permission must
// be obtained from MIT. These programs shall not be used, rewritten,
// or adapted as the basis of a commercial software or hardware
// product without first obtaining appropriate licenses from MIT. MIT
// makes no representations about the suitability of this software for
// any purpose. It is provided "as is" without express or implied
// warranty.
#include "types.h"
#include "pseg.h"
#include "ping.h"
#include "mac.h"
#include "sysmanager.h"
#include "boottest.h"
#include "tephra.h"
static unsigned int _bootStack[BOOT_TASK_STACK_SIZE];
static void _bootTask(void *args);
void BootInit(void) {
}
void BootStart(void) {
OSTaskCreate(_bootTask, NULL, (void *)&_bootStack[BOOT_TASK_STACK_SIZE-1],
BOOT_TASK_ID);
}
80
static void _bootTask(void *args) {
// put node into test
SysSetTestMode(true);
// send out boot anouncement
BootSendPkt(BOOT_BOOTING, 0);
// register the ping process to watch for sync messages
while (SysGetTestMode() && (OSTimeGet() < 540*OS_TICKS_PER_SEC)) {
PingStartAsyncLinkTest();
OSTimeDly(60*OS_TICKS_PER_SEC);
PingStopAsyncLinkTest();
}
SysSetTestMode(false);
BootSendPkt(BOOT_FINISHED, 0);
OSTaskDel(BOOT_TASK_ID);
// watch for sync
// when sync'd send out a sync message
// after sync, collect neighbor information and send
// if all looks good, then go out of test
// otherwise, stay in test, redoing the ping every once in a while
// and sending updates
} // _bootSendPkt(bootcode_t code, uint8_t data)
// sends a packet with code and data from this node as a broadcast
// to anyone who cares
void BootSendPkt(bootcode_t code, uint8_t data) {
pseg_t *bootPkt = PSegAlloc(PSEG_TYPE_BOOT_REPORT, sizeof(bootPayload), NULL);
bootPayload *bp = PSegPayload(bootPkt);
bp->node = NodeGetID();
bp->bootCode = code;
bp->bootData = data;
MACXmitPkt(bootPkt);
}
cost
.h
// File: cost.h
// Description: establish and maintain cost metrics to remote nodes
// Author(s): Robert Poor <[email protected]>
//
// Copyright 2001 by the Massachusetts Institute of Technology. All
// rights reserved.
//
// This MIT Media Laboratory project was sponsored by the Defense
// Advanced Research Projects Agency, Grant No. MOA972-99-1-0012. The
// content of the information does not necessarily reflect the
// position or the policy of the Government, and no official
// endorsement should be inferred.
//
// For general public use.
//
// This distribution is approved by Walter Bender, Director of the
// Media Laboratory, MIT. Permission to use, copy, or modify this
// software and its documentation for educational and research
// purposes only and without fee is hereby granted, provided that this
// copyright notice and the original authors' names appear on all
// copies and supporting documentation. If individual files are
// separated from this distribution directory structure, this
// copyright notice must be included. For any other uses of this
// software, in original or modified form, including but not limited
// to distribution in whole or in part, specific prior permission must
// be obtained from MIT. These programs shall not be used, rewritten,
// or adapted as the basis of a commercial software or hardware
// product without first obtaining appropriate licenses from MIT. MIT
// makes no representations about the suitability of this software for
// any purpose. It is provided "as is" without express or implied
// warranty.
#ifndef COST_H
#define COST_H
#include "node_id.h"
#include "pseg.h"
typedef uint8_t cost_t;
// cost is measured in # of hops, assumed less than 256
#define COST_UNKNOWN 0xff
// Value for unknown cost
// Cost table support.
// Cost table packetizing:
// this is the data we actually send from costTableEntry
typedef struct {
cost_t fCost;
uint8_t fSequence;
} costTableXmitEntry;
#define MAX_USEFUL_COST_ENTRY 108
// divisible by COST_TRANSMIT_ENTRIES is better!
#define COST_TRANSMIT_ENTRIES 6
#define COST_MAX_CHUNKS MAX_USEFUL_COST_ENTRY/COST_TRANSMIT_ENTRIES
typedef struct {
uint32_t fSampleTime;
uint8_t fStartingEntry;
uint8_t fNumEntries;
costTableXmitEntry fTableChunk[COST_TRANSMIT_ENTRIES];
} costTablePayload;
// As a simplification, the cost table assumes 8 bit node IDs, so
// node IDs are used as direct indeces into the table.
typedef struct {
cost_t fCost;
// cost to node
uint8_t fSequence;
// last seen sequence #
uint8_t fTTL;
// agings before entry is pruned
} costTableEntry;
void CostInit(void);
// cold start initialization
void CostReset(void);
// warm start initialization
void CostStart(void);
// cost table aging thread start
81
costTableEntry *CostTable(void);
// return pointer to cost table
void CostAgeTable(void);
// count down cost table TTLs and prune expired entries.
cost_t CostTo(node_id target);
// return the cost to the given target, or COST_UNKNOWN if not known
bool CostUpdate(pseg_t *gradSeg);
// Update a single cost table entry according to the given gradSeg.
// Returns true if gradSeg refers to a fresh (non-duplicate) message,
// or if there is no grad segment at all.
bool CostShouldRelay(pseg_t *gradSeg);
// Return true if this packet should be relayed
pseg_t *CostMakeSegment(uint8_t chunkNo, pseg_t *next);
// Create a segment containing chunk number chunkNo
// [contains entries [COST_TRANSMIT_ENTRIES * chunkNo -
// (COST_TRANSMIT_ENTRIES * (chunkNo + 1)) - 1, inclusive.
#endif
gra
d.h
// File: grad.h
// Description: support for Gradient Routing
// Author(s): Robert Poor <[email protected]>
// Andrew Wheeler <[email protected]>
//
// Copyright 2001 by the Massachusetts Institute of Technology. All
// rights reserved.
//
// This MIT Media Laboratory project was sponsored by the Defense
// Advanced Research Projects Agency, Grant No. MOA972-99-1-0012. The
// content of the information does not necessarily reflect the
// position or the policy of the Government, and no official
// endorsement should be inferred.
//
// For general public use.
//
// This distribution is approved by Walter Bender, Director of the
// Media Laboratory, MIT. Permission to use, copy, or modify this
// software and its documentation for educational and research
// purposes only and without fee is hereby granted, provided that this
// copyright notice and the original authors' names appear on all
// copies and supporting documentation. If individual files are
// separated from this distribution directory structure, this
// copyright notice must be included. For any other uses of this
// software, in original or modified form, including but not limited
// to distribution in whole or in part, specific prior permission must
// be obtained from MIT. These programs shall not be used, rewritten,
// or adapted as the basis of a commercial software or hardware
// product without first obtaining appropriate licenses from MIT. MIT
// makes no representations about the suitability of this software for
// any purpose. It is provided "as is" without express or implied
// warranty.
#ifndef GRAD_H
#define GRAD_H
#include "node_id.h"
#include "pseg.h"
#include "cost.h"
// A gradPayload contains the information used by the gradient routing
// mechanism. A gradPayload can be found in the payload of any packet
// segment whose type is PSEG_TYPE_GRAD or PSEG_TYPE_DISCO.
typedef struct {
node_id fOriginator;
uint8_t fSequence;
uint8_t fCostAccrued;
node_id fDestination;
uint8_t fCostBudget;
} gradPayload;
void GRAdInit(void);
// intialize the gradient routing system
void GRAdReset(void);
// re-init the gradient routing system
pseg_t *GRAdFindSegment(pseg_t *pkt);
// Search pkt for a segment of type PSEG_TYPE_GRAD or PSEG_TYPE_DISCO.
// Return such segment if found, NULL if not found.
pseg_t *GRAdMakePkt(pseg_t *pkt, node_id destination);
// Create and push a GRAd header segment onto the front of pkt. If
// the cost to destination is unknown, a DISCOvery segment is created,
// otherwise an appropriately initialized GRAD segment is created.
void GRAdUpdateSeg(pseg_t *pkt, cost_t boost);
// find the PSEG_TYPE_DISCO or PSEG_TYPE_GRAD segment in this packet.
// In place, fix up current sequence number and cost info.
bool GRAdIsForMe(pseg_t *gradSeg);
// seg must refer to a packet segment of type PSEG_TYPE_DISCO or
// PSEG_TYPE_GRAD. Returns true if the packet is destined for this
// node (dest is either BROADCAST_ID or this node).
void GRAdRelayIfNeeded(pseg_t *pkt, pseg_t *gradSeg);
// seg must refer to a packet segment of type PSEG_TYPE_DISCO or
// PSEG_TYPE_GRAD. Relay pkt if appropriate, else just free it.
#endif
gra
d.c
// File: grad.c
// Description: support for Gradient Routing
// Author(s): Robert Poor <[email protected]>
// Andrew Wheeler <[email protected]>
//
// Copyright 2001 by the Massachusetts Institute of Technology. All
// rights reserved.
//
// This MIT Media Laboratory project was sponsored by the Defense
// Advanced Research Projects Agency, Grant No. MOA972-99-1-0012. The
// content of the information does not necessarily reflect the
// position or the policy of the Government, and no official
// endorsement should be inferred.
//
// For general public use.
//

82
// This distribution is approved by Walter Bender, Director of the
// Media Laboratory, MIT. Permission to use, copy, or modify this
// software and its documentation for educational and research
// purposes only and without fee is hereby granted, provided that this
// copyright notice and the original authors' names appear on all
// copies and supporting documentation. If individual files are
// separated from this distribution directory structure, this
// copyright notice must be included. For any other uses of this
// software, in original or modified form, including but not limited
// to distribution in whole or in part, specific prior permission must
// be obtained from MIT. These programs shall not be used, rewritten,
// or adapted as the basis of a commercial software or hardware
// product without first obtaining appropriate licenses from MIT. MIT
// makes no representations about the suitability of this software for
// any purpose. It is provided "as is" without express or implied
// warranty.
#include "cost.h"
#include "grad.h"
#include "mac.h"
#include "node_id.h"
#include "param.h"
#include "types.h"
#include "stats.h"
#include "pseg.h"
#include "util.h"
// GRAd is responsible for the routing of packets. Upon reception,
// GRAd decides whether to relay a packet, pass it to the application
// level, or to drop it. For transmission, GRAd appends a routing
// header that will be used by the GRAd service in receiving nodes.
static unsigned char _sequence;
// Sequence number for next originated packet.
// ================================================================
// exported routines
void GRAdInit()
{ #ifdef DEBUG_BUFFER
debug_buffer(53);
#endif
_sequence = 0;
} pseg_t *GRAdFindSegment(pseg_t *pkt) {
#ifdef DEBUG_BUFFER
debug_buffer(54);
#endif
// search the list of segments for a packet that contains a
// gradPayload.
while (pkt != NULL)
{
pseg_type t = PSegType(pkt);
if ((t == PSEG_TYPE_GRAD) || (t == PSEG_TYPE_DISCO))
{
return pkt;
}
pkt = PSegNext(pkt);
}
return NULL;
}
static pseg_type _prepPayload(gradPayload *payload,
node_id dest,
cost_t boost)
{
// fill in a gradPayload with dest, cost, sequence, etc. Returns
// PSEG_TYPE_DISCO if cost is known or PSEG_TYPE_GRAD if not.
cost_t cost = CostTo(dest);
#ifdef DEBUG_BUFFER
debug_buffer(55);
#endif
payload->fOriginator = NodeGetID();
payload->fSequence = ++_sequence;
payload->fCostAccrued = 1; // receivers are already one hop away
payload->fDestination = dest;
if (cost == COST_UNKNOWN)
{
payload->fCostBudget = ParamGet(PARAM_GRAD_DISCOVERY_COST) + boost;
// ## stats_floodPkt();
// note a flood packet
StatsIncGradFlooded();
return PSEG_TYPE_DISCO;
}
else
{
payload->fCostBudget = cost + boost;
// ## stats_origPkt();
// note a routed packet
StatsIncGradOriginated();
return PSEG_TYPE_GRAD;
}
}
void GRAdUpdateSeg(pseg_t *pkt, cost_t boost)
{
// Find the PSEG_TYPE_DISCO or PSEG_TYPE_GRAD segment in this
// packet. In-place, fixup current sequence number and cost info,
// adding boost to the initial fCostBudget. Currently, this routine
// is used to update ARQ packets when they are retransmitted.
pseg_t *gradSeg;
gradPayload *gp;
#ifdef DEBUG_BUFFER
debug_buffer(56);
#endif
if ((gradSeg = GRAdFindSegment(pkt)) == NULL)
{
return;
}
gp = PSegPayload(gradSeg);
PSegType(gradSeg) = _prepPayload(gp, gp->fDestination, boost);
}
pseg_t *GRAdMakePkt(pseg_t *pkt, node_id dest)
{
// Tack a GRAd routing header on the front of this packet. If the
// cost to dest is known, it creates a regular GRAd data packet. If
// the cost isn't known, it creates a discovery packet.
pseg_t *gradSeg = PSegAlloc(0, sizeof(gradPayload), pkt);
gradPayload *gp = PSegPayload(gradSeg);
PSegType(gradSeg) = _prepPayload(gp, dest, 0);
#ifdef DEBUG_BUFFER
debug_buffer(57);
83
#endif
return gradSeg;
} bool GRAdIsForMe(pseg_t *gradSeg)
{ // Return true this packet is intended for this node:
// [1] gradSeg is null, indicating no routing header
// [2] fDestination == BROADCAST_ID, indicating any node
// [3] fDestination == NodeGetID(), indicating this node
#ifdef DEBUG_BUFFER
debug_buffer(58);
#endif
if (gradSeg == NULL)
{
return true;
}
else
{
node_id id = ((gradPayload *)PSegPayload(gradSeg))->fDestination;
return (id == NodeGetID()) || (id == BROADCAST_ID);
}
} void GRAdRelayIfNeeded(pseg_t *pkt, pseg_t *gradSeg)
{ #ifdef DEBUG_BUFFER
debug_buffer(59);
#endif
if ((gradSeg != NULL) &&
(CostShouldRelay(gradSeg)) &&
(ParamGet(PARAM_GRAD_ENABLE_RELAY) != 0) &&
(((gradPayload *)PSegPayload(gradSeg))->fOriginator != NodeGetID()) &&
(((gradPayload *)PSegPayload(gradSeg))->fDestination != NodeGetID()))
{
// pkt should be relayed. Update the grad header and schedule the
// packet for re-transmission.
gradPayload *gp = PSegPayload(gradSeg);
gp->fCostAccrued++;
// one hop further from originator
gp->fCostBudget--;
// one hop closer to destination
// ## stats_relayPkt();
// note a relayed packet
StatsIncGradRelayed();
MACXmitPkt(pkt);
}
else {
PSegFree(pkt);
// Packet is not to be relayed. Drop it.
}
}
mac
.h
// File: mac.h
// Description: Medium Access Control mechanism for sharing airwaves
// Author(s): Robert Poor <[email protected]>
// Andrew Wheeler <[email protected]>
//
// Copyright 2001 by the Massachusetts Institute of Technology. All
// rights reserved.
//
// This MIT Media Laboratory project was sponsored by the Defense
// Advanced Research Projects Agency, Grant No. MOA972-99-1-0012. The
// content of the information does not necessarily reflect the
// position or the policy of the Government, and no official
// endorsement should be inferred.
//
// For general public use.
//
// This distribution is approved by Walter Bender, Director of the
// Media Laboratory, MIT. Permission to use, copy, or modify this
// software and its documentation for educational and research
// purposes only and without fee is hereby granted, provided that this
// copyright notice and the original authors' names appear on all
// copies and supporting documentation. If individual files are
// separated from this distribution directory structure, this
// copyright notice must be included. For any other uses of this
// software, in original or modified form, including but not limited
// to distribution in whole or in part, specific prior permission must
// be obtained from MIT. These programs shall not be used, rewritten,
// or adapted as the basis of a commercial software or hardware
// product without first obtaining appropriate licenses from MIT. MIT
// makes no representations about the suitability of this software for
// any purpose. It is provided "as is" without express or implied
// warranty.
#ifndef MAC_H
#define MAC_H
#include "pseg.h"
#include "vector.h"
void MACInit(void);
// one-time cold start initialization
void MACReset(void);
// warm restart
void MACStart(void);
// start MAC thread
vector_t *MACQueue(void);
// returns the underlying MAC queue.
void MACXmitPkt(pseg_t *pkt);
// queue a packet for transmission
void MACStartTimer(void);
void MACStopTimer(void);
// Start and stop the holdoff timer. The timer should be stopped
// when the radio is busy, restarted whenever it is idle.
void MACSystemTick(void);
// called by the OS whenever a system tick occurs
#endif
mac
.c
// File: mac.c
// Description: Medium Access Control mechanism for sharing airwaves
// Author(s): Robert Poor <[email protected]>
// Andrew Wheeler <[email protected]>
//
// Copyright 2001 by the Massachusetts Institute of Technology. All
// rights reserved.
//
// This MIT Media Laboratory project was sponsored by the Defense
84
// Advanced Research Projects Agency, Grant No. MOA972-99-1-0012. The
// content of the information does not necessarily reflect the
// position or the policy of the Government, and no official
// endorsement should be inferred.
//
// For general public use.
//
// This distribution is approved by Walter Bender, Director of the
// Media Laboratory, MIT. Permission to use, copy, or modify this
// software and its documentation for educational and research
// purposes only and without fee is hereby granted, provided that this
// copyright notice and the original authors' names appear on all
// copies and supporting documentation. If individual files are
// separated from this distribution directory structure, this
// copyright notice must be included. For any other uses of this
// software, in original or modified form, including but not limited
// to distribution in whole or in part, specific prior permission must
// be obtained from MIT. These programs shall not be used, rewritten,
// or adapted as the basis of a commercial software or hardware
// product without first obtaining appropriate licenses from MIT. MIT
// makes no representations about the suitability of this software for
// any purpose. It is provided "as is" without express or implied
// warranty.
#include "arq.h"
//#include "clk.h"
#include "mac.h"
#include "param.h"
#include "pseg.h"
#include "rad.h"
#include "tephra.h"
#include "vector.h"
#include "includes.h"
#include <stdlib.h>
static unsigned int _macStack[MAC_TASK_STACK_SIZE];
static bool _backoffTimerExpired;
static bool _macCountDownFlag;
static bool _macStopTimer;
static bool _radStopTimer;
//static uint16_t _macBackoffCounter;
// The MAC maintains a queue for outgoing packets and is the exclusive
// arbiter of the radio transmitter.
#define MAC_QUEUE_SIZE 10
// Define the raw storage for the transmit queue
static DEFINE_VECTOR(_macQueue, MAC_QUEUE_SIZE);
static void _MACTask(void *args);
static void _resetBackoff(void);
// reset backoff exponent to its minimum
static void _incrementBackoff(void);
// increment backoff exponent upto its maximum
static void _generateBackoff(void);
// set backoff timer according to current backoff exponent
static void _macTimerISR(void);
// handles MAC timer interrupt
//static bool _backoffHasExpired(void);
// returns true if the backoff timer has expired
// ================================================================
void MACInit(void)
{
#ifdef DEBUG_BUFFER
debug_buffer(60);
#endif
// initialize the transmit queue
VectorInit(VECTOR(_macQueue), MAC_QUEUE_SIZE);
_macCountDownFlag = false;
// _macBackoffCounter = 0;
_backoffTimerExpired = false;
// setup the MAC timer
OS_ENTER_CRITICAL();
ISR_TMC0 = (unsigned)_macTimerISR;
TPRE0 = 0xFF;
TDAT0 = 0x00FF;
TCON0 = TCON_DISABLE | TCON_CLOCK_INTERNAL | TCON_CLEAR | TCON_INTERVAL_MODE;
INTPND = ~INT_TMC0;
INTMSK |= INT_TMC0;
// each timer tick now equals 12.8uS
_macStopTimer = true;
_radStopTimer = false;
OS_EXIT_CRITICAL();
}
void MACReset(void)
{
#ifdef DEBUG_BUFFER
debug_buffer(61);
#endif
// launch the mac task. Called from INIT_TASK.
VectorClear(VECTOR(_macQueue));
_backoffTimerExpired = false;
}
void MACStart(void)
{
#ifdef DEBUG_BUFFER
debug_buffer(62);
#endif
// start the mac task
OSTaskCreate(_MACTask, NULL, (void *)&_macStack[MAC_TASK_STACK_SIZE-1],
MAC_TASK_ID);
}
vector_t *MACQueue(void)
{
#ifdef DEBUG_BUFFER
debug_buffer(63);
#endif
// return a reference to the underlying MAC queue. Use with care.
return VECTOR(_macQueue);
}
// ================================================================
// ================================================================
85
// The MAC task runs essentially as follows:
//
// while (1) {
//
wait for a packet to appear in the MAC queue
//
set backoff counter according to exponential backoff
//
wait for backoff counter to expire
//
if packet is still in the MAC queue, transmit it
// }
//
// Note that the backoff counter only counts down when the radio
// is idle (not receiving).
void _MACTask(void *args)
{
_resetBackoff();
// zero the backoff counter
// _macBackoffCounter = 0;
// Start MAC countdown timer. The radio task will stop the timer
// whenever the radio is busy.
MACStartTimer();
while (true)
{
pseg_t *pkt;
#ifdef DEBUG_BUFFER
debug_buffer(64);
#endif
//
Uart_Printf("MACTask\n");
// Wait for a packet to become available in the MAC queue. Don't
// remove it until the backoff timer expires, since some other
// task may prune it from the queue in the interim.
while (VectorCount(VECTOR(_macQueue)) == 0)
{
_resetBackoff();
// Empty queue? Reset backoff exponent...
OSTaskSuspend(MAC_TASK_ID);
}
#ifdef DEBUG_BUFFER
debug_buffer(213);
#endif
// Initialize the backoff counter according to the current backoff
// exponent and then wait until it counts down to zero
_generateBackoff();
while (!_backoffTimerExpired)
{
OSTaskSuspend(MAC_TASK_ID);
}
#ifdef DEBUG_BUFFER
debug_buffer(214);
#endif
// Backoff has expired. If there's still a packet available,
// format and transmit the packet. Tell ARQ that the packet
// was sent (in case ARQ wants to make a copy for retransmit),
// then free it.
if ((pkt = VectorDequeue(VECTOR(_macQueue))) != NULL)
{
RadXmitPkt(pkt);
ARQDidXmit(pkt);
PSegFree(pkt);
}
}
}
// ================================================================
// queue a packet for subsequent transmission by the MAC task
// Called by anybody that wishes to send a packet, but normally
// called from the application thread. If the queue fills up,
// throw away the oldest.
void MACXmitPkt(pseg_t *pkt)
{
#ifdef DEBUG_BUFFER
debug_buffer(65);
#endif
if (RadIsBusy())
{
_incrementBackoff();
}
// Install a packet in the transmit queue and notify the MAC thread.
// If the queue filled up as a result of enqueuing a new packet,
// remove and free the oldest.
PSegFree(VectorShove(VECTOR(_macQueue), pkt));
OSTaskResume(MAC_TASK_ID);
}
// ================================================================
// ================================================================
// backoff timing
static unsigned char _backoffExponent;
#define MIN_BACKOFF 4
#define MAX_BACKOFF 10
static void _resetBackoff(void)
{
#ifdef DEBUG_BUFFER
debug_buffer(66);
#endif
_backoffExponent = MIN_BACKOFF;
}
static void _incrementBackoff(void)
{
#ifdef DEBUG_BUFFER
debug_buffer(67);
#endif
if (_backoffExponent < (MAX_BACKOFF-1)) {
_backoffExponent++;
}
}
// 1.228mS-2.5mS min
// 314.5mS-629.1mS max
static void _generateBackoff(void) {
// generate a random backoff between 2^e and 2^(e+1)
uint16_t minBackoff;
#ifdef DEBUG_BUFFER
debug_buffer(68);
#endif
minBackoff = 1<<_backoffExponent;
OS_ENTER_CRITICAL();
TCON0 |= TCON_CLEAR;
86
TDAT0 = (rand() % minBackoff + minBackoff)*ParamGet(PARAM_MAC_TICS_PER_BACKOFF);
_backoffTimerExpired = false;
_macStopTimer = false;
if (!_radStopTimer) {
// start the timer
TCON0 |= TCON_ENABLE;
}
OS_EXIT_CRITICAL();
//MACStartTimer();
} /*static bool _backoffHasExpired(void)
{ #ifdef DEBUG_BUFFER
debug_buffer(69);
#endif
return (_macBackoffCounter == 0);
}*/
void MACStartTimer(void)
{ #ifdef DEBUG_BUFFER
debug_buffer(70);
#endif
// OS_ENTER_CRITICAL();
_radStopTimer = false;
if (!_macStopTimer) {
TDAT0 += 100; // hack to account for post-packet data transfer
TCON0 |= TCON_ENABLE;
}
// OS_EXIT_CRITICAL();
} void MACStopTimer(void)
{ #ifdef DEBUG_BUFFER
debug_buffer(71);
#endif
// OS_ENTER_CRITICAL();
_radStopTimer = true;
TCON0 &= ~TCON_ENABLE; // stop the timer
// OS_EXIT_CRITICAL();
} // handles the MAC timer (TIMER0) interrupt
void _macTimerISR(void) {
INTPND = ~INT_TMC0; // clear the interrupt
// stop the timer
TCON0 = TCON_DISABLE | TCON_CLOCK_INTERNAL | TCON_CLEAR | TCON_INTERVAL_MODE;
_macStopTimer = true;
// set countdown done flag
_backoffTimerExpired = true;
// wakeup the MAC task
OSTaskResume(MAC_TASK_ID);
}
no
de_
id.h
// File: node_id.h
// Description: support for per-node unique ID
// Author(s): Robert Poor <[email protected]>
// Paul Pham <[email protected]>
//
// Copyright 2001 by the Massachusetts Institute of Technology. All
// rights reserved.
//
// This MIT Media Laboratory project was sponsored by the Defense
// Advanced Research Projects Agency, Grant No. MOA972-99-1-0012. The
// content of the information does not necessarily reflect the
// position or the policy of the Government, and no official
// endorsement should be inferred.
//
// For general public use.
//
// This distribution is approved by Walter Bender, Director of the
// Media Laboratory, MIT. Permission to use, copy, or modify this
// software and its documentation for educational and research
// purposes only and without fee is hereby granted, provided that this
// copyright notice and the original authors' names appear on all
// copies and supporting documentation. If individual files are
// separated from this distribution directory structure, this
// copyright notice must be included. For any other uses of this
// software, in original or modified form, including but not limited
// to distribution in whole or in part, specific prior permission must
// be obtained from MIT. These programs shall not be used, rewritten,
// or adapted as the basis of a commercial software or hardware
// product without first obtaining appropriate licenses from MIT. MIT
// makes no representations about the suitability of this software for
// any purpose. It is provided "as is" without express or implied
// warranty.
#ifndef NODE_ID_H
#define NODE_ID_H
#include "types.h"
#define BROADCAST_ID 0xff
typedef uint8_t node_id;
// node ids are in the range of 0 to 0xff (256 max)
node_id NodeGetID(void);
// return the node ID of this node
#endif
par
am.h
// File: param.h
// Description: remotely set and query tunable system parameters
// Author(s): Robert Poor <[email protected]>
// Andrew Wheeler <[email protected]>
//
// Copyright 2001 by the Massachusetts Institute of Technology. All
// rights reserved.
//
// This MIT Media Laboratory project was sponsored by the Defense
// Advanced Research Projects Agency, Grant No. MOA972-99-1-0012. The
// content of the information does not necessarily reflect the
// position or the policy of the Government, and no official
// endorsement should be inferred.
//
// For general public use.

87
//
// This distribution is approved by Walter Bender, Director of the
// Media Laboratory, MIT. Permission to use, copy, or modify this
// software and its documentation for educational and research
// purposes only and without fee is hereby granted, provided that this
// copyright notice and the original authors' names appear on all
// copies and supporting documentation. If individual files are
// separated from this distribution directory structure, this
// copyright notice must be included. For any other uses of this
// software, in original or modified form, including but not limited
// to distribution in whole or in part, specific prior permission must
// be obtained from MIT. These programs shall not be used, rewritten,
// or adapted as the basis of a commercial software or hardware
// product without first obtaining appropriate licenses from MIT. MIT
// makes no representations about the suitability of this software for
// any purpose. It is provided "as is" without express or implied
// warranty.
#ifndef PARAM_H
#define PARAM_H
// param.h defines a set of tunable parameters. Each parameter
// can be queried and set remotely.
#include "pseg.h"
#include "node_id.h"
#include "includes.h"
#define MAX_PARAMS 16
// A paramPayload struct is used to get or set the state of up
// to 16 tunable parameters in the tephra system.
typedef struct {
uint16_t fMask;
uint16_t fParams[MAX_PARAMS];
} paramPayload;
enum {
PARAM_PING_SEARCH_COUNT,
// # pings to send searching for neighbors
PARAM_PING_LINK_TEST_COUNT, // # pings to send per link test
PARAM_PING_LINK_TEST_DELAY, // tics to wait between link pings
PARAM_ARQ_DELAY,
// tics to wait before retransmit ARQ packets
PARAM_ARQ_RETRY,
// # of times to retry retransmission
PARAM_COST_TTL,
// cost entry time to live (cost quantum tics)
PARAM_COST_AGE_QUANTUM,
// # of seconds between calling CostAgeTable()
PARAM_GRAD_DISCOVERY_COST,
// default initial discovery cost budget
PARAM_GRAD_ENABLE_RELAY,
// allow/inhibit relaying of packets
PARAM_MAC_TICS_PER_BACKOFF, // # of os tics per backoff
PARAM_AWAKE_TIME, // # of seconds the rock is awake
PARAM_SLEEP_TIME, // # of seconds the rock sleeps
PARAM_BASESTATION_ADDR, // # address of basestation
PARAM_ARQ_REPORTS, // do we put an arq request on the report packets
(sensor data/statistics?)
MAX_PARAM_INDEX
};
#define PARAM_PING_SEARCH_COUNT_DEFAULT
20 // OK
#define PARAM_PING_LINK_TEST_COUNT_DEFAULT
100 // lower?
#define PARAM_PING_LINK_TEST_DELAY_DEFAULT
20 // lower?
#define PARAM_ARQ_DELAY_DEFAULT
8*OS_TICKS_PER_SEC //
in system ticks
#define PARAM_ARQ_RETRY_DEFAULT
6
#define PARAM_COST_TTL_DEFAULT
180
#define PARAM_COST_AGE_QUANTUM_DEFAULT
OS_TICKS_PER_SEC // how often we
run through the cost table
#define PARAM_GRAD_DISCOVERY_COST_DEFAULT
60 // OK- check network diameter
#define PARAM_GRAD_ENABLE_RELAY_DEFAULT
1 // OK
#define PARAM_MAC_TICS_PER_BACKOFF_DEFAULT
12 // OK
#define PARAM_AWAKE_TIME_DEFAULT 90 // OK
#define PARAM_SLEEP_TIME_DEFAULT 510 // OK
#define PARAM_BASESTATION_ADDR_DEFAULT 16 //BROADCAST_ID //OK
//#define PARAM_BASESTATION_ADDR_DEFAULT 11 //OK
#define PARAM_ARQ_REPORTS_DEFAULT 1
void ParamInit(void);
// reset all parameters to their defaults. Normally used at
// cold start, but can also be used to beat the system back
// into a working state.
void ParamReset(void);
// warm restart.
uint16_t ParamGet(uint8_t index);
// fetch a value from the local param table
void ParamSet(uint8_t index, uint16_t value);
// set a param in the local param table
// ================================================================
// The following three functions are designed to be used in consort
// to set parameters on a remote node.
//
// First you call ParamPktAlloc() to allocate a parameter setting
// packet, then you call ParamPktSet() once per parameter you wish
// to set on a remote note. Finally, you send the packet using
// ParamPktXmit().
pseg_t *ParamPktAlloc(void);
// allocate a SEG_TYPE_PARAM_SET packet, to be used in subsequent
// calls to ParamPktSet()
void ParamPktSet(pseg_t *pkt, uint8_t index, uint16_t value);
// Set a parameter in the given SEG_TYPE_PARAM_SET packet.
// void ParamPktXMit(pseg_t *pkt, node_id target);
// Send a SEG_TYPE_PARAM_SET packet to the given target. The target
// can be BROADCAST_ID in which case it goes out to all nodes.
// ================================================================
// Handle incoming messages
void ParamServiceSet(pseg_t *pkt);
// handle a param setting packet. For each 1 bit in the fMask field,
// set the corresponding system parameter from the body of the payload.
void ParamServiceGet(pseg_t *gradSeg);
// Handle a request for the current parameter. Creates a param state
// packet and sends it to the requester.
void ParamServiceRequest(pseg_t *gradSeg);
// Handle a request for PSEG_TYPE_PARAM_REQUEST packet by
// replying with a PSEG_TYPE_PARAM_REPORT message.
#endif
pin
g.h

88
// File: ping.h
// Description: test link reliability with neighboring nodes
// Author(s): Robert Poor <[email protected]>
// Andrew Wheeler <[email protected]>
// Paul Covell <[email protected]>
//
// Copyright 2001 by the Massachusetts Institute of Technology. All
// rights reserved.
//
// This MIT Media Laboratory project was sponsored by the Defense
// Advanced Research Projects Agency, Grant No. MOA972-99-1-0012. The
// content of the information does not necessarily reflect the
// position or the policy of the Government, and no official
// endorsement should be inferred.
//
// For general public use.
//
// This distribution is approved by Walter Bender, Director of the
// Media Laboratory, MIT. Permission to use, copy, or modify this
// software and its documentation for educational and research
// purposes only and without fee is hereby granted, provided that this
// copyright notice and the original authors' names appear on all
// copies and supporting documentation. If individual files are
// separated from this distribution directory structure, this
// copyright notice must be included. For any other uses of this
// software, in original or modified form, including but not limited
// to distribution in whole or in part, specific prior permission must
// be obtained from MIT. These programs shall not be used, rewritten,
// or adapted as the basis of a commercial software or hardware
// product without first obtaining appropriate licenses from MIT. MIT
// makes no representations about the suitability of this software for
// any purpose. It is provided "as is" without express or implied
// warranty.
#ifndef PING_H
#define PING_H
#include "node_id.h"
#include "types.h"
#include "pseg.h"
// Ping service:
//
// In response to a PSEG_TYPE_NEIGHBOR_REQUEST message, ping will
// find all neighboring nodes and send a PSEG_TYPE_NEIGHBOR_REPORT
// back to the requestor.
//
// In response to a PSEG_TYPE_LINK_REQUEST message, ping will enter
// into a link test loop with a specific neighbor and send the results
// back to the requestor in a PSEG_TYPE_LINK_REPORT message.
//
// Internally, ping will generate and receive PSEG_TYPE_PING and
// PSEG_TYPE_PONG messages as part of the discovery and link test
// procedures.
// Some things that the ping service does:
//
// find all (one hop) neighbors
// gather channel statistics to a specific (one hop) neighbor
// determine connectivity to a remote neighbor
#define PING_MAX_NEIGHBORS 10
// a NEIGHBORS_REPORT message will report up to PING_MAX_NEIGHBORS
// PSEG_TYPE_NEIGHBOR_REQEUST has an empty payload (but C doesn't
// like an empty struct).
typedef struct {
uint8_t fUnused;
} neighborsRequestPayload;
// PSEG_TYPE_NEIGHBOR_REPORT has a payload with the node IDs of the
// first PING_MAX_NEIGHBORS with the most responses.
//
typedef struct {
node_id fNeighbors[PING_MAX_NEIGHBORS];
} neighborsReportPayload;
// PSEG_TYPE_LINK_REQUEST messages name the node with which to enter
// a link test.
//
typedef struct {
node_id fNeighbor;
} linkRequestPayload;
// PSEG_TYPE_LINK_REPORT messages give the results of a link test.
//
typedef struct {
node_id fNeighbor;
// neighbor in question
uint8_t fPingsSent;
// # pings this node sent
uint8_t fPingsRcvd;
// # pings rcvd (as reported by neighbor)
uint8_t fPongsSent;
// # pongs sent (as reported by neighbor)
uint8_t fPongsRcvd;
// # pongs rcvd at this node
} linkState;
// PSEG_TYPE_PING is what this node sends to elicit pongs from
// one or more neighbors
typedef struct {
node_id fPinger;
// node sending the ping
node_id fTarget;
// node recieving ping, can be BROADCAST_ID
uint8_t fPingsSent;
// # pings sent by this node
} pingPayload;
// PSEG_TYPE_PONG is what a node will send whenever it receives
// a ping message.
typedef struct {
node_id fPonger;
// node sending the pong
node_id fTarget;
// node that sent the ping
uint8_t fPongsSent;
// # pongs sent by this node
} pongPayload;
// ================================================================
void PingInit(void);
// cold start
void PingReset(void);
// warm restart
// ================================================================
// servicing and originating messages
void PingSendPing(node_id target);
// send a lone ping packet to a target- mainly for use in keeping a node awake
// should really use a special keepalive packet- but some nodes were deployed
89
// without it
void PingStartAsyncLinkTest( void );
// instructs the ping system to run a link tests on any new nodes it sees after this
void PingStopAsyncLinkTest( void );
// stops running link tests off of sync packets
void PingCheckSync(pseg_t *pkt);
// called by sync system to see if ping wants to do something with packet
void PingStartBeaconMode( void );
// enter a beacon testing mode where we try to discover devices
// when a new device is discovered, a link test is run and the
// results printed to the screen
void PingServiceNeighborsRequest(pseg_t *pkt, pseg_t *gradSeg);
// Handle a request to discover neighbors. Respond by finding
// neighbors and sending a PSEG_TYPE_NEIGHBOR_REPORT to the
// originator.
void PingServiceLinkRequest(pseg_t *pkt, pseg_t *gradSeg);
// Handle a request for a link test with a specific neighbor. Respond
// by performing link test and sending a PSEG_TYPE_LINK_REPORT to the
// originator.
void PingServicePing(pseg_t *pkt, pseg_t *gradSeg);
// Handle an incoming ping packet. Respond by sending a pong packet.
void PingServicePong(pseg_t *pkt);
// Handle an incoming pong packet.
// Originating messages
void PingRequestNeighbors(node_id target);
// Originate a PSEG_TYPE_NEIGHBOR_REQUEST message, destined for the
// named target node. Soon, a PSEG_TYPE_NEIGHBOR_REPORT message
// should arrive back at this node.
void PingRequestLinkTest(node_id target, node_id neighbor);
// Originate a PSEG_TYPE_LINK_REQUEST message, destined for the named
// target node. Soon, a PSEG_TYPE_LINK_REPORT message should arrive
// back at this node.
#endif
pin
g.c
// File: ping.c
// Description: test link reliability with neighboring nodes
// Author(s): Andrew Wheeler <[email protected]>
// Paul Covell <[email protected]>
// Robert Poor <[email protected]>
//
// Copyright 2001 by the Massachusetts Institute of Technology. All
// rights reserved.
//
// This MIT Media Laboratory project was sponsored by the Defense
// Advanced Research Projects Agency, Grant No. MOA972-99-1-0012. The
// content of the information does not necessarily reflect the
// position or the policy of the Government, and no official
// endorsement should be inferred.
//
// For general public use.
//
// This distribution is approved by Walter Bender, Director of the
// Media Laboratory, MIT. Permission to use, copy, or modify this
// software and its documentation for educational and research
// purposes only and without fee is hereby granted, provided that this
// copyright notice and the original authors' names appear on all
// copies and supporting documentation. If individual files are
// separated from this distribution directory structure, this
// copyright notice must be included. For any other uses of this
// software, in original or modified form, including but not limited
// to distribution in whole or in part, specific prior permission must
// be obtained from MIT. These programs shall not be used, rewritten,
// or adapted as the basis of a commercial software or hardware
// product without first obtaining appropriate licenses from MIT. MIT
// makes no representations about the suitability of this software for
// any purpose. It is provided "as is" without express or implied
// warranty.
#include "grad.h"
#include "mac.h"
#include "param.h"
#include "ping.h"
#include "pseg.h"
#include "tephra.h"
#include "includes.h"
#include "arq.h"
#include <stdlib.h>
#include "ucos_ii.h"
#include "serial.h"
#include "sysmanager.h"
#include "sync.h"
#include "boottest.h"
#undef PING_PRINTFS
// ================================================================
// local declarations
//#define LINK_TEST_COUNT
200
// # of ping messages to send to a specific neighbor in testing
// link reliability
#define TABLE_SIZE 256
#define PING_TABLE_SIZE 256
#define NEIGHBOR_DISC_SIZE 12
// The ping table keeps a history of ping messages sent by this node
// and the corresponding pong messages that have been received. The
// Nth record corresponds to nodeID N.
// The linkTable keeps track of the link statistics for the local nodes
// and the remote nodes with which they are communicating.
// The local variables represent data relating to the local node, and the
// remote variables represent the `local-data-from-the-remote-node-relating-
// to-the-local-node.'
// This is desirable so that a single node can print bi-directional link
// statistics.
typedef struct
{

90
node_id fNeighbor;
uint8_t fLocalPingsSent;
uint8_t fLocalPingsRcvd;
uint8_t fLocalPongsSent;
uint8_t fLocalPongsRcvd;
uint8_t fRemotePingsSent;
// uint8_t fRemotePingsRcvd; // We don't actually know this
uint8_t fRemotePongsSent;
// uint8_t fRemotePongsRcvd; // We don't actually know this
} linkStatistics;
static linkStatistics _linkTable[TABLE_SIZE];
static node_id beaconTable[TABLE_SIZE];
//linkState _linkTable[TABLE_SIZE];
// The pong table keeps a history of ping messages that have been
// received at this node. The Nth entry corresponds to nodeID N.
typedef struct {
uint8_t fPingsSent;
// # of pings sent (as reported by pinger)
uint8_t fPingsRcvd;
// pings actually received (= pongs sent)
} pingState;
//pingState _pingTable[TABLE_SIZE];
unsigned int _linkRequestStack[LINK_REQUEST_STACK_SIZE];
unsigned int _pingNeighborsStack[PING_NEIGHBORS_STACK_SIZE];
unsigned int _beaconStack[BEACON_STACK_SIZE];
static node_id discNeighbors[NEIGHBOR_DISC_SIZE];
static node_id _neighborReqDest;
static node_id _linkTarget;
static node_id _linkReqDest;
static bool _runLinkOnAsync;
static bool _linkTestRunning;
static void _linkTableReset(void);
static void _linkTableResetEntry(node_id id);
static void _discoverNeighbors(void);
static void _linkTest(node_id id);
void _sendPing(node_id target, uint8_t pingsSent);
void _sendPong(node_id target, uint8_t pongsSent, bool useGrad);
static int _linkStatisticsCmp(const void *p1, const void *p2);
void _pingNeighborsTask(void *args);
void _linkRequestTask(void *args);
void _beaconTask(void *args);
static void _pingClearNeighbors( void );
// ================================================================
// exported routines
void PingInit(void)
{ #ifdef DEBUG_BUFFER
debug_buffer(83);
#endif
// cold start
_runLinkOnAsync = false;
_linkTestRunning = false;
} void PingReset(void)
{
#ifdef DEBUG_BUFFER
debug_buffer(84);
#endif
// warm restart
_runLinkOnAsync = false;
_linkTestRunning = false;
}
// sets up a new link test session
void PingStartAsyncLinkTest( void ) {
// clear out the neighbor table
_pingClearNeighbors();
// start the link tests running
_runLinkOnAsync = true;
}
void PingStopAsyncLinkTest( void ) {
_runLinkOnAsync = false;
}
// has the opportunity to check a sync packet that is recieved
// to see if we want to do anything with it
void PingCheckSync(pseg_t *pkt) {
int i;
bool found;
syncPayload *sp = PSegPayload(pkt);
found = false;
for (i=0; i<NEIGHBOR_DISC_SIZE; i++) {
if (discNeighbors[i] == BROADCAST_ID) {
discNeighbors[i] = sp->fSender;
break;
}
if (discNeighbors[i] == sp->fSender) {
found = true;
discNeighbors[i+1] = sp->fSender;
break;
}
}
if ((i < (NEIGHBOR_DISC_SIZE - 1)) && !found) {
if (_runLinkOnAsync && !_linkTestRunning) {
#ifdef PING_PRINTFS
Uart_Printf("discovered node %d, running link test...\n", sp->fSender);
#endif
_linkReqDest = BROADCAST_ID;
_linkTarget = sp->fSender;
OSTaskDel(LINK_REQUEST_TASK_ID);
OSTaskCreate(_linkRequestTask,
NULL,
(void *)&_linkRequestStack[LINK_REQUEST_STACK_SIZE-1],
LINK_REQUEST_TASK_ID);
}
}
}
// activates a testing beacon task
void PingStartBeaconMode( void ) {
OSTaskCreate(_beaconTask,
NULL,
(void *)&_beaconStack[BEACON_STACK_SIZE-1],
BEACON_TASK_ID);
91
} // searches for nodes every once in a while and then runs link tests on the
// new ones
void _beaconTask( void *args ) {
int i;
// TESTING
_linkTest(96);
Uart_Printf(" link test results:\n");
Uart_Printf(" pings sent: %d, pings rcvd: %d, pongs sent: %d, pongs rcvd: %d\n",
_linkTable[96].fLocalPingsSent,
_linkTable[96].fRemotePongsSent,
_linkTable[96].fRemotePongsSent,
_linkTable[96].fLocalPongsRcvd);
while (1);
// END TESTING
while (1) {
_discoverNeighbors();
qsort(_linkTable, TABLE_SIZE, sizeof(linkStatistics), _linkStatisticsCmp);
// The neighbors who generated the most pong responses are now at
// the top of _linkTable
// copy the neighbors out of linkTable
for (i = 0; i < TABLE_SIZE; i++) {
linkStatistics *ls = &_linkTable[i];
if (ls->fLocalPongsRcvd != 0) {
beaconTable[i] = ls->fNeighbor;
}
else {
beaconTable[i] = BROADCAST_ID;
}
}
// run a link test on each of the discovered neighbors
for (i = 0; i < TABLE_SIZE; i++) {
if (beaconTable[i] == BROADCAST_ID) {
break;
}
#ifdef PING_PRINTFS
Uart_Printf("discovered node %d, running link test...\n", beaconTable[i]);
#endif
_linkTest(beaconTable[i]);
#ifdef PING_PRINTFS
Uart_Printf(" link test results:\n");
Uart_Printf(" pings sent: %d, pings rcvd: %d, pongs sent: %d, pongs rcvd:
%d\n",
_linkTable[beaconTable[i]].fLocalPingsSent,
_linkTable[beaconTable[i]].fRemotePongsSent,
_linkTable[beaconTable[i]].fRemotePongsSent,
_linkTable[beaconTable[i]].fLocalPongsRcvd);
if (_linkTable[beaconTable[i]].fLocalPongsRcvd > 84) {
Uart_Printf(" node %d passed\n", beaconTable[i]);
} else {
Uart_Printf(" NODE %d FAILED\n", beaconTable[i]);
}
#endif
}
OSTimeDly(5*OS_TICKS_PER_SEC);
}
}
void PingServiceNeighborsRequest(pseg_t *pkt, pseg_t *gradSeg)
{
#ifdef DEBUG_BUFFER
debug_buffer(85);
#endif
if (gradSeg != NULL)
{
_neighborReqDest = ((gradPayload *)PSegPayload(gradSeg))->fOriginator;
}
else
{
_neighborReqDest = BROADCAST_ID;
}
OSTaskDel(PING_NEIGHBORS_TASK_ID);
OSTaskCreate(_pingNeighborsTask,
NULL,
(void *)&_pingNeighborsStack[PING_NEIGHBORS_STACK_SIZE-1],
PING_NEIGHBORS_TASK_ID);
}
void _pingNeighborsTask(void *args)
{
// Handle a request to discover neighbors. Send (broadcast) PING
// messages to the neighbors, tally the incoming PONG messages to
// figure out who the neighbors are, and send a
// PSEG_TYPE_NEIGHBORS_REPORT to the originator.
int i;
pseg_t *report;
neighborsReportPayload *reportPayload;
#ifdef DEBUG_BUFFER
debug_buffer(86);
#endif
// Emit a series of PING messages and tally the number of PONG
// responses from each neighbor
_discoverNeighbors();
// At this point, _linkTable()[N]->fLocalPongsRcvd contains the number of
// pong messages this node has received from neighbor N. Sort the
// table by decreasing number of pongs received.
qsort(_linkTable, TABLE_SIZE, sizeof(linkStatistics), _linkStatisticsCmp);
// The neighbors who generated the most pong responses are now at
// the top of _linkTable
// compose a PSEG_TYPE_NEIGHBOR_REPORT message
report = PSegAlloc(PSEG_TYPE_NEIGHBOR_REPORT,
sizeof(neighborsReportPayload),
NULL);
reportPayload = PSegPayload(report);
// copy the node ids of the nodes with the most responses.
for (i = 0; i < PING_MAX_NEIGHBORS; i++)
{
linkStatistics *ls = &_linkTable[i];
if (ls->fLocalPongsRcvd != 0)
{
reportPayload->fNeighbors[i] = ls->fNeighbor;
}
else
{

92
// no more neighbors - write an out-of-band value
reportPayload->fNeighbors[i] = BROADCAST_ID;
}
}
// finally send the report back to the sender
if (_neighborReqDest == NodeGetID())
{
SerialServiceNeighborReport(report);
PSegFree(report);
}
else if (_neighborReqDest != BROADCAST_ID)
{
MACXmitPkt(ARQMakeARQ(GRAdMakePkt(report, _neighborReqDest)));
}
else
{
// no GRAd header received? Reply with a headerless report...
MACXmitPkt(report);
}
OSTaskDel(PING_NEIGHBORS_TASK_ID);
} void PingServiceLinkRequest(pseg_t *linkPkt, pseg_t *gradSeg)
{ #ifdef DEBUG_BUFFER
debug_buffer(87);
#endif
if (gradSeg != NULL)
{
_linkReqDest = ((gradPayload *)PSegPayload(gradSeg))->fOriginator;
}
else
{
_linkReqDest = BROADCAST_ID;
}
_linkTarget = ((linkRequestPayload *)PSegPayload(linkPkt))->fNeighbor;
OSTaskDel(LINK_REQUEST_TASK_ID);
OSTaskCreate(_linkRequestTask,
NULL,
(void *)&_linkRequestStack[LINK_REQUEST_STACK_SIZE-1],
LINK_REQUEST_TASK_ID);
} void _linkRequestTask(void *args)
{ // Handle a request for a link test with a specific neighbor. Respond
// by performing link test and sending a PSEG_TYPE_LINK_REPORT to the
// originator.
pseg_t *reportPkt;
linkState *reportP;
_linkTestRunning = true;
// HACK- bad place for this, but easiest to write at the moment
if (_runLinkOnAsync) {
BootSendPkt(BOOT_FOUNDNEIGHBOR, _linkTarget);
}
#ifdef DEBUG_BUFFER
debug_buffer(88);
#endif
_linkTest(_linkTarget);
// at tthis point, _linkTable[fNeighbor] has logged the number of
// pings and pongs sent and pongs received. Copy the info for that
// neighbor into a link report message and send it back to the
// requestor
reportPkt = PSegAlloc(PSEG_TYPE_LINK_REPORT,
sizeof(linkState),
NULL);
reportP = PSegPayload(reportPkt);
reportP->fNeighbor = _linkTarget;
reportP->fPingsSent = _linkTable[_linkTarget].fLocalPingsSent;
reportP->fPingsRcvd = _linkTable[_linkTarget].fRemotePongsSent;
reportP->fPongsSent = _linkTable[_linkTarget].fRemotePongsSent;
reportP->fPongsRcvd = _linkTable[_linkTarget].fLocalPongsRcvd;
// send the report to the requestor
if(_linkReqDest == NodeGetID())
{
SerialServiceNeighborLinkReport(reportPkt);
PSegFree(reportPkt);
}
else if (_linkReqDest != BROADCAST_ID)
{
MACXmitPkt(ARQMakeARQ(GRAdMakePkt(reportPkt, _linkReqDest)));
}
else
{
// no GRAd header received? Reply with a headerless report...
MACXmitPkt(reportPkt);
}
#ifdef PING_PRINTFS
Uart_Printf(" link test results:\n");
Uart_Printf(" pings sent: %d, pings rcvd: %d, pongs sent: %d, pongs rcvd: %d\n",
_linkTable[_linkTarget].fLocalPingsSent,
_linkTable[_linkTarget].fRemotePongsSent,
_linkTable[_linkTarget].fRemotePongsSent,
_linkTable[_linkTarget].fLocalPongsRcvd);
#endif
_linkTestRunning = false;
OSTaskDel(LINK_REQUEST_TASK_ID);
}
void PingServicePing(pseg_t *pingPkt, pseg_t *gradSeg)
{
// Handle an incoming ping packet. Make a note of how many pings
// have been receiced from that neighbor and send a pong packet in
// reply.
pingPayload *pip = PSegPayload(pingPkt);
#ifdef DEBUG_BUFFER
debug_buffer(89);
#endif
if ((pip->fTarget == BROADCAST_ID) || (pip->fTarget == NodeGetID()))
{
// message is for me...
linkStatistics *ls = &_linkTable[pip->fPinger];
// notify the system manager that we are currently participating in a ping
SysSetPingParticipant();
// note another ping message received, resetting if the pinger
// has started a new sequence.
if (pip->fPingsSent < ls->fRemotePingsSent)

93
{
ls->fLocalPingsRcvd = 0;
ls->fLocalPongsSent = 0;
}
ls->fRemotePingsSent = pip->fPingsSent;
ls->fLocalPingsRcvd++;
#ifdef PING_PRINTFS
Uart_Printf(" Got a ping from %d, remote pings sent %d, local pings rcvd
%d, pkt %x\n",
pip->fPinger, ls->fRemotePingsSent, ls->fLocalPingsRcvd,
pingPkt);
#endif
// compose and send a pong message in response.
ls->fLocalPongsSent++; // increment pongs sent
_sendPong(pip->fPinger, ls->fLocalPongsSent, (gradSeg != NULL));
}
} void PingServicePong(pseg_t *pongPkt)
{ // Handle an incoming pong packet.
pongPayload *pop = PSegPayload(pongPkt);
linkStatistics *pie = &_linkTable[pop->fPonger];
#ifdef DEBUG_BUFFER
debug_buffer(90);
#endif
if ((pop->fTarget == BROADCAST_ID) || (pop->fTarget == NodeGetID())) {
// this pong is for me...
pie->fRemotePongsSent = pop->fPongsSent;
pie->fLocalPongsRcvd++;
}
#ifdef PING_PRINTFS
Uart_Printf(" Got a pong to %d, from %d, remote pongs sent %d, local pongs rcvd
%d\n",
pop->fTarget,pop->fPonger, pie->fRemotePongsSent,
pie->fLocalPongsRcvd);
#endif
} // Originating messages
void PingRequestNeighbors(node_id target)
{ // Originate a PSEG_TYPE_NEIGHBOR_REQUEST message, destined for the
// named target node. Soon, a PSEG_TYPE_NEIGHBOR_REPORT message
// should arrive back at this node.
pseg_t *nrPkt = PSegAlloc(PSEG_TYPE_NEIGHBOR_REQUEST,
sizeof(neighborsRequestPayload),
NULL);
#ifdef DEBUG_BUFFER
debug_buffer(91);
#endif
if (target != BROADCAST_ID)
{
MACXmitPkt(ARQMakeARQ(GRAdMakePkt(nrPkt, target)));
}
else
{
MACXmitPkt(nrPkt);
}
}
void PingRequestLinkTest(node_id target, node_id neighbor)
{
// Originate a PSEG_TYPE_LINK_REQUEST message, destined for the named
// target node. Soon, a PSEG_TYPE_LINK_REPORT message should arrive
// back at this node.
pseg_t *lrPkt = PSegAlloc(PSEG_TYPE_LINK_REQUEST,
sizeof(linkRequestPayload),
NULL);
linkRequestPayload *lrp = PSegPayload(lrPkt);
lrp->fNeighbor = neighbor;
#ifdef DEBUG_BUFFER
debug_buffer(92);
#endif
if (target != BROADCAST_ID)
{
MACXmitPkt(ARQMakeARQ(GRAdMakePkt(lrPkt, target)));
}
else
{
MACXmitPkt(lrPkt);
}
}
// ================================================================
// internal routines
static void _pingClearNeighbors( void ) {
int i;
for (i=0; i<NEIGHBOR_DISC_SIZE; i++) {
discNeighbors[i] = BROADCAST_ID;
}
}
static void _linkTableReset(void)
{
int i;
#ifdef DEBUG_BUFFER
debug_buffer(93);
#endif
for (i = 0; i<TABLE_SIZE; i++)
{
_linkTableResetEntry(i);
}
}
static void _linkTableResetEntry(node_id id)
{
linkStatistics *lr = &_linkTable[id];
#ifdef DEBUG_BUFFER
debug_buffer(94);
#endif
lr->fNeighbor = id;
lr->fLocalPingsSent = 0;
lr->fLocalPingsRcvd = 0;
lr->fLocalPongsSent = 0;
lr->fLocalPongsRcvd = 0;
lr->fRemotePingsSent = 0;
//lr->fRemotePingsRcvd = 0;
lr->fRemotePongsSent = 0;
//lr->fRemotePongsRcvd = 0;
}
94
static void _discoverNeighbors(void)
{ // send a series of PING messages out, let PingServicePong() tally
// how many replies arrive
int i;
#ifdef DEBUG_BUFFER
debug_buffer(95);
#endif
_linkTableReset();
for (i = 0; i < ParamGet(PARAM_PING_SEARCH_COUNT); i++)
{
_sendPing(BROADCAST_ID, i+1);
OSTimeDly(ParamGet(PARAM_PING_LINK_TEST_DELAY));
}
// By now, a number of PSEG_TYPE_PONG messages should have arrived
// and updated _pingTable[].
} static void _linkTest(node_id id)
{ int i;
#ifdef DEBUG_BUFFER
debug_buffer(95);
#endif
_linkTableResetEntry(id);
for (i = 0; i < ParamGet(PARAM_PING_LINK_TEST_COUNT); i++)
{
_sendPing(id, i+1);
OSTimeDly(ParamGet(PARAM_PING_LINK_TEST_DELAY));
}
} void _sendPing(node_id target, uint8_t pingsSent)
{ // Send a PING message to the given target
pseg_t *pingPkt = PSegAlloc(PSEG_TYPE_PING, sizeof(pingPayload), NULL);
pingPayload *pip = PSegPayload(pingPkt);
#ifdef DEBUG_BUFFER
debug_buffer(96);
#endif
pip->fPinger = NodeGetID();
pip->fTarget = target;
pip->fPingsSent = pingsSent;
// Set pings sent
_linkTable[target].fLocalPingsSent = pingsSent;
MACXmitPkt(pingPkt);
} void PingSendPing(node_id target) {
_sendPing(target, 0);
} void _sendPong(node_id target, uint8_t pongsSent, bool useGrad)
{ // Send a PONG message to the given target
pseg_t *pongPkt = PSegAlloc(PSEG_TYPE_PONG, sizeof(pongPayload), NULL);
pongPayload *pop = PSegPayload(pongPkt);
#ifdef DEBUG_BUFFER
debug_buffer(97);
#endif
pop->fPonger = NodeGetID();
pop->fTarget = target;
pop->fPongsSent = pongsSent;
// Set pongs sent
_linkTable[target].fLocalPongsSent = pongsSent;
if (!useGrad)
{
MACXmitPkt(pongPkt);
}
else
{
// this was a remote ping.. relay
MACXmitPkt(GRAdMakePkt(pongPkt, target));
}
}
static int _linkStatisticsCmp(const void *p1, const void *p2)
{
// Sorting predicate for qsort:
// return neg / 0 / pos if the pongs received of p1 are
// less than / eq / greater than the pongs received of p2
// this is backwards to get descending order
#ifdef DEBUG_BUFFER
debug_buffer(98);
#endif
return ((linkStatistics *)p2)->fLocalPongsRcvd -
((linkStatistics *)p1)->fLocalPongsRcvd;
}
pse
g.h
// File: pseg.h
// Description: support for Packets and Segments
// Author(s): Robert Poor <[email protected]>
// Andrew Wheeler <[email protected]>
//
// Copyright 2001 by the Massachusetts Institute of Technology. All
// rights reserved.
//
// This MIT Media Laboratory project was sponsored by the Defense
// Advanced Research Projects Agency, Grant No. MOA972-99-1-0012. The
// content of the information does not necessarily reflect the
// position or the policy of the Government, and no official
// endorsement should be inferred.
//
// For general public use.
//
// This distribution is approved by Walter Bender, Director of the
// Media Laboratory, MIT. Permission to use, copy, or modify this
// software and its documentation for educational and research
// purposes only and without fee is hereby granted, provided that this
// copyright notice and the original authors' names appear on all
// copies and supporting documentation. If individual files are
// separated from this distribution directory structure, this
// copyright notice must be included. For any other uses of this
// software, in original or modified form, including but not limited
// to distribution in whole or in part, specific prior permission must
// be obtained from MIT. These programs shall not be used, rewritten,
// or adapted as the basis of a commercial software or hardware
// product without first obtaining appropriate licenses from MIT. MIT
// makes no representations about the suitability of this software for
95
// any purpose. It is provided "as is" without express or implied
// warranty.
#ifndef PSEG_H
#define PSEG_H
#include "types.h"
// A packet carries data among nodes. Each packet is a linked list of
// packet segments; each segment carries a segment type, a byte count,
// and a payload.
//
// Internally, a segment has a fixed size payload, and a type-specific
// structure is cast to the payload (typically using fewer bytes than
// the full payload).
//
// When a segment is transmitted, it is serialized and only the
// "active" bytes of its payload are sent over the airwaves.
// MAX_PAYLOAD_SIZE defines the maximum number of payload bytes in a
// packet segment.
//
#define MAX_PAYLOAD_SIZE 64
// EOP_TRANSMIT_LENGTH defines the length of the EOP segment when it
// is transmitted -- one byte for the type, one byte for the length [0]
#define EOP_TRANSMIT_LENGTH 2
typedef enum {
PSEG_TYPE_EOP = 0,
PSEG_TYPE_SYNC = 1,
// inter-node sync info
PSEG_TYPE_GRAD = 2,
// gradient routing info
PSEG_TYPE_DISCO = 3,
// discovery routing request
PSEG_TYPE_PING = 4,
// ping packet, request for pong
PSEG_TYPE_PONG = 5,
// reply to a ping
PSEG_TYPE_ARQ = 6,
// request and ack
PSEG_TYPE_ACK = 7,
// reply by sending an ack
PSEG_TYPE_NEIGHBOR_REQUEST = 8,
// request list of neighboring nodes
PSEG_TYPE_NEIGHBOR_REPORT = 9,
// here's my list of neighbors
PSEG_TYPE_LINK_REQUEST = 10,
// request link test to specific neighbor
PSEG_TYPE_LINK_REPORT = 11, // here's the result of the link test
PSEG_TYPE_PARAM_SET = 12,
// set parameters from payload
PSEG_TYPE_PARAM_REQUEST = 13,
// request current parameters
PSEG_TYPE_PARAM_REPORT = 14,
// here are my current parameters
PSEG_TYPE_STATS_RESET = 15, // clear current logging stats
PSEG_TYPE_STATS_REQUEST = 16,
// request logging statistics
PSEG_TYPE_STATS_REPORT_A = 17,// here are my logging statistics
PSEG_TYPE_STATS_REPORT_B = 18,
PSEG_TYPE_APPX_REPORT = 19, // here is the sensor data
PSEG_TYPE_COST_TABLE = 20, // contains a chunk of the cost table
PSEG_TYPE_SET_IN_OPERATION = 21, // this node exits config mode and goes into
operational mode
PSEG_TYPE_SDP_REQUEST = 22,
PSEG_TYPE_SDP_REPLY = 23,
PSEG_TYPE_BOOT_REPORT = 24,
PSEG_TYPE_ENTER_TEST = 25,
PSEG_TYPE_EXIT_TEST = 26,
PSEG_TYPE_TESTING = 27,
PSEG_TYPE_START_ASYNC = 28,
PSEG_TYPE_STOP_ASYNC = 29,
// add new seg types above this line and extend appr.c accordingly
MAX_PSEG_TYPE
} pseg_type;
// generic segment structure
//
typedef struct _pseg_t {
struct _pseg_t *fNext;
// link to the next segment in pkt
uint32_t fPayload[MAX_PAYLOAD_SIZE];
pseg_type fType;
// segment type
uint8_t fSize;
// size of segment in bytes
} pseg_t;
void PSegInit(void);
// initialize the packet system
void PSegReset(void);
// reset pkt system after sleep
pseg_t *PSegAlloc(pseg_type type, uint8_t size, pseg_t *next);
// allocate a single packet segment
void PSegFree(pseg_t *head);
// free a chain of packet segments
pseg_t *PSegCopy(pseg_t *pkt);
// make a "deep copy" of pkt
#define PSegType(p) ((p)->fType)
// access the packet type for this segment
#define PSegSize(p) ((p)->fSize)
// access the number of bytes in the payload.
#define PSegNext(p) ((p)->fNext)
// access the link to the next packet in the list of packets
#define PSegPayload(p) ((void *)((p)->fPayload))
// access the first byte of the payload.
#define PSegTransmitSize(p) \
((p)->fSize + sizeof((p)->fSize) + sizeof((p)->fType))
pseg_t *PSegFindType(pseg_t *pkt, pseg_type type);
// find a segment of the given type in the packet chain, returning
// NULL if not found
uint8_t PSegCountBytes(pseg_t *pkt);
// Count the number of bytes in the packet chain
uint8_t PSegCountSegs(pseg_t *pkt);
// Count the number of segments in the packet chain
void PSegPrintSeg(pseg_t *seg);
// print one segment to stdout in hex
void PSegPrint(pseg_t *pkt);
// print a string of segments to stdout in hex
#endif
rad
.h
// File: rad.h
// Description: send and receive packets over the radio hardware
// Author(s): Andrew Wheeler <[email protected]>

96
// Robert Poor <[email protected]>
//
// Copyright 2001 by the Massachusetts Institute of Technology. All
// rights reserved.
//
// This MIT Media Laboratory project was sponsored by the Defense
// Advanced Research Projects Agency, Grant No. MOA972-99-1-0012. The
// content of the information does not necessarily reflect the
// position or the policy of the Government, and no official
// endorsement should be inferred.
//
// For general public use.
//
// This distribution is approved by Walter Bender, Director of the
// Media Laboratory, MIT. Permission to use, copy, or modify this
// software and its documentation for educational and research
// purposes only and without fee is hereby granted, provided that this
// copyright notice and the original authors' names appear on all
// copies and supporting documentation. If individual files are
// separated from this distribution directory structure, this
// copyright notice must be included. For any other uses of this
// software, in original or modified form, including but not limited
// to distribution in whole or in part, specific prior permission must
// be obtained from MIT. These programs shall not be used, rewritten,
// or adapted as the basis of a commercial software or hardware
// product without first obtaining appropriate licenses from MIT. MIT
// makes no representations about the suitability of this software for
// any purpose. It is provided "as is" without express or implied
// warranty.
#ifndef RAD_H
#define RAD_H
// definitions for radio interface
#include "pseg.h"
#include "types.h"
// The radio normally runs a receive task at high priority, waiting
// for packets to appear from the radio processor (an Atmel device).
// When a packet is received, it is broken up into pseg_t segments and
// inserted in the application receive queue for processing by the
// application receive task.
void RadPrintStats(void);
void RadInit(void);
// cold start initialization, called once upon power up
void RadReset(void);
// Warm start re-initialization, called upon system wake up.
void RadStart(void);
// Start the radio receive thread.
void RadXmitPkt(pseg_t *packet);
// Transmit a packet immediately. Called from the MAC_XMIT_TASK.
// Terminates the receive thread, configures the radio for xmit,
// transmits the packet, then restarts the receive thread.
bool RadIsBusy(void);
// Returns true if the radio is actively transmitting or receiving.
void RadSleep(void);
// puts the radio to sleep (unless it is already asleep, in which case the function
does nothing)
void RadWakeUp(void);
// wakes up the radio if it is asleep, otherwise it resets the recieve state of the
radio
uint32_t RadLastPktTime(void);
#define RAD_STAT_SIZE 4 // number of bytes of statistics sent with the
packet
#define RAD_MAX_PKT_SIZE 50 // number of bytes the longest packet can be
#define RAD_RCV_DMA_BYTE_COUNT ((RAD_MAX_PKT_SIZE*3) + RAD_STAT_SIZE + 1) //
packet+stat+length byte + chk
#define RAD_TX_DMA_BYTE_COUNT ((RAD_MAX_PKT_SIZE) + 2) // packet + length + length2+
1 that is lost +chk
#define RX_GOOD_PKT_LOW 0
#define RX_GOOD_PKT_HIGH 1
#define RX_BAD_PKT_LOW 2
#define RX_BAD_PKT_HIGH 3
#define RX_LENGTH 4
#define RAD_TIMEOUT (1 * MCLK / 96) // 1 second
#endif
rad
.c
// File: rad.c
// Description: send and receive packets over the radio hardware
// Author(s): Andrew Wheeler <[email protected]>
// Robert Poor <[email protected]>
//
// Copyright 2001 by the Massachusetts Institute of Technology. All
// rights reserved.
//
// This MIT Media Laboratory project was sponsored by the Defense
// Advanced Research Projects Agency, Grant No. MOA972-99-1-0012. The
// content of the information does not necessarily reflect the
// position or the policy of the Government, and no official
// endorsement should be inferred.
//
// For general public use.
//
// This distribution is approved by Walter Bender, Director of the
// Media Laboratory, MIT. Permission to use, copy, or modify this
// software and its documentation for educational and research
// purposes only and without fee is hereby granted, provided that this
// copyright notice and the original authors' names appear on all
// copies and supporting documentation. If individual files are
// separated from this distribution directory structure, this
// copyright notice must be included. For any other uses of this
// software, in original or modified form, including but not limited
// to distribution in whole or in part, specific prior permission must
// be obtained from MIT. These programs shall not be used, rewritten,
// or adapted as the basis of a commercial software or hardware
// product without first obtaining appropriate licenses from MIT. MIT
// makes no representations about the suitability of this software for
// any purpose. It is provided "as is" without express or implied
// warranty.
#include "s3c3410x.h"
#include "tephra.h"
97
#include "pseg.h"
#include "rad.h"
#include "types.h"
#include "includes.h"
#include "sync.h"
#include "mac.h"
#include "appr.h"
#include "stats.h"
//#define THIS_IS_STUB_CODE
#undef RAD_PRINTFS
static void _RadSetupTxDma( void );
static void _RadSetupRxDma( void );
static void _RadBusyISR( void );
static void _RadDMADoneISR( void );
static void _RadExportPkt(pseg_t *pkt);
static void _RadTask(void *args);
static bool _RadPktValid( void );
static pseg_t * _RadImportPkt( void );
//volatile bool _radioBusyFlag;
volatile bool _radioTXModeFlag;
volatile bool _radioRXEnabledFlag;
volatile bool _radioAsleepFlag;
volatile bool _radioDmaTxDone;
static unsigned int _radStack[RAD_RCV_TASK_STACK_SIZE];
// receive and transmit buffers
static uint8_t _radTXBuffer[RAD_TX_DMA_BYTE_COUNT];
static uint8_t _radRCVBuffer[RAD_RCV_DMA_BYTE_COUNT];
//static uint8_t _radTXIntB[RAD_MAX_PKT_SIZE+1];
//static uint8_t _radRXIntB[RAD_MAX_PKT_SIZE+1];
static uint32_t _lastPktRcvTime;
int good, bad;
// signaling semaphore to indicate DMA done
static OS_EVENT *dmaDoneSem;
static unsigned char _toHex[16]={
'0','1','2','3','4','5','6','7',
'8','9','a','b','c','d','e','f'};
static void _putHex(unsigned char ch)
{ #ifdef DEBUG_BUFFER
debug_buffer(109);
#endif
Uart_SendByte(_toHex[ch >> 4]);
Uart_SendByte(_toHex[ch & 0x0f]);
} void RadInit()
{ good = 0;
bad = 0;
#ifdef DEBUG_BUFFER
debug_buffer(112);
#endif
// setup the dmaDone semaphore
dmaDoneSem = OSSemCreate(0);
// setting up variables
// _radioBusyFlag = false;
_radioTXModeFlag = false; // in receive by default
_radioRXEnabledFlag = false; // not receiving yet
// make sure radio is awake MOVED CALL TO LATER
// RadWakeUp();
_radioAsleepFlag = false; // radio starts out awake
OS_ENTER_CRITICAL();
// install the DMA interrupt handler
ISR_DMA0 = (unsigned)_RadDMADoneISR;
// install the radio busy interrupt handler
ISR_EINT1 = (unsigned)_RadBusyISR;
// setup the interrupt mask to enable EINT1 and SIO0
EINTCON = EINTCON_EINT1_ENABLE; // enable the EINT1 pin interrupt
// generation
EINTMOD = EINTMOD_EINT1_BOTH_EDGE; // set the EINT1 interrupt mode to be
// both edges
INTPND = ~EINT1; // clear any EINT1 pending interrupts
INTMSK |= EINT1; // activate the EINT1 interrupt
OS_EXIT_CRITICAL();
}
void RadReset()
{
#ifdef DEBUG_BUFFER
debug_buffer(113);
#endif
RadWakeUp();
}
void RadXmitPkt(pseg_t *packet)
{
uint32_t delay = RAD_TIMEOUT;
int i;
#ifdef DEBUG_BUFFER
debug_buffer(114);
#endif
// make sure that the radio is not currently busy
while (RadIsBusy() && delay)
{
delay--;
}
if (delay == 0)
{
return;
}
// delay?
// deactivate receive DMA operation
OS_ENTER_CRITICAL();
SIOCON0 = SIOCON_MODE_DISABLE;
DMACON0 = DMACON_RUN_DISABLE;
OS_EXIT_CRITICAL();
// setup flags for transmit
_radioTXModeFlag = true;
_radioDmaTxDone = false;
98
// timestamp the packet
SyncWillXmit(packet);
// copies the packet to the transmit DMA buffer
_RadExportPkt(packet);
// for (
// _radTXBuffer[1] = (PSegCountBytes(pkt)+1)
// signal to the radio that we would like to transmit...
#ifdef RAD_PRINTFS
Uart_Printf("pktlength = %x seglength = %x segtype = %x [%x %x %x %x %x]\n",
_radTXBuffer[1],
_radTXBuffer[2],
_radTXBuffer[3],
_radTXBuffer[4],
_radTXBuffer[5],
_radTXBuffer[6],
_radTXBuffer[7],
_radTXBuffer[8]);
#endif
RAD_SIGNAL_TXPKT();
RAD_SET_INTERRUPT();
delay = RAD_TIMEOUT;
while (!INTERRUPT_ACK() && delay)
{
delay--;
}
if (delay == 0)
{
return;
}
// setup transmit DMA operation
_RadSetupTxDma();
RAD_UNSET_INTERRUPT(); // tells the radio that we are ready to begin the
transmit operation
// wait for DMA to complete
delay = RAD_TIMEOUT;
while (!_radioDmaTxDone);
/*
{
delay--;
}
if (delay == 0)
{
return;
}
*/
// disable the DMA0 system
OS_ENTER_CRITICAL();
SIOCON0 = SIOCON_MODE_DISABLE;
DMACON0 = DMACON_RUN_DISABLE;
OS_EXIT_CRITICAL();
// reset to receive mode
_radioTXModeFlag = false;
if (_radioRXEnabledFlag)
{ // if the RX dma was setup...
_RadSetupRxDma();
_radioRXEnabledFlag = true;
}
// go away
}
void RadStart()
{
#ifdef DEBUG_BUFFER
debug_buffer(115);
#endif
OSTaskCreate(_RadTask, NULL, (void *)&_radStack[RAD_RCV_TASK_STACK_SIZE-1],
RAD_RCV_TASK_ID);
}
bool RadIsBusy() {
#ifdef DEBUG_BUFFER
debug_buffer(116);
#endif
return ((bool)RAD_BUSY_PIN_SET());
}
uint32_t RadLastPktTime() {
#ifdef DEBUG_BUFFER
debug_buffer(117);
#endif
return _lastPktRcvTime;
}
// void _RadTask()
// This thread sits in a loop waiting for a packet to arrive
// It first sets up the DMA operation to recieve from the radio.
// It then suspends itself until resumed by the DMA interrupt routine
static void _RadTask(void *args)
{
pseg_t *pkt;
uint8_t errNo;
while (true)
{
#ifdef DEBUG_BUFFER
debug_buffer(118);
#endif
//
Uart_Printf("RadTask\n");
// setup RX DMA
_RadSetupRxDma();
// suspend myself and wait for a packet to arrive via DMA
//
OSTaskSuspend(RAD_RCV_TASK_ID);
OSSemPend(dmaDoneSem, 0, &errNo);
#ifdef DEBUG_BUFFER
debug_buffer(215);
#endif
// disable SIO/DMA
OS_ENTER_CRITICAL();
_radioRXEnabledFlag = false;
SIOCON0 = SIOCON_MODE_DISABLE;
DMACON0 = DMACON_RUN_DISABLE;
OS_EXIT_CRITICAL();
_lastPktRcvTime = OSTimeGet();
// call the timestamp function
SyncWillReceive();

99
// verify that a valid packet arrived?
// CHECK PACKET HERE... make sure length field is between 3 bytes
// and 50 bytes
if ((_radRCVBuffer[RX_LENGTH] < 4) | (_radRCVBuffer[RX_LENGTH] >
(RAD_MAX_PKT_SIZE*3)))
{
// bad length somehow- just continue
//
Uart_Printf("got bad pkt length: %d\n",
_radRCVBuffer[RX_LENGTH]);
continue;
}
#ifdef RAD_PRINTFS
Uart_Printf("pktlength = %x seglength = %x segtype = %x [%x %x %x %x
%x]\n",
_radRCVBuffer[4],
_radRCVBuffer[5],
_radRCVBuffer[6],
_radRCVBuffer[7],
_radRCVBuffer[8],
_radRCVBuffer[9],
_radRCVBuffer[10],
_radRCVBuffer[11]);
#endif
// check the packet to make sure it is OK DEBUGGING
if (!_RadPktValid()) {
continue;
}
//
continue;
// parse out the packet
pkt = _RadImportPkt();
LED_4_ON();
SyncDidReceive(pkt);
// handle packet - hand it to appr
#ifdef RAD_PRINTFS
Uart_Printf(" segtype = %x seglength = %x\n", pkt->fType,
pkt->fSize);
#endif
AppRReceivePkt(pkt);
LED_4_OFF();
}
} // void _RadExportPkt( pseg_t *pkt )
// processes a packet for transmit an places it in the transmit DMA buffer
static void _RadExportPkt(pseg_t *pkt)
{ uint8_t i,chksum; // Points to current entry in buffer
#ifdef DEBUG_BUFFER
debug_buffer(119);
#endif
if (pkt == NULL)
{
return;
}
// 1. Reserved [byte 0]
// 2. Write packet length [byte 1]
// 3. While more segments & buffer space remain, stuff segments into buffer
// _radTXBuffer[0] = 0;
_radTXBuffer[1] = (PSegCountBytes(pkt)+2); // adding one for checksum and one
for length
_radTXBuffer[2] = 3*(PSegCountBytes(pkt)+1); // adding one for checksum
i = 3;
chksum = 0;
// 1. Absolute bad condition: we've exceeded the array: stop
// Probably we've already crashed, though, so rely on 2 and 3.
// 2. Break when we've put the last segment into the array.
// 3. Break when the size of the next segment would cause us to
// exceed the array.
while (i < RAD_TX_DMA_BYTE_COUNT)
{
uint8_t segmentSize;
uint8_t *payload;
if (pkt == NULL)
{
break;
}
if (i + PSegTransmitSize(pkt) > RAD_TX_DMA_BYTE_COUNT)
{
break;
}
segmentSize = PSegSize(pkt);
_radTXBuffer[i++] = segmentSize + 1;
//
_radTXBuffer[i++] = segmentSize + 1;
//
_radTXBuffer[i++] = segmentSize + 1;
chksum += (segmentSize + 1);
_radTXBuffer[i++] = PSegType(pkt);
//
_radTXBuffer[i++] = PSegType(pkt);
//
_radTXBuffer[i++] = PSegType(pkt);
chksum += PSegType(pkt);
payload = PSegPayload(pkt);
while (segmentSize-- > 0)
{
chksum += *payload;
//
_radTXBuffer[i++] = *payload;
//
_radTXBuffer[i++] = *payload;
_radTXBuffer[i++] = *payload++;
}
pkt = PSegNext(pkt); // Advance packet
}
chksum = 0-chksum;
// _radTXBuffer[i++] = chksum;
// _radTXBuffer[i++] = chksum;
_radTXBuffer[i++] = chksum;
// _putHex(_radTXBuffer[1]);
// for (i=0; i<=_radTXBuffer[1]; i++) {
// _putHex(_radTXBuffer[2+i]);
// }
// Uart_Printf("\n");
}
10
0
// pseg_t * _RadImportPkt( void )
// processes the data contained in the recieve DMA buffer and creates a pseg chain
static pseg_t * _RadImportPkt( void )
{ // unsigned int goodPackets; // These should go away with real storage
// unsigned int badPackets; // : example only!
uint8_t numBytes; // Number of bytes in packet
uint8_t i; // points to current entry in packet
pseg_t *pkt; // Return packet
#ifdef DEBUG_BUFFER
debug_buffer(120);
#endif
// 1. Receive radio statistics and store them [byte 0-3]
// 2. Receive packet length [byte 4]
// 3. While more segments remain, create and link segments
// goodPackets = _radRCVBuffer[0]; // lo byte
// goodPackets |= (_radRCVBuffer[1] << 8); // hi byte
// badPackets = _radRCVBuffer[2]; // lo byte
// badPackets |= (_radRCVBuffer[3] << 8); // hi byte
numBytes = _radRCVBuffer[4];
pkt = (pseg_t *)NULL;
i = 5;
// So that countdown will work properly, increase numBytes -- then we
// can stop when i == numBytes
numBytes += i;
// 1. Absolute bad condition: we've exceeded the array: stop
// Probably we've already crashed, though, so rely on 2.
// 2. Break when we've read the appropriate number of bytes.
while (i < RAD_RCV_DMA_BYTE_COUNT && i < numBytes)
{
// 1. Segment length
// 2. Segment type
uint8_t segmentLength = _radRCVBuffer[i++];
uint8_t segmentType = _radRCVBuffer[i++];
uint8_t *pp = NULL; // payload -- generic 8 bit unsigned
if(segmentType == PSEG_TYPE_EOP) // last segment
break;
if(i + segmentLength > RAD_RCV_DMA_BYTE_COUNT) // error; stop.
break;
// Create a new segment and copy the generic payload
pkt = PSegAlloc(segmentType, segmentLength-1, pkt);
pp = PSegPayload(pkt);
while (segmentLength-- > 1)
{
*pp++ = _radRCVBuffer[i++];
}
}
return(pkt);
}
// checks to make sure all is well with the packet
/*static bool _RadPktValid( void ) {
uint8_t checksum;
int i;
checksum = 0;
for (i=0; i<_radRCVBuffer[4]; i++) {
checksum += _radRCVBuffer[5+i];
}
checksum = 0-checksum;
if (checksum != _radRCVBuffer[5+_radRCVBuffer[4]]) {
bad++;
Uart_Printf("good: %d, bad %d:\n ", good, bad);
_putHex(_radRCVBuffer[4]);
for (i=0; i<=_radRCVBuffer[4]; i++) {
_putHex(_radRCVBuffer[5+i]);
}
Uart_Printf("\n");
return false;
} else {
good++;
return true;
}
}*/
static bool _RadPktValid( void ) {
uint8_t checksum, ab, bc, ac;
int i;
checksum = 0;
_radRCVBuffer[4] = _radRCVBuffer[4]/3;
for (i=0; i<(_radRCVBuffer[4]-1); i++) {
ab = _radRCVBuffer[5+(i*3)] & _radRCVBuffer[5+(i*3)+1];
bc = _radRCVBuffer[5+(i*3)+1] & _radRCVBuffer[5+(i*3)+2];
ac = _radRCVBuffer[5+(i*3)] & _radRCVBuffer[5+(i*3)+2];
_radRCVBuffer[5+i] = (ab | bc | ac);
checksum += _radRCVBuffer[5+i];
}
checksum = 0-checksum;
i = (_radRCVBuffer[4]-1);
ab = _radRCVBuffer[5+(i*3)] & _radRCVBuffer[5+(i*3)+1];
bc = _radRCVBuffer[5+(i*3)+1] & _radRCVBuffer[5+(i*3)+2];
ac = _radRCVBuffer[5+(i*3)] & _radRCVBuffer[5+(i*3)+2];
_radRCVBuffer[4] = _radRCVBuffer[4]-1;
if (checksum != (ab | bc | ac)) {
bad++;
// Uart_Printf("good: %d, bad %d:\n ", good, bad);
// _putHex(_radRCVBuffer[4]);
// for (i=0; i<=_radRCVBuffer[4]; i++) {
// _putHex(_radRCVBuffer[5+i]);
// }
// Uart_Printf("\n");
StatsSetBadPackets(bad);
StatsSetGoodPackets(good);
return false;
10
1
} else {
StatsSetBadPackets(bad);
StatsSetGoodPackets(good);
good++;
// Uart_Printf("good: %d, bad %d:\n ", good, bad);
// _putHex(_radRCVBuffer[4]);
// for (i=0; i<=_radRCVBuffer[4]; i++) {
// _putHex(_radRCVBuffer[5+i]);
// }
// Uart_Printf("\n");
return true;
}
} void RadPrintStats(void) {
Uart_Printf("STATS good: %d, bad: %d\n", good, bad);
} // void _RadSetupRxDma( void )
// does all the register twiddling to setup and enable Radio->ARM DMA transfer
static void _RadSetupRxDma( void )
{ #ifdef DEBUG_BUFFER
debug_buffer(121);
#endif
// --------------- ENTERING NON-INTERRUPTABLE CODE -----------------
OS_ENTER_CRITICAL();
// ensure that the DMA interrupt is clear and enabled
INTPND = ~INT_DMA0; // clear any DMA0 pending interrupt
INTMSK |= INT_DMA0; // activate the DMA0 interrupt
// reset DMA/SIO for receive operation
DMASRC0 = (SFR_BASE + 0x6002);
DMADST0 = (uint32_t)_radRCVBuffer;
DMACNT0 = RAD_RCV_DMA_BYTE_COUNT;
DMACON0 = DMACON_SOURCE_SIO_TIMER |
DMACON_SRC_ADDRESS_FIX |
DMACON_DST_ADDRESS_INCREASE |
DMACON_STOP_INT_ENABLE |
DMACON_SINGLE_MODE |
DMACON_8_BITS |
DMACON_RUN_ENABLE;
// setup SIO operation
// SIO0 Configuration : Mode=DMA1, Auto run, Rising edge, Rx/Tx mode, MSB,
Internal clk
SIOCON0 = SIOCON_MODE_DMA0_REQUEST |
SIOCON_FALLING_EDGE_CLOCK |
SIOCON_RCV_MODE |
SIOCON_MSB_MODE |
SIOCON_CLOCK_EXTERNAL;
// enable SIO again
SIOCON0 |= SIOCON_CLEAR_AND_START;
_radioRXEnabledFlag = true;
// OS_EXIT_CRITICAL();
// ------------ EXITING NON-INTERRUPTABLE CODE --------------------
} // void _RadSetupTxDma( void )
// does all the register twiddling to setup and enable ARM->Radio DMA transfer
static void _RadSetupTxDma( void ) {
#ifdef DEBUG_BUFFER
debug_buffer(122);
#endif
// --------------- ENTERING NON-INTERRUPTABLE CODE -----------------
OS_ENTER_CRITICAL();
// sets up DMA/SIO for transmit
DMASRC0 = (uint32_t)_radTXBuffer;
DMADST0 = (SFR_BASE + 0x6002); // SIODAT0
DMACNT0 = RAD_TX_DMA_BYTE_COUNT;
DMACON0 = DMACON_SOURCE_SIO_TIMER |
DMACON_SRC_ADDRESS_INCREASE |
DMACON_DST_ADDRESS_FIX |
DMACON_STOP_INT_ENABLE |
DMACON_SINGLE_MODE |
DMACON_8_BITS |
DMACON_RUN_ENABLE;
// SIO0 Configuration : Mode=DMA0, Auto run, Rising edge, Rx/Tx mode, MSB,
External clk
SIOCON0 = SIOCON_MODE_DMA0_REQUEST |
SIOCON_FALLING_EDGE_CLOCK |
SIOCON_RCV_XMT_MODE |
SIOCON_MSB_MODE |
SIOCON_CLOCK_EXTERNAL;
// activate SIO
SIOCON0 |= SIOCON_CLEAR_AND_START;
// alert radio via interrupt that we are ready to send data
RAD_SIGNAL_TXPKT();
RAD_SET_INTERRUPT();
OS_EXIT_CRITICAL();
// ------------ EXITING NON-INTERRUPTABLE CODE --------------------
}
// void _RadBusyISR( void )
// This function should be installed as the interrupt handler for external
interrupt 1 (EINT1)
// On a rising edge, this function sets the _radioBusyFlag to true, and on a
falling
// edge, it sets it to false
void _RadBusyISR( void )
{
#ifdef DEBUG_BUFFER
debug_buffer(123);
#endif
INTPND = ~EINT1;
if (RAD_BUSY_PIN_SET())
{
// _radioBusyFlag = true;
MACStopTimer();
}
else
{
// _radioBusyFlag = false;
MACStartTimer();
}
10
2
} // void _RadDMADoneISR( void )
// This function should be installed as the DMA
void _RadDMADoneISR( void )
{ #ifdef DEBUG_BUFFER
debug_buffer(124);
#endif
INTPND = ~INT_DMA0;
if (!_radioTXModeFlag)
{
// we are recieving... unblock the radio task
// OSTaskResume(RAD_RCV_TASK_ID);
OSSemPost(dmaDoneSem);
}
else
{
// we are transmitting... set the finished flag
_radioDmaTxDone = true;
}
} // void RadSleep( void )
// This function puts the radio to sleep if it is not already asleep, otherwise it
does
// nothing
void RadSleep( void )
{ uint32_t delay = RAD_TIMEOUT;
#ifdef DEBUG_BUFFER
debug_buffer(125);
#endif
if (!_radioAsleepFlag)
{
RAD_SIGNAL_SLEEP();
// signal an interrupt
RAD_SET_INTERRUPT();
while (!INTERRUPT_ACK() && delay)
{
delay--;
}
// release the interrupt line
RAD_UNSET_INTERRUPT();
_radioAsleepFlag = true;
}
} // void RadWakeUp( void )
// This function asserts the wakeup interrupt to the radio. If the radio is
already awake,
// this will do nothing
void RadWakeUp( void )
{ // uint32_t delay = RAD_TIMEOUT;
#ifdef DEBUG_BUFFER
debug_buffer(126);
#endif
RAD_SIGNAL_WAKEUP();
// signal an interrupt
RAD_SET_INTERRUPT();
while (!INTERRUPT_ACK());
RAD_UNSET_INTERRUPT();
_radioAsleepFlag = false;
OSTimeDly(4);
}
rtc.
h
// File: rtc.h
// Description: support for the hardware Real Time Clock
// Author(s): Paul Pham <[email protected]>, Robert Poor <[email protected]>
//
// Copyright 2001 by the Massachusetts Institute of Technology. All
// rights reserved.
//
// This MIT Media Laboratory project was sponsored by the Defense
// Advanced Research Projects Agency, Grant No. MOA972-99-1-0012. The
// content of the information does not necessarily reflect the
// position or the policy of the Government, and no official
// endorsement should be inferred.
//
// For general public use.
//
// This distribution is approved by Walter Bender, Director of the
// Media Laboratory, MIT. Permission to use, copy, or modify this
// software and its documentation for educational and research
// purposes only and without fee is hereby granted, provided that this
// copyright notice and the original authors' names appear on all
// copies and supporting documentation. If individual files are
// separated from this distribution directory structure, this
// copyright notice must be included. For any other uses of this
// software, in original or modified form, including but not limited
// to distribution in whole or in part, specific prior permission must
// be obtained from MIT. These programs shall not be used, rewritten,
// or adapted as the basis of a commercial software or hardware
// product without first obtaining appropriate licenses from MIT. MIT
// makes no representations about the suitability of this software for
// any purpose. It is provided "as is" without express or implied
// warranty.
#ifndef RTC_H
#define RTC_H
// file: rtc.h
//
// Access to the system's real time clock. We don't need to keep time
// beyond one hour, so we ignore the higher order fields.
#include "types.h"
typedef uint32_t rtc_t;
// rtc_t encodes time as s + (60 * (m + (60 * h)))
#define MAKE_TIME(h, m, s) ((h * 3600) + (m + 60) + s)
#define RTC_EPOCH MAKE_TIME(24, 0, 0)
// maximum time (exclusive) recorded by the system
#define RTC_HALF_EPOCH MAKE_TIME(12, 0, 0)
// half of the maximum time recorded by the system
void RTCInit(void);
// called once when the system boots up
void RTCReset(void);
// called on system restarts/wakeups

10
3
void RTCStart(void);
// called to start the LED blinking thread for sync stuff
rtc_t RTCGetTime(void);
// fetch the current time
void RTCSetTime(rtc_t t);
// set the RTC from the given time value
void RTCSetAlarmTime(rtc_t t);
// set the RTC Alarm for the given time value
void RTCAdvanceTime(rtc_t delta);
void RTCRetardTime(rtc_t delta);
// advance or retard the real time clock by delta
#endif
seri
al.h
#ifndef SERIAL_H
#define SERIAL_H
#include "pseg.h"
// Exported functions
void SerialInit( void );
void SerialReset( void );
void SerialStart( void );
// Sets the neighbor list
void SerialServiceNeighborReport(pseg_t *seg);
// Reports on the strength of a neighbor
void SerialServiceNeighborLinkReport(pseg_t *seg);
void SerialServiceBootReport(pseg_t *seg);
// When we receive an ack
void SerialServiceAck(pseg_t *seg);
// Used to determine if we're in doctor mode or gateway mode
bool SerialGatewayMode( void );
bool SerialDoctorMode( void );
void SerialCheckSync(pseg_t *pkt);
void SerialStartInGateway( void );
#endif
seri
al.c
// File: serial.c
// Description: Drops into special modes for serial interfacing
// Author(s): Paul Covell <[email protected]>
// Andrew Wheeler <[email protected]>
//
// Copyright 2001 by the Massachusetts Institute of Technology. All
// rights reserved.
//
// This MIT Media Laboratory project was sponsored by the Defense
// Advanced Research Projects Agency, Grant No. MOA972-99-1-0012. The
// content of the information does not necessarily reflect the
// position or the policy of the Government, and no official
// endorsement should be inferred.
//
// For general public use.
//
// This distribution is approved by Walter Bender, Director of the
// Media Laboratory, MIT. Permission to use, copy, or modify this
// software and its documentation for educational and research
// purposes only and without fee is hereby granted, provided that this
// copyright notice and the original authors' names appear on all
// copies and supporting documentation. If individual files are
// separated from this distribution directory structure, this
// copyright notice must be included. For any other uses of this
// software, in original or modified form, including but not limited
// to distribution in whole or in part, specific prior permission must
// be obtained from MIT. These programs shall not be used, rewritten,
// or adapted as the basis of a commercial software or hardware
// product without first obtaining appropriate licenses from MIT. MIT
// makes no representations about the suitability of this software for
// any purpose. It is provided "as is" without express or implied
// warranty.
#include <ctype.h>
#include <stdlib.h>
// #define PC_DEBUG // define this when running on a PC and want to debug menuing
#include "serial.h"
#ifndef PC_DEBUG
#include <stdio.h>
#include <util.h> // Provides serial handling headers
#include <ping.h> // Provides segment types
#include "mac.h"
#include "node_id.h"
#include "param.h"
#include "pseg.h"
#include "tephra.h"
#include "types.h"
#include "vector.h"
#include "includes.h"
#include "os_cfg.h" // Keep ucos_ii.h happy
#include "ucos_ii.h" // Provides OSTimeGet(), OSTimeDly()
#include "arq.h"
#include "grad.h"
#include "sync.h"
#include "ping.h"
#include "appr.h"
#include "sysmanager.h"
#include "boottest.h"
#endif
#ifdef PC_DEBUG
#include <sys/types.h>
#include <poll.h>
#include <unistd.h>
#include <stdio.h>
#include <stdlib.h>
typedef int uint8_t;

10
4
typedef int node_id;
#define BROADCAST_ID 0xFF
#endif
#ifdef PC_DEBUG
#define SENDSTRING(s) fprintf(stdout, s); fflush(stdout)
#else
#define SENDSTRING(s) Uart_SendString(s)
#endif
// stack for the serial task
static unsigned int _serialStack[SER_RCV_TASK_STACK_SIZE];
static pseg_t *queuedPkt;
static bool waitOnPkt;
static bool printSync;
static bool syncFlood;
static node_id _targetNode;
static uint8_t _serialState; // Used to store the current state machine state
static void _SerialTask(void *args);
uint8_t _fromHex(char c);
uint8_t _receiveLinkRequestInfo(pseg_t *pkt, char inCh, int reset);
uint8_t _receiveParamSetInfo(pseg_t *pkt, char inCh, int reset);
uint8_t _receiveSyncInfo(pseg_t *pkt, char inCh, int reset);
uint8_t _theRightATOI(const char *);
void _wakeupSerial(void);
void _sendOperationOnPacket(node_id targetNode);
void _sendEnterTestPkt(node_id targetNode);
void _sendExitTestPkt(node_id targetNode);
// ================================================================
#define BAUD_RATE 19200
#define WAIT_KEYPRESS 0
#define ENTER_GATEWAY 1
#define ENTER_DOCTOR 2
#define ENTER_BEACON 3
#define DOCTOR_MAIN 16
#define EXIT_DOCTOR 17
#define BEACON_MAIN 20
#define GATEWAY_MAIN 128
//--
// Description: Initializes the serial thread for the first time.
//--
void SerialInit()
{ #ifdef DEBUG_BUFFER
debug_buffer(139);
#endif
ISR_URX = (uint32_t)_wakeupSerial;
INTPND = ~INT_URX;
INTMSK |= INT_URX; // activate serial interrupt
queuedPkt = NULL;
waitOnPkt = false;
_targetNode = BROADCAST_ID;
printSync = false;
syncFlood = false;
_serialState = WAIT_KEYPRESS;
}
//--
// Description: Resets the serial thread, called before serialStart()
//--
void SerialReset()
{
#ifdef DEBUG_BUFFER
debug_buffer(140);
#endif
//#ifndef PC_DEBUG
Uart_Init(TEPHRA_BAUD_RATE);
//#endif
printSync = false;
queuedPkt = NULL;
waitOnPkt = false;
syncFlood = false;
_targetNode = BROADCAST_ID;
_serialState = WAIT_KEYPRESS;
}
void SerialStartInGateway() {
_serialState = GATEWAY_MAIN;
AppRSetIsPrinting(TRUE);
SysSetGatewayMode(true);
}
//--
// Description: Runs a thread that blocks until serial input is received,
// at which time it may change the operating mode of the processor. This
// thread should not be killed unless <Doctor Mode> is off AND
// <Gateway Mode> is off.
//--
void SerialStart()
{
#ifdef DEBUG_BUFFER
debug_buffer(141);
#endif
// Initialize state
OSTaskCreate(_SerialTask, NULL,
(void *)&_serialStack[SER_RCV_TASK_STACK_SIZE-1],
SER_RCV_TASK_ID);
}
/*-- Begin definitions for functionality --*/
#define DOCTOR_KEY 'D'
#define GATEWAY_KEY 'G'
#define BEACON_KEY 'B'
static node_id _neighborList[PING_MAX_NEIGHBORS]; // List of neighbors of target
static uint8_t _updateInProgress; // Receiving input from the packet handler?
volatile static uint8_t _serialChar; // last character
#define REDRAW_SCREEN 0
#define NO_REDRAW_SCREEN 1
#define PROMPT_SET_TARGET "\n\rSet target node to: "
#define PROMPT_SET_GATEWAY_NODE "\n\rSet gateway node to: "
#define PROMPT_SET_NEIGHBOR_NODE "\n\rRequest strength on node: "
10
5
#define INFO_CHECK_ALL_NEIGHBOR_STRENGTH "\n\rCollecting link strength from all
neighbors to target node..\n\r"
// Format: [nnn | s-ping | r-ping | s-pong | r-pong]
#define INFO_CHECK_ALL_NEIGHBOR_FORMAT "\n\r[nid | spi | rpi | spo | rpo ]\n\r"
#define INFO_SET_TARGET_NODE "\n\rTarget node set.\n\r"
#define INFO_SET_GATEWAY_NODE "\n\rGateway node set.\n\r"
#define INFO_SET_NEIGHBOR_NODE "\n\rNeighbor node set.\n\r"
#define INFO_OPERATIONAL_MODE "\n\rTarget node set operational.\n\rNOTE: It will
now sleep. Play accordingly.\n\r"
#define INFO_COLLECT_NEIGHBORS "\n\rCollecting neighbors from target node..\n\r"
#define INFO_COLLECT_NEIGHBORS_DONE "\n\rNeighbor collection completed.\n\r"
#define ERROR_TARGET_NODE_NOT_SET "\n\r**Target node not set. Set target node
first.\n\r"
#define ERROR_NEIGHBOR_STRENGTH_TIMEOUT "**Timeout receiving node strength**\n\r"
#define ERROR_COLLECT_NEIGHBORS_TIMEOUT "**Timeout receiving node neighbors**\n\r"
#define ERROR_DOCTOR_NO_OPERATIONAL "**Can't set the doctor to operational
mode**\n\r"
#define ERROR_NODE_SELF "**Can't execute this operation ON the same node you're
using!**\n\r"
void _process_gateway_input(void);
void _print_doctor_screen(void);
uint8_t _process_doctor_keypress(void);
void _updateStarted(void);
void _updateFinished(void);
void _SerialTask(void *args)
{ char inCh;
#ifdef PC_DEBUG
Uart_Printf("Starting main serial loop.\n\r");
#endif
while (true)
{
#ifdef DEBUG_BUFFER
debug_buffer(142);
#endif
// Delay every time through the loop for 20ms -- good? bad?
switch(_serialState)
{
case WAIT_KEYPRESS:
// block until receive key
OSTaskSuspend(OS_PRIO_SELF);
#ifdef DEBUG_BUFFER
debug_buffer(219);
#endif
inCh = _serialChar;
if (inCh == DOCTOR_KEY)
{
_serialState = ENTER_DOCTOR;
}
else if(inCh == GATEWAY_KEY)
{
_serialState = ENTER_GATEWAY;
}
else if (inCh == BEACON_KEY)
{
_serialState = ENTER_BEACON;
}
// else do nothing
break;
case ENTER_DOCTOR:
// set doctor flags XXX
#ifdef PC_DEBUG
Uart_Printf("Entering doctor main\n\r");
#endif
_print_doctor_screen();
_updateInProgress = 0;
SysSetDoctorMode(true);
_serialState = DOCTOR_MAIN;
break;
case ENTER_GATEWAY:
Uart_Printf("Entering Gateway Mode\n");
AppRSetIsPrinting(TRUE);
SysSetGatewayMode(true);
_serialState = GATEWAY_MAIN;
break;
case ENTER_BEACON:
Uart_Printf("Beacon Mode activated, searching for devices...\n");
SysSetTestMode(true);
PingStartBeaconMode();
_serialState = BEACON_MAIN;
break;
case DOCTOR_MAIN:
// 1. display the interface screen
// 2. wait for menu command / watch for incoming data
// 3. act on menu command / act on incoming data
if(_process_doctor_keypress() == REDRAW_SCREEN)
{
_print_doctor_screen();
}
break;
case EXIT_DOCTOR:
SysSetDoctorMode(false);
_serialState = WAIT_KEYPRESS;
break;
case BEACON_MAIN:
// spin here indefinitely
OSTaskSuspend(OS_PRIO_SELF);
break;
case GATEWAY_MAIN:
// 1. wait for data from base station to retransmit
// 2. incoming network data is handled by Rob's code in the
// lower network layer.
_process_gateway_input();
break;
default:
_serialState = WAIT_KEYPRESS;
break;
}
}
}

10
6
void _wakeupSerial(void)
{ INTPND = ~INT_URX;
_serialChar = URXH;
OSTaskResume(SER_RCV_TASK_ID);
} #define KEY_SET_TARGET_NODE 'T'
#define KEY_COLLECT_NEIGHBORS 'C'
#define KEY_OPERATIONAL_MODE 'O'
#define KEY_CHECK_NEIGHBOR_STRENGTH 'S'
#define KEY_SET_GATEWAY 'G'
#define KEY_CHECK_ALL_NEIGHBOR_STRENGTH 'A'
#define KEY_EXIT_DOCTOR_MODE 'E'
#define KEY_ENTER_TEST 'X'
#define KEY_EXIT_TEST 'Y'
#define KEY_START_ASYNC 'D'
#define KEY_STOP_ASYNC 'F'
#define KEY_CHECK_NODE 'H'
#define KEY_UPDATE_PARAMS 'P'
#define KEY_SYNC_FLOOD 'Z'
#define KEY_TOOGLE_SYNC_INFO 'I'
#define KEY_REDRAW_SCREEN 13 // Hit enter to redraw
//--
// Description: draws the interface screen using VT100 commands
// Preconditions: None.
// Postconditions: the screen contents have been sent via the uart
// Returns: None.
//--
void _print_doctor_screen()
{ #ifdef DEBUG_BUFFER
debug_buffer(143);
#endif
SENDSTRING("Doctor Main Menu\n\r");
SENDSTRING("\n\r");
SENDSTRING("[T]arget Node\n\r");
SENDSTRING("[C]ollect Neighbors\n\r");
SENDSTRING("[A]ll Neighbor Strength\n\r");
// SENDSTRING("[G]ateway Node Set\n\r");
SENDSTRING("[X] Enter Test Mode\n\r");
SENDSTRING("[Y] Exit Test Mode\n\r");
SENDSTRING("[D] Start Async Ping\n\r");
SENDSTRING("[F] Stop Async Ping\n\r");
SENDSTRING("[H] Check Node Existance\n\r");
SENDSTRING("[P] Update Params\n\r");
SENDSTRING("[Z] Sync Flood\n\r");
SENDSTRING("[I] Toggle Sync Info\n\r");
// SENDSTRING("[O]perational Mode\n\r");
SENDSTRING("[S]pecific Neighbor Strength\n\r");
SENDSTRING("\n\r");
SENDSTRING("[E]xit Doctor Mode\n\r");
SENDSTRING("\n\r>");
} //--
// Descriptin: If a key is pressed, handle the key
// Preconditions: None.
// Postconditions: Keypress [if any] is handled properly
// Returns: 0 if screen should be redrawn; 1 if it should not be
//--
#define INPUT_STATE 0
#define COLLECT_NEIGHBORS 2
#define CHECK_NEIGHBOR_STRENGTH 3
#define CHECK_ALL_NEIGHBOR_STRENGTH 4
#define SET_TARGET_NODE 5
#define SET_NEIGHBOR_NODE 6
#define SET_GATEWAY_NODE 7
// Timeouts
#define TIMEOUT_CHECK_DELAY .5*OS_TICKS_PER_SEC // Wait for 1/2 sec before
checking; in 5ms ticks
#define RECEIVE_TIMEOUT 60*OS_TICKS_PER_SEC // Timeout in 60 seconds; in 5ms
ticks
uint8_t _process_doctor_keypress()
{
static uint8_t _keypressState = INPUT_STATE;
static char _tempString[4];
static uint8_t _stringPos = 0;
static uint32_t _timerStart; // used for timeouts for receiving packets
uint8_t neighborNode = BROADCAST_ID; // Used by check neighbor
uint8_t retVal = NO_REDRAW_SCREEN;
uint8_t i;
char inCh;
#ifdef PC_DEBUG
// Setup polling
struct pollfd pfd;
pfd.fd = STDIN_FILENO;
pfd.events = POLLIN;
#endif
#ifdef DEBUG_BUFFER
debug_buffer(144);
#endif
#ifdef PC_DEBUG
if(poll(&pfd, 1, 1) > 0) // poll for 1ms
#else
OSTaskSuspend(OS_PRIO_SELF);
if((inCh = _serialChar) > 0)
#endif
{
#ifdef PC_DEBUG
read(STDIN_FILENO, &inCh, 1);
//printf("Read '%c'\n\r", inCh);
#endif
switch(_keypressState)
{
case INPUT_STATE:
switch(inCh)
{
case KEY_SET_TARGET_NODE:
SENDSTRING(PROMPT_SET_TARGET);
retVal = NO_REDRAW_SCREEN;
_stringPos = 0;
_keypressState = SET_TARGET_NODE;
10
7
break;
case KEY_COLLECT_NEIGHBORS:
SENDSTRING(INFO_COLLECT_NEIGHBORS);
if(_targetNode == BROADCAST_ID)
{
SENDSTRING(ERROR_TARGET_NODE_NOT_SET);
}
else
{
// 1. Request neighbor nodes from target
// 2. Wait for neighbor nodes to be returned [with timeout]
// 3. Print out neighbor nodes
if(_targetNode == NodeGetID())
{
// Fake a packet to self if we're the target node
pseg_t *gradSeg = GRAdMakePkt(NULL, NodeGetID());
PingServiceNeighborsRequest(NULL, gradSeg);
PSegFree(gradSeg);
}
else
{
PingRequestNeighbors(_targetNode);
}
//OSTaskSuspend(OS_PRIO_SELF);
// Wait for status update to finish [with timeout]
_updateStarted();
_timerStart = OSTimeGet();
while(_updateInProgress == 1)
{
OSTimeDly(TIMEOUT_CHECK_DELAY);
if(OSTimeGet() - _timerStart > RECEIVE_TIMEOUT)
{
SENDSTRING(ERROR_COLLECT_NEIGHBORS_TIMEOUT);
break;
}
}
// Done
SENDSTRING(INFO_COLLECT_NEIGHBORS_DONE);
}
retVal = REDRAW_SCREEN;
break;
case KEY_SET_GATEWAY:
SENDSTRING(PROMPT_SET_GATEWAY_NODE);
retVal = NO_REDRAW_SCREEN;
_stringPos = 0;
_keypressState = SET_GATEWAY_NODE;
break;
case KEY_OPERATIONAL_MODE:
if(_targetNode == BROADCAST_ID)
{
SENDSTRING(ERROR_TARGET_NODE_NOT_SET);
retVal = REDRAW_SCREEN;
}
else
{
if(_targetNode == NodeGetID())
{
// can't put the doctor in operational mode
SENDSTRING(ERROR_DOCTOR_NO_OPERATIONAL);
}
else
{
_sendOperationOnPacket(_targetNode);
SENDSTRING(INFO_OPERATIONAL_MODE);
}
retVal = REDRAW_SCREEN;
}
break;
case KEY_ENTER_TEST:
if(_targetNode == BROADCAST_ID)
{
SENDSTRING(ERROR_TARGET_NODE_NOT_SET);
retVal = REDRAW_SCREEN;
}
else
{
if(_targetNode == NodeGetID())
{
// can't put the doctor in operational mode
SENDSTRING(ERROR_DOCTOR_NO_OPERATIONAL);
}
else
{
_sendEnterTestPkt(_targetNode);
//SENDSTRING(INFO_OPERATIONAL_MODE);
}
retVal = REDRAW_SCREEN;
}
break;
case KEY_EXIT_TEST:
if(_targetNode == BROADCAST_ID) {
SENDSTRING(ERROR_TARGET_NODE_NOT_SET);
retVal = REDRAW_SCREEN;
} else {
if(_targetNode == NodeGetID()) {
// can't put the doctor in operational mode
SENDSTRING(ERROR_DOCTOR_NO_OPERATIONAL);
} else {
_sendExitTestPkt(_targetNode);
//SENDSTRING(INFO_OPERATIONAL_MODE);
}
retVal = REDRAW_SCREEN;
}
break;
case KEY_START_ASYNC:
if(_targetNode == BROADCAST_ID) {
SENDSTRING(ERROR_TARGET_NODE_NOT_SET);
retVal = REDRAW_SCREEN;
} else {
if(_targetNode == NodeGetID()) {
// can't put the doctor in operational mode
SENDSTRING(ERROR_DOCTOR_NO_OPERATIONAL);
} else {
queuedPkt = PSegAlloc(PSEG_TYPE_START_ASYNC,
sizeof(dummyPayload), NULL);
queuedPkt = ARQMakeARQ(GRAdMakePkt(queuedPkt, _targetNode));
waitOnPkt = true;
10
8
}
retVal = REDRAW_SCREEN;
}
break;
case KEY_STOP_ASYNC:
if(_targetNode == BROADCAST_ID) {
SENDSTRING(ERROR_TARGET_NODE_NOT_SET);
retVal = REDRAW_SCREEN;
} else {
if(_targetNode == NodeGetID()) {
// can't put the doctor in operational mode
SENDSTRING(ERROR_DOCTOR_NO_OPERATIONAL);
} else {
queuedPkt = PSegAlloc(PSEG_TYPE_STOP_ASYNC,
sizeof(dummyPayload), NULL);
queuedPkt = ARQMakeARQ(GRAdMakePkt(queuedPkt, _targetNode));
waitOnPkt = true;
}
retVal = REDRAW_SCREEN;
}
break;
case KEY_UPDATE_PARAMS:
if(_targetNode == BROADCAST_ID) {
SENDSTRING(ERROR_TARGET_NODE_NOT_SET);
retVal = REDRAW_SCREEN;
} else {
if(_targetNode == NodeGetID()) {
// can't put the doctor in operational mode
SENDSTRING(ERROR_DOCTOR_NO_OPERATIONAL);
} else {
paramPayload *pp;
queuedPkt = PSegAlloc(PSEG_TYPE_PARAM_SET, sizeof(paramPayload),
NULL);
// hacking- just putting in hardcode now
pp = PSegPayload(queuedPkt);
pp->fParams[PARAM_ARQ_DELAY] = 8;
pp->fParams[PARAM_ARQ_RETRY] = 6;
pp->fParams[PARAM_COST_TTL] = 180;
pp->fParams[PARAM_AWAKE_TIME] = 90;
pp->fParams[PARAM_SLEEP_TIME] = 510;
pp->fMask = (1<<PARAM_ARQ_DELAY) | (1<<PARAM_ARQ_RETRY) |
(1<<PARAM_COST_TTL) |
(1<<PARAM_AWAKE_TIME) | (1<<PARAM_SLEEP_TIME);
queuedPkt = ARQMakeARQ(GRAdMakePkt(queuedPkt, _targetNode));
waitOnPkt = true;
Uart_Printf("sending update params\n");
}
retVal = REDRAW_SCREEN;
}
break;
case KEY_SYNC_FLOOD:
// sync flood- wait for ping packet from the node and then send lots
of syncs
syncFlood = true;
waitOnPkt = true;
Uart_Printf("preparing for sync flood\n");
retVal = REDRAW_SCREEN;
break;
case KEY_TOOGLE_SYNC_INFO:
// sets a flag that causes current node sync info to be printed
if (printSync) {
Uart_Printf("turning off sync printing\n");
} else {
Uart_Printf("turning on sync printing\n");
}
printSync = !printSync;
waitOnPkt = true;
retVal = REDRAW_SCREEN;
break;
case KEY_CHECK_NODE:
if(_targetNode == BROADCAST_ID) {
SENDSTRING(ERROR_TARGET_NODE_NOT_SET);
retVal = REDRAW_SCREEN;
} else {
if(_targetNode == NodeGetID()) {
// can't put the doctor in operational mode
SENDSTRING(ERROR_DOCTOR_NO_OPERATIONAL);
} else {
waitOnPkt = true;
}
retVal = REDRAW_SCREEN;
}
break;
case KEY_CHECK_NEIGHBOR_STRENGTH:
if(_targetNode == BROADCAST_ID)
{
SENDSTRING(ERROR_TARGET_NODE_NOT_SET);
retVal = REDRAW_SCREEN;
}
else
{
SENDSTRING(PROMPT_SET_NEIGHBOR_NODE);
retVal = NO_REDRAW_SCREEN;
_stringPos = 0;
_keypressState = SET_NEIGHBOR_NODE;
}
break;
case KEY_CHECK_ALL_NEIGHBOR_STRENGTH:
if(_targetNode == BROADCAST_ID)
{
SENDSTRING(ERROR_TARGET_NODE_NOT_SET);
}
else
{
SENDSTRING(INFO_CHECK_ALL_NEIGHBOR_STRENGTH);
// For each entry in the neighbors list, ask for the strength
// and report it.
// Format: [nnn | s-ping | r-ping | s-pong | r-pong]
SENDSTRING(INFO_CHECK_ALL_NEIGHBOR_FORMAT);
for(i = 0;
_neighborList[i] != BROADCAST_ID && i < PING_MAX_NEIGHBORS;
i++)
{
//--
// 1. Request link strength
10
9
// 2. Wait for link data to come back [with timeout]
// 3. Print out link data
if(_targetNode == NodeGetID())
{
// fake a link request packet
pseg_t *linkPkt = PSegAlloc(PSEG_TYPE_LINK_REQUEST,
sizeof(linkRequestPayload),
NULL);
pseg_t *gradSeg = GRAdMakePkt(NULL, NodeGetID());
((linkRequestPayload *)PSegPayload(linkPkt))-
>fNeighbor = _neighborList[i];
PingServiceLinkRequest(gradSeg, linkPkt);
PSegFree(linkPkt);
PSegFree(gradSeg);
}
else
{
PingRequestLinkTest(_targetNode, _neighborList[i]);
}
// Wait for status update to finish [with timeout]
_updateStarted();
_timerStart = OSTimeGet();
while(_updateInProgress == 1)
{
OSTimeDly(TIMEOUT_CHECK_DELAY);
if(OSTimeGet() - _timerStart > RECEIVE_TIMEOUT)
{
SENDSTRING(ERROR_NEIGHBOR_STRENGTH_TIMEOUT);
break;
}
}
// Done
//--
}
}
retVal = REDRAW_SCREEN;
break;
case KEY_REDRAW_SCREEN:
retVal = REDRAW_SCREEN;
break;
case KEY_EXIT_DOCTOR_MODE:
_serialState = EXIT_DOCTOR;
retVal = NO_REDRAW_SCREEN;
break;
default:
break;
}
break;
case SET_TARGET_NODE:
if(inCh == 13 || _stringPos == 4)
{
_targetNode = _theRightATOI(_tempString);
SENDSTRING(INFO_SET_TARGET_NODE);
#ifdef PC_DEBUG
Uart_Printf("Set node to: %d\n\r", _targetNode);
#endif
_keypressState = INPUT_STATE;
retVal = REDRAW_SCREEN;
}
else
{
_tempString[_stringPos++] = inCh;
_tempString[_stringPos] = 0; // auto-terminate
#ifdef PC_DEBUG
Uart_Printf("%c", inCh);
#else
Uart_SendByte(inCh);
#endif
retVal = NO_REDRAW_SCREEN;
}
break;
case SET_GATEWAY_NODE:
if(inCh == 13 || _stringPos == 4)
{
if(_targetNode == NodeGetID())
{
ParamSet(PARAM_BASESTATION_ADDR, _theRightATOI(_tempString));
}
else
{
char buffer[100];
pseg_t *pkt = ParamPktAlloc();
ParamPktSet(pkt, PARAM_BASESTATION_ADDR,
_theRightATOI(_tempString));
pkt = ARQMakeARQ(GRAdMakePkt(pkt, _targetNode));
// ARQ is the current seg type
sprintf(buffer, "Sending packet with ARQ reference %2d\n\r",
((arqPayload *)PSegPayload(pkt))->fReference);
SENDSTRING(buffer);
MACXmitPkt(pkt);
}
SENDSTRING(INFO_SET_GATEWAY_NODE);
#ifdef PC_DEBUG
Uart_Printf("Set node to: %d\n\r", _targetNode);
#endif
_keypressState = INPUT_STATE;
retVal = REDRAW_SCREEN;
}
else
{
_tempString[_stringPos++] = inCh;
_tempString[_stringPos] = 0; // auto-terminate
#ifdef PC_DEBUG
Uart_Printf("%c", inCh);
#else
11
0
Uart_SendByte(inCh);
#endif
retVal = NO_REDRAW_SCREEN;
}
break;
case SET_NEIGHBOR_NODE:
if(inCh == 13 || _stringPos == 4)
{
neighborNode = _theRightATOI(_tempString);
SENDSTRING(INFO_SET_NEIGHBOR_NODE);
#ifdef PC_DEBUG
Uart_Printf("Set node to: %d\n\r", neighborNode);
#endif
//--
// 1. Request link strength
// 2. Wait for link data to come back [with timeout]
// 3. Print out link data
if(_targetNode == NodeGetID())
{
// fake a link request packet
pseg_t *linkPkt = PSegAlloc(PSEG_TYPE_LINK_REQUEST,
sizeof(linkRequestPayload),
NULL);
pseg_t *gradSeg = GRAdMakePkt(NULL, NodeGetID());
((linkRequestPayload *)PSegPayload(linkPkt))->fNeighbor =
_neighborList[i];
PingServiceLinkRequest(gradSeg, linkPkt);
PSegFree(linkPkt);
PSegFree(gradSeg);
}
else
{
PingRequestLinkTest(_targetNode, neighborNode);
}
// Wait for status update to finish [with timeout]
_updateStarted();
_timerStart = OSTimeGet();
while(_updateInProgress == 1)
{
OSTimeDly(TIMEOUT_CHECK_DELAY);
if(OSTimeGet() - _timerStart > RECEIVE_TIMEOUT)
{
SENDSTRING(ERROR_NEIGHBOR_STRENGTH_TIMEOUT);
break;
}
}
// Done
//--
_keypressState = INPUT_STATE;
retVal = REDRAW_SCREEN;
}
else
{
_tempString[_stringPos++] = inCh;
_tempString[_stringPos] = 0;
#ifdef PC_DEBUG
Uart_Printf("%c", inCh);
#else
Uart_SendByte(inCh);
#endif
retVal = NO_REDRAW_SCREEN;
}
break;
default:
break;
}
}
return(retVal);
}
#define WAIT_PACKET 0
#define RECV_PACKET_TYPE 1
#define RECV_TARGET_HI 2
#define RECV_TARGET_LO 3
#define RECV_SYNC_INFO 4
#define RECV_LINK_REQUEST_INFO 5
#define RECV_PARAM_SET_INFO 6
//--
// Description: handles input from the base station
// Preconditions: none
// Postconditions: data is handled as received
// Returns: none
//--
void _process_gateway_input()
{
static uint8_t _gatewayState;
static pseg_t *curPkt = NULL;
static pseg_type packetType;
static node_id destination;
int error;
char inCh;
#ifdef PC_DEBUG
// Setup polling
struct pollfd pfd;
pfd.fd = STDIN_FILENO;
pfd.events = POLLIN;
#endif
#ifdef DEBUG_BUFFER
debug_buffer(145);
#endif
#ifdef PC_DEBUG
if(poll(&pfd, 1, 1) > 0) // poll for 1ms
#else
OSTaskSuspend(OS_PRIO_SELF);
if((inCh = _serialChar) > 0)
#endif
{
#ifdef PC_DEBUG
read(STDIN_FILENO, &inCh, 1);
#endif
11
1
error = 0;
switch(_gatewayState)
{
case WAIT_PACKET:
curPkt = NULL;
if(inCh == '0')
{
_gatewayState = RECV_PACKET_TYPE;
}
else if(inCh == '1')
{
curPkt = ARQMakeARQ(curPkt);
_gatewayState = RECV_PACKET_TYPE;
}
else
{
_gatewayState = WAIT_PACKET;
}
break;
case RECV_PACKET_TYPE:
switch(inCh)
{
case 'y':
packetType = PSEG_TYPE_SYNC;
break;
case 'n':
packetType = PSEG_TYPE_NEIGHBOR_REQUEST;
break;
case 'l':
packetType = PSEG_TYPE_LINK_REQUEST;
break;
case 'm':
packetType = PSEG_TYPE_PARAM_SET;
break;
case 'q':
packetType = PSEG_TYPE_PARAM_REQUEST;
break;
case 's':
packetType = PSEG_TYPE_STATS_REQUEST;
break;
case 't':
packetType = PSEG_TYPE_STATS_RESET;
break;
default:
error = 1;
break;
}
if (error) {
_gatewayState = WAIT_PACKET;
} else {
_gatewayState = RECV_TARGET_HI;
}
break;
case RECV_TARGET_HI:
destination = (_fromHex(inCh) << 4);
_gatewayState = RECV_TARGET_LO;
break;
case RECV_TARGET_LO:
destination |= _fromHex(inCh);
curPkt = GRAdMakePkt(curPkt, destination);
switch(packetType)
{
case PSEG_TYPE_SYNC:
curPkt = PSegAlloc(packetType, sizeof(syncPayload), curPkt);
_gatewayState = _receiveSyncInfo(curPkt, inCh, 1);
break;
case PSEG_TYPE_NEIGHBOR_REQUEST:
curPkt = PSegAlloc(packetType, sizeof(neighborsRequestPayload),
curPkt);
_gatewayState = WAIT_PACKET;
break;
case PSEG_TYPE_LINK_REQUEST:
curPkt = PSegAlloc(packetType, sizeof(linkRequestPayload), curPkt);
_gatewayState = _receiveLinkRequestInfo(curPkt, inCh, 1);
break;
case PSEG_TYPE_PARAM_SET:
curPkt = PSegAlloc(packetType, sizeof(paramPayload), curPkt);
_gatewayState = _receiveParamSetInfo(curPkt, inCh, 1);
break;
case PSEG_TYPE_PARAM_REQUEST:
curPkt = PSegAlloc(packetType, 1, curPkt);
_gatewayState = WAIT_PACKET;
break;
case PSEG_TYPE_STATS_REQUEST:
curPkt = PSegAlloc(packetType, 0, curPkt);
_gatewayState = WAIT_PACKET;
break;
case PSEG_TYPE_STATS_RESET:
curPkt = PSegAlloc(packetType, 0, curPkt);
_gatewayState = WAIT_PACKET;
break;
default:
_gatewayState = WAIT_PACKET;
break;
}
if(_gatewayState == WAIT_PACKET)
{
MACXmitPkt(curPkt);
curPkt = NULL;
}
break;
case RECV_SYNC_INFO:
_gatewayState = _receiveSyncInfo(curPkt, inCh, 0);
break;
case RECV_LINK_REQUEST_INFO:
_gatewayState = _receiveLinkRequestInfo(curPkt, inCh, 0);
break;
case RECV_PARAM_SET_INFO:
_gatewayState = _receiveParamSetInfo(curPkt, inCh, 0);
break;
default:
_gatewayState = WAIT_PACKET;
break;
}

11
2
}
} // Description: Called to notify the serial routine that its information
// is being updated.
void _updateStarted()
{ #ifdef DEBUG_BUFFER
debug_buffer(146);
#endif
_updateInProgress = 1;
} // Description: Called to notify the serial routine that its information
// is done being updated.
void _updateFinished()
{ #ifdef DEBUG_BUFFER
debug_buffer(147);
#endif
_updateInProgress = 0;
} // Description: add neighbors to the list and print out to uart
void SerialServiceNeighborReport(pseg_t *seg)
{ uint8_t i;
neighborsReportPayload *report = PSegPayload(seg);
char buffer[20]; // careful! string can only be 11 chars long in our use
#ifdef DEBUG_BUFFER
debug_buffer(148);
#endif
if(!SerialDoctorMode())
return;
_updateStarted();
// Fortunately, BROADCAST_ID is also used in this code to denote an
// unused entry.
for(i = 0; i < PING_MAX_NEIGHBORS; i++)
{
_neighborList[i] = report->fNeighbors[i];
// don't change this without checking the buffer length!
sprintf(buffer, "%d: %d ", i & 0xFF, report->fNeighbors[i] & 0xFF);
SENDSTRING(buffer);
}
SENDSTRING("\n\r");
_updateFinished();
} void SerialServiceBootReport(pseg_t *seg) {
bootPayload *bp = PSegPayload(seg);
if(!SerialDoctorMode())
return;
switch (bp->bootCode) {
case BOOT_BOOTING:
Uart_Printf("\n Node %d booting\n", bp->node);
break;
case BOOT_GOT_SYNC:
Uart_Printf("\n Node %d got sync\n", bp->node);
break;
case BOOT_STANDALONE:
Uart_Printf("\n Node %d forced standalone\n", bp->node);
break;
case BOOT_FOUNDNEIGHBOR:
Uart_Printf("\n Node %d found neighbor %d, running test\n", bp->node, bp-
>bootData);
break;
case BOOT_FINISHED:
Uart_Printf("\n Node %d exiting test mode\n", bp->node);
break;
default:
Uart_Printf("bad boot report\n");
break;
}
}
// Preconditions: seg is the acked packet
// Postconditions: the ack has been relayed, if doctor mode is on.
void SerialServiceAck(pseg_t *seg)
{
char buffer[100];
pseg_t *gradSeg = GRAdFindSegment(seg);
pseg_t *arqSeg = PSegFindType(seg, PSEG_TYPE_ARQ);
#ifdef DEBUG_BUFFER
debug_buffer(149);
#endif
if(!SerialDoctorMode())
return;
if(arqSeg == NULL)
return;
if(gradSeg != NULL)
{
sprintf(buffer, "Received ack for packet %2d to node %2d\n\r",
((arqPayload *)PSegPayload(arqSeg))->fReference,
((gradPayload *)PSegPayload(gradSeg))->fOriginator);
}
else
{
sprintf(buffer, "Received ack for packet %2d\n\r",
((arqPayload *)PSegPayload(arqSeg))->fReference);
}
SENDSTRING(buffer);
}
// Preconditions: none
// Postconditions: the link statistics for neighbor are printed to the uart and
// the received packet flag is set to true so that anyone watching can move on.
//
// Format: [nnn | s-ping | r-ping | s-pong | r-pong]
// Where nnn is the neighbor
// s-ping is the number of pings the target sent to the neighbor
// r-ping is the number of pings the neighbor received from the target
// s-pong is the number of pongs the neighbor sent to the target
// r-pong is the number of pongs the target received from the neighbor
//
11
3
void SerialServiceNeighborLinkReport(pseg_t *seg)
{ char buffer[40]; // 32 character long
linkState *sr = PSegPayload(seg);
#ifdef DEBUG_BUFFER
debug_buffer(150);
#endif
if(!SerialDoctorMode())
return;
_updateStarted();
// don't change this without checking the buffer length!
sprintf(buffer, "[%3d | %3d | %3d | %3d | %3d ]\n\r", sr->fNeighbor,
sr->fPingsSent, sr->fPingsRcvd,
sr->fPongsSent, sr->fPongsRcvd);
SENDSTRING(buffer);
_updateFinished();
} uint8_t _receiveSyncInfo(pseg_t *pkt, char inCh, int reset)
{ static uint8_t _i;
uint8_t retVal = RECV_SYNC_INFO;
syncPayload *sp = PSegPayload(pkt);
#ifdef DEBUG_BUFFER
debug_buffer(151);
#endif
if(reset == 1)
{
_i = 7;
sp->fXmitTime = 0;
}
else
{
sp->fXmitTime |= (_fromHex(inCh) << (_i*4));
if(_i == 0)
{
MACXmitPkt(pkt);
retVal = WAIT_PACKET;
}
else
{
_i--;
}
}
return(retVal);
} uint8_t _receiveLinkRequestInfo(pseg_t *pkt, char inCh, int reset)
{ static uint8_t _i;
uint8_t retVal = RECV_LINK_REQUEST_INFO;
linkRequestPayload *lrp = PSegPayload(pkt);
#ifdef DEBUG_BUFFER
debug_buffer(152);
#endif
if(reset == 1)
{
lrp->fNeighbor = 0;
_i = 1;
}
else
{
lrp->fNeighbor |= (_fromHex(inCh) << (_i*4));
if(_i == 0)
{
MACXmitPkt(pkt);
retVal = WAIT_PACKET;
}
else
{
_i--;
}
}
return(retVal);
}
uint8_t _receiveParamSetInfo(pseg_t *pkt, char inCh, int reset)
{
static uint8_t _shift;
static uint8_t _index;
uint8_t retVal = RECV_PARAM_SET_INFO;
uint8_t *payload = PSegPayload(pkt);
#ifdef DEBUG_BUFFER
debug_buffer(153);
#endif
if(reset == 1)
{
_index = 0;
_shift = 1;
}
else
{
payload[_index] = (_fromHex(inCh) << (_shift * 4));
if(_shift == 0)
{
_index++;
_shift = 1;
}
else
{
_shift--;
}
if(_index == PSegSize(pkt))
{
MACXmitPkt(pkt);
retVal = WAIT_PACKET;
}
}
return(retVal);
}
uint8_t _fromHex(char c)
{
#ifdef DEBUG_BUFFER
debug_buffer(154);
#endif
11
4
if(c >= '0' && c <= '9')
return(c - '0');
else if(c >= 'a' && c <= 'f')
return(c - 'a');
else if(c >= 'A' && c <= 'F')
return(c - 'A');
else
return(0);
} uint8_t _theRightATOI(const char *s) {
uint8_t value;
value = 0;
#ifdef DEBUG_BUFFER
debug_buffer(155);
#endif
while (*s != 0) {
value = (value * 10) + (*s++ - '0');
}
return value;
} void _sendOperationOnPacket(node_id targetNode)
{ char buffer[50];
pseg_t *pkt = PSegAlloc(PSEG_TYPE_SET_IN_OPERATION,
sizeof(setOperationalPayload), NULL);
pkt = ARQMakeARQ(GRAdMakePkt(pkt, targetNode));
#ifdef DEBUG_BUFFER
debug_buffer(156);
#endif
// ARQ is the current seg type
sprintf(buffer, "Sending packet with ARQ reference %2d\n\r",
((arqPayload *)PSegPayload(pkt))->fReference);
SENDSTRING(buffer);
MACXmitPkt(pkt);
} void _sendEnterTestPkt(node_id targetNode)
{ pseg_t *pkt = PSegAlloc(PSEG_TYPE_ENTER_TEST, sizeof(dummyPayload), NULL);
pkt = ARQMakeARQ(GRAdMakePkt(pkt, targetNode));
MACXmitPkt(pkt);
} void _sendExitTestPkt(node_id targetNode)
{ pseg_t *pkt = PSegAlloc(PSEG_TYPE_EXIT_TEST, sizeof(dummyPayload), NULL);
pkt = ARQMakeARQ(GRAdMakePkt(pkt, targetNode));
/* Uart_Printf(" sending dst %d, src %d, seq %d\n",
((gradPayload *)PSegPayload(GRAdFindSegment(pkt)))->fDestination,
((gradPayload *)PSegPayload(GRAdFindSegment(pkt)))->fOriginator,
((gradPayload *)PSegPayload(GRAdFindSegment(pkt)))->fSequence);
*/
MACXmitPkt(pkt);
} void SerialCheckSync(pseg_t *pkt) {
syncPayload *sp = PSegPayload(pkt);
node_id id = sp->fSender;
if (waitOnPkt) {
if (id == _targetNode) {
Uart_Printf("saw target node %d", id);
if (printSync) {
rtc_t diff;
diff = sp->fXmitTime - sp->fRecvTime;
Uart_Printf("\n time diff = %d, cycle time = %d\n ", diff, (sp-
>fXmitTime%600));
}
if (queuedPkt != NULL) {
Uart_Printf("... sending queued pkt\n");
MACXmitPkt(queuedPkt);
} else if (syncFlood) {
Uart_Printf("... performing sync flood\n");
PingSendPing(_targetNode);
OSTimeDly(15);
PingSendPing(_targetNode);
SyncDoFlood();
} else {
Uart_Printf("\n");
}
queuedPkt = NULL;
waitOnPkt = false;
syncFlood = false;
}
}
}
bool SerialGatewayMode( void )
{
#ifdef DEBUG_BUFFER
debug_buffer(157);
#endif
return SysGetGatewayMode();
}
bool SerialDoctorMode( void )
{
#ifdef DEBUG_BUFFER
debug_buffer(158);
#endif
return SysGetDoctorMode();
}
#ifdef PC_DEBUG
int main(void)
{
#ifdef DEBUG_BUFFER
debug_buffer(159);
#endif
SerialInit();
SerialReset();
SerialStart();
}
#endif
stat
s.h
// File: stats.h
// Description:
// Author(s): Andy Wheeler <[email protected]>
11
5
//
// Copyright 2001 by the Massachusetts Institute of Technology. All
// rights reserved.
//
// This MIT Media Laboratory project was sponsored by the Defense
// Advanced Research Projects Agency, Grant No. MOA972-99-1-0012. The
// content of the information does not necessarily reflect the
// position or the policy of the Government, and no official
// endorsement should be inferred.
//
// For general public use.
//
// This distribution is approved by Walter Bender, Director of the
// Media Laboratory, MIT. Permission to use, copy, or modify this
// software and its documentation for educational and research
// purposes only and without fee is hereby granted, provided that this
// copyright notice and the original authors' names appear on all
// copies and supporting documentation. If individual files are
// separated from this distribution directory structure, this
// copyright notice must be included. For any other uses of this
// software, in original or modified form, including but not limited
// to distribution in whole or in part, specific prior permission must
// be obtained from MIT. These programs shall not be used, rewritten,
// or adapted as the basis of a commercial software or hardware
// product without first obtaining appropriate licenses from MIT. MIT
// makes no representations about the suitability of this software for
// any purpose. It is provided "as is" without express or implied
// warranty.
#ifndef STATS_H
#define STATS_H
#include "types.h"
#include "pseg.h"
typedef struct {
uint32_t maxTimeDiffThisPeriod;
uint32_t uptime;
uint16_t badPackets;
uint16_t goodPackets;
uint16_t duplicatePackets;
} statsReportPayloadA;
typedef struct {
uint16_t gradOriginated;
uint16_t gradFlooded;
uint16_t gradRelayed;
uint16_t arqPktsSent;
uint16_t ackPktsRcvd;
uint16_t arqPktsDropped;
} statsReportPayloadB;
void StatsInit( void );
// called on startup- zeros the stats
void StatsReset( void );
// clears the "period" stats
void StatsStart( void );
// starts the statistics reporting task
pseg_t * StatsMakePktA( pseg_t *next );
// returns a PSEG_TYPE_STATS_REPORT
pseg_t * StatsMakePktB( pseg_t *next );
// returns a PSEG_TYPE_STATS_REPORT
void SendStatsPkt( pseg_t *gradSeg );
// Sends both segment types in two different packets
void StatsClearData( void );
// clears the currently held data
// statistics functions
void StatsSetBadPackets(uint16_t bad);
void StatsSetGoodPackets(uint16_t good);
void StatsTimeDiff(uint32_t timeDiff);
void StatsIncDupPkts( void );
void StatsIncGradOriginated( void );
void StatsIncGradFlooded( void );
void StatsIncGradRelayed( void );
void StatsIncARQPktsSent( void );
void StatsIncARCPktsRcvd( void );
void StatsIncARQPktsDropped( void );
#endif
syn
c.h
// File: sync.h
// Description: establish and maintain network-wide synchronization
// Author(s): Robert Poor <[email protected]>
// Andrew Wheeler <[email protected]>
//
// Copyright 2001 by the Massachusetts Institute of Technology. All
// rights reserved.
//
// This MIT Media Laboratory project was sponsored by the Defense
// Advanced Research Projects Agency, Grant No. MOA972-99-1-0012. The
// content of the information does not necessarily reflect the
// position or the policy of the Government, and no official
// endorsement should be inferred.
//
// For general public use.
//
// This distribution is approved by Walter Bender, Director of the
// Media Laboratory, MIT. Permission to use, copy, or modify this
// software and its documentation for educational and research
// purposes only and without fee is hereby granted, provided that this
// copyright notice and the original authors' names appear on all
// copies and supporting documentation. If individual files are
// separated from this distribution directory structure, this
// copyright notice must be included. For any other uses of this
// software, in original or modified form, including but not limited
// to distribution in whole or in part, specific prior permission must
// be obtained from MIT. These programs shall not be used, rewritten,
11
6
// or adapted as the basis of a commercial software or hardware
// product without first obtaining appropriate licenses from MIT. MIT
// makes no representations about the suitability of this software for
// any purpose. It is provided "as is" without express or implied
// warranty.
#ifndef SYNC_H
#define SYNC_H
#include "node_id.h"
#include "pseg.h"
#include "types.h"
#include "rtc.h"
// rtc_t is "synchronization time", or
// seconds + 60 * (minutes + (60 * hours))
// as measured from the real time clock
// A sync message carries the ID of the sending node, the
// value of the sender's real time clock, and the value of
// the receiver's real time clock, captured at the onset
// time of the reception.
typedef struct {
rtc_t fXmitTime;
rtc_t fRecvTime;
node_id fSender;
} syncPayload;
void SyncInit(void);
// cold start
void SyncReset(void);
// warm start
void SyncStart(void);
// start up the sync transmission task
pseg_t *SyncMakePkt(void);
// create a sync packet for transmission
void SyncDoFlood( void );
// runs a sync flood
void SyncServicePkt(pseg_t *pkt);
// handle an incoming sync packet. Tweaks the real time clock
// to average between sender and receiver.
void SyncWillXmit(pseg_t *pkt);
// to be called by radio code just prior to passing the packet
// to the radio. If the packet contains a sync segment, it will
// be time stamped with the current time and node id.
void SyncWillReceive(void);
// to be called by the radio code when a packet first arrives
// at the host. It simply caches a copy of the current time.
void SyncDidReceive(pseg_t *pkt);
// to be called by the radio code at the completion of receiving
// a packet. If the packet contains a sync segment, the receive
// time (cached in SyncWillReceive) is copied into the segment.
#endif
syn
c.c
// File: sync.c
// Description: establish and maintain network-wide synchronization
// Author(s): Andrew Wheeler <[email protected]>
// Robert Poor <[email protected]>
//
// Copyright 2001 by the Massachusetts Institute of Technology. All
// rights reserved.
//
// This MIT Media Laboratory project was sponsored by the Defense
// Advanced Research Projects Agency, Grant No. MOA972-99-1-0012. The
// content of the information does not necessarily reflect the
// position or the policy of the Government, and no official
// endorsement should be inferred.
//
// For general public use.
//
// This distribution is approved by Walter Bender, Director of the
// Media Laboratory, MIT. Permission to use, copy, or modify this
// software and its documentation for educational and research
// purposes only and without fee is hereby granted, provided that this
// copyright notice and the original authors' names appear on all
// copies and supporting documentation. If individual files are
// separated from this distribution directory structure, this
// copyright notice must be included. For any other uses of this
// software, in original or modified form, including but not limited
// to distribution in whole or in part, specific prior permission must
// be obtained from MIT. These programs shall not be used, rewritten,
// or adapted as the basis of a commercial software or hardware
// product without first obtaining appropriate licenses from MIT. MIT
// makes no representations about the suitability of this software for
// any purpose. It is provided "as is" without express or implied
// warranty.
#include "node_id.h"
#include "sync.h"
#include "types.h"
#include "rtc.h"
#include "mac.h"
#include "includes.h"
#include "tephra.h"
#include "stats.h"
#include "sysmanager.h"
#include "ping.h"
#include <stdlib.h>
#define IS_ODD(x) (((x) & 1) == 1)
// snapshot of time at which receive starts
static rtc_t _recvTime;
static rtc_t _lastTimeDiff;
static int _rcvdPktNum;
static unsigned int _syncStack[SYNC_TASK_STACK_SIZE];
static void _SyncTask(void *args);
void SyncInit()
{
#ifdef DEBUG_BUFFER
debug_buffer(178);
11
7
#endif
// cold start
srand((uint32_t)NodeGetID());
RTCSetTime(10500);
// record that we are starting up for the first time ever
_lastTimeDiff = 20000;
_rcvdPktNum = 0;
} void SyncReset()
{ #ifdef DEBUG_BUFFER
debug_buffer(179);
#endif
// warm start
} void SyncStart()
{ #ifdef DEBUG_BUFFER
debug_buffer(180);
#endif
// start the sync task
OSTaskCreate(_SyncTask, NULL, (void *)&_syncStack[SYNC_TASK_STACK_SIZE-1],
SYNC_TASK_ID);
} static void _SyncTask(void *args)
{ uint32_t delay;
while (true)
{
#ifdef DEBUG_BUFFER
debug_buffer(181);
#endif
delay = (10*OS_TICKS_PER_SEC) + (rand() % (6*OS_TICKS_PER_SEC)); // delay
10-16 seconds
// Uart_Printf("SyncTask: system time: %d \n", RTCGetTime());
OSTimeDly(delay);
if (SysGetSyncState() && !SysGetDoctorMode()) {
LED_3_ON();
MACXmitPkt(SyncMakePkt());
LED_3_OFF();
}
}
} pseg_t *SyncMakePkt()
{ // create a sync packet for transmission. The payload will
// be filled in by the SyncWillXmit() and SyncDidReceive()
// methods below.
#ifdef DEBUG_BUFFER
debug_buffer(182);
#endif
return PSegAlloc(PSEG_TYPE_SYNC, sizeof(syncPayload), NULL);
} void SyncDoFlood() {
// perform a sync flood- basically 5 seconds of just sending syncs
int i;
for (i=0; i<30; i++) {
OSTimeDly(15);
MACXmitPkt(SyncMakePkt());
}
}
void SyncServicePkt(pseg_t *pkt)
{
// Handle an incoming sync packet, adjusting the real time clock to
// average between sender's time and receiver's time.
syncPayload *sp = PSegPayload(pkt);
rtc_t diff;
bool advance;
#ifdef DEBUG_BUFFER
debug_buffer(183);
#endif
// Pretend EPOCH is 60 seconds (one minute):
// case A: x=15 r=05, e=10 => advance by e/2
// case B: x=55 r=05, e=50 => retard by (60-e)/2
// case C: x=05 r=15, e=10 => retard by e/2
// case D: x=05 r=55, e=50 => advance by (60-e)/2
if (SysGetSyncState() && SysGetDoctorMode()) {
return;
}
if (SysGetSyncState() && SysGetGatewayMode() && (sp->fSender != 93)) {
return;
}
if (sp->fXmitTime == sp->fRecvTime) {
// Uart_Printf("SyncServicePkt: got packet, diff = 0\n");
if ((++_rcvdPktNum > 2) && (_lastTimeDiff < 3)) {
// if we have received some packets and the time difference is low
// then we can exit starting up mode
SysSetSyncState(true);
}
_lastTimeDiff = 0;
return;
} else if (sp->fXmitTime > sp->fRecvTime) {
diff = sp->fXmitTime - sp->fRecvTime;
advance = 1;
// assume case A
} else /* if (sp->fXmitTime < sp->fRecvTime) */ {
diff = sp->fRecvTime - sp->fXmitTime;
advance = 0;
// assume case C
}
if (diff > RTC_HALF_EPOCH) {
// difference exceeds half the epoch. Convert to case B or D.
diff -= RTC_HALF_EPOCH;
advance = !advance;
}
StatsTimeDiff(diff);
if (!SysGetSyncState()) {
// we are starting up- don't average time- just set it
// Uart_Printf("SyncServicePkt: setting RTC time, diff = %d\n", diff);
if (advance) {
RTCAdvanceTime(diff);
11
8
} else {
RTCRetardTime(diff);
}
if ((++_rcvdPktNum > 2) && (_lastTimeDiff < 3) && (diff < 3)) {
// if we have received some packets and the time difference is low
// then we can exit starting up mode
SysSetSyncState(true);
}
} else {
// we are not starting up, average times
// Uart_Printf("SyncServicePkt: averaging RTC time\n");
// halve difference and adjust RTC clock
if (IS_ODD(diff)) {
diff += rand() & 1;
// dither before divide by 2
}
diff = diff / 2;
// divide by 2
if (advance) {
RTCAdvanceTime(diff);
} else {
RTCRetardTime(diff);
}
}
_lastTimeDiff = diff;
} void SyncWillXmit(pseg_t *pkt)
{ // to be called by radio code just prior to passing the packet
// to the radio. If the packet contains a sync segment, it will
// be time stamped with the current time and node id.
// uint32_t a;
pseg_t *syncSeg = PSegFindType(pkt, PSEG_TYPE_SYNC);
#ifdef DEBUG_BUFFER
debug_buffer(184);
#endif
if (syncSeg != NULL)
{
syncPayload *sp = PSegPayload(syncSeg);
sp->fSender = NodeGetID();
// sp->fRecvTime = 69000;
// a = RTCGetTime();
// sp->fXmitTime = a;
sp->fXmitTime = RTCGetTime();
}
} void SyncWillReceive()
{ #ifdef DEBUG_BUFFER
debug_buffer(185);
#endif
// to be called by the radio code when a packet first arrives
// at the host. It simply caches a copy of the current time.
_recvTime = RTCGetTime();
} //Note: You should not call SyncWillReceive twice before calling SyncDidReceive;
//if you did, you would have the same _recvTime value for both, which would not
//be happy.
void SyncDidReceive(pseg_t *pkt)
{ // to be called by the radio code at the completion of receiving
// a packet. If the packet contains a sync segment, the receive
// time (cached in SyncWillReceive) is copied into the segment.
pseg_t *syncSeg = PSegFindType(pkt, PSEG_TYPE_SYNC);
#ifdef DEBUG_BUFFER
debug_buffer(186);
#endif
if (syncSeg != NULL) {
syncPayload *sp = PSegPayload(syncSeg);
sp->fRecvTime = _recvTime;
}
}
sysm
anag
er.h
// File: sysmanager.c
// Description: manages system power and runtime state
// Author(s): Andrew Wheeler <[email protected]>
//
// Copyright 2001 by the Massachusetts Institute of Technology. All
// rights reserved.
//
// This MIT Media Laboratory project was sponsored by the Defense
// Advanced Research Projects Agency, Grant No. MOA972-99-1-0012. The
// content of the information does not necessarily reflect the
// position or the policy of the Government, and no official
// endorsement should be inferred.
//
// For general public use.
//
// This distribution is approved by Walter Bender, Director of the
// Media Laboratory, MIT. Permission to use, copy, or modify this
// software and its documentation for educational and research
// purposes only and without fee is hereby granted, provided that this
// copyright notice and the original authors' names appear on all
// copies and supporting documentation. If individual files are
// separated from this distribution directory structure, this
// copyright notice must be included. For any other uses of this
// software, in original or modified form, including but not limited
// to distribution in whole or in part, specific prior permission must
// be obtained from MIT. These programs shall not be used, rewritten,
// or adapted as the basis of a commercial software or hardware
// product without first obtaining appropriate licenses from MIT. MIT
// makes no representations about the suitability of this software for
// any purpose. It is provided "as is" without express or implied
// warranty.
#ifndef SYSMANAGER_H
#define SYSMANAGER_H
#include "includes.h"
// tunable parameters
// number of seconds before the node gives up on syncing and decides to go
standalone
#define SYNC_TIMEOUT 160
// base number of seconds to sleep for at a time
#define SLEEP_BASE_TIME 20
// randomization factor in seconds (average sleep time is base + rand/2)
#define SLEEP_RAND_TIME 20
// number of OSTicks a PING keeps the system awake for
#define PING_AWAKE_TIME 5*OS_TICKS_PER_SEC

11
9
typedef struct
{ uint8_t unused; // c doesn't like empty structures
} dummyPayload;
void SysInit(void);
// intializes the system manager
void SysStart(void);
// starts the system manager
bool SysAwakeNow(void);
// returns true if the system is sync'd and in the "awake" cycle of the network
bool SysGetSyncState(void);
// returns true if the system is determined to either be synched to its
// surrounding nodes, or if sync has timed out and we are now running standalone
void SysSetSyncState(bool state);
// sets the sync state
void SysSetPingParticipant(void);
// tells the power manager that we are now participating in some sort
// of link test, which means that we should interrupt the normal sleep schedule
void SysUnsetPingParticipant(void);
// tells the power manager we are no longer participating in a link test
void SysSetTestMode(bool state);
// tells the power manager to enter test mode. This causes the node to stay
// awake until the test mode is turned off. This is not intended to be used
// in running code- and is primarily for things like packet beacons
bool SysGetTestMode( void );
bool SysRequestNoSleep(uint32_t time);
// requests that the system not sleep for a time equal to time as expressed
// in system ticks- the system manager replies with a true if the request
// is granted, and false otherwise
bool SysGetGatewayMode(void);
// returns true if this node is currently a gateway, false otherwise
void SysSetGatewayMode(bool state);
// if state is true, indicates we are now a gateway, otherwise we are not one
// in this code revision, gateways are assumed to be powered devices, and thus
// never sleep. They also broadcast "authoritative" synchronization packets
bool SysGetDoctorMode(void);
// returns true if this node is currently in "doctor" mode, false otherwise
void SysSetDoctorMode(bool state);
// sets if this node is in doctor mode- if state is true then we are a doctor
#endif
sysm
anag
er.c
// File: sysmanager.c
// Description: manages system power and runtime state
// Author(s): Andrew Wheeler <[email protected]>
//
// Copyright 2001 by the Massachusetts Institute of Technology. All
// rights reserved.
//
// This MIT Media Laboratory project was sponsored by the Defense
// Advanced Research Projects Agency, Grant No. MOA972-99-1-0012. The
// content of the information does not necessarily reflect the
// position or the policy of the Government, and no official
// endorsement should be inferred.
//
// For general public use.
//
// This distribution is approved by Walter Bender, Director of the
// Media Laboratory, MIT. Permission to use, copy, or modify this
// software and its documentation for educational and research
// purposes only and without fee is hereby granted, provided that this
// copyright notice and the original authors' names appear on all
// copies and supporting documentation. If individual files are
// separated from this distribution directory structure, this
// copyright notice must be included. For any other uses of this
// software, in original or modified form, including but not limited
// to distribution in whole or in part, specific prior permission must
// be obtained from MIT. These programs shall not be used, rewritten,
// or adapted as the basis of a commercial software or hardware
// product without first obtaining appropriate licenses from MIT. MIT
// makes no representations about the suitability of this software for
// any purpose. It is provided "as is" without express or implied
// warranty.
#include "tephra.h"
#include "types.h"
#include "includes.h"
#include "rad.h"
#include "mac.h"
#include "pseg.h"
#include "param.h"
#include "appr.h"
#include "appx.h"
#include "ping.h"
#include "sync.h"
#include "grad.h"
#include "rtc.h"
#include "cost.h"
#include "arq.h"
#include "util.h"
#include "serial.h"
#include "stats.h"
#include "sysmanager.h"
#include "boottest.h"
#include <stdlib.h>
#ifndef BIT
#define BIT(x)
(1 << (x))
#endif
#ifndef min
#define min(x1,x2) ((x1<x2)?x1:x2)
#endif
// internal functions
static void _sleepSystem( rtc_t delay );
// sets the registers and alarms to put the system to sleep for delay seconds
// - also sleeps the radio hardware
12
0
// assumes that all tasks and non-essential hardware regsiters
// are prepared to sleep
// returns when the system is awake again with alarms disabled
static void _startTasks(void);
// starts all the system tasks in the correct order
static void _killTasks( void );
// kills all the system tasks
static void _restartTasks( void );
// calls reset on all the tasks and restarts them
static void _SysTask(void *args);
// performs power and task management
static void _wakeupISR( void );
// ISR that is called when the system wakes up
static void _sendSleepingSyncPkt( void );
// sends a sync packet while the system is not running
// starts and stops essential services
// private variables
static bool syncState;
static uint32_t pingExpires;
static uint32_t endofNoSleep;
static bool gatewayMode;
static bool doctorMode;
static bool testMode;
static unsigned int _sysStack[SYS_TASK_STACK_SIZE];
static bool _systemAsleep;
static bool systemRunning;
void SysInit() {
// install the wakeup ISR
ISR_RTCA = (unsigned)_wakeupISR;
// initialize the state variables
syncState = false;
pingExpires = 0;
endofNoSleep = 0;
gatewayMode = false;
doctorMode = false;
testMode = false;
_systemAsleep = false;
systemRunning = false;
} // void SysStart()
// starts the system manager main thread that is responsible for
// controlling other tasks and power managing the system
void SysStart() {
OSTaskCreate(_SysTask, NULL, (void *)&_sysStack[SYS_TASK_STACK_SIZE-1],
SYS_TASK_ID);
} // void _SysTask(void *args)
// system manager main thread- starts all the other tasks and does power
// management
void _SysTask(void *args) {
rtc_t curCycleTime;
/* int i;
pseg_t *pkt;
char *payload;*/
// run tests
//AppRStart();
////MACStart();
////RadStart(); // start the radio task
// ARQStart();
// SerialStart();
////CostStart();
// AppXStart();
// RTCStart(); // TESTING ONLY
// SyncStart();
// StatsStart();
// PingStartBeaconMode();
/*while (1) {
OSTimeDly(15*OS_TICKS_PER_SEC);
RadPrintStats();
}
for (i=0; i<100; i++) {
pkt = PSegAlloc(PSEG_TYPE_TESTING,
10,
NULL);
payload = PSegPayload(pkt);
payload[0] = 0x01;
payload[1] = 0x23;
payload[2] = 0x45;
payload[3] = 0x67;
payload[4] = 0x89;
payload[5] = 0x0A;
payload[6] = 0xBC;
payload[7] = 0xDE;
payload[8] = 0xFE;
payload[9] = 0xDC;
OSTimeDly(25);
MACXmitPkt(pkt);
}
while(1);*/
// startup everything
Uart_Printf("SysTask: starting tasks\n");
_startTasks();
OSTimeDly(OS_TICKS_PER_SEC);
BootInit();
BootStart();
Uart_Printf("SysTask: tasks started\n");
SysSetTestMode(true);
// PingStartAsyncLinkTest();
// wait for us to be sync'd or for sync to time out before continuing
while (!syncState && (OSTimeGet() < (SYNC_TIMEOUT * OS_TICKS_PER_SEC))) {
OSTimeDly(OS_TICKS_PER_SEC);
}
if (!syncState) {
if (doctorMode) Uart_Printf("SysTask: forcing standalone mode\n");
BootSendPkt(BOOT_STANDALONE, 0);
12
1
} else {
if (doctorMode) Uart_Printf("SysTask: sync attained\n");
BootSendPkt(BOOT_GOT_SYNC, 0);
}
// force us to go into standalone mode if we haven't sync'd
syncState = true;
while (true) {
OSTimeDly(OS_TICKS_PER_SEC/4);
// calculate current cycle time
curCycleTime = RTCGetTime() % (ParamGet(PARAM_AWAKE_TIME) +
ParamGet(PARAM_SLEEP_TIME));
// the asleep period is the first SLEEP_TIME seconds of a cycle
while (curCycleTime < ParamGet(PARAM_SLEEP_TIME)) {
// looks like we should be asleep
// check if there is a reason we shouldn't be asleep
if ((pingExpires > OSTimeGet())|| gatewayMode || testMode || doctorMode ||
(OSTimeGet() < endofNoSleep)) {
// try again later
if (gatewayMode && (curCycleTime < 305) && (curCycleTime > 299)) {
// restart gateway
_killTasks();
_sleepSystem(5);
_restartTasks();
}
OSTimeDly(OS_TICKS_PER_SEC/4);
curCycleTime = RTCGetTime() % (ParamGet(PARAM_AWAKE_TIME) +
ParamGet(PARAM_SLEEP_TIME));
if (!systemRunning) {
_killTasks(); // kill tasks just in case
_restartTasks();
}
continue;
}
// OK- we should go to sleep now
_killTasks();
_sleepSystem(min((SLEEP_BASE_TIME + (rand() % SLEEP_RAND_TIME)),
(ParamGet(PARAM_SLEEP_TIME)-curCycleTime)));
// send the sleeping sync packet
_sendSleepingSyncPkt();
// delay to see if we rcv a packet forcing a test mode or ping exchange
OSTimeDly(OS_TICKS_PER_SEC);
// update the current cycle time
curCycleTime = RTCGetTime() % (ParamGet(PARAM_AWAKE_TIME) +
ParamGet(PARAM_SLEEP_TIME));
// Uart_Printf("cycle time = %d\n, systemRunning = %d", curCycleTime,
systemRunning);
}
// turn back on the system if we are asleep
if (!systemRunning) {
_killTasks(); // kill tasks just in case
_restartTasks();
}
}
} // bool SysAwakeNow();
// returns true if the node is currently sync'd and in the "awake" phase
bool SysAwakeNow() {
rtc_t curCycleTime;
curCycleTime = RTCGetTime() % (ParamGet(PARAM_AWAKE_TIME) +
ParamGet(PARAM_SLEEP_TIME));
return (syncState && (curCycleTime > ParamGet(PARAM_SLEEP_TIME)));
}
// bool SysGetSyncState();
// returns true if the system is determined to either be synched to its
// surrounding nodes, or if sync has timed out and we are now running standalone
bool SysGetSyncState() {
return syncState;
}
// sets the sync state
void SysSetSyncState(bool state) {
// Uart_Printf("SysSetSyncState: set to %d\n", state);
syncState = state;
}
// tells the power manager that we are now participating in some sort
// of link test, which means that we should interrupt the normal sleep schedule
void SysSetPingParticipant() {
pingExpires = OSTimeGet() + PING_AWAKE_TIME;
}
// indicates that we are in a test mode
// currently doesn't sleep until test mode is unset
// also kills off "reporting" tasks like appx and stat
void SysSetTestMode(bool state) {
testMode = state;
if (testMode) {
// if (!systemRunning) {
// _killTasks(); // kill tasks just in case
// _restartTasks();
// }
OSTaskDel(APPX_TASK_ID);
OSTaskDel(STAT_TASK_ID);
}
}
bool SysGetTestMode( void ) {
return testMode;
}
// requests that the system not sleep for a time equal to time as expressed
// in system ticks- the system manager replies with a true if the request
// is granted, and false otherwise
bool SysRequestNoSleep(uint32_t time) {
if (time < 1000) {
endofNoSleep = OSTimeGet() + time;
return true;
} else {
return false;
}
}
// returns true if this node is currently a gateway, false otherwise
bool SysGetGatewayMode() {
return gatewayMode;
}
// if state is true, indicates we are now a gateway, otherwise we are not one
// - in this code revision, gateways are assumed to be powered devices, and thus
12
2
// never sleep. They also broadcast "authoritative" synchronization packets
void SysSetGatewayMode(bool state) {
gatewayMode = state;
if (gatewayMode) {
//syncState = true; // force sync'd state
testMode = false; // turns off test mode
PingStopAsyncLinkTest();
}
} // returns true if this node is currently in "doctor" mode, false otherwise
bool SysGetDoctorMode() {
return doctorMode;
} // sets if this node is in doctor mode- if state is true then we are a doctor
void SysSetDoctorMode(bool state) {
doctorMode = state;
if (doctorMode) {
testMode = false;
PingStopAsyncLinkTest();
}
} static void _sendSleepingSyncPkt( void ) {
// wakes up the proper services to send a ping packet, and then
// rad, mac, appr, ping, arq
ParamReset();
RTCReset();
RadReset(); // reset the radio task
PSegReset();
MACReset();
AppRReset();
PingReset();
ARQReset();
AppRStart();
MACStart();
RadStart(); // start the radio task
ARQStart();
// send a sync packet
MACXmitPkt(SyncMakePkt());
} static void _startTasks()
{ AppRStart();
MACStart();
RadStart(); // start the radio task
ARQStart();
SerialStart();
CostStart();
AppXStart();
// RTCStart(); // TESTING ONLY
SyncStart();
StatsStart();
systemRunning = true;
} static void _killTasks() {
#ifdef DEBUG_BUFFER
debug_buffer(4);
#endif
OSSchedLock(); // lock the scheduler
OSTaskDel(SER_RCV_TASK_ID);
OSTaskDel(RTC_TASK_ID);
OSTaskDel(RAD_RCV_TASK_ID);
OSTaskDel(MAC_TASK_ID);
OSTaskDel(APPR_TASK_ID);
OSTaskDel(APPX_TASK_ID);
OSTaskDel(ARQ_TASK_ID);
OSTaskDel(PING_NEIGHBORS_TASK_ID);
OSTaskDel(LINK_REQUEST_TASK_ID);
OSTaskDel(SYNC_TASK_ID);
OSTaskDel(STAT_TASK_ID);
OSSchedUnlock();
systemRunning = false;
}
static void _restartTasks() {
#ifdef DEBUG_BUFFER
debug_buffer(5);
#endif
ParamReset();
StatsReset();
RTCReset();
RadReset(); // reset the radio task
PSegReset();
MACReset();
AppRReset();
AppXReset();
PingReset();
SyncReset();
CostReset();
ARQReset();
SerialReset();
if (gatewayMode) {
SerialStartInGateway();
AppRStart();
MACStart();
RadStart(); // start the radio task
ARQStart();
SerialStart();
CostStart();
// AppXStart();
// RTCStart(); // TESTING ONLY
SyncStart();
// StatsStart();
} else {
AppRStart();
MACStart();
RadStart(); // start the radio task
ARQStart();
SerialStart();
CostStart();
AppXStart();
// RTCStart(); // TESTING ONLY
SyncStart();
StatsStart();
}
systemRunning = true;
12
3
} static void _wakeupISR(void)
{ #ifdef DEBUG_BUFFER
debug_buffer(6);
#endif
INTPND = ~INT_RTCA;
_systemAsleep = false;
} static void _sleepSystem( rtc_t delay )
{ char savedSYSCON;
#ifdef DEBUG_BUFFER
debug_buffer(7);
#endif
RadSleep();
OS_ENTER_CRITICAL();
OSSchedLock(); // Lock the OS Scheduler
PDAT0 |= BIT(2); // turns SENSORPWR off (inverse logic)
PDAT0 &= ~BIT(3); // turns TEMP sensor off
LED_1_OFF();
LED_2_OFF();
LED_3_OFF();
LED_4_OFF();
RTCSetAlarmTime(RTCGetTime() + delay); // setup the RTC alarm for now + delay
RTCALM = RTCALM_SECOND_ENABLE |
RTCALM_MINUTE_ENABLE |
RTCALM_HOUR_ENABLE |
RTCALM_GLOBAL_ENABLE;
// enable the RTC alarm on hours/minutes/seconds (days+ not used by RTC)
savedSYSCON = SYSCON; // save the system configuration register
INTPND = ~INT_RTCA; // make sure that an RTC alarm interrupt is not
pending
INTMSK &= ~INT_TMC2; // turn off the system timer interrupt
INTMSK |= INT_RTCA; // enable the RTC alarm interrupt to wake us back up
_systemAsleep = true;
LED_4_ON();
EnterPWDN(0x59); // sleep the chip
while (_systemAsleep); // wait for sleep and rewakeup
// after sleep period when we reach here
SYSCON = savedSYSCON; // restore the syscon register
LED_4_OFF();
RTCALM = 0x00; // disable the RTC alarm
INTMSK &= ~INT_RTCA; // disable the RTC alarm interrupt
INTPND = ~INT_TMC2; // clear the system timer interrupt
INTMSK |= INT_TMC2; // re-enable the system timer
OSSchedUnlock(); // unlock the OS Scheduler
Uart_Init(TEPHRA_BAUD_RATE);
OS_EXIT_CRITICAL();
}
vect
or.
h
// File: vector.h
// Description: support for arrays of pointer sized objects
// Author(s): Robert Poor <[email protected]>
//
// Copyright 2001 by the Massachusetts Institute of Technology. All
// rights reserved.
//
// This MIT Media Laboratory project was sponsored by the Defense
// Advanced Research Projects Agency, Grant No. MOA972-99-1-0012. The
// content of the information does not necessarily reflect the
// position or the policy of the Government, and no official
// endorsement should be inferred.
//
// For general public use.
//
// This distribution is approved by Walter Bender, Director of the
// Media Laboratory, MIT. Permission to use, copy, or modify this
// software and its documentation for educational and research
// purposes only and without fee is hereby granted, provided that this
// copyright notice and the original authors' names appear on all
// copies and supporting documentation. If individual files are
// separated from this distribution directory structure, this
// copyright notice must be included. For any other uses of this
// software, in original or modified form, including but not limited
// to distribution in whole or in part, specific prior permission must
// be obtained from MIT. These programs shall not be used, rewritten,
// or adapted as the basis of a commercial software or hardware
// product without first obtaining appropriate licenses from MIT. MIT
// makes no representations about the suitability of this software for
// any purpose. It is provided "as is" without express or implied
// warranty.
#ifndef VECTOR_H
#define VECTOR_H
#include "types.h"
typedef void *obj_t;
// Vectors hold "pointer sized" objects
// A vector is a sequence of pointer-sized elements, densely packed
// starting at index 0 and ending at VectorCount()-1.
typedef struct _vector_t {
uint32_t fCount;
// number of elements in the array
uint32_t fCapacity;
// size of the array
obj_t fElements[1];
// a dense array of objects
} vector_t;
#define VECTOR_INDEX_NOT_FOUND
0xff
// value to return when VectorIndexOf() can't find the object
// create static storage for a vector, masquerading as an array of char
#define DEFINE_VECTOR(name, cap) char name[sizeof(vector_t) + ((cap - 1) *
sizeof(obj_t))]
12
4
// turn a static char reference into a vector pointer.
#define VECTOR(v) ((vector_t *)&v)
// ================================================================
// initialize a vector. Must call this before first use
// void VectorInit(vector_t *v, uint8_t cap)
#define VectorInit(v, cap) (v)->fCount = 0; (v)->fCapacity = (cap)
void VectorPrint(vector_t *v);
vector_t *VectorInsert(vector_t *v, obj_t elem, uint8_t index);
// insert element into the vector. return v if inserted, or null if
// the vector was full prior to the call or if index is out of range.
obj_t VectorRemove(vector_t *v, uint8_t index);
// remove and return the element at the given index, or return
// null if index is out of range.
vector_t *VectorSwap(vector_t *v, uint8_t i1, uint8_t i2);
// swap two elements in the vector. return null if i1 or i2 are out
// of range.
obj_t VectorShove(vector_t *v, obj_t element);
// Like VectorPush(), inserts element at the high end of the
// array. Unlike VectorPush(), removes the first element and
// returns it to make room for the new element as needed.
uint8_t VectorIndexOf(vector_t *v, obj_t element);
// return the index of the element in the vector, or -1 if not found
obj_t VectorRef(vector_t *v, uint8_t index);
// return the indexth entry of the table, or null if index out of range
vector_t *VectorSet(vector_t *v, obj_t element, uint8_t index);
// set the indexth entry of the table to element. Returns v on
// success, null if index is out of range.
// ================================================================
// Everything else are macro definitions...
// vector_t *VectorClear(vector_t *v);
#define VectorClear(v) ((v)->fCount) = 0
// uint8_t VectorCount(vector_t *v);
#define VectorCount(v) ((v)->fCount)
// uint8_t VectorCapacity(vector_t *v);
#define VectorCapacity(v) ((v)->fCapacity)
// obj_t *VectorElements(vector_t *v);
#define VectorElements(v) ((v)->fElements)
// vector_t *VectorPush(vector_t *v, obj_t element);
#define VectorPush(v, e) VectorInsert((v), (e), (v)->fCount)
// obj_t VectorPop(vector_t *v);
#define VectorPop(v) VectorRemove((v), ((v)->fCount)-1)
// vector_t VectorEnqueue(vector_t *v, obj_t element);
#define VectorEnqueue(v, e) VectorInsert((v), (e), (v)->fCount)
// obj_t VectorDequeue(vector_t *v);
#define VectorDequeue(v) VectorRemove((v), 0)
// bool VectorIsEmpty(vector_t *v);
#define VectorIsEmpty(v) ((v)->fCount == 0)
// bool VectorIsFull(vector_t *v);
#define VectorIsFull(v) ((v)->fCount == (v)->fCapacity)
// ================================================================
// fast versions - call only when you know arguments to be safe!
void VectorFastInsert(vector_t *v, obj_t element, uint8_t index);
obj_t VectorFastRemove(vector_t *v, uint8_t index);
void VectorFastSwap(vector_t *v, uint8_t index1, uint8_t index2);
// obj_t VectorFastRef(vector_t *v, uint8_t index);
#define VectorFastRef(v, i) ((v)->fElements[(i)])
// void VectorFastSet(vector_t *v, obj_t element, uint8_t index);
#define VectorFastSet(v, e, i) ((v)->fElements[(i)]) = e
#define VectorFastPush(v, e) VectorFastInsert((v), (e), (v)->fCount)
#define VectorFastPop(v) VectorRemove((v), ((v)->fCount)-1)
#define VectorFastEnqueue(v, e) VectorFastInsert((v), (e), (v)->fCount)
#define VectorFastDequeue(v) VectorFastRemove((v), 0)
#endif

125
References
[Abrams] Abrams Gentile Entertainment, Inc. 244 54th Street, New York,
NY 10019.
[Bridges01] Kim Bridges. University of Hawaii Botany Department web
site. http://www.botany.hawaii.edu/
[Broch98] J. Broch, et.al. “A Performance Comparison of Multi-hop
Wireless Ad-hoc Network Routing Protocols.” Mobicom 1998.
[Cerpa01] Alberto Cerpa, et.al. “Habitat monitoring: Application driver for
wireless communications technology.” Proceedings of the 2001 ACM
SIGCOMM Workshop on Data Communications in Latin America and the
Caribbean. April, 2001.
[Heidemann00] John Heidemann, et.al. “Effects of Detail in Wireless
Simulation.” Proceedings of the SCS Communication Networks and
Distributed Systems Modeling and Simulation Conference. September,
2000.
[Hollar01] Seth Edward-Austin Hollar. “COTS Dust.” Draft of Master’s
Thesis, Engineering- Mechanical Engineering, University of California,
Berkeley. January 2001.
[IEEE99] IEEE Standard 802.11, 1999 Edition. “Information technology—
Telecommunications and information exchange between systems—Local
and metropolitan area networks—Specific requirements—Part 11:
Wireless LAN Medium Access Control (MAC) and Physical Layer (PHY)
Specifications.” IEEE Standards Association, 1999.
[Johansson99] P. Johansson, et.al. “Scenario-based Performance
Analysis of Routing Protocols for Mobile Ad-hoc Networks.” Proceedings
of the ACM/IEEE International Conference on Mobile Computing and
Networking. August 1999.
[Labrosse99] Jean Labrosse. MicroC/OS-II: The Real-Time Kernel. R&D
Books, Kansas, 1999.

126
[Lau98] Matthew Lau. “GeoPak: monitoring climbers and climate on Mount
Everest.” Masters Thesis, Department of Electrical Engineering and
Computer Science, Massachusetts Institute of Technology. October 1998.
[Maxim97] Dallas Semiconductor/Maxim Datasheet “MAX639”, Rev 3.
August 1997. http://pdfserv.maxim-ic.com/arpdf/MAX639-MAX653.pdf
[NS01] Network Simulator ns-2 website. http://www.isi.edu/nsnam/ns/
[Panametrics01] Panametrics, Inc. Datasheet “MiniCap 2 Relative
Humidity Sensor.”
http://www.panametrics.com/div_pci/pdf/relative_humidity/Sensors/MINIC
AP2.PDF
[Poor01] Robert Poor. “Embedded Networks: Pervasive, Low-Power,
Wireless Connectivity.” Ph.D. Dissertation, Department of Architecture,
Program in Media Arts and Sciences, Massachusetts Institute of
Technology. January 2001.
[Rappaport96] Theodore Rappaport. Wireless Communications: Principles
and Practice. Prentice Hall, New Jersey, 1996.
[Rockwell01] Rockwell Scientific HiDRA website.
http://www.rsc.rockwell.com/hidra
[Samsung01] Samsung Electronics Datasheet “S3C3410X RISC
Microprocessor.” http://www.samsungelectronics.com/
[Thermometrics01] Keystone Thermometrics Corporation Datasheet “NTC
Thermistors: Type RL10.”
http://www.thermometrics.com/assests/images/rl10.pdf
[Wheeler-Bletsas00] Andrew Wheeler, Aggelos Bletsas. “Energy Efficiency
Study of Routing Protocols for Mobile Ad-Hoc Networks.” Final project
paper for Fall 2000 MIT Class 6.899 Computer Networks.
[Xu00] Ya Xu, et.al. “Adaptive Energy-Conserving Routing for Multihop Ad
Hoc Networks.” Research Report 527, USC/Information Sciences Institute,
October 2000.
Related Documents