Tensiometry and dilational rheology of mixed b-lactoglobulin/ionic surfactant adsorption layers at water/air and water/hexane interfaces Abhijit Dan a,1 , Georgi Gochev a,b,⇑ , Reinhard Miller a a Max-Planck-Institute for Colloid and Interface Science, 14476 Potsdam/Golm, Germany b Institute of Physical Chemistry, Bulgarian Academy of Sciences, 1113 Sofia, Bulgaria graphical abstract article info Article history: Received 5 November 2014 Accepted 14 January 2015 Available online 24 January 2015 Keywords: b-Lactoglobulin–SDS interactions b-Lactoglobulin–DoTAB interactions Drop profile analysis tensiometry Double capillary Drop bulk exchange Sequential vs. simultaneous adsorption Water/air surface Water/oil interface Oscillating drops Dilational visco-elasticity abstract Oscillating drop tensiometry was applied to study adsorbed interfacial layers at water/air and water/hex- ane interfaces formed from mixed solutions of b-lactoglobulin (BLG, 1 lM in 10 mM buffer, pH 7 – neg- ative net charge) and the anionic surfactant SDS or the cationic DoTAB. The interfacial pressure P and the dilational viscoelasticity modulus |E| of the mixed layers were measured for mixtures of varying surfac- tant concentrations. The double capillary technique was employed which enables exchange of the protein solution in the drop bulk by surfactant solution (sequential adsorption) or by pure buffer (washing out). The first protocol allows probing the influence of the surfactant on a pre-adsorbed protein layer thus studying the protein/surfactant interactions at the interface. The second protocol gives access to the residual values of P and |E| measured after the washing out procedure thus bringing information about the process of protein desorption. The DoTAB/BLG complexes exhibit higher surface activity and higher resistance to desorption in com- parison with those for the SDS/BLG complexes due to hydrophobization via electrostatic binding of sur- factant molecules. The neutral DoTAB/BLG complexes achieve maximum elastic response of the mixed layer. Mixed BLG/surfactant layers at the water/oil interface are found to reach higher surface pressure and lower maximum dilational elasticity than those at the water/air surface. The sequential adsorption mode experiments and the desorption study reveal that binding of DoTAB to pre-adsorbed BLG globules is somehow restricted at the water/air surface in comparison with the case of complex formation in the solution bulk and subsequently adsorbed at the water/air surface. Maximum elasticity is achieved with washed out layers obtained after simultaneous adsorption, i.e. isolation of the most surface active DoTAB/BLG complex. These specific effects are much less pronounced at the W/H interface. Ó 2015 Elsevier Inc. All rights reserved. 1. Introduction b-Lactoglobulin (BLG), and proteins in general, readily adsorb at fluid interfaces forming a visco-elastic network [1–5]. Concerning the influence of the hydrophobic phase, the adsorption is more http://dx.doi.org/10.1016/j.jcis.2015.01.035 0021-9797/Ó 2015 Elsevier Inc. All rights reserved. ⇑ Corresponding author at: Max Planck Institute of Colloids and Interfaces, Am Mühlenberg 1 OT Golm, 14476 Potsdam, Germany. E-mail addresses: [email protected], [email protected] (G. Gochev). 1 Present address: Department of Chemical and Biological Engineering, University of Wisconsin – Madison, 1415 Engineering Drive, Madison, WI 53706, USA. Journal of Colloid and Interface Science 449 (2015) 383–391 Contents lists available at ScienceDirect Journal of Colloid and Interface Science www.elsevier.com/locate/jcis

Welcome message from author
This document is posted to help you gain knowledge. Please leave a comment to let me know what you think about it! Share it to your friends and learn new things together.
Transcript

Journal of Colloid and Interface Science 449 (2015) 383–391
Contents lists available at ScienceDirect
Journal of Colloid and Interface Science
www.elsevier .com/locate / jc is
Tensiometry and dilational rheology of mixed b-lactoglobulin/ionicsurfactant adsorption layers at water/air and water/hexane interfaces
http://dx.doi.org/10.1016/j.jcis.2015.01.0350021-9797/� 2015 Elsevier Inc. All rights reserved.
⇑ Corresponding author at: Max Planck Institute of Colloids and Interfaces,Am Mühlenberg 1 OT Golm, 14476 Potsdam, Germany.
E-mail addresses: [email protected], [email protected] (G. Gochev).1 Present address: Department of Chemical and Biological Engineering, University
of Wisconsin – Madison, 1415 Engineering Drive, Madison, WI 53706, USA.
Abhijit Dan a,1, Georgi Gochev a,b,⇑, Reinhard Miller a
a Max-Planck-Institute for Colloid and Interface Science, 14476 Potsdam/Golm, Germanyb Institute of Physical Chemistry, Bulgarian Academy of Sciences, 1113 Sofia, Bulgaria
g r a p h i c a l a b s t r a c t
a r t i c l e i n f o
Article history:Received 5 November 2014Accepted 14 January 2015Available online 24 January 2015
Keywords:b-Lactoglobulin–SDS interactionsb-Lactoglobulin–DoTAB interactionsDrop profile analysis tensiometryDouble capillaryDrop bulk exchangeSequential vs. simultaneous adsorptionWater/air surfaceWater/oil interfaceOscillating dropsDilational visco-elasticity
a b s t r a c t
Oscillating drop tensiometry was applied to study adsorbed interfacial layers at water/air and water/hex-ane interfaces formed from mixed solutions of b-lactoglobulin (BLG, 1 lM in 10 mM buffer, pH 7 – neg-ative net charge) and the anionic surfactant SDS or the cationic DoTAB. The interfacial pressure P and thedilational viscoelasticity modulus |E| of the mixed layers were measured for mixtures of varying surfac-tant concentrations. The double capillary technique was employed which enables exchange of the proteinsolution in the drop bulk by surfactant solution (sequential adsorption) or by pure buffer (washing out).The first protocol allows probing the influence of the surfactant on a pre-adsorbed protein layer thusstudying the protein/surfactant interactions at the interface. The second protocol gives access to theresidual values of P and |E| measured after the washing out procedure thus bringing information aboutthe process of protein desorption.
The DoTAB/BLG complexes exhibit higher surface activity and higher resistance to desorption in com-parison with those for the SDS/BLG complexes due to hydrophobization via electrostatic binding of sur-factant molecules. The neutral DoTAB/BLG complexes achieve maximum elastic response of the mixedlayer. Mixed BLG/surfactant layers at the water/oil interface are found to reach higher surface pressureand lower maximum dilational elasticity than those at the water/air surface. The sequential adsorptionmode experiments and the desorption study reveal that binding of DoTAB to pre-adsorbed BLG globulesis somehow restricted at the water/air surface in comparison with the case of complex formation in thesolution bulk and subsequently adsorbed at the water/air surface. Maximum elasticity is achieved withwashed out layers obtained after simultaneous adsorption, i.e. isolation of the most surface activeDoTAB/BLG complex. These specific effects are much less pronounced at the W/H interface.
� 2015 Elsevier Inc. All rights reserved.
1. Introduction
b-Lactoglobulin (BLG), and proteins in general, readily adsorb atfluid interfaces forming a visco-elastic network [1–5]. Concerningthe influence of the hydrophobic phase, the adsorption is more
384 A. Dan et al. / Journal of Colloid and Interface Science 449 (2015) 383–391
intensive at the water/oil interface compared to the water/air (W/A) surface leading to smaller molar areas [1–8]. This fact is attrib-uted to the stronger cohesive interaction between the organic mol-ecules and the protein’s hydrophobic segments which leads topenetration of such segments into the oil phase thus changingthe conformation of the protein in the adsorbed state comparedto that at the W/A surface. A consequence of that is the attenuationof the intermolecular interaction within the interface which in turnresults in lower values of the surface shear [5] and dilational [2–9]moduli for water/oil interface. Lucassen-Reynders et al. proposed arelation between the dilational visco-elasticity modulus |E| and theinteraction parameter HS in the equation of state for proteinadsorption layers as both parameters diminish with decreasingthe clean-interface tension c0 bringing evidence that c0 is an essen-tial parameter in the visco-elasticity modulus [4,6].
Apart from the effect of the nature of the interface, there is anumber of factors, such as pH, ionic strength, temperature andchemical modification [10], which generally influence the kineticsand thermodynamics of adsorption, surface conformation andinterfacial rheology of proteins. The latter characteristics of theprotein adsorption layer are also substantially affected by the addi-tion of other surface active species to the protein solution [8,11–18]. The properties of mixed protein/surfactant interfacial layershave been investigated for both cases when protein/surfactantcomplexes are formed in the bulk (simultaneous adsorption)[8,11–18] or when the surfactant is introduced into a systemwhere the protein molecules are already adsorbed at the interface(sequential adsorption) [13–15,18]. Comparison of the resultsobtained by the two approaches shows differences in the dynamicand equilibrium surface tension and in the surface rheologicalcharacteristics indicating the formation of protein/surfactant com-plexes, via electrostatic and/or hydrophobic interactions either inthe bulk or at the interface. Their subsequent replacement fromthe surface by free surfactant molecules can follow differentscenarios.
Recently mixed interfacial layers of b-casein (BCS) and an ionicsurfactant SDS or DoTAB at the W/A and water/hexane (W/H)interfaces were studied using simultaneous and sequential adsorp-tion protocols followed by a procedure of washing out the bulksolution with pure buffer thus probing the resistance of the mixedinterfacial layer against desorption [14,19,20]. These studiesshowed that above a sufficiently high SDS concentration self-asso-ciation of the complexes occurs in the bulk that controls theadsorption of free surfactant molecules at the interface, which inturn leads to an intermediate maximum in the simultaneousadsorption isotherm unlike in the case of the sequential adsorptionroute. Following the same protocols, experimental results on SDS/BLG and DoTAB/BLG systems are presented here. The conclusionsdrawn comprise four aspects: (1) type of surfactant – equally(SDS) or oppositely (DoTAB) charged in respect to BLG (negativenet charge at pH 7); (2) type of the hydrophobic fluid phase –gas or oil (hexane); (3) experimental conditions – simultaneousor sequential adsorption; and (4) desorption experiments.
2. Experimental
The b-lactoglobulin (BLG, molecular mass M = 18,300 Da) sam-ple and the procedure of the protein solution purification werethe same as explained in Ref. [31]. SDS (M = 288 g/mol) and DoTAB(M = 308.35 g/mol) were purchased from Fluka (Switzerland) assay>99% and re-crystallized twice in hot ethanol. All surfactant, pro-tein and mixed solutions were prepared in 10 mM phosphate buf-fer (Na2HPO4/NaH2PO4) pH 7. In all solutions containing proteinwe kept constant concentration CBLG = 10�6 M and the surfactantconcentration CS in the mixtures was varied in the range between
10�6 M and 10�2 M, i.e. the mixing ratio RS/P between 1 and 104.Hexane was purchased from Fluka (Switzerland) and purified withaluminum oxide. The interfacial pressure (P = c0 � c, c0 = 72.5 and49 mN/m for pure buffer/air and buffer/hexane interfaces, respec-tively, c – interfacial tension) of a pendant solution drop in air orin hexane was measured by the profile analysis tensiometer PAT(Sinterface, Berlin). The double capillary technique was employedwhich enables exchange of the drop bulk solution with a new solu-tion keeping the drop volume constant [21,22]. Thus it is possibleto introduce surface active species into the drop bulk in a sequen-tial way. Schematics of the experimental protocols used in thisstudy are shown in Fig. A1 in the supplementary data [15,19,20].Briefly, they consist of several stages, namely simultaneous adsorp-tion (Sim): (I) adsorption from mixed protein/surfactant solution;and (II) washing out with pure buffer; sequential adsorption(Seq): (I) adsorption from protein solution; (II) washing out withpure buffer; (III) drop volume exchange with surfactant solution;and (IV) washing out with pure buffer. Measurements of the resid-ual surface pressure and surface rheological parameters after thewashing out procedure bring information about the resistance ofthe accumulated interfacial material against desorption driven bythe decrease of the bulk concentration with which the adsorbedlayer stays in equilibrium. The instrumentation allows evaluationof the surface dilational visco-elasticity modulus |E| from the inter-facial tension response to sinusoidal drop area (A) oscillations [21].The drop oscillations were performed at frequencies in the rangebetween 0.01 and 0.2 Hz keeping constant area deformation DA/A = 7%. All data points presented were measured after aging timesof several hours (depending on the surfactant concentration)assuming equilibrium of the interfacial layer validated by con-stancy of the surface/interfacial tension values with time. The aver-age accuracy of the measurements for the dilational modulus |E| isbetter than ±5 mN/m. Error bars are not added to the graphs toprovide easier reading.
3. Results
Figs. 1a and 1c present the P–CS adsorption isotherms for pureSDS and DoTAB layers and for SDS/BLG and DoTAB/BLG mixed lay-ers at W/A and W/H interfaces measured with the double capillaryfor a drop pending in air or in hexane, respectively. The presenteddata for the individual surfactants are in very good agreement withrecent literature data [23–25] showing that the plateaus indicatingCMC of the surfactant solutions appear for SDS at a concentrationCSDS = 5 � 10�3 M for both interfaces with PCMC,SDS = 36 mN/m(W/A) and 43 mN/m (W/H), and for DoTAB at a concentrationCDoTAB = 10�2 M for both interfaces with PCMC,DoTAB = 30 mN/m(W/A) and = 40 mN/m (W/H).
The adsorption isotherms for all mixed solutions in Figs. 1a and1c start at P = 15–16 mN/m for the W/A surface and at P = 25 mN/mfor the W/H interface the values of which correspond to those forthe pure protein solution at the respective interface suggestingnegligible effect of the added surfactants. A further increase of CS
causes a gradual increase of the surface pressure until concentra-tions close to the CMC are reached where the isotherms mergewith those for the pure surfactants. For the separate cases of simul-taneous and sequential adsorption (designated respectively Simand Seq in the figures and text below) the curves virtually coincidefor SDS/BLG mixtures at W/A surface and slightly differ from eachother when measured at the W/H interface. In contrast, for DoTAB/BLG mixtures the shift between simultaneous and sequentialadsorption data is well pronounced for both interfaces. Theseresults are further supported by the isotherms measured afterwashing out with buffer solutions (Figs. 1b and 1d) and by the rhe-ology data discussed further below (Figs. 2–5).

Fig. 1. (a and c) P–CS isotherms for SDS, DoTAB (jh) and SDS/BLG and DoTAB/BLG mixed adsorption layers at W/A (empty symbols) and W/H (full symbols) interfacesformed in sequential (ND) and simultaneous (ds) way. (b and d) P–CS isotherms for the same mixed adsorption layers after washing out with buffer solution. CBLG = 10�6 M,the corresponding surfactant/protein ratios RS/P scale is shown for comparison at the bottom of the figure. (Lines are guides for the eye).
Fig. 2. Dilational complex visco-elasticity modulus |E| of mixed SDS/BLG layers at water/air (full red symbols) and water/hexane (empty blue symbols) interfaces measuredafter simultaneous (a) and sequential (b) adsorption and after subsequent washing out with buffer solution (respectively c and d). CBLG = 10�6 M; drop oscillations withf = 0.01–0.2 Hz and area deformation DA/A = 7 %. (Lines are guides for the eye). (For interpretation of the references to color in this figure legend, the reader is referred to theweb version of this article.)
A. Dan et al. / Journal of Colloid and Interface Science 449 (2015) 383–391 385
Figs. 1b and 1d present the P–CS isotherms for SDS/BLG andDoTAB/BLG mixed layers at W/A and W/H interfaces measuredafter washing out with buffer solutions in stage II for simultaneous
and stage IV for sequential adsorption (see Section 2). Generally,increasing CSDS leads to a gradual decrease in the residual surfacepressures of the SDS/BLG layers indicating a reduced adsorbed

Fig. 3. Dependence of the dilational complex visco-elasticity modulus |E| on thesurface pressure P for SDS/BLG layers. The four curves on the right hand side withempty symbols correspond to the |E|-values measured after simultaneous (h ) orsequential ( ) adsorption at water/air (h ) and water/oil ( )interfaces, while the four curves on the left hand side with filled symbols correspondto the |E|-values measured after washing out for simultaneous (j ) or sequential( ) adsorption at water/air (j ) and water/oil ( ) interfaces.The arrow to the right points towards increasing P with increasing CSDS, correspond-ing to the adsorption curves in Fig. 1a. The arrow to the left points towards decreasingP with increasing CSDS for the washing out curves in Fig. 1c. The vertical dotted linesindicate the respective initial surface pressures for the W/A and W/H interfaces inFigs. 1a and 1c. CBLG = 10�6 M; drop oscillation frequency f = 0.1 Hz and relative areadeformation DA/A = 7%. (Lines are guides for the eye).
386 A. Dan et al. / Journal of Colloid and Interface Science 449 (2015) 383–391
amount after the washing out stage. Note, the course of the P–CSDS
curves differs in respect to the way the mixed layer (simultaneousor sequential) is formed. And also for the two types of interfacethese curves are different. As one can see in Fig. 1d this is notthe case for DoTAB/BLG mixed layers where continuous exchangeof the drop bulk with buffer does not lead to a decrease in surfacepressure but keeps virtually constant P-values for the layersformed in a sequential way. Interestingly an increase of the P-val-ues is observed after washing out of the layers formed in a simul-taneous way. The general trends in Figs. 1b and 1d clearlydemonstrate the main differences between the properties of BLG/surfactant layers for SDS or DoTAB.
Fig. 2 presents the dependence of the dilational complex visco-elasticity modulus |E| in the frequency range 0.01–0.2 Hz as a func-tion of the SDS concentration measured for mixed SDS/BLG layersin the corresponding cases shown in Figs. 1a and 1c. Figs. 1a, 2aand 2b show the general trends of the surface pressure and thedilational modulus of SDS/BLG layers with increasing CSDS. Sinceeven saturated SDS or DoTAB layers do exhibit much lower |E|-val-ues than those for the BLG layer at the studied concentration(10�6 M), the fact that the trends of P and |E| in the mixtures keepopposite directions, i.e. decrease of |E| with increasing P, is consis-tent with the continuous increase of the interfacial amount of SDSdue to competitive adsorption and subsequent replacement of theprotein (protein/surfactant complexes) from both the W/A [26–28]and the W/H interfaces [27,36] by unbound surfactant molecules.Figs. 1b, 2c and 2d show the change of P and |E| with increasingCSDS after the washing out stage. The most striking differencesamong the results appear in respect to the nature of the interfaceand especially as the consequence of the washing out processwhile the way of formation of the interfacial layers (simultaneousand sequential) seems to affect weaker their properties.
To further analyze the dilational rheology data for drawing clearconclusions about the properties of the mixed SDS/BLG layers weplot the data from Figs. 1a, 1b and 2 in terms of |E| vs. P for a fixedfrequency of 0.1 Hz (Fig. 3). The right-side curves with empty sym-bols correspond to the P–CSDS isotherms for the interfacial layersmeasured after simultaneous and sequential adsorption at W/Aand W/H interfaces while those on the left-side with filled symbolscorrespond to the respective P–CBLG curves after washing out.The adsorption and washing out data start from the same P- and|E|-values for each of the two interfaces (vertical dottedlines in Fig. 3) the values of which correspond to the lowest surfac-tant concentration CSDS = 10�6 M. The washing out protocol doesnot change the adsorption and rheological characteristics of thepreformed mixed layers, which are dominated by the protein, indi-cating negligible surfactant effects at this concentration. Furtherincrease of CSDS results in a rise of P for the adsorption case orreduction of P for the washing out case and both are accompaniedby a decrease of the dilational modulus. It is worth to note that theadsorption data in Fig. 3 are almost independent of the way of for-mation of the interfacial layers. On the contrary, the washing outcurves follow rather different courses. This demonstrates theadvantage of the washing out experimental protocol in gainingadditional indicative information for the state of the mixed layerswhich is discussed further below.
Fig. 4 presents the dependence of the dilational modulus |E| inthe frequency range 0.01–0.2 Hz on the DoTAB concentration mea-sured for mixed DoTAB/BLG layers in the respective cases in Fig. 1.The results for the DoTAB/BLG layers in Figs. 1c, 4a and 4b showthe same tendency, but somehow weaker, i.e. smaller dilationalvisco-elasticity modulus with increasing surfactant concentrationas compared to that for the SDS/BLG layers. The most striking dif-ference between the effects of different surfactants on the proteinlayer is evidenced by measurements of the residual surface pres-sures (Figs. 1c and 1d) and surface rheological parameters
(Figs. 2c,d and 4c,d) after the washing out procedure in the mixedsystems. As discussed further below, such distinction is due to theformation of various protein/surfactant complexes (either in thebulk or at the interface) which possess different adsorption ener-gies and respectively different resistance against desorption.
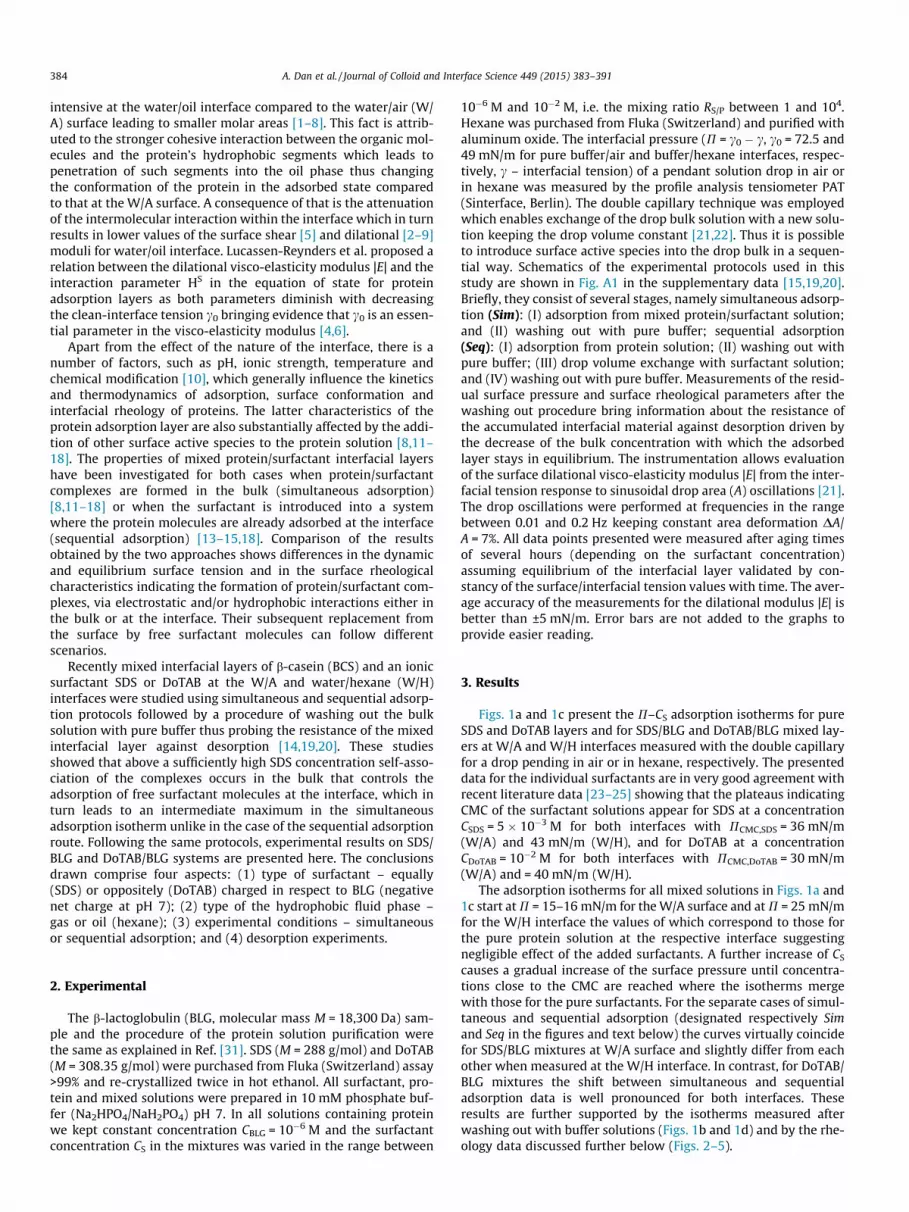
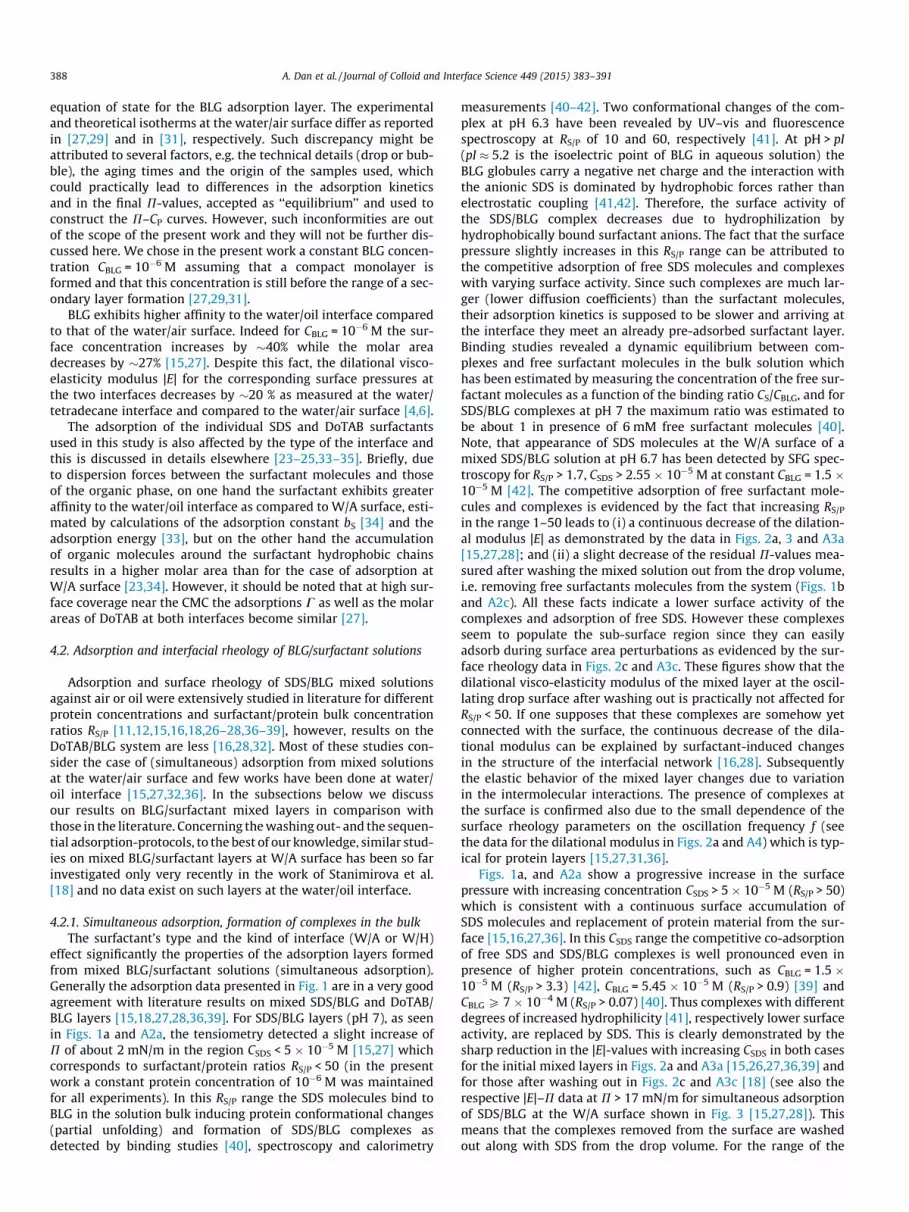
The influence of the type of the interface is also detected and itis well pronounced in the results obtained by both adsorption anddesorption experiments. Fig. 5 presents the combination of theadsorption and rheological data from Figs. 1a,c; 2a,b and 4a,b, plot-ted in terms of |E| vs. P for a fixed frequency of 0.1 Hz. Twobranches corresponding to one of the two interfaces are clearly dis-tinguished as the adsorption layers at the W/A surface reach higher|E|-values. In addition to the shift in the surface pressure and thedilational modulus between these two branches, it is obvious thatfor the W/H interface the data for both surfactants obtained bysimultaneous or sequential adsorption more or less merge eachother, except for the region of the highest P (highest CSDS). In con-trast, for the W/A surface the curves for the DoTAB/BLG system areshifted to higher P- and |E|-values as compared to those for theSDS/BLG system. There is also a difference in the profiles for simul-taneous and sequential adsorption of DoTAB/BLG layers at the W/Asurface.
Fig. 6 presents the |E|–P dependence for mixed DoTAB/BLG lay-ers after washing out with buffer. For both W/A and W/H inter-faces, the surface pressure of the washed out layers formedsequentially remains virtually constant with varying CDoTAB indi-cating the resistance of the protein material to desorption. Inter-estingly the residual surface pressure of the washed out layersformed in a simultaneous way even starts to increase as shownin Fig. 1d. For the W/A surface a pronounced difference is observedbetween the Sim and Seq data. The two curves start from similarconditions but follow opposite directions of the change in the elas-tic modulus. Seq-data show that at virtually constant surface pres-sure the |E|-values diminish with increasing CDoTAB. On thecontrary, the Sim-data show gradual increase of P and exhibit a
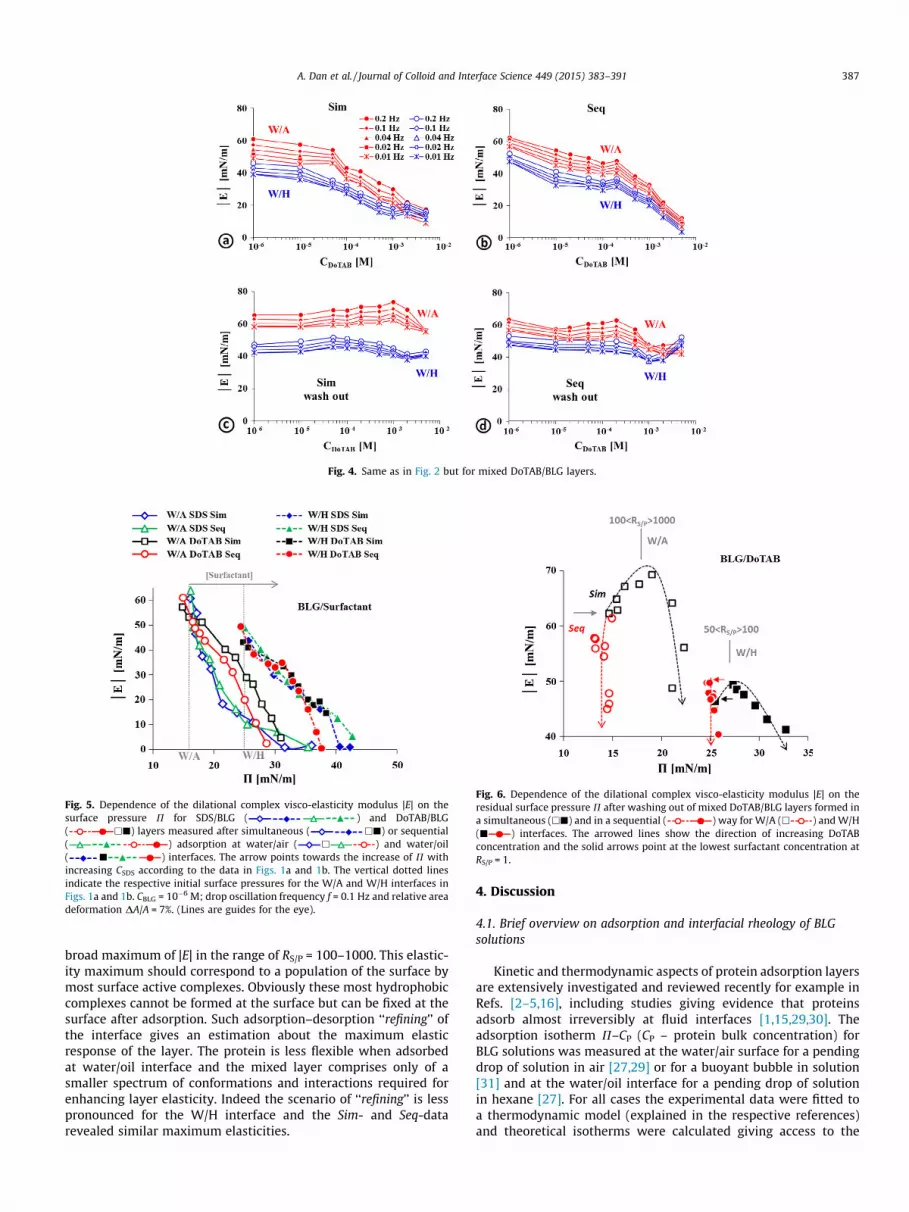
Fig. 4. Same as in Fig. 2 but for mixed DoTAB/BLG layers.
Fig. 5. Dependence of the dilational complex visco-elasticity modulus |E| on thesurface pressure P for SDS/BLG ( ) and DoTAB/BLG( hj) layers measured after simultaneous ( hj) or sequential( ) adsorption at water/air ( h ) and water/oil( j ) interfaces. The arrow points towards the increase of P withincreasing CSDS according to the data in Figs. 1a and 1b. The vertical dotted linesindicate the respective initial surface pressures for the W/A and W/H interfaces inFigs. 1a and 1b. CBLG = 10�6 M; drop oscillation frequency f = 0.1 Hz and relative areadeformation DA/A = 7%. (Lines are guides for the eye).
Fig. 6. Dependence of the dilational complex visco-elasticity modulus |E| on theresidual surface pressure P after washing out of mixed DoTAB/BLG layers formed ina simultaneous (hj) and in a sequential ( ) way for W/A (h ) and W/H(j ) interfaces. The arrowed lines show the direction of increasing DoTABconcentration and the solid arrows point at the lowest surfactant concentration atRS/P = 1.
A. Dan et al. / Journal of Colloid and Interface Science 449 (2015) 383–391 387
broad maximum of |E| in the range of RS/P = 100–1000. This elastic-ity maximum should correspond to a population of the surface bymost surface active complexes. Obviously these most hydrophobiccomplexes cannot be formed at the surface but can be fixed at thesurface after adsorption. Such adsorption–desorption ‘‘refining’’ ofthe interface gives an estimation about the maximum elasticresponse of the layer. The protein is less flexible when adsorbedat water/oil interface and the mixed layer comprises only of asmaller spectrum of conformations and interactions required forenhancing layer elasticity. Indeed the scenario of ‘‘refining’’ is lesspronounced for the W/H interface and the Sim- and Seq-datarevealed similar maximum elasticities.
4. Discussion
4.1. Brief overview on adsorption and interfacial rheology of BLGsolutions
Kinetic and thermodynamic aspects of protein adsorption layersare extensively investigated and reviewed recently for example inRefs. [2–5,16], including studies giving evidence that proteinsadsorb almost irreversibly at fluid interfaces [1,15,29,30]. Theadsorption isotherm P–CP (CP – protein bulk concentration) forBLG solutions was measured at the water/air surface for a pendingdrop of solution in air [27,29] or for a buoyant bubble in solution[31] and at the water/oil interface for a pending drop of solutionin hexane [27]. For all cases the experimental data were fitted toa thermodynamic model (explained in the respective references)and theoretical isotherms were calculated giving access to the
388 A. Dan et al. / Journal of Colloid and Interface Science 449 (2015) 383–391
equation of state for the BLG adsorption layer. The experimentaland theoretical isotherms at the water/air surface differ as reportedin [27,29] and in [31], respectively. Such discrepancy might beattributed to several factors, e.g. the technical details (drop or bub-ble), the aging times and the origin of the samples used, whichcould practically lead to differences in the adsorption kineticsand in the final P-values, accepted as ‘‘equilibrium’’ and used toconstruct the P–CP curves. However, such inconformities are outof the scope of the present work and they will not be further dis-cussed here. We chose in the present work a constant BLG concen-tration CBLG = 10�6 M assuming that a compact monolayer isformed and that this concentration is still before the range of a sec-ondary layer formation [27,29,31].
BLG exhibits higher affinity to the water/oil interface comparedto that of the water/air surface. Indeed for CBLG = 10�6 M the sur-face concentration increases by �40% while the molar areadecreases by �27% [15,27]. Despite this fact, the dilational visco-elasticity modulus |E| for the corresponding surface pressures atthe two interfaces decreases by �20 % as measured at the water/tetradecane interface and compared to the water/air surface [4,6].
The adsorption of the individual SDS and DoTAB surfactantsused in this study is also affected by the type of the interface andthis is discussed in details elsewhere [23–25,33–35]. Briefly, dueto dispersion forces between the surfactant molecules and thoseof the organic phase, on one hand the surfactant exhibits greateraffinity to the water/oil interface as compared to W/A surface, esti-mated by calculations of the adsorption constant bS [34] and theadsorption energy [33], but on the other hand the accumulationof organic molecules around the surfactant hydrophobic chainsresults in a higher molar area than for the case of adsorption atW/A surface [23,34]. However, it should be noted that at high sur-face coverage near the CMC the adsorptions C as well as the molarareas of DoTAB at both interfaces become similar [27].
4.2. Adsorption and interfacial rheology of BLG/surfactant solutions
Adsorption and surface rheology of SDS/BLG mixed solutionsagainst air or oil were extensively studied in literature for differentprotein concentrations and surfactant/protein bulk concentrationratios RS/P [11,12,15,16,18,26–28,36–39], however, results on theDoTAB/BLG system are less [16,28,32]. Most of these studies con-sider the case of (simultaneous) adsorption from mixed solutionsat the water/air surface and few works have been done at water/oil interface [15,27,32,36]. In the subsections below we discussour results on BLG/surfactant mixed layers in comparison withthose in the literature. Concerning the washing out- and the sequen-tial adsorption-protocols, to the best of our knowledge, similar stud-ies on mixed BLG/surfactant layers at W/A surface has been so farinvestigated only very recently in the work of Stanimirova et al.[18] and no data exist on such layers at the water/oil interface.
4.2.1. Simultaneous adsorption, formation of complexes in the bulkThe surfactant’s type and the kind of interface (W/A or W/H)
effect significantly the properties of the adsorption layers formedfrom mixed BLG/surfactant solutions (simultaneous adsorption).Generally the adsorption data presented in Fig. 1 are in a very goodagreement with literature results on mixed SDS/BLG and DoTAB/BLG layers [15,18,27,28,36,39]. For SDS/BLG layers (pH 7), as seenin Figs. 1a and A2a, the tensiometry detected a slight increase ofP of about 2 mN/m in the region CSDS < 5 � 10�5 M [15,27] whichcorresponds to surfactant/protein ratios RS/P < 50 (in the presentwork a constant protein concentration of 10�6 M was maintainedfor all experiments). In this RS/P range the SDS molecules bind toBLG in the solution bulk inducing protein conformational changes(partial unfolding) and formation of SDS/BLG complexes asdetected by binding studies [40], spectroscopy and calorimetry
measurements [40–42]. Two conformational changes of the com-plex at pH 6.3 have been revealed by UV–vis and fluorescencespectroscopy at RS/P of 10 and 60, respectively [41]. At pH > pI(pI � 5.2 is the isoelectric point of BLG in aqueous solution) theBLG globules carry a negative net charge and the interaction withthe anionic SDS is dominated by hydrophobic forces rather thanelectrostatic coupling [41,42]. Therefore, the surface activity ofthe SDS/BLG complex decreases due to hydrophilization byhydrophobically bound surfactant anions. The fact that the surfacepressure slightly increases in this RS/P range can be attributed tothe competitive adsorption of free SDS molecules and complexeswith varying surface activity. Since such complexes are much lar-ger (lower diffusion coefficients) than the surfactant molecules,their adsorption kinetics is supposed to be slower and arriving atthe interface they meet an already pre-adsorbed surfactant layer.Binding studies revealed a dynamic equilibrium between com-plexes and free surfactant molecules in the bulk solution whichhas been estimated by measuring the concentration of the free sur-factant molecules as a function of the binding ratio CS/CBLG, and forSDS/BLG complexes at pH 7 the maximum ratio was estimated tobe about 1 in presence of 6 mM free surfactant molecules [40].Note, that appearance of SDS molecules at the W/A surface of amixed SDS/BLG solution at pH 6.7 has been detected by SFG spec-troscopy for RS/P > 1.7, CSDS > 2.55 � 10�5 M at constant CBLG = 1.5 �10�5 M [42]. The competitive adsorption of free surfactant mole-cules and complexes is evidenced by the fact that increasing RS/P
in the range 1–50 leads to (i) a continuous decrease of the dilation-al modulus |E| as demonstrated by the data in Figs. 2a, 3 and A3a[15,27,28]; and (ii) a slight decrease of the residual P-values mea-sured after washing the mixed solution out from the drop volume,i.e. removing free surfactants molecules from the system (Figs. 1band A2c). All these facts indicate a lower surface activity of thecomplexes and adsorption of free SDS. However these complexesseem to populate the sub-surface region since they can easilyadsorb during surface area perturbations as evidenced by the sur-face rheology data in Figs. 2c and A3c. These figures show that thedilational visco-elasticity modulus of the mixed layer at the oscil-lating drop surface after washing out is practically not affected forRS/P < 50. If one supposes that these complexes are somehow yetconnected with the surface, the continuous decrease of the dila-tional modulus can be explained by surfactant-induced changesin the structure of the interfacial network [16,28]. Subsequentlythe elastic behavior of the mixed layer changes due to variationin the intermolecular interactions. The presence of complexes atthe surface is confirmed also due to the small dependence of thesurface rheology parameters on the oscillation frequency f (seethe data for the dilational modulus in Figs. 2a and A4) which is typ-ical for protein layers [15,27,31,36].
Figs. 1a, and A2a show a progressive increase in the surfacepressure with increasing concentration CSDS > 5� 10�5 M (RS/P > 50)which is consistent with a continuous surface accumulation ofSDS molecules and replacement of protein material from the sur-face [15,16,27,36]. In this CSDS range the competitive co-adsorptionof free SDS and SDS/BLG complexes is well pronounced even inpresence of higher protein concentrations, such as CBLG = 1.5 �10�5 M (RS/P > 3.3) [42], CBLG = 5.45 � 10�5 M (RS/P > 0.9) [39] andCBLG P 7 � 10�4 M (RS/P > 0.07) [40]. Thus complexes with differentdegrees of increased hydrophilicity [41], respectively lower surfaceactivity, are replaced by SDS. This is clearly demonstrated by thesharp reduction in the |E|-values with increasing CSDS in both casesfor the initial mixed layers in Figs. 2a and A3a [15,26,27,36,39] andfor those after washing out in Figs. 2c and A3c [18] (see also therespective |E|–P data at P > 17 mN/m for simultaneous adsorptionof SDS/BLG at the W/A surface shown in Fig. 3 [15,27,28]). Thismeans that the complexes removed from the surface are washedout along with SDS from the drop volume. For the range of the

A. Dan et al. / Journal of Colloid and Interface Science 449 (2015) 383–391 389
highest measured concentrations CSDS > 2 � 10�3 M (RS/P > 2000)most of the complexes are displaced from the surface by free SDS[18,26] which is shown in Figs. 1a and A2a by the merging of theP–CSDS isotherms for the mixed layers with that for layers of pureSDS solutions [15,27,36,39]. It should be noted, the correlationbetween results from binding studies and ring tensiometry,reported in Ref. [40], shows that at protein concentrationsCBLG P 7 � 10�4 M the surface layer can be still partially occupiedby complexes even in the presence of unbound SDS at concentra-tions up to about 6 mM. However, at similar surfactant concentra-tions an almost complete displacement of any protein moleculesfrom the surface [15,27,36] and wash out from the drop is likelyif the protein concentration is lower as it is in the present work(CBLG = 10�6 M). This is proved by the data in Figs. 1b and A2cwhich show only negligible residual surface pressures measuredafter washing out of the mixed solutions. The absence of com-plexes at the surface is further confirmed by the plateau valuesof the dilational modulus for both cases of initial adsorption inFigs. 2a and A3a and after washing out as shown in Figs. 2c andA3c. These values (see also Fig. A4a) are comparable to those typ-ical for low-molecular-mass surfactants. In this paper we do notconsider in detail the point of the frequency dependence of thedilational modulus but just emphasize its impact on the diagnos-tics of protein/surfactant adsorption layer composition [27,31].For illustration, Fig. A4b in the supplementary data shows the fre-quency dependent values of the complex dilational modulus |E|and the corresponding real part E0 (dilational elasticity) and imag-inary part E’’ (dilational viscosity) for the two cases of RS/P = 1(‘‘protein-rich’’ regime) and RS/P = 1000 (‘‘protein-poor’’ regime)from Fig. A4a. Obviously, the protein/surfactant interfacial layeris predominantly elastic than viscous since the values for E0 and|E| are rather close in both cases.
For SDS/BLG solutions at pH < pI the protein net charge is posi-tive and the electrostatic interaction with SDS anions leads tostronger binding of surfactant and formation of hydrophobic com-plexes [41] of higher surface activity [40,42]. Surface charge rever-sal and maximum ellipsometric layer thickness have been detectedin the range of RS/P between 2 and 10, CBLG = 1.5 � 10�5 M [42]which can be attributed to multilayer adsorption of neutral SDS/BLG complexes.
A similar scenario holds at pH > pI when BLG is mixed with thecationic surfactant DoTAB. Electrostatic coupling between DoTA+
ions and negatively charged groups in the protein molecule leadsto much higher binding ratios of DoTAB than those for the anionicSDS under the same pH-conditions. Increase in the surfactant con-centration leads: (i) to the formation of DoTAB/BLG complexeswith increasing hydrophobicity, i.e. surface activity, until a chargereversal of the complex occurs which is evidenced by bulkprecipitation; and (ii) subsequently to hydrophilization of the neu-tral complex [40,43]. Precipitation of DoTAB/BLG solutions at pH6.7 has been observed at RS/P � 100 [43]. Below this ratio(CDoTAB < 10�4 M in the present study), the adsorption data inFigs. 1c and A2c show only a weak increase in surface pressurewith increasing CDoTAB. The corresponding surface rheology datain Figs. 4a and A3a show only a slight decrease of the dilationalmodulus. These results reveal a higher surface activity of suchhydrophobic DoTAB/BLG complexes as compared to those of SDS/BLG complexes. This is further confirmed by the fact that low sur-factant concentrations change neither the residual surface pressure(Figs. 1d, A2c) nor the dilational modulus (Figs. 4c and A3c) of themixed layers after the washing out procedure. This means that themore hydrophobic DoTAB/BLG complexes are not removed fromthe system in contrast to the SDS/BLG complexes under the sameconditions. At higher surfactant concentrations CDoTAB > 5 � 10�5 M,RS/P > 50, the surface pressure of the mixed solutions graduallyincreases due to co-adsorption of unbound DoTAB molecules and
the adsorption isotherm for the mixed layers merge with that forthe pure DoTAB at CDoTAB > 5 � 10�3 M, i.e. RS/P > 5000 (Figs. 1cand A2a). This is accompanied by a gradual reduction in the dila-tional modulus [28] (Figs. 4a and A3a) which implies decreasedintensity of the intermolecular interactions responsible for theelastic behavior of the layer. At RS/P = 5000, the rather high abso-lute values indicate still a partial occupation of the surface byprotein complexes. The higher surface activity of the hydrophobicDoTAB/BLG complex as compared to the SDS/BLG complexes at theW/A surface is evidenced in Fig. 5 by the higher |E|-values at a cer-tain surface pressure in the range 17 < P < 30 mN/m (50 < RS/P <5000). Furthermore, the most striking difference between the sur-face properties of these two systems is demonstrated by the datameasured after the washing out procedure. The values of the resid-ual surface pressures in Figs. 1d and A2c do not decrease, as it is thecase for the SDS/BLG system [18], but on the contrary they evenincrease with increasing surfactant concentration for ratios RS/P >50. Such rise in surface pressure suggests a reorganization of themixed surface layer after removing the free surfactant. A possiblemechanism could be that only strongly bound DoTAB molecules– due to electrostatic coupling – are included in the compositionof the neutral hydrophobic complexes which are more surfaceactive than the original protein. Obviously such complexes arecapable to maintain a similar or even an enhanced elastic behaviorof the surface layer as revealed by the rheology data for the dila-tional modulus in Figs. 4c and A3c. To further elucidate this pointthe course of the |E|–P curves for the washed out Sim-layers inFig. 6 can be used. A well pronounced maximum is observed withincreasing CDoTAB in the range 100 < RS/P < 1000 for the W/A surfaceand in the range 50 < RS/P < 100 for the W/H interface. This maxi-mum corresponds more or less to a DoTAB/BLG ratio of RS/P �100 [43] at which precipitation in the solution occurs. Therefore,the observed increase of the residual surface pressure should beaccounted for with increase of the adsorbed amount due to thepossible formation of a multilayer structure induced by the lackof co-adsorbing surfactant. In any case, although the system showsan increasing P, the maximum of the dilational modulus suggestsan optimum state of highest elasticity.
Finally the effect of the interface type on the properties of thedifferent mixed layers obtained by simultaneous adsorption willbe discussed. Generally identical mixed solution compositionsexhibit always higher surface pressures at the W/H interface whencompared to the W/A surface (Figs. 1 and A2). Such tendency istypical for protein solutions in absence of surfactants for whichthe water/oil interface is characterized with higher surface cover-age and smaller areas per molecule [4,6,15,27]. The general trendof the elastic modulus in the |E|–P dependence for the differentinterfaces is illustrated in Figs. 3 and 5. There are two distinguishedbranches corresponding to the data for W/A and W/H interfaces.The branch for W/H interface starts at lower |E|-values and isshifted towards higher surface pressures than for the W/A surfacewith DP of about 10 mN/m, i.e. similar values of the elastic mod-ulus require higher surface pressure at the W/H interface. It is alsoobvious from Fig. 5 that the effect of the type of the surfactant ismuch weaker for the W/H interface which can be attributed tothe stronger anchoring of the protein molecules and/or of the com-plexes into the oil phase suggesting a decreased ability of theadsorbed protein material to be modified by surfactant. A possiblemechanism could be a partial release of surfactant molecules fromthe (bulk) complexes due to specific conformational changes in theadsorbed BLG globules induced by the high affinity of some proteinsegments to the condensed hydrophobic phase [14,15]. Furtherinformation about the properties of the mixed layers at differentinterfaces is provided by the results for the residual |E|- and P-val-ues after washing out (Figs. 1–4, A2 and A3). The |E|–P dependencefor the washed-out SDS/BLG layers show individual trends for the

390 A. Dan et al. / Journal of Colloid and Interface Science 449 (2015) 383–391
different interfaces and any direct comparison is complicated(Figs. 2c and A3c,d). However, the data suggest a higher resistanceto desorption of protein material from the W/H interface. Thehigher interfacial affinity of the DoTAB/BLG complexes in compar-ison to the SDS/BLG ones is again affirmed by the virtual constancyof the residual dilational modulus with increasing surfactantconcentrations up to CDoTAB = 5 � 10�3 M, i.e. RS/P = 5000.
4.2.2. Sequential adsorption, formation of complexes at the interfaceThe adsorption and rheological characteristics of mixed layers
formed on a sequential route (Seq) by a subsequent injection ofthe surfactant into a system with pre-adsorbed protein can differfrom those of layers obtained from the traditional route of adsorp-tion of both components from a mixed solutions (simultaneousadsorption, Sim) [14,15,18]. However, our results revealed similartrends of the measured dependences P–CS (Figs. 1 and A2) and|E|–CS (Figs. 2, 4 and A3). Interestingly the |E|–P plots in Figs. 3and 5 for the SDS/BLG system are practically identical for bothexperimental protocols and only the effect of the type of the inter-face is well distinguished by the shift of the data for W/H to highersurface pressure and lower dilational modulus. This was discussedin the previous section as the main difference between the twointerfaces. The overlap of the |E|–P plots for the SDS/BLG system(Fig. 3) is an indication that binding of SDS and BLG is not signifi-cantly influenced by the location of interactions either in the bulkor at the interface. However, Figs. 1b,d and A2c,d show slightlyhigher residual surface pressures after washing out of the Seqmixed layers at both W/A and W/H interfaces.
As it was discussed above, the more hydrophobic DoTAB/BLGcomplexes formed in the bulk solution compete with free surfactantmolecules for the surface area much stronger than the more hydro-philic SDS/BLG ones. At surfactant concentrations CDoTAB > 5 �10�5 M, RS/P > 50, the adsorption isotherm P–CS for the mixed layerseither at W/A or at W/H interfaces splits into two branches and thelower ones correspond to the Seq-data (Figs. 1a,c and A2a,b). Obvi-ously, DoTAB/BLG complexes formed in the bulk can achieve highersurface pressures compared to complexes formed at the interface,however, this does not influence significantly the course of the|E|–CS dependence in Figs. 4a,b and A3a,b. These differences arebetter illustrated by the |E|–P plots in Fig. 5 which show that for acertain surface pressure achieved at the W/A surface the Sim-layersare more elastic than the Seq-layers whereas for the W/H interfacethis difference is only pronounced at high surface pressuresP > 35 mN/m (CDoTAB > 5 � 10�4 M, i.e. for RS/P > 500).
The most striking difference between the properties of the Sim-and the Seq-mixed layers is detected by the data gained from thewashing out experiments (Figs. 1d and A2c,d). The residual surfacepressures for the Seq-mixed layers at both W/A and W/H interfacesare virtually independent of the surfactant/protein ratio, in con-trast to the Sim-mixed layers discussed in the previous section.The protein matrix of the mixed layer maintains residual surfacepressures virtually independent of the increasing CDoTAB. Obvi-ously, such mixed layers are resistant to desorption but at the sametime become less elastic with increasing CDoTAB. This suggests con-formational changes of the complex interfacial network due to fur-ther incorporation of surfactant molecules into the protein matrix[16,28]. It seems that the adsorption of free DoTAB molecules ispartially restricted by the complexes formed at the surface (Seqmode) whereas in common mixed solutions the complexescompete for the surface with the smaller and faster free surfactantmolecules (Sim mode). However, higher surface coverage andmaximum elasticity are achieved after washing out the Sim-mixedlayers which means that the complexes formed at the interfacesomehow do not entirely develop the surface activity responsedemonstrated by the complexes formed in the bulk and subse-quently isolated and fixed at the surface by removing the free sur-
factant (Figs. 6 and A5). It is worth to note that this hypotheticscenario holds for both interfaces. Apart from the typical shift tohigher P- and lower |E|-values, the Sim-wash out data for theW/H interface differ from those for the W/A surface by the optimalsurfactant/protein ratio for achieving a maximum elasticity (Fig. 6).The lower optimal ratio for the W/H system suggests restrictedbinding of DoTAB molecules to parts of the protein protruding intothe condensed organic phase.
5. Conclusions
We measured the surface pressure P and the dilational visco-elasticity modulus |E| of DoTAB/BLG and SDS/BLG mixed layers atW/A and W/H interfaces. The interpretation of the data aims at fur-ther elucidating the mechanisms of formation and adsorption ofthe protein/surfactant complexes under different conditions suchas the surface activity of different types of complexes, competitiveadsorption of free surfactant and replacement of the complexesfrom the interface [14,15,18,20,26–28,32,36,42]. At a fixed pH thesurfactant charge significantly influences the conformation andhydrophobic/hydrophilic balance of the formed protein/surfactantcomplexes [40,41,43], i.e. their surface activity, and subsequentlythe adsorption, desorption and rheological characteristics of themixed adsorption layer [15,19,20,28,32]. At pH 7 the SDS/BLG com-plexes are in an intensive competition for the surface area withincreasing amount of unbound surfactant molecules [26,27,36].They are progressively replaced from the surface by increasingsurfactant concentrations and washed out along with the freesurfactant from the system [18]. The adsorption isotherm ofBLG/surfactant mixed solutions did not show an intermediatemaximum as in the case of b-casein/surfactant ones [14,19,20]which is the most striking difference when comparing binding ofsurfactant to a globular or a random-coil protein. However, somepeculiarities were observed in the wash out results from simulta-neous and sequential experiments as detected also for b-casein/SDS mixed layers [14,15,19,20]. The surface activity and the resis-tance against desorption of the DoTAB/BLG complexes are muchhigher due to the hydrophobization via electrostatic binding of sur-factant ions. The DoTAB/BLG complexes formed at the interface aresomehow restricted to hydrophobic modification by the surfactantand the elastic response of the Seq-mixed layers is reduced. Maxi-mum layer elastic performance is achieved by isolating the mostsurface active complexes at the interface which can be accom-plished by washing out the Sim-mixed layers at surfactant/proteinratios between 100 and 1000 for the W/A surface. Such state can berelated to the reversal of the complex net charge observed for solu-tion with surfactant/protein ratios of about 100 [43]. Generally thespecific effects discussed above are less pronounced at the W/Hinterface because of immobilization of the adsorbed protein mate-rial [6,9,27,36] and spatial deficit of protein exposure available forsurfactant binding due to the partial penetration of protein partsinto the condensed organic phase. Further interest is to test thediscussed tendencies in the interfacial behavior of BLG/ionic sur-factant/buffer systems by exploring solution formulations withvarying pH as well as formulations containing food-scale proteinconcentrations. Such achievement would be well complementedby detailed studies on the frequency dependence of the visco-elasticity characteristics of the mixed layers and especially at highfrequencies f > 0.2 Hz.
Acknowledgments
Financial support by the DFG-AiF cluster project on ‘‘ProteinFoams’’ Mi418/20-2 and by the COST actions CM1101 andMP1106 are gratefully acknowledged.
A. Dan et al. / Journal of Colloid and Interface Science 449 (2015) 383–391 391
Appendix A. Supplementary material
Supplementary data can be found in a separate file in the onlineversion. Fig. A1 shows schematics of the experimental protocolsused in this study. Figs. A2–A5 present the same data as in the textbut re-plotted in appropriate combinations for better illustration ofthe specific effects. Supplementary data associated with this articlecan be found, in the online version, at http://dx.doi.org/10.1016/j.jcis.2015.01.035.
References
[1] F. MacRitchie, in: D. Möbius, R. Miller (Eds.), Proteins at Liquid Interfaces.Studies in Interface Science, vol. 7, Elsevier, Amsterdam, 1998, p. 149.
[2] M.A. Bos, T. van Vliet, Adv. Colloid Interface Sci. 91 (2001) 437–471.[3] J. Benjamins, E.H. Lucassen-Reynders, Interfacial rheology of adsorbed protein
layers, in: R. Miller, L. Liggieri (Eds.), Interfacial Rheology. Progress in Colloidand Interface Science Leyden, Brill, 2009, pp. 253–302.
[4] E.H. Lucassen-Reynders, J. Benjamins, V.B. Fainerman, Curr. Opin. ColloidInterface Sci. 15 (2010) 264–270.
[5] V. Mitropoulos, A. Mütze, P. Fischer, Adv. Colloid Interface Sci. 206 (2014) 195–206.
[6] J. Benjamins, J. Lyklema, E.H. Lucassen-Reynders, Langmuir 22 (2006) 6181–6188.
[7] R. Wüstneck, B. Moser, G. Muschiolik, Colloids Surf. B 15 (1999) 263–273.[8] R. Miller, E.V. Aksenenko, V.S. Alahverdjieva, V.B. Fainerman, C.S. Kotsmar, J.
Krägel, M.E. Leser, J. Maldonado-Valderrama, V. Pradines, C. Stefaniu, A. Stocco,R. Wüstneck, Thermodynamics and kinetics of mixed protein/surfactantadsorption layers at liquid interfaces, in: J.M. Ruso, Á. Piñeiro (Eds.), Proteinsin Solution and at Interfaces: Methods and Applications in Biotechnology andMaterials Science, John Wiley & Sons, Inc., 2013 (Ch. 20).
[9] J. Maldonado-Valderrama, R. Miller, V.B. Fainerman, P.J. Wilde, V.J. Morris,Langmuir 26 (20) (2010) 15901–15908.
[10] B.S. Murray, Curr. Opin. Colloid Interface Sci. 7 (2002) 426–431 (and thereferences therein).
[11] A.R. Mackie, Curr. Opin. Colloid Interface Sci. 9 (2004) 357–361.[12] A.R. Mackie, P.J. Wilde, Adv. Colloid Interface Sci. 117 (2005) 3–13.[13] J. Maldonado-Valderrama, J.M.R. Patino, Curr. Opin. Colloid Interface Sci. 15
(2010) 271–282.[14] A. Dan, G. Gochev, J. Krägel, E.V. Aksenenko, V.B. Fainerman, R. Miller, Curr.
Opin. Colloid Interface Sci. 18 (2013) 302–310.[15] C.s. Kotsmar, V. Pradines, V.S. Alahverdjieva, E.V. Aksenenko, V.B. Fainerman,
V.I. Kovalchuk, J. Krägel, M.E. Leser, B.A. Noskov, R. Miller, Adv. ColloidInterface Sci. 150 (2009) 41–54.
[16] B.A. Noskov, Adv. Colloid Interface Sci. 206 (2014) 222–238.[17] K.D. Danov, P.A. Kralchevsky, G.M. Radulova, E.S. Basheva, S.D. Stoyanov, E.G.
Pelan, Adv. Colloid Interface Sci. (2014), http://dxdoi.org/10.1016/j.cis.2014.04.009.
[18] R.D. Stanimirova, K.G. Marinova, K.D. Danov, P.A. Kralchevsky, E.S. Basheva,S.D. Stoyanov, E.G. Pelan, Colloids Surf. A 457 (2014) 307–317.
[19] A. Dan, R. Wüstneck, J. Krägel, E.V. Aksenenko, V.B. Fainerman, R. Miller,Langmuir 29 (2013) 2233–2241.
[20] A. Dan, Cs. Kotsmar, J.K. Ferry, A. Javadi, M. Karbaschi, J. Krägel, R. Wüstneck, R.Miller, Soft Matter 8 (2012) 6057.
[21] A. Javadi, N. Mucic, M. Karbaschi, J.Y. Won, M. Lotfi, A. Dan, V. Ulaganathan, G.Gochev, A.V. Makievski, V.I. Kovalchuk, N.M. Kovalchuk, J. Krägel, R. Miller, Eur.Phys. J.: Spec. Top. 222 (2013) 7–29.
[22] M.A. Cabrerizo-Vilchez, H.A. Wege, J.A. Holgado-Terriza, A.W. Neumann, Rev.Sci. Instrum. 70 (1999) 2438.
[23] T.D. Gurkov, D.T. Dimitrova, K.G. Marinova, C. Bilke-Crause, C. Gerber, I.B.Ivanov, Colloids Surf. A 261 (2005) 29–38.
[24] V.B. Fainerman, S.V. Lylyk, E.V. Aksenenko, J.T. Petkov, J. Yorke, R. Miller,Colloids Surf. A 354 (2010) 8–15.
[25] A. Javadi, N. Mucic, D. Vollhardt, V.B. Fainerman, R. Miller, J. Colloid InterfaceSci. 351 (2010) 537–541.
[26] A.R. Mackie, P. Gunning, P.J. Wilde, V.J. Morris, Langmuir 16 (2000) 8176–8181.
[27] V. Pradines, J. Krägel, V. Fainerman, R. Miller, J. Phys. Chem. B 113 (2009) 745–751.
[28] A.A. Mikhailovskaya, B.A. Noskov, S.-Y. Lin, G. Loglio, R. Miller, J. Phys. Chem. B115 (2011) 9971–9979.
[29] V.B. Fainerman, R. Miller, Colloid J. 67 (2005) 393–404.[30] V.B. Fainerman, R. Miller, J.K. Ferri, H. Watzke, M.E. Leser, M. Michel, Adv.
Colloid Interface Sci. 123–126 (2006) 163–171.[31] G. Gochev, I. Retzlaff, E.V. Aksenenko, V.B. Fainerman, R. Miller, Colloids Surf. A
422 (2013) 33–38.[32] V. Pradines, V.B. Fainerman, E.V. Aksenenko, J. Krägel, R. Wüstneck, R. Miller,
Langmuir 27 (2011) 965–971.[33] K. Medrzycka, W. Zwierzykowski, J. Colloid Interface Sci. 230 (2000) 67–72.[34] C.s. Kotsmar, E.V. Aksenenko, V.B. Fainerman, V. Pradines, J. Krägel, R. Miller,
Colloids Surf. A 354 (2010) 210–217.[35] V. Pradines, V.B. Fainerman, E.V. Aksenenko, J. Krägel, N. Mucic, R. Miller,
Colloids Surf. A 371 (2010) 22–28.[36] J. Krägel, M. O’Neill, A.V. Makievski, M. Michel, M.E. Leser, R. Miller, Colloids
Surf. B 31 (2003) 107–114.[37] V. Ulaganathana, B. Bergenstahl, J. Krägel, R. Miller, Colloids Surf. A 413 (2012)
136–141.[38] V. Ulaganathan, M. Krzan, M. Lotfi, S.S. Dukhin, V.I. Kovalchuk, A.f. Javadi, D.Z.
Gunes, C. Gehin-Delval, K. Malysa, R. Miller, Colloids Surf. A 460 (2014) 361–368.
[39] F.J. Lech, P. Steltenpool, M.B.J. Meindersa, S. Sforza, H. Gruppen, P.A. Wierenga,Colloids Surf. A 462 (2014) 34–44.
[40] S. Magdassi, Y. Vinetsky, P. Relkin, Colloids Surf. B 6 (1996) 353–362.[41] A. Taheri-Kafrani, A.-K. Bordbar, S.H.-A. Mousavi, T. Haertlé, J. Agric. Food
Chem. 56 (2008) 7528–7534.[42] K. Engelhardt, U. Weichsel, E. Kraft, D. Segets, W. Peukert, B. Braunschweig, J.
Phys. Chem. B 118 (2014) 4098–4105.[43] A. Taheri-Kafrani, E. Asgari-Mobarakeh, A.-K. Bordbar, T. Haertlé, Colloids Surf.
B 75 (2010) 268–274.
Related Documents