The INL is a U.S. Department of Energy National Laboratory operated by Battelle Energy Alliance INL/EXT-13-29671 Tensile Properties of Alloy 617 Bar Stock J. K. Wright N. J. Lybeck R. N. Wright July 2013

Welcome message from author
This document is posted to help you gain knowledge. Please leave a comment to let me know what you think about it! Share it to your friends and learn new things together.
Transcript

The INL is a U.S. Department of Energy National Laboratory operated by Battelle Energy Alliance
INL/EXT-13-29671
Tensile Properties of Alloy 617 Bar Stock
J. K. WrightN. J. LybeckR. N. Wright
July 2013

DISCLAIMERThis information was prepared as an account of work sponsored by an
agency of the U.S. Government. Neither the U.S. Government nor any agency thereof, nor any of their employees, makes any warranty, expressed or implied, or assumes any legal liability or responsibility for the accuracy, completeness, or usefulness, of any information, apparatus, product, or process disclosed, or represents that its use would not infringe privately owned rights. References herein to any specific commercial product, process, or service by trade name, trade mark, manufacturer, or otherwise, does not necessarily constitute or imply its endorsement, recommendation, or favoring by the U.S. Government or any agency thereof. The views and opinions of authors expressed herein do not necessarily state or reflect those of the U.S. Government or any agency thereof.
INL/EXT-13-29671
Tensile Properties of Alloy 617 Bar Stock
J. K. WrightN. J. Lybeck R. N. Wright
July 2013
Idaho National LaboratoryIdaho Falls, Idaho 83415
http://www.inl.gov
Prepared for theU.S. Department of EnergyOffice of Nuclear Energy
Under DOE Idaho Operations OfficeContract DE-AC07-05ID14517


iv
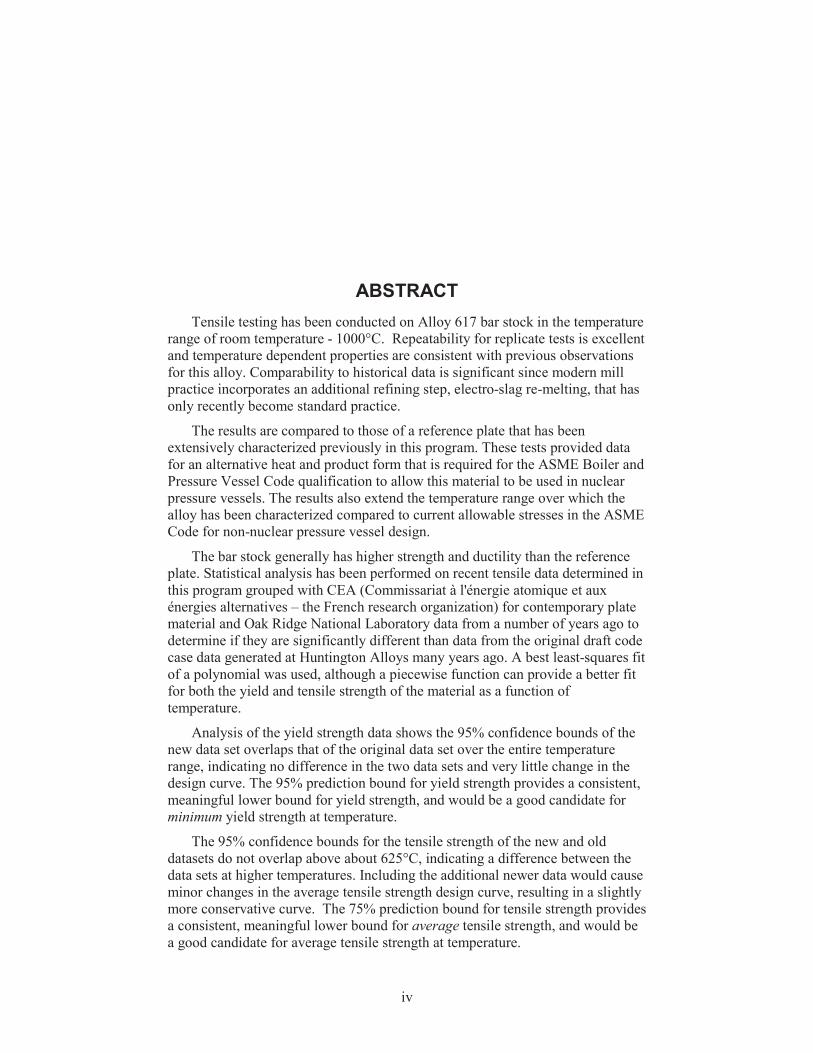
ABSTRACTTensile testing has been conducted on Alloy 617 bar stock in the temperature
range of room temperature - 1000°C. Repeatability for replicate tests is excellent and temperature dependent properties are consistent with previous observations for this alloy. Comparability to historical data is significant since modern mill practice incorporates an additional refining step, electro-slag re-melting, that has only recently become standard practice.
The results are compared to those of a reference plate that has been extensively characterized previously in this program. These tests provided data for an alternative heat and product form that is required for the ASME Boiler and Pressure Vessel Code qualification to allow this material to be used in nuclear pressure vessels. The results also extend the temperature range over which the alloy has been characterized compared to current allowable stresses in the ASME Code for non-nuclear pressure vessel design.
The bar stock generally has higher strength and ductility than the reference plate. Statistical analysis has been performed on recent tensile data determined in this program grouped with CEA (Commissariat à l'énergie atomique et aux énergies alternatives – the French research organization) for contemporary plate material and Oak Ridge National Laboratory data from a number of years ago to determine if they are significantly different than data from the original draft code case data generated at Huntington Alloys many years ago. A best least-squares fit of a polynomial was used, although a piecewise function can provide a better fit for both the yield and tensile strength of the material as a function of temperature.
Analysis of the yield strength data shows the 95% confidence bounds of the new data set overlaps that of the original data set over the entire temperature range, indicating no difference in the two data sets and very little change in the design curve. The 95% prediction bound for yield strength provides a consistent, meaningful lower bound for yield strength, and would be a good candidate for minimum yield strength at temperature.
The 95% confidence bounds for the tensile strength of the new and old datasets do not overlap above about 625°C, indicating a difference between the data sets at higher temperatures. Including the additional newer data would cause minor changes in the average tensile strength design curve, resulting in a slightly more conservative curve. The 75% prediction bound for tensile strength provides a consistent, meaningful lower bound for average tensile strength, and would be a good candidate for average tensile strength at temperature.

v
vi
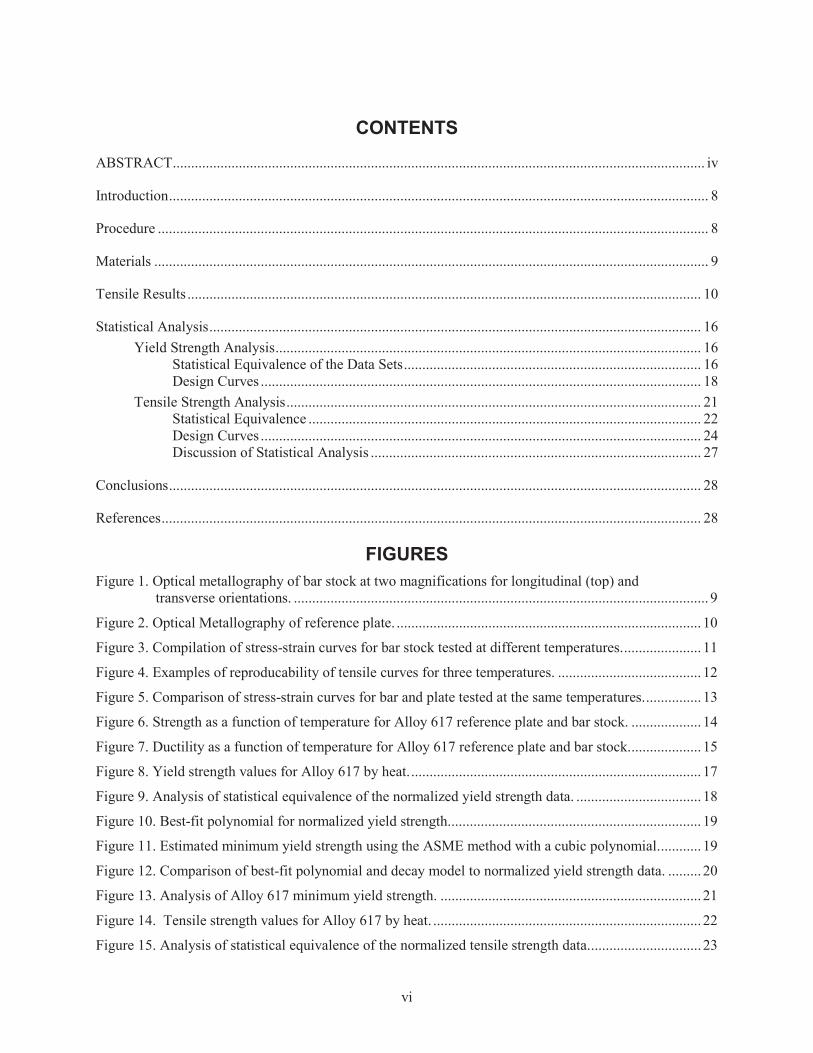
CONTENTS
ABSTRACT................................................................................................................................................. iv
Introduction................................................................................................................................................... 8
Procedure ...................................................................................................................................................... 8
Materials ....................................................................................................................................................... 9
Tensile Results ............................................................................................................................................ 10
Statistical Analysis...................................................................................................................................... 16 Yield Strength Analysis.................................................................................................................... 16
Statistical Equivalence of the Data Sets................................................................................. 16 Design Curves ........................................................................................................................ 18
Tensile Strength Analysis................................................................................................................. 21 Statistical Equivalence ........................................................................................................... 22 Design Curves ........................................................................................................................ 24 Discussion of Statistical Analysis .......................................................................................... 27
Conclusions................................................................................................................................................. 28
References................................................................................................................................................... 28
FIGURESFigure 1. Optical metallography of bar stock at two magnifications for longitudinal (top) and
transverse orientations. ................................................................................................................. 9
Figure 2. Optical Metallography of reference plate. ................................................................................... 10
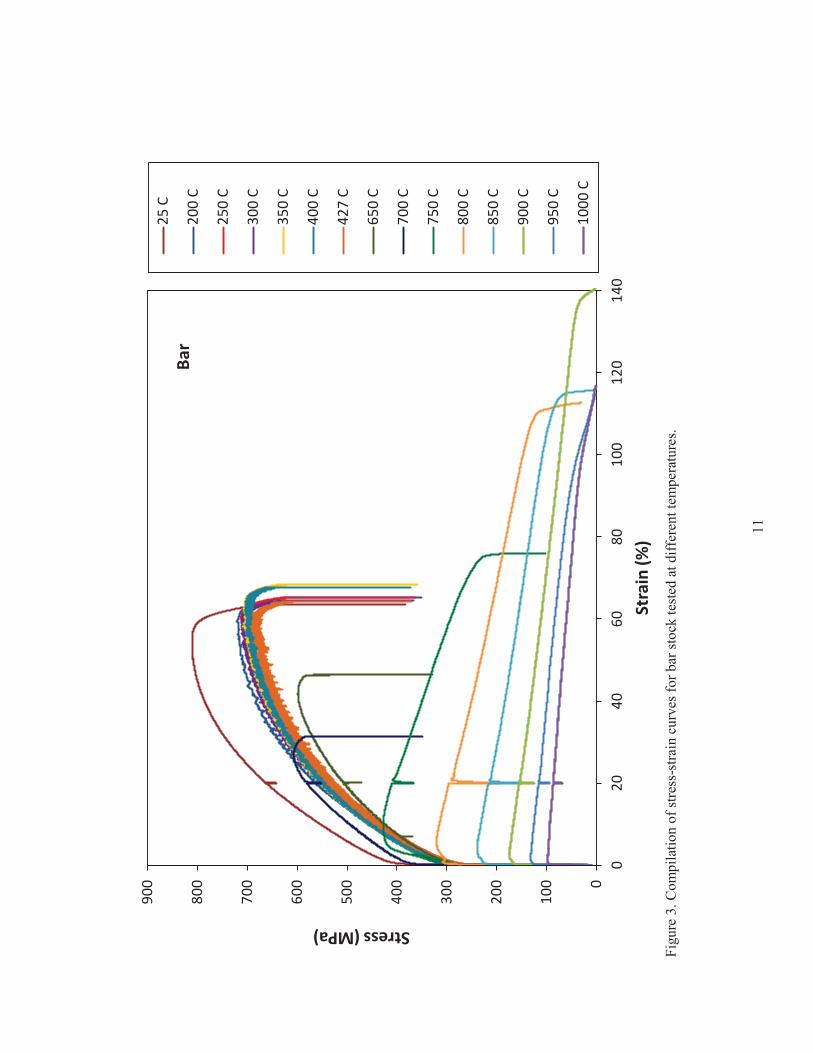
Figure 3. Compilation of stress-strain curves for bar stock tested at different temperatures...................... 11
Figure 4. Examples of reproducability of tensile curves for three temperatures. ....................................... 12
Figure 5. Comparison of stress-strain curves for bar and plate tested at the same temperatures................ 13
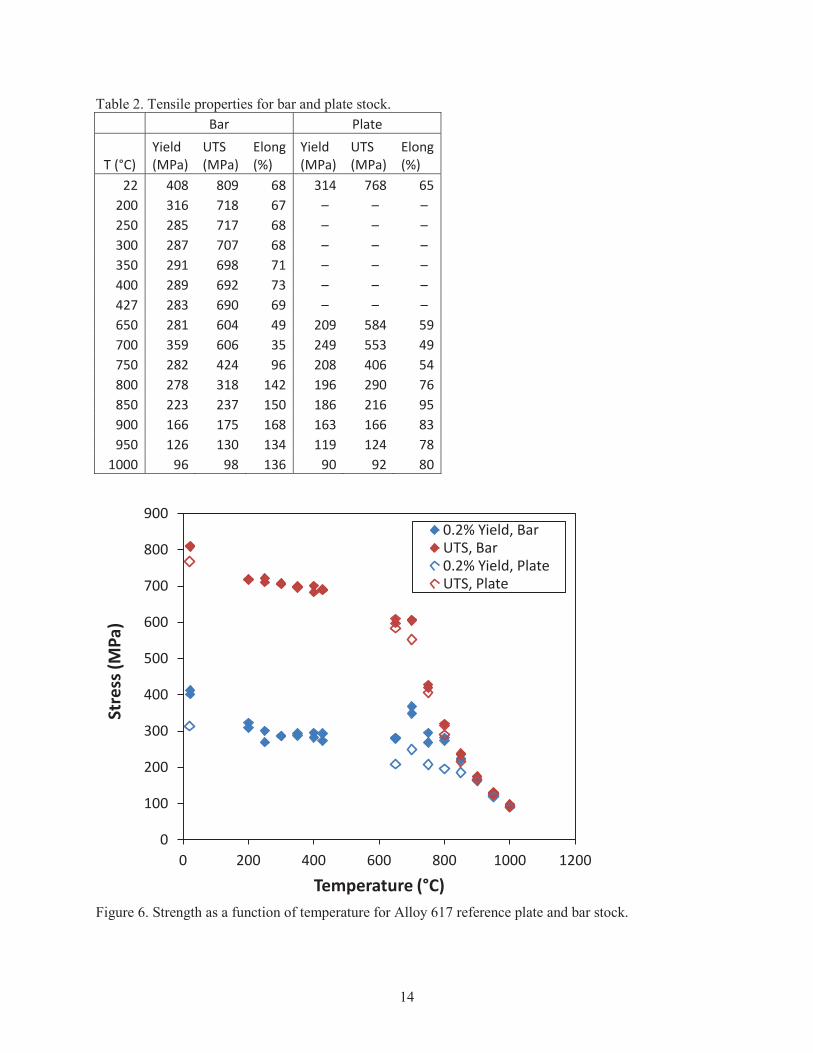
Figure 6. Strength as a function of temperature for Alloy 617 reference plate and bar stock. ................... 14
Figure 7. Ductility as a function of temperature for Alloy 617 reference plate and bar stock.................... 15
Figure 8. Yield strength values for Alloy 617 by heat................................................................................ 17
Figure 9. Analysis of statistical equivalence of the normalized yield strength data. .................................. 18
Figure 10. Best-fit polynomial for normalized yield strength..................................................................... 19
Figure 11. Estimated minimum yield strength using the ASME method with a cubic polynomial............ 19
Figure 12. Comparison of best-fit polynomial and decay model to normalized yield strength data. ......... 20
Figure 13. Analysis of Alloy 617 minimum yield strength. ....................................................................... 21
Figure 14. Tensile strength values for Alloy 617 by heat. ......................................................................... 22
Figure 15. Analysis of statistical equivalence of the normalized tensile strength data............................... 23
vii
Figure 16. Model fit to normalized tensile strength grouped by temperature and data source. .................. 24
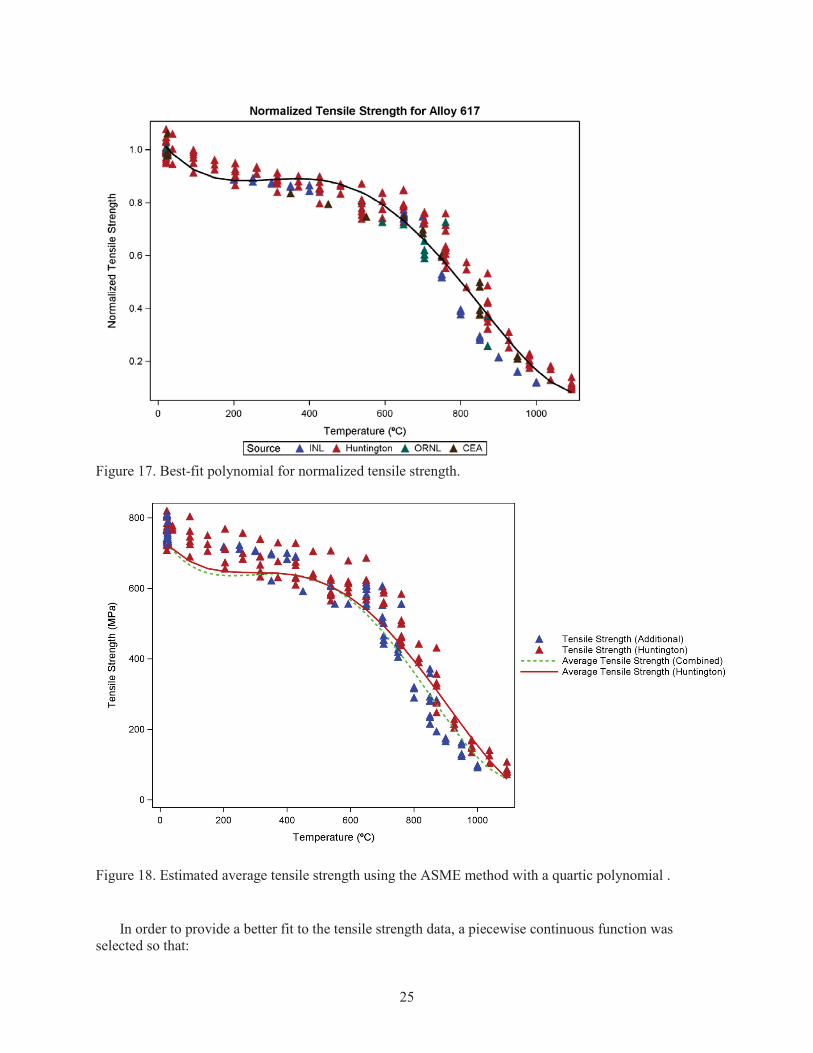
Figure 17. Best-fit polynomial for normalized tensile strength. ................................................................. 25
Figure 18. Estimated average tensile strength using the ASME method with a quartic polynomial ......... 25
Figure 19. Comparison of best fit polynomial to decay model for normalized tensile strength data. ........ 26
Figure 20. Analysis of Alloy 617 average tensile strength. ........................................................................ 27
TABLESTable 1. Chemical Analysis of ThyssenKrupp VDM USA, Inc. heat number 188155. ............................... 9
Table 2. Tensile properties for bar and plate stock. .................................................................................... 14
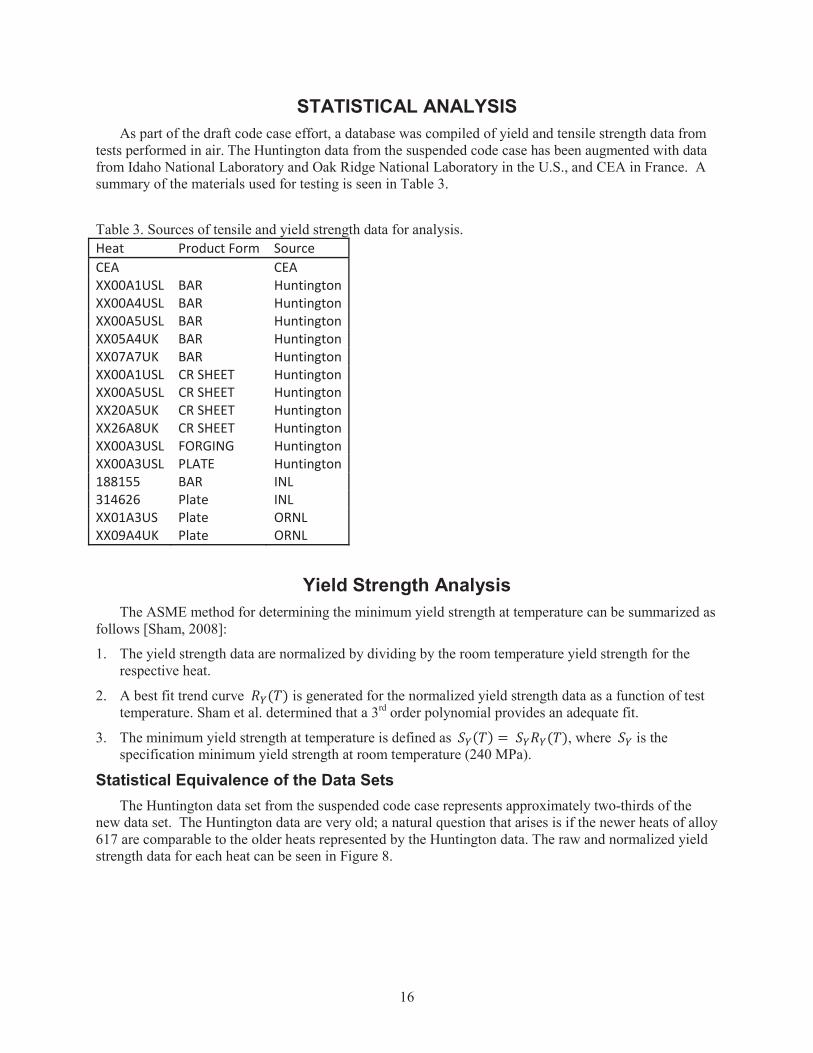
Table 3. Sources of tensile and yield strength data for analysis. ................................................................ 16
Table 4, Best-fit parameter coefficients for normalized and raw yield strength......................................... 21
Table 5. Best-fit parameter coefficients for normalized and raw tensile strength ...................................... 27

8
Tensile Properties of Alloy 617 Bar StockINTRODUCTION
Alloy 617 is approved for non-nuclear construction in the ASME Boiler and Pressure Vessel Code Section I and Section VIII, Division 1 but is not currently qualified for nuclear use in ASME Code Section III. A draft Code Case was developed in the 1980’s to qualify the alloy for nuclear service but efforts were stopped before the approval process was completed. Renewed interest in high temperature nuclear reactors has resulted in a new effort to qualify Alloy 617 for use in nuclear pressure vessels.
Tensile properties of the alloy are needed for several aspects of Code qualification. Minimum yield strength and average tensile strength at temperature are used to set time independent allowable stress, Sm,for structural materials in B&PV Code, Section III, Subsection NH. It must also be demonstrated that there is no minimum ductility between room temperatures and 427°C (the upper temperature limit for Subsection NB) to minimize the number of fatigue tests required for developing the fatigue design curve. The bar properties reported here represent data for an additional heat and product form. A forged and rolled plate, designated as a reference material for the program, has been studied extensively and tensile properties are presented for comparison. Both of the product forms that have been characterized in the current program, plate and bar, were produced using current mill practice that includes additional refining using electro-slag re-melting. This additional processing step was not used for some of the materials in the historical database and it is of interest to demonstrate that the properties of contemporary material are comparable to the historical values.
PROCEDURETensile tests were conducted at room temperature, 200, 250, 300, 350, 400, 427 (800°F, the cutoff of
ASME Subsection NB), and 650-1000°C at 50° intervals. Two replicate tests were performed at each temperature to assess the reproducibility of results. Tensile specimens conformed to ASTM E21, with a 6.35 mm diameter reduced section and a reduced section length of 32mm cut from material in the as-received condition with the axis of the specimen parallel to the direction of fabrication. The length and diameter of the test specimens were measured using calibrated micrometers. Final dimensions, such as diameter and gauge length, were measured on the fractured specimen with ends fit carefully together, and the percent elongation and percent reduction in area calculated. Yield strengths are reported at an offset of 0.2% strain.
All tensile testing was conducted in accordance with test standards E 8 and E 21, for room temperature and elevated temperature tests, respectively. The test machine for this study was a screw driven electro-mechanical machine with a resistance heated box furnace. Both the room and elevated temperature extensometers were calibrated to meet B-2 classification. The extensometers were direct mounted to the reduced section of the specimens and used from 0-20% strain for each test. Strain data after removal of the extensometers are a displacement-estimated strain based on the beginning and ending strain values and the crosshead displacement. The test machine crosshead speed was adjusted to maintain the stress and strain rates for the various tests. For room temperature testing the crosshead speed was generally ~1.25mm/minute to achieve a stress rate between 1.15-11.5 MPa/sec. For elevated temperature testing, tensile tests were carried out at constant crosshead-displacement rate of ~0.2mm/minute corresponding with an initial strain rate of approximately 0.5% /min and the temperature was monitored by 3 type K thermocouples welded to the reduced section near either fillet and in the specimen center. The 3 zone furnace controller was offset to achieve uniform temperature reading across the specimen gage, and control throughout the test was held within 3° of specified test temperature.

9
MATERIALSAlloy 617 is strengthened by solid solution hardening provided by the alloy elements chromium,
cobalt and molybdenum as well as by intra- and inter-granular carbide precipitates. The high temperature oxidation resistance is derived from the high nickel and chromium content. The material was in the form of a 2.01 in (51 mm) by 12 foot bar, produced by ThyssenKrupp VDM USA, Inc. Chemistry of heat number 188155, from which the bar stock was produced is given in Table 1.
Table 1. Chemical Analysis of ThyssenKrupp VDM USA, Inc. heat number 188155.C Mn Si P S Cr Ni Co Mo Ti Al B Cu Fe 0.080 0.23 0.20 0.005 0.001 22.02 53.27 11.91 9.38 0.32 1.10 0.002 0.02 1.46
Optical metallography of the bar stock in both the longitudinal and transverse direction is shown in Figure 1. Similar scale micrographs are shown in Figure 2 for the reference plate.
Figure 1. Optical metallography of bar stock at two magnifications for longitudinal (top) and transverse orientations.

10
Figure 2. Optical Metallography of reference plate.
TENSILE RESULTSStress-strain curves are shown for the bar stock at each temperature tested in Figure 3. Tensile
properties are very similar for test temperatures of 200-427°C. Starting at 700°C, the yield strength decreases and ductility increases with temperature and the material is no longer work hardening. Note the strength at 700°C is greater and the ductility less than that at 650°C, an anomaly typically observed in Alloy 617.
Tests were reproducible, as seen in Figure 4 by the nearly identical stress-strain curves of replicate tests for a given temperature. Only one test for each temperature is plotted in Figure 3 to avoid further complexity in the plot.
The tensile properties of the bar are compared to those of the reference plate in Figure 5 and Table 2.Properties were only measured for temperatures of 650°C and greater, with the exception of room temperature. The bar was stronger at all temperatures, and also more ductile at 750°C and above. At 650 and 700°C the bar is less ductile, and at room temperature it is similar to the plate. The tensile behavior of the bar and plate as a function of temperature are further illustrated in Figure 6 and Figure 7.
11
Figu
re 3
. Com
pila
tion
of st
ress
-stra
in c
urve
s for
bar
stoc
k te
sted
at d
iffer
ent t
empe
ratu
res.
0
100
200
300
400
500
600
700
800
900
0 20
40
60
80
10
0 12
0 14
0
Stress (MPa)
Stra
in (%
)
Bar
25 C
200
C
250
C
300
C
350
C
400
C
427
C
650
C
700
C
750
C
800
C
850
C
900
C
950
C
1000
C

12
0
100
200
300
400
500
600
700
800
0 20 40 60 80
Stre
ss (M
Pa)
Strain (%)
350°C
0 50
100 150 200 250 300 350 400 450
0 20 40 60 80 100
Stre
ss (M
Pa)
Strain (%)
750°C
0
20
40
60
80
100
120
140
0 20 40 60 80 100 120 140
Stre
ss (M
Pa)
Strain (%)
950°C
Figure 4. Examples of reproducability of tensile curves for three temperatures.

13
Figu
re 5
. Com
paris
on o
f stre
ss-s
train
cur
ves f
or b
ar a
nd p
late
test
ed a
t the
sam
e te
mpe
ratu
res.
0
100
200
300
400
500
600
700
800
900
0 20
40
60
80
10
0 12
0 14
0
Stress (MPa)
Stra
in (%
)
RT B
ar
RT P
late
650°
C Ba
r
650°
C Pl
ate
700°
C Ba
r
700°
C Pl
ate
750°
C Ba
r
750°
C Pl
ate
800°
C Ba
r
800°
C Pl
ate
850°
C Ba
r
850°
C Pl
ate
900°
C Ba
r
900°
C Pl
ate
950°
C Ba
r
950°
C Pl
ate
1000
°C B
ar
1000
°C P
late
RT
650°
C
850°
C
800°
C 75
0°C
700°
C
1000
°C
950°
C 90
0°C
14
Table 2. Tensile properties for bar and plate stock. Bar Plate
T (°C) Yield (MPa)
UTS (MPa)
Elong (%)
Yield (MPa)
UTS (MPa)
Elong (%)
22 408 809 68 314 768 65 200 316 718 67 – – – 250 285 717 68 – – – 300 287 707 68 – – – 350 291 698 71 – – – 400 289 692 73 – – – 427 283 690 69 – – – 650 281 604 49 209 584 59 700 359 606 35 249 553 49 750 282 424 96 208 406 54 800 278 318 142 196 290 76 850 223 237 150 186 216 95 900 166 175 168 163 166 83 950 126 130 134 119 124 78
1000 96 98 136 90 92 80
Figure 6. Strength as a function of temperature for Alloy 617 reference plate and bar stock.
0
100
200
300
400
500
600
700
800
900
0 200 400 600 800 1000 1200
Stre
ss (M
Pa)
Temperature (°C)
0.2% Yield, Bar UTS, Bar 0.2% Yield, Plate UTS, Plate

15
Figure 7. Ductility as a function of temperature for Alloy 617 reference plate and bar stock.
0
20
40
60
80
100
120
140
0 200 400 600 800 1000
Elon
gatio
n (%
)
Temperature (°C)
Bar Plate
16
STATISTICAL ANALYSISAs part of the draft code case effort, a database was compiled of yield and tensile strength data from
tests performed in air. The Huntington data from the suspended code case has been augmented with data from Idaho National Laboratory and Oak Ridge National Laboratory in the U.S., and CEA in France. A summary of the materials used for testing is seen in Table 3.
Table 3. Sources of tensile and yield strength data for analysis.Heat Product Form Source CEA CEA XX00A1USL BAR Huntington XX00A4USL BAR Huntington XX00A5USL BAR Huntington XX05A4UK BAR Huntington XX07A7UK BAR Huntington XX00A1USL CR SHEET Huntington XX00A5USL CR SHEET Huntington XX20A5UK CR SHEET Huntington XX26A8UK CR SHEET Huntington XX00A3USL FORGING Huntington XX00A3USL PLATE Huntington 188155 BAR INL 314626 Plate INL XX01A3US Plate ORNL XX09A4UK Plate ORNL
Yield Strength AnalysisThe ASME method for determining the minimum yield strength at temperature can be summarized as
follows [Sham, 2008]:
1. The yield strength data are normalized by dividing by the room temperature yield strength for the respective heat.
2. A best fit trend curve ( ) is generated for the normalized yield strength data as a function of test temperature. Sham et al. determined that a 3rd order polynomial provides an adequate fit.
3. The minimum yield strength at temperature is defined as ( ) = ( ), where is the specification minimum yield strength at room temperature (240 MPa).
Statistical Equivalence of the Data SetsThe Huntington data set from the suspended code case represents approximately two-thirds of the
new data set. The Huntington data are very old; a natural question that arises is if the newer heats of alloy 617 are comparable to the older heats represented by the Huntington data. The raw and normalized yield strength data for each heat can be seen in Figure 8.

17
Figure 8. Yield strength values for Alloy 617 by heat.
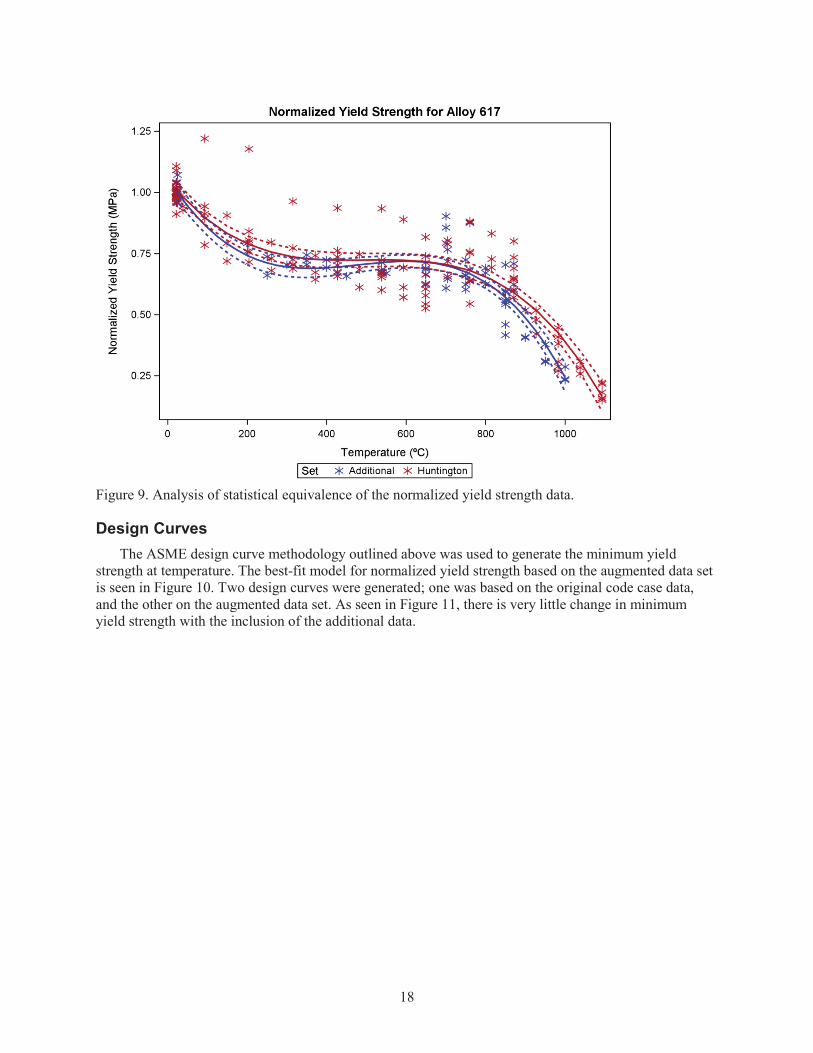
A statistical analysis was performed using the normalized yield strength data to determine the statistical equivalence of the data sets. The normalized yield strength data from INL, ORNL, and CEA were combined in one group, and the Huntington data formed the second group. The best least-squares fit third-order polynomial was generated for each data group. The results in Figure 9 show that the 95% confidence bounds are overlapping for the entire temperature range. There is no evidence to suggest a difference in the two data sets.
18
Figure 9. Analysis of statistical equivalence of the normalized yield strength data.
Design CurvesThe ASME design curve methodology outlined above was used to generate the minimum yield
strength at temperature. The best-fit model for normalized yield strength based on the augmented data set is seen in Figure 10. Two design curves were generated; one was based on the original code case data, and the other on the augmented data set. As seen in Figure 11, there is very little change in minimumyield strength with the inclusion of the additional data.

19
Figure 10. Best-fit polynomial for normalized yield strength.
Figure 11. Estimated minimum yield strength using the ASME method with a cubic polynomial.
20
The margin between the minimum yield strength at temperature and the yield strength data decreases noticeably as temperature increases, providing a conservative lower bound at room temperature, but running through the data at the highest temperatures.
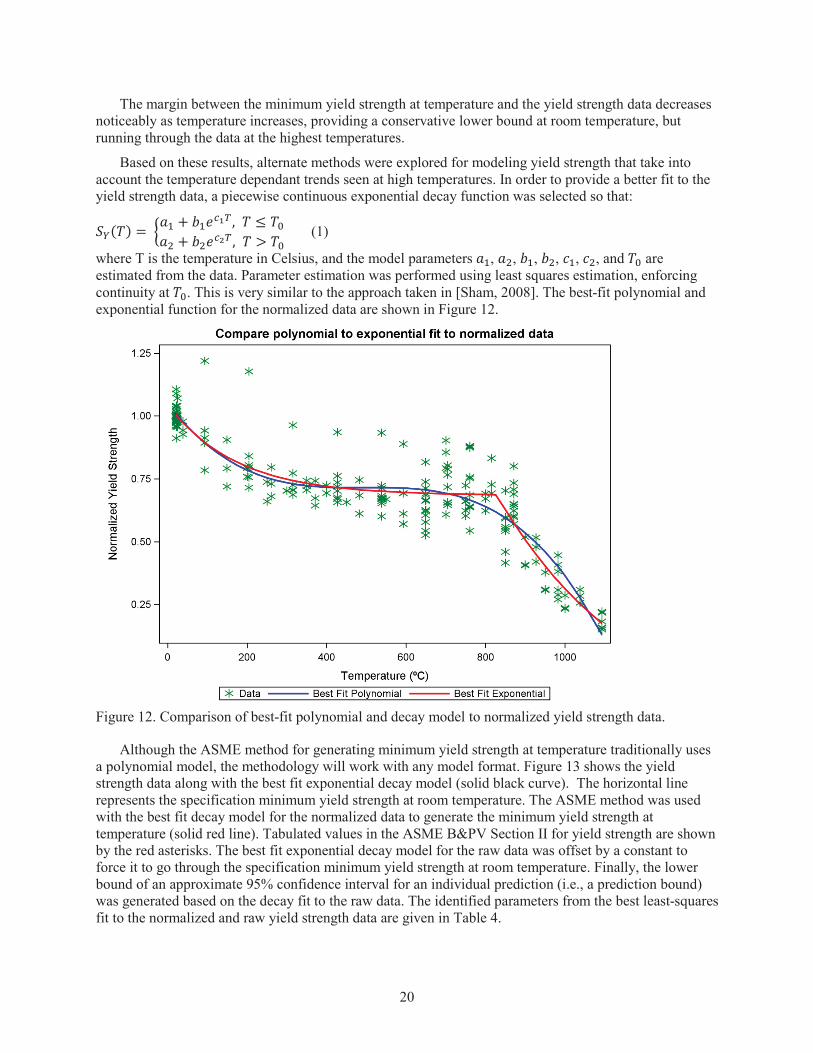
Based on these results, alternate methods were explored for modeling yield strength that take into account the temperature dependant trends seen at high temperatures. In order to provide a better fit to the yield strength data, a piecewise continuous exponential decay function was selected so that:( ) = + ,+ , > (1)
where T is the temperature in Celsius, and the model parameters , , , , , , and are estimated from the data. Parameter estimation was performed using least squares estimation, enforcing continuity at . This is very similar to the approach taken in [Sham, 2008]. The best-fit polynomial and exponential function for the normalized data are shown in Figure 12.
Figure 12. Comparison of best-fit polynomial and decay model to normalized yield strength data.
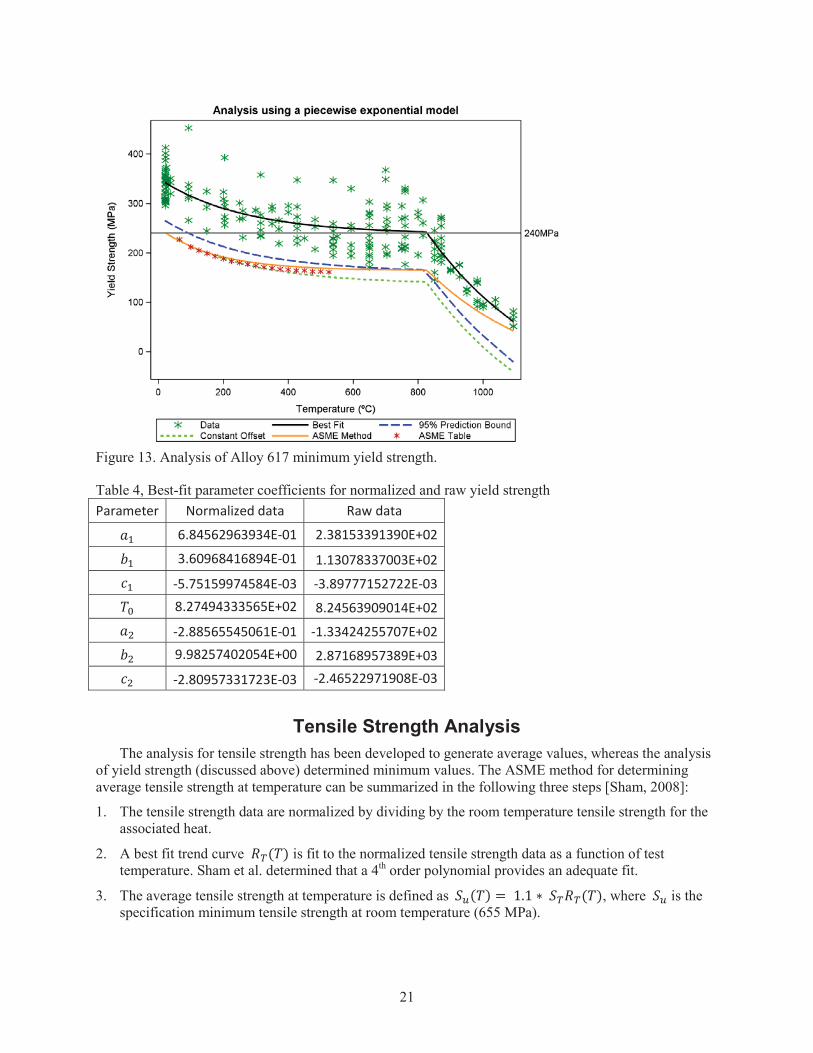
Although the ASME method for generating minimum yield strength at temperature traditionally uses a polynomial model, the methodology will work with any model format. Figure 13 shows the yield strength data along with the best fit exponential decay model (solid black curve). The horizontal line represents the specification minimum yield strength at room temperature. The ASME method was used with the best fit decay model for the normalized data to generate the minimum yield strength at temperature (solid red line). Tabulated values in the ASME B&PV Section II for yield strength are shown by the red asterisks. The best fit exponential decay model for the raw data was offset by a constant to force it to go through the specification minimum yield strength at room temperature. Finally, the lower bound of an approximate 95% confidence interval for an individual prediction (i.e., a prediction bound) was generated based on the decay fit to the raw data. The identified parameters from the best least-squares fit to the normalized and raw yield strength data are given in Table 4.
21
Figure 13. Analysis of Alloy 617 minimum yield strength.
Table 4, Best-fit parameter coefficients for normalized and raw yield strengthParameter Normalized data Raw data
6.84562963934E-01 2.38153391390E+02
3.60968416894E-01 1.13078337003E+02 -5.75159974584E-03 -3.89777152722E-03 8.27494333565E+02 8.24563909014E+02 -2.88565545061E-01 -1.33424255707E+02 9.98257402054E+00 2.87168957389E+03 -2.80957331723E-03 -2.46522971908E-03
Tensile Strength AnalysisThe analysis for tensile strength has been developed to generate average values, whereas the analysis
of yield strength (discussed above) determined minimum values. The ASME method for determining average tensile strength at temperature can be summarized in the following three steps [Sham, 2008]:
1. The tensile strength data are normalized by dividing by the room temperature tensile strength for the associated heat.
2. A best fit trend curve ( ) is fit to the normalized tensile strength data as a function of test temperature. Sham et al. determined that a 4th order polynomial provides an adequate fit.
3. The average tensile strength at temperature is defined as ( ) = 1.1 ( ), where is the specification minimum tensile strength at room temperature (655 MPa).

22
Statistical EquivalenceThe raw and normalized tensile strength data for each heat can be seen in Figure 14.
In order to analyze statistical equivalence of the data sets, the normalized tensile strength data from INL, ORNL, and CEA were combined in one group, and the Huntington data formed the second group. The best least-squares fit fourth-order polynomial was generated for each data group. The results in Figure 15 show that the 95% confidence bounds are overlapping for lower temperatures (approximately 0-625ºC), but that they are not overlapping for higher temperatures.
Figure 14. Tensile strength values for Alloy 617 by heat.

23
Figure 15. Analysis of statistical equivalence of the normalized tensile strength data.
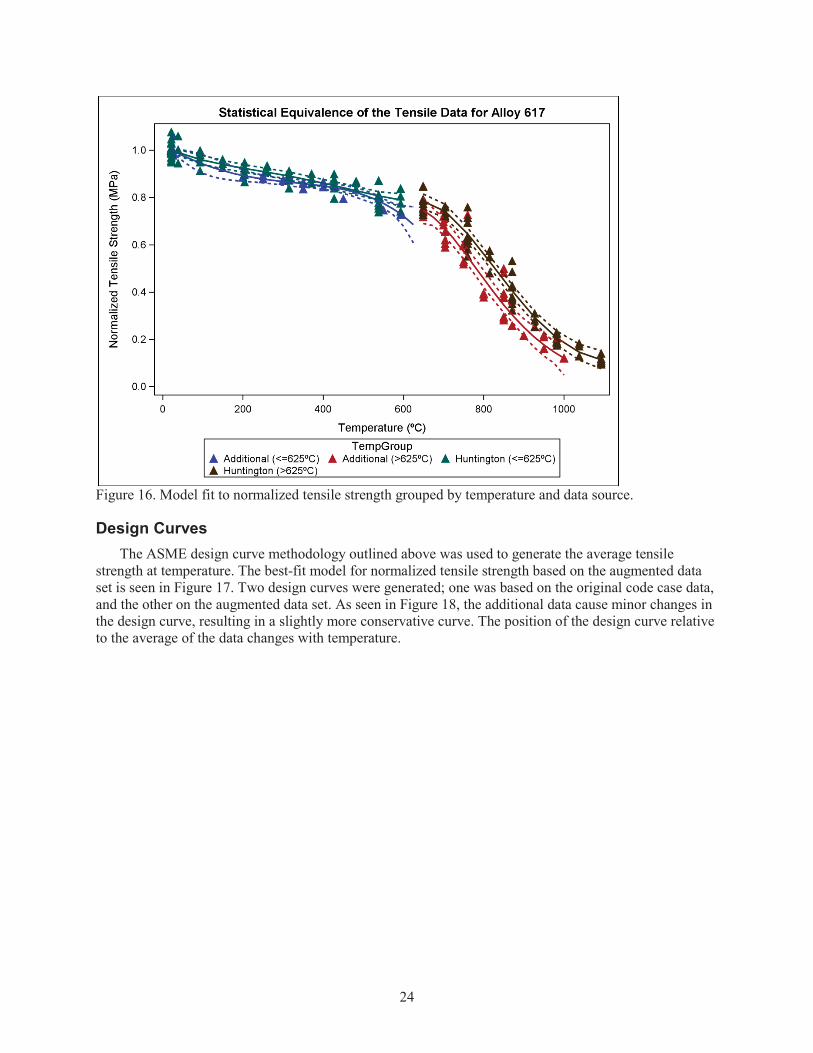
Based on these results, models were fit to the Huntington and Additional data sets for lower (<= 625ºC) and higher (>625ºC) temperatures. The results shown in Figure 16 are consistent with the previous analysis, with overlapping confidence bounds for lower temperatures, and non-overlapping confidence bounds above 625ºC. This indicates there is a difference between the data sets for higher temperatures. Because the additional data sets have lower tensile strength values, the resulting design curves will be more conservative for the joint data set.
24
Figure 16. Model fit to normalized tensile strength grouped by temperature and data source.
Design CurvesThe ASME design curve methodology outlined above was used to generate the average tensile
strength at temperature. The best-fit model for normalized tensile strength based on the augmented data set is seen in Figure 17. Two design curves were generated; one was based on the original code case data, and the other on the augmented data set. As seen in Figure 18, the additional data cause minor changes in the design curve, resulting in a slightly more conservative curve. The position of the design curve relative to the average of the data changes with temperature.
25
Figure 17. Best-fit polynomial for normalized tensile strength.
Figure 18. Estimated average tensile strength using the ASME method with a quartic polynomial .
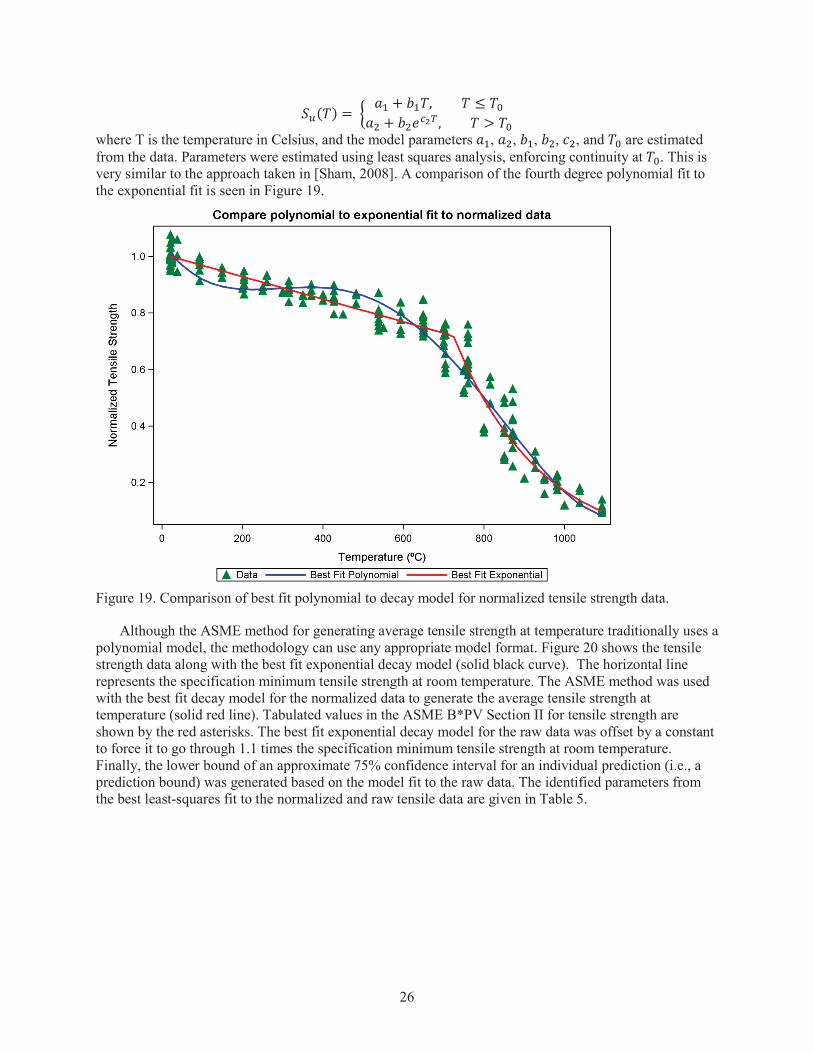
In order to provide a better fit to the tensile strength data, a piecewise continuous function was selected so that:
26
( ) = + ,+ , >where T is the temperature in Celsius, and the model parameters , , , , , and are estimated from the data. Parameters were estimated using least squares analysis, enforcing continuity at . This is very similar to the approach taken in [Sham, 2008]. A comparison of the fourth degree polynomial fit to the exponential fit is seen in Figure 19.
Figure 19. Comparison of best fit polynomial to decay model for normalized tensile strength data.
Although the ASME method for generating average tensile strength at temperature traditionally uses a polynomial model, the methodology can use any appropriate model format. Figure 20 shows the tensile strength data along with the best fit exponential decay model (solid black curve). The horizontal line represents the specification minimum tensile strength at room temperature. The ASME method was used with the best fit decay model for the normalized data to generate the average tensile strength at temperature (solid red line). Tabulated values in the ASME B*PV Section II for tensile strength are shown by the red asterisks. The best fit exponential decay model for the raw data was offset by a constant to force it to go through 1.1 times the specification minimum tensile strength at room temperature. Finally, the lower bound of an approximate 75% confidence interval for an individual prediction (i.e., a prediction bound) was generated based on the model fit to the raw data. The identified parameters from the best least-squares fit to the normalized and raw tensile data are given in Table 5.

27
Figure 20. Analysis of Alloy 617 average tensile strength.
Table 5. Best-fit parameter coefficients for normalized and raw tensile strengthParameter Normalized data Raw data
1.00809519519E+00 7.71748461184E+02
-3.98933842187E-04 -2.93524772281E-01
7.24094783303E+02 7.22747336965E+02
-3.91607682652E-02 -2.84714696511E+01
2.18506626389E+01 1.74564181628E+04
-4.64136570776E-03 -4.69127568771E-03
Discussion of Statistical AnalysisSham, Eno, and Jensen first noted an inconsistent margin resulting from using the ASME design
curve methodologies for minimum yield strength and average yield strength at temperature [Sham, 2008] for the large temperature ranges of interest for Alloy 617. Sham et al. suggested an alternate method for generating the design curves using the Huntington data set. Kim et al. repeated the analysis using an expanded data set including data collected through world-wide literature surveys, manufacturing companies, and KAERI data [Kim, 2012]. In this paper, the alternate methodology was presented with minor modifications for a data set including data from Huntington, CEA, ORNL, and INL.
The SAS procedure NLIN was used to generate all curve fits, as well as the prediction bounds. The 95% prediction bound for yield strength provides a consistent, meaningful lower bound for yield strength, and would be a good candidate for minimum yield strength at temperature. The 75% prediction bound for tensile strength provides a consistent, meaningful lower bound for average tensile strength, and would be a good candidate for average tensile strength at temperature.

28
CONCLUSIONSTensile testing has been conducted on Alloy 617 bar stock in the temperature range of room
temperature - 1000°C and the results are compared to those of a previously tested reference plate. These tests provided data for an alternative heat and product form that is required for the ASME Code Case. The bar stock generally has higher strength and ductility than the reference plate. Repeatability is excellent and temperature dependent properties are consistent with previous observations for this alloy.
Statistical analysis has been performed on recent INL tensile data grouped with CEA and ORNL data to determine if they are significantly different than data from the original draft code case data generated at Huntington Alloys many years ago. A best least-squares fit of a polynomial was used, although a piecewise function can provide a better fit for both the yield and tensile strength of the material as a function of temperature.
Analysis of the yield strength data shows the 95% confidence bounds of the new data set overlaps that of the original data set over the entire temperature range, indicating no difference in the two data sets and very little change in the design curve. The 95% prediction bound for yield strength provides a consistent, meaningful lower bound for yield strength, and would be a good candidate for minimum yield strength at temperature.
The 95% confidence bounds for the tensile strength of the new and old datasets do not overlap above about 625°C, indicating a difference between the data sets at higher temperatures. Including the additional newer data would cause minor changes in the average tensile strength design curve, resulting in a slightly more conservative curve. The 75% prediction bound for tensile strength provides a consistent, meaningful lower bound for average tensile strength, and would be a good candidate for average tensile strength at temperature.
REFERENCES
ASME Boiler & Pressure Vessel Code, Section III, Division 1, Subsection NB and Subsection NH –Class 1 Components in Elevated Temperature Service, ASME International, Three Park Avenue, New York, NY, July 1, 2011.
ASTM E-8-11, Standard Test Methods for Tension Testing of Metallic Materials, ASTM International, 100 Barr Harbor Drive, PO Box C700, West Conshohocken, PA, 2011.
ASTM E-21-09, Standard Test Methods for Elevated Temperature Tension Tests of Metallic Materials, ASTM International, 100 Barr Harbor Drive, PO Box C700, West Conshohocken, PA, 2009.
[Sham, 2008] T.-L. Sham, D.R. Eno, and K.P. Jensen, “Treatment of High Temperature Tensile Data for Alloy 617 and Alloy 230,” Proceedings of 2008 ASME Pressure Vessels and Piping Division Conference, PVP2008-61128, July 21-31, 2008, Chicago, Illinois.
[Kim, 2012] W.-G. Kim, S.-N. Yin, J.-Y. Park, S.-D. Hong, Y.-W. Kim, “An improved methodology for determining tensile design strengths of Alloy 617,” Journal of Mechanical Science and Technology 26(2) (2012) 379-387; DOI 10.1007/s12206-011-1024-5.
Related Documents