Copyright by David Jason Lubitz 2005

Welcome message from author
This document is posted to help you gain knowledge. Please leave a comment to let me know what you think about it! Share it to your friends and learn new things together.
Transcript

Copyright
by
David Jason Lubitz
2005
Tensile and Fatigue Behavior of Punched Structural Steel Plates
by
David Jason Lubitz, B.C.E.
Thesis
Presented to the Faculty of the Graduate School of
The University of Texas at Austin
in Partial Fulfillment
of the Requirements
for the Degree of
Master of Science in Engineering
The University of Texas at Austin
May 2005
Tensile and Fatigue Behavior of Punched Structural Steel Plates
Approved by
Supervising Committee:
Karl H. Frank
Michael D. Engelhardt

For great family and friends
ACKNOWLEDGMENTS
This report is part of an ongoing research project entitled "Performance
and Effects of Punched Holes and Cold Bending on Steel Bridge Fabrication,”
sponsored by the Texas Department of Transportation. The project is currently in
progress at the Ferguson Structural Engineering Laboratory at The University of
Texas at Austin as well as at Texas A&M University.
The author would like to express his appreciation to Dr. Karl H. Frank for
the guidance and support he provided throughout the research and thesis writing
processes. Gratitude is also extended to Dr. Michael D. Engelhardt for his
editorial comments on and content suggestions for this thesis.
The author would also like to express his sincere appreciation to faculty,
staff, and students at the Ferguson Structural Engineering Laboratory for their
support.
David Jason Lubitz
Austin, Texas
May 2005
v
Tensile and Fatigue Behavior of Punched Structural Steel Plates
by
David Jason Lubitz, M.S.E.
The University of Texas at Austin, 2005
Supervisor: Karl H. Frank
The research work described in this report, “Tensile and Fatigue Behavior
of Punched Structural Plates,” is part of a project entitled "Performance and
Effects of Punched Holes and Cold Bending on Steel Bridge Fabrication,”
sponsored by the Texas Department of Transportation. This research includes
testing and analysis completed primarily at the Ferguson Structural Engineering
Laboratory at The University of Texas at Austin.
This report discusses the method and ramifications of hole fabrication by
punching in structural plate. Typically, punching is employed in the fabrication
of structural elements related to connections, such as members, cross-frames, and
gusset plates on bridges. AASHTO steel bridge specifications do not allow full
size punched holes in primary load carrying members. Instead, holes are required
to be formed by full-size drilling or reaming following punching.
vi
In addition to literature review and analysis of previous research on the
behavior and strength of connections with variables such as hole preparation, 120
plate specimens with punched, reamed, or drilled holes were tensile and fatigue
tested during this study. Specimen variations included steel type, temperature,
hole size, plate thickness, edge distance, edge preparation, punching clearance,
punching operation, galvanizing, and amount of reaming. From this testing, net
section stress, strength ratio, and usable elongation values at failure were
determined for each specimen variation. While grade of steel, hole size, and plate
thickness displayed some influence on strength ratio and usable elongation, edge
distance, edge preparation, punching clearance, punching operation, galvanizing,
and amount of reaming displayed little to no influence on strength ratio and
usable elongation.
Overall, in strength performance, reamed specimens had the highest
average strength ratio, followed by drilled and then punched specimens. In usable
elongation performance, drilled and reamed specimens had the highest average
elongation values, followed by punched specimens. Additionally, 41 replicate
punched and drilled hole specimens were tensile tested to failure during this study
in order to directly compare the performance of punched and drilled plate. Based
on the strength performance of punched hole specimens, and particularly relative
to drilled hole specimens, a capacity reduction factor is recommended for
punched plate used in steel bridge connections.
vii

TABLE OF CONTENTS
1. Introduction ........................................................................................................1
1.1 Background ..................................................................................................1
1.2 Objective and Scope.....................................................................................3
2. Background and Literature Review with Analysis ............................................4
2.1 The Punching Process and Ramifications of Punching................................4
2.2 Early Research............................................................................................14
2.3 University of Illinois at Urbana-Champaign Research ..............................15
2.4 Recent Research .........................................................................................21
2.5 Use of Previous Research in Conjunction with Current Study ..................23
3. Experiment Design...........................................................................................24
3.1 Plate Specimens..........................................................................................24
3.2 Testing Matrices.........................................................................................24
3.2.1 Steel Type and Temperature Investigation..........................................25
3.2.2 Hole Size and Plate Thickness Investigation ......................................26
3.2.3 Edge Distance and Preparation Investigation......................................28
3.2.4 Punching Clearance Investigation.......................................................29
3.2.5 Punching Operation Investigation.......................................................33
3.2.6 Cold Tensile Testing Thickness Investigation ....................................34
3.2.7 Galvanizing Investigation ...................................................................34
3.2.8 Reaming Investigation.........................................................................35
3.2.9 Fatigue Investigation ...........................................................................36
4. Specimen Fabrication and Test Procedures .....................................................37
4.1 Specimen Fabrication.................................................................................37
4.1.1 Drilled Plates .......................................................................................37
4.1.2 Punched Plates.....................................................................................40
viii
4.2 Galvanizing Procedure ...............................................................................46
4.3 Reaming Procedure ....................................................................................47
4.4 Testing Apparatus and Procedure ..............................................................49
4.4.1 Tensile Testing ....................................................................................49
4.4.1.1 Room Temperature Tensile Testing.............................................49
4.4.1.2 Cold Temperature Tensile Testing...............................................54
4.4.2 Fatigue Testing....................................................................................57
4.4.3 Chemistry Analysis .............................................................................61
4.4.4 ASTM Coupon Testing .......................................................................62
4.4.5 Charpy V-Notch Testing .....................................................................62
5. Test Results and Analysis ................................................................................63
5.1 Chemistry Investigation .............................................................................63
5.2 ASTM Coupon Testing ..............................................................................64
5.3 Charpy V-Notch Testing ............................................................................66
5.4 Notes on Chemistry, Coupon, and Charpy Investigations .........................67
5.4.1 Chemistry Considerations ...................................................................67
5.4.2 Influence of Coupon Tensile Strength Characteristics........................68
5.4.3 Influence of Notch Toughness Characteristics....................................68
5.5 Steel Type and Temperature Investigation.................................................68
5.6 Room Temperature Tensile Observations..................................................72
5.7 Hole Size and Plate Thickness Investigation .............................................80
5.8 Edge Distance and Preparation Investigation.............................................83
5.9 Punching Clearance Investigation ..............................................................85
5.10 Punching Operation Investigation............................................................87
5.11 Cold Tensile Testing Thickness Investigation .........................................88
5.12 Galvanizing Investigation ........................................................................89
5.13 Reaming Investigation..............................................................................91
ix
5.14 Fatigue Investigation ................................................................................93
5.15 Summary of Tensile Test Results.............................................................96
5.16 Additional Considerations......................................................................107
6. Conclusions ....................................................................................................108
Appendix .............................................................................................................111
Bibliography........................................................................................................125
Vita ......................................................................................................................127
x
LIST OF FIGURES
Figure 2.1: Load versus Elongation and Effect of Strain Aging.............................7
Figure 2.2: Characteristics of Parent Material and Punched Hole (Brolund 2004) 8
Figure 2.3: Scheme of Three Different Zones around Hole after Punching
(Sanchez 2002) ......................................................................................................10
Figure 2.4: Punch Progression at Different Distances through Material (15/16
Inch Diameter Hole in 3/4 Inch Thickness Grade 50 Plate)..................................10
Figure 2.5: Close-Up of Punch Progression (15/16 Inch Diameter Hole in 3/4 Inch
Thickness Grade 50 Plate).....................................................................................11
Figure 2.6: Distribution of Hardness around a Punched Hole (Huhn 2004).........12
Figure 2.7: Stress-Strain Curves of Micro-Tensile Test Specimens (Huhn 2004) 13
Figure 2.8: Ductility of the Loaded (Stretched) Sheet with Orthogonal Grid
(Gaylord 1972) ......................................................................................................14
Figure 2.9: Typical Truss-Type Specimen Following Failure (Chesson and
Munse, Behavior 1958) .........................................................................................16
Figure 2.10: Experimental versus Current Specification Limit States for Chesson
and Munse Data.....................................................................................................20
Figure 2.11: Stress Range versus Number of Cycles for UC Data .......................22
Figure 3.1: Typical Plate Specimen Geometry .....................................................24
Figure 3.2: Deformation Due to Increasing Clearance (Brolund 2004)................32
Figure 3.3: Excessive Clearance and Unclean Fracture (Brolund 2004) ..............33
Figure 4.1: Typical Drilled Hole Preparation (with Slugger) ...............................38
Figure 4.2: Close-Up of Drill, Bit, Slug, and Specimen during Preparation ........38
Figure 4.3: Cross-Section of Typical Drilled Hole Specimen (15/16 Inch Diameter
Hole in 3/4 Inch Thickness Grade 50 Plate)..........................................................39
xi

Figure 4.4: Close-Up of Cross-Section of Typical Drilled Hole Specimen (15/16
Inch Diameter Hole in 3/4 Inch Thickness Grade 50 Plate)..................................39
Figure 4.5: Plate Inserted in Punch Press..............................................................40
Figure 4.6: Plate and Punched Holes Following Typical Specimen Preparation..41
Figure 4.7: Mechanical Punch Press at AIW ........................................................42
Figure 4.8: Cross-Section of Typical Punched Hole Specimen (15/16 Inch
Diameter Hole in 3/4 Inch Thickness Grade 50 Plate)..........................................43
Figure 4.9: Close-Up of Cross-Section of Typical Punched Hole Specimen (15/16
Inch Diameter Hole in 3/4 Inch Thickness Grade 50 Plate)..................................44
Figure 4.10: Typical 15/16 Inch Diameter, 1/2 Inch Thickness and 15/16 Inch
Diameter, 3/4 Inch Thickness Punched Holes (Grade 50) ....................................45
Figure 4.11: AIW Typical 15/16 Inch Diameter, 1/2 Inch Thickness and 15/16
Inch Diameter, 3/4 Inch Thickness Punched Holes (Grade 50) ............................46
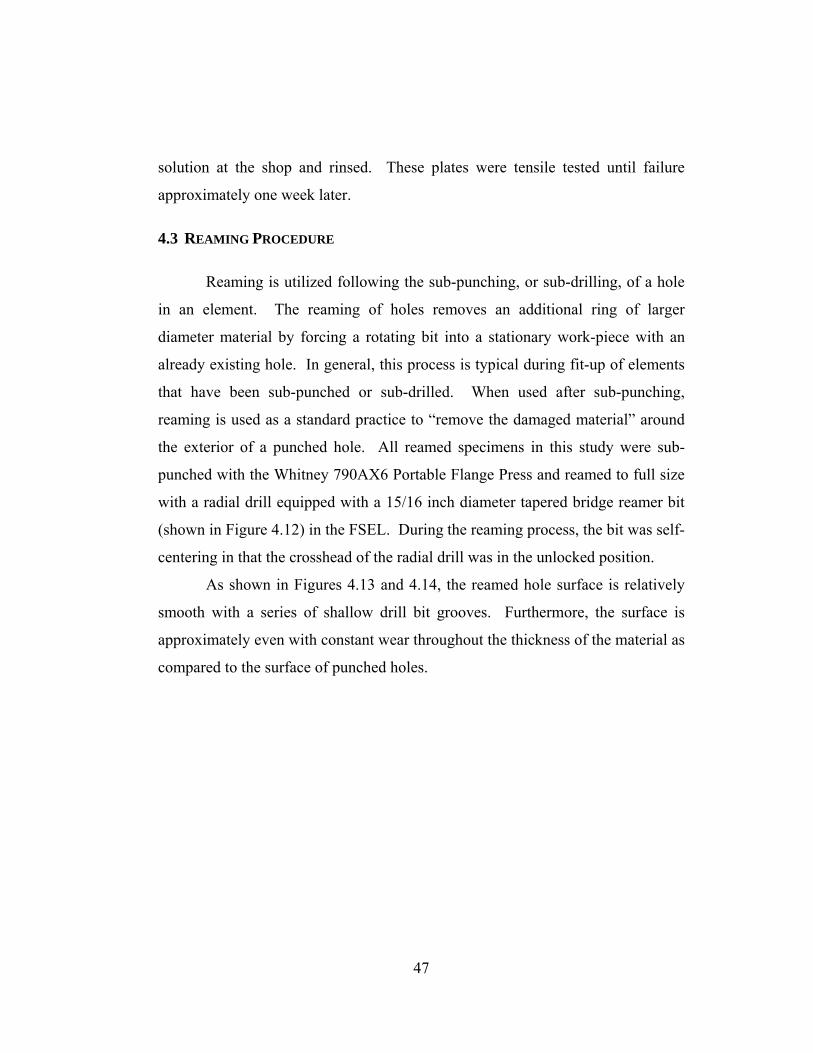
Figure 4.12: High Speed Radial Drill and Reamer ...............................................48
Figure 4.13: Reamer Bit and Finished Hole in Specimen.....................................48
Figure 4.14: Close-Up of Reamer Bit and Hole in Specimen...............................49
Figure 4.15: 600-Kip UTS Used for Tensile Testing............................................51
Figure 4.16: Test Specimen in Grips of 600-Kip UTS .........................................52
Figure 4.17: PDAQ System Used for Tensile Testing ..........................................53
Figure 4.18: Linear Potentiometer Used for Tensile Testing................................53
Figure 4.19: Interior of Freezer Storing Cold Plates .............................................55
Figure 4.20: Temperature Chamber Surrounding Specimen in 600-Kip UTS .....56
Figure 4.21: Open Temperature Chamber Prior to Tensile Test...........................57
Figure 4.22: Profile of 220-Kip MTS Used for Fatigue Testing...........................58
Figure 4.23: Typical Specimen in Grips of 220-Kip MTS ...................................59
Figure 4.24: Control System Used for Fatigue Testing ........................................60
xii
Figure 5.1: Load versus Displacement Comparison of Similar Punched and
Drilled Hole Specimens ........................................................................................72
Figure 5.2: Punched Hole Specimen Yielding and Initial Fracture ......................74
Figure 5.3: Punched Hole Specimen Progression of Fracture ..............................75
Figure 5.4: Fractured Punched Hole and Drilled Hole Specimens .......................76
Figure 5.5: Typical Punched and Drilled Hole Fracture Cross-Sections (3/4 Inch
Thickness, 15/16 Inch Diameter Hole, Grade 50).................................................78
Figure 5.6: Typical Punched and Drilled Hole Fracture Cross-Sections (3/8 Inch
Thickness, 15/16 Inch Diameter Hole, Grade 50).................................................79
Figure 5.7: Close-Up of Typical Punched and Drilled Hole Fracture Cross-
Sections (3/8 Inch Thickness, 15/16 Inch Diameter Hole, Grade 50)...................80
Figure 5.8: Typical Failure of Galvanized Specimen............................................91
Figure 5.9: Punched and Drilled Fatigue Specimen..............................................93
Figure 5.10: Typical Failed Fatigue Specimen .....................................................94
Figure 5.11: Profile Close-Up of Fatigue Crack ...................................................95
Figure 5.12: Close-Up of Fatigue Crack Fracture Surface....................................96
Figure 5.13: Experimental versus Specification Strength Limit State Summary of
Tensile Tests........................................................................................................100
Figure 5.14: Punched versus Drilled and Reamed Holes Usable Elongation
Histogram............................................................................................................102
Figure 5.15: Punched Strength Ratio/Drilled Strength Ratio Histogram............104
Figure 5.16: Punched/Drilled Holes Usable Elongation Histogram ...................105
Figure A.1: Energy versus Temperature for 3/8 Inch Grade 36 Plate.................116
Figure A.2: Energy versus Temperature for 1/2 Inch Grade 36 Plate.................117
Figure A.3: Energy versus Temperature for 3/4 Inch Grade 36 Plate.................118
Figure A.4: Energy versus Temperature for 1/2 Inch Grade 36 (Sheared) Plate 119
Figure A.5: Energy versus Temperature for 3/8 Inch Grade 50 Plate.................120
xiii
Figure A.6: Energy versus Temperature for 1/2 Inch Grade 50 Plate.................121
Figure A.7: Energy versus Temperature for 3/4 Inch Grade 50 Plate.................122
Figure A.8: Energy versus Temperature for 1/2 Inch Grade 50 (Sheared) Plate 123
Figure A.9: Energy versus Temperature for 1/2 Inch Grade 55 Plate.................124
xiv

LIST OF TABLES
Table 2.1: Tons Force Required to Punch Typical Grade 36 Steel.........................5
Table 2.2: Multiplier Chart for Tons Force Required to Punch ..............................6
Table 3.1: Steel Type and Temperature Test Matrix.............................................25
Table 3.2: Hole Size and Plate Thickness Test Matrixes ......................................27
Table 3.3: Edge Distance and Preparation Test Matrix (with 15/16 Inch Diameter
Holes) ....................................................................................................................28
Table 3.4: Punching Clearance Test Matrix (1/2 Inch Thickness Plate)...............30
Table 3.5: Die Clearance based on Material Thickness ........................................30
Table 3.6: Die Clearance Used for Standard Holes ..............................................31
Table 3.7: Punching Operation Test Matrix (15/16 Inch Diameter Holes)...........34
Table 3.8: Cold Tensile Test Thickness Matrix ....................................................34
Table 3.9: Galvanizing Test Matrix ......................................................................35
Table 3.10: Reaming Test Matrix .........................................................................36
Table 5.1: Results of Chemistry Investigation ......................................................63
Table 5.2: Results of ASTM Coupon Tests ..........................................................65
Table 5.3: Results of ASTM Cold Coupon Tests..................................................66
Table 5.4: Results of Charpy Testing....................................................................66
Table 5.5: Steel Type and Temperature Investigation Results (Grade 36, 1/2 Inch
Thickness, 15/16 Inch Diameter Hole Size)..........................................................69
Table 5.6: Steel Type and Temperature Investigation Results (Grade 50, 1/2 Inch
Thickness, 15/16 Inch Diameter Hole Size)..........................................................70
Table 5.7: Steel Type and Temperature Investigation Results (Grade 55, 1/2 Inch
Thickness, 15/16 Inch Diameter Hole Size)..........................................................70
Table 5.8: Steel Type and Temperature Investigation Results Summary (1/2 Inch
Thickness, 15/16 Inch Diameter Hole) .................................................................71
xv

Table 5.9: Hole Size and Plate Thickness Investigation Results (Grade 36) ........81
Table 5.10: Hole Size and Plate Thickness Investigation Results (Grade 50) ......81
Table 5.11: Plate Thickness Investigation Summary (11/16, 13/16, and 15/16 Inch
Diameter Holes) ....................................................................................................82
Table 5.12: Edge Distance and Preparation Investigation Results (Grade 36, 1/2
Inch Thickness, 15/16 Inch Diameter Hole Size) .................................................83
Table 5.13: Edge Distance and Preparation Investigation Results (Grade 50, 1/2
Inch Thickness, 15/16 Inch Diameter Hole Size) .................................................84
Table 5.14: Punching Clearance Investigation Results (Grade 36, 1/2 Inch
Thickness) .............................................................................................................86
Table 5.15: Punching Clearance Investigation Results (Grade 50, 1/2 Inch
Thickness) .............................................................................................................86
Table 5.16: Punching Clearance Investigation Summary (1/2 Inch Thickness) ...86
Table 5.17: Punching Operation Investigation Results (Grade 50, 15/16 Inch
Diameter Hole Size) ..............................................................................................87
Table 5.18: Punching Operation Investigation Summary (15/16 Inch Diameter
Hole, Grade 50) .....................................................................................................88
Table 5.19: Cold Tensile Testing Thickness Investigation Results (Grade 36,
15/16 Inch Diameter Hole Size)............................................................................88
Table 5.20: Cold Tensile Testing Thickness Investigation Results (Grade 50,
15/16 Inch Diameter Hole Size)............................................................................89
Table 5.21: Galvanizing Investigation Results (Grade 36, 3/8 Inch Thickness,
13/16 Inch Diameter Hole Size)............................................................................90
Table 5.22: Galvanizing Investigation Results (Grade 50, 3/8 Inch Thickness,
13/16 Inch Diameter Hole Size)............................................................................90
Table 5.23: Reaming Investigation Results (Grade 36, 1/2 Inch Thickness, 15/16
Inch Diameter Hole Size) ......................................................................................92
xvi
Table 5.24: Reaming Investigation Results (Grade 50, 1/2 Inch Thickness, 15/16
Inch Diameter Hole Size) ......................................................................................92
Table 5.25: Average Strength Ratio and Standard Deviation by Preparation.....101
Table 5.26: Average Usable Elongation and Standard Deviation by Preparation
Type.....................................................................................................................103
Table 5.27: Strength Ratio and Usable Elongation Statistics for Replicate
Specimens............................................................................................................105
Table A.1: Current Limit States for UIUC Specimen SA...................................112
Table A.2: Current Limit States for UIUC Specimen SB ...................................113
Table A.3: Current Limit States for UIUC Specimen SD...................................114
Table A.4: Current Limit States for UIUC Specimen SE ...................................115
xvii
1. INTRODUCTION
A research project entitled "Performance and Effects of Punched Holes
and Cold Bending on Steel Bridge Fabrication,” sponsored by the Texas
Department of Transportation (TxDOT), is currently in progress at The University
of Texas at Austin (UT) and Texas A&M University (TAMU). This project
includes, but is not limited to, the research work described herein entitled “Tensile
and Fatigue Behavior of Punched Structural Plates.” This research includes
testing and analysis completed primarily at the Ferguson Structural Engineering
Laboratory (FSEL).
1.1 BACKGROUND
Punching is a quick, economical, and versatile method utilized in the
fabrication of metal. Punching processes may be directly applied to the
fabrication of structural steel intended for use in bridges, buildings, and a variety
of other assemblies for civil use. Typically, punching is employed in the
fabrication of structural elements related to connections, such as members, cross-
frames, and gusset plates on bridges.
The American Association of Transportation Officials (AASHTO) steel
bridge specifications do not allow full size punched holes in primary load carrying
members. The specifications state that holes in these members may be punched
and then reamed full size (in order to remove the damaged zone immediately
surrounding the hole) or drilled. In members in which punching is currently
allowed, AASHTO limits the maximum thickness of punched material to 3/4 inch
for grade 36, 5/8 inch for grade 50, and 1/2 inch for grade 70 (AASHTO
Construction 11-15). Interestingly enough, no distinction is made between
1
punched and drilled holes in the building specification. This is most likely
because structural building elements, relative to structural bridge elements, have
fewer fatigue and fracture-critical issues due to less cyclic loading and exposure
to varying environmental conditions.
Fabricators generally use punching for connection-related bridge elements
that have a small number of holes. Since many fabricators’ current practices are
to use computer numeric controlled (CNC) drilling for splice plates, this generally
leaves gusset plates, connection angles, webs, and any other remaining secondary
elements as candidates for punching. Based on recent specification modifications,
some areas of possible concern now include the punching of thick gusset plates,
as well as the punching of elements such as cross-frames and diaphragms in
curved plate structures. Cross-frames and diaphragms are now considered
primary members; therefore, if there is any bolting of these elements such as
connecting angles to plate diaphragms, punching to full size is prohibited
(AASHTO Design 2004).
AASHTO Construction specifications require that punched holes must be
sub-punched and reamed to the required diameter when used in members carrying
calculated load forces. Holes are required to be sub-punched at least 3/16 inch
smaller than the nominal size of the fastener and then reamed to full size
(AASHTO Construction 2004). The purpose of reaming is to remove the
plastically strained material surrounding the hole and any micro-cracks formed
during the punching operation. Nevertheless, the practice of adding a 1/16 inch
damage zone to all prepared holes, punched or drilled, is used in all structural
steel specifications in the United States.
Since the current specifications only provide general guidelines pertaining
to the exclusion and thickness limitations of the punching process, this research
investigates the effects of many parameters on punched hole specimens and the
2
punching process while providing a comparison to drilled and reamed holes. The
variations imposed on punched hole specimens in this study include a range of
steel types, temperatures, hole sizes, plate thicknesses, edge distances and
preparation, punch clearance and operation, galvanizing, and reaming. Through
tensile and fatigue testing and analysis, this research explores the possible use of
punched holes with a reduced connection capacity.
1.2 OBJECTIVE AND SCOPE
As noted in the Background section, the goal of this research work is to
determine the influence of punched holes upon the tensile and fatigue capacity of
steel connections. In order to do this, a total of 120 punched, drilled, and reamed
hole specimens have been tested in tension and fatigue and analyzed at the FSEL.
Based on the results of this study, possible modified specification provisions,
including guidelines and limits based on material, geometric, and punching
variations, for members with punched holes have been recommended.
3

2. BACKGROUND AND LITERATURE REVIEW WITH ANALYSIS
2.1 THE PUNCHING PROCESS AND RAMIFICATIONS OF PUNCHING
Punching is a rapid method of making holes for bolted connections in steel
structures and is done using a punch and an oversize female die in either a
hydraulic or mechanical press. Hole punching equipment is often utilized in
manufacturing lines which combine two or more processes (e.g. punching and
shearing) for efficient fabrication. Many times, punching processes are used to
rapidly, and even automatically, produce smaller angle members for cross frames
and bracing members.
In the punching process, a hole is produced by shearing the parent
material. As shown in Tables 2.1 and 2.2, the force required to punch a hole
increases with the thickness of the material, diameter of the hole, and the strength
of the steel (Brolund 2004).
4

Table 2.1: Tons Force Required to Punch Typical Grade 36 Steel
Hole Dia. 1/16 1/8 3/16 1/14 5/16 3/8 1/2 5/8 3/4 7/8 1 1-1/8 1-1/4(in.) .063 .125 .187 .250 .312 .375 .500 .625 .750 .875 1.000 1.125 1.2501/4 1.4 3.0 4.4 5.9 7.3 8.8 - - - - - - -5/16 1.8 3.7 5.5 7.4 9.2 11.0 - - - - - - -3/8 2.1 4.4 6.6 8.8 11.0 13.3 17.7 - - - - - -7/16 2.5 5.2 7.7 10.3 12.9 15.5 20.6 - - - - - -1/2 2.8 5.9 8.8 11.8 14.7 17.7 23.6 29.5 - - - - -9/16 3.2 6.7 9.9 13.2 16.5 19.9 26.5 33.1 - - - - -5/8 3.5 7.4 11.0 14.7 18.4 22.1 29.4 37.0 44.2 - - - -
11/16 3.9 8.1 12.1 16.2 20.2 24.3 32.4 40.5 48.6 - - - -3/4 4.2 8.9 13.2 17.7 22.1 26.5 35.3 44.2 53.0 62.0 - - -
13/16 4.6 9.6 14.3 19.1 24.0 28.7 38.3 48.0 57.4 67.0 76.6 - -7/8 4.9 10.3 15.4 20.6 25.7 31.0 41.0 51.5 62.0 72.2 82.5 - -
15/16 5.3 11.1 16.5 22.1 27.6 33.1 44.2 55.2 66.3 77.3 88.3 99.4 -1 5.6 11.8 17.6 23.6 29.4 35.3 47.1 59.0 70.7 82.5 94.3 106.0 -
1-1/16 6.0 12.5 18.7 25.0 31.3 37.6 50.0 62.6 75.0 87.7 100.0 113.0 125.21-1/8 6.3 13.3 19.8 26.5 33.0 39.7 52.9 66.2 79.4 92.7 106.0 119.0 132.5
1-3/16 6.7 14.0 20.9 28.0 34.9 42.0 55.9 69.9 83.9 97.9 111.9 125.9 139.91-1/4 7.1 14.7 22.0 29.5 36.8 44.2 58.9 73.7 88.4 103.2 117.9 132.6 147.3
1-5/16 7.4 15.5 23.1 30.9 38.6 46.3 61.8 77.2 92.7 108.1 123.6 139.0 154.61-3/8 7.8 16.2 24.2 32.4 40.4 48.6 64.8 81.0 97.2 113.4 129.6 145.8 162.01-1/2 8.5 17.7 26.4 35.3 44.1 53.0 70.6 88.3 106.0 123.6 141.3 159.0 176.71-3/4 9.9 20.6 30.9 41.2 51.5 61.9 82.5 103.1 123.7 144.3 164.9 185.6 206.2
2 11.3 23.6 35.3 47.1 58.8 70.7 94.3 117.8 141.4 164.9 188.5 212.1 235.62-1/4 12.7 26.5 39.7 53.0 66.2 79.5 106.0 132.5 159.0 185.6 212.1 238.6 -2-1/2 14.2 29.5 44.1 58.9 73.5 88.4 117.8 147.3 - - - - -2-3/4 15.6 32.4 48.5 64.8 80.9 97.2 129.6 - - - - - -
3 17.0 35.4 52.9 70.7 88.2 106.0 141.4 - - - - - -
Material Thickness (in.)Tons Force Required to Punch ASTM-A36 Structural Steel (60,000 psi Tensile Strength)
5
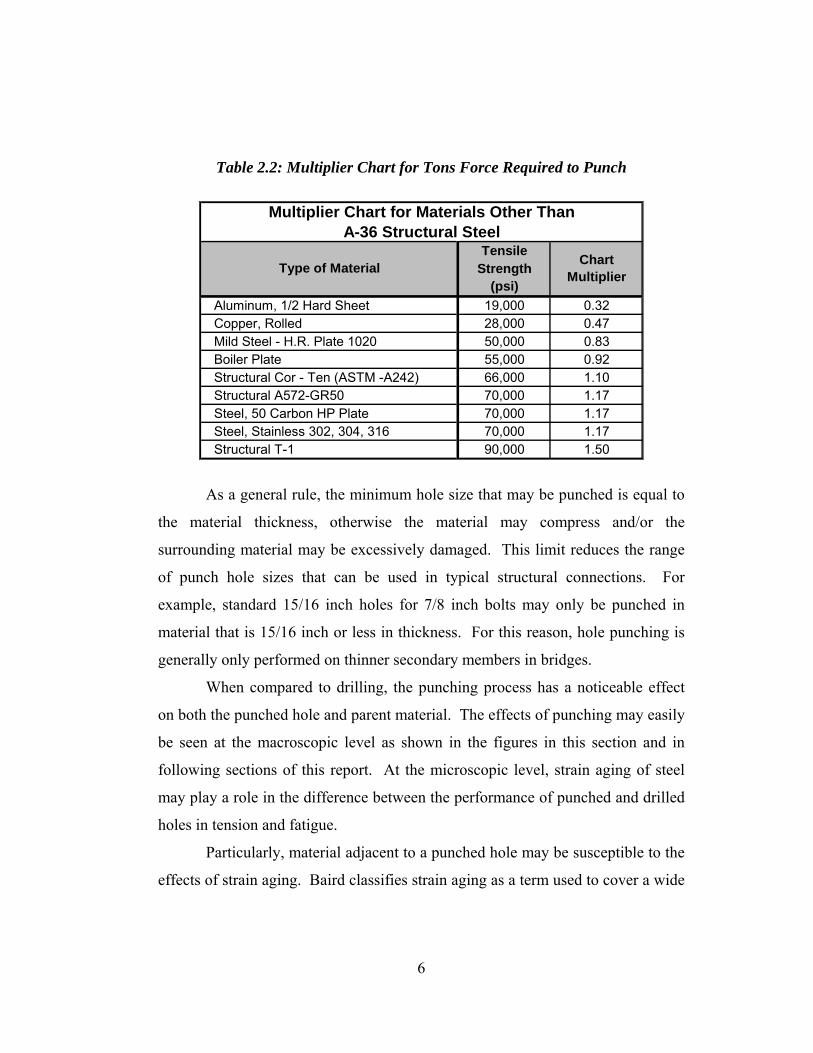
Table 2.2: Multiplier Chart for Tons Force Required to Punch
TensileStrength
(psi) Aluminum, 1/2 Hard Sheet 19,000 0.32 Copper, Rolled 28,000 0.47 Mild Steel - H.R. Plate 1020 50,000 0.83 Boiler Plate 55,000 0.92 Structural Cor - Ten (ASTM -A242) 66,000 1.10 Structural A572-GR50 70,000 1.17 Steel, 50 Carbon HP Plate 70,000 1.17 Steel, Stainless 302, 304, 316 70,000 1.17 Structural T-1 90,000 1.50
Multiplier Chart for Materials Other Than A-36 Structural Steel
Type of Material Chart Multiplier
As a general rule, the minimum hole size that may be punched is equal to
the material thickness, otherwise the material may compress and/or the
surrounding material may be excessively damaged. This limit reduces the range
of punch hole sizes that can be used in typical structural connections. For
example, standard 15/16 inch holes for 7/8 inch bolts may only be punched in
material that is 15/16 inch or less in thickness. For this reason, hole punching is
generally only performed on thinner secondary members in bridges.
When compared to drilling, the punching process has a noticeable effect
on both the punched hole and parent material. The effects of punching may easily
be seen at the macroscopic level as shown in the figures in this section and in
following sections of this report. At the microscopic level, strain aging of steel
may play a role in the difference between the performance of punched and drilled
holes in tension and fatigue.
Particularly, material adjacent to a punched hole may be susceptible to the
effects of strain aging. Baird classifies strain aging as a term used to cover a wide
6
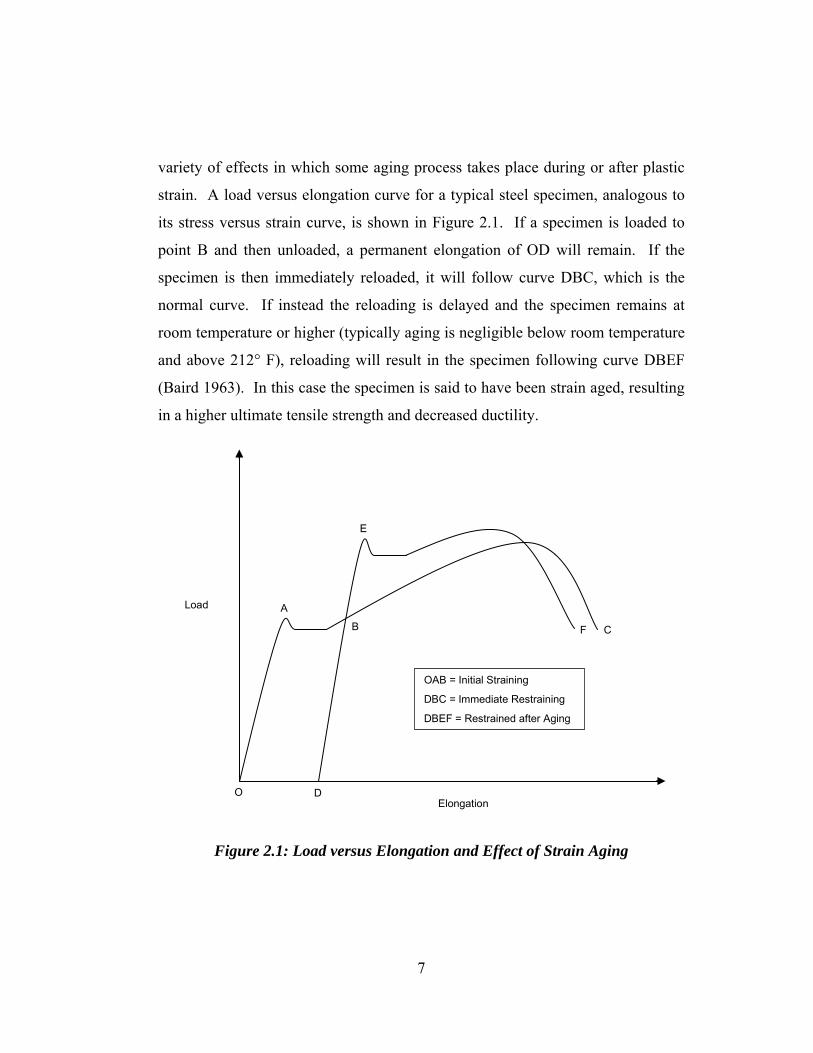
variety of effects in which some aging process takes place during or after plastic
strain. A load versus elongation curve for a typical steel specimen, analogous to
its stress versus strain curve, is shown in Figure 2.1. If a specimen is loaded to
point B and then unloaded, a permanent elongation of OD will remain. If the
specimen is then immediately reloaded, it will follow curve DBC, which is the
normal curve. If instead the reloading is delayed and the specimen remains at
room temperature or higher (typically aging is negligible below room temperature
and above 212° F), reloading will result in the specimen following curve DBEF
(Baird 1963). In this case the specimen is said to have been strain aged, resulting
in a higher ultimate tensile strength and decreased ductility.
Load
ElongationO D
A
E
CF
OAB = Initial Straining
DBC = Immediate Restraining
DBEF = Restrained after Aging
B
Figure 2.1: Load versus Elongation and Effect of Strain Aging
7

Hume-Rothery (1954) notes that the cause of strain aging and
accompanying increase in strength and decrease in ductility is the desegregation
of interstitial carbon and nitrogen solute atoms from the iron crystal lattice within
the material. Normally, the carbon and nitrogen solute atoms occupy the
interstitial sites in the body-center-cubic iron crystal lattice and create “misfit
stresses” in the strain fields of dislocations. When these interstitial atoms are
relocated to the core regions of dislocations by heat or stress (e.g. localized
punching), the “misfit energy” is lowered, thus causing an increase in hardness
and strength and a decrease in ductility.
These material response characteristics play an important role in the
aftereffects of the punching process. Brolund (2004) states that since punching
material relies on shear cutting action, the process produces four inherent
characteristics found on both the surface of the punched hole and the adjacent
parent material as illustrated in Figure 2.2.
Figure 2.2: Characteristics of Parent Material and Punched Hole (Brolund
2004)
The severity of the characteristics illustrated in Figure 2.2 depends on many
variables including, but not limited to, the:
• Thickness of the material
8
• Type and hardness of the material
• Amount of clearance between the cutting edges
• Condition of the cutting edges
• Support or firmness of material on both sides of the cut
• Diameter of hole in relation to material thickness
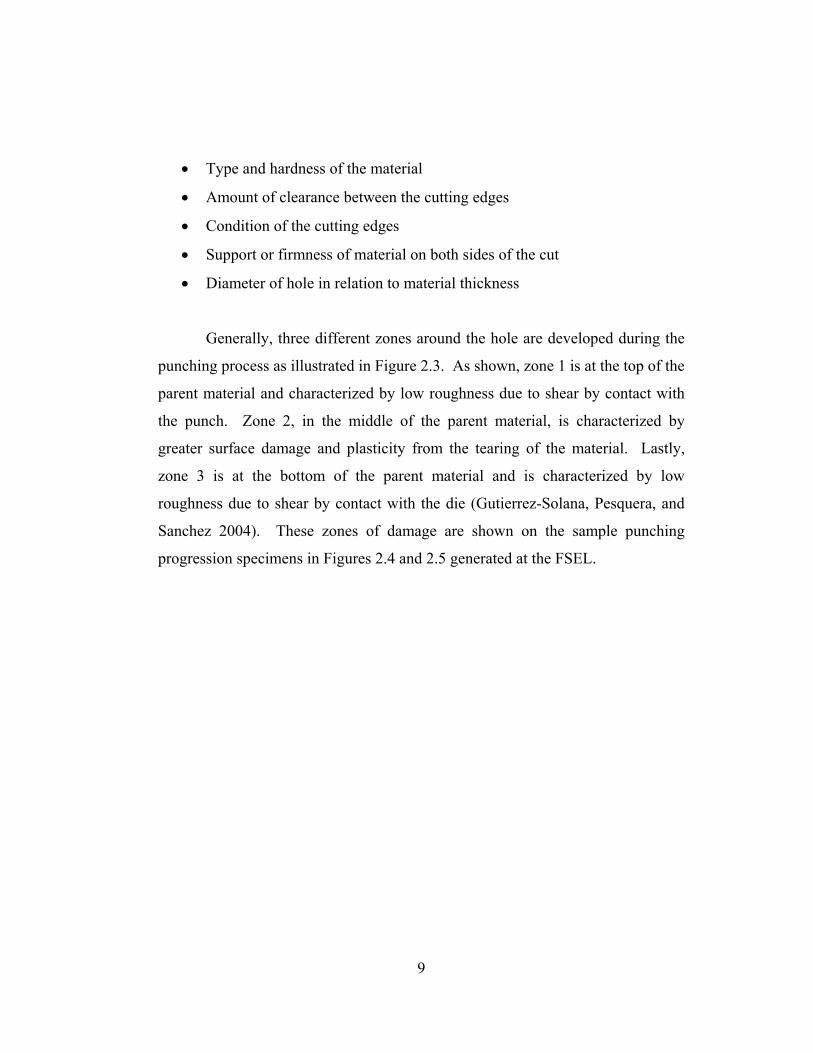
Generally, three different zones around the hole are developed during the
punching process as illustrated in Figure 2.3. As shown, zone 1 is at the top of the
parent material and characterized by low roughness due to shear by contact with
the punch. Zone 2, in the middle of the parent material, is characterized by
greater surface damage and plasticity from the tearing of the material. Lastly,
zone 3 is at the bottom of the parent material and is characterized by low
roughness due to shear by contact with the die (Gutierrez-Solana, Pesquera, and
Sanchez 2004). These zones of damage are shown on the sample punching
progression specimens in Figures 2.4 and 2.5 generated at the FSEL.
9
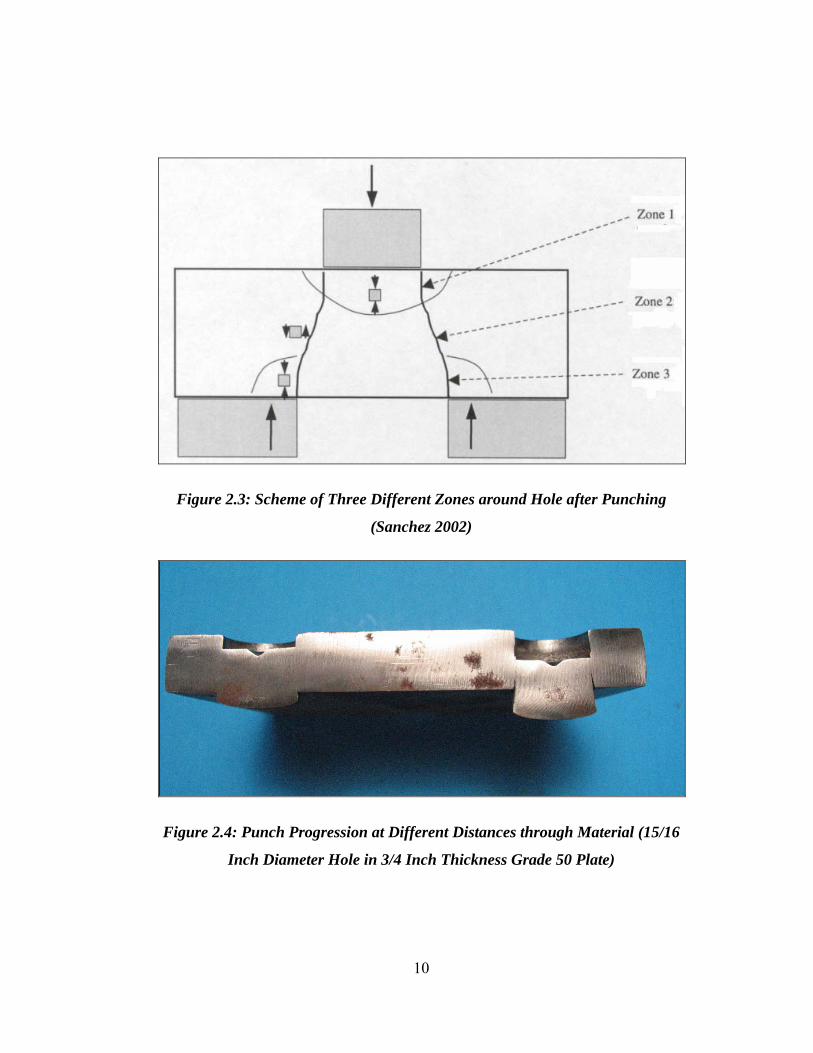
Figure 2.3: Scheme of Three Different Zones around Hole after Punching
(Sanchez 2002)
Figure 2.4: Punch Progression at Different Distances through Material (15/16
Inch Diameter Hole in 3/4 Inch Thickness Grade 50 Plate)
10
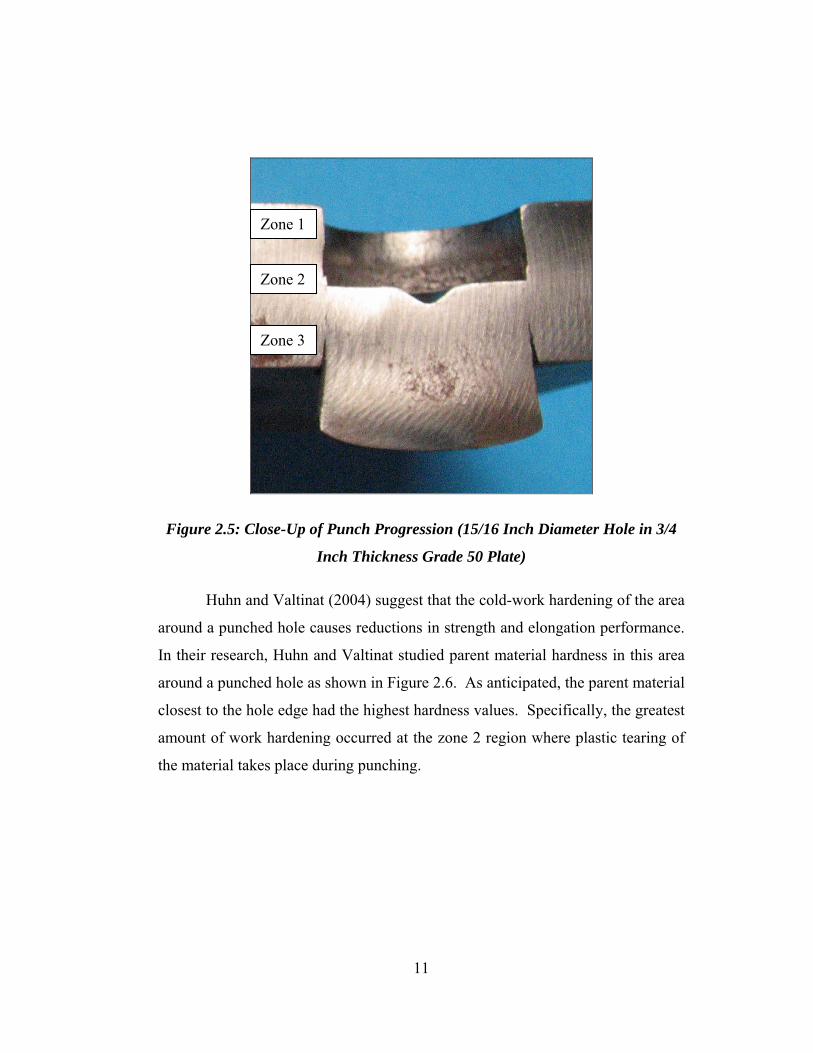
Figure 2.5: C
Huhn an
around a punch
In their researc
around a punch
closest to the h
amount of wor
the material tak
Zone 1
Zone 2 Zone 3lose-Up of Punch Progression (15/16 Inch Diameter Hole in 3/4
Inch Thickness Grade 50 Plate)
d Valtinat (2004) suggest that the cold-work hardening of the area
ed hole causes reductions in strength and elongation performance.
h, Huhn and Valtinat studied parent material hardness in this area
ed hole as shown in Figure 2.6. As anticipated, the parent material
ole edge had the highest hardness values. Specifically, the greatest
k hardening occurred at the zone 2 region where plastic tearing of
es place during punching.
11
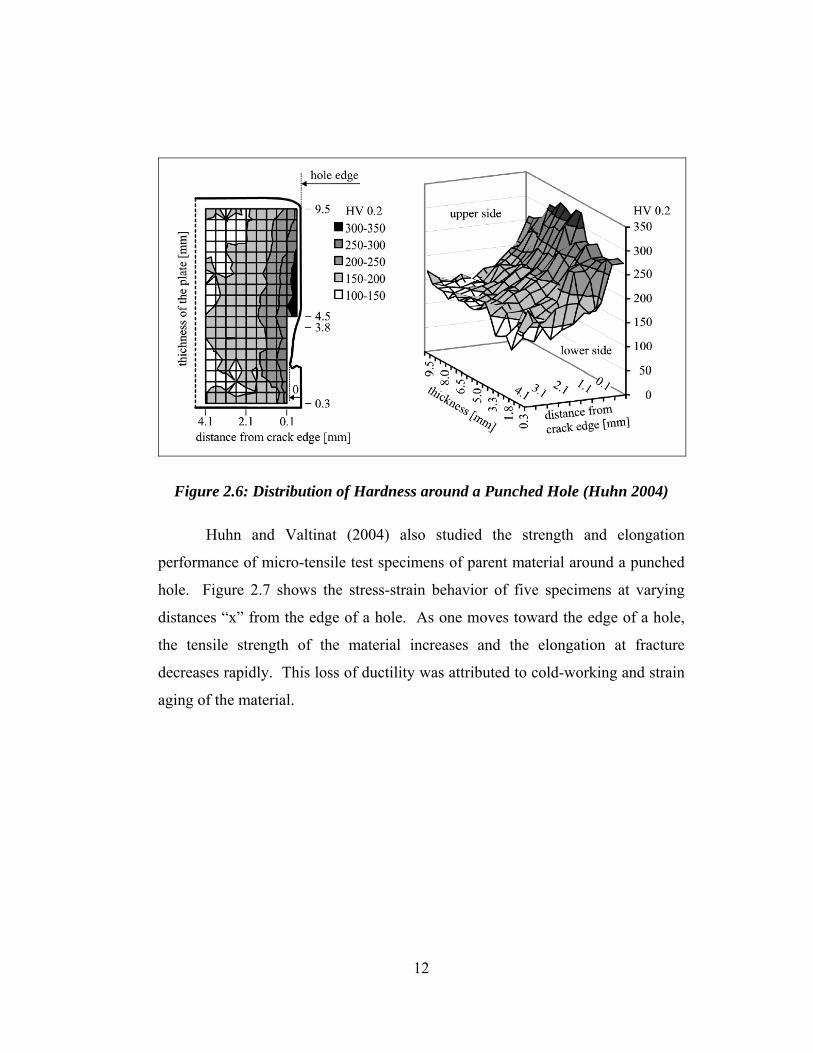
Figure 2.6: Distribution of Hardness around a Punched Hole (Huhn 2004)
Huhn and Valtinat (2004) also studied the strength and elongation
performance of micro-tensile test specimens of parent material around a punched
hole. Figure 2.7 shows the stress-strain behavior of five specimens at varying
distances “x” from the edge of a hole. As one moves toward the edge of a hole,
the tensile strength of the material increases and the elongation at fracture
decreases rapidly. This loss of ductility was attributed to cold-working and strain
aging of the material.
12

Figure 2.7: Stress-Strain Curves of Micro-Tensile Test Specimens (Huhn 2004)
Gaylord (1972) notes that strains at the edge of a hole are much larger than
those located at a distance from a hole, but stress concentrations (K) at holes are
usually neglected in structural design. In the case of a tension-only loaded plate
with a hole located in the middle of the section:
3max ==applied
Kσσ (5.1)
This stress concentration is usually ignored because stress is redistributed by
yielding adjacent to the hole. This ductility is shown in Figure 2.8, an illustration
of the unloaded and loaded (or stretched) states of a sheet with an orthogonal grid.
Note that following hole punching, the hardened material adjacent to a punched
hole limits the redistribution of stress, resulting in lower strength and ductility.
13
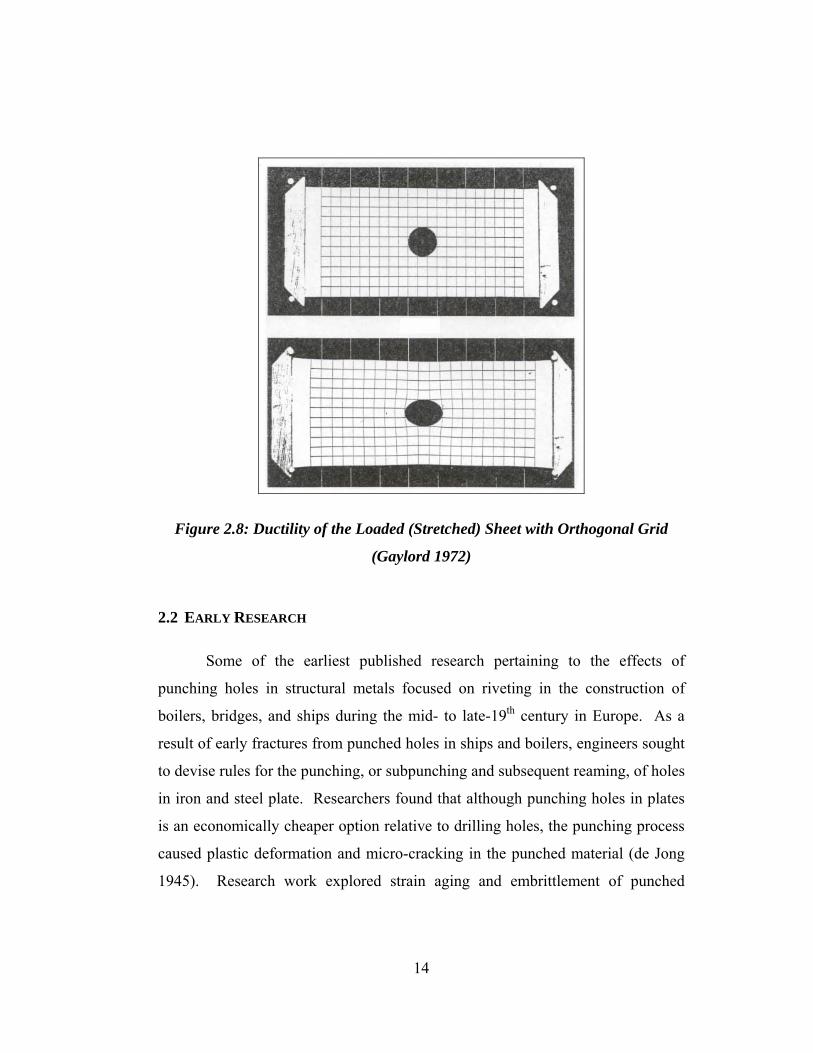
Figure 2.8: Ductility of the Loaded (Stretched) Sheet with Orthogonal Grid
(Gaylord 1972)
2.2 EARLY RESEARCH
Some of the earliest published research pertaining to the effects of
punching holes in structural metals focused on riveting in the construction of
boilers, bridges, and ships during the mid- to late-19th century in Europe. As a
result of early fractures from punched holes in ships and boilers, engineers sought
to devise rules for the punching, or subpunching and subsequent reaming, of holes
in iron and steel plate. Researchers found that although punching holes in plates
is an economically cheaper option relative to drilling holes, the punching process
caused plastic deformation and micro-cracking in the punched material (de Jong
1945). Research work explored strain aging and embrittlement of punched
14
material during fabrication and service as well as ramifications of this material
damage.
Most of this research only explored the effects of hole-making methods on
material strength and, qualitatively, on material ductility. Test results comparing
punching, punching followed by reaming, and drilling holes varied, but generally
showed that punching reduced the strength of plates or connections by 5 to 10
percent relative to drilling (de Jong 1945). Since there was a limited amount of
quantitative results available by the beginning of the 20th century, theoretical and
experimental research on the punching of holes then expanded throughout
Europe, Japan, and the United States.
2.3 UNIVERSITY OF ILLINOIS AT URBANA-CHAMPAIGN RESEARCH
In the 1940s, 1950s, and 1960s, researchers at the University of Illinois at
Urbana-Champaign (UIUC) extensively investigated the behavior of structural
steel connections. In this time period, at least one hundred and fifty full-size steel
connections were tested and over nine hundred previous connection tests
completed at other facilities were analyzed. UIUC researchers explored a wide
range of variables, from fastener pattern and specimen configuration to plate
characteristics, while testing double-strap butt-type and other large truss-type
riveted and bolted connections (see Figure 2.9). Following testing and analysis,
the method of forming holes was found to be one of the most significant variables
affecting joint efficiency in their study.
15
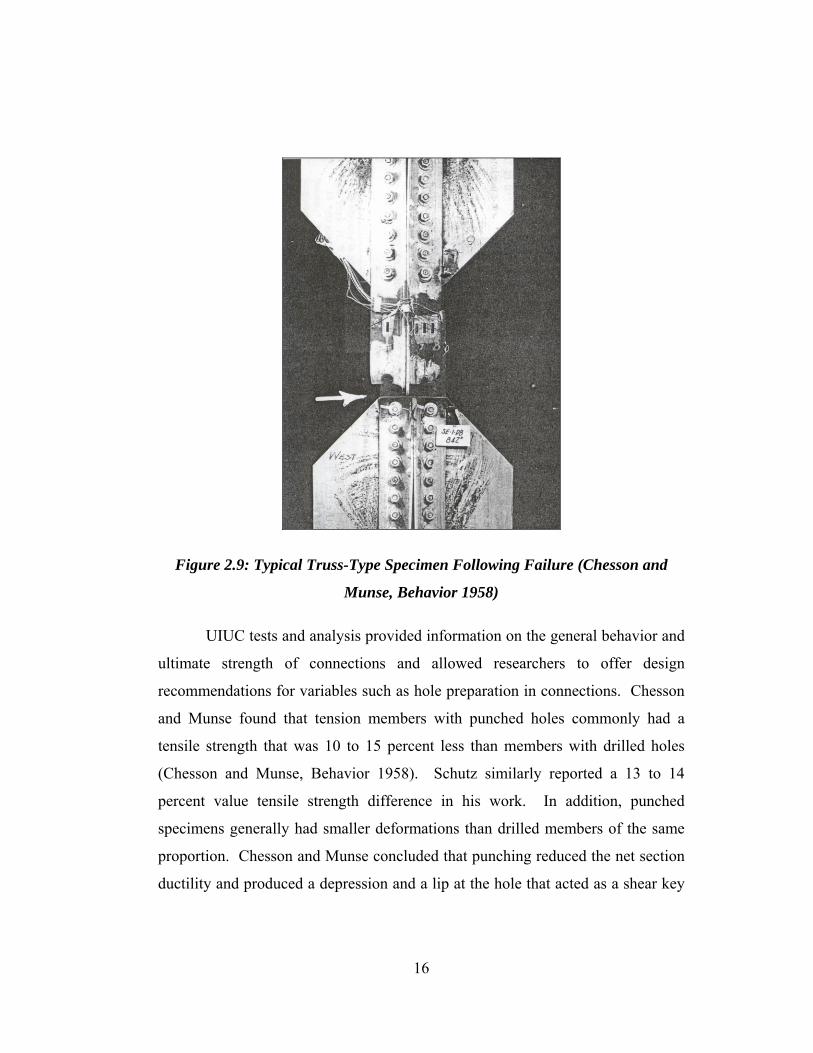
Figure 2.9: Typical Truss-Type Specimen Following Failure (Chesson and
Munse, Behavior 1958)
UIUC tests and analysis provided information on the general behavior and
ultimate strength of connections and allowed researchers to offer design
recommendations for variables such as hole preparation in connections. Chesson
and Munse found that tension members with punched holes commonly had a
tensile strength that was 10 to 15 percent less than members with drilled holes
(Chesson and Munse, Behavior 1958). Schutz similarly reported a 13 to 14
percent value tensile strength difference in his work. In addition, punched
specimens generally had smaller deformations than drilled members of the same
proportion. Chesson and Munse concluded that punching reduced the net section
ductility and produced a depression and a lip at the hole that acted as a shear key
16
to impede deformation relative to drilling. This lower ductility caused the
ultimate stress to be reached early near the holes; thus, stress in the more distant
material could not be as effectively developed relative to drilled plates (Chesson
and Munse, Truss 1963).
Out of the many specimens that were tested and analyzed at the UIUC,
twenty have been re-analyzed using current AASHTO Load Resistance Factor
Design (LRFD) Bridge Design Specifications. These ten pairs of specimens were
all large truss-type connections that were replicates with either punched or drilled
holes. Note that all reduction and resistance factors were taken as 1.0 since only
the method of hole preparation was being compared. The following current
AASHTO LRFD Bridge Design Specifications sections were utilized in analyzing
these specimens:
• 6.8.2 Tensile Resistance
gyynyyr AFPP φφ == (2.1)
UAFPP nuunuur φφ == (2.2)
where Pny = nominal tensile resistance for yielding in gross section
Fy = yield strength
Ag = gross cross-sectional area of the member
Pnu = nominal tensile resistance for fracture in net section
Fu = tensile strength
An = net area of the member as specified in Section 6.8.3
U = reduction factor to account for shear lag (taken as 1.0 in this
comparison of results)
φy = resistance factor for yielding of tension members (taken as
1.0 in this comparison of results)
17

φu = resistance factor for fracture of tension members (taken as
1.0 in this comparison of results)
• 6.8.3 Net Area
Net area, An, of a member is the sum of the products of thickness and the
smallest net width of each element. The width of each standard bolt hole
shall be taken as the nominal diameter of the hole plus 1/16 inch.
The net width for each chain shall be determined by subtracting from the
width of the element the sum of the widths of all holes in the chain and
adding the quantity s2/4g for each space between consecutive holes in the
chain, where:
s = pitch of any two consecutive holes
g = gage of the same two holes
• 6.13.4 Block Shear Rupture Resistance
If Atn ≥ 0.58 Avn, then:
( )tnuvgybsr AFAFR += 58.0φ (2.3)
otherwise:
( )tgyvnubsr AFAFR += 58.0φ (2.4)
where Avg = gross area along the plane resisting shear stress
Avn = net area along the plane resisting shear stress
Atg = gross area along the plane resisting tension stress
Atn = net area along the plane resisting tension stress
Fy = specified minimum yield strength of the connected material
Fu = specified minimum tensile strength of the connection material
18
φbs = resistance factor for block shear (not used in order to obtain
the most accurate comparisons)
• 6.13.5 Connection Elements
The factored resistance in tension shall be taken as the least of the values
given by Section 6.8.2 for yielding and fracture, respectively, or the block
shear rupture resistance specified in Section 6.13.4.
Using these specification details on the UIUC specimens, a current
specification limit state was calculated based on a governing tension (yield or
fracture) failure or a block shear (shear or tension) failure. Tables A1 through A4
in the Appendix show the limit state calculations for each type of UIUC
specimen.
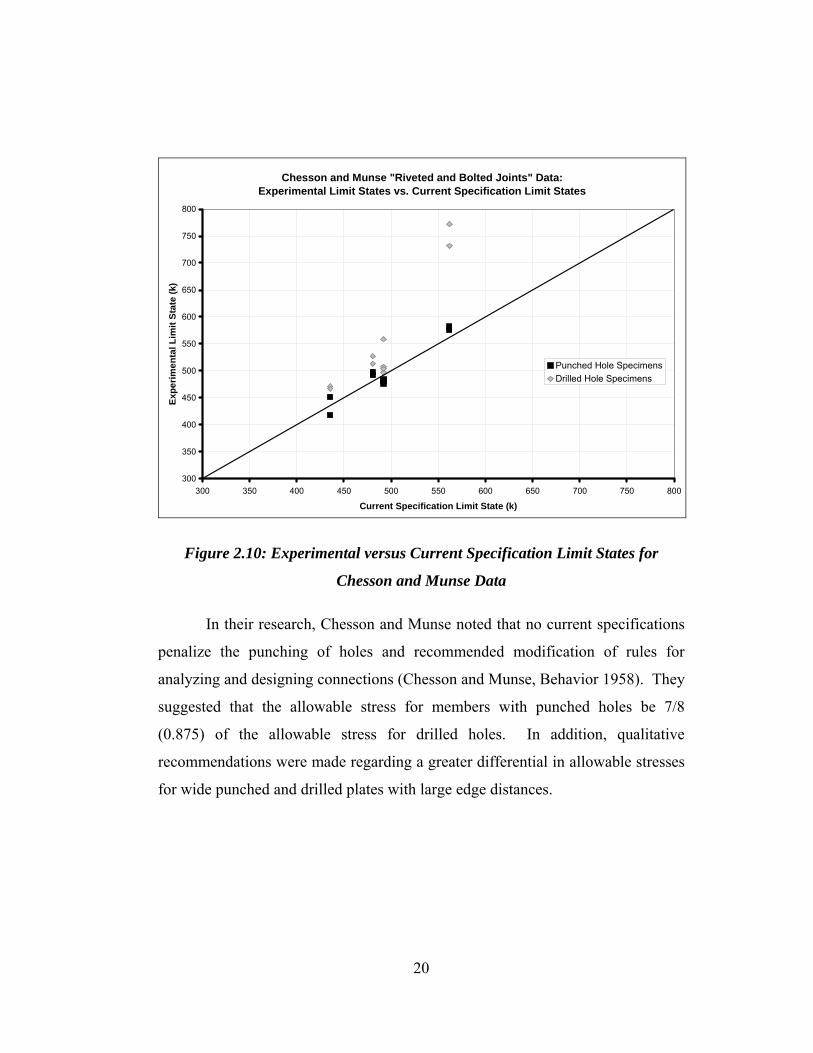
A comparison between the UIUC experimental strength limit state versus
the current AASHTO Design specification strength limit state is illustrated in
Figure 2.7. The 45 degree line shown in the plot signifies equal experimental and
specification limit states. Whereas points above this line indicate experimental
results that exceed specification limits, points below this line indicate
experimental results that are lower than specification limits. Points falling below
this line signify non-conservative specification limit states. As seen in Figure
2.10, the drilled hole variations of each specimen pair performed better than the
punched hole variations, some of which fell below the 45 degree line. Most
notably, there is a large difference between the performance of punched and
drilled holes in the plotted specimen that failed at the highest load in Figure 2.7.
Chesson and Munse suggest that this large discrepancy may be due to the effect of
punched holes on wide plates with large edge distances (Chesson and Munse,
Truss 1963).
19
Chesson and Munse "Riveted and Bolted Joints" Data: Experimental Limit States vs. Current Specification Limit States
300
350
400
450
500
550
600
650
700
750
800
300 350 400 450 500 550 600 650 700 750 800
Current Specification Limit State (k)
Expe
rimen
tal L
imit
Stat
e (k
)
Punched Hole SpecimensDrilled Hole Specimens
Figure 2.10: Experimental versus Current Specification Limit States for
Chesson and Munse Data
In their research, Chesson and Munse noted that no current specifications
penalize the punching of holes and recommended modification of rules for
analyzing and designing connections (Chesson and Munse, Behavior 1958). They
suggested that the allowable stress for members with punched holes be 7/8
(0.875) of the allowable stress for drilled holes. In addition, qualitative
recommendations were made regarding a greater differential in allowable stresses
for wide punched and drilled plates with large edge distances.
20

2.4 RECENT RESEARCH
In 2002, Frank (2002) performed a study comparing the tensile behavior
of plates prepared with punched and drilled holes. Plate material and thicknesses
that may be typically punched, or unintentionally punched full-size, in a state of
Texas highway bridge were used. In tests that varied two grades of steel,
thicknesses, and temperatures, each drilled hole specimen exhibited greater
strength and ductility relative to its punched hole replicate. Specifically, Frank
showed the average strength ratio of punched and drilled holes specimens to be
0.98 and 1.16, respectively. His recommendations included the reaming of
punched holes in primary tension members and the use of punched holes in
secondary connection members. These results closely matched those previously
found by Chesson, Munse, and Schutz at the UIUC.
Concurrent research by Rassati, Swanson, and Yuan (2004) at the
University of Cincinnati (UC) has been investigating the effects of drilling,
punching, and thermal cutting in structural steel. Tensile testing results of bar and
tee specimens have shown average strength ratios of 1.05 for punched specimens
and 1.11 for drilled and flame cut specimens. This strength difference due to hole
preparation is somewhat smaller than those differences previously reported by
Frank and the UIUC researchers, but a similar decrease in tensile ductility was
found for punched specimens relative to specimens with other methods of hole-
forming. Rassati, Swanson, and Yuan reported no well-defined trends with regard
to punch-to-thickness ratio, punching workmanship, or the gage of holes in the tee
specimens.
Fatigue of punched hole plates is also currently being researched at other
universities, both in the United States and in Europe. Rassati, Swanson, and Yuan
(UC) are also investigating the efficiency of high-performance grade 70 steel that
is punched, sub-punched and reamed, or drilled. UC researchers have found a
21
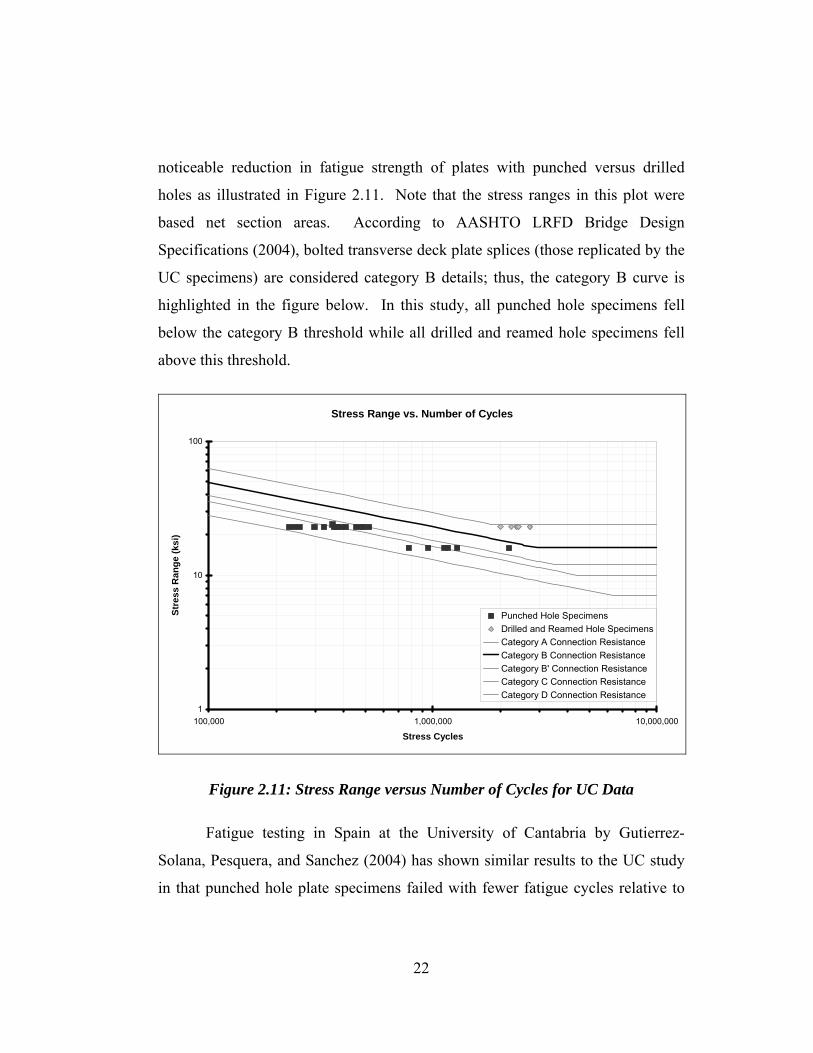
noticeable reduction in fatigue strength of plates with punched versus drilled
holes as illustrated in Figure 2.11. Note that the stress ranges in this plot were
based net section areas. According to AASHTO LRFD Bridge Design
Specifications (2004), bolted transverse deck plate splices (those replicated by the
UC specimens) are considered category B details; thus, the category B curve is
highlighted in the figure below. In this study, all punched hole specimens fell
below the category B threshold while all drilled and reamed hole specimens fell
above this threshold.
Stress Range vs. Number of Cycles
1
10
100
100,000 1,000,000 10,000,000
Stress Cycles
Stre
ss R
ange
(ksi
)
Punched Hole SpecimensDrilled and Reamed Hole SpecimensCategory A Connection ResistanceCategory B Connection ResistanceCategory B' Connection ResistanceCategory C Connection ResistanceCategory D Connection Resistance
Figure 2.11: Stress Range versus Number of Cycles for UC Data
Fatigue testing in Spain at the University of Cantabria by Gutierrez-
Solana, Pesquera, and Sanchez (2004) has shown similar results to the UC study
in that punched hole plate specimens failed with fewer fatigue cycles relative to
22
drilled hole plate specimens. Specifically, the average punched to drilled hole
ratio of cycles to failure was found to be 0.51 (i.e. drilled specimens had
approximately double the fatigue resistance). Solana, Pesquera, and Sanchez
found that the fatigue performance of these plates was independent of the steel
quality. In addition, their study analyzed local micro-structural damage at
fracture surfaces and found punched specimens developing first propagation
stages of fracture 10 times faster than replicate drilled specimens.
2.5 USE OF PREVIOUS RESEARCH IN CONJUNCTION WITH CURRENT STUDY
From early research of punched holes and rivets in iron plates to recent
tests in Illinois, Ohio, Texas, and Spain, experimental evidence has shown that the
tensile and fatigue performance of punched hole specimens is sub par relative to
drilled hole specimens. Further testing, as described in this report, considers
additional variations including a range of steel types, temperatures, hole sizes,
plate thicknesses, edge distances and preparation, punch clearance and operation,
galvanizing, and reaming. In combining past research data with multiple sets of
current findings, design recommendations may be formulated for the use of
members with punched holes. Most importantly, these recommendations may
now consider current fabrication practices as well as steels currently used in the
bridge industry.
23
3. EXPERIMENT DESIGN
3.1 PLATE SPECIMENS
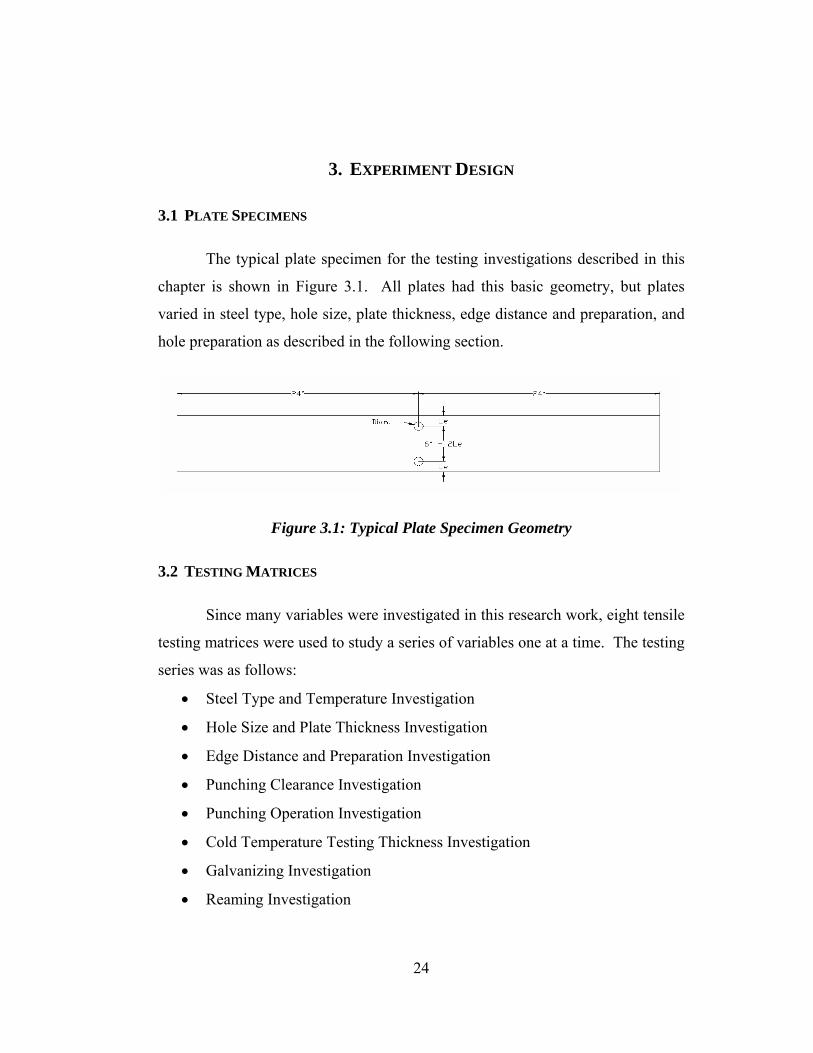
The typical plate specimen for the testing investigations described in this
chapter is shown in Figure 3.1. All plates had this basic geometry, but plates
varied in steel type, hole size, plate thickness, edge distance and preparation, and
hole preparation as described in the following section.
Figure 3.1: Typical Plate Specimen Geometry
3.2 TESTING MATRICES
Since many variables were investigated in this research work, eight tensile
testing matrices were used to study a series of variables one at a time. The testing
series was as follows:
• Steel Type and Temperature Investigation
• Hole Size and Plate Thickness Investigation
• Edge Distance and Preparation Investigation
• Punching Clearance Investigation
• Punching Operation Investigation
• Cold Temperature Testing Thickness Investigation
• Galvanizing Investigation
• Reaming Investigation
24
3.2.1 Steel Type and Temperature Investigation
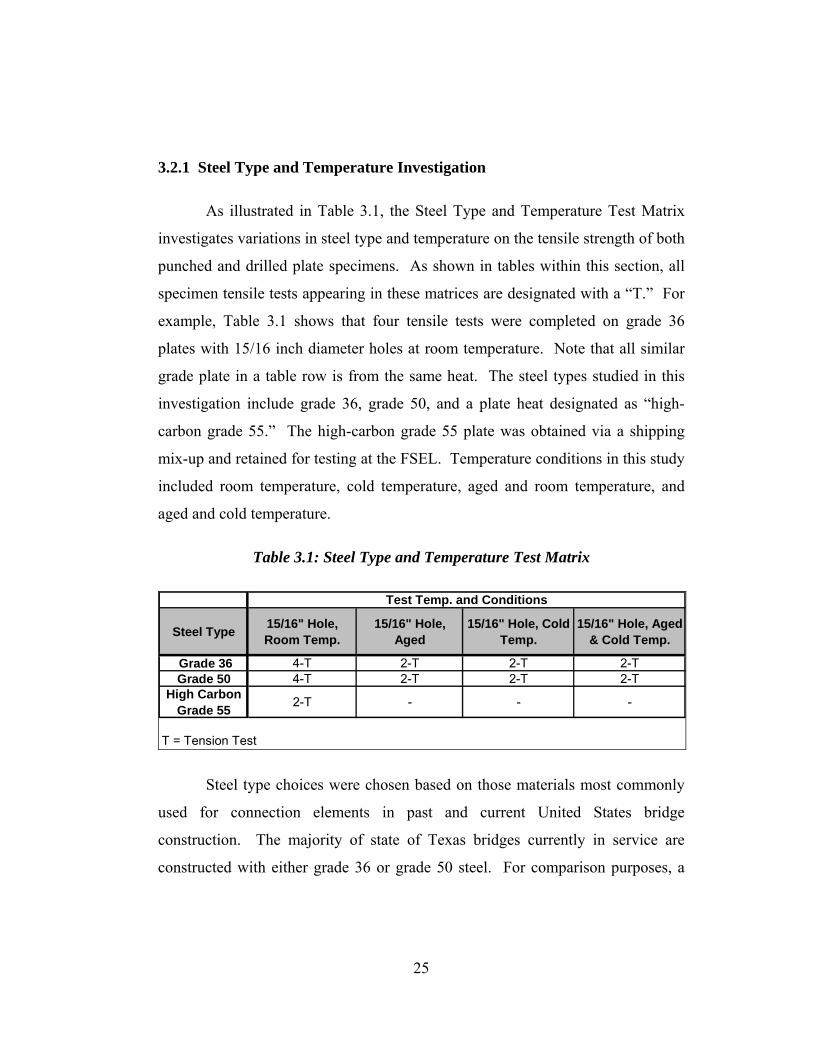
As illustrated in Table 3.1, the Steel Type and Temperature Test Matrix
investigates variations in steel type and temperature on the tensile strength of both
punched and drilled plate specimens. As shown in tables within this section, all
specimen tensile tests appearing in these matrices are designated with a “T.” For
example, Table 3.1 shows that four tensile tests were completed on grade 36
plates with 15/16 inch diameter holes at room temperature. Note that all similar
grade plate in a table row is from the same heat. The steel types studied in this
investigation include grade 36, grade 50, and a plate heat designated as “high-
carbon grade 55.” The high-carbon grade 55 plate was obtained via a shipping
mix-up and retained for testing at the FSEL. Temperature conditions in this study
included room temperature, cold temperature, aged and room temperature, and
aged and cold temperature.
Table 3.1: Steel Type and Temperature Test Matrix
Steel Type 15/16" Hole, Room Temp.
15/16" Hole, Aged
15/16" Hole, Cold Temp.
15/16" Hole, Aged & Cold Temp.
Grade 36 4-T 2-T 2-T 2-TGrade 50 4-T 2-T 2-T 2-T
High Carbon Grade 55 2-T - - -
T = Tension Test
Test Temp. and Conditions
Steel type choices were chosen based on those materials most commonly
used for connection elements in past and current United States bridge
construction. The majority of state of Texas bridges currently in service are
constructed with either grade 36 or grade 50 steel. For comparison purposes, a
25
high-carbon grade 55 steel was tested to further demonstrate the effects of
different chemical compositions on material performance.
Temperature conditions were chosen to simulate different environmental
conditions experienced by state of Texas bridges. Room temperature testing was
performed during the spring and summer months indoors at the FSEL. Indoor lab
temperatures typically ranged from 70 to 85 degrees Fahrenheit. Cold
temperature testing was performed by using the temperature chamber as described
later in this report and ranged from zero to five degrees Fahrenheit. Aged plates
were stored in an oven at 150 degrees Fahrenheit for 24 hours prior to testing to
simulate exposure to summer heat and strain aging that may occur due to this
exposure.
3.2.2 Hole Size and Plate Thickness Investigation
As illustrated in Table 3.2, the Hole Size and Plate Thickness Test
Matrixes investigates variations in plate thickness and hole size on the tensile
strength of both punched and drilled plate specimens. The plate thicknesses
studied included 3/8, 1/2, and 3/4 inch dimensions and the hole sizes include
11/16, 13/16, and 15/16 inch diameters.
26
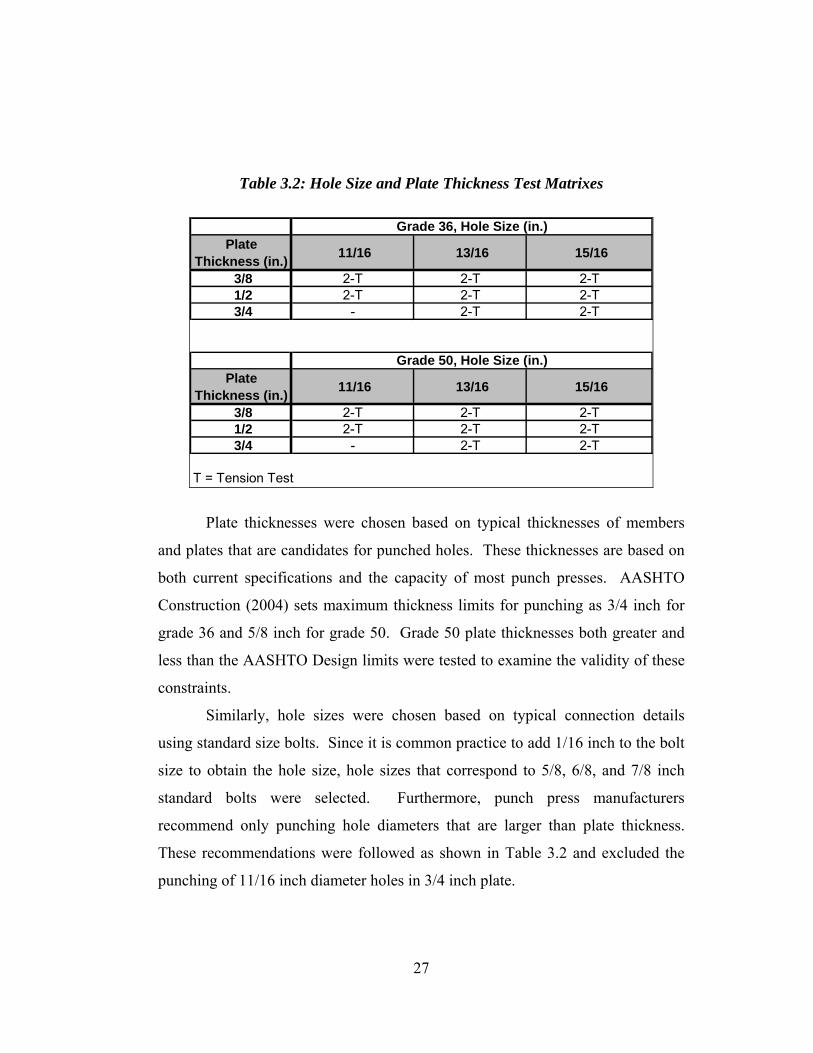
Table 3.2: Hole Size and Plate Thickness Test Matrixes
Plate Thickness (in.) 11/16 13/16 15/16
3/8 2-T 2-T 2-T1/2 2-T 2-T 2-T3/4 - 2-T 2-T
Plate Thickness (in.) 11/16 13/16 15/16
3/8 2-T 2-T 2-T1/2 2-T 2-T 2-T3/4 - 2-T 2-T
T = Tension Test
Grade 50, Hole Size (in.)
Grade 36, Hole Size (in.)
Plate thicknesses were chosen based on typical thicknesses of members
and plates that are candidates for punched holes. These thicknesses are based on
both current specifications and the capacity of most punch presses. AASHTO
Construction (2004) sets maximum thickness limits for punching as 3/4 inch for
grade 36 and 5/8 inch for grade 50. Grade 50 plate thicknesses both greater and
less than the AASHTO Design limits were tested to examine the validity of these
constraints.
Similarly, hole sizes were chosen based on typical connection details
using standard size bolts. Since it is common practice to add 1/16 inch to the bolt
size to obtain the hole size, hole sizes that correspond to 5/8, 6/8, and 7/8 inch
standard bolts were selected. Furthermore, punch press manufacturers
recommend only punching hole diameters that are larger than plate thickness.
These recommendations were followed as shown in Table 3.2 and excluded the
punching of 11/16 inch diameter holes in 3/4 inch plate.
27
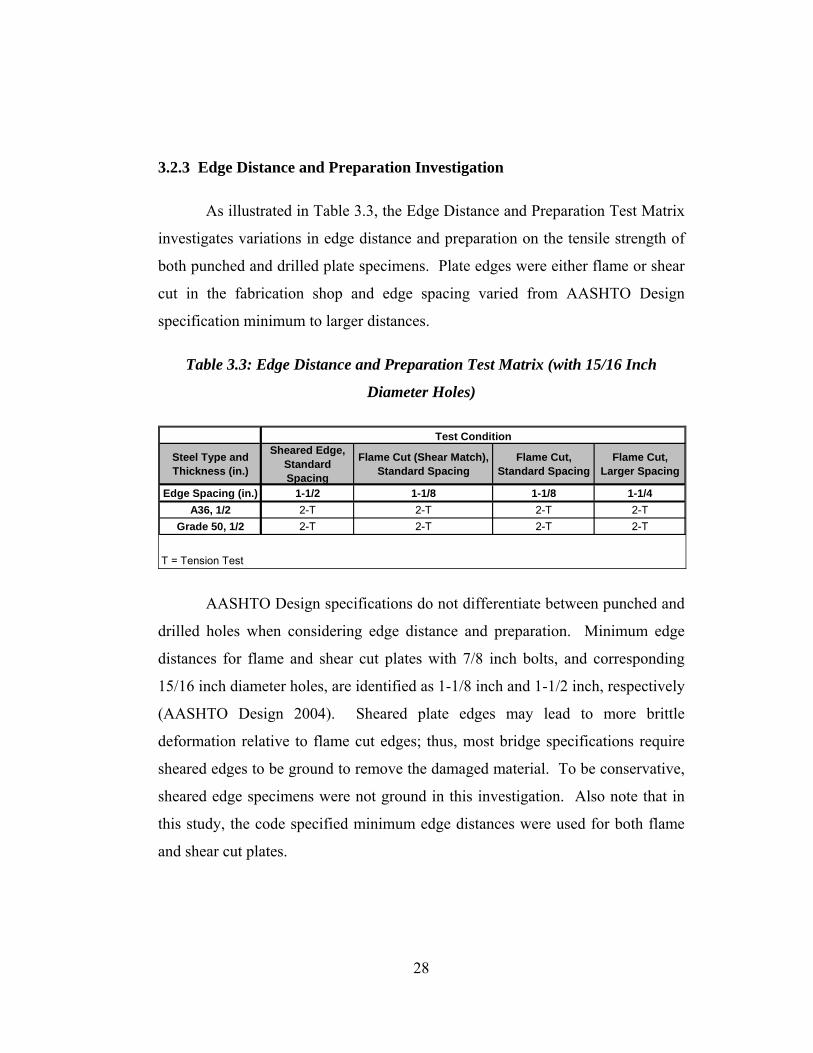
3.2.3 Edge Distance and Preparation Investigation
As illustrated in Table 3.3, the Edge Distance and Preparation Test Matrix
investigates variations in edge distance and preparation on the tensile strength of
both punched and drilled plate specimens. Plate edges were either flame or shear
cut in the fabrication shop and edge spacing varied from AASHTO Design
specification minimum to larger distances.
Table 3.3: Edge Distance and Preparation Test Matrix (with 15/16 Inch
Diameter Holes)
Steel Type and Thickness (in.)
Sheared Edge, Standard Spacing
Flame Cut (Shear Match), Standard Spacing
Flame Cut, Standard Spacing
Flame Cut, Larger Spacing
Edge Spacing (in.) 1-1/2 1-1/8 1-1/8 1-1/4A36, 1/2 2-T 2-T 2-T 2-T
Grade 50, 1/2 2-T 2-T 2-T 2-T
T = Tension Test
Test Condition
AASHTO Design specifications do not differentiate between punched and
drilled holes when considering edge distance and preparation. Minimum edge
distances for flame and shear cut plates with 7/8 inch bolts, and corresponding
15/16 inch diameter holes, are identified as 1-1/8 inch and 1-1/2 inch, respectively
(AASHTO Design 2004). Sheared plate edges may lead to more brittle
deformation relative to flame cut edges; thus, most bridge specifications require
sheared edges to be ground to remove the damaged material. To be conservative,
sheared edge specimens were not ground in this investigation. Also note that in
this study, the code specified minimum edge distances were used for both flame
and shear cut plates.
28

Edge distances of holes influence the amount of plastic deformation in the
material surrounding the punched hole. Large distances constrain the plastic flow
around the hole, while smaller ones increase the bulging and plastic deformation
on the material between the hole and the edge. Greater plastic deformation
reduces the ductility of the material and increases its susceptibility to a more
brittle failure (Chesson and Munse, Truss 1963). In the FSEL study, specification
minimum flame cut edge distances of 7/8, 1, and 1-1/8 inch were used for 11/16,
13/16, and 15/16 inch hole diameters, respectively (AASHTO Design 2004). To
study the change in plastic flow with variance of edge distance, a larger spacing
of plus 1/8 inch on each side was used. In these specimens, the distance from the
edge to the center-of-hole was set equal to the spacing of the holes.
3.2.4 Punching Clearance Investigation
As illustrated in Table 3.4, the Punching Clearance Test Matrix
investigates variations in clearance on the tensile strength of punched plate
specimens. To replicate proper and improper, or worn, punch dies, holes were
punched at both manufacturer recommended clearance and at larger clearance
(plus 1/8 inch), respectively.
29
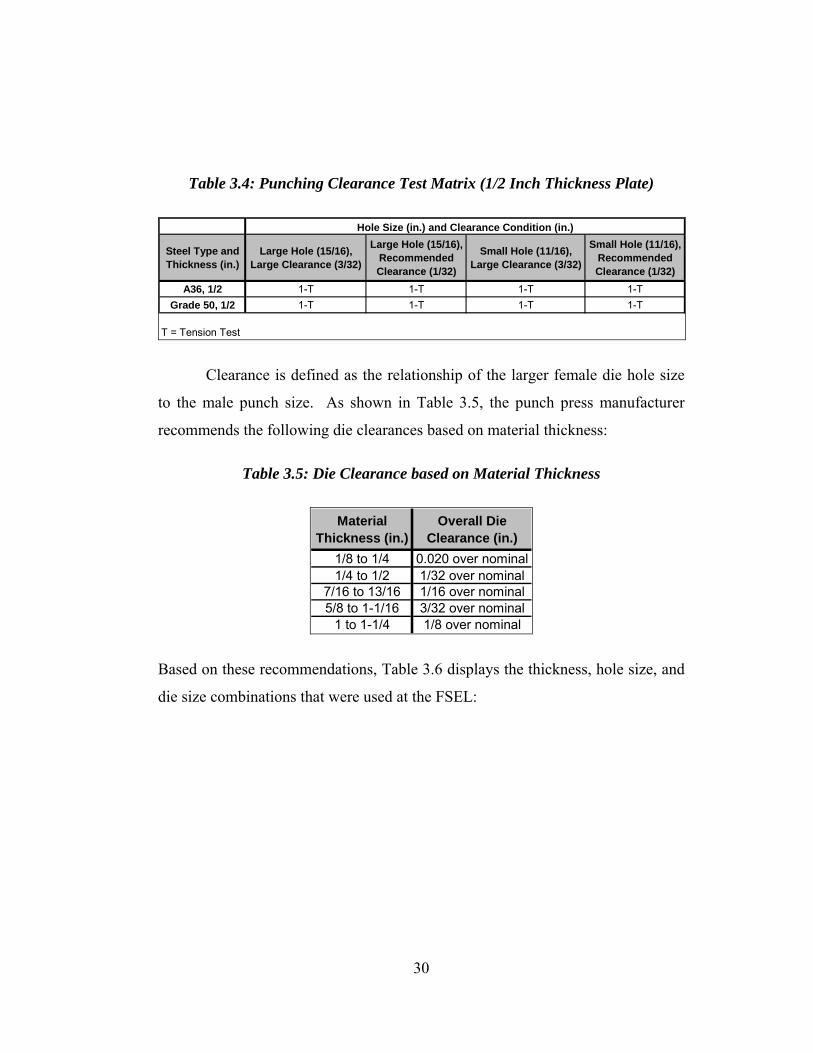
Table 3.4: Punching Clearance Test Matrix (1/2 Inch Thickness Plate)
Steel Type and Thickness (in.)
Large Hole (15/16), Large Clearance (3/32)
Large Hole (15/16), Recommended Clearance (1/32)
Small Hole (11/16), Large Clearance (3/32)
Small Hole (11/16), Recommended Clearance (1/32)
A36, 1/2 1-T 1-T 1-T 1-TGrade 50, 1/2 1-T 1-T 1-T 1-T
T = Tension Test
Hole Size (in.) and Clearance Condition (in.)
Clearance is defined as the relationship of the larger female die hole size
to the male punch size. As shown in Table 3.5, the punch press manufacturer
recommends the following die clearances based on material thickness:
Table 3.5: Die Clearance based on Material Thickness
Material Thickness (in.)
Overall Die Clearance (in.)
1/8 to 1/4 0.020 over nominal1/4 to 1/2 1/32 over nominal
7/16 to 13/16 1/16 over nominal5/8 to 1-1/16 3/32 over nominal
1 to 1-1/4 1/8 over nominal
Based on these recommendations, Table 3.6 displays the thickness, hole size, and
die size combinations that were used at the FSEL:
30
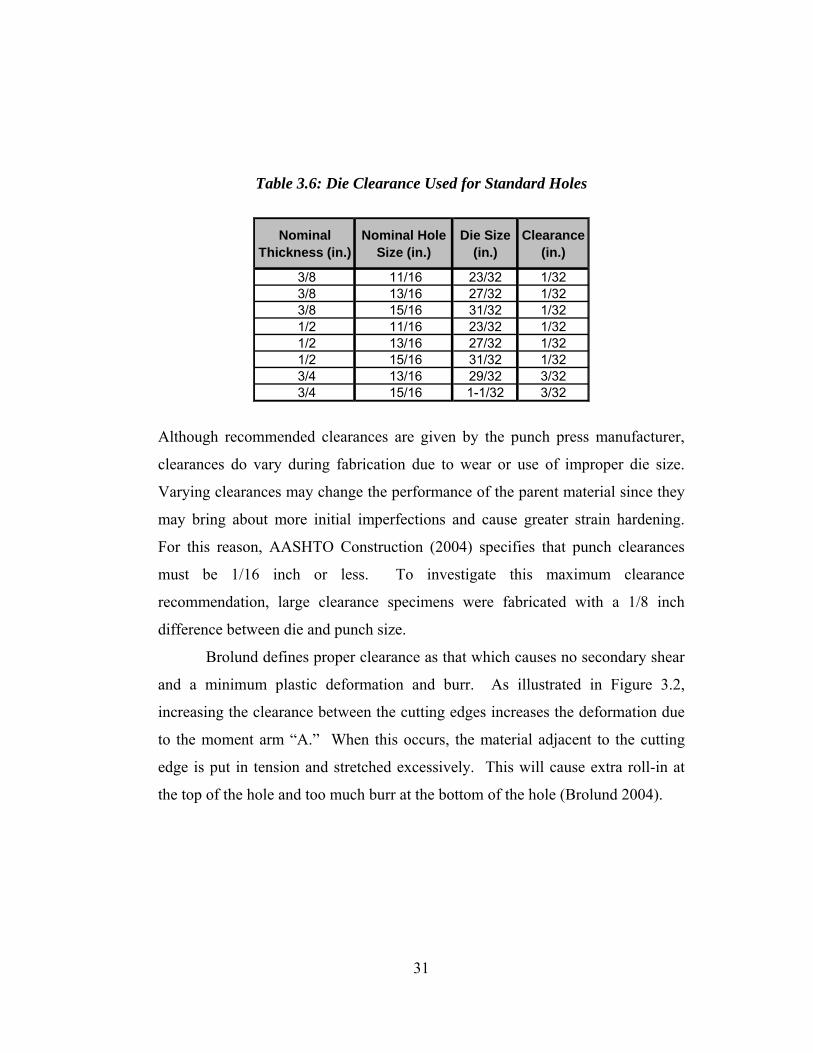
Table 3.6: Die Clearance Used for Standard Holes
Nominal Thickness (in.)
Nominal Hole Size (in.)
Die Size (in.)
Clearance(in.)
3/8 11/16 23/32 1/323/8 13/16 27/32 1/323/8 15/16 31/32 1/321/2 11/16 23/32 1/321/2 13/16 27/32 1/321/2 15/16 31/32 1/323/4 13/16 29/32 3/323/4 15/16 1-1/32 3/32
Although recommended clearances are given by the punch press manufacturer,
clearances do vary during fabrication due to wear or use of improper die size.
Varying clearances may change the performance of the parent material since they
may bring about more initial imperfections and cause greater strain hardening.
For this reason, AASHTO Construction (2004) specifies that punch clearances
must be 1/16 inch or less. To investigate this maximum clearance
recommendation, large clearance specimens were fabricated with a 1/8 inch
difference between die and punch size.
Brolund defines proper clearance as that which causes no secondary shear
and a minimum plastic deformation and burr. As illustrated in Figure 3.2,
increasing the clearance between the cutting edges increases the deformation due
to the moment arm “A.” When this occurs, the material adjacent to the cutting
edge is put in tension and stretched excessively. This will cause extra roll-in at
the top of the hole and too much burr at the bottom of the hole (Brolund 2004).
31
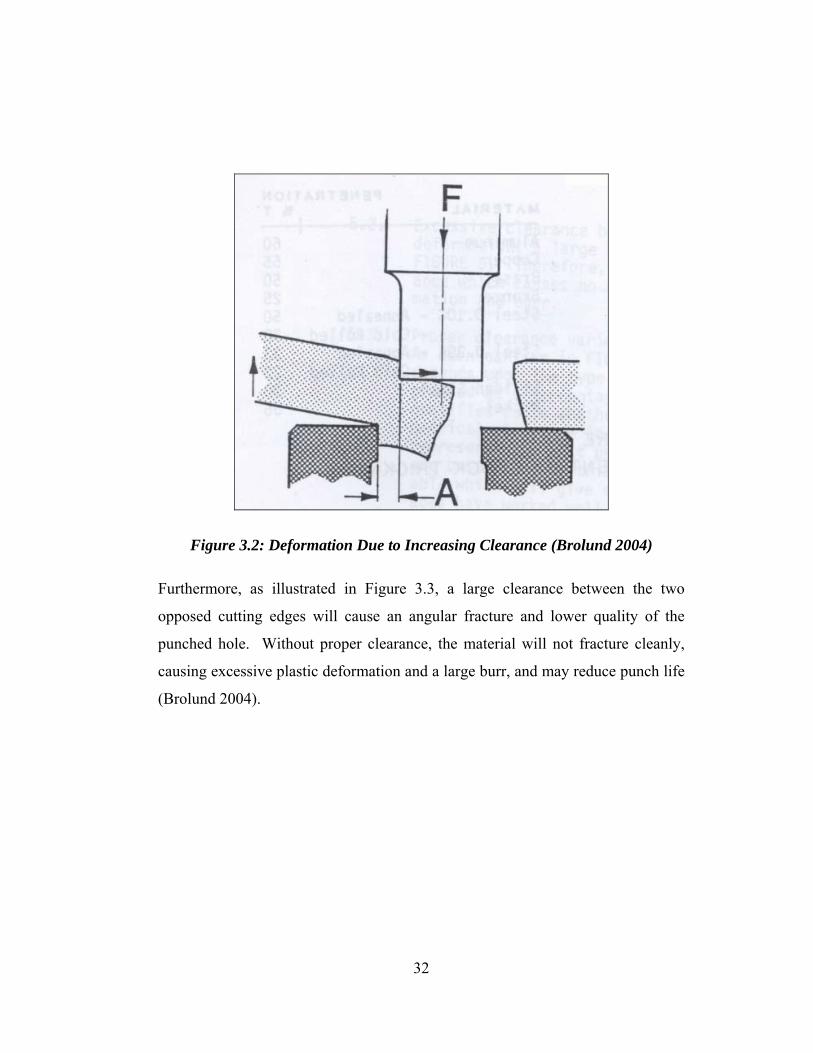
Figure 3.2: Deformation Due to Increasing Clearance (Brolund 2004)
Furthermore, as illustrated in Figure 3.3, a large clearance between the two
opposed cutting edges will cause an angular fracture and lower quality of the
punched hole. Without proper clearance, the material will not fracture cleanly,
causing excessive plastic deformation and a large burr, and may reduce punch life
(Brolund 2004).
32
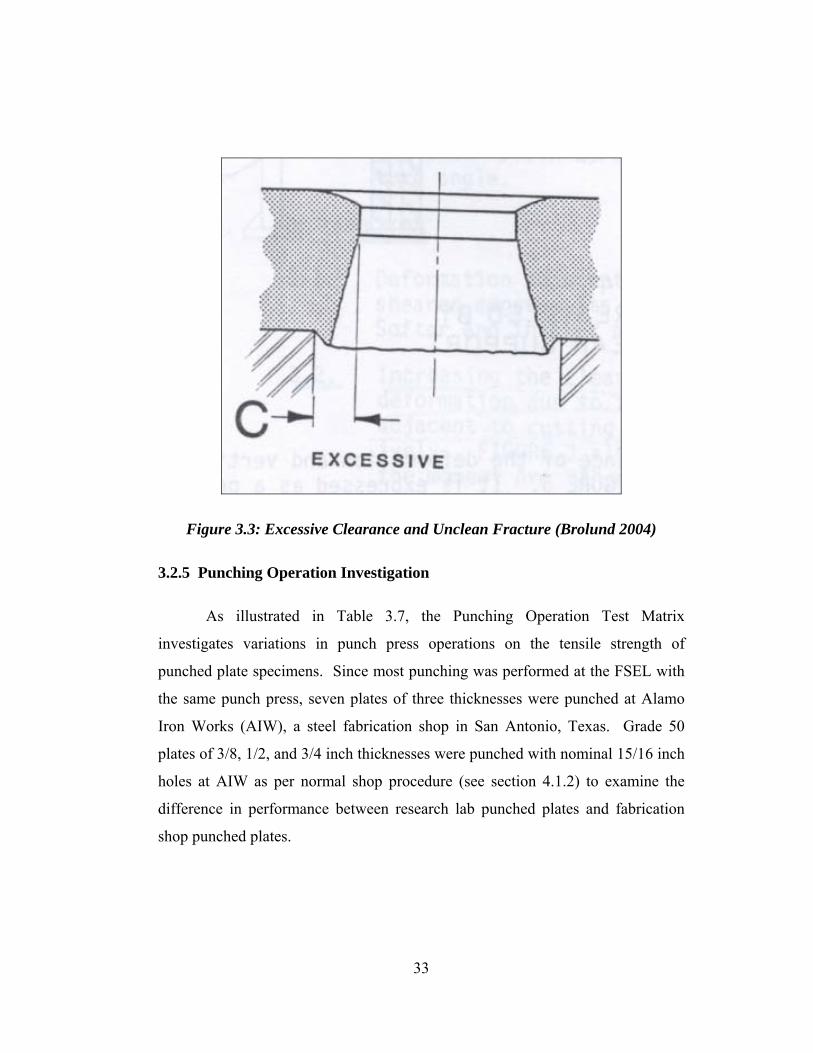
Figure 3.3: Excessive Clearance and Unclean Fracture (Brolund 2004)
3.2.5 Punching Operation Investigation
As illustrated in Table 3.7, the Punching Operation Test Matrix
investigates variations in punch press operations on the tensile strength of
punched plate specimens. Since most punching was performed at the FSEL with
the same punch press, seven plates of three thicknesses were punched at Alamo
Iron Works (AIW), a steel fabrication shop in San Antonio, Texas. Grade 50
plates of 3/8, 1/2, and 3/4 inch thicknesses were punched with nominal 15/16 inch
holes at AIW as per normal shop procedure (see section 4.1.2) to examine the
difference in performance between research lab punched plates and fabrication
shop punched plates.
33
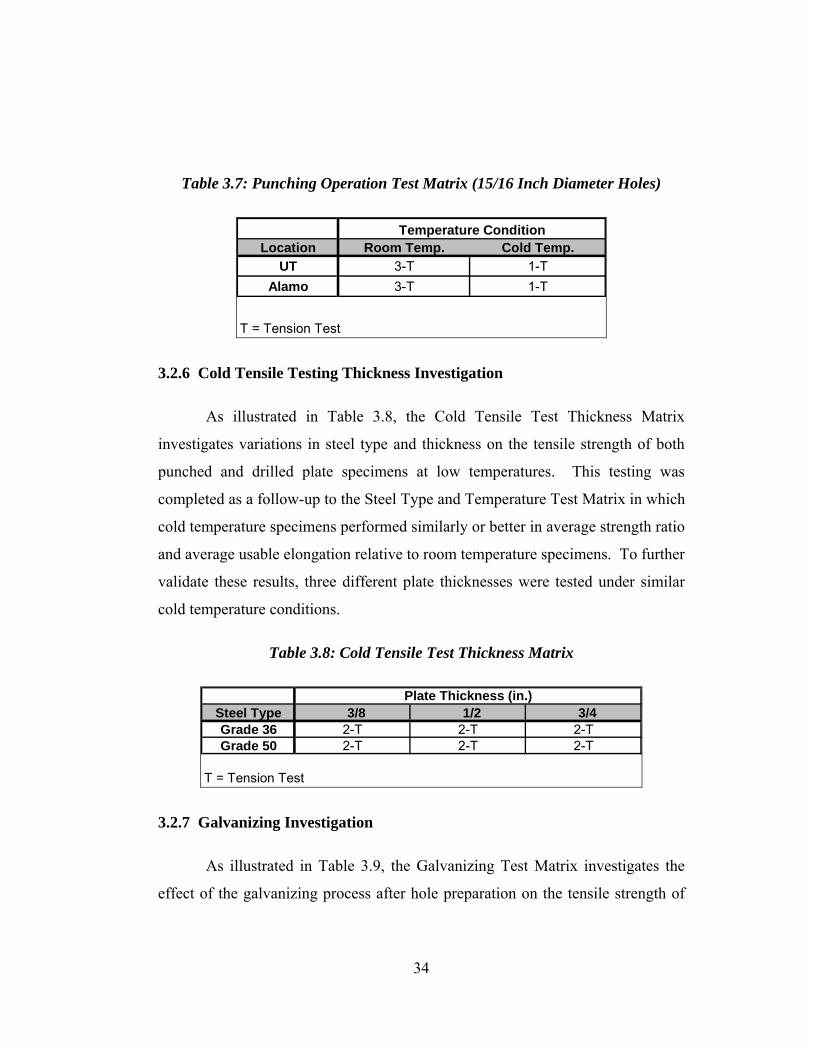
Table 3.7: Punching Operation Test Matrix (15/16 Inch Diameter Holes)
Location Room Temp. Cold Temp.UT 3-T 1-T
Alamo 3-T 1-T
T = Tension Test
Temperature Condition
3.2.6 Cold Tensile Testing Thickness Investigation
As illustrated in Table 3.8, the Cold Tensile Test Thickness Matrix
investigates variations in steel type and thickness on the tensile strength of both
punched and drilled plate specimens at low temperatures. This testing was
completed as a follow-up to the Steel Type and Temperature Test Matrix in which
cold temperature specimens performed similarly or better in average strength ratio
and average usable elongation relative to room temperature specimens. To further
validate these results, three different plate thicknesses were tested under similar
cold temperature conditions.
Table 3.8: Cold Tensile Test Thickness Matrix
Steel Type 3/8 1/2 3/4 Grade 36 2-T 2-T 2-TGrade 50 2-T 2-T 2-T
T = Tension Test
Plate Thickness (in.)
3.2.7 Galvanizing Investigation
As illustrated in Table 3.9, the Galvanizing Test Matrix investigates the
effect of the galvanizing process after hole preparation on the tensile strength of
34

both punched and drilled plate specimens. Four plates of 3/8 inch thickness were
galvanized at Southwest Galvanizing, Inc. (SGI), a hot dip galvanizing company
in San Antonio, Texas. Specimens of 3/8 thickness were studied since thin plates
such as these are typically candidates for galvanizing and use on traffic signal
structures.
Table 3.9: Galvanizing Test Matrix
Steel Type As Received Plate Galvanized PlateGrade 36 2-T 2-TGrade 50 2-T 2-T
T = Tension Test
Plate Preparation
Previous literature review and research by Huhn and Valtinat (2004) has
noted that hot dip galvanizing at high temperatures may promote aging of steel
and may have a negative impact of the fatigue behavior of connections. Huhn and
Valtinat mention that aging may be especially critical for galvanized connections
in which punched holes exist.
3.2.8 Reaming Investigation
As illustrated in Table 3.10, the Reaming Test Matrix investigates
variations in reaming and sub-punching in forming a hole. This was done since a
varying amount of reaming may occur in a shop during fit-up of elements and
connections. AASHTO Construction specifications require that punched holes
must be sub-punched and reamed to the required diameter when used in members
carrying calculated load forces. Holes are required to be sub-punched at least
3/16 inch smaller than the nominal size of the fastener and then reamed to full
size (AASHTO Construction 2004).
35
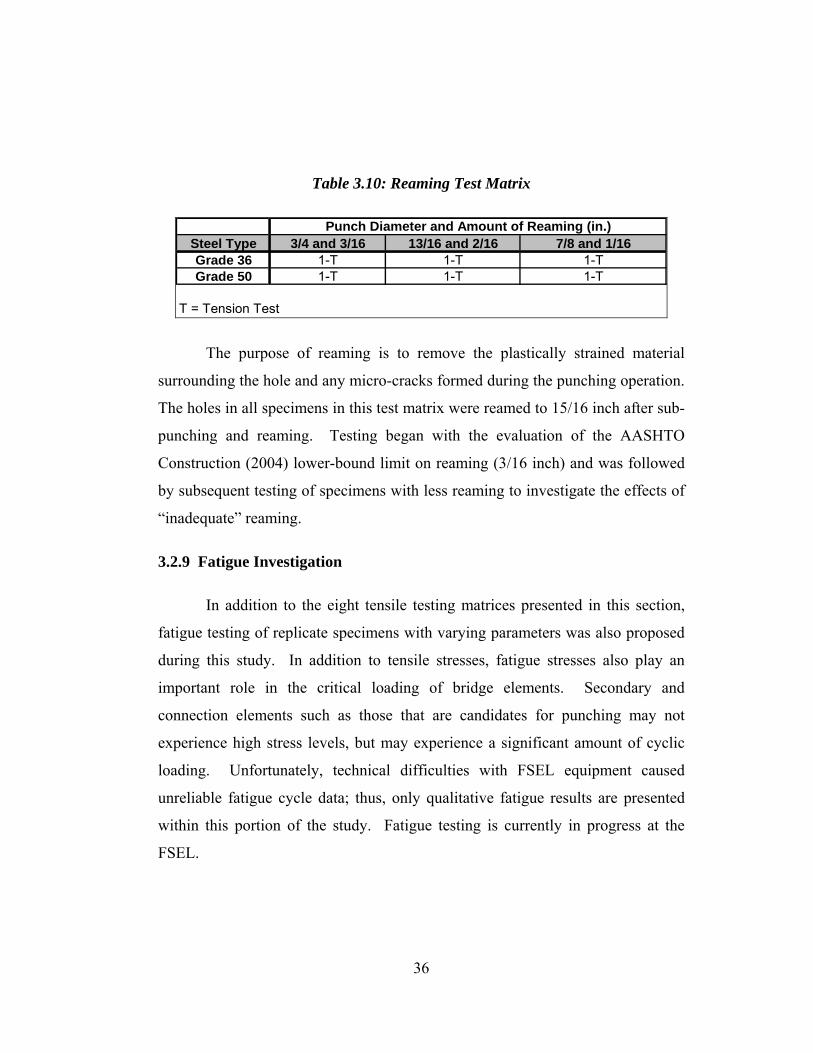
Table 3.10: Reaming Test Matrix
Steel Type 3/4 and 3/16 13/16 and 2/16 7/8 and 1/16Grade 36 1-T 1-T 1-TGrade 50 1-T 1-T 1-T
T = Tension Test
Punch Diameter and Amount of Reaming (in.)
The purpose of reaming is to remove the plastically strained material
surrounding the hole and any micro-cracks formed during the punching operation.
The holes in all specimens in this test matrix were reamed to 15/16 inch after sub-
punching and reaming. Testing began with the evaluation of the AASHTO
Construction (2004) lower-bound limit on reaming (3/16 inch) and was followed
by subsequent testing of specimens with less reaming to investigate the effects of
“inadequate” reaming.
3.2.9 Fatigue Investigation
In addition to the eight tensile testing matrices presented in this section,
fatigue testing of replicate specimens with varying parameters was also proposed
during this study. In addition to tensile stresses, fatigue stresses also play an
important role in the critical loading of bridge elements. Secondary and
connection elements such as those that are candidates for punching may not
experience high stress levels, but may experience a significant amount of cyclic
loading. Unfortunately, technical difficulties with FSEL equipment caused
unreliable fatigue cycle data; thus, only qualitative fatigue results are presented
within this portion of the study. Fatigue testing is currently in progress at the
FSEL.
36
4. SPECIMEN FABRICATION AND TEST PROCEDURES
4.1 SPECIMEN FABRICATION
Sixty-six (66) plates with punched holes, 46 plates with drilled holes, and
6 plates with sub-punched and reamed holes were tested in the investigations as
described in the Experiment Design chapter. Most specimen preparation took
place in the FSEL with in-house equipment as described in the following two
sections.
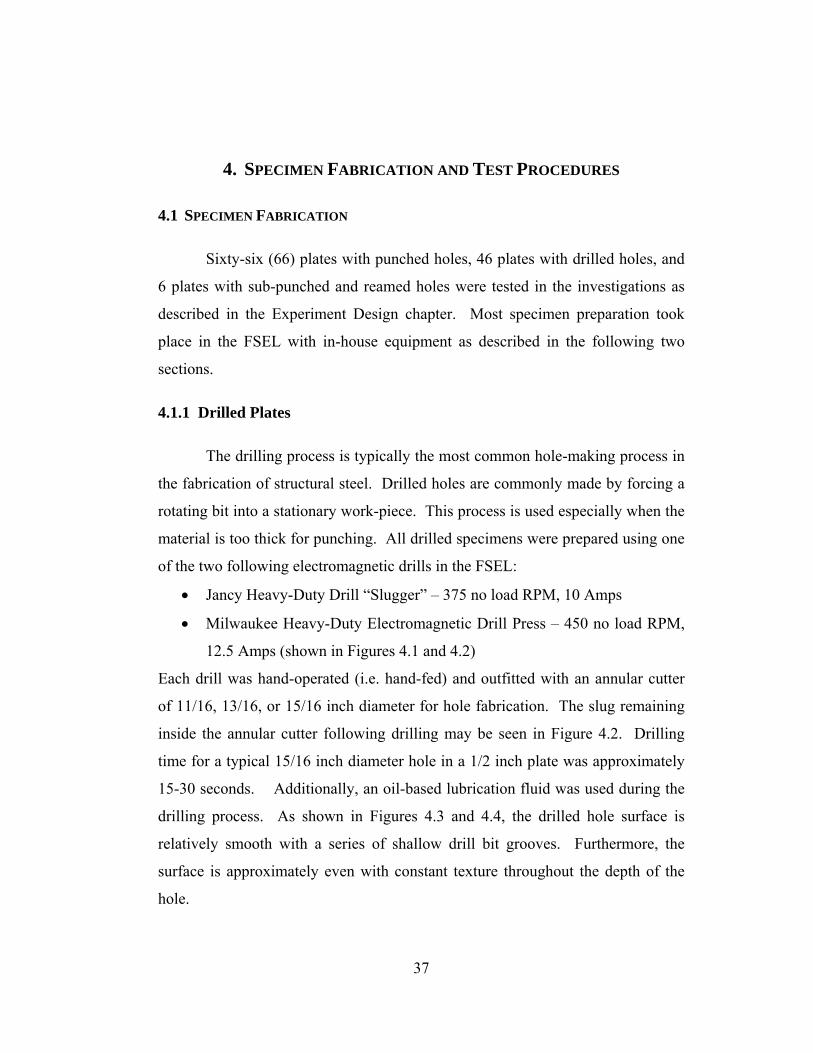
4.1.1 Drilled Plates
The drilling process is typically the most common hole-making process in
the fabrication of structural steel. Drilled holes are commonly made by forcing a
rotating bit into a stationary work-piece. This process is used especially when the
material is too thick for punching. All drilled specimens were prepared using one
of the two following electromagnetic drills in the FSEL:
• Jancy Heavy-Duty Drill “Slugger” – 375 no load RPM, 10 Amps
• Milwaukee Heavy-Duty Electromagnetic Drill Press – 450 no load RPM,
12.5 Amps (shown in Figures 4.1 and 4.2)
Each drill was hand-operated (i.e. hand-fed) and outfitted with an annular cutter
of 11/16, 13/16, or 15/16 inch diameter for hole fabrication. The slug remaining
inside the annular cutter following drilling may be seen in Figure 4.2. Drilling
time for a typical 15/16 inch diameter hole in a 1/2 inch plate was approximately
15-30 seconds. Additionally, an oil-based lubrication fluid was used during the
drilling process. As shown in Figures 4.3 and 4.4, the drilled hole surface is
relatively smooth with a series of shallow drill bit grooves. Furthermore, the
surface is approximately even with constant texture throughout the depth of the
hole.
37
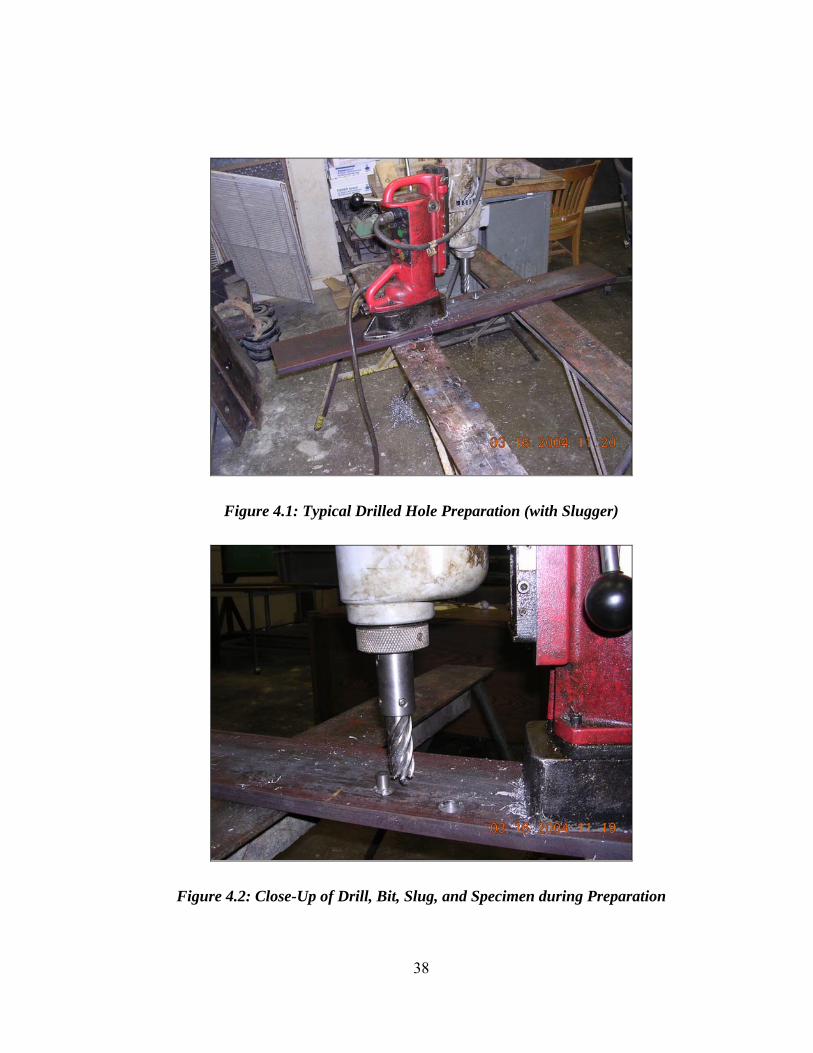
Figure 4.1: Typical Drilled Hole Preparation (with Slugger)
Figure 4.2: Close-Up of Drill, Bit, Slug, and Specimen during Preparation
38
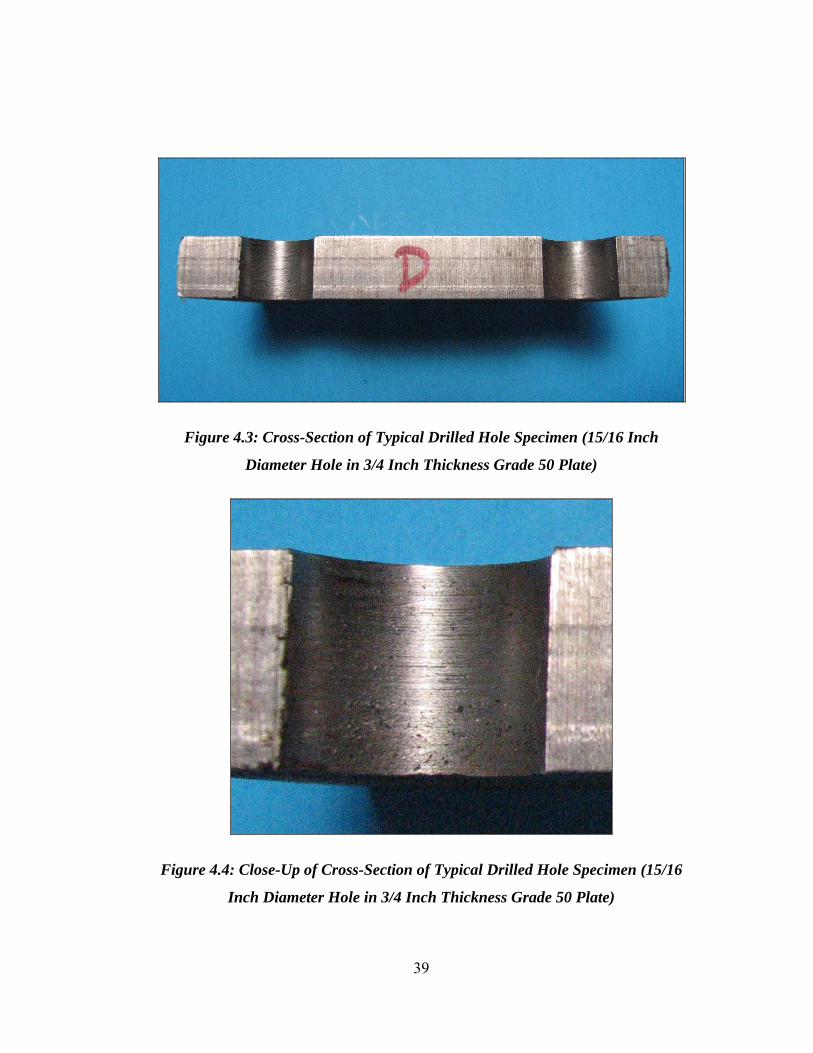
Figure 4.3: Cross-Section of Typical Drilled Hole Specimen (15/16 Inch
Diameter Hole in 3/4 Inch Thickness Grade 50 Plate)
Figure 4.4: Close-Up of Cross-Section of Typical Drilled Hole Specimen (15/16
Inch Diameter Hole in 3/4 Inch Thickness Grade 50 Plate)
39
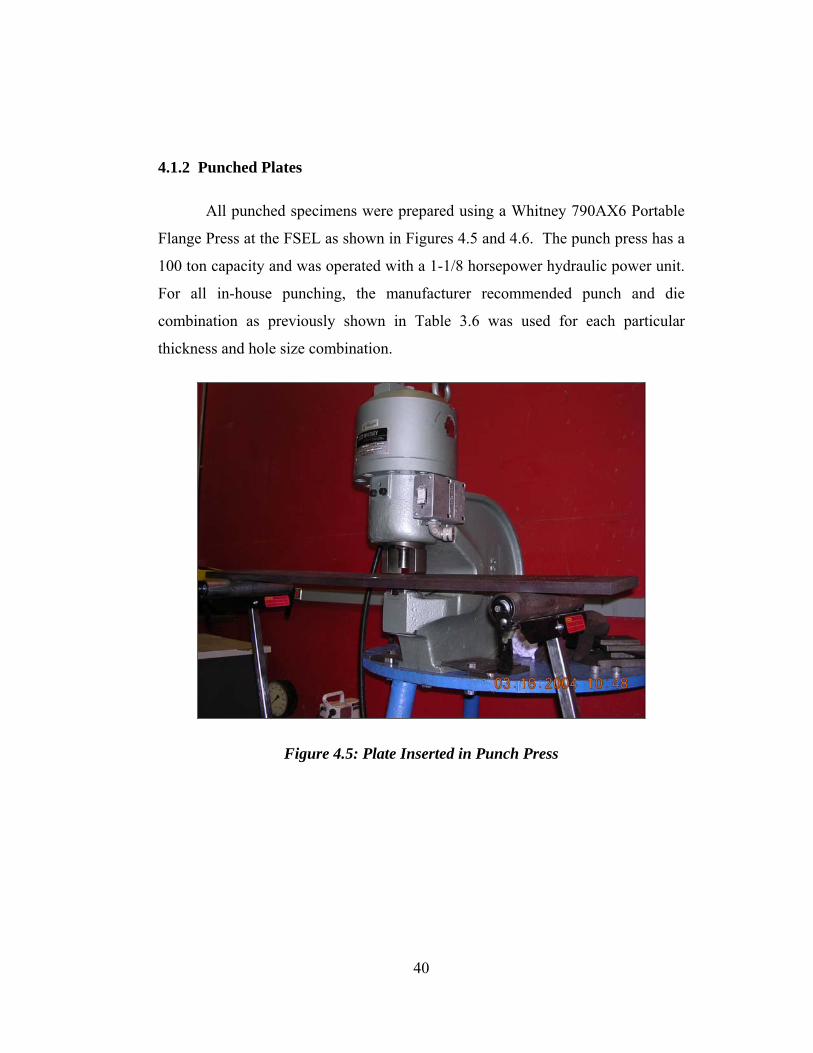
4.1.2 Punched Plates
All punched specimens were prepared using a Whitney 790AX6 Portable
Flange Press at the FSEL as shown in Figures 4.5 and 4.6. The punch press has a
100 ton capacity and was operated with a 1-1/8 horsepower hydraulic power unit.
For all in-house punching, the manufacturer recommended punch and die
combination as previously shown in Table 3.6 was used for each particular
thickness and hole size combination.
Figure 4.5: Plate Inserted in Punch Press
40

Figure 4.6: Plate and Punched Holes Following Typical Specimen Preparation
Seven plate specimens were punched at AIW in addition to those punched
at the FSEL. The plates were punched using normal operation procedures of the
fabrication shop with five of the seven plates (3/8 inch and 1/2 inch thicknesses)
punched by the mechanical punch shown in Figure 4.7. The two remaining,
larger thickness 3/4 inch plates were punched using a hydraulic punch similar to
the FSEL punch press. All plates were punched to form nominal 15/16 inch
diameter holes. As per usual AIW shop procedure, a one inch die was used for all
of the plate thickness. The most noticeable differences between the two punching
operations were the clearance considerations and the faster punching rate at which
AIW prepared plates.
41
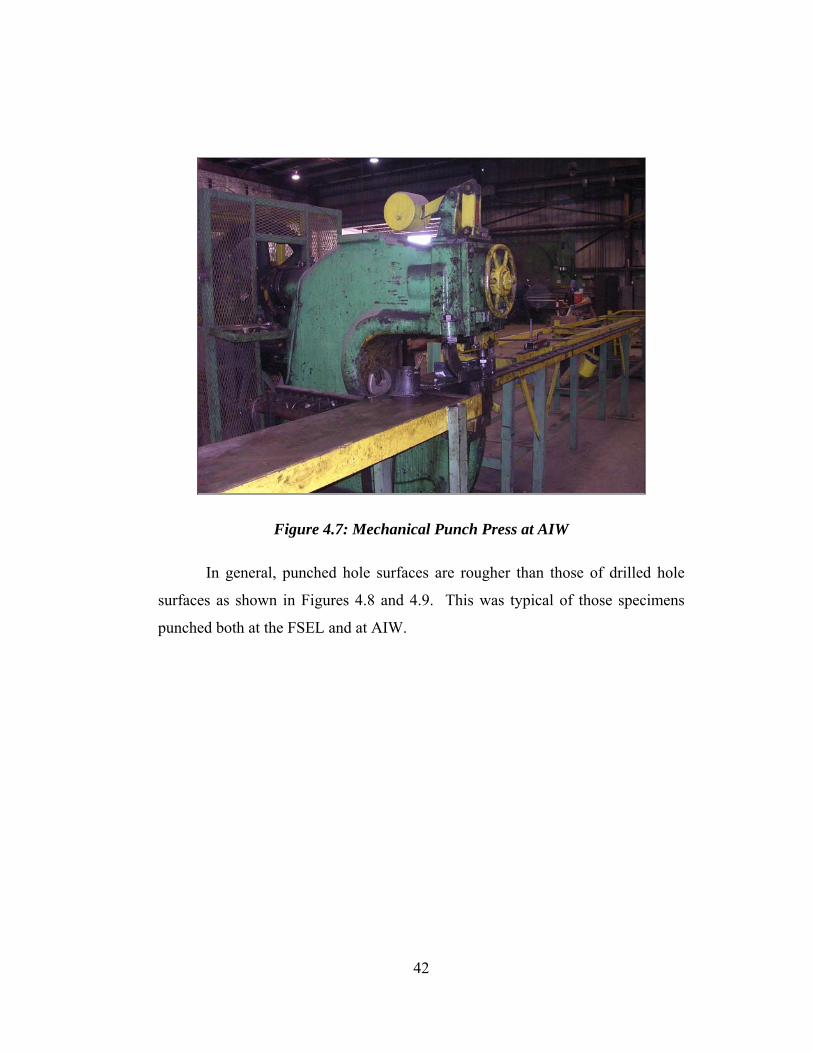
Figure 4.7: Mechanical Punch Press at AIW
In general, punched hole surfaces are rougher than those of drilled hole
surfaces as shown in Figures 4.8 and 4.9. This was typical of those specimens
punched both at the FSEL and at AIW.
42
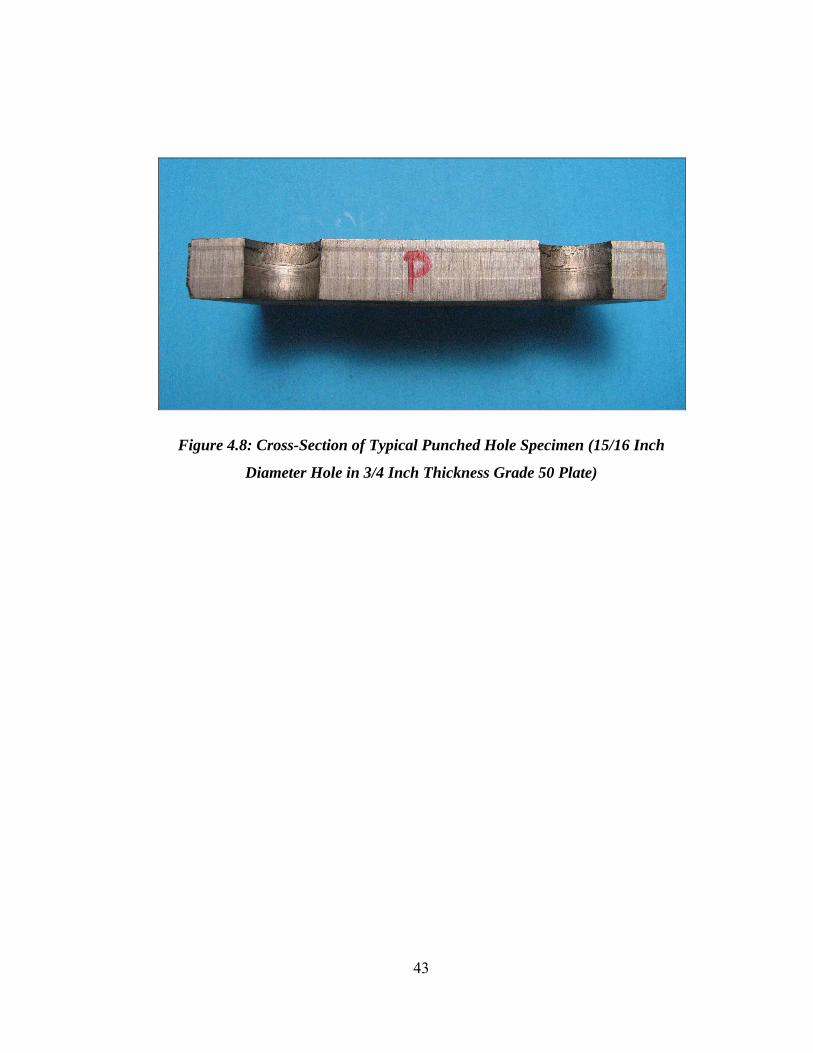
Figure 4.8: Cross-Section of Typical Punched Hole Specimen (15/16 Inch
Diameter Hole in 3/4 Inch Thickness Grade 50 Plate)
43
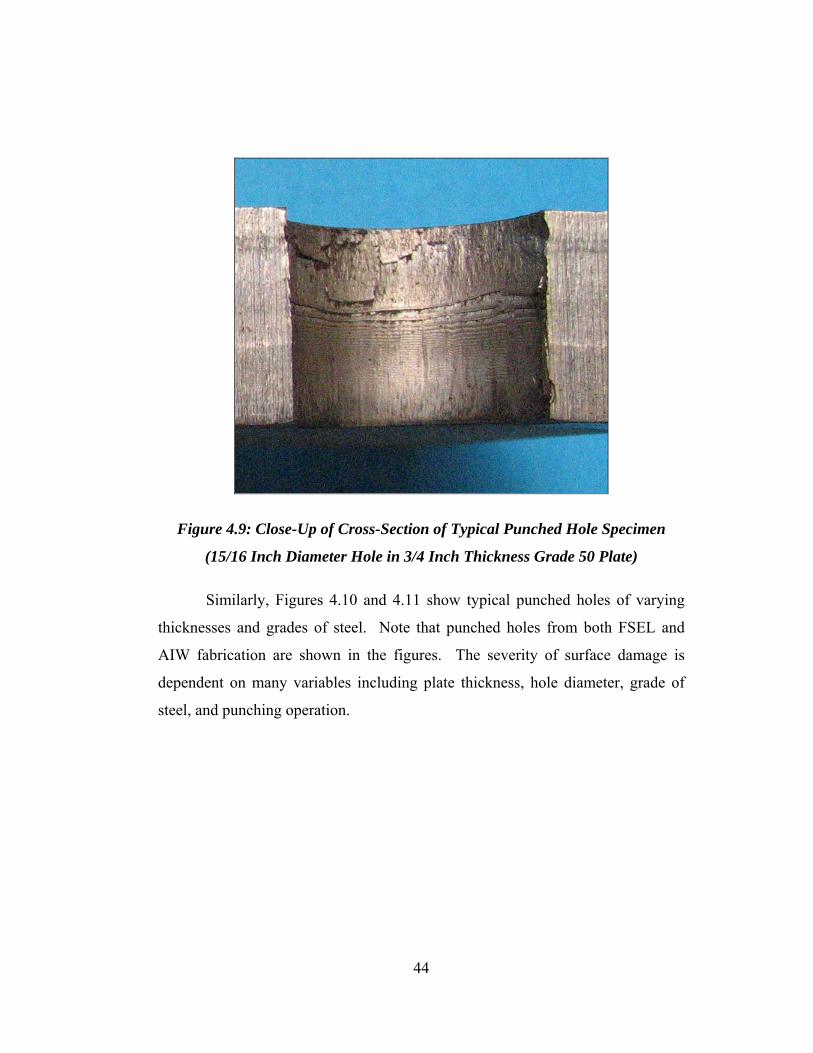
Figure 4.9: Close-Up of Cross-Section of Typical Punched Hole Specimen
(15/16 Inch Diameter Hole in 3/4 Inch Thickness Grade 50 Plate)
Similarly, Figures 4.10 and 4.11 show typical punched holes of varying
thicknesses and grades of steel. Note that punched holes from both FSEL and
AIW fabrication are shown in the figures. The severity of surface damage is
dependent on many variables including plate thickness, hole diameter, grade of
steel, and punching operation.
44
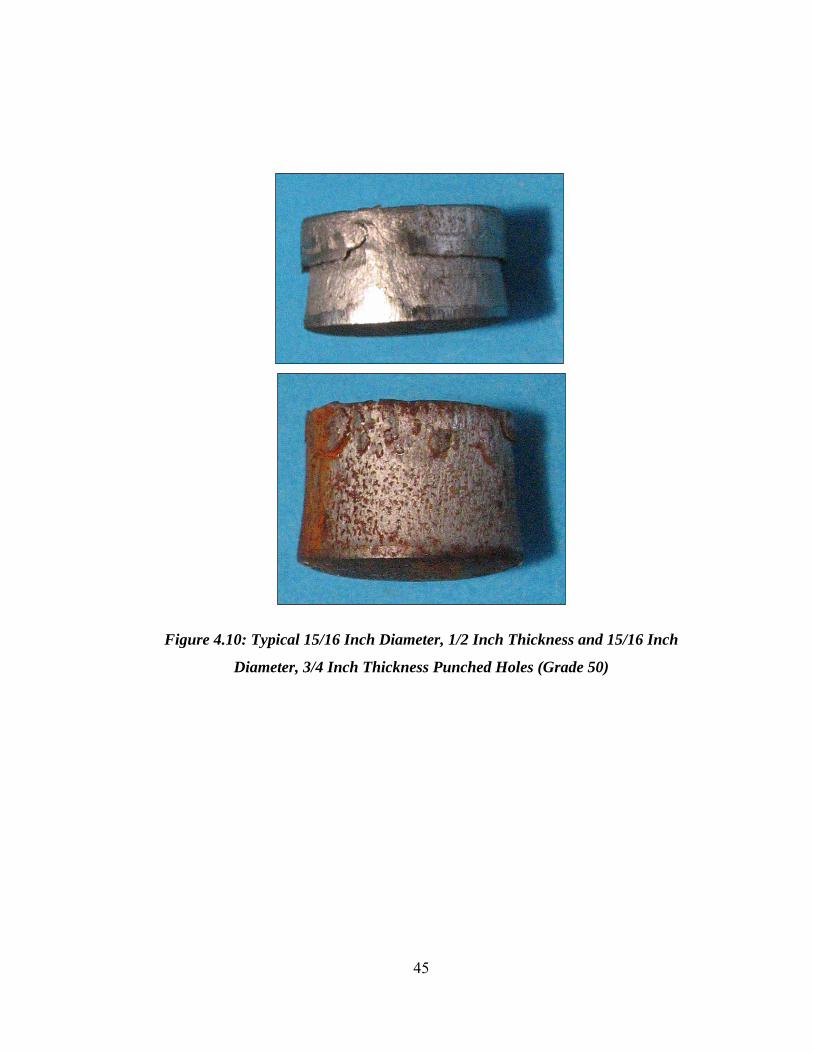
Figure 4.10: Typical 15/16 Inch Diameter, 1/2 Inch Thickness and 15/16 Inch
Diameter, 3/4 Inch Thickness Punched Holes (Grade 50)
45
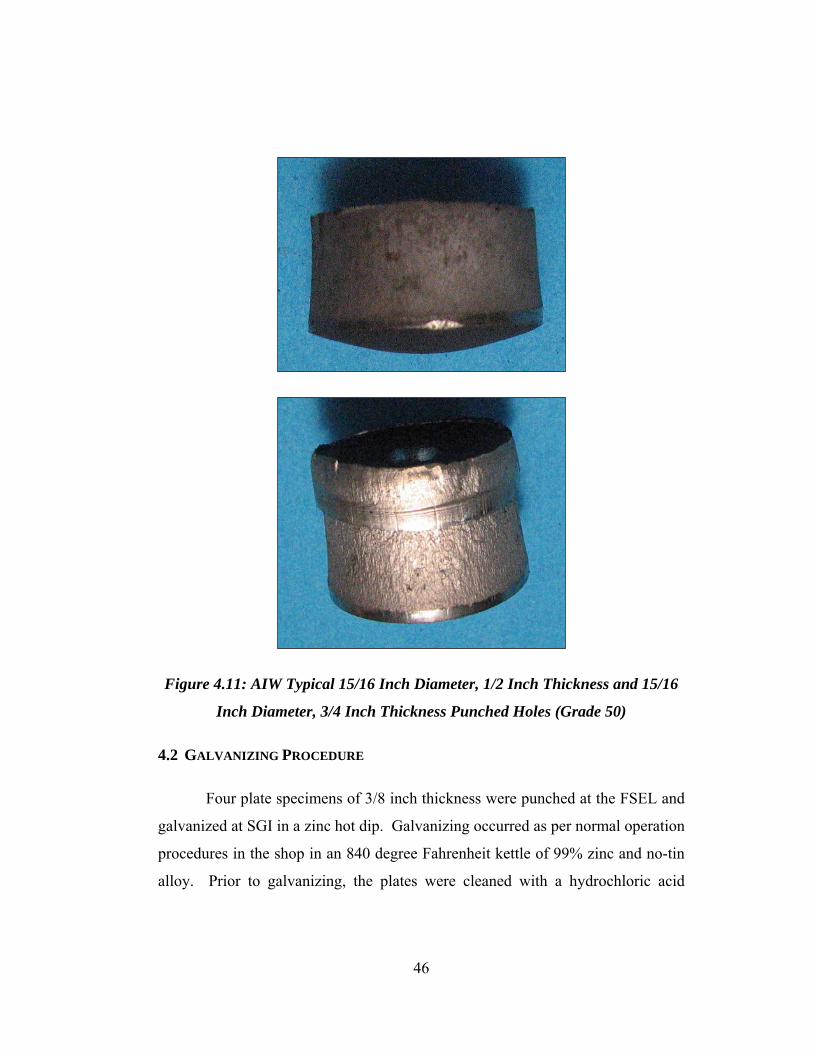
Figure 4.11: AIW Typical 15/16 Inch Diameter, 1/2 Inch Thickness and 15/16
Inch Diameter, 3/4 Inch Thickness Punched Holes (Grade 50)
4.2 GALVANIZING PROCEDURE
Four plate specimens of 3/8 inch thickness were punched at the FSEL and
galvanized at SGI in a zinc hot dip. Galvanizing occurred as per normal operation
procedures in the shop in an 840 degree Fahrenheit kettle of 99% zinc and no-tin
alloy. Prior to galvanizing, the plates were cleaned with a hydrochloric acid
46
solution at the shop and rinsed. These plates were tensile tested until failure
approximately one week later.
4.3 REAMING PROCEDURE
Reaming is utilized following the sub-punching, or sub-drilling, of a hole
in an element. The reaming of holes removes an additional ring of larger
diameter material by forcing a rotating bit into a stationary work-piece with an
already existing hole. In general, this process is typical during fit-up of elements
that have been sub-punched or sub-drilled. When used after sub-punching,
reaming is used as a standard practice to “remove the damaged material” around
the exterior of a punched hole. All reamed specimens in this study were sub-
punched with the Whitney 790AX6 Portable Flange Press and reamed to full size
with a radial drill equipped with a 15/16 inch diameter tapered bridge reamer bit
(shown in Figure 4.12) in the FSEL. During the reaming process, the bit was self-
centering in that the crosshead of the radial drill was in the unlocked position.
As shown in Figures 4.13 and 4.14, the reamed hole surface is relatively
smooth with a series of shallow drill bit grooves. Furthermore, the surface is
approximately even with constant wear throughout the thickness of the material as
compared to the surface of punched holes.
47
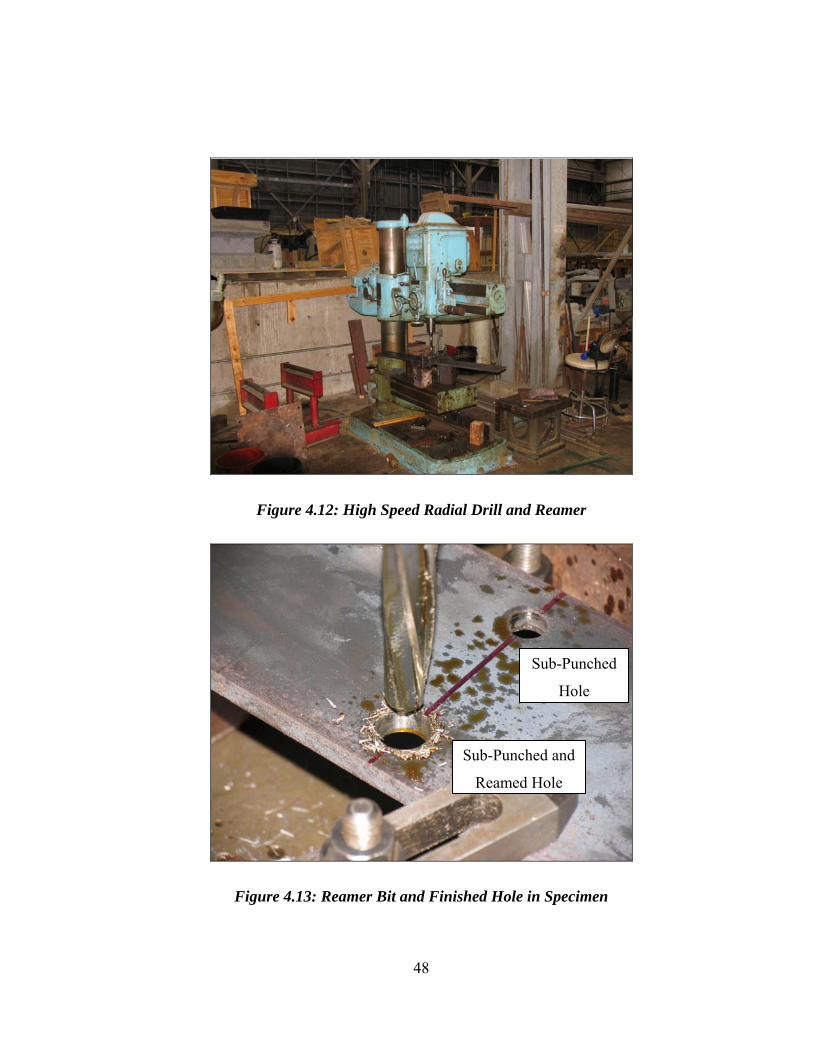
Figure 4.12: High Speed Radial Drill and Reamer
Sub-Punched
Hole
Sub-Punched and
Reamed Hole
Figure 4.13: Reamer Bit and Finished Hole in Specimen
48
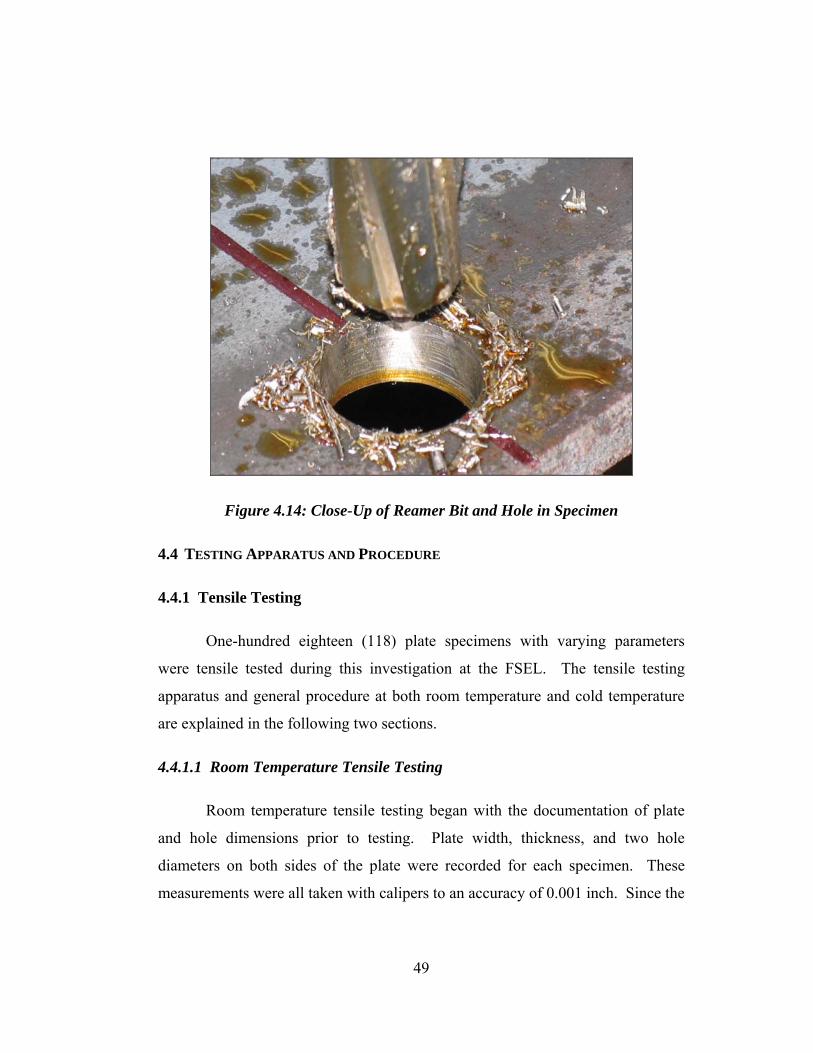
Figure 4.14: Close-Up of Reamer Bit and Hole in Specimen
4.4 TESTING APPARATUS AND PROCEDURE
4.4.1 Tensile Testing
One-hundred eighteen (118) plate specimens with varying parameters
were tensile tested during this investigation at the FSEL. The tensile testing
apparatus and general procedure at both room temperature and cold temperature
are explained in the following two sections.
4.4.1.1 Room Temperature Tensile Testing
Room temperature tensile testing began with the documentation of plate
and hole dimensions prior to testing. Plate width, thickness, and two hole
diameters on both sides of the plate were recorded for each specimen. These
measurements were all taken with calipers to an accuracy of 0.001 inch. Since the
49

hole diameters varied depending on the hole-making process, an average diameter
was used for each hole to calculate the net section area as shown in Equation 3.1.
Note that two diameters of each hole were measured on each side of the plate (i.e.
four diameter measurements were taken for each hole). Hole diameter variations
from one side of the plate to the other ranged from 0.001 to 0.02 inches.
( ) tddwA avgavgnet ⋅−−= ,2,1 (3.1)
where w = width
d1,avg = average diameter of hole 1
d2,avg = average diameter of hole 2
t = thickness
All tensile specimens were tensile tested to failure in the FSEL’s 600 kip
Universal Testing System (UTS) as shown in Figures 4.15 and 4.16. During each
test, the load and cross-head displacement were recorded using a Personal Data
Acquisition (PDAQ) system and linear displacement potentiometer as shown in
Figures 4.17 and 4.18. During testing, the recorded load and displacement data
was taken with an accuracy of 0.1 kip and 0.001 inch, respectively. The average
loading rate for the specimens was 0.65-0.85 kips per second, which met the
American Society of Testing and Materials (ASTM 2004) E8-04 requirements for
standard testing of metallic materials.
50

Figure 4.15: 600-Kip UTS Used for Tensile Testing
51

Figure 4.16: Test Specimen in Grips of 600-Kip UTS
52

Figure 4.17: PDAQ System Used for Tensile Testing
Figure 4.18: Linear Potentiometer Used for Tensile Testing
53
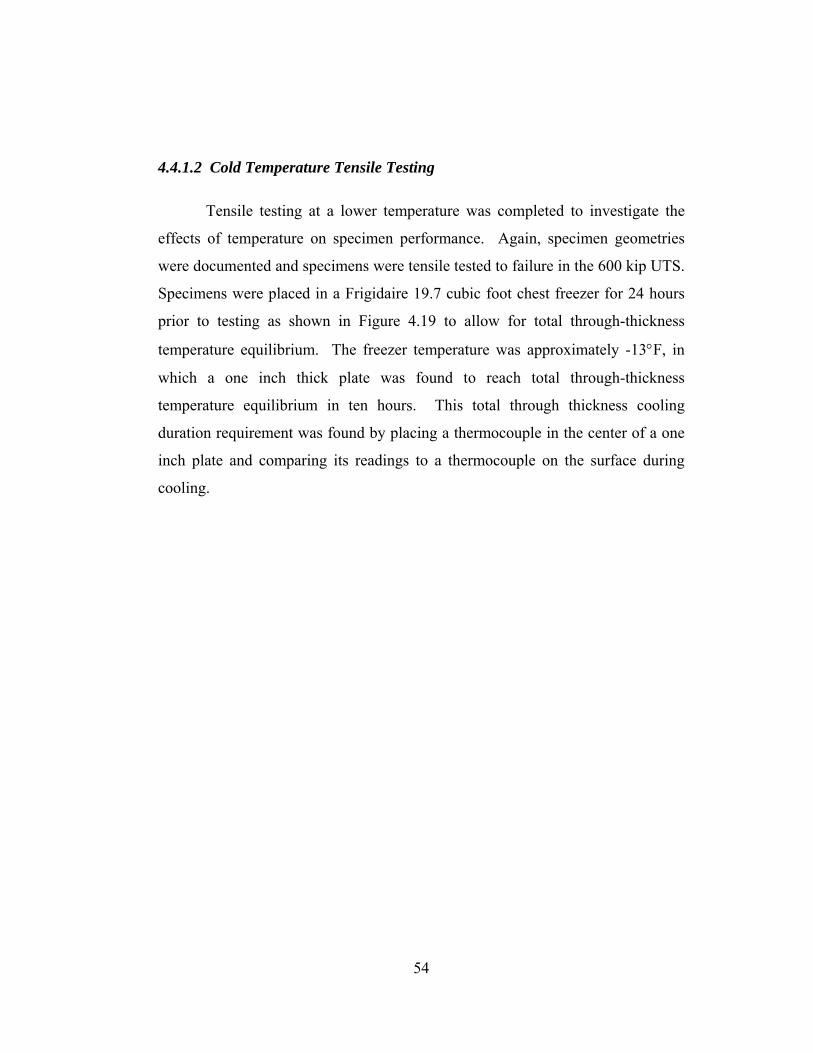
4.4.1.2 Cold Temperature Tensile Testing
Tensile testing at a lower temperature was completed to investigate the
effects of temperature on specimen performance. Again, specimen geometries
were documented and specimens were tensile tested to failure in the 600 kip UTS.
Specimens were placed in a Frigidaire 19.7 cubic foot chest freezer for 24 hours
prior to testing as shown in Figure 4.19 to allow for total through-thickness
temperature equilibrium. The freezer temperature was approximately -13°F, in
which a one inch thick plate was found to reach total through-thickness
temperature equilibrium in ten hours. This total through thickness cooling
duration requirement was found by placing a thermocouple in the center of a one
inch plate and comparing its readings to a thermocouple on the surface during
cooling.
54
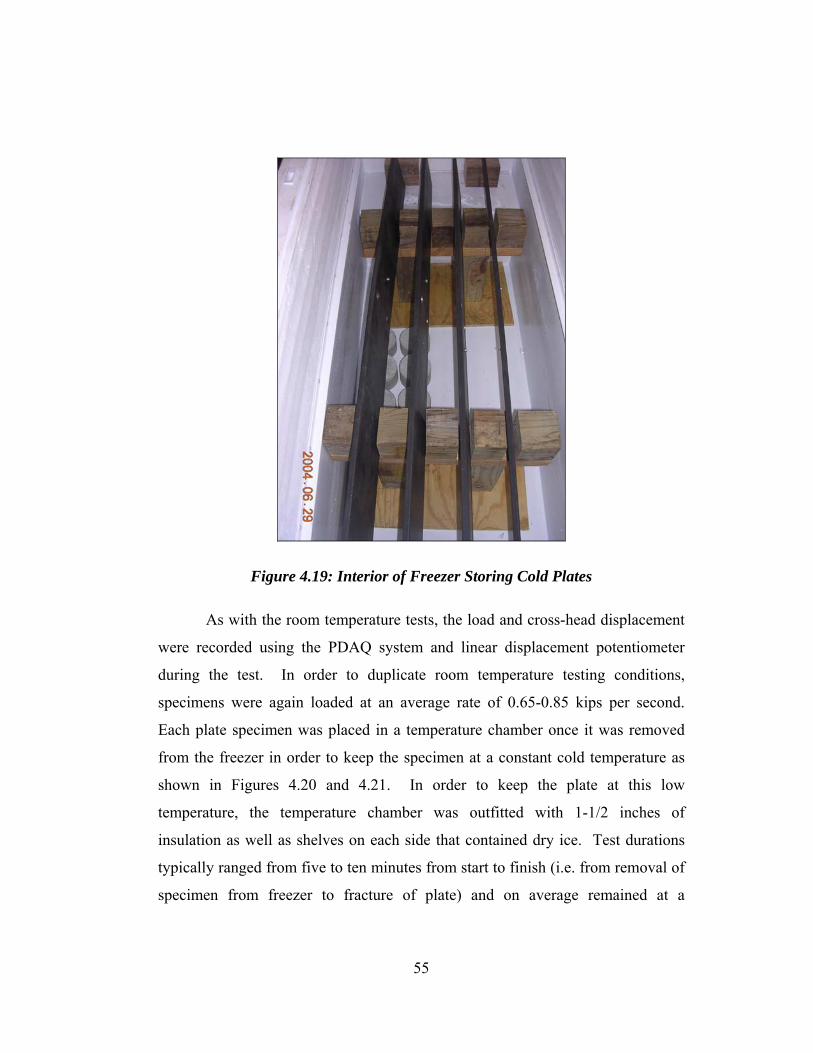
Figure 4.19: Interior of Freezer Storing Cold Plates
As with the room temperature tests, the load and cross-head displacement
were recorded using the PDAQ system and linear displacement potentiometer
during the test. In order to duplicate room temperature testing conditions,
specimens were again loaded at an average rate of 0.65-0.85 kips per second.
Each plate specimen was placed in a temperature chamber once it was removed
from the freezer in order to keep the specimen at a constant cold temperature as
shown in Figures 4.20 and 4.21. In order to keep the plate at this low
temperature, the temperature chamber was outfitted with 1-1/2 inches of
insulation as well as shelves on each side that contained dry ice. Test durations
typically ranged from five to ten minutes from start to finish (i.e. from removal of
specimen from freezer to fracture of plate) and on average remained at a
55
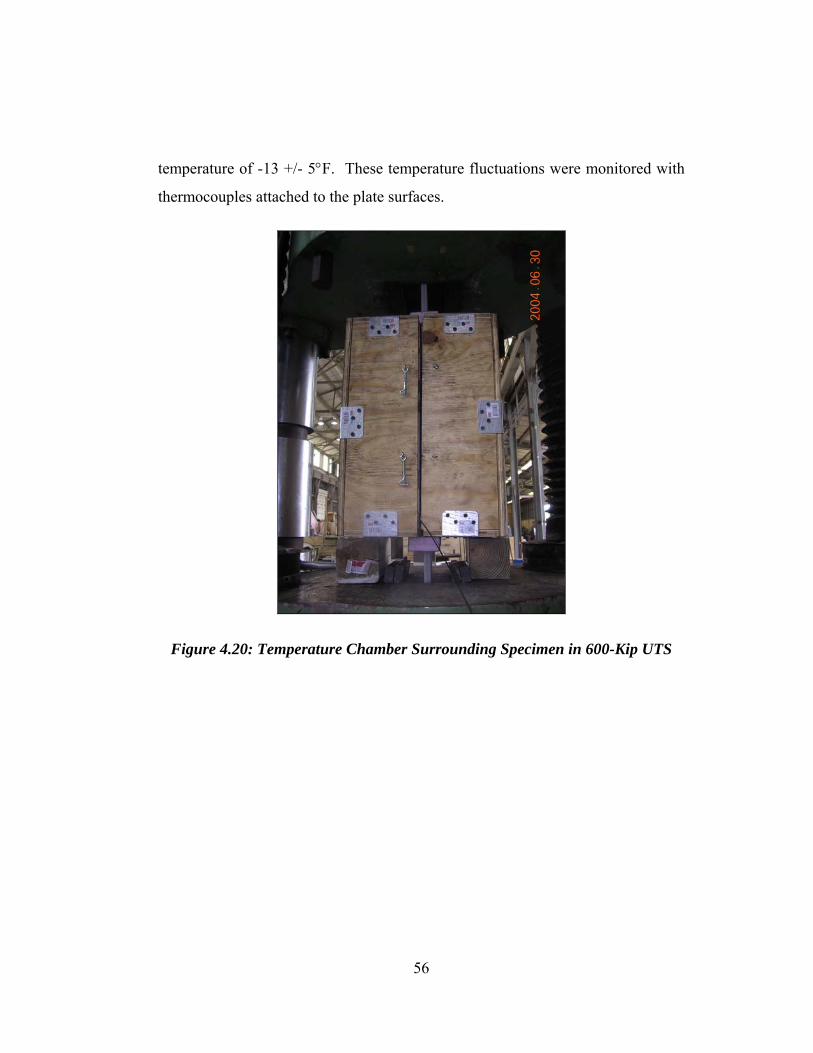
temperature of -13 +/- 5°F. These temperature fluctuations were monitored with
thermocouples attached to the plate surfaces.
Figure 4.20: Temperature Chamber Surrounding Specimen in 600-Kip UTS
56
Figure 4.21: Open Temperature Chamber Prior to Tensile Test
4.4.2 Fatigue Testing
Fatigue testing of several plate specimens with varying parameters was
proposed during this investigation at the FSEL. As with tensile testing, fatigue
testing began with documentation of plate and hole dimensions prior to testing.
All fatigue specimens were tested to failure in the FSEL’s 220 kip Mechanical
Testing System (MTS) as shown in Figures 4.22 and 4.23. During each test, the
load range and number of cycles were recorded using a Data Acquisition (DAQ)
control system as shown in Figure 4.24. The cyclic frequency for the load range
for the specimens was 3.5 Hertz.
Although this system was calibrated with a load cell, non-uniform (and
unintended) cyclic loads were experienced by specimens during fatigue testing
due to issues with the MTS and control electronics. Strain data monitoring
57
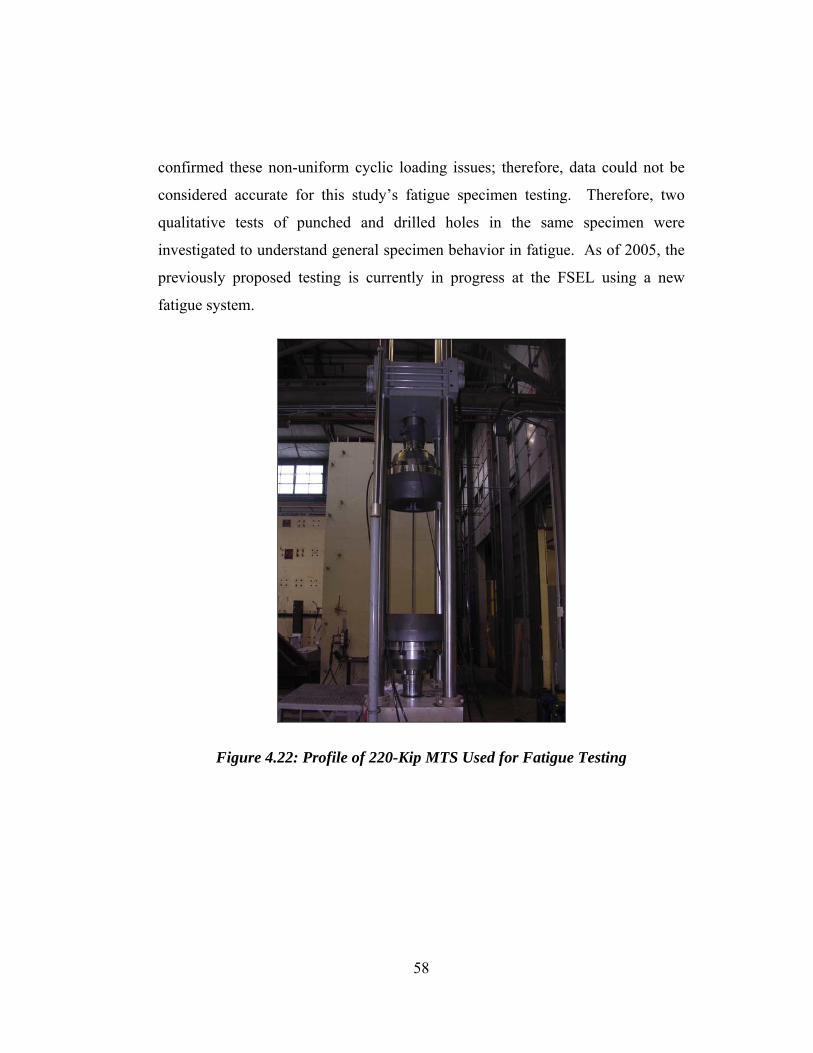
confirmed these non-uniform cyclic loading issues; therefore, data could not be
considered accurate for this study’s fatigue specimen testing. Therefore, two
qualitative tests of punched and drilled holes in the same specimen were
investigated to understand general specimen behavior in fatigue. As of 2005, the
previously proposed testing is currently in progress at the FSEL using a new
fatigue system.
Figure 4.22: Profile of 220-Kip MTS Used for Fatigue Testing
58
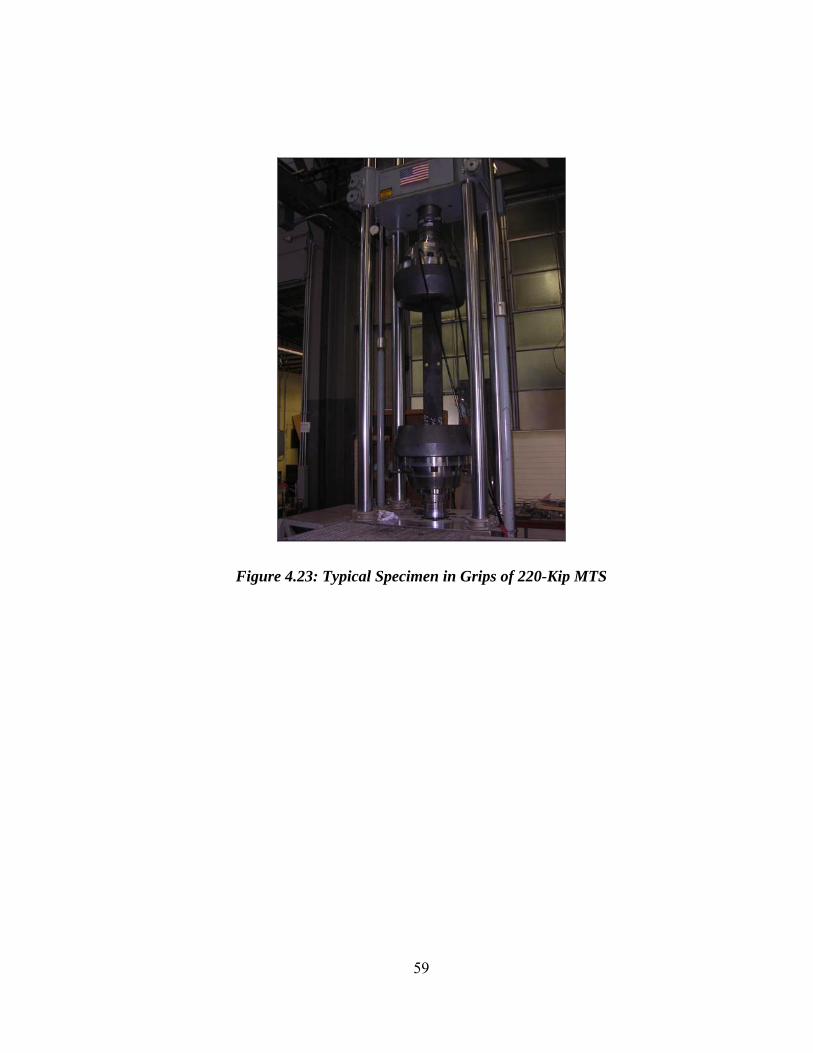
Figure 4.23: Typical Specimen in Grips of 220-Kip MTS
59
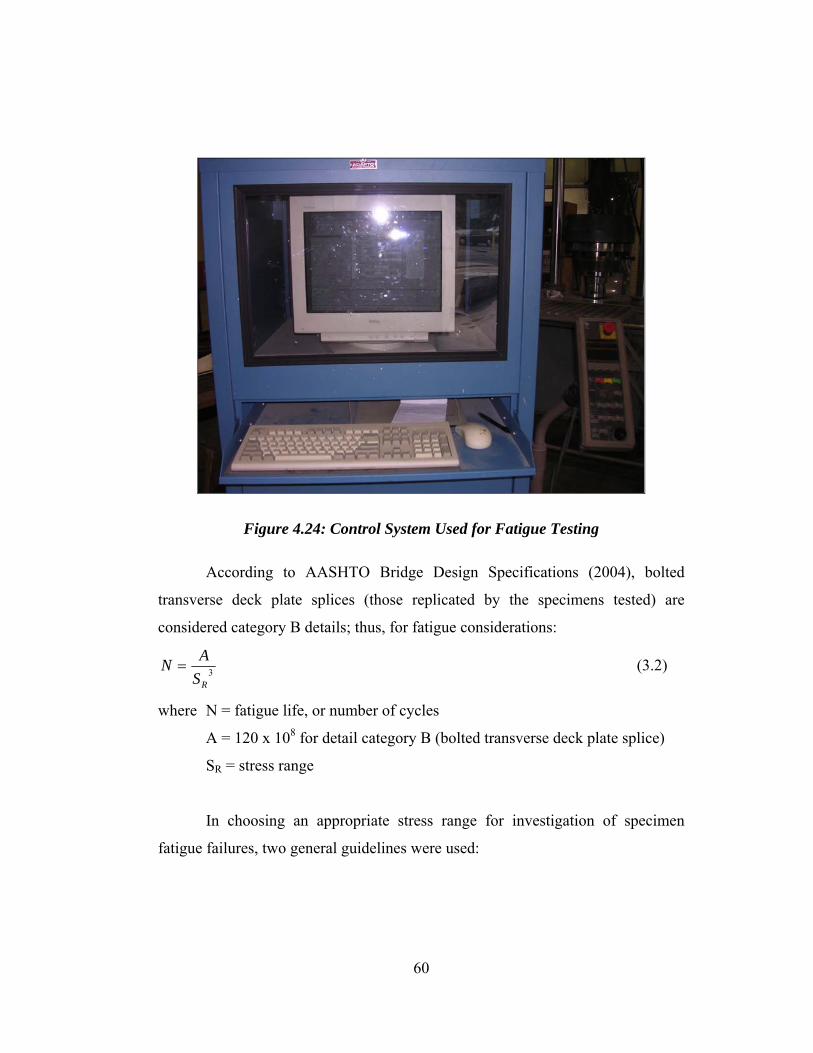
Figure 4.24: Control System Used for Fatigue Testing
According to AASHTO Bridge Design Specifications (2004), bolted
transverse deck plate splices (those replicated by the specimens tested) are
considered category B details; thus, for fatigue considerations:
3RSAN = (3.2)
where N = fatigue life, or number of cycles
A = 120 x 108 for detail category B (bolted transverse deck plate splice)
SR = stress range
In choosing an appropriate stress range for investigation of specimen
fatigue failures, two general guidelines were used:
60

1. It was necessary to keep the net section stress less than the yield stress of
the material (Equation 3.3).
2. It was necessary to keep the minimum load greater than zero to investigate
stress cycles from tension forces only (Equation 3.4).
ynetA
P σ<max (3.3)
where Pmax = maximum load on net section
Anet = net area
σy = yield strength of material
0min >P (3.4)
where Pmin = minimum load on net section
As previously mentioned, issues with the MTS and DAQ did not allow for
uniform cyclic loading. The two qualitative punched and drilled specimens were
both monitored with strain gages during testing and although they experienced
non-uniform cyclic loads, they did meet the guidelines of Equations 3.3 and 3.4.
4.4.3 Chemistry Analysis
Punched hole samples from all nine specimen plate heats were sent to
Chicago Spectra Service Lab Inc. in Chicago, Illinois for their standard nine
element steel chemistry testing. The chemistry testing determined weight
percentages of carbon, manganese, phosphorus, sulfur, silicon, nickel, chromium,
molybdenum, and copper in each of the plate types. These chemistry testing
results were also used for comparison with chemistry data given in the steel
supplier’s mill test reports.
61
4.4.4 ASTM Coupon Testing
Eight inch flat plate-type coupons with reduced sections from all nine
specimen plate heats were tensile tested to failure in the FSEL’s 600-kip UTS in
accordance with ASTM E8-04 standards. During each test, the load and eight
inch gage length extensometer readings were recorded using a PDAQ system.
Following this testing, the yield strength, ultimate strength, and percent
elongation of each plate heat could be derived from the collected data. These
coupon testing results were also used for comparison with chemistry data given in
the steel supplier’s mill test reports.
4.4.5 Charpy V-Notch Testing
Charpy simple-beam impact test specimens from all nine specimen plate
heats were impact tested at the FSEL in accordance with ASTM E23-04
standards. During each test, an absorbed energy value was obtained for a
specimen at a particular temperature. Following this testing, the temperature
values at 15 foot-pounds of energy and at the upper shelf of the energy-
temperature curve of each plate heat could be derived from the collected data.
62
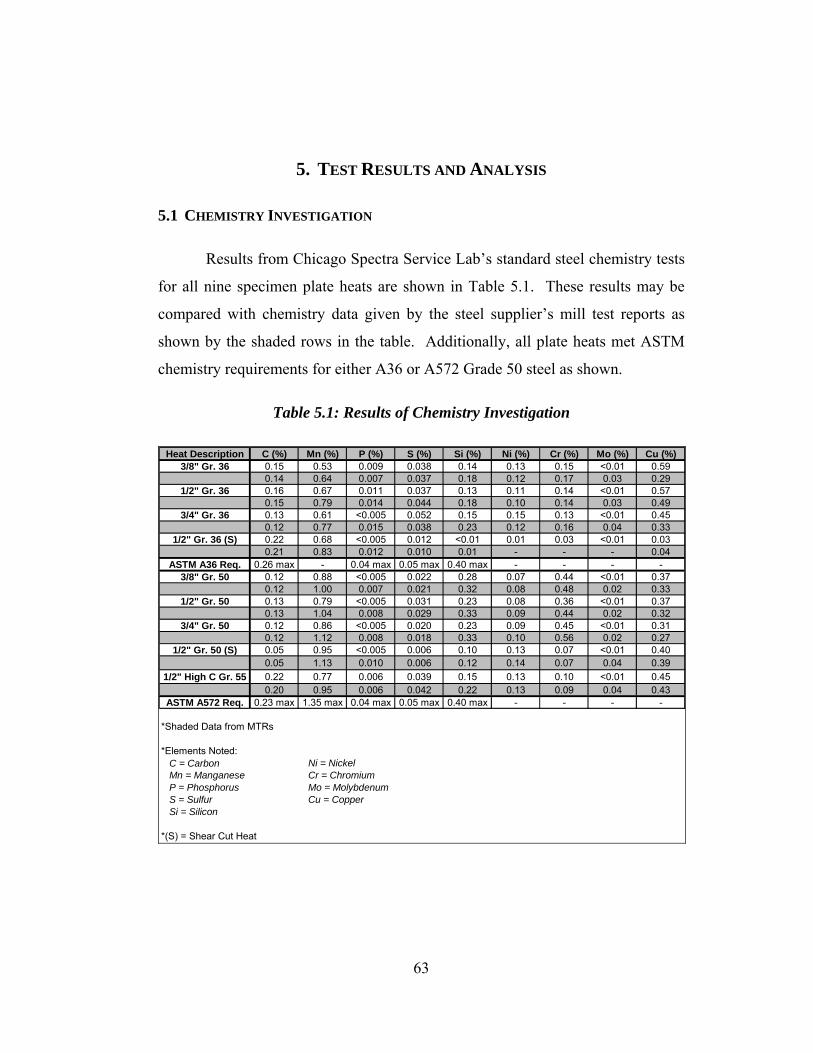
5. TEST RESULTS AND ANALYSIS
5.1 CHEMISTRY INVESTIGATION
Results from Chicago Spectra Service Lab’s standard steel chemistry tests
for all nine specimen plate heats are shown in Table 5.1. These results may be
compared with chemistry data given by the steel supplier’s mill test reports as
shown by the shaded rows in the table. Additionally, all plate heats met ASTM
chemistry requirements for either A36 or A572 Grade 50 steel as shown.
Table 5.1: Results of Chemistry Investigation
Heat Description C (%) Mn (%) P (%) S (%) Si (%) Ni (%) Cr (%) Mo (%) Cu (%)3/8" Gr. 36 0.15 0.53 0.009 0.038 0.14 0.13 0.15 <0.01 0.59
0.14 0.64 0.007 0.037 0.18 0.12 0.17 0.03 0.291/2" Gr. 36 0.16 0.67 0.011 0.037 0.13 0.11 0.14 <0.01 0.57
0.15 0.79 0.014 0.044 0.18 0.10 0.14 0.03 0.493/4" Gr. 36 0.13 0.61 <0.005 0.052 0.15 0.15 0.13 <0.01 0.45
0.12 0.77 0.015 0.038 0.23 0.12 0.16 0.04 0.331/2" Gr. 36 (S) 0.22 0.68 <0.005 0.012 <0.01 0.01 0.03 <0.01 0.03
0.21 0.83 0.012 0.010 0.01 - - - 0.04ASTM A36 Req. 0.26 max - 0.04 max 0.05 max 0.40 max - - - -
3/8" Gr. 50 0.12 0.88 <0.005 0.022 0.28 0.07 0.44 <0.01 0.370.12 1.00 0.007 0.021 0.32 0.08 0.48 0.02 0.33
1/2" Gr. 50 0.13 0.79 <0.005 0.031 0.23 0.08 0.36 <0.01 0.370.13 1.04 0.008 0.029 0.33 0.09 0.44 0.02 0.32
3/4" Gr. 50 0.12 0.86 <0.005 0.020 0.23 0.09 0.45 <0.01 0.310.12 1.12 0.008 0.018 0.33 0.10 0.56 0.02 0.27
1/2" Gr. 50 (S) 0.05 0.95 <0.005 0.006 0.10 0.13 0.07 <0.01 0.400.05 1.13 0.010 0.006 0.12 0.14 0.07 0.04 0.39
1/2" High C Gr. 55 0.22 0.77 0.006 0.039 0.15 0.13 0.10 <0.01 0.450.20 0.95 0.006 0.042 0.22 0.13 0.09 0.04 0.43
ASTM A572 Req. 0.23 max 1.35 max 0.04 max 0.05 max 0.40 max - - - -
*Shaded Data from MTRs
*Elements Noted:C = Carbon Ni = NickelMn = Manganese Cr = ChromiumP = Phosphorus Mo = MolybdenumS = Sulfur Cu = CopperSi = Silicon
*(S) = Shear Cut Heat
63
5.2 ASTM COUPON TESTING
Tensile results from all nine specimen standard 1-1/2 inch wide by 8 inch
long gage length coupons are shown in Table 5.2. These results may be compared
with material data given by the steel supplier’s mill test reports as shown by the
shaded rows in the table. All plate heats met ASTM chemistry requirements for
either A36 or A572 Grade 50 steel as shown with the exception of two percent
elongation test values. In addition, cold coupons that matched those cold
specimens tested during the initial material screening were examined. Note that
the cold coupons had a higher strength relative to their room temperature
replicates. Tensile results from these cold coupon tests are shown in Table 5.3.
64
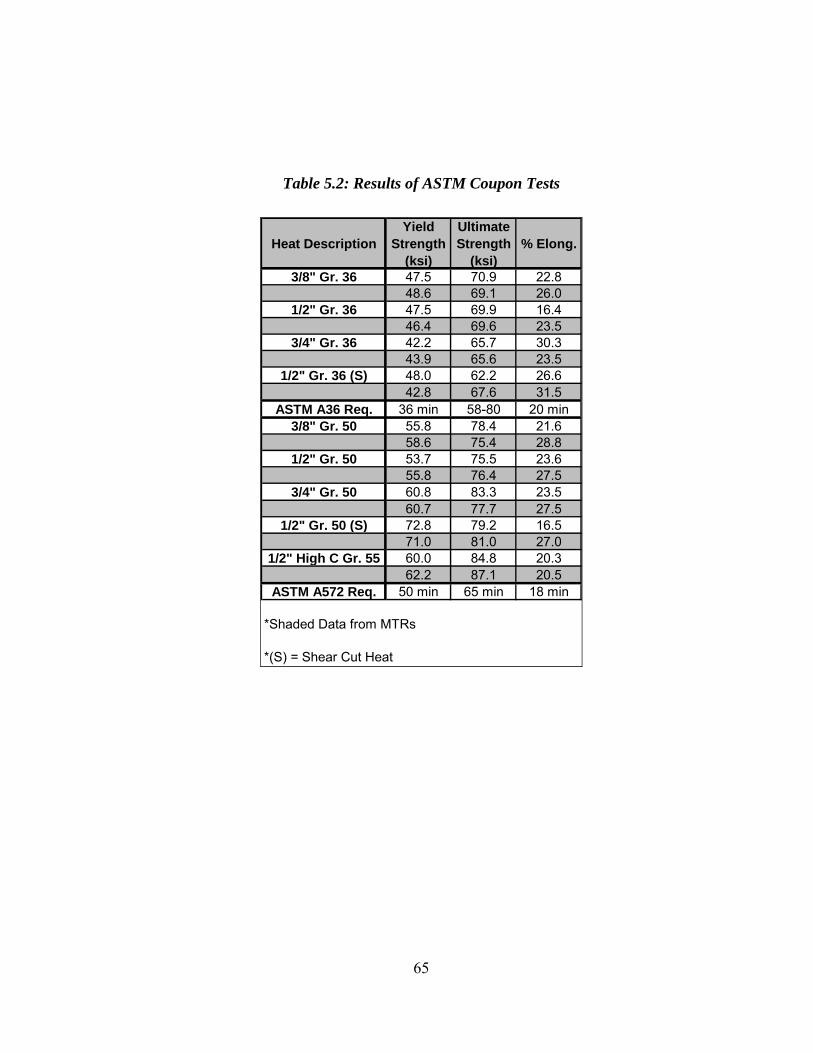
Table 5.2: Results of ASTM Coupon Tests
Heat Description Strength Yield
(ksi)
Ultimate Strength
(ksi)% Elong.
3/8" Gr. 36 47.5 70.9 22.848.6 69.1 26.0
1/2" Gr. 36 47.5 69.9 16.446.4 69.6 23.5
3/4" Gr. 36 42.2 65.7 30.343.9 65.6 23.5
1/2" Gr. 36 (S) 48.0 62.2 26.642.8 67.6 31.5
ASTM A36 Req. 36 min 58-80 20 min3/8" Gr. 50 55.8 78.4 21.6
58.6 75.4 28.81/2" Gr. 50 53.7 75.5 23.6
55.8 76.4 27.53/4" Gr. 50 60.8 83.3 23.5
60.7 77.7 27.51/2" Gr. 50 (S) 72.8 79.2 16.5
71.0 81.0 27.01/2" High C Gr. 55 60.0 84.8 20.3
62.2 87.1 20.5ASTM A572 Req. 50 min 65 min 18 min
*Shaded Data from MTRs
*(S) = Shear Cut Heat
65

Table 5.3: Results of ASTM Cold Coupon Tests
Heat Description Strength Yield
(ksi)
Ultimate Strength
(ksi)% Elong.
1/2" Gr. 36 (Cold) 50.3 74.6 25.31/2" Gr. 50 (Cold) 56.3 77.8 22.9
5.3 CHARPY V-NOTCH TESTING
Final results from the Charpy tests for all nine specimen plate heats are
shown in Table 5.4. The temperature at 15 foot-pounds and at the upper shelf was
estimated based on energy versus temperature plots for each plate heat, shown in
Appendix Figures A1 through A9. Charpy simple-beam impact test specimens of
the two 3/8 inch thickness plates were sub-size according to ASTM standards;
thus, energy readings for these specimens were factored accordingly to obtain
values for full-size specimens (these readings were multiplied by the ratio of
standard specimen width to actual specimen width). All plate heats met ASTM
toughness requirements of 70°F at 15 foot-pounds for A36 or A572 steel.
Table 5.4: Results of Charpy Testing
Heat Description Temperature at 15 ft-lbs (F)
Temperature at Upper Shelf (F)
3/8" Gr. 36 -38 701/2" Gr. 36 -32 703/4" Gr. 36 -40 80
1/2" Gr. 36 (S) 18 903/8" Gr. 50 -62 401/2" Gr. 50 -44 803/4" Gr. 50 0 80
1/2" Gr. 50 (S) 0 801/2" High C Gr. 55 -8 70
*(S) = Shear Cut Heat
66
5.4 NOTES ON CHEMISTRY, COUPON, AND CHARPY INVESTIGATIONS
Although the eight test investigations studied specific parameters such as
steel type, plate thickness, and hole size, to name a few, basic material properties
may have also played a significant role in the performance of the plates. As
previously shown, chemistry, coupon, and Charpy testing was completed for each
plate heat used for specimen testing. For each type of material, these tests
specifically revealed chemistry composition, yield strength, ultimate strength,
percent elongation, and hardness characteristics. In the following three sections,
chemistry, coupon tensile strength, and Charpy “outlier” plate heats are noted
along with observed performance differences of these plate heats during tensile
testing. Note that these tensile testing performance differences may be attributed
to these plate heat characteristics or to the specific parameters that were examined
during the investigations.
5.4.1 Chemistry Considerations
Whereas chemistry results for six of the nice plate heats were somewhat
similar, those for the three remaining plate heats varied to some extent. All plate
heats designated as grade 36 or grade 50 met steel chemistry specifications
according to both sets of chemistry testing that were completed. The following
three plate heats were the chemistry “outliers”:
• 1/2 Inch Thickness Grade 36 Sheared
• 1/2 Inch Thickness Grade 50 Sheared
• 1/2 Inch Thickness High Carbon Grade 55
67
5.4.2 Influence of Coupon Tensile Strength Characteristics
All plate heats designated as grade 36 or grade 50 met steel material
specifications according to both sets of testing that were completed. Whereas all
plate heats designated as grade 36 showed similar coupon strength performance,
one of the plate heats designated as grade 50 differed from the other three grade
50 plate heats in strength performance. The following plate heat was the coupon
“outlier”:
• 1/2 Inch Thickness Grade 50 Sheared
5.4.3 Influence of Notch Toughness Characteristics
During Charpy testing, four plate heats displayed notably lower notch
toughness characteristics relative to the other five plate heats. The following four
plate heats were the Charpy “outliers”:
• 1/2 Inch Thickness Grade 36 Sheared
• 3/4 Inch Thickness Grade 50
• 1/2 Inch Thickness Grade 50 Sheared
• 1/2 Inch Thickness High Carbon Grade 55
5.5 STEEL TYPE AND TEMPERATURE INVESTIGATION
Tensile results of specimens from the steel type and temperature test
matrix are shown in Tables 5.5 through 5.7. Tabular results in the sections that
follow are generally separated by punched and drilled hole preparation, and then
more specifically separated by specific investigation parameters. Tables 5.5
through 5.7 display test results from room temperature, aged, cold temperature,
and aged and cold temperature specimens. Net section stress was determined by
dividing the specimen’s ultimate load during testing by its measured net area.
68
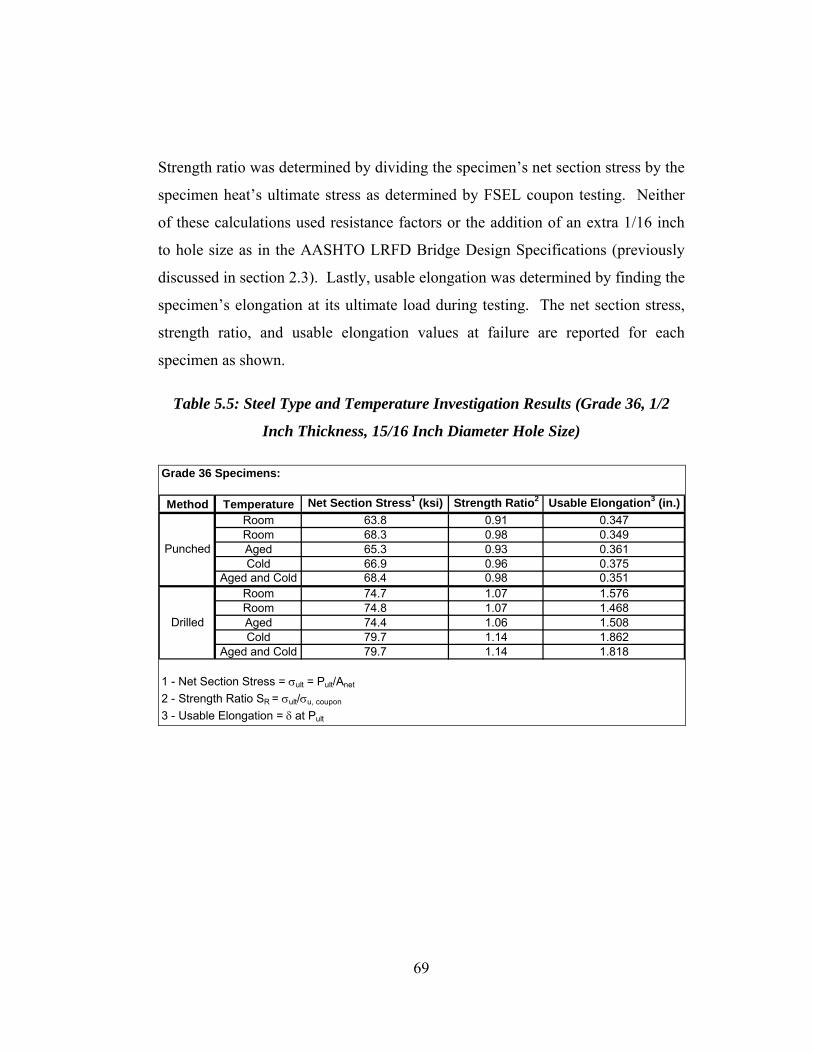
Strength ratio was determined by dividing the specimen’s net section stress by the
specimen heat’s ultimate stress as determined by FSEL coupon testing. Neither
of these calculations used resistance factors or the addition of an extra 1/16 inch
to hole size as in the AASHTO LRFD Bridge Design Specifications (previously
discussed in section 2.3). Lastly, usable elongation was determined by finding the
specimen’s elongation at its ultimate load during testing. The net section stress,
strength ratio, and usable elongation values at failure are reported for each
specimen as shown.
Table 5.5: Steel Type and Temperature Investigation Results (Grade 36, 1/2
Inch Thickness, 15/16 Inch Diameter Hole Size)
Grade 36 Specimens:
Method Temperature Net Section Stress1 (ksi) Strength Ratio2 Usable Elongation3 (in.)Room 63.8 0.91 0.347Room 68.3 0.98 0.349Aged 65.3 0.93 0.361Cold 66.9 0.96 0.375
Aged and Cold 68.4 0.98 0.351Room 74.7 1.07 1.576Room 74.8 1.07 1.468Aged 74.4 1.06 1.508Cold 79.7 1.14 1.862
Aged and Cold 79.7 1.14 1.818
1 - Net Section Stress = σult = Pult/Anet
2 - Strength Ratio SR = σult/σu, coupon
3 - Usable Elongation = δ at Pult
Drilled
Punched
69
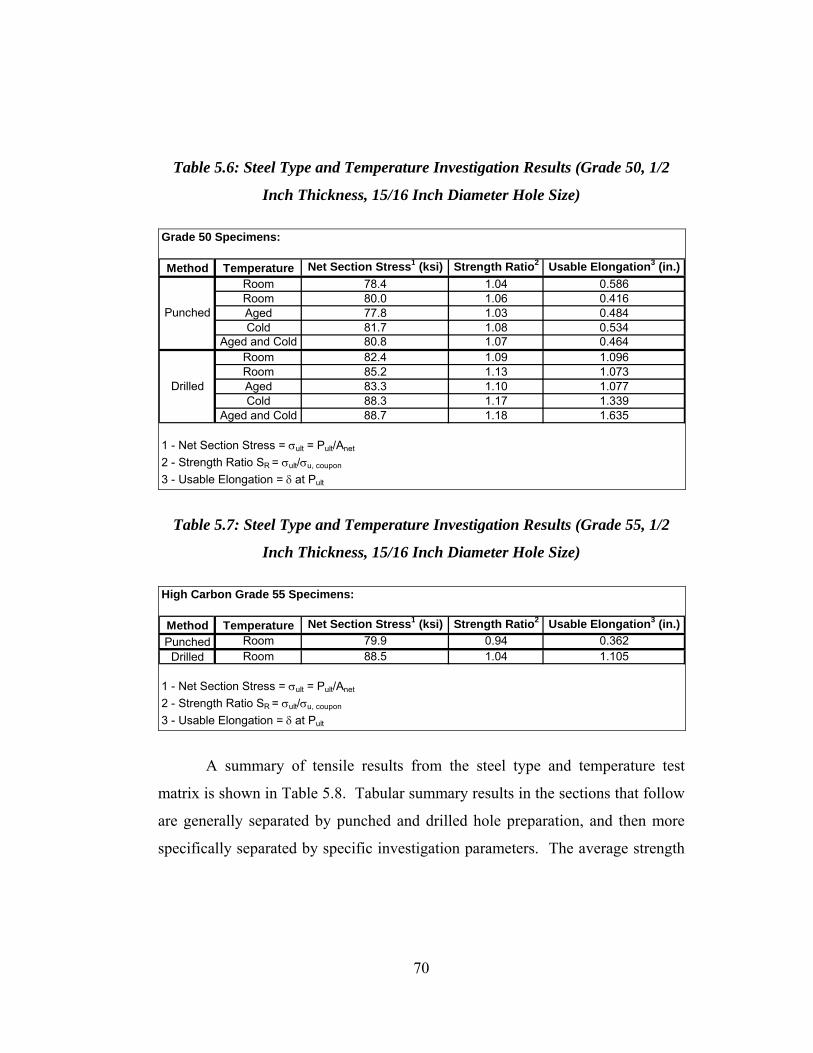
Table 5.6: Steel Type and Temperature Investigation Results (Grade 50, 1/2
Inch Thickness, 15/16 Inch Diameter Hole Size)
Grade 50 Specimens:
Method Temperature Net Section Stress1 (ksi) Strength Ratio2 Usable Elongation3 (in.)Room 78.4 1.04 0.586Room 80.0 1.06 0.416Aged 77.8 1.03 0.484Cold 81.7 1.08 0.534
Aged and Cold 80.8 1.07 0.464Room 82.4 1.09 1.096Room 85.2 1.13 1.073Aged 83.3 1.10 1.077Cold 88.3 1.17 1.339
Aged and Cold 88.7 1.18 1.635
1 - Net Section Stress = σult = Pult/Anet
2 - Strength Ratio SR = σult/σu, coupon
3 - Usable Elongation = δ at Pult
Punched
Drilled
Table 5.7: Steel Type and Temperature Investigation Results (Grade 55, 1/2
Inch Thickness, 15/16 Inch Diameter Hole Size)
High Carbon Grade 55 Specimens:
Method Temperature Net Section Stress1 (ksi) Strength Ratio2 Usable Elongation3 (in.)Punched Room 79.9 0.94 0.362
Drilled Room 88.5 1.04 1.105
1 - Net Section Stress = σult = Pult/Anet
2 - Strength Ratio SR = σult/σu, coupon
3 - Usable Elongation = δ at Pult
A summary of tensile results from the steel type and temperature test
matrix is shown in Table 5.8. Tabular summary results in the sections that follow
are generally separated by punched and drilled hole preparation, and then more
specifically separated by specific investigation parameters. The average strength
70
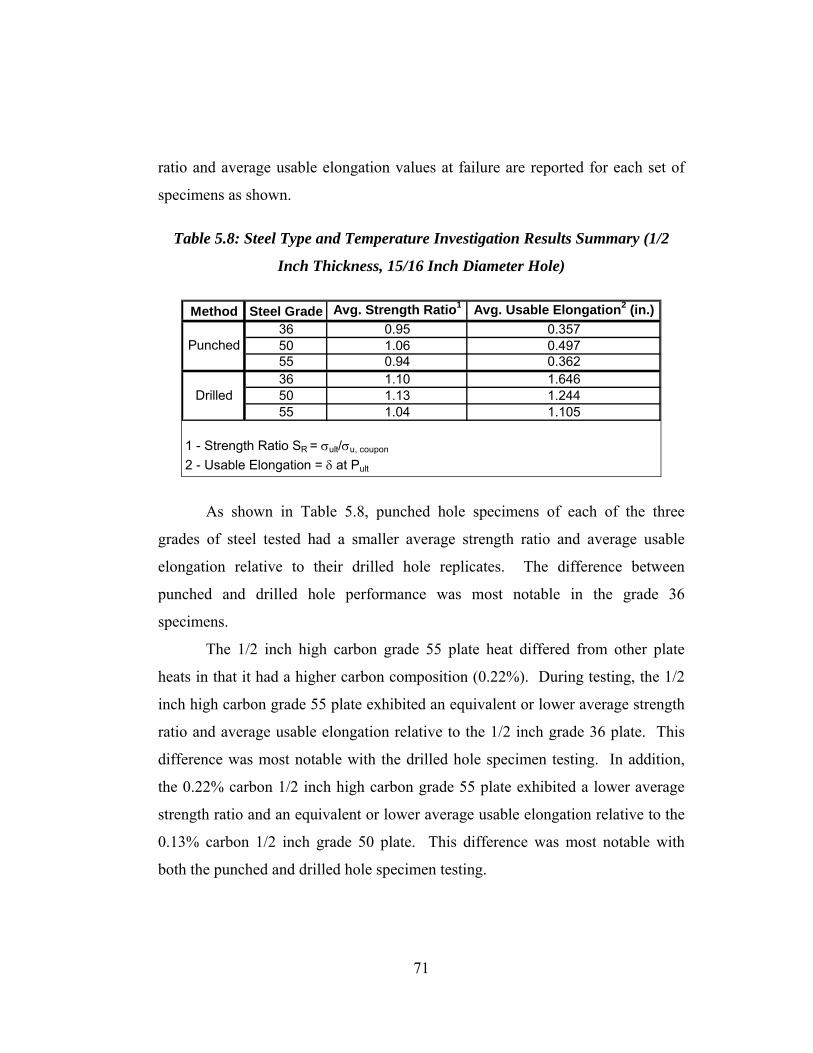
ratio and average usable elongation values at failure are reported for each set of
specimens as shown.
Table 5.8: Steel Type and Temperature Investigation Results Summary (1/2
Inch Thickness, 15/16 Inch Diameter Hole)
Method Steel Grade Avg. Strength Ratio1 Avg. Usable Elongation2 (in.)36 0.95 0.35750 1.06 0.49755 0.94 0.36236 1.10 1.64650 1.13 1.24455 1.04 1.105
1 - Strength Ratio SR = σult/σu, coupon
2 - Usable Elongation = δ at Pult
Punched
Drilled
As shown in Table 5.8, punched hole specimens of each of the three
grades of steel tested had a smaller average strength ratio and average usable
elongation relative to their drilled hole replicates. The difference between
punched and drilled hole performance was most notable in the grade 36
specimens.
The 1/2 inch high carbon grade 55 plate heat differed from other plate
heats in that it had a higher carbon composition (0.22%). During testing, the 1/2
inch high carbon grade 55 plate exhibited an equivalent or lower average strength
ratio and average usable elongation relative to the 1/2 inch grade 36 plate. This
difference was most notable with the drilled hole specimen testing. In addition,
the 0.22% carbon 1/2 inch high carbon grade 55 plate exhibited a lower average
strength ratio and an equivalent or lower average usable elongation relative to the
0.13% carbon 1/2 inch grade 50 plate. This difference was most notable with
both the punched and drilled hole specimen testing.
71
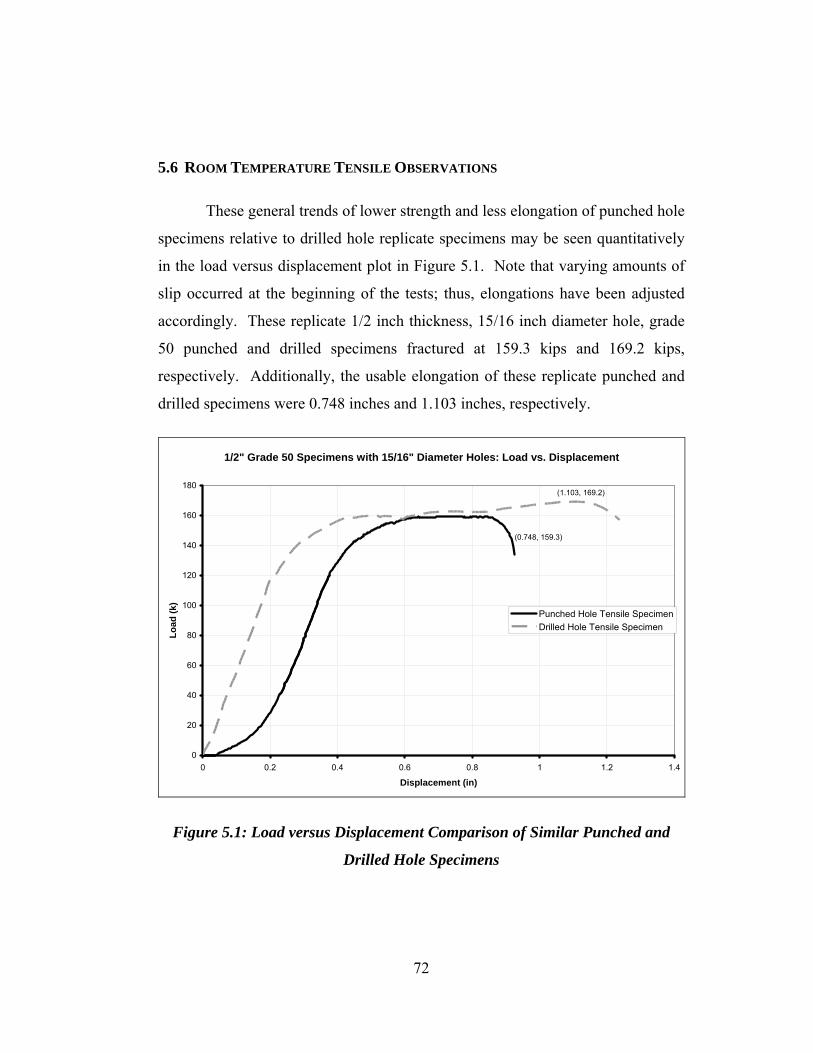
5.6 ROOM TEMPERATURE TENSILE OBSERVATIONS
These general trends of lower strength and less elongation of punched hole
specimens relative to drilled hole replicate specimens may be seen quantitatively
in the load versus displacement plot in Figure 5.1. Note that varying amounts of
slip occurred at the beginning of the tests; thus, elongations have been adjusted
accordingly. These replicate 1/2 inch thickness, 15/16 inch diameter hole, grade
50 punched and drilled specimens fractured at 159.3 kips and 169.2 kips,
respectively. Additionally, the usable elongation of these replicate punched and
drilled specimens were 0.748 inches and 1.103 inches, respectively.
1/2" Grade 50 Specimens with 15/16" Diameter Holes: Load vs. Displacement
0
20
40
60
80
100
120
140
160
180
0 0.2 0.4 0.6 0.8 1 1.2 1.4
Displacement (in)
Load
(k)
Punched Hole Tensile SpecimenDrilled Hole Tensile Specimen
(0.748, 159.3)
(1.103, 169.2)
Figure 5.1: Load versus Displacement Comparison of Similar Punched and
Drilled Hole Specimens
72
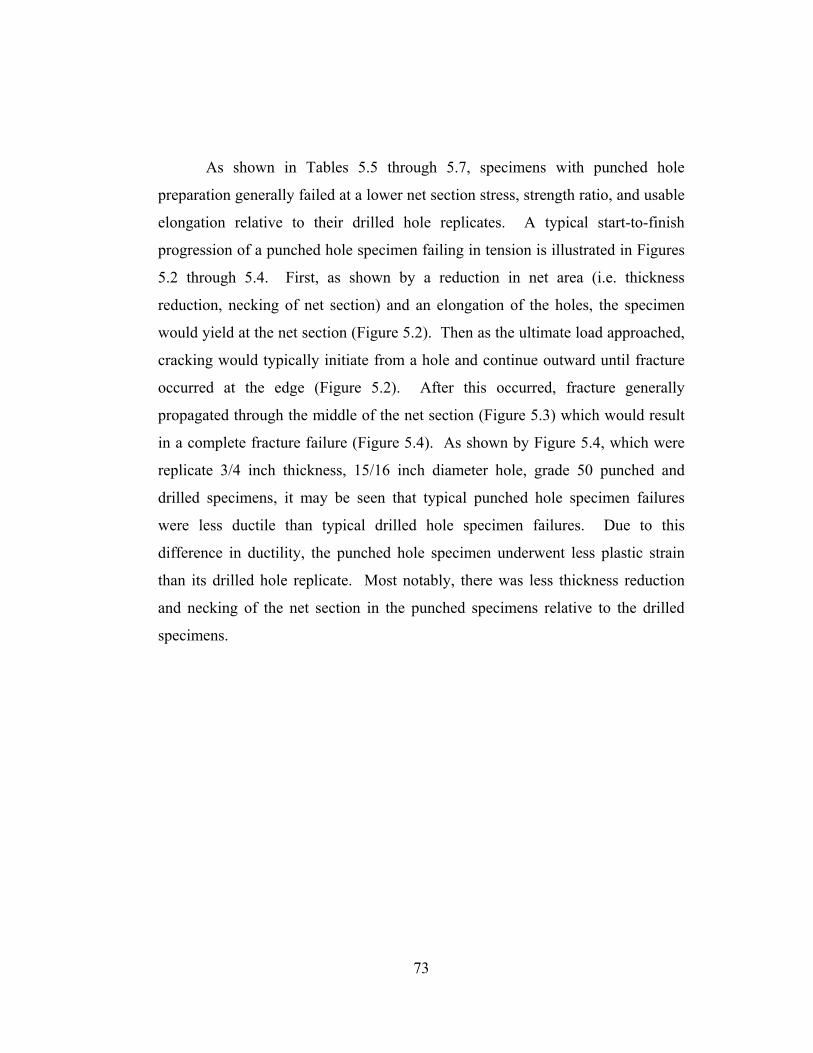
As shown in Tables 5.5 through 5.7, specimens with punched hole
preparation generally failed at a lower net section stress, strength ratio, and usable
elongation relative to their drilled hole replicates. A typical start-to-finish
progression of a punched hole specimen failing in tension is illustrated in Figures
5.2 through 5.4. First, as shown by a reduction in net area (i.e. thickness
reduction, necking of net section) and an elongation of the holes, the specimen
would yield at the net section (Figure 5.2). Then as the ultimate load approached,
cracking would typically initiate from a hole and continue outward until fracture
occurred at the edge (Figure 5.2). After this occurred, fracture generally
propagated through the middle of the net section (Figure 5.3) which would result
in a complete fracture failure (Figure 5.4). As shown by Figure 5.4, which were
replicate 3/4 inch thickness, 15/16 inch diameter hole, grade 50 punched and
drilled specimens, it may be seen that typical punched hole specimen failures
were less ductile than typical drilled hole specimen failures. Due to this
difference in ductility, the punched hole specimen underwent less plastic strain
than its drilled hole replicate. Most notably, there was less thickness reduction
and necking of the net section in the punched specimens relative to the drilled
specimens.
73
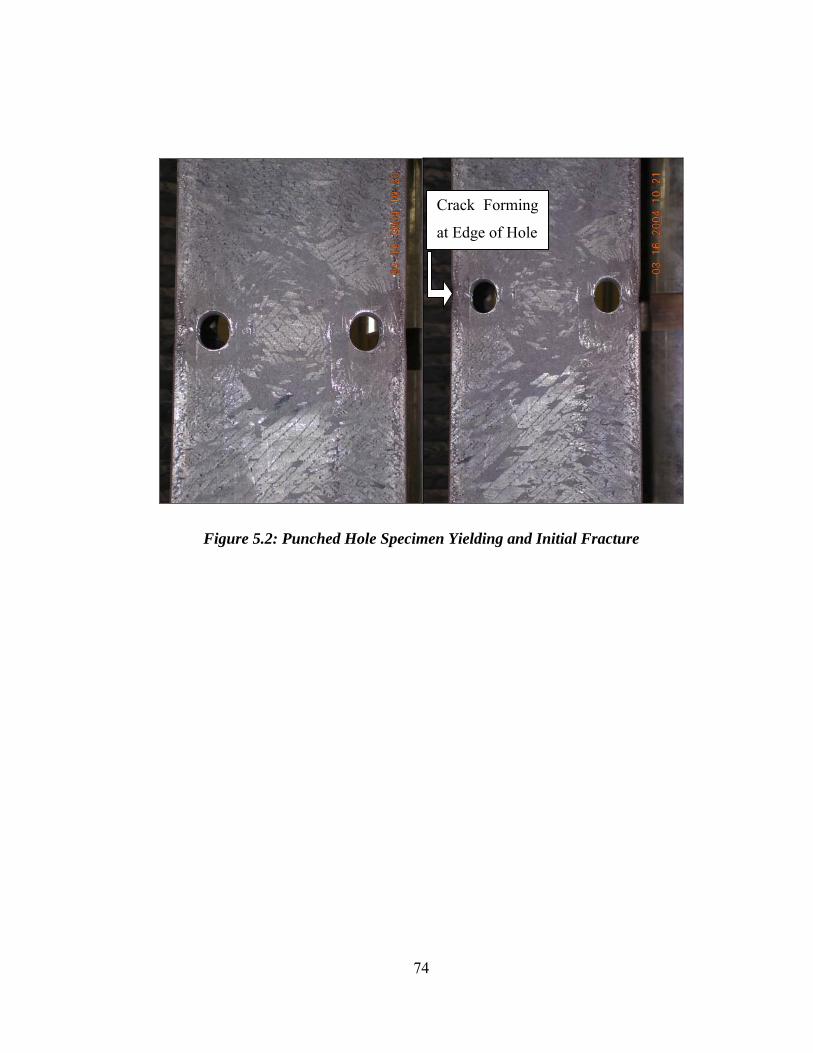
Crack Forming
at Edge of Hole
Figure 5.2: Punched Hole Specimen Yielding and Initial Fracture
74
Figure 5.3: Punched Hole Specimen Progression of Fracture
75

Punched
Specimen
Drilled
Specimen
Figure 5.4: Fractured Punched Hole and Drilled Hole Specimens
This difference in ductility is also shown by viewing the fracture surfaces
of punched and drilled hole specimens in Figures 5.5 through 5.7. Again,
punched hole specimen surfaces had a rougher, more brittle fracture appearance
relative to the fracture surfaces of drilled hole specimens. Of note, the fracture
surface at the hole is rougher in those specimens with punched holes. These
punched hole fracture surfaces did not appear to be influenced by the changes in
clearance and punching operations examined in this study. In addition, it may be
seen that the drilled hole specimens experienced a visibly noticeable larger
reduction in area prior to failure. The cross-sections of those specimens that were
prepared with reamed holes appeared very similar to those prepared with drilled
holes.
76
Moreover, Figure 5.5 show replicate 3/4 inch thickness, 15/16 inch
diameter hole, grade 50 punched and drilled specimens. The strength ratios for
this punched and drilled replicate pair were 1.07 and 1.08, respectively, and the
usable elongations were 0.558 and 1.110, respectively. Similarly, Figures 5.6 and
5.7 show replicate 3/8 inch thickness, 15/16 inch diameter hole, grade 50 punched
and drilled specimens. The strength ratios for this punched and drilled replicate
pair were 0.97 and 1.06, respectively, and the usable elongations were 0.469 and
1.058, respectively.
77
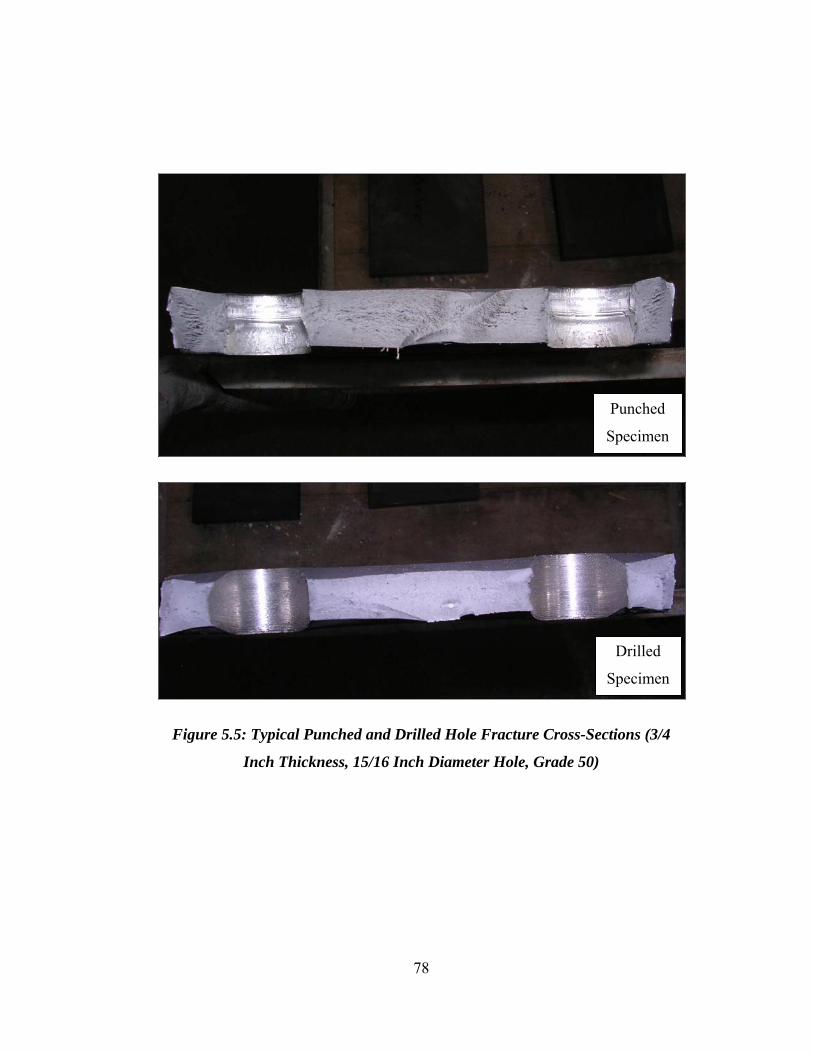
Punched
Specimen
Drilled
Specimen
Figure 5.5: Typical Punched and Drilled Hole Fracture Cross-Sections (3/4
Inch Thickness, 15/16 Inch Diameter Hole, Grade 50)
78
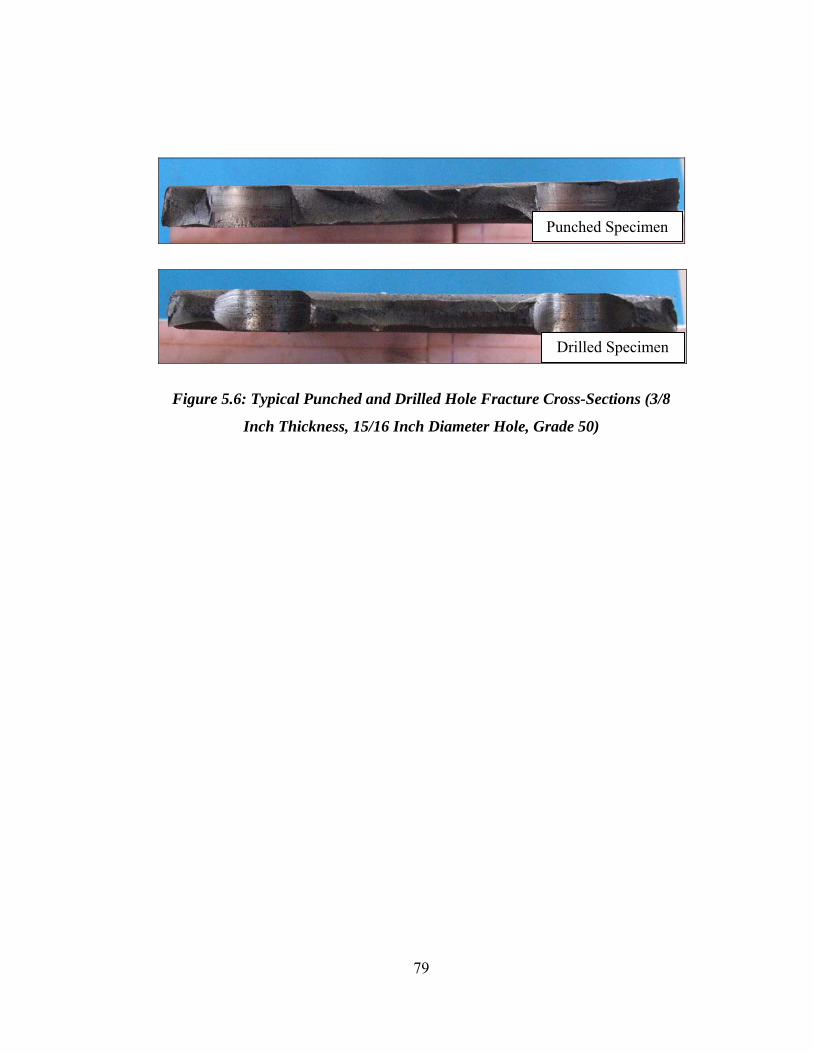
Punched Specimen
Drilled Specimen
Figure 5.6: Typical Punched and Drilled Hole Fracture Cross-Sections (3/8
Inch Thickness, 15/16 Inch Diameter Hole, Grade 50)
79

Punched
Specimen
Drilled
Specimen
Figure 5.7: Close-Up of Typical Punched and Drilled Hole Fracture Cross-
Sections (3/8 Inch Thickness, 15/16 Inch Diameter Hole, Grade 50)
5.7 HOLE SIZE AND PLATE THICKNESS INVESTIGATION
Tensile results of specimens from the hole size and plate thickness test
matrix are shown in Tables 5.9 and 5.10. These tables display test results from
3/8, 1/2, and 3/4 inch thickness specimens with either 11/16, 13/16, or 15/16 inch
hole sizes. Note that specimens of different thicknesses are from different plate
80
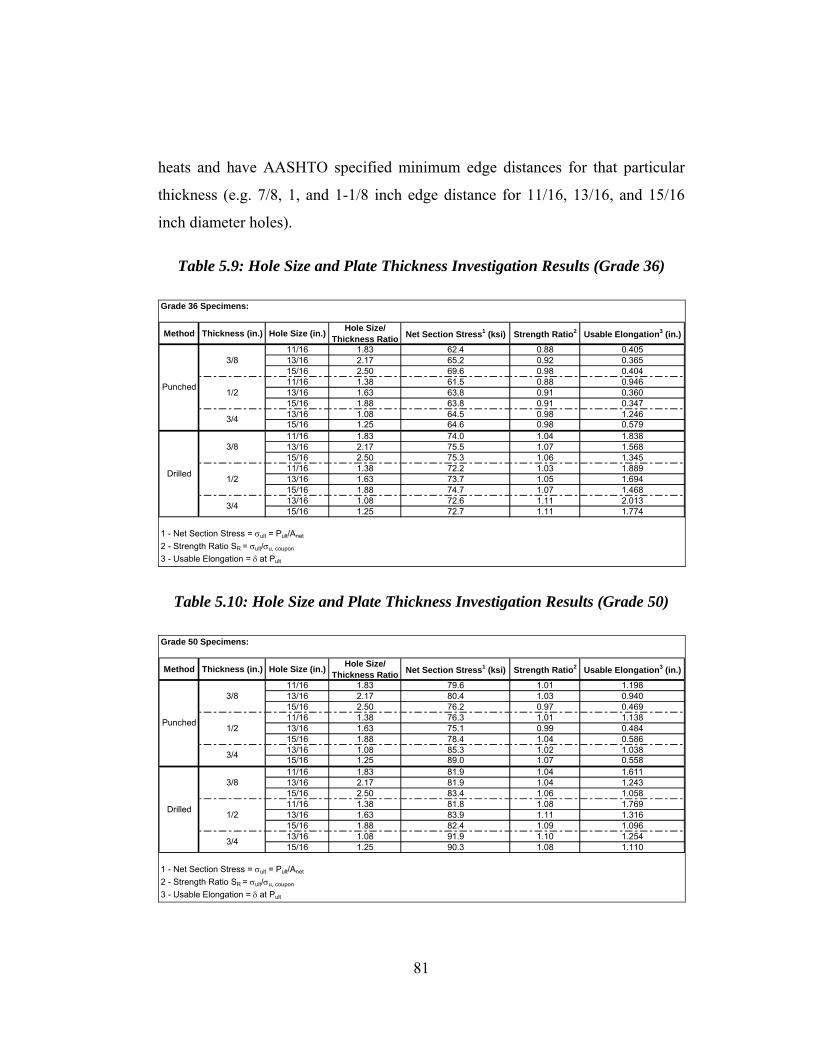
heats and have AASHTO specified minimum edge distances for that particular
thickness (e.g. 7/8, 1, and 1-1/8 inch edge distance for 11/16, 13/16, and 15/16
inch diameter holes).
Table 5.9: Hole Size and Plate Thickness Investigation Results (Grade 36)
Grade 36 Specimens:
Method Thickness (in.) Hole Size (in.) Hole Size/ Thickness Ratio Net Section Stress1 (ksi) Strength Ratio2 Usable Elongation3 (in.)
11/16 1.83 62.4 0.88 0.40513/16 2.17 65.2 0.92 0.36515/16 2.50 69.6 0.98 0.40411/16 1.38 61.5 0.88 0.94613/16 1.63 63.8 0.91 0.36015/16 1.88 63.8 0.91 0.34713/16 1.08 64.5 0.98 1.24615/16 1.25 64.6 0.98 0.57911/16 1.83 74.0 1.04 1.83813/16 2.17 75.5 1.07 1.56815/16 2.50 75.3 1.06 1.34511/16 1.38 72.2 1.03 1.88913/16 1.63 73.7 1.05 1.69415/16 1.88 74.7 1.07 1.46813/16 1.08 72.6 1.11 2.01315/16 1.25 72.7 1.11 1.774
1 - Net Section Stress = σult = Pult/Anet
2 - Strength Ratio SR = σult/σu, coupon
3 - Usable Elongation = δ at Pult
Punched
3/8
1/2
3/4
3/4
3/8
1/2
Drilled
Table 5.10: Hole Size and Plate Thickness Investigation Results (Grade 50)
Grade 50 Specimens:
Method Thickness (in.) Hole Size (in.) Hole Size/ Thickness Ratio Net Section Stress1 (ksi) Strength Ratio2 Usable Elongation3 (in.)
11/16 1.83 79.6 1.01 1.19813/16 2.17 80.4 1.03 0.94015/16 2.50 76.2 0.97 0.46911/16 1.38 76.3 1.01 1.13813/16 1.63 75.1 0.99 0.48415/16 1.88 78.4 1.04 0.58613/16 1.08 85.3 1.02 1.03815/16 1.25 89.0 1.07 0.55811/16 1.83 81.9 1.04 1.61113/16 2.17 81.9 1.04 1.24315/16 2.50 83.4 1.06 1.05811/16 1.38 81.8 1.08 1.76913/16 1.63 83.9 1.11 1.31615/16 1.88 82.4 1.09 1.09613/16 1.08 91.9 1.10 1.25415/16 1.25 90.3 1.08 1.110
1 - Net Section Stress = σult = Pult/Anet
2 - Strength Ratio SR = σult/σu, coupon
3 - Usable Elongation = δ at Pult
1/2Drilled
3/4
3/4
3/8
Punched
3/8
1/2
81
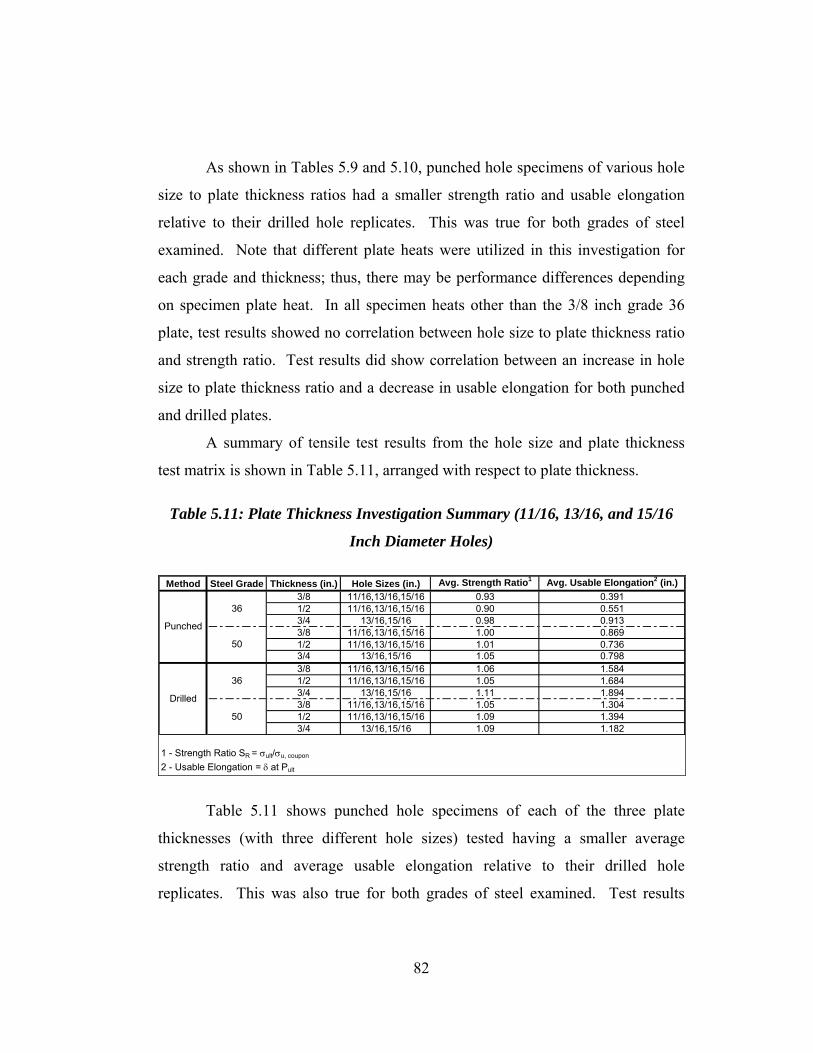
As shown in Tables 5.9 and 5.10, punched hole specimens of various hole
size to plate thickness ratios had a smaller strength ratio and usable elongation
relative to their drilled hole replicates. This was true for both grades of steel
examined. Note that different plate heats were utilized in this investigation for
each grade and thickness; thus, there may be performance differences depending
on specimen plate heat. In all specimen heats other than the 3/8 inch grade 36
plate, test results showed no correlation between hole size to plate thickness ratio
and strength ratio. Test results did show correlation between an increase in hole
size to plate thickness ratio and a decrease in usable elongation for both punched
and drilled plates.
A summary of tensile test results from the hole size and plate thickness
test matrix is shown in Table 5.11, arranged with respect to plate thickness.
Table 5.11: Plate Thickness Investigation Summary (11/16, 13/16, and 15/16
Inch Diameter Holes)
Method Steel Grade Thickness (in.) Hole Sizes (in.) Avg. Strength Ratio1 Avg. Usable Elongation2 (in.)3/8 11/16,13/16,15/16 0.93 0.3911/2 11/16,13/16,15/16 0.90 0.5513/4 13/16,15/16 0.98 0.9133/8 11/16,13/16,15/16 1.00 0.8691/2 11/16,13/16,15/16 1.01 0.7363/4 13/16,15/16 1.05 0.7983/8 11/16,13/16,15/16 1.06 1.5841/2 11/16,13/16,15/16 1.05 1.6843/4 13/16,15/16 1.11 1.8943/8 11/16,13/16,15/16 1.05 1.3041/2 11/16,13/16,15/16 1.09 1.3943/4 13/16,15/16 1.09 1.182
1 - Strength Ratio SR = σult/σu, coupon
2 - Usable Elongation = δ at Pult
Punched
36
50
Drilled
36
50
Table 5.11 shows punched hole specimens of each of the three plate
thicknesses (with three different hole sizes) tested having a smaller average
strength ratio and average usable elongation relative to their drilled hole
replicates. This was also true for both grades of steel examined. Test results
82
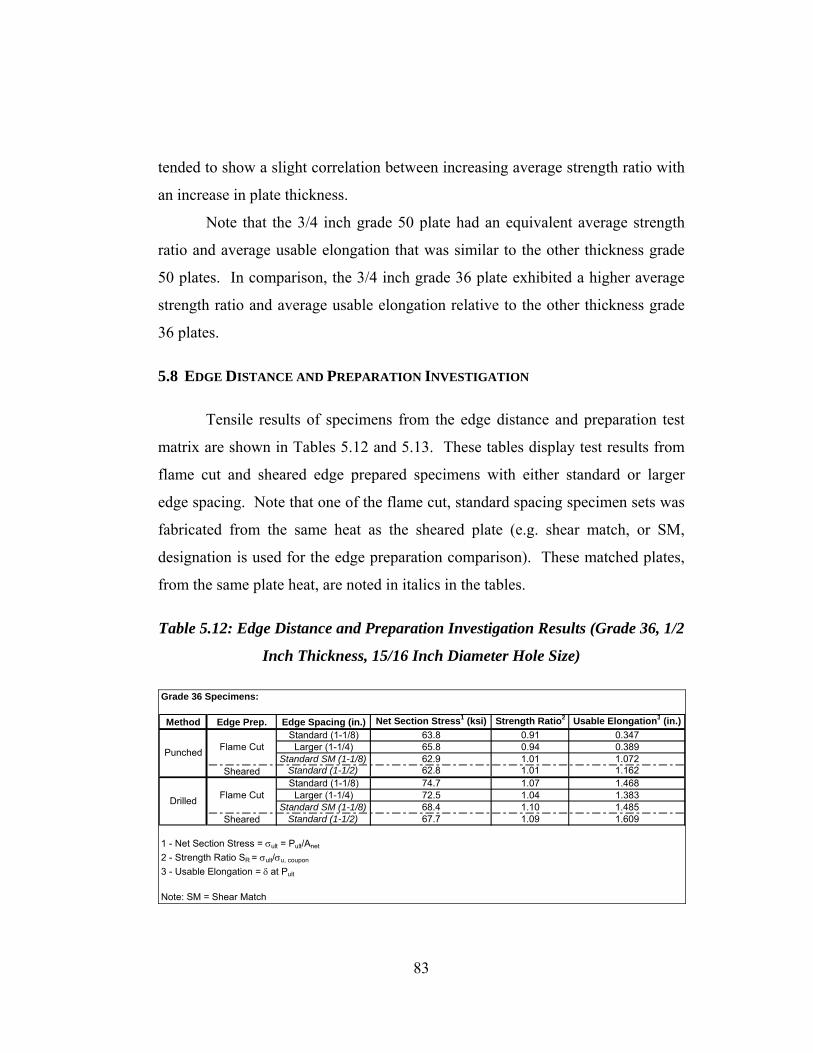
tended to show a slight correlation between increasing average strength ratio with
an increase in plate thickness.
Note that the 3/4 inch grade 50 plate had an equivalent average strength
ratio and average usable elongation that was similar to the other thickness grade
50 plates. In comparison, the 3/4 inch grade 36 plate exhibited a higher average
strength ratio and average usable elongation relative to the other thickness grade
36 plates.
5.8 EDGE DISTANCE AND PREPARATION INVESTIGATION
Tensile results of specimens from the edge distance and preparation test
matrix are shown in Tables 5.12 and 5.13. These tables display test results from
flame cut and sheared edge prepared specimens with either standard or larger
edge spacing. Note that one of the flame cut, standard spacing specimen sets was
fabricated from the same heat as the sheared plate (e.g. shear match, or SM,
designation is used for the edge preparation comparison). These matched plates,
from the same plate heat, are noted in italics in the tables.
Table 5.12: Edge Distance and Preparation Investigation Results (Grade 36, 1/2
Inch Thickness, 15/16 Inch Diameter Hole Size)
Grade 36 Specimens:
Method Edge Prep. Edge Spacing (in.) Net Section Stress1 (ksi) Strength Ratio2 Usable Elongation3 (in.)Standard (1-1/8) 63.8 0.91 0.347
Larger (1-1/4) 65.8 0.94 0.389Standard SM (1-1/8) 62.9 1.01 1.072
Sheared Standard (1-1/2) 62.8 1.01 1.162Standard (1-1/8) 74.7 1.07 1.468
Larger (1-1/4) 72.5 1.04 1.383Standard SM (1-1/8) 68.4 1.10 1.485
Sheared Standard (1-1/2) 67.7 1.09 1.609
1 - Net Section Stress = σult = Pult/Anet
2 - Strength Ratio SR = σult/σu, coupon
3 - Usable Elongation = δ at Pult
Note: SM = Shear Match
Punched
Drilled
Flame Cut
Flame Cut
83

Table 5.13: Edge Distance and Preparation Investigation Results (Grade 50, 1/2
Inch Thickness, 15/16 Inch Diameter Hole Size)
Grade 50 Specimens:
Method Edge Prep. Edge Spacing Net Section Stress1 (ksi) Strength Ratio2 Usable Elongation3 (in.)Standard (1-1/8) 78.4 1.04 0.586
Larger (1-1/4) 79.1 1.05 0.479Standard SM (1-1/8) 88.7 1.12 0.334
Sheared Standard (1-1/2) 88.4 1.12 0.354Standard (1-1/8) 82.4 1.09 1.096
Larger (1-1/4) 80.2 1.06 0.521Standard SM (1-1/8) 89.3 1.13 0.427
Sheared Standard (1-1/2) 86.6 1.09 0.375
1 - Net Section Stress = σult = Pult/Anet
2 - Strength Ratio SR = σult/σu, coupon
3 - Usable Elongation = δ at Pult
Note: SM = Shear Match
Flame Cut
Drilled Flame Cut
Punched
As shown in these tables, punched hole specimens with both standard and
larger edge distances had a smaller strength ratio and usable elongation relative to
their drilled hole replicates. This was true for both grades of steel examined, even
though the grade 36 sheared and shear match plate showed large usable
elongation. Again, note that two different plate heats were utilized in this
investigation; thus, there may be performance differences depending on specimen
plate heat. Test results showed no significant correlation between edge distance
and strength ratio or usable elongation.
Furthermore, punched hole specimens with both flame cut and sheared
edges had a smaller or equivalent strength ratio and usable elongation when
compared to their drilled hole replicates. This was true for both grades of steel
examined. Test results tended to show no significant correlation between edge
preparation and strength ratio or usable elongation.
The 1/2 inch thickness grade 36 sheared plate heat generally differed from
other plate heats in that it had a higher carbon composition (0.22%) and a lower
percentage composition of alloys such as silicon (<0.01%), nickel (0.01%),
84

chromium (0.03%), and copper (0.03%). During testing, the 0.22% carbon 1/2
inch grade 36 shear plate with edges flame cut off (i.e. plate designated as “shear
match” in edge preparation investigation) exhibited an equivalent or higher
average strength ratio and average usable elongation relative to the 0.16% carbon
1/2 inch grade 36 plate. This improvement was most notable with the punched
hole specimen testing.
The 1/2 inch thickness grade 50 sheared plate heat generally differed from
other plate heats in that it had a lower carbon composition (0.05%) and a lower
percentage composition of alloys such as sulfur (0.006%) and chromium (0.07%).
During testing, the 0.05% carbon 1/2 inch grade 50 shear plate with edges flame
cut off (i.e. plate designated as “shear match” in edge preparation investigation)
exhibited a higher average strength ratio and a lower average usable elongation
relative to the 0.13% carbon 1/2 inch grade 50 plate. This difference was most
notable with the drilled hole specimen testing.
5.9 PUNCHING CLEARANCE INVESTIGATION
Tensile results of specimens from the punching clearance test matrix are
shown in Tables 5.14 and 5.15. These tables display test results from 11/16 and
15/16 inch hole size specimens with either recommended or larger clearances.
These clearances were obtained by changing the die size (e.g. larger clearance
was recommended clearance plus 1/8 inch) while keeping the punch size constant,
as discussed in section 3.2.4.
85
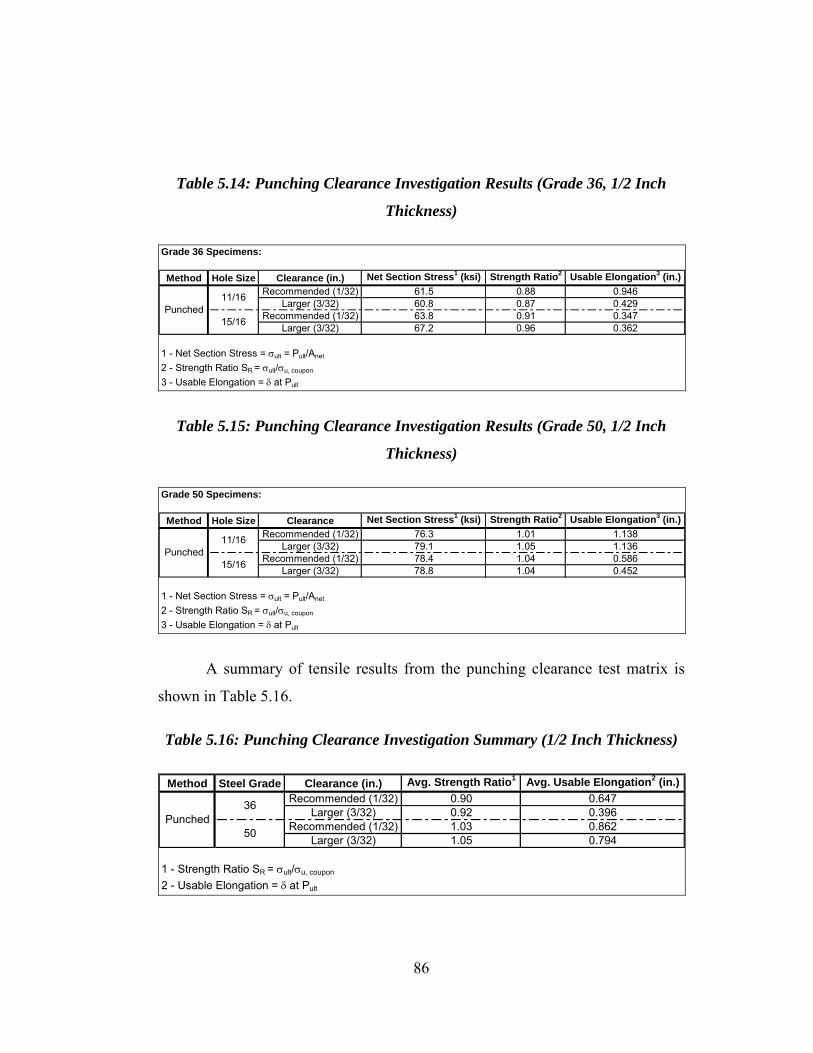
Table 5.14: Punching Clearance Investigation Results (Grade 36, 1/2 Inch
Thickness)
Grade 36 Specimens:
Method Hole Size Clearance (in.) Net Section Stress1 (ksi) Strength Ratio2 Usable Elongation3 (in.)Recommended (1/32) 61.5 0.88 0.946
Larger (3/32) 60.8 0.87 0.429Recommended (1/32) 63.8 0.91 0.347
Larger (3/32) 67.2 0.96 0.362
1 - Net Section Stress = σult = Pult/Anet
2 - Strength Ratio SR = σult/σu, coupon
3 - Usable Elongation = δ at Pult
11/16
15/16Punched
Table 5.15: Punching Clearance Investigation Results (Grade 50, 1/2 Inch
Thickness)
Grade 50 Specimens:
Method Hole Size Clearance Net Section Stress1 (ksi) Strength Ratio2 Usable Elongation3 (in.)Recommended (1/32) 76.3 1.01 1.138
Larger (3/32) 79.1 1.05 1.136Recommended (1/32) 78.4 1.04 0.586
Larger (3/32) 78.8 1.04 0.452
1 - Net Section Stress = σult = Pult/Anet
2 - Strength Ratio SR = σult/σu, coupon
3 - Usable Elongation = δ at Pult
Punched11/16
15/16
A summary of tensile results from the punching clearance test matrix is
shown in Table 5.16.
Table 5.16: Punching Clearance Investigation Summary (1/2 Inch Thickness)
Method Steel Grade Clearance (in.) Avg. Strength Ratio1 Avg. Usable Elongation2 (in.)Recommended (1/32) 0.90 0.647
Larger (3/32) 0.92 0.396Recommended (1/32) 1.03 0.862
Larger (3/32) 1.05 0.794
1 - Strength Ratio SR = σult/σu, coupon
2 - Usable Elongation = δ at Pult
Punched36
50
86
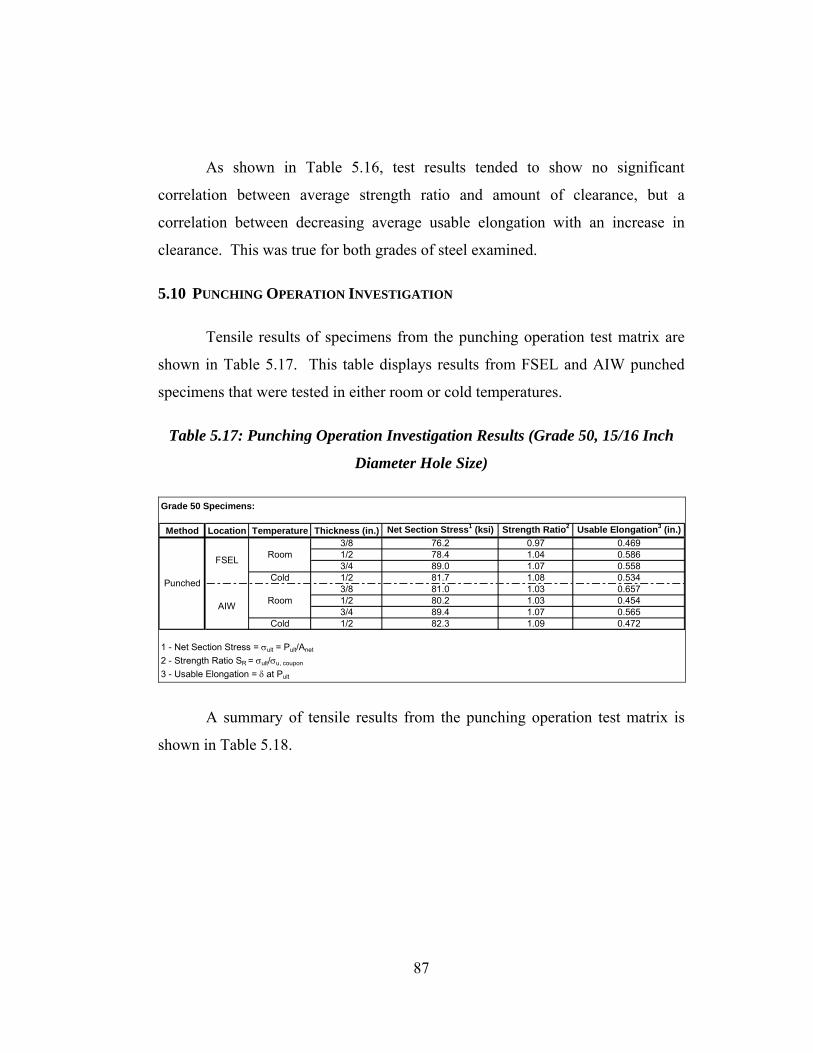
As shown in Table 5.16, test results tended to show no significant
correlation between average strength ratio and amount of clearance, but a
correlation between decreasing average usable elongation with an increase in
clearance. This was true for both grades of steel examined.
5.10 PUNCHING OPERATION INVESTIGATION
Tensile results of specimens from the punching operation test matrix are
shown in Table 5.17. This table displays results from FSEL and AIW punched
specimens that were tested in either room or cold temperatures.
Table 5.17: Punching Operation Investigation Results (Grade 50, 15/16 Inch
Diameter Hole Size)
Grade 50 Specimens:
Method Location Temperature Thickness (in.) Net Section Stress1 (ksi) Strength Ratio2 Usable Elongation3 (in.)3/8 76.2 0.97 0.4691/2 78.4 1.04 0.5863/4 89.0 1.07 0.558
Cold 1/2 81.7 1.08 0.5343/8 81.0 1.03 0.6571/2 80.2 1.03 0.4543/4 89.4 1.07 0.565
Cold 1/2 82.3 1.09 0.472
1 - Net Section Stress = σult = Pult/Anet
2 - Strength Ratio SR = σult/σu, coupon
3 - Usable Elongation = δ at Pult
Punched
Room
Room
FSEL
AIW
A summary of tensile results from the punching operation test matrix is
shown in Table 5.18.
87

Table 5.18: Punching Operation Investigation Summary (15/16 Inch Diameter
Hole, Grade 50)
Avg. Strength Ratio1 Avg. Usable Elongation2 (in.)Method LocationFSEL 1.04 0.537AIW 1.06 0.537
1 - Strength Ratio SR = σult/σu, coupon
2 - Usable Elongation = δ at Pult
Punched
As shown in Table 5.18, test results tended to show no significant
correlation between punching operation and average strength ratio or average
usable elongation.
5.11 COLD TENSILE TESTING THICKNESS INVESTIGATION
Tensile results of specimens from the cold tensile test thickness matrix are
shown in Tables 5.19 and 5.20. These tables display test results from cold
temperature 3/8, 1/2 and 3/4 inch thickness specimens.
Table 5.19: Cold Tensile Testing Thickness Investigation Results (Grade 36,
15/16 Inch Diameter Hole Size)
Grade 36 Specimens:
Method Thickness (in.) Net Section Stress1 (ksi) Strength Ratio2 Room Temp. Strength Ratio2
Usable Elongation3 (in.)
Room Temp. Usable Elongation3 (in.)
3/8 72.0 1.02 0.98 0.405 0.4041/2 66.9 0.96 0.91 0.375 0.3473/4 69.3 1.05 0.98 1.174 0.5793/8 78.6 1.11 1.06 1.454 1.3451/2 79.7 1.14 1.07 1.862 1.4683/4 78.0 1.19 1.11 1.984 1.774
1 - Net Section Stress = σult = Pult/Anet
2 - Strength Ratio SR = σult/σu, coupon
3 - Usable Elongation = δ at Pult
Punched
Drilled
88
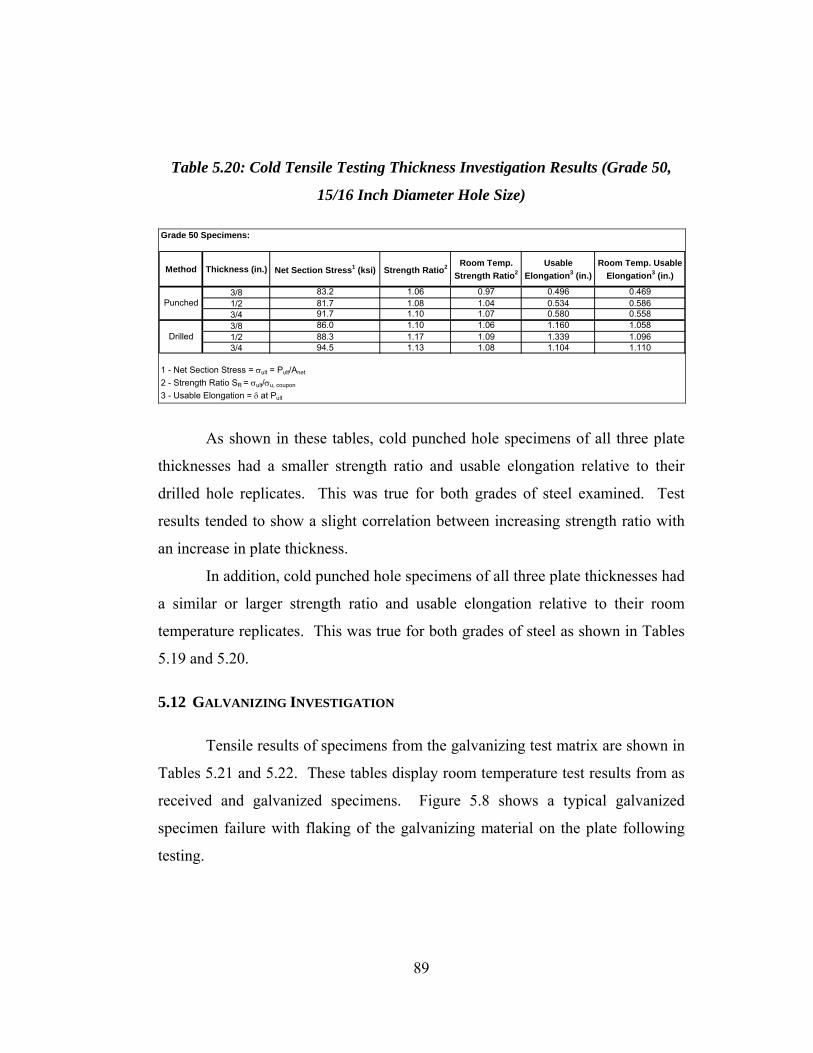
Table 5.20: Cold Tensile Testing Thickness Investigation Results (Grade 50,
15/16 Inch Diameter Hole Size)
Grade 50 Specimens:
Method Thickness (in.) Net Section Stress1 (ksi) Strength Ratio2 Room Temp. Strength Ratio2
Usable Elongation3 (in.)
Room Temp. Usable Elongation3 (in.)
3/8 83.2 1.06 0.97 0.496 0.4691/2 81.7 1.08 1.04 0.534 0.5863/4 91.7 1.10 1.07 0.580 0.5583/8 86.0 1.10 1.06 1.160 1.0581/2 88.3 1.17 1.09 1.339 1.0963/4 94.5 1.13 1.08 1.104 1.110
1 - Net Section Stress = σult = Pult/Anet
2 - Strength Ratio SR = σult/σu, coupon
3 - Usable Elongation = δ at Pult
Punched
Drilled
As shown in these tables, cold punched hole specimens of all three plate
thicknesses had a smaller strength ratio and usable elongation relative to their
drilled hole replicates. This was true for both grades of steel examined. Test
results tended to show a slight correlation between increasing strength ratio with
an increase in plate thickness.
In addition, cold punched hole specimens of all three plate thicknesses had
a similar or larger strength ratio and usable elongation relative to their room
temperature replicates. This was true for both grades of steel as shown in Tables
5.19 and 5.20.
5.12 GALVANIZING INVESTIGATION
Tensile results of specimens from the galvanizing test matrix are shown in
Tables 5.21 and 5.22. These tables display room temperature test results from as
received and galvanized specimens. Figure 5.8 shows a typical galvanized
specimen failure with flaking of the galvanizing material on the plate following
testing.
89
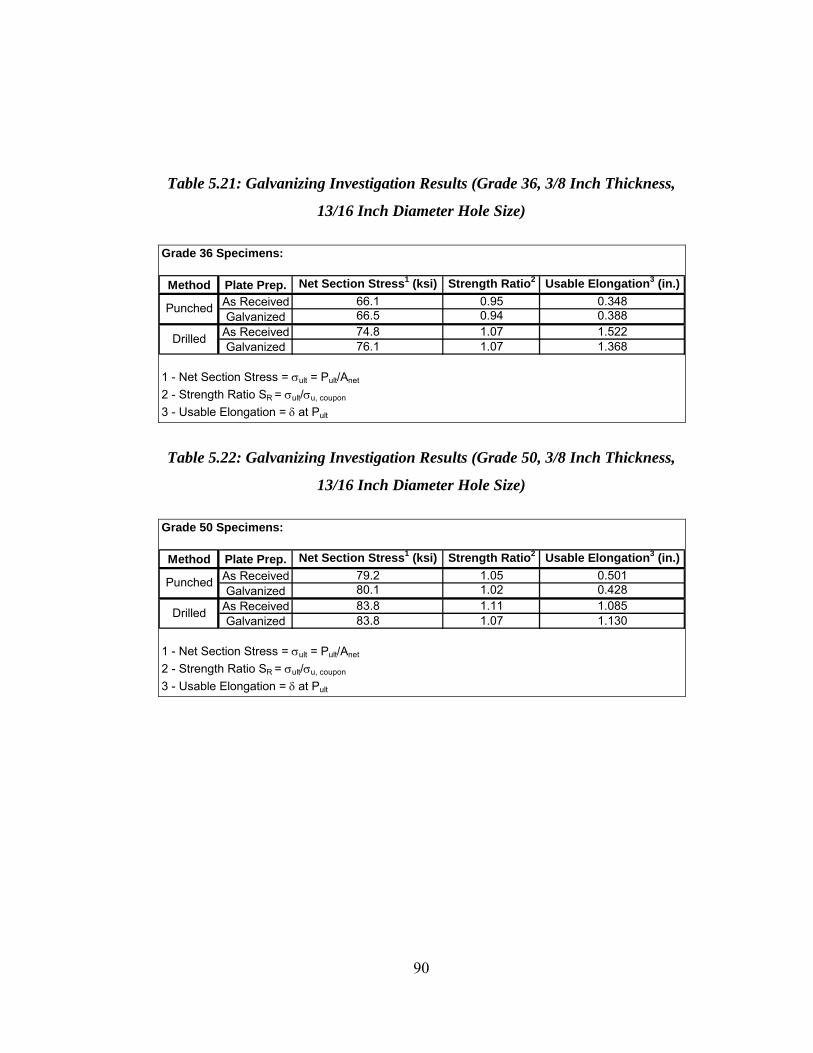
Table 5.21: Galvanizing Investigation Results (Grade 36, 3/8 Inch Thickness,
13/16 Inch Diameter Hole Size)
Grade 36 Specimens:
Method Plate Prep. Net Section Stress1 (ksi) Strength Ratio2 Usable Elongation3 (in.)As Received 66.1 0.95 0.348Galvanized 66.5 0.94 0.388
As Received 74.8 1.07 1.522Galvanized 76.1 1.07 1.368
1 - Net Section Stress = σult = Pult/Anet
2 - Strength Ratio SR = σult/σu, coupon
3 - Usable Elongation = δ at Pult
Punched
Drilled
Table 5.22: Galvanizing Investigation Results (Grade 50, 3/8 Inch Thickness,
13/16 Inch Diameter Hole Size)
Grade 50 Specimens:
Method Plate Prep. Net Section Stress1 (ksi) Strength Ratio2 Usable Elongation3 (in.)As Received 79.2 1.05 0.501Galvanized 80.1 1.02 0.428
As Received 83.8 1.11 1.085Galvanized 83.8 1.07 1.130
1 - Net Section Stress = σult = Pult/Anet
2 - Strength Ratio SR = σult/σu, coupon
3 - Usable Elongation = δ at Pult
Drilled
Punched
90
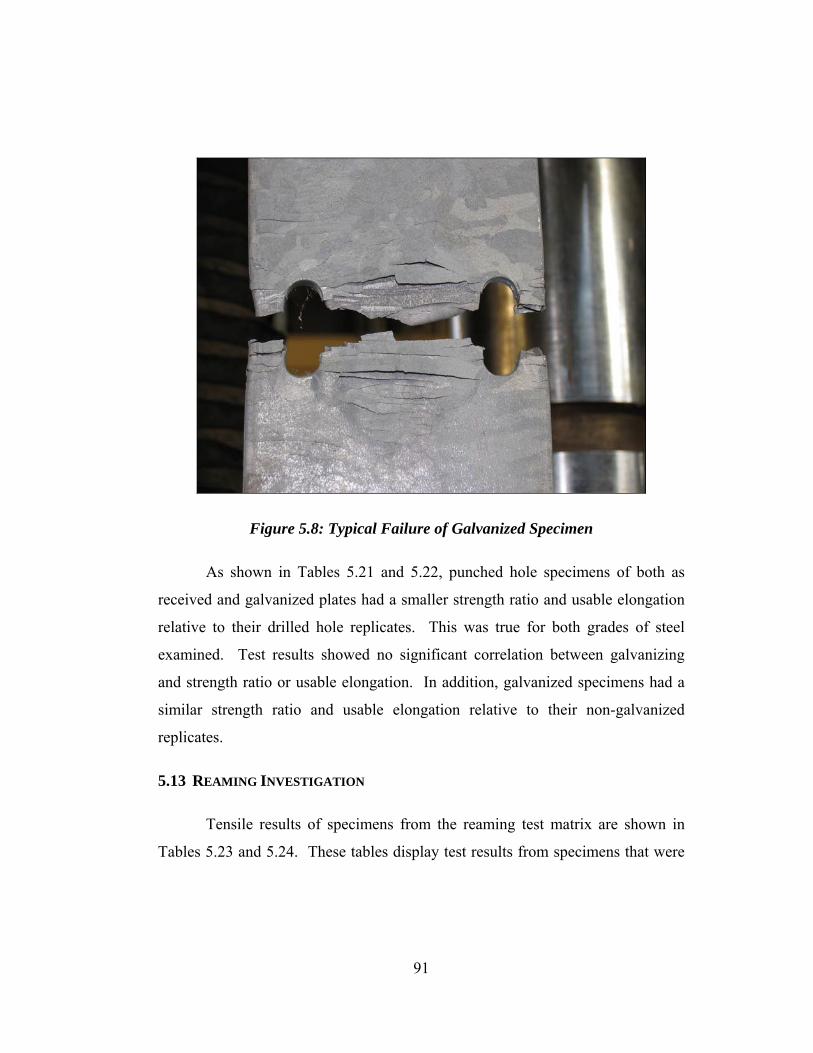
Figure 5.8: Typical Failure of Galvanized Specimen
As shown in Tables 5.21 and 5.22, punched hole specimens of both as
received and galvanized plates had a smaller strength ratio and usable elongation
relative to their drilled hole replicates. This was true for both grades of steel
examined. Test results showed no significant correlation between galvanizing
and strength ratio or usable elongation. In addition, galvanized specimens had a
similar strength ratio and usable elongation relative to their non-galvanized
replicates.
5.13 REAMING INVESTIGATION
Tensile results of specimens from the reaming test matrix are shown in
Tables 5.23 and 5.24. These tables display test results from specimens that were
91

reamed 1/16, 2/16, or 3/16 inches following punching. All finished holes had the
same diameter of 15/16 inch.
Table 5.23: Reaming Investigation Results (Grade 36, 1/2 Inch Thickness,
15/16 Inch Diameter Hole Size)
Grade 36 Specimens:
Method Punch Diameter and Amount of Reaming (in.) Net Section Stress1 (ksi) Strength Ratio2 Usable Elongation3 (in.)
Drilled - 74.8 1.07 1.5223/4 and 3/16 76.6 1.10 1.449
13/16 and 2/16 76.9 1.10 1.4927/8 and 1/16 78.2 1.12 1.521
Punched - 66.1 0.95 0.348
1 - Net Section Stress = σult = Pult/Anet
2 - Strength Ratio SR = σult/σu, coupon
3 - Usable Elongation = δ at Pult
Reamed
Table 5.24: Reaming Investigation Results (Grade 50, 1/2 Inch Thickness,
15/16 Inch Diameter Hole Size)
Grade 50 Specimens:
Method Punch Diameter and Amount of Reaming (in.) Net Section Stress1 (ksi) Strength Ratio2 Usable Elongation3 (in.)
Drilled - 83.8 1.11 1.0853/4 and 3/16 86.3 1.14 1.035
13/16 and 2/16 85.6 1.13 1.0307/8 and 1/16 86.1 1.14 1.065
Punched - 79.2 1.05 0.501
1 - Net Section Stress = σult = Pult/Anet
2 - Strength Ratio SR = σult/σu, coupon
3 - Usable Elongation = δ at Pult
Reamed
Test results tended to show no significant correlation between amount of
reaming and strength ratio or usable elongation. This was true for both grades of
steel examined. Moreover, test results show strength ratio and usable elongation
improvements from reaming relative to punching, and even relative to drilling.
92
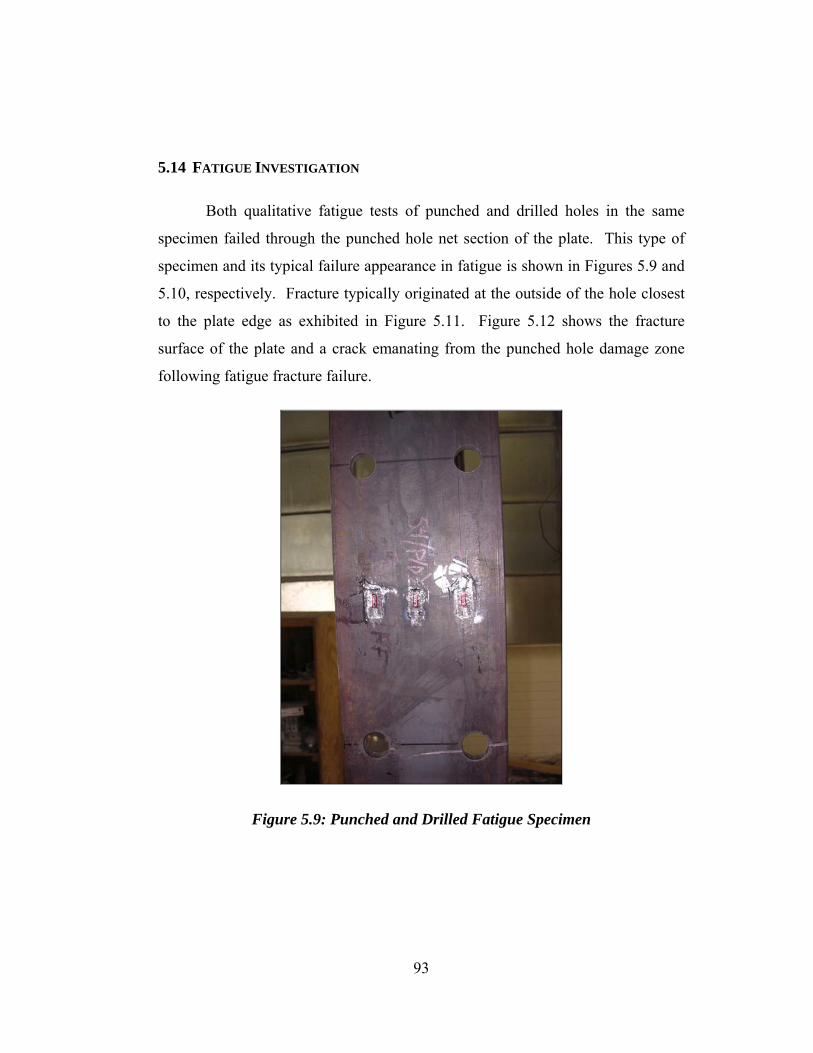
5.14 FATIGUE INVESTIGATION
Both qualitative fatigue tests of punched and drilled holes in the same
specimen failed through the punched hole net section of the plate. This type of
specimen and its typical failure appearance in fatigue is shown in Figures 5.9 and
5.10, respectively. Fracture typically originated at the outside of the hole closest
to the plate edge as exhibited in Figure 5.11. Figure 5.12 shows the fracture
surface of the plate and a crack emanating from the punched hole damage zone
following fatigue fracture failure.
Figure 5.9: Punched and Drilled Fatigue Specimen
93
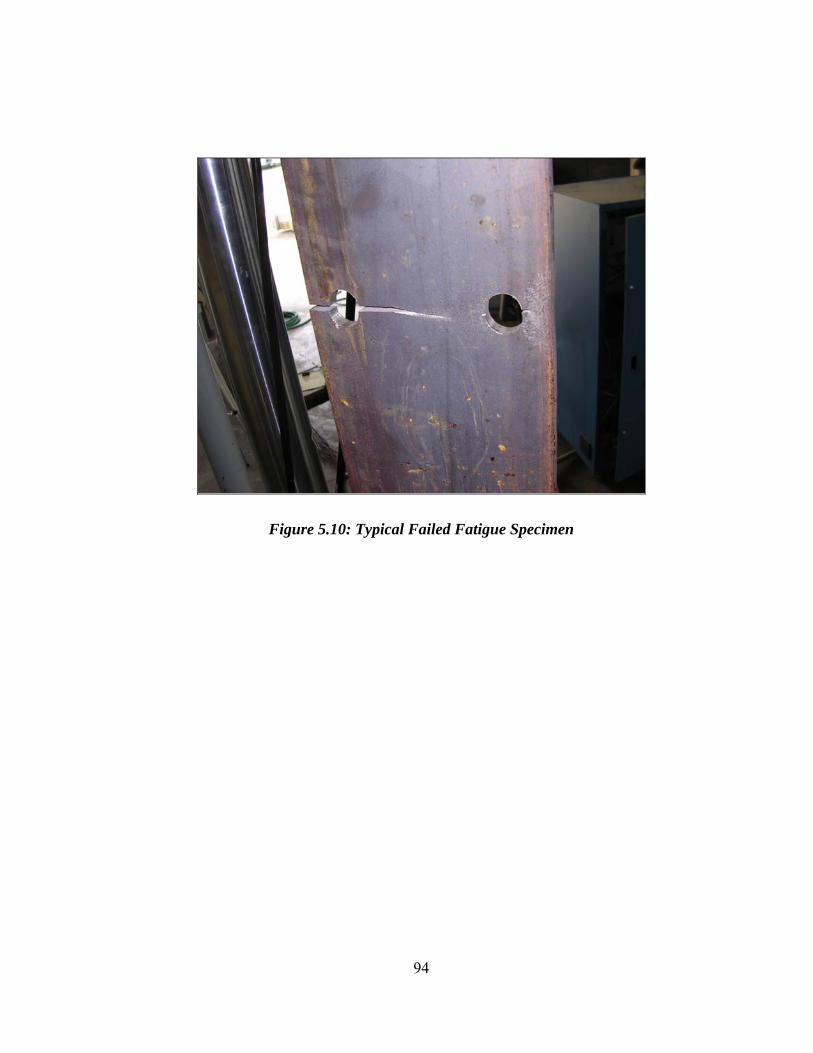
Figure 5.10: Typical Failed Fatigue Specimen
94
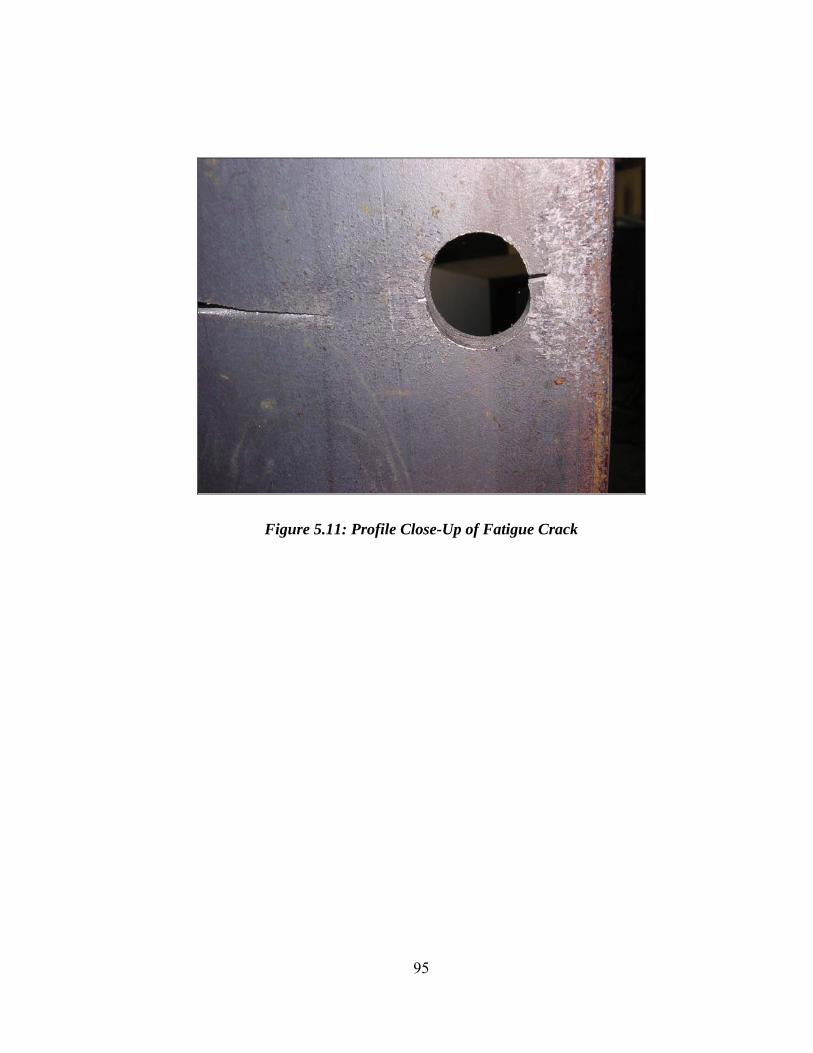
Figure 5.11: Profile Close-Up of Fatigue Crack
95
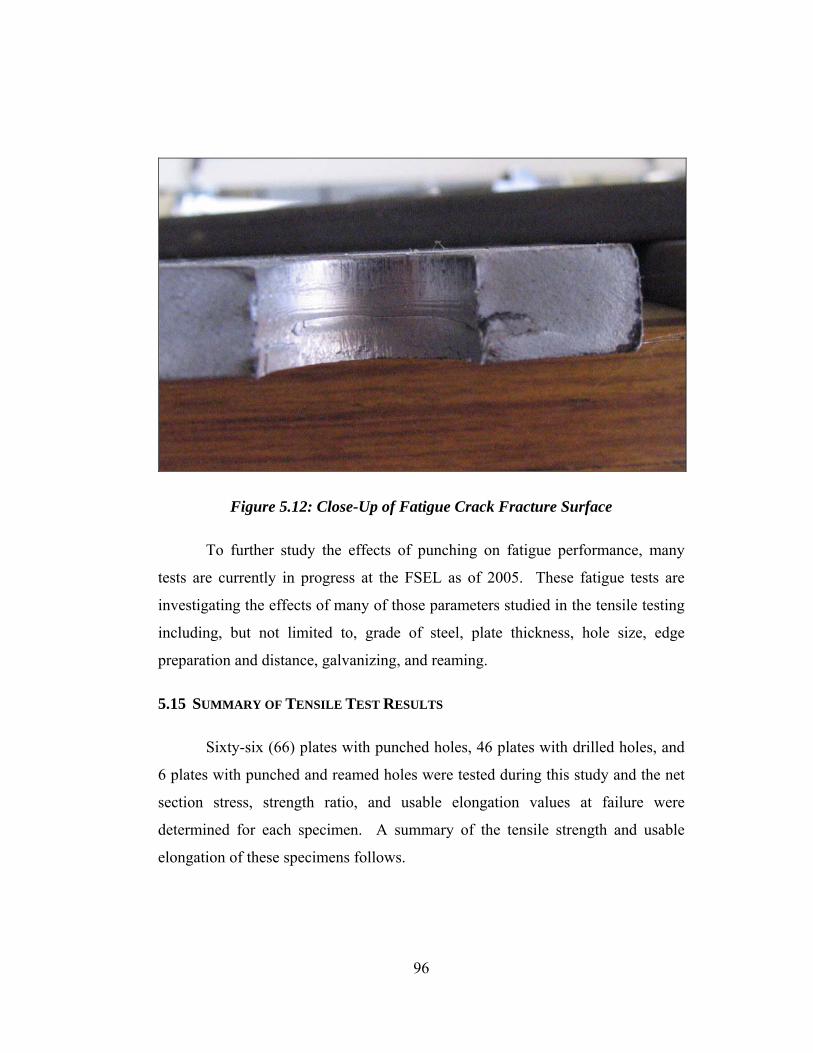
Figure 5.12: Close-Up of Fatigue Crack Fracture Surface
To further study the effects of punching on fatigue performance, many
tests are currently in progress at the FSEL as of 2005. These fatigue tests are
investigating the effects of many of those parameters studied in the tensile testing
including, but not limited to, grade of steel, plate thickness, hole size, edge
preparation and distance, galvanizing, and reaming.
5.15 SUMMARY OF TENSILE TEST RESULTS
Sixty-six (66) plates with punched holes, 46 plates with drilled holes, and
6 plates with punched and reamed holes were tested during this study and the net
section stress, strength ratio, and usable elongation values at failure were
determined for each specimen. A summary of the tensile strength and usable
elongation of these specimens follows.
96

The following current AASHTO LRFD Bridge Design Specifications
sections were utilized in analyzing specimens (note that all reduction and
resistance factors were taken as 1.0 since only the method of hole preparation was
being compared):
• 6.8.2 Tensile Resistance
gyynyyr AFPP φφ == (6.1)
UAFPP nuunuur φφ == (6.2)
where Pny = nominal tensile resistance for yielding in gross section
Fy = yield strength based on coupon tests
Ag = gross cross-sectional area of the member
Pnu = nominal tensile resistance for fracture in net section
Fu = tensile strength based on coupon tests
An = net area of the member as specified in Section 6.8.3
U = reduction factor to account for shear lag (U = 0.85 for these
connections, taken as 1.0 in this comparison of results)
φy = resistance factor for yielding of tension members (taken as
1.0 in this comparison of results)
φu = resistance factor for fracture of tension members (taken as
1.0 in this comparison of results)
97

• 6.8.3 Net Area
Net area, An, of a member is the sum of the products of thickness and the
smallest net width of each element. The width of each standard bolt hole
shall be taken as the nominal diameter of the hole plus 1/16 inch (taken as
actual hole diameter in all net section calculations in this analysis).
The net width for each chain shall be determined by subtracting from the
width of the element the sum of the widths of all holes in the chain and
adding the quantity s2/4g for each space between consecutive holes in the
chain, where:
s = pitch of any two consecutive holes
g = gage of the same two holes
• 6.13.4 Block Shear Rupture Resistance
If Atn ≥ 0.58 Avn, then:
( )tnuvgybsr AFAFR += 58.0φ (6.3)
otherwise:
( )tgyvnubsr AFAFR += 58.0φ (6.4)
where Avg = gross area along the plane resisting shear stress
Avn = net area along the plane resisting shear stress
Atg = gross area along the plane resisting tension stress
Atn = net area along the plane resisting tension stress
Fy = specified minimum yield strength of the connected material
Fu = specified minimum tensile strength of the connection material
φbs = resistance factor for block shear (not used in order to obtain
the most accurate comparisons)
98
• 6.13.5 Connection Elements
The factored resistance in tension shall be taken as the least of the values
given by Section 6.8.2 for yielding and fracture, respectively, or the block
shear rupture resistance specified in Section 6.13.4.
Using these specification details on the specimens, a current specification
limit state was calculated based on a governing tension (yield or fracture) failure
or a block shear (shear or tension) failure. Note that the nominal hole diameter
used was that which was measured following hole preparation (i.e. measured hole
diameter was used instead of a nominal bolt diameter plus 1/8 inch).
In compiling all test data, a comparison between the FSEL specimen
experimental strength limit state versus the current AASHTO Design
specification strength limit state is illustrated in Figure 5.13. The 45 degree line
shown in the plot signifies equal experimental and specification limit states.
Whereas points above this line indicate experimental results that exceed
specification limits, points below this line indicate experimental results that are
lower than specification limits. Points falling below this line signify non-
conservative specification limit states. As seen in Figure 5.13, the drilled and
reamed hole specimens generally performed better than the punched hole
specimens, 43% of which fell below the 45 degree line.
99
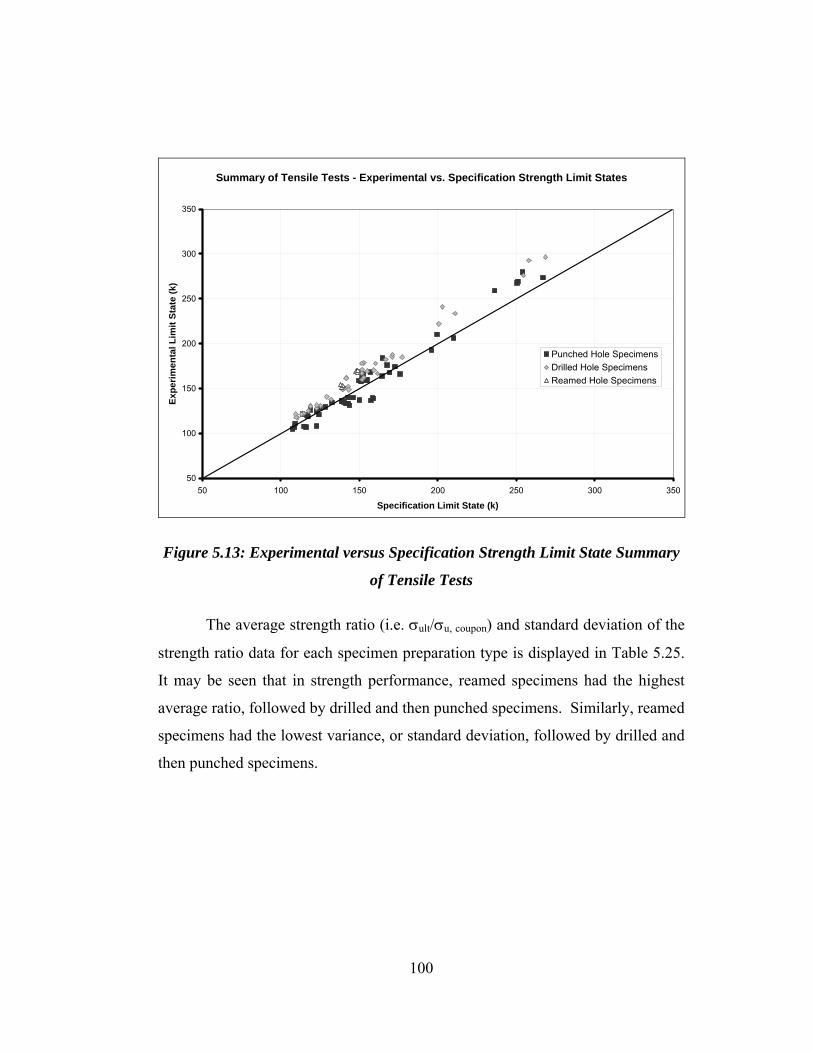
Summary of Tensile Tests - Experimental vs. Specification Strength Limit States
50
100
150
200
250
300
350
50 100 150 200 250 300 350
Specification Limit State (k)
Expe
rimen
tal L
imit
Stat
e (k
)
Punched Hole SpecimensDrilled Hole SpecimensReamed Hole Specimens
Figure 5.13: Experimental versus Specification Strength Limit State Summary
of Tensile Tests
The average strength ratio (i.e. σult/σu, coupon) and standard deviation of the
strength ratio data for each specimen preparation type is displayed in Table 5.25.
It may be seen that in strength performance, reamed specimens had the highest
average ratio, followed by drilled and then punched specimens. Similarly, reamed
specimens had the lowest variance, or standard deviation, followed by drilled and
then punched specimens.
100
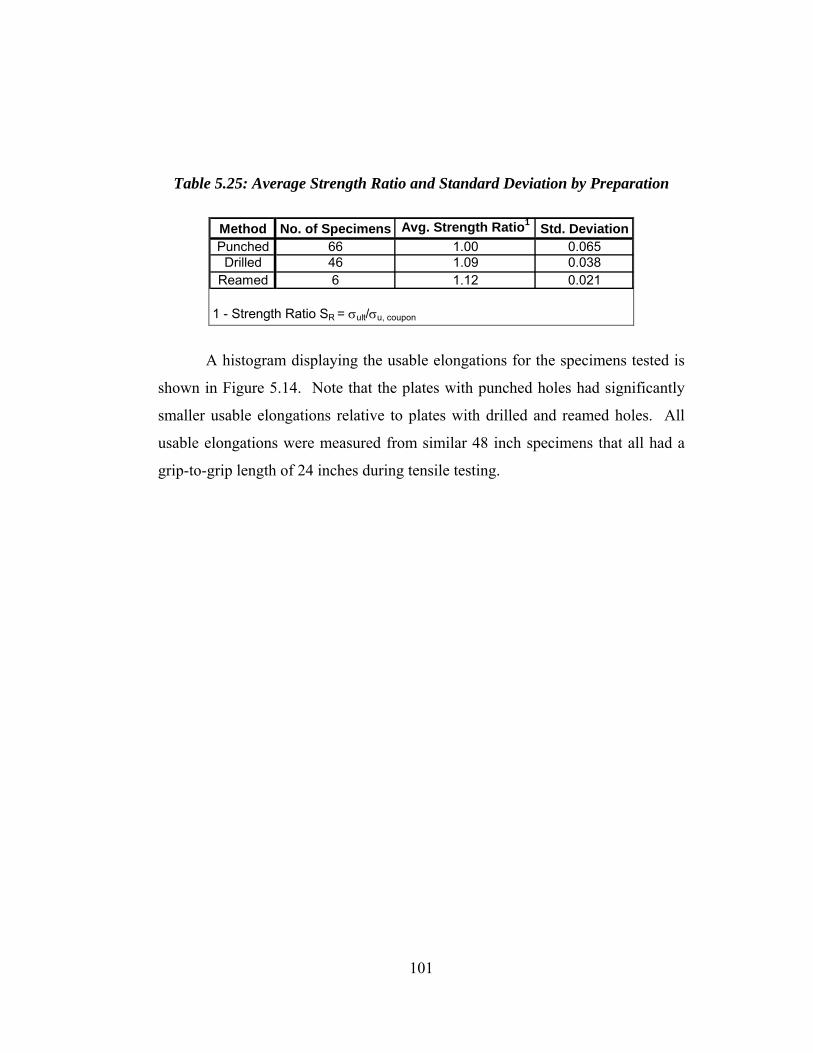
Table 5.25: Average Strength Ratio and Standard Deviation by Preparation
Avg. Strength Ratio1Method No. of Specimens Std. DeviationPunched 66 1.00 0.065Drilled 46 1.09 0.038
Reamed 6 1.12 0.021
1 - Strength Ratio SR = σult/σu, coupon
A histogram displaying the usable elongations for the specimens tested is
shown in Figure 5.14. Note that the plates with punched holes had significantly
smaller usable elongations relative to plates with drilled and reamed holes. All
usable elongations were measured from similar 48 inch specimens that all had a
grip-to-grip length of 24 inches during tensile testing.
101
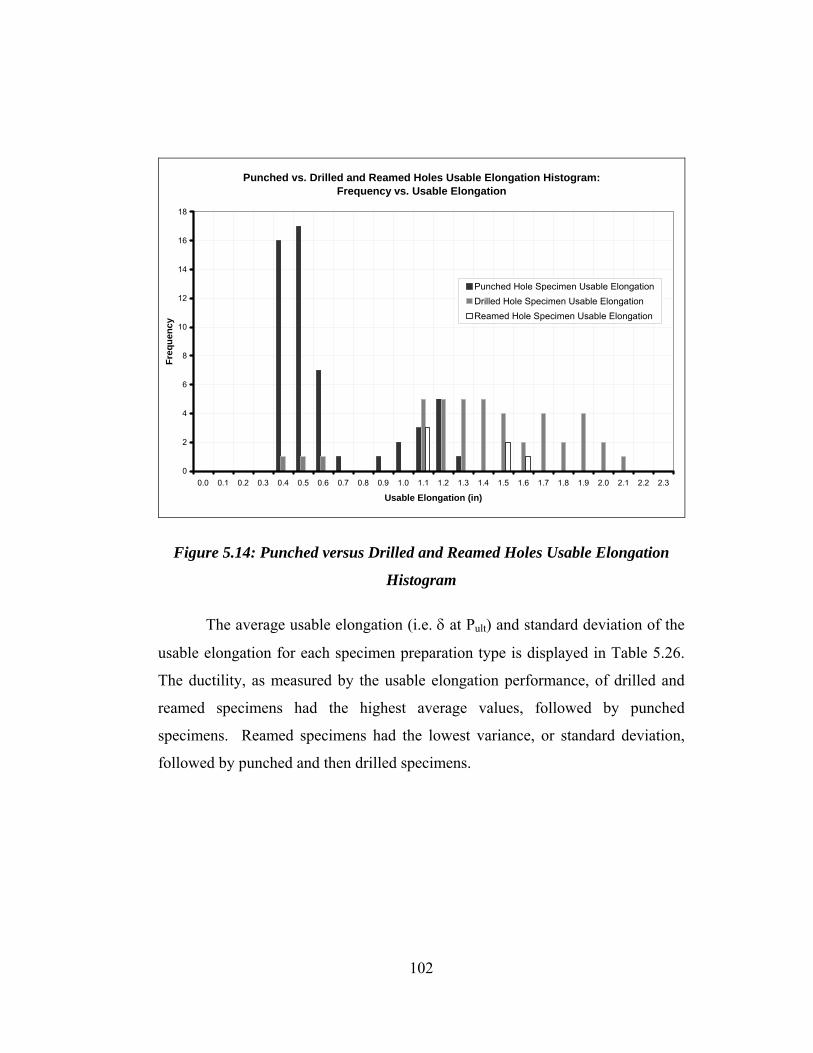
Punched vs. Drilled and Reamed Holes Usable Elongation Histogram: Frequency vs. Usable Elongation
0
2
4
6
8
10
12
14
16
18
0.0 0.1 0.2 0.3 0.4 0.5 0.6 0.7 0.8 0.9 1.0 1.1 1.2 1.3 1.4 1.5 1.6 1.7 1.8 1.9 2.0 2.1 2.2 2.3
Usable Elongation (in)
Freq
uenc
y
Punched Hole Specimen Usable ElongationDrilled Hole Specimen Usable ElongationReamed Hole Specimen Usable Elongation
Figure 5.14: Punched versus Drilled and Reamed Holes Usable Elongation
Histogram
The average usable elongation (i.e. δ at Pult) and standard deviation of the
usable elongation for each specimen preparation type is displayed in Table 5.26.
The ductility, as measured by the usable elongation performance, of drilled and
reamed specimens had the highest average values, followed by punched
specimens. Reamed specimens had the lowest variance, or standard deviation,
followed by punched and then drilled specimens.
102

Table 5.26: Average Usable Elongation and Standard Deviation by Preparation
Type
Avg. Usable Elongation2 (in.)Method No. of Specimens Std. DeviationPunched 66 0.582 0.285
Drilled 46 1.374 0.390Reamed 6 1.264 0.243
2 - Usable Elongation = δ at Pult
Of note, there were 41 replicate pairs of punched and drilled hole plates
from similar plate heats that were tensile tested to failure during this study. These
replicate specimens allow for a direct comparison of punched and drilled hole
specimen performance relative to one another. In these comparisons, the punched
strength ratio divided by the drilled strength ratio may be defined as:
⎟⎟⎠
⎞⎜⎜⎝
⎛
⎟⎟⎠
⎞⎜⎜⎝
⎛
=⎟⎠⎞
⎜⎝⎛
drillednet
drilledult
punchednet
punchedult
ratio
AP
AP
DP
,
,
,
,
(6.3)
Figure 5.15 shows a histogram comparing punched and drilled strength ratios and
Figure 5.16 shows a histogram comparing punched and drilled usable elongations.
103
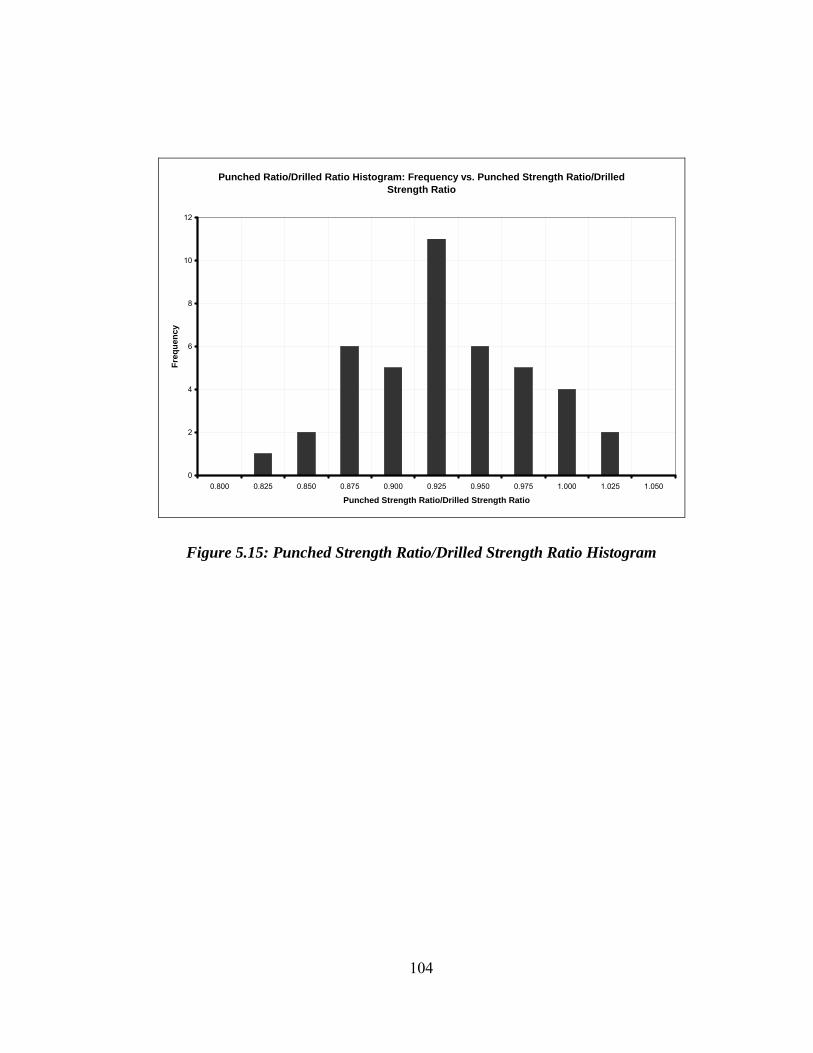
Punched Ratio/Drilled Ratio Histogram: Frequency vs. Punched Strength Ratio/Drilled Strength Ratio
0
2
4
6
8
10
12
0.800 0.825 0.850 0.875 0.900 0.925 0.950 0.975 1.000 1.025 1.050
Punched Strength Ratio/Drilled Strength Ratio
Freq
uenc
y
Figure 5.15: Punched Strength Ratio/Drilled Strength Ratio Histogram
104
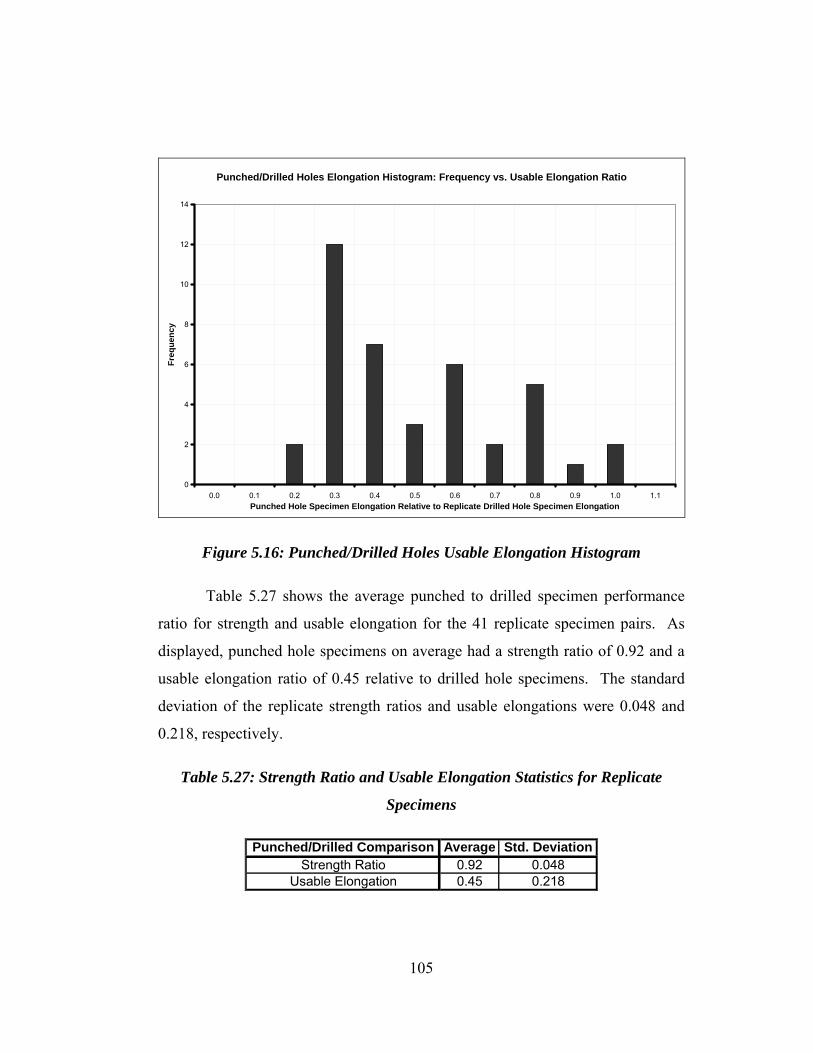
Punched/Drilled Holes Elongation Histogram: Frequency vs. Usable Elongation Ratio
0
2
4
6
8
10
12
14
0.0 0.1 0.2 0.3 0.4 0.5 0.6 0.7 0.8 0.9 1.0 1.1Punched Hole Specimen Elongation Relative to Replicate Drilled Hole Specimen Elongation
Freq
uenc
y
Figure 5.16: Punched/Drilled Holes Usable Elongation Histogram
Table 5.27 shows the average punched to drilled specimen performance
ratio for strength and usable elongation for the 41 replicate specimen pairs. As
displayed, punched hole specimens on average had a strength ratio of 0.92 and a
usable elongation ratio of 0.45 relative to drilled hole specimens. The standard
deviation of the replicate strength ratios and usable elongations were 0.048 and
0.218, respectively.
Table 5.27: Strength Ratio and Usable Elongation Statistics for Replicate
Specimens
Punched/Drilled Comparison Average Std. DeviationStrength Ratio 0.92 0.048
Usable Elongation 0.45 0.218
105
Out of the many parameters that were studied in this investigation in
addition to the method of hole preparation, only three displayed some influence
on the strength ratio and usable elongation of specimens. These parameters
include grade of steel, hole size, and plate thickness. In all tests examining these
parameters, punched hole specimens had a smaller average strength ratio and
average usable elongation relative to their drilled hole replicates. With respect to
grade of steel, the difference between punched and drilled hole performance was
most notable in the grade 36 specimens (average punched and drilled strength
ratios: 0.95 and 1.10, average punched and drilled usable elongation: 0.357 and
1.646). With respect to hole size, test results showed correlation between an
increase in hole size to plate thickness ratio with a decrease in average usable
elongation (see Tables 5.9 and 5.10). And lastly, with respect to plate thickness,
test results showed a slight correlation between increasing average strength ratio
with an increase in plate thickness (see Table 5.11).
The remaining parameters studied in this investigation displayed little to
no influence on the strength ratio and usable elongation of specimens. These
parameters included edge distance and edge preparation, punching clearance,
punching operation, galvanizing, and amount of reaming.
Based on the performance of punched holes relative to drilled holes in the
qualitative fatigue tests in this study, further fatigue testing is currently in
progress at the FSEL.
Furthermore, basic material properties examined in chemistry, coupon,
and Charpy testing may have also played a significant role in the performance of
some of the plate heats as previously noted.
106
5.16 ADDITIONAL CONSIDERATIONS
During this investigation’s review of previous research, experiment
design, and testing and analysis of results, a few additional considerations were
brought to the attention of researchers at the FSEL. These considerations include,
but are not limited to, investigation of high performance grades of steel,
weathering steel, slotted holes, and connections.
Although not frequently used for secondary members due to their large
thicknesses, high performance steels may be candidates for punching if leftover,
or “scrap,” material is used for secondary members during bridge fabrication. For
this reason, it may be useful to investigate the tensile and fatigue performance of
punched high performance steels such as grade 70 materials that are currently
being utilized in hybrid bridge design.
The performance of weathering steel and plate with slotted holes are two
additional parameters scheduled for study at the FSEL as of 2005. Since
secondary members may be composed of weathering steel or plate with slotted
holes, plates with these two parameters are candidates for hole punching.
Ultimately, connections will be tensile and fatigue tested at the FSEL to
investigate the performance of bolted double shear lap splice specimens with
different types of hole preparation. These tests will serve as a model for studying
the influence of hole preparation on connections between secondary members.
One interesting consideration may be the friction force of a tightened bolt against
a plate and its role in distributing load during tensile and fatigue testing.
107

6. CONCLUSIONS
Punching is a quick, economical, and versatile method utilized in the
fabrication of metal. Punching processes may be directly applied to the
fabrication of structural steel intended for use in bridges, buildings, and a variety
of structures. Typically, punching is employed in the fabrication of structural
elements related to connections, such as members, cross-frames, and gusset plates
on bridges.
AASHTO steel bridge specifications do not allow full size punched holes
in primary load carrying members. Instead, holes are required to be formed by
full-size drilling or reaming following punching. Furthermore, other punching
limitations include thickness limits depending on grade of steel.
Previous research has provided information on the general behavior and
ultimate strength of connections with variables such as hole preparation.
University of Illinois at Urbana-Champaign researchers found that tension
members with punched holes commonly had a tensile strength that was 10 to 15
percent less than members with drilled holes. Similarly, strength value
differences of 6 to 15 percent were determined during research at both The
University of Texas at Austin and the University of Cincinnati.
Sixty-six (66) plates with punched holes, 46 plates with drilled holes, and
6 plates with punched and reamed holes were tensile tested at the FSEL during
this study. During testing, the net section stress, strength ratio, and usable
elongation values at failure have been determined for each specimen variation.
These specimen variations included steel type, temperature, hole size, plate
thickness, edge distance, edge preparation, punching clearance, punching
operation, galvanizing, and amount of reaming.
108
Overall, in strength performance, reamed specimens had the highest
average strength ratio (1.12), followed by drilled (1.09) and then punched (1.00)
specimens. Similarly, reamed specimens had the lowest standard deviation of
strength ratios (0.021), followed by drilled (0.038) and then punched specimens
(0.065). In usable elongation performance, drilled and reamed specimens had the
highest average elongation values (1.374 inches and 1.264 inches), followed by
punched specimens (0.582 inches). Again, reamed specimens had the lowest
standard deviation of usable elongations (0.243 inches), followed by punched
(0.285 inches) and then drilled specimens (0.390 inches).
In order to most directly compare punched and drilled hole preparation, 41
replicate punched and drilled hole plates were tensile tested to failure during this
study. Punched hole specimens on average had a strength ratio of 0.92 and a
usable elongation ratio of 0.45 relative to drilled hole specimens. The standard
deviation of the replicate strength ratios and usable elongations were 0.048 and
0.218, respectively.
Based on the strength performance of punched hole specimens (1.00
average strength ratio, 0.065 standard deviation), and particularly relative to
drilled hole specimens (0.92 punched-to-drilled strength ratio, 0.048 standard
deviation), a capacity reduction of 0.85 is recommended for punched plate used in
steel bridge connections. It is important to consider the strength performance of
punched plate relative to specification limit states as well as relative to the
performance of drilled plate since current AASHTO specifications for strength
performance are calibrated with drilled holes. In using a capacity reduction (φ) of
0.85 for punched holes, the strength performance of over 95% of the punched
hole specimens in this study is conservative relative to their current specification
limit state. Furthermore, the strength performance of over 90% of these
109
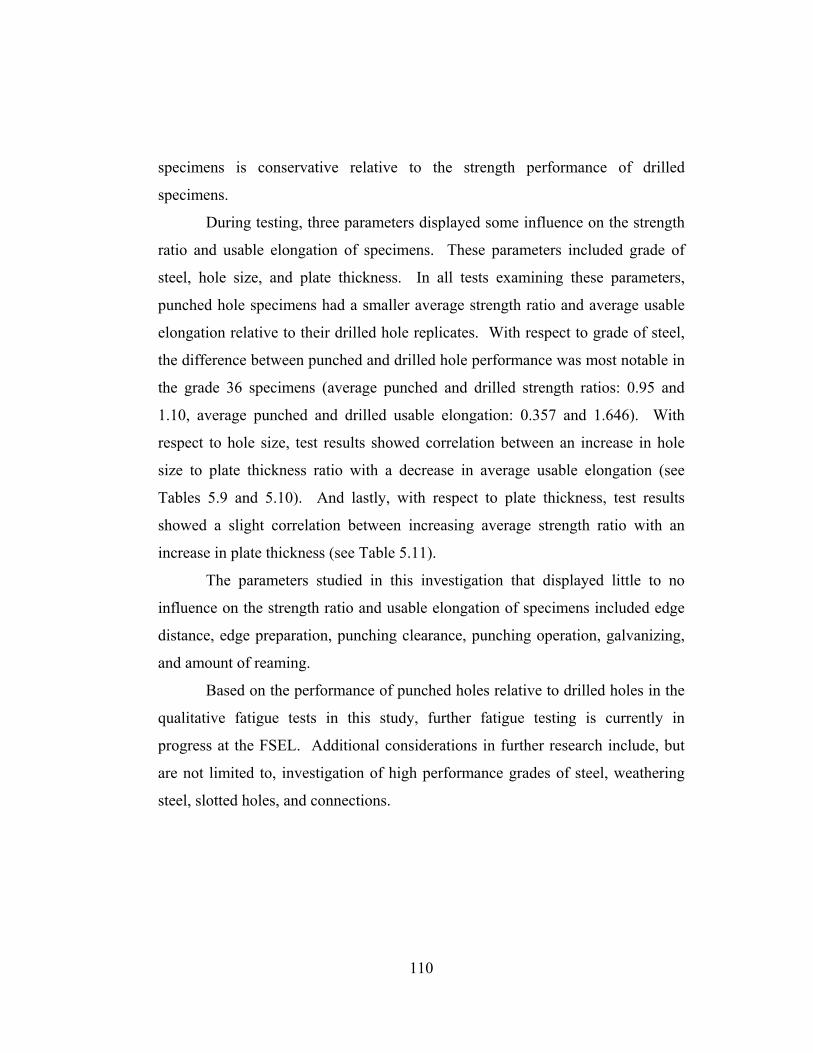
specimens is conservative relative to the strength performance of drilled
specimens.
During testing, three parameters displayed some influence on the strength
ratio and usable elongation of specimens. These parameters included grade of
steel, hole size, and plate thickness. In all tests examining these parameters,
punched hole specimens had a smaller average strength ratio and average usable
elongation relative to their drilled hole replicates. With respect to grade of steel,
the difference between punched and drilled hole performance was most notable in
the grade 36 specimens (average punched and drilled strength ratios: 0.95 and
1.10, average punched and drilled usable elongation: 0.357 and 1.646). With
respect to hole size, test results showed correlation between an increase in hole
size to plate thickness ratio with a decrease in average usable elongation (see
Tables 5.9 and 5.10). And lastly, with respect to plate thickness, test results
showed a slight correlation between increasing average strength ratio with an
increase in plate thickness (see Table 5.11).
The parameters studied in this investigation that displayed little to no
influence on the strength ratio and usable elongation of specimens included edge
distance, edge preparation, punching clearance, punching operation, galvanizing,
and amount of reaming.
Based on the performance of punched holes relative to drilled holes in the
qualitative fatigue tests in this study, further fatigue testing is currently in
progress at the FSEL. Additional considerations in further research include, but
are not limited to, investigation of high performance grades of steel, weathering
steel, slotted holes, and connections.
110

APPENDIX
Using current AASHTO specification details on the UIUC specimens
described in section 2.3, a limit state was calculated based on a governing tension
(yield or fracture) failure or a block shear (shear or tension) failure. Tables A1
through A4 show the limit state calculations for each type of UIUC specimen.
111

Table A.1: Current Limit States for UIUC Specimen SA
Specimen Type: SA (4 angles)Dimensions: 3.5
3.50.4375 (7/16")
Hole Size (in): 0.8125 (13/16")Hole Size + 1/16 (in): 0.875 (14/16")Gross Area (in2): 11.48Net Area (in2): 8.86Net Areamodern (+1/16 in. hole) (in
2): 8.64Net Areaw/o stagger (in
2): 8.61Net Areamodern w/o stagger (in
2): 8.42
Fy (ksi) 43.1Fu (ksi) 67.0xbar (in) 0.41L (in) 15(1-xbar/L) 0.97(1-xbar/L)spec 0.85Aeff net (in
2) 7.53Aeff net modern (in
2) 7.34g (in) 1.5s (in) 17#holesg 0.5#holess 6.5
Tensile Limit States: Block Shear Limit States (Fracture):
Yield (k) 494.8 AGT (in2) 0.656(FyAg) ANT (in2) 0.479Fracture (k) ANT modern (in
2) 0.465(FuAn) 504.6 AGV (in2) 7.438(FuAn)modern 492.0 ANV (in2) 5.127
ANV modern (in2) 4.949
Shear (k)(.6FuANV + FyAGT) 937.6(.6FuANV + FyAGT)modern 909.0Tensile (k)(.6FyAGV + FuANT) 897.6(.6FyAGV + FuANT)modern 893.9
Test Results (k): check:Punched 483.8, 476.5, 481.1, 482.0 .6FyAGV ≤ .6FuANV?Drilled 507.6, 497.2, 559.0, 504.1 192.3 199.0 ☺
112
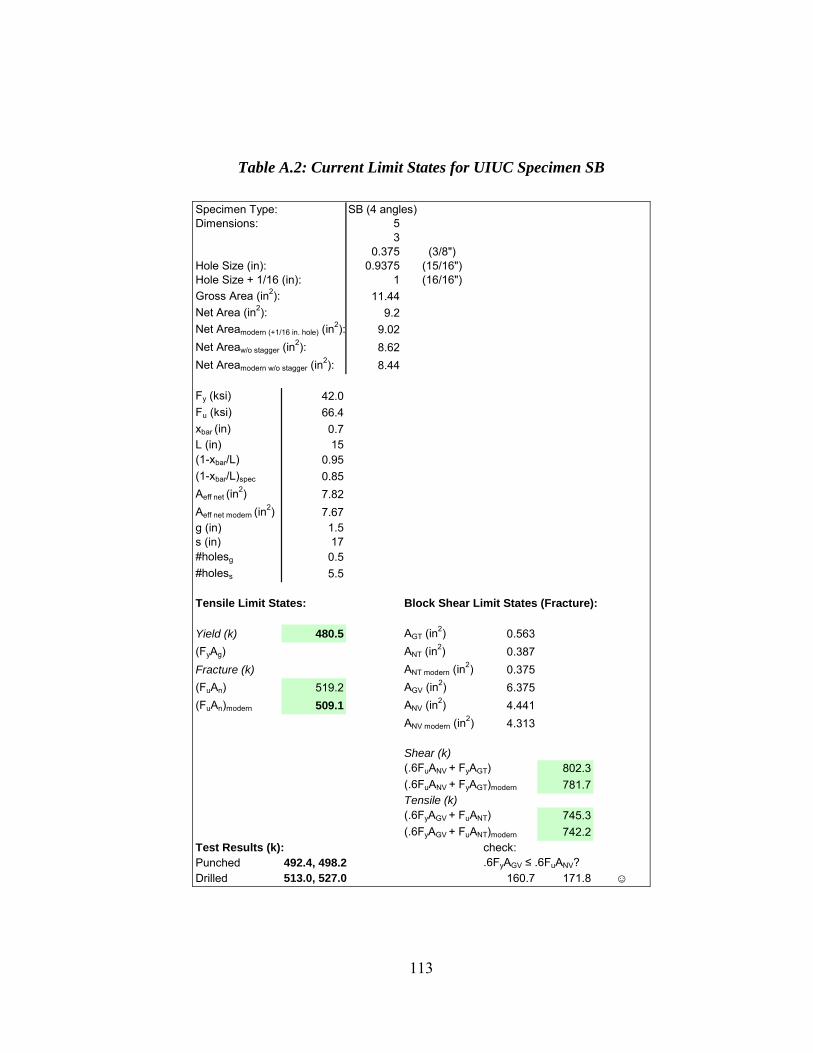
Table A.2: Current Limit States for UIUC Specimen SB
Specimen Type: SB (4 angles)Dimensions: 5
30.375 (3/8")
Hole Size (in): 0.9375 (15/16")Hole Size + 1/16 (in): 1 (16/16")Gross Area (in2): 11.44Net Area (in2): 9.2Net Areamodern (+1/16 in. hole) (in
2): 9.02Net Areaw/o stagger (in
2): 8.62Net Areamodern w/o stagger (in
2): 8.44
Fy (ksi) 42.0Fu (ksi) 66.4xbar (in) 0.7L (in) 15(1-xbar/L) 0.95(1-xbar/L)spec 0.85Aeff net (in
2) 7.82Aeff net modern (in
2) 7.67g (in) 1.5s (in) 17#holesg 0.5#holess 5.5
Tensile Limit States: Block Shear Limit States (Fracture):
Yield (k) 480.5 AGT (in2) 0.563(FyAg) ANT (in2) 0.387Fracture (k) ANT modern (in
2) 0.375(FuAn) 519.2 AGV (in2) 6.375(FuAn)modern 509.1 ANV (in2) 4.441
ANV modern (in2) 4.313
Shear (k)(.6FuANV + FyAGT) 802.3(.6FuANV + FyAGT)modern 781.7Tensile (k)(.6FyAGV + FuANT) 745.3(.6FyAGV + FuANT)modern 742.2
Test Results (k): check:Punched 492.4, 498.2 .6FyAGV ≤ .6FuANV?Drilled 513.0, 527.0 160.7 171.8 ☺
113
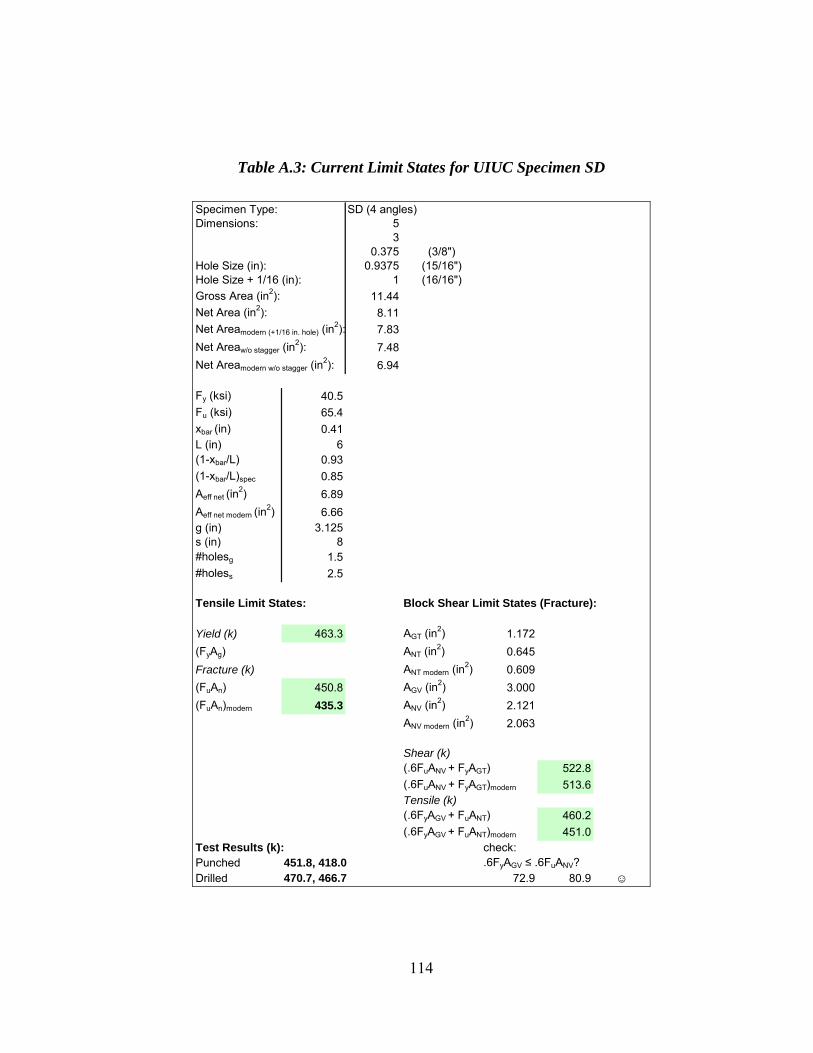
Table A.3: Current Limit States for UIUC Specimen SD
Specimen Type: SD (4 angles)Dimensions: 5
30.375 (3/8")
Hole Size (in): 0.9375 (15/16")Hole Size + 1/16 (in): 1 (16/16")Gross Area (in2): 11.44Net Area (in2): 8.11Net Areamodern (+1/16 in. hole) (in
2): 7.83Net Areaw/o stagger (in
2): 7.48Net Areamodern w/o stagger (in
2): 6.94
Fy (ksi) 40.5Fu (ksi) 65.4xbar (in) 0.41L (in) 6(1-xbar/L) 0.93(1-xbar/L)spec 0.85Aeff net (in
2) 6.89Aeff net modern (in
2) 6.66g (in) 3.125s (in) 8#holesg 1.5#holess 2.5
Tensile Limit States: Block Shear Limit States (Fracture):
Yield (k) 463.3 AGT (in2) 1.172
(FyAg) ANT (in2) 0.645
Fracture (k) ANT modern (in2) 0.609
(FuAn) 450.8 AGV (in2) 3.000(FuAn)modern 435.3 ANV (in2) 2.121
ANV modern (in2) 2.063
Shear (k)(.6FuANV + FyAGT) 522.8(.6FuANV + FyAGT)modern 513.6Tensile (k)(.6FyAGV + FuANT) 460.2(.6FyAGV + FuANT)modern 451.0
Test Results (k): check:Punched 451.8, 418.0 .6FyAGV ≤ .6FuANV?Drilled 470.7, 466.7 72.9 80.9 ☺
114
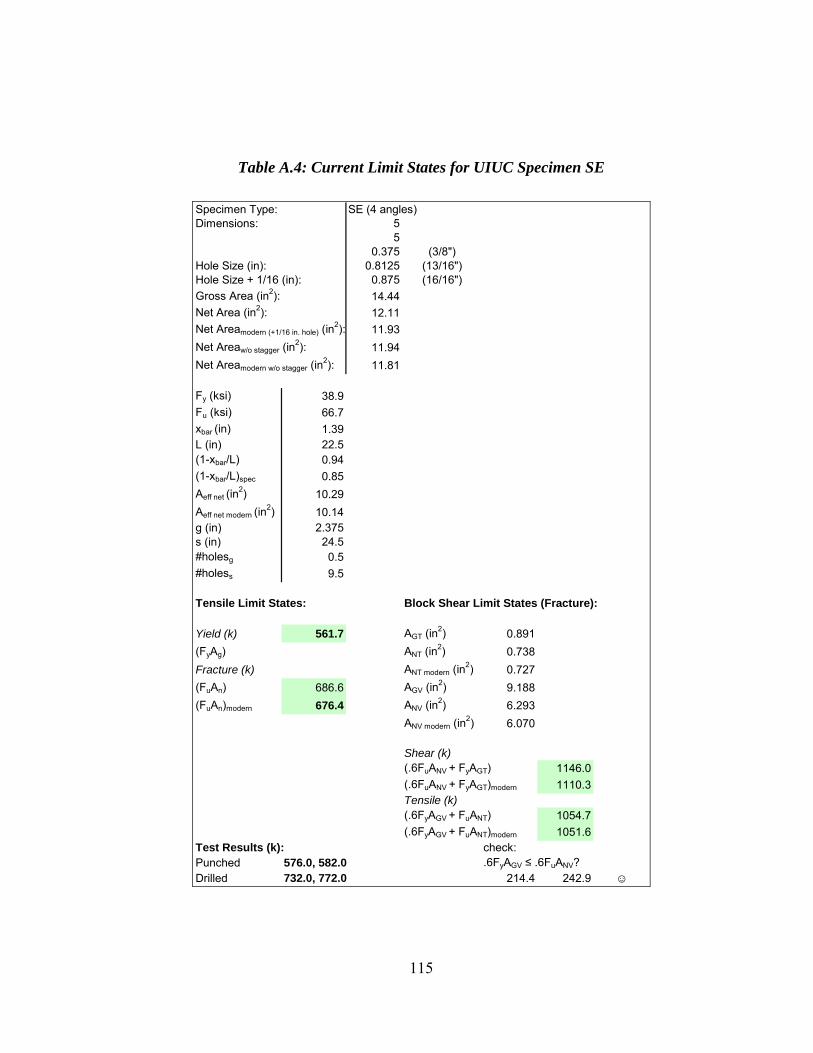
Table A.4: Current Limit States for UIUC Specimen SE
Specimen Type: SE (4 angles)Dimensions: 5
50.375 (3/8")
Hole Size (in): 0.8125 (13/16")Hole Size + 1/16 (in): 0.875 (16/16")Gross Area (in2): 14.44Net Area (in2): 12.11Net Areamodern (+1/16 in. hole) (in
2): 11.93Net Areaw/o stagger (in
2): 11.94Net Areamodern w/o stagger (in
2): 11.81
Fy (ksi) 38.9Fu (ksi) 66.7xbar (in) 1.39L (in) 22.5(1-xbar/L) 0.94(1-xbar/L)spec 0.85Aeff net (in
2) 10.29Aeff net modern (in
2) 10.14g (in) 2.375s (in) 24.5#holesg 0.5#holess 9.5
Tensile Limit States: Block Shear Limit States (Fracture):
Yield (k) 561.7 AGT (in2) 0.891(FyAg) ANT (in2) 0.738Fracture (k) ANT modern (in
2) 0.727(FuAn) 686.6 AGV (in2) 9.188(FuAn)modern 676.4 ANV (in2) 6.293
ANV modern (in2) 6.070
Shear (k)(.6FuANV + FyAGT) 1146.0(.6FuANV + FyAGT)modern 1110.3Tensile (k)(.6FyAGV + FuANT) 1054.7(.6FyAGV + FuANT)modern 1051.6
Test Results (k): check:Punched 576.0, 582.0 .6FyAGV ≤ .6FuANV?Drilled 732.0, 772.0 214.4 242.9 ☺
115
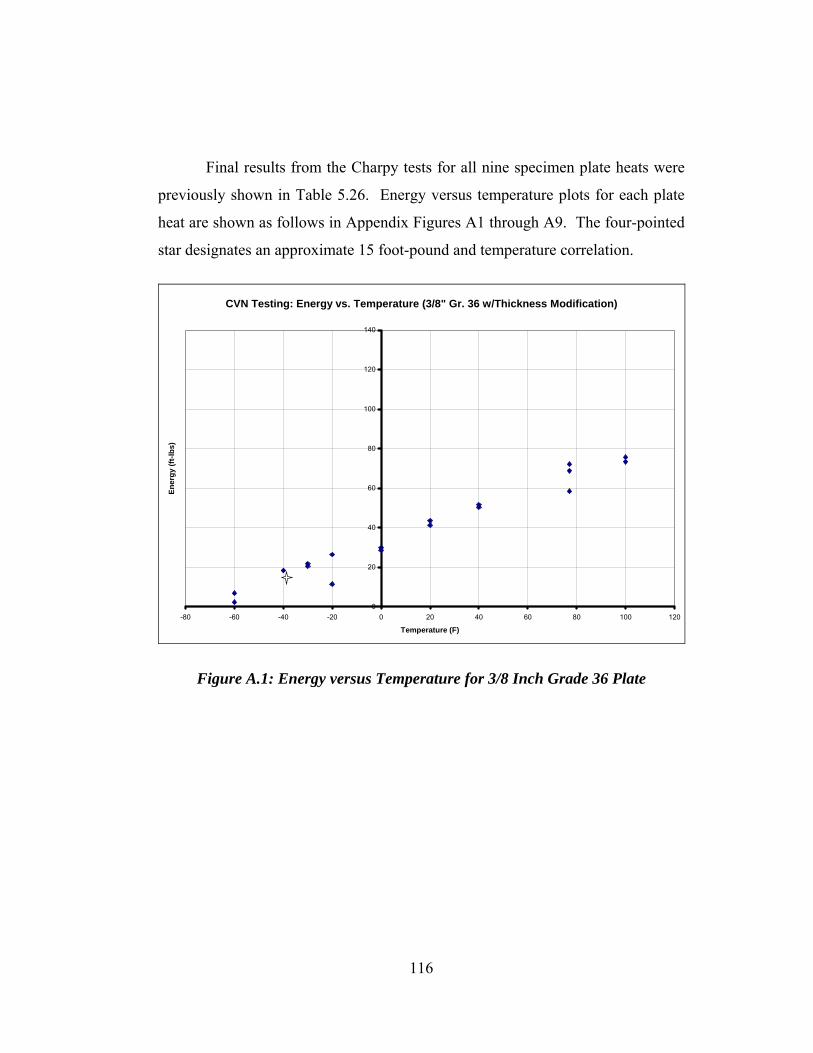
Final results from the Charpy tests for all nine specimen plate heats were
previously shown in Table 5.26. Energy versus temperature plots for each plate
heat are shown as follows in Appendix Figures A1 through A9. The four-pointed
star designates an approximate 15 foot-pound and temperature correlation.
CVN Testing: Energy vs. Temperature (3/8" Gr. 36 w/Thickness Modification)
0
20
40
60
80
100
120
140
-80 -60 -40 -20 0 20 40 60 80 100 120
Temperature (F)
Ener
gy (f
t-lbs
)
Figure A.1: Energy versus Temperature for 3/8 Inch Grade 36 Plate
116
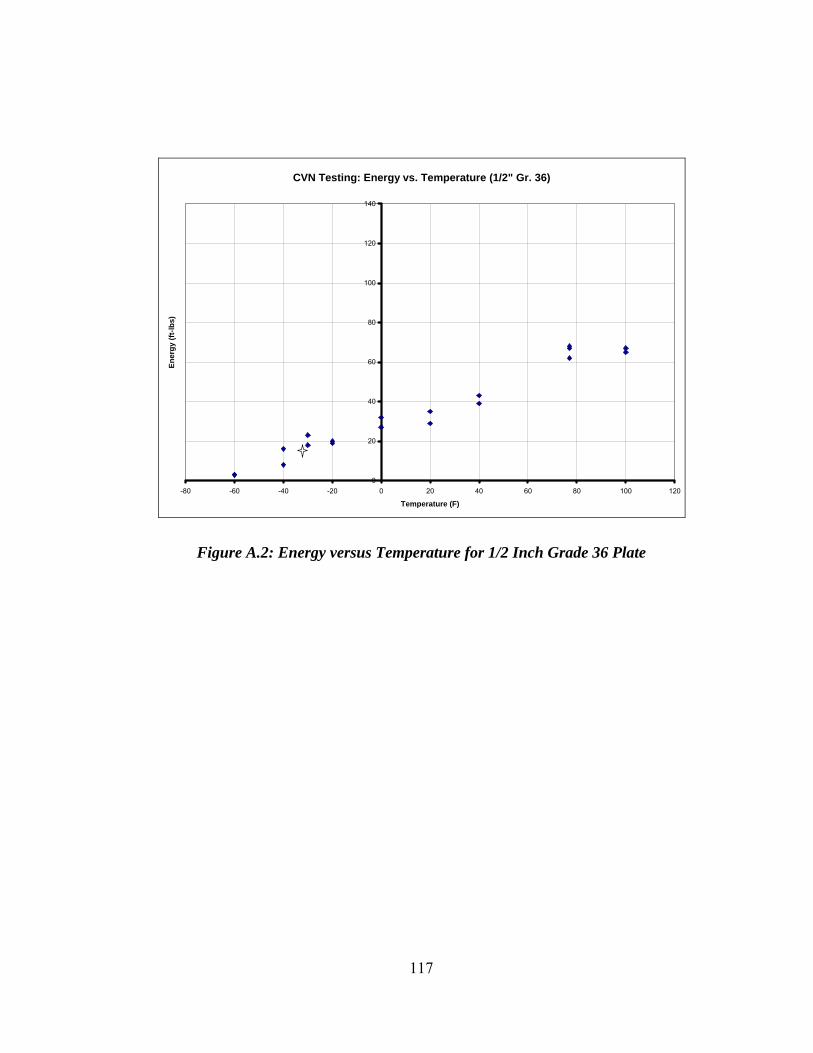
CVN Testing: Energy vs. Temperature (1/2" Gr. 36)
0
20
40
60
80
100
120
140
-80 -60 -40 -20 0 20 40 60 80 100 120
Temperature (F)
Ener
gy (f
t-lbs
)
Figure A.2: Energy versus Temperature for 1/2 Inch Grade 36 Plate
117
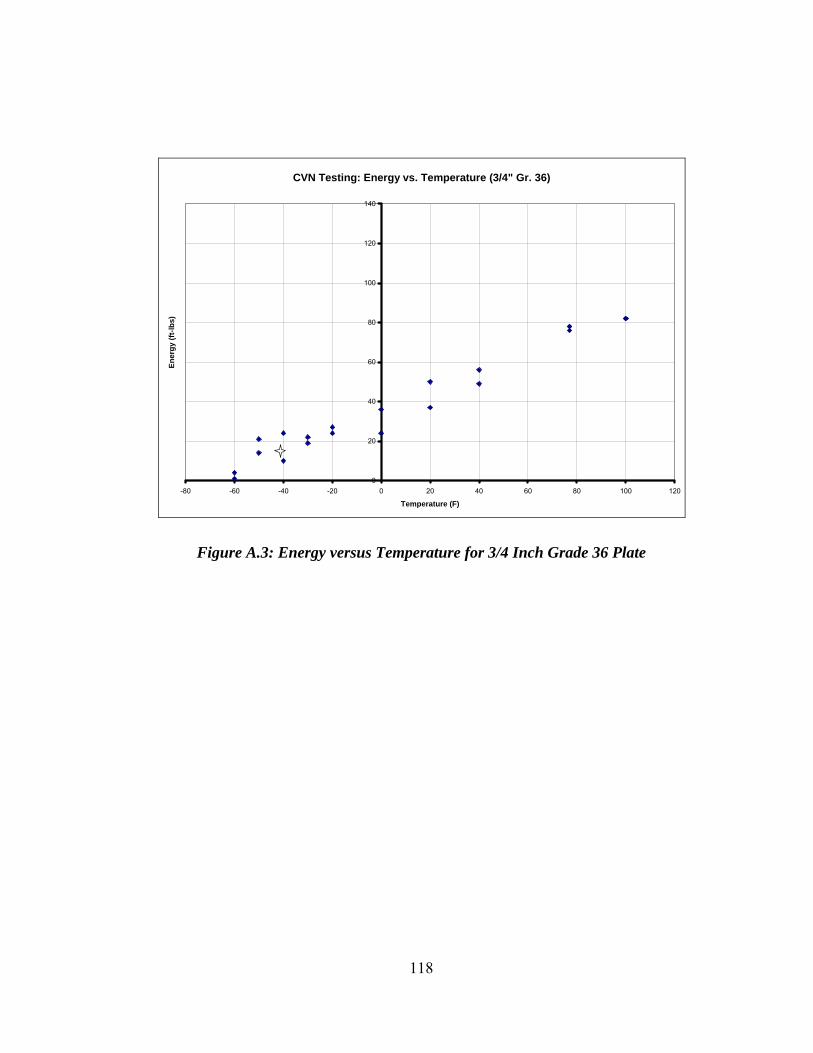
CVN Testing: Energy vs. Temperature (3/4" Gr. 36)
0
20
40
60
80
100
120
140
-80 -60 -40 -20 0 20 40 60 80 100 120
Temperature (F)
Ener
gy (f
t-lbs
)
Figure A.3: Energy versus Temperature for 3/4 Inch Grade 36 Plate
118
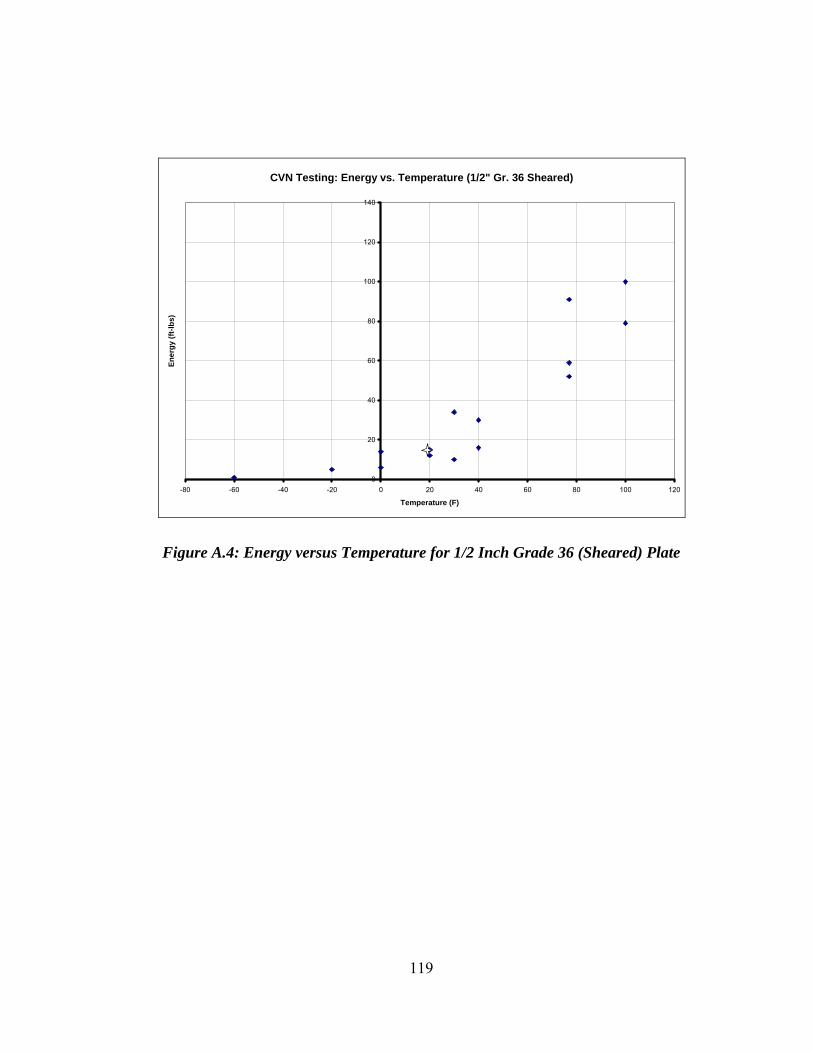
CVN Testing: Energy vs. Temperature (1/2" Gr. 36 Sheared)
0
20
40
60
80
100
120
140
-80 -60 -40 -20 0 20 40 60 80 100 120
Temperature (F)
Ener
gy (f
t-lbs
)
Figure A.4: Energy versus Temperature for 1/2 Inch Grade 36 (Sheared) Plate
119

CVN Testing: Energy vs. Temperature (3/8" Gr. 50 w/Thickness Modification)
0
20
40
60
80
100
120
140
-80 -60 -40 -20 0 20 40 60 80 100 120
Temperature (F)
Ener
gy (f
t-lbs
)
Figure A.5: Energy versus Temperature for 3/8 Inch Grade 50 Plate
120

CVN Testing: Energy vs. Temperature (1/2" Gr. 50)
0
20
40
60
80
100
120
140
-80 -60 -40 -20 0 20 40 60 80 100 120
Temperature (F)
Ener
gy (f
t-lbs
)
Figure A.6: Energy versus Temperature for 1/2 Inch Grade 50 Plate
121
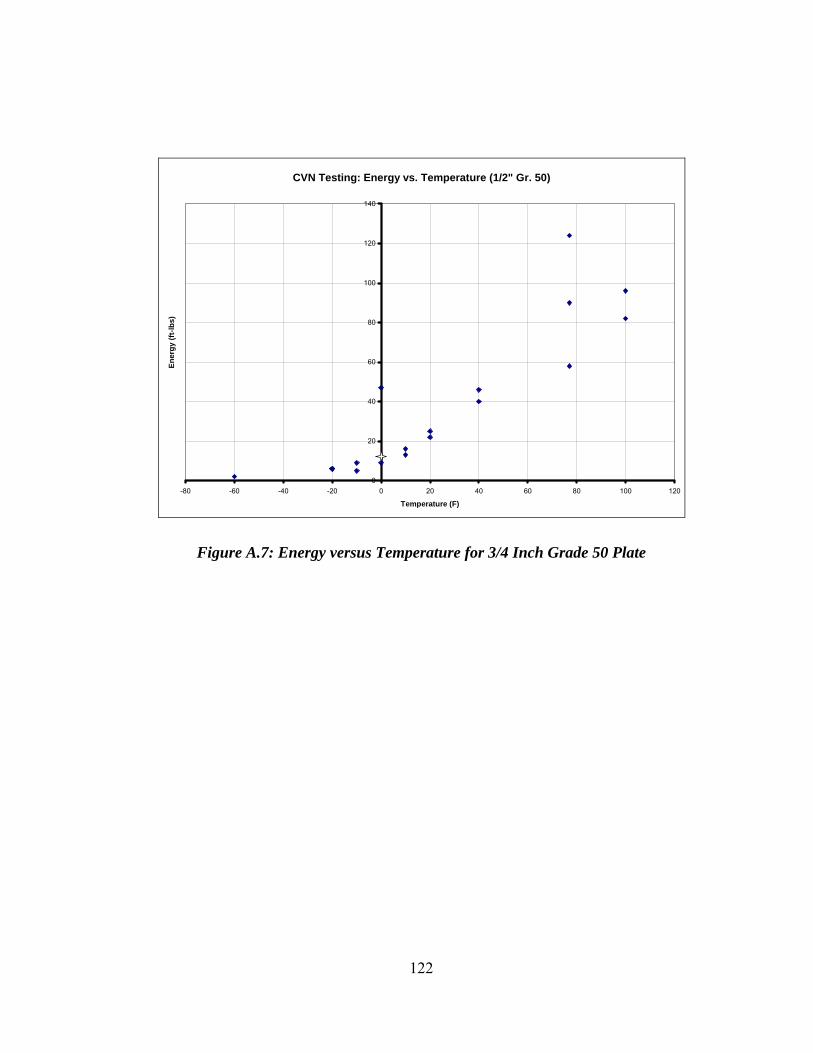
CVN Testing: Energy vs. Temperature (1/2" Gr. 50)
0
20
40
60
80
100
120
140
-80 -60 -40 -20 0 20 40 60 80 100 120
Temperature (F)
Ener
gy (f
t-lbs
)
Figure A.7: Energy versus Temperature for 3/4 Inch Grade 50 Plate
122
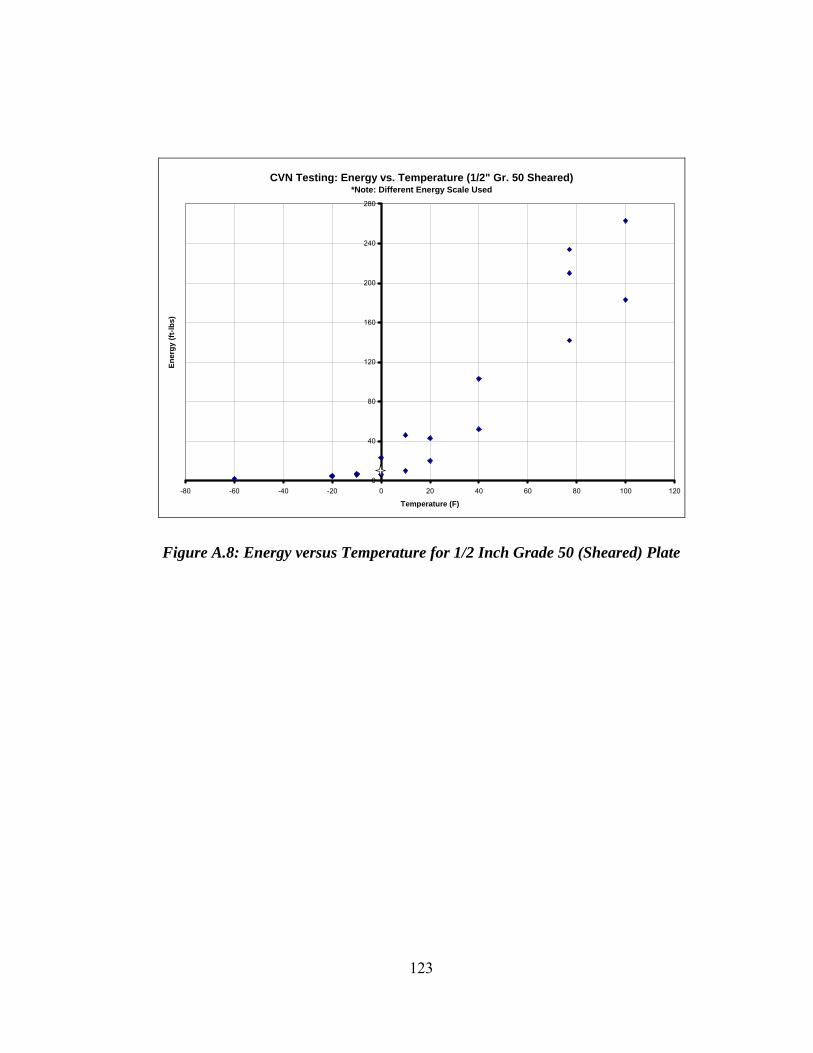
CVN Testing: Energy vs. Temperature (1/2" Gr. 50 Sheared)*Note: Different Energy Scale Used
0
40
80
120
160
200
240
280
-80 -60 -40 -20 0 20 40 60 80 100 120
Temperature (F)
Ener
gy (f
t-lbs
)
Figure A.8: Energy versus Temperature for 1/2 Inch Grade 50 (Sheared) Plate
123
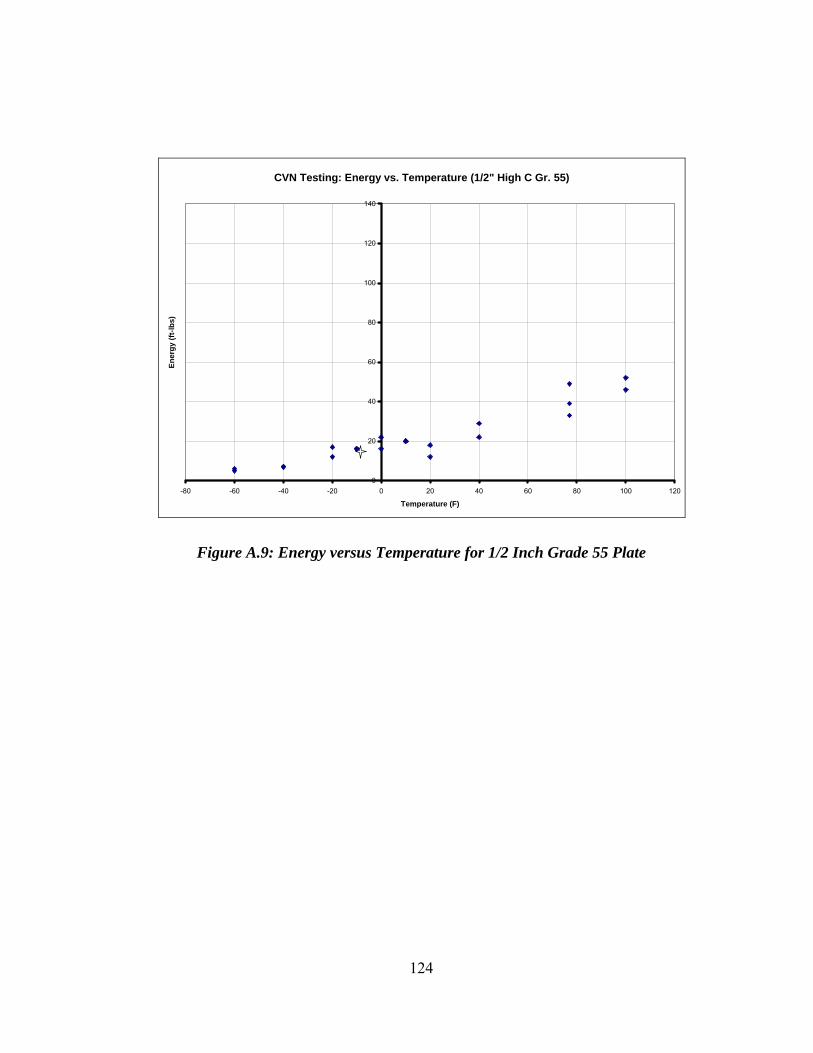
CVN Testing: Energy vs. Temperature (1/2" High C Gr. 55)
0
20
40
60
80
100
120
140
-80 -60 -40 -20 0 20 40 60 80 100 120
Temperature (F)
Ener
gy (f
t-lbs
)
Figure A.9: Energy versus Temperature for 1/2 Inch Grade 55 Plate
124
BIBLIOGRAPHY
AASHTO LRFD Bridge Construction Guide Specifications – U.S. Units. Washington, DC: American Association of State Highway and Transportation Officials, 2004.
AASHTO LRFD Bridge Design Specifications – U.S. Units. Washington, DC: American Association of State Highway and Transportation Officials, 2004.
Baird, J. D. “Strain Aging of Steel – a Critical Review.” Iron and Steel (May 1963): 186-191.
Brolund, T. F. “Punching and Shearing Science.” W. A. Whitney Portable Press Operations and Maintenance Manual. Rockford: W. A. Whitney Corporation, 2004.
Cayci, M. A., W. H. Munse, and W. M. Wilson. “A Study of the Practical Efficiency under Static Loading of Riveted Joints Connecting Plates.” University of Illinois Engineering Experiment Station Bulletin 402 (January 1953): 1-75.
Chesson, Jr., E., and W. H. Munse. “Riveted and Bolted Joints: Net Section Design.” Journal of the Structural Division: Proceedings of the American Society of Civil Engineers 89 (February 1963): 107-126.
Chesson, Jr., E., and W. H. Munse. “Riveted and Bolted Joints: Truss-Type Tensile Connections.” Journal of the Structural Division: Proceedings of the American Society of Civil Engineers 89 (February 1963): 67-107.
Chesson, Jr., E., and W. H. Munse. “Behavior of Riveted Truss-Type Connections.” Transactions of the American Society of Civil Engineers 123 (1958): 1087-1128.
de Jong, A. E. R. “Riveted Joints: A Critical Review of the Literature Covering Their Development, with Bibliography and Abstracts of the Most Important Articles.” ASME Research Publication (1945): 1-111.
Frank, K.H. “Influence of Hole Making Process upon the Tensile Strength of Steel Plates.” TxDOT Research Publication (May 2002): 1-9.
125
Gaylord, C. N., and E. H. Gaylord. Design of Steel Structures. New York: McGraw-Hill, 1972.
Gutierrez-Solana, F., D. Pesquera, and L. Sanchez. “Fatigue Behavior of Punched Structural Plates.” Engineering Failure Analysis 11 (2004): 751-764.
Huhn, H. and G. Valtinat. “Bolted Connections with Hot Dip Galvanized Steel Members with Punched Holes.” Proceedings of the ECCS/AISC Workshop, Connections in Steel Structures V: Innovative Steel Connections, June 3-5, 2004. Amsterdam: European Convention for Constructional Steelwork/American Institute of Steel Construction, 2004.
Hume-Rothery, W. The Structure of Metals and Alloys. Suffolk: Richard Clay and Company Limited, 1954.
Iwankiw, N. and T. Schlafly. “Effect of Hole-Making on the Strength of Double Lap Joints.” Engineering Journal of the American Institute of Steel Construction 19 (1982): 170-178.
Peterson, R. E. Stress Concentration Factors. New York: John Wiley and Sons, 1974.
Rassati, G.A., J. A. Swanson, and Q. Yuan. “Investigation of Hole Making Practices in the Fabrication of Structural Steel.” American Institute of Steel Construction (2004).
Schutz, Jr., F. W. The Efficiency of Riveted Structural Joints. Urbana: University of Illinois, 1952.
“Standard Test Methods for Notched Bar Impact Testing of Metallic Materials, ASTM E23-04.” ASTM International Standards for Mechanical Fasteners and Related Standards for Fastener Materials, Coatings, Test Methods, and Quality. West Conshohocken: American Society for Testing and Materials, 2004.
“Standard Test Methods for Tension Testing of Metallic Materials, ASTM E8- 04.” ASTM International Standards for Mechanical Fasteners and Related Standards for Fastener Materials, Coatings, Test Methods, and Quality. West Conshohocken: American Society for Testing and Materials, 2004.
126

VITA
David Jason Lubitz was born on October 11, 1981 in Westminster, Maryland, the
son of Robert Myron Lubitz and Linda Joyce Lubitz. After completing his work
at South Carroll High School, Sykesville, Maryland, in 1999, he began study at
the University of Delaware in Newark, Delaware. During his time at the
University of Delaware, David served as a Department of Civil and
Environmental Engineering research and teaching assistant and worked as an
engineering technician at a local civil engineering consulting firm. In May of
2003, he graduated Magna Cum Laude from the University of Delaware with a
Bachelor of Civil Engineering degree. In September of 2003, David began
graduate study and employment as a graduate research assistant in the Structural
Engineering program at The University of Texas at Austin in pursuit of a Master
of Science in Engineering degree.
Permanent Address: 897 Bear Branch Road
P.O. Box 2167
Westminster, MD 21158
This thesis was typed by the author.
127
Related Documents