Tennessee Forest Action Plan 2020-2030 Tennessee Department of Agriculture| Report | December 2020

Welcome message from author
This document is posted to help you gain knowledge. Please leave a comment to let me know what you think about it! Share it to your friends and learn new things together.
Transcript

Tennessee Forest Action Plan2020-2030Tennessee Department of Agriculture| Report | December 2020

a a2
The State of Tennessee policy of non-discriminationPursuant to the State of Tennessee’s policy of non-discrimination, the Tennessee Department of Agriculture does not discriminate on the basis of race, sex, religion, color, national or ethnic origin, age, disability or military service in its policies or in the admission or access to treatment or employment in its programs, services, or activities.
If you seek more information or feel that you have been treated unfairly in regard to the State’s services or hiring practices, contact the Tennessee Department of Agriculture, EEO/AA/ADA Coordinator, P.O. Box 40627 Melrose Station, Nashville, TN 37204, 615-837-5115.
The 2020 Tennessee Forest Action Plan was written in collaboration between the Tennessee Department of Agriculture - Division of Forestry (TDF) and the Tennessee Chapter of the Nature Conservancy (TNC).
We would like to acknowledge the following people for their many hours of work and thoughtful contributions towards this document.
Authors:Heather Slayton, TDFTrish Johnson, TNCRachel Greene, TDF
Jeff Hill, TDF Christel Hiltibran, TNC
TDF Contributors/Reviewers: Brian Hughett, David Arnold, David Todd, Neil Owens, Wade Waters, Tim Phelps
TNC Contributors/Reviewers: Danna Baxley, Gabby Lynch, Katherine Medlock, Sally Palmer, Alex Wyss, Terry Cook, Brittney Townsend, Paul Kingsbury, Cory Holliday
Partner Contributors: Sharon Jean-Philippe (University of Tennessee), Jennifer Watson (Gallatin, Tennessee), Rachel Greene (Mississippi State University)
Cover Photo Credit: Byron Jorjorian
Suggested Citation: Tennessee Division of Forestry. (2020). Tennessee Forest Action Plan: 2020-2030.
Tennessee Department of Agriculture. https://www.tn.gov/agriculture/forests/protection/ag-forests-action-plan.html

a a3
The abundance and variety of Tennessee’s forestlands have nurtured and inspired
generations. From the ancient forested mountains of East Tennessee to the rich bottomland hardwoods of West Tennessee, our forests have been part of our culture and have provided countless benefits to the people, communities, and businesses of our state since its founding in 1796. This Forest Action Plan builds on years of foundational work by the State of Tennessee to ensure that our vital forest resources are sustainably managed and to address the challenges that can impact our forests, such as a growing population, shifting markets, and climate change.
It is estimated that 52 percent of Tennessee’s landscape is in forest cover, with oak-hickory being the dominate forest type. This abundance of forest resources helps make Tennessee one of the top three hardwood lumber-producing states in the U.S. The economic impact of Tennessee’s forests is significant. They support a variety of forestry and forest product industries that contribute over $24 billion to Tennessee’s economy, employing about 100,000 individuals, generating labor income of $6.2 billion, and contributing $9.8 billion in total value added to the state economy. Much of this economic impact is felt in Tennessee’s rural and economically distressed counties.
To maintain and strengthen Tennessee’s forests, this Forest Action Plan addresses four key objectives:
• Enhancing Forest Health and Resilience
• Expanding Market Diversification
• Maintaining and Improving Connected Landscapes, and
• Strengthening Wildfire Resilient Communities.
In addition, the plan aspires to motivate a wide variety of partners to collaboratively address these objectives and bring resources that can be leveraged to support the strategies and actions identified in this assessment. We believe that there are many unique, creative, or new approaches that might bring excitement and renewed energy to managing our state’s forests as we work to make Tennessee’s forest resources more productive, healthier, and more resilient on the landscape.
David ArnoldState Forester and Assistant Commissioner for Forestry
David Arnold & Terry Cook
Executive Summary

a a4
It is important to highlight the need for diverse, competitive, sustainable forest products markets, a foundation to many strategies put forth in this plan. In the past, similar plans have buried the role of such markets in individual strategies and action steps. By design, this plan places forest-products market development as a key and foundational building block to keep forests as forests. These markets provide the best incentive to encourage forest landowners to actively manage their forests. Actively managed forests are more productive, healthy, and resilient, providing the broadest scope of forest benefits to all Tennessee citizens.
New and creative solutions to keeping forests as forests are championed in this plan. One of the most exciting strategies is being spearheaded at The Nature Conservancy’s Bridgestone Nature Reserve at Chestnut Mountain. The Nature
Conservancy (TNC) acquired over 5,700 acres in 2018 through a land donation by Bridgestone Americas, Inc. TNC’s management goal is to protect the densely forested property’s associated high conservation values while engaging the voluntary carbon market to generate revenue and also improve forest health through active forest management. We believe learning from TNC’s experience and applying similar strategies to private lands across Tennessee is a creative and quite revolutionary approach to forestry. This and similar strategies in the Forest Action Plan have the potential to provide forest landowners unprecedented opportunities for financial returns that will allow them to stay in the forest landowner business.
The need to leverage resources through partnerships is a longstanding strategy acknowledged by most successful organizations. It is so common a theme it is almost cliché. Yet it is undeniably true that there is incredible strength, innovation, and energy to be gained through partnerships. Tennessee’s forestry community faces steep challenges, but it also has tremendous opportunities to seize. These situations cannot be addressed through continued fragmentation of objectives, goals, and strategies. Over the last few years, our state’s forestry interests have rallied as a true community to put in play focused priorities and strategies that will help our forests. Development of this plan, though the partnership between the Tennessee Department of Agriculture – Division of Forestry and the Tennessee Chapter of The Nature Conservancy, is a prime example of the collaborative spirit brought to the table to protect, conserve, and enhance the forests we all love. The strategies in this plan build on this energy of partnership to ensure we have forests forever that will be enjoyed by all Tennesseans.
Executive Summary
Terry CookThe Nature Conservancy State Director

a a5
Executive Summary ..................................................................................................... 3Table of Contents ......................................................................................................... 5Introduction ................................................................................................................... 9Statewide Forest Resource Assessment .............................................................12
District Boundaries ..................................................................................................................................................................12
West Tennessee District ............................................................................................................................................12
Highland Rim District .................................................................................................................................................12
Cumberland District ...................................................................................................................................................13
East Tennessee District ..............................................................................................................................................13
Mississippi Alluvial Plain and Mississippi Valley Loess Plains ...............................................................................14
Southeastern Plains ...................................................................................................................................................16
Interior Plateau ...........................................................................................................................................................16
Southwestern and Central Appalachians (also called the Cumberland Plateau and Mountains) ....................18
Ridge and Valley .........................................................................................................................................................18
Blue Ridge Mountains ................................................................................................................................................19
Forest Resource Conditions....................................................................................................................................................20
Forestland Area Change ............................................................................................................................................20
Forest Distribution .....................................................................................................................................................21
Ownership of Forestland ...........................................................................................................................................22
Forest Composition ....................................................................................................................................................23
Stand-Size Class Distributions ..................................................................................................................................24
Tree Volume ................................................................................................................................................................25
Stand Origin ................................................................................................................................................................25
Growth, Removals, and Mortality .............................................................................................................................26
Tree Grade ..................................................................................................................................................................27
Wood Availability Case Studies .................................................................................................................................28
Characteristics of Private Forestland Ownership ..........................................................................................................32
Characteristics of Public Forestland Ownership ...........................................................................................................35
Table of Contents

a a6
Characteristics of Protected Lands in Tennessee .........................................................................................................37
Tennessee Forests Objectives ................................................................................. 40 Enhancing Forest Health and Resiliency ........................................................................................................................41
Current State ...............................................................................................................................................................41
How are Forest Health and Resiliency Threatened? ..............................................................................................42
Goal and Strategies ....................................................................................................................................................44
Expanding Market Diversification ...................................................................................................................................54
Current State ...............................................................................................................................................................54
How Is Market Diversification Threatened? ............................................................................................................57
Goals and Strategies ..................................................................................................................................................58
Maintaining and Improving Connected Landscapes ....................................................................................................64
Current State ...............................................................................................................................................................64
How Are Connected Landscapes Threatened? .......................................................................................................65
Goals and Strategies ..................................................................................................................................................71
Strengthening Wildfire Resilient Communities .............................................................................................................74
Current State ...............................................................................................................................................................74
How Are Communities Threatened? ........................................................................................................................76
Goal and Strategies ....................................................................................................................................................77
Priority Areas ................................................................................................................ 82 Forests to Faucets .............................................................................................................................................................83
USDA Forest Service Forest Inventory and Analysis Carbon Inventory ......................................................................83
Resilient and Connected Landscapes .............................................................................................................................88
Strategy Matrix and Resources Needed by the State Foresterto Address Strategies ................................................................................................. 90 Regional Initiatives ............................................................................................................................................................90
Enhancing Forest Health and Resiliency..................................................................................................................92
Hemlock Woolly Adelgid ............................................................................................................................................92
Laurel Wilt Disease .....................................................................................................................................................93
Table of Contents

a a7
Gypsy Moth .................................................................................................................................................................94
Emerald Ash Borer .....................................................................................................................................................95
Oak Decline .................................................................................................................................................................96
Invasive Plants ............................................................................................................................................................96
American Forest Carbon Initiative ............................................................................................................................97
White Oak Initiative ....................................................................................................................................................97
Shortleaf Pine Initiative ..............................................................................................................................................97
Expanding Market Diversification ...................................................................................................................................98
Workforce Development ...........................................................................................................................................98
Export Market Development .....................................................................................................................................98
Maintaining and Improving Connected Landscapes ....................................................................................................98
Landscape Management Planning ...........................................................................................................................99
Complementary Planning Initiatives & Stakeholder Coordination ............................................................................100
Forest Stewardship Coordinating Committee .......................................................................................................100
Natural Resources Conservation Services (NRCS) .................................................................................................100
State Wildlife Action Plan ..........................................................................................................................................100
Southeast Conservation Adaptation Strategy ........................................................................................................100
Community Wildfire Protection Plans (CWPP) .......................................................................................................101
Appendices ...................................................................................................................103 Appendix A. Overview of Data Products ..............................................................................................................................105
Forest Inventory and Analysis ..................................................................................................................................105
National Woodland Owner Survey ..........................................................................................................................105
National Land Cover Database ................................................................................................................................106
Protected Areas Database-US ..................................................................................................................................108
National Conservation Easement Database ..........................................................................................................111
Appendix B. Overview of Analytical Models ........................................................................................................................114
National Insect and Disease Risk Map ....................................................................................................................114
SLEUTH Urbanization Models ..................................................................................................................................115
Table of Contents

a a8
Impervious Surface Scenarios .................................................................................................................................116
Southern Wildfire Risk Assessment Portal .............................................................................................................117
Appendix C. Forest Stewardship Program ...........................................................................................................................118
Forest Stewardship Management Plans: Principles and Elements .....................................................................118
Creating a Stewardship Management Plan ............................................................................................................119
Eligibility ......................................................................................................................................................................120
Appendix D. Forest Legacy Program ....................................................................................................................................121
Purpose of the Forest Legacy Program ..................................................................................................................121
Authority .....................................................................................................................................................................121
Program Implementation .........................................................................................................................................121
Program Funding .......................................................................................................................................................121
Tennessee Program Objectives ...............................................................................................................................122
Program Management..............................................................................................................................................122
Monitoring ..................................................................................................................................................................123
Forest Legacy Assessment and Identification of Forest Legacy Areas ...............................................................123
Public Benefits Derived from Tennessee’s Forest Legacy Areas .........................................................................124
Eligibility Criteria for Tennessee’s Forest Legacy Areas ........................................................................................124
Description/Identification of Tennessee’s Forest Legacy Areas ..........................................................................125
Landowner participation – application, selection, and development of easements ........................................126
Forest Legacy Eligibility Requirements ...................................................................................................................128
Project Application Scoring ......................................................................................................................................128
Appendix E. 2015 Forest Action Plan Updates ....................................................................................................................132
References ..................................................................................................................................................................133
Literature Citations ...................................................................................................................................................133
Data Citations ............................................................................................................................................................137
Table of Contents (Figures) ......................................................................................138Table of Contents (Tables) .......................................................................................140
Table of Contents

a a9
The purpose of the FAP is to determine the status of the forest resources—and what is needed to maintain and improve them—through an assessment: what’s there, who owns it, what are its threats, how can partners collaborate to address the threats, and how can resources be leveraged to develop strategic partnerships and procure funding assistance. Strategies and actions have been developed to address challenges identified in this assessment. The completion of this FAP is a requirement before states are eligible to apply, compete for, and receive federal funds through an annual grant cycle for the 10-year plan period.
The Tennessee Department of Agriculture (TDA) Division of Forestry (TDF) partnered with the Tennessee Chapter of The Nature Conservancy (TNC) to complete this document. A key goal of this FAP is not only to address national private forest conservation priorities, but also to be a useful tool to a wide range of organizations and individuals in Tennessee to address forest resource issues pertinent to them. Where possible, the FAP complements other state agency assessments, such as the Tennessee Wildlife Resource Agency’s (TWRA) State Wildlife Action Plan (SWAP) and various Community
Wildfire Protection Plans (CWPP). To ensure this FAP aligns with other state and regional conservation plans, input was included from the Southeast Conservation Adaptation Strategy (SECAS) initiative (see Complementary Planning Initiatives section).
Through engagement and communication, the statewide FAP will be highly relevant and useful to a variety of organizations and individuals. Input from knowledgeable forest resource stakeholders was vital to achieve this comprehensive and collaboratively driven 10-year plan. Stakeholder groups include the Tennessee Forestry Association (TFA), the Tennessee Farm Bureau, the Tennessee Department of Environment and Conservation (TDEC), the Tennessee Wildlife Resources Agency, the State Technical Advisory Committee, the State Forest Stewardship Coordinating Committee, the Tennessee Forestry Commission, the Tennessee Association of Conservation Districts, the University of Tennessee (UT), the U.S. Department of Agriculture (USDA) Forest Service (USFS), and the USDA Natural Resources Conservation Service (NRCS).
This FAP was written with this overarching question in mind: What are the significant threats to our forests’ resiliency and how can our objectives, strategies, and actions protect and enhance the ability of our forests to be resilient? In this plan, resiliency is defined as the degree to which a forested landscape can recover from one or more disturbances without a major (and perhaps irreversible) shift in composition or function. Examples of managing for resilience can include but are not limited to: periodic reduction in stem densities and surface fuels to reduce fire severity in dry forest; actively managing forests to be healthy and robust; land acquisition of a critical connecting forest corridor; or managing forests to be more diverse in age, species composition, and spatial arrangement. The focus over the next 10 years will be to prioritize strategies around the four main objectives listed below and, by doing so effectively, most if not all threats to Tennessee’s forest will be mitigated.
The 2008 Farm Bill amended the Cooperative Forestry Assistance Act of 1978, directing states to develop a long-term Statewide Assessment and Strategy for Forest Resources (termed Forest Action Plan). The first Forest Action Plan (FAP) for Tennessee was authored in 2010 and provided guidance to conservation professionals for 10 years. This document is the second FAP and will serve as the guiding document for the next 10 years until 2030.
Introduction
The four main objectives of the 2020 FAP are: • Enhancing Forest Health and Resiliency
• Expanding Market Diversification• Maintaining and Improving Connected Landscapes
• Strengthening Wildfire Resilient Communities

a a10
IntroductionSeveral elements are integral to the approach in making our forests more resilient over the next 10 years. Without proper attention and respect to these elements, the strategies and goals identified will not be as strong or as effective. These major elements that build the foundation for the FAP are forest product markets, outreach and education, and partnerships.
The first foundational element is the understanding of how diverse, sustainable, and competitive forest product markets play a major role in making sustainable forest management a reality. Having a robust and diversified marketplace provides landowners of all types (public and private) options to manage their forest. When diverse market options are offered, landowners are encouraged and enabled to maintain sustainable, working forests that are healthy and resilient. Although addressing the lack of appropriate forest product markets diversification is identified as a standalone objective in this action plan, strategies and actions to improve forest product markets also apply to Enhancing Forest Health and Resiliency and Maintaining and Improving Connected Landscapes.
Effective outreach and education are also critical to sustainable management of Tennessee’s forest resources. With the majority of Tennesseans living in urban and suburban communities, it is imperative that current and future generations are educated about their role in and their impacts on forest resiliency. There is an intricate interrelationship between forest resources and human use of natural resources.
Through formal education (K-12, post-secondary, and higher education), study of the environment can be integrated into many subject areas, such as math, environmental science, physical science, biology, forestry, and history. In addition, informal (outreach) education can provide valuable lessons through experiential activities that explore ecosystems and their management impacts on the needs of both urban and rural citizens regarding wildlife, recreation, habitat protection, and consumer products derived from forest. As illustrated in Figure 1, knowledge, skills, and tools that effectively teach Tennesseans about forest resource management practices, forest ecology, threats to the forest resources, and strategies to counteract these threats can help prepare decision-makers and next-generation, climate-conscious forest managers to tackle tomorrow’s forest problems.
A third element that is foundational to improving the overall health and resiliency of Tennessee’s forests is partnerships. Strong, communicative, collaborative, and productive partnerships are key to every strategy and approach to managing the forest landscape. It is in the spirit of collaboration that TDF and TNC partnered to write this FAP. Functional partnerships can and should exist among agencies and organizations, and with private forest landowners. It is crucial that the citizens of Tennessee know the roles and values of their forest resources and understand that their actions are part of a much larger picture. The majority of Tennessee’s forests are owned by private landowners, and their active participation in forest management and sustainable stewardship of the land will ensure Tennessee’s forest resources are secured for the greatest number of citizens, the greatest good, and for the longest time.
The end goal is to keep Tennessee’s forests as forests and to keep them working. Working rural forests can be defined as forests that are actively managed to generate revenue from multiple sources, including sustainably-produced timber and other ecosystem services. Keeping working forests embedded in rural communities decreases the risk of forest loss due to land-use conversion and presents an opportunity to marry conservation goals with timber utility. A working urban forest can be both publicly and privately owned and work for communities by providing a myriad of environmental, health, and economic benefits.
Tennessee’s FAP is meant to be a document to help guide conservation activities in Tennessee. It is intentional that the strategies and action steps found within this document are non-exclusive. Creativity and innovation in the next 10 years are necessary to achieve the objectives. This plan purposefully allows for latitude within the action steps because every agency, organization, group, and private forest landowner offers something different to ensure sustainability of forested lands.
Through strategic and mindful actions guided by this FAP, Tennesseans will continue to conserve, protect, and enhance Tennessee’s forests.

a a11
Introduction
Figure 1. A professional forester demonstrating how to measure a tree diameter. These types of measurements are key components to managing Tennessee’s forests and a simple way to educate the public on the value of collecting data to manage for forest health and resiliency (photo courtesy of Trish Johnson, TNC).

a a12
Statewide ForestResource Assessment
District BoundariesIn the 2020 FAP, Tennessee’s assessments, threats, and strategies are organized within TDF’s district boundaries, which are heavily influenced by the characteristics of the ecological regions but are simplified to improve programmatic implementation. As depicted in Figure 2 below, these districts are: (1) West Tennessee District, (2) Highland Rim District, (3) Cumberland District, and (4) East Tennessee District. These districts generally coincide with those regional boundaries established by the Tennessee Wildlife Resources Agency and area boundaries established by the Natural Resources Conservation Service. Organizing this FAP according to these boundaries creates alignment and improves communications across partnerships. Most of the analyses conducted to inform this action plan were stratified by district boundaries. Additionally, most maps displayed in this action plan depict the district boundaries for reference.
Descriptions of these districts are below, while Figure 2 illustrates district locations.
West Tennessee District The West Tennessee District (WTD) generally encompasses the physiographic regions of the Mississippi Alluvial Plain and the Upper Gulf Coastal Plain. It is bordered to the west by the Mississippi River and to the east by the Tennessee River. The WTD is mostly cropland interspersed with isolated upland forests and linear corridors of bottomland forests.
THE WTD COMPRISES 20 COUNTIES COVERING 6,599,500 ACRES.
Highland Rim District The Highland Rim District (HRD) generally encompasses the physiographic region of the Interior Low Plateau. It is bordered to the west by the Tennessee River, and it bisects the Highland Rim to the east. The HRD is composed of two primary areas, the Central Basin and the Highland Rim.
THE HRD COMPRISES 24 COUNTIES COVERING 7,668,600 ACRES.
Tennessee’s forest resource assessment provides a comprehensive analysis of the forest-related conditions, trends, threats, and strategies within the state using a combination of qualitative, quantitative, and geospatial data that provide information relevant to key issues to the state while addressing national priorities of conserving, protecting, and enhancing the forest resource.

a a13
Statewide ForestResource Assessment
Figure 2. The Tennessee Division of Forestry administrative boundaries.
Cumberland District The Cumberland District (CD) encompasses the Cumberland Plateau that is bordered to the west by the Highland Rim and to the east by the Ridge and Valley ecoregion. The Plateau cuts diagonally across Tennessee a length of about 140 miles, averaging about 40 miles wide, and stretches from northern Alabama to West Virginia.
THE CD COMPRISES 27 COUNTIES COVERING 6,462,500 ACRES.
East Tennessee District The East Tennessee District (ETD) encompasses the Ridge and Valley and Southern Blue Ridge Ecoregions. It is bordered on the west by the Cumberland Plateau and on the east by the state line between Tennessee and North Carolina and Virginia. The Great Smoky Mountains National Park (GSMNP) and the Cherokee National Forest reside within this district.
THE ETD COMPRISES 24 COUNTIES COVERING 6,241,000 ACRES.

a a14
Ecological regions, or ecoregions, denote areas of similarity in ecosystems and in the type, quality, and quantity of environmental resources. Ecoregions are designed as spatial frameworks for research, assessment, management, and monitoring of ecosystems and their components. Several iterations of ecoregions have been developed and published. Early approaches to compiling maps of ecoregions analyzed patterns and composition of several biotic and abiotic factors including vegetation, wildlife, climate, hydrology, soils, geology, and physiography (Wiken 1986; Omernik 1987, 1995). A Roman numeral hierarchical scheme has been adopted for different levels of ecoregions. Level I is the coarsest spatial scale and divides North America into 15 ecoregions, while Level II divides this same area into 52 regions. At Level III, the continental U.S. is segmented into 99 regions (U.S. Environmental Protection Agency [EPA] 1997). Level III ecoregions are the most commonly used ecoregion-based planning unit for conservation purposes. Level IV is a more recent subdivision of Level III ecoregions. Explanations of the methods used to define the U.S. EPA’s ecoregions are given in Omernik (1995), Griffith et al. (1994, 1997), and Gallant et al. (1989). The ecoregion classification scheme, presented here
for the Tennessee geography (Griffith et al. 1998), was an interagency effort that drew from conceptual approaches and mapping methodologies of existing ecoregion-type frameworks including those developed by the USDA Forest Service (Bailey et al. 1994), the US EPA (Omernik 1987, 1995), and the Natural Resources Conservation Service (USDA 1981).
Figure 3 depicts the eight major terrestrial ecoregions that occur across Tennessee. From west to east, these regions include: the Mississippi Alluvial Plain, the Mississippi Valley Loess Plains, the Southeastern Plains, the Interior Plateau, the Southwestern Appalachians, the Central Appalachians, the Ridge and Valley, and the Blue Ridge Mountains.
Mississippi Alluvial Plain and Mississippi Valley Loess Plains Tennessee’s western boundary is formed by the Mississippi River. Alongside the main body of this river lies a floodplain known as the Mississippi Alluvial Plain. Over millennia, lateral migrations of the river have created numerous oxbow lakes, meander scars, and natural levees. Much of the area periodically floods, although artificial levees have been constructed to reduce flooding. In Tennessee, the Mississippi Alluvial Plain consists primarily of alluvial soils. To the east, the floodplain is bound by the loess soils of the Chickasaw Bluffs, part of the Mississippi Valley Loess Plains.
Forested wetlands, including permanently flooded cypress (Taxodium spp.) and tupelo (Nyssa sylvatica), periodically flooded bottomland hardwoods, and periodically flooded streamside (riparian) forests, are common in the Mississippi Alluvial Plain and throughout western Tennessee. Bald cypress and water tupelo are usually the dominant trees in permanently flooded areas. Areas flooded during the winter and early spring support a diverse forest dominated by red maple (Acer rubrum), sweetgum (Liquidambar styraciflua), water hickory (Carya aquatica), and many species of mesophyllic oak (Quercus spp.). Cane
Ecological Regions

a a15
(Arundinaria gigantea) often occurs in the understory of the seasonally flooded forest. Dominant trees on the highest, rarely flooded sites include American beech (Fagus grandifolia), American elm (Ulmus americana), sweetgum, a variety of oaks, and shagbark hickory (Carya ovata).
To the east of the Mississippi Alluvial Plain lies the Mississippi Valley Loess Plains. This ecoregion stretches from western Kentucky to Louisiana and consists of oak-hickory and oak-hickory-pine (Q. spp.-C. spp.-Pinus spp.) forests. The Mississippi Valley Loess Plains may be considered in two sections: the Bluff Hills and the Loess
Plains. The Bluff Hills are a disjunct region in Tennessee characterized by loess greater than 60 feet deep; a mosaic of microenvironments including dry slopes and ridges, ravines, and small cypress swamps; and unique aquatic habitats with gravel substrate (Griffith et al. 1997). The Loess Plains are gently rolling with no more than 50 feet of loess and host several large river systems in its wide floodplains, namely the Obion, Forked Deer, Hatchie, Loosahatchie, and Wolf rivers. The Mississippi Valley Loess Plains have a long history of agricultural land use and remains largely in cropland today. Isolated patches and linear corridors of deciduous forest mirror the forest types observed in the Mississippi Alluvial Plain.
Ecological Regions
Figure 3. Ecoregions of Tennessee.

a a16
Rivers of western Tennessee have been extensively channelized. Compared to historic surveys of bottomland forest cover in the 1950s, only 20 percent of bottomland hardwood forests remain intact in the Mississippi Alluvial Plain. Sedimentation, disrupted streamflow, and downstream flooding are also critical ecological issues in this ecoregion. An estimated 1.4 million tons of silt are deposited annually in Reelfoot Lake in northwestern Tennessee (TWRA 2015). Maintaining and restoring the wetlands of western Tennessee enhance critical functions such as groundwater recharge, reducing sediment transfer, and minimizing downstream flooding. In recent years, TWRA has made concerted efforts to replant and regenerate forests in the Mississippi Alluvial Plain to address issues of ecological function and increase wildlife habitat in the Mississippi River Flyway. The Mississippi River Flyway is recognized as one of the most significant bird migration corridors in the world with up to 50 million ducks, geese, shorebirds, wading birds, neotropical birds, and raptors migrating through the Mississippi Alluvial Plain each year. Wetlands also provide key habitat for alligator gar (Atractosteus spatula), alligator snapping turtles (Macrochelys temminckii), and bald eagles (Haliaeetus leucocephalus).
Southeastern Plains The Southeastern Plains ecoregion is bound by the Mississippi Valley Loess Plains to the west and the Tennessee River to the east. This area’s undulating terrain gradually increases in elevation moving eastward. The Southeastern Plains comprises five distinct subregions: Blackland Prairie, Flatwoods/Alluvial Prairie Margins, Fall Line Hills, Southeastern Plains and Hills, and Transition Hills.
The Blackland Prairie, Flatwoods/Alluvial Prairie Margins, and Fall Line Hills extend northward from Mississippi and cover a very small portion of Tennessee. The Blackland Prairie’s natural vegetation was sweetgum, post oak (Q. stellata), and red cedar, along with patches of bluestem (Andropogon spp.) prairie. While the Blackland Prairie was once part of a much larger grassland-shrub complex extending from McNairy County, Tennessee south to Mississippi and east to Alabama, much of this area is currently in cropland or pasture use with small patches of mixed hardwoods. The Flatwoods/Alluvial Prairie Margin marks a transition from prairie to the more forested plains and hills of
the Southeastern Plains and Hills. In Tennessee, the Flatwoods/Alluvial Prairie Margin is distinct from the rest of the Southeastern Plains as being lower and less hilly cropland and pasture. The Falls Line Hills extend to Pickwick Lake in Hardin County, Tennessee, and are composed of sand and chert gravel materials covered by sandy loam topsoils (Griffith et al. 1998). The Fall Line Hills are dominated by oak-hickory-pine forest.
The Southeastern Plains and Hills and Transition Hills are a mosaic of cropland, pasture, woodland, and upland hardwood forest with the predominant trees being oaks and hickories. While oak-hickory is the general forest type, some of the undisturbed bluff vegetation is rich in mesophytes, such as beech and sugar maple (Acer saccharum), with similarities to hardwood forests of eastern Tennessee (Griffith et al. 1997, TNWPC 2000). Southern red oak (Q. falcata) is dominant on drier upland sites, and white oak (Q. alba), often in association with yellow-poplar (Liriodendron tulipifera) and sweetgum, is dominant on more mesic sites. Hickories are common throughout the area. Less common tree species include eastern red cedar (Juniperus virginiana), yellow pines, dogwoods (Cornus spp.), and redbuds (Cercis). Shortleaf pine (P. echinata) occurs on sandy soils of the uplands. The average elevation for the region is approximately 492 feet with some hills near the Tennessee River reaching over 705 feet. The Transition Hills have the highest elevations in this ecoregion, containing characteristics of both the Southeastern Plains and the Interior Plateau. This is a mostly forested region of oak-hickory-pine with pine plantations associated with pulp and paper operations (Griffith et al. 1997, TNWPC 2000).
Interior Plateau The Interior Plateau is composed of two primary areas, the Central Basin and the Highland Rim. The Central Basin is an elliptically shaped depression measuring about 120 miles long by 60 miles wide covering an area of 8,600 square miles (Miller, 1974). It is oriented nearly north-south and encircled by the Highland Rim. The Central Basin lies in the heart of Middle Tennessee. There are two parts, the Inner and the Outer Basin. The Outer Basin is made up of knobs, narrow ridges, and dissected landscape. The Inner Basin is flat with some gently rolling hills dominated by eastern red cedars and hardwoods interspersed with openings of exposed limestone that underlies one of Tennessee’s
Ecological Regions

a a17
most unique ecosystems, the Limestone Cedar Glades. The average elevation of the Inner Basin is 590 feet. The Outer Basin has an average elevation of 754 feet, with a few hills in the southern portion reaching elevations of approximately 1,250 feet. Poor surface drainage, shallow soils, and other karst features such as caves, sinkholes, and underground drainages are common in the Inner Basin. The Outer Basin has much greater relief with rolling hills and narrow ridges. It has deeper phosphoric soils that supported significantly diverse hardwood forests prior to settlement.
The Outer and Inner Basins support forest communities containing mixed mesophytic species such as yellow-poplar, beech, northern red oak (Q. rubra), yellowwood (Cladrastis kentukea), shagbark hickory, sugar maple, Kentucky coffeetree (Gymnocladus dioicus), pawpaw (Asimina spp.), bladdernut (Staphylea spp.), spicebush (Lindera benzoin), and flowering dogwood (C. florida) in the ravines, lower terraces and north-facing slopes. Dryer limestone sites and south-facing slopes of the Outer Basin resemble Inner Basin forests composed of eastern red cedar often mixed with hardwoods. Deciduous forest, pasture, and cropland are the dominant land covers. The region’s limestone rocks and soils are high in phosphorus, and commercial phosphate is mined. The limestone cedar glades, a unique mixed grassland-forest vegetation type with many endemic species, are located primarily in the Inner Basin (Griffith et al., 1997, TNWPC, 2000).
The Highland Rim encircles the Central Basin and stretches from the Tennessee River in the west to the Cumberland Plateau in the east. The Highland Rim is broken into three distinct subregions: Eastern Highland Rim, Western Highland Rim, and Western Pennyroyal Karst. Collectively, these subregions represent remnants of an ancient massive dome that eroded. The Highland Rim today is characterized as an upland area heavily dissected by river and creek valleys. In general, the Highland Rim’s elevation approaches 1,000 feet, being somewhat higher in the Eastern Highland Rim section than in the more expansive Western Highland Rim. The Western Pennyroyal Karst extends southward from Kentucky into northern Middle Tennessee. Underlain with limestone, the Highland Rim entails an extensive area of karst topography and cave development, especially on the eastern and northern sections.
The Highland Rim is covered with rich oak-hickory-yellow-poplar forests with many woodland streams. The Highland Rim’s dry ridges support acid-loving species such as sourwood (Oxydendrum arboreum), blackgum, blueberries (Vaccinium spp.), oaks, and hickories. The native oak-hickory forests of the Western Highland Rim were intensively harvested in the mid- to late 1800s in conjunction with the iron-ore related mining and smelting of the mineral limonite. In the last 100 years, the region has regenerated and currently contains the largest remaining contiguous forest in middle Tennessee. Species of these forests include white, black, and chinkapin oaks; yellow-poplar; beech; hickory; and sugar maple. Natural vegetation in the Eastern Highland Rim is transitional between the oak-hickory forests to the west and the mixed mesophytic forests of the Appalachian ecoregions to the east (Griffith et al., 1997, TNWPC, 2000). Swamp forests including pin (Q. palustris), overcup (Q. lyrata), willow (Q. phellos), water (Q. nigra), and swamp chestnut (Q. michauxii) oaks; red maple; and sweetgum and blackgum occur on poorly drained soils. Forests of the Highland Rim support a large diversity of breeding birds, such as cerulean warbler (Setophaga cerulea), red-headed woodpecker (Melanerpes erythrocephalus), Acadian flycatcher (Empidonax virescens), and yellow-billed cuckoo (Coccyzus americanus), as well as darters and the last reproducing population of eastern hellbenders (Cryptobranchus alleganiensis) in middle Tennessee (TWRA 2015).
Most of the Western Pennyroyal Karst is cultivated or in pasture. The natural vegetation consists of oak-hickory forest with patches of bluestem prairie (Griffith et al., 1997, TNWPC, 2000). The vegetation of these barrens is floristically similar to Midwestern prairies that were dominated by big bluestem (A. gerardii), little bluestem (Schizachyrium scoparium), switchgrass (Panicum spp.), and many forbs (Carman, 2001). The largest remnant of barrens lies within Fort Campbell Military Reservation where regular prescribed burning, used to support training and readiness exercises, has sustained numerous fire-dependent species: Henslow’s sparrow (Centronyx henslowii), grasshopper sparrow (Ammodramus savannarum), prairie warbler (S. discolor), hognosed snake (Heterodon platirhinos), and timber rattlesnake (Crotalus horridus; TWRA, 2015).
Ecological Regions

a a18
Southwestern and Central Appalachians (also called the Cumberland Plateau and Mountains) The Southwestern and Central Appalachians are separated from the Interior Plateau by an irregular escarpment. The region cuts diagonally across Tennessee for a length of about 140 miles and on average is about 40 miles wide. The Southwestern Appalachians ecoregion stretches from northern Alabama to West Virginia and represents a western extension of the Southern Appalachian Mountain chain. The southern portion of this region in Alabama and Tennessee is the “true” plateau section with gently rolling uplands averaging 1,500 to 1,800 feet in elevation. Along both sides of the Southwestern Appalachians are deep gorges known as “gulfs,” the deeper being where the Tennessee River cuts through the Cumberland Plateau near Chattanooga. Lookout Mountain, Raccoon Mountain, Signal Mountain, and Walden’s Ridge are all fingers of the Southwestern Appalachians. The northern portion of the region in Tennessee is where the Southwestern Appalachians meet a section of the Central Appalachians. The topography of this section is quite complex with a lesser mountainous region, known as the Black Mountains, reaching 3,500 feet in elevation on Cross Mountain.
Surface rock strata in the Southwestern and Central Appalachians have produced varied soils and a wide variety of forest types. The region is forested with some agriculture and coal mining activities. Forest types vary from hemlock-basswood-buckeye-yellow-poplar (Tsuga canadensis-Tilia spp.-Aesculus spp.-L. tulipifera) forests found in cool gorges to oak-hickory-Virginia pine (Q. spp.-C. spp.-P. virginiana) associations found on dry sandy ridges. The mixed mesophytic forest is generally restricted to deeper gorges and escarpment slopes. Stands of chestnut oaks occur out of the gorges and directly below the bluff lines. Directly above the bluff lines, Virginia pine stands dominate the dry rocky soil. The forest varies from the yellow-poplar-white oak-red oak associations of the moister, richer hollows to the post oak-scarlet oak (Q. stellata-Q. coccinea) and hickory stands of the dryer, sandy uplands. The Cumberland Plateau Escarpment is characterized by steep, forested slopes and high-velocity, high-gradient streams. The forest types in the ravines and gorges include mixed oak and chestnut oak on the upper slopes and mesic forests
on the middle and lower slopes, while hemlock occupies rocky streamsides and river birch along floodplain terraces. The Sequatchie Valley is similar to parts of the Ridge and Valley, and is an agriculturally productive region, with areas of pasture, hay, soybeans, small grain, corn, and tobacco (Griffith et al., 1997, TNWPC, 2000).
The Southwestern and Central Appalachians support an array of wildlife species. Karst areas support several priority sites for endangered gray bats and Indiana bats. The numerous rivers and streams support several species of salamander (Black Mountain [Desmognathus welteri], green [Aneides aeneus], Cumberland dusky [D. abditus], and mud [Pseudotriton montanus]), mussels, and the federally endangered blue mask darter (Etheostoma akatulo; TWRA, 2015). Wetlands support breeding mountain chorus frogs (Pseudacris brachyphona) and wintering golden eagles (Aquila chrysaetos). Challenges facing forests and wildlife in this region include siltation and non-point source pollution at headwater streams and sprawling developments that fragment forest and riverine ecosystems.
Ridge and Valley Between the uplands of the Central Appalachians and the Blue Ridge Mountains lies the Ridge and Valley. This province extends from the Coastal Plain of Alabama to southwest Virginia. The Ridge and Valley is creased by several parallel ridges running northeast to southwest. The Ridge and Valley was formed concurrently with the Central and Southwestern Appalachians as a shallow inland sea which gradually filled with deltaic sediments of marine life. Unlike the Central and Southwestern Appalachians, the Ridge and Valley contains less impervious sandstone. As a result, the limestone valleys eroded more rapidly into the current system of narrow ridges and broad river valleys. The ridges are higher at the north end with Clinch Mountain at 2,624 feet and Bays Mountain at 3,100 feet. The valley floors slope gently to the southwest from an average elevation of 980 feet in the north to about 750 feet in the south.
Present-day forests cover about 50 percent of the region. The forests are dominated by oak/hickory/pine forest types with some mesic northern hardwoods. White oak forest, bottomland oak forest, and sycamore-ash-elm (Platanus occidentalis-Fraxinus spp.-Ulmus spp.) riparian forests are also common forest types. Chestnut oak (Q. montana) forests and pine forests are typical
Ecological Regions

a a19
for the higher elevations of the ridges, with areas of white oak, mixed mesophytic forest, and yellow-poplar on the lower slopes, knobs, and draws (Griffith et al., 1997, TNWPC, 2000). The mixed-mesophytic forest is similar to the nearby Cumberland Mountains and occurs on the northern slopes and in the ravines of the Ridge and Valley. Two of the most biologically diverse rivers in the nation, the Clinch and Powell Rivers, meander through the Ridge and Valley. The Conasauga River, whose headwaters are almost exclusively protected within National Forests, flows from the Blue Ridge Mountains into the Ridge and Valley before turning south to Georgia. Water quality is of great concern as rivers flow from montane forests into the Ridge and Valley’s agricultural landscape, sparking the Clinch Powell Clean Rivers Initiative and other efforts focusing on riparian buffer restoration, stream bank stabilization, and improved culvert and stormwater drainage systems. Scattered patches of prairie remnants, barrens, and cedar-pine glades also dot the region. These areas have similar floristic components to other natural grasslands in the state (DeSelm, 1984, Martin, 1989).
Blue Ridge Mountains The eastern-most portion of Tennessee is characterized by the southern reaches of the Appalachian mountain chain that runs in a northeast-southwest direction. The Blue Ridge Mountains of Tennessee and North Carolina form the highest peaks in the eastern United States at over 6,600 feet in elevation. The Blue Ridge is characterized by steep topography, vast forest complexes, and mid- to high-elevation streams. Valleys tend to be narrow and found only along large creeks and rivers. This geologically complex area comprises several mountain ranges: Iron, Holston, Stone, Unaka, Bald, Great Smoky, and Unicoi mountains. Along the western edge of the Blue Ridge region are a series of outlying mountains, generally lower in elevation than those along the North Carolina border: English, Chilhowee, Starr, and Bean Mountains (the Southern Sedimentary Ridges subregion). Also, the Blue Ridge contains several isolated limestone valleys at low elevations. The most notable of these are Shady Valley, Bumpass Cove, Wear Cove, Cades Cove, and Tuckaleechee Cove (the Limestone Valleys and Coves subregion).
The Blue Ridge is one of the richest centers of biodiversity in the eastern United States (Jenkins et al., 2015). The northeastern section of the Blue Ridge
contains all of Tennessee’s brook trout (Salvelinus fontinalis) resources as well as several populations of Eastern hellbender and the only remaining population of bog turtles (Glyptemys muhlenbergii). It is the most floristically diverse ecoregion of the state (Griffith et al., 1997, TNWPC, 2000, Jenkins et al., 2015) with a multitude of forest types. Lowlands support cove hardwood forests composed of yellow-poplar-sugar maple-yellow buckeye (A. flava)-and silverbells (Halesia spp.). Oak-chestnut (Q. spp.-Castanea spp.) forests once dominated this forest community until the chestnut blight virtually eliminated the American chestnut (C. dentata). Today the mixed oak and Appalachian oak forest has replaced the oak-chestnut forest. At slightly higher elevations, eastern hemlock forests are critical for numerous aquatic and terrestrial Species of Greatest Conservation Need identified in TWRA’s 2015 State Wildlife Action Plan (TWRA, 2015). Northern hardwood forests with yellow birch (Betula nigra), beech, and serviceberry (Amelanchier laevis) are usually found above 3,000 feet. Above 5,500 feet are the spruce-fir (Picea spp.-Abies spp.) forests, reminiscent of boreal forests in the northern US and Canada, which can tolerate more southerly latitudes due to the cooler, moister climate of high-elevation sections. Along this high-elevation zone, Fraser fir (Abies fraseri), a Southern Appalachian endemic, and red spruce (Picea rubens) tower over a mossy forest floor where bluets (Houstonia spp.), trilliums (Trillium spp.), clintonia (Clintonia borealis), and a host of other herbaceous flowers grow. As well, treeless areas called “balds” are frequently encountered along these ridges. In some places, heath balds occur with azaleas and rhododendron (Rhododendron spp.). Others are grassy balds with approximately 35 different species of grass. The Blue Ridge Mountains are challenged by declines in hemlock forest, development in ecologically sensitive areas, interruptions in stream connectivity, acid deposition, and some invasive species.
Ecological Regions

a a20Table 1. Area by land class between 1961 and 2017 (thousand acres).
Land Class 1961 1971 1980 1989 1999 2004 2009 2017Timberland 13,432.4 12,819.8 12,879.0 13,265.2 13,459.2 13,254.5 13,547.2 13,288.9
Other/ Reserved 263.5 316.5 429.5 337.3 390.3 566.1 456.1 572.4Total Forest 13,695.9 13,136.3 13,308.5 13,602.5 13,849.5 13,820.6 14.003.3 13,881.5Non-Forest 12,826.2 13,338.6 13,141.6 12,844.5 12,511.4 13,151.2 12,968.1 12,423.0
Total Land Area 26,522.1 26,474.9 26,450.1 26,447.0 26,360.9 26,971.8 26,971.4 26,304.5Percent Forested 52 50 50 51 51 52 52 53
Forest ResourceConditions
This forest resource condition assessment summarizes data from the ninth complete survey of Tennessee’s forest resources, which was conducted during the period 2010-2016 with updates from Inventory Years 2016-2017 collected during the period 2018-2019 by the US Department of Agriculture (USDA) Forest Service, Forest Inventory and Analysis (FIA) program in coordination with TDF. The primary purpose of conducting forest inventories is to gather multi-resource information to inform sound forest policies, provide data for forest-based economic development, develop forest programs, and provide an authoritative, defensible, and scientific basis for monitoring forest ecosystems.
Through data collection on permanently established field plots, FIA reports on status and trends in forest area and location; in the species, size, and health of trees; in total tree growth, mortality, and removals by harvest; in wood production and utilization rates by various products; and in forestland ownership. Although forest inventories were originally oriented toward describing and informing forest industry and traditional forest products, FIA resource assessments have expanded to include assessments of non-traditional forest products (e.g., biomass), forest
health indicators, sustainability, and climate change. Data were accessed and compiled from the USDA Forest Service’s EVALIDator (USDA Forest Service 2020) during June 2020 for this forest resource condition assessment. Additionally, FIA’s National Woodland Owner Survey (NWOS) and Timber Products Output (TPO) datasets were included in analyses and discussion of land ownership and utilization of timber products, respectively. FIA data has greatest utility in depicting statewide trends in forest land area and ownership change, forest composition, average annual net growth, removals, and mortality. Due to sampling error and resource constraints that limit the number of plots that can be sampled in any year, finer-scale (e.g., county) estimates of forest land cover and distribution may be more appropriately gathered from alternative data sources. In this forest resource assessment, the FIA data supplements the National Land Cover Database (NLCD) 2016 analysis of land cover from satellite imagery. See Appendix A for a full description of NLCD products.
Forestland Area Change Forests are a vibrant part of Tennessee’s economic, cultural, and ecological landscape, providing valuable forest products, clean water, recreational opportunities, and a sense of place. Tennessee’s forests cover an estimated 13,881,540 acres or 53 percent of the state (USDA Forest Service, 2020; Table 1). Beginning with the implementation of annual forest inventory surveys in 1999, area of forestland remained fairly constant at 51-52 percent. A trend from 2002-2017 of increasing forestland in western Tennessee has increased the percentage of land occupied by forest to 53 percent. However, increasing development around current metropolitan areas (e.g., Nashville, Memphis, Knoxville) has the potential to erode forest gains.
a a21
Forest ResourceConditions
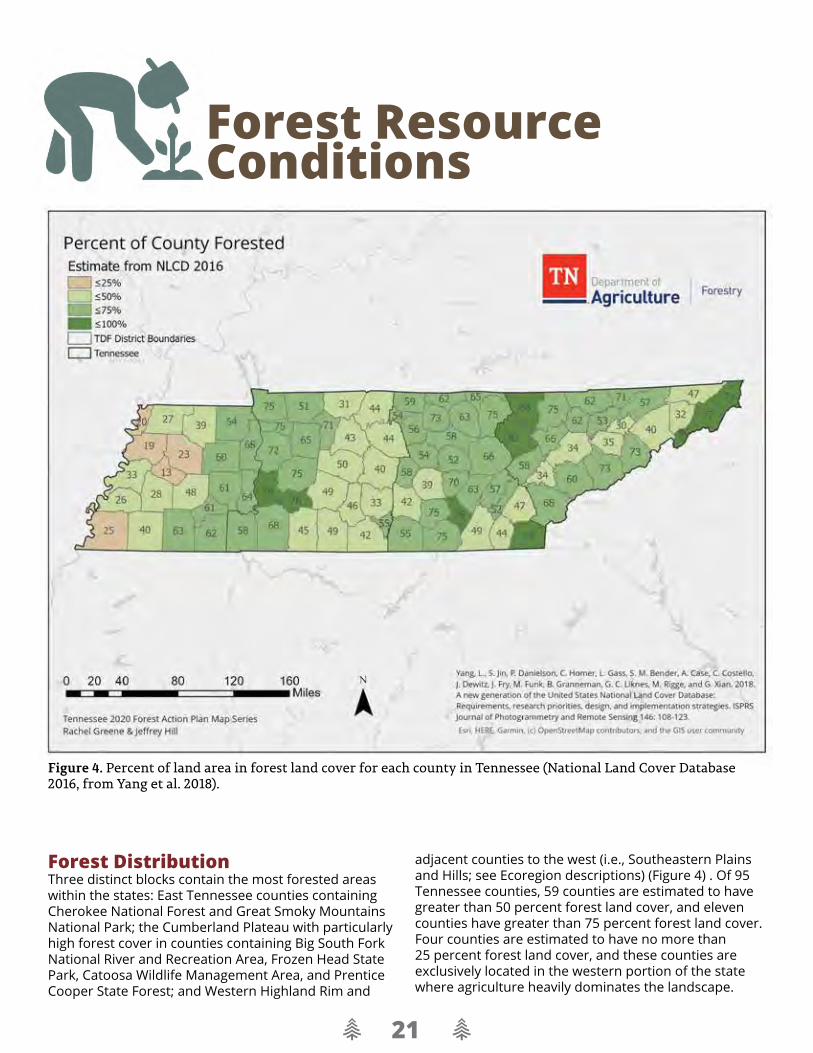
Forest Distribution Three distinct blocks contain the most forested areas within the states: East Tennessee counties containing Cherokee National Forest and Great Smoky Mountains National Park; the Cumberland Plateau with particularly high forest cover in counties containing Big South Fork National River and Recreation Area, Frozen Head State Park, Catoosa Wildlife Management Area, and Prentice Cooper State Forest; and Western Highland Rim and
adjacent counties to the west (i.e., Southeastern Plains and Hills; see Ecoregion descriptions) (Figure 4) . Of 95 Tennessee counties, 59 counties are estimated to have greater than 50 percent forest land cover, and eleven counties have greater than 75 percent forest land cover. Four counties are estimated to have no more than 25 percent forest land cover, and these counties are exclusively located in the western portion of the state where agriculture heavily dominates the landscape.
Figure 4. Percent of land area in forest land cover for each county in Tennessee (National Land Cover Database 2016, from Yang et al. 2018).

a a22
Ownership of Forestland Tennessee forestland remains overwhelmingly in private ownership (Figure 5). Eighty-three percent of forestland in the state is privately owned. An estimated 17 percent of Tennessee’s forestland is publicly owned and administered with 5 percent being managed by the USDA Forest Service as National Forests and 12 percent held by state, local, and other federal agencies.In the last two decades, the greatest significant change in ownership patterns across the state occurred during the forest industry’s divestiture of land assets in the early to mid-2000s. Comparing the percent change in forest land area with forest industry ownership from 1999 to 2009, 28 counties had greater than 75 percent reduction in land area in forest industry ownership (Oswalt et al., 2012). An additional 10 counties had 51-75 percent loss of forest industry ownership, and five counties exhibited gains. Loss of forest industry ownership was strongly associated with the Western
Pennyroyal Karst Plain and Ridge and Valley ecoregions. As forest industry divested most of its forest land base, concomitant gains were made in non-industrial private forest ownership across the state. State and local government holdings increased in localized pockets.
Current patterns of parcelization demonstrate that the majority of parcels are in small land holdings (<5 acres) but most of the land base is in larger tracts, meaning that relatively few individuals make management decisions that impact 84 percent of Tennessee’s total (forested and non-forested) land area (Figure 5). As of 2020, 21 percent (4,896,000 acres) of Tennessee’s land area is in parcel sizes of at least 500 acres. Public lands account for 3,115,000 acres (13 percent of the state) in parcel-size class of 500+ acres, while private lands account for 1,781,000 acres (8 percent of the state) in the largest class.
Forest ResourceConditions
Figure 5. Parcelization and ownership dynamics in Tennessee based on 2020 parcel data from Tennessee Comptroller of the Treasury.

a a23
Forest ResourceConditions
Forest Composition Forest types are used to describe assemblages of trees that occur on the landscape. Tennessee’s forests contain 89 percent hardwood forest types. The oak-hickory forest type, including stands dominated by yellow-poplar, accounts for an estimated 70 percent (9.76 million acres) of forestland in Tennessee (Figure 6). The loblolly-shortleaf pine (Pinus spp.) type accounts for only 8 percent and mixed stands of the oak-pine type account for an estimated 7 percent of forestland. Bottomland hardwoods (elm-ash-cottonwood and oak-gum-cypress forest types) account for 9 percent of forestland, principally occurring in West Tennessee. Maple-beech-birch accounts for an estimated 3 percent
of forestland. Eastern white pine, including eastern hemlock, accounts for less than 1 percent. Compared to the previous FIA inventory of 2009, Tennessee’s current forest composition has a slightly increased bottomland hardwood component. The increase likely stems from one or more of the following related factors: reforestation efforts of Tennessee Wildlife Resources Agency in the Mississippi Alluvial Plain, implementation of the Natural Resources Conservation Services’ Wetland Reserve Program permanent conservation easements, or annual variation of agricultural use on marginal land associated with commodity crop markets. From 2009 to 2018, Wetland Reserve Program easements totaled more than 26,000 acres, and the majority of these easements occur in West Tennessee.
Figure 6. Forest type composition (USDA Forest Service, 2020).

a a24
Stand-Size Class Distributions Stand-size class distribution indicates the average tree size in a stand. Sawtimber-sized trees are 9 inches diameter at breast height (dbh) or greater for softwoods and 11 inches dbh or greater for hardwoods. Poletimber-sized trees are 5 inches dbh up to sawtimber size. Seedlings and saplings are less than 5 inches dbh. The number of acres in sawtimber has steadily
increased since the 1989 inventory. The 2017 inventory estimates 9.8 million acres of forestland are in the sawtimber stand-size class (Figure 7). Since 1989, forestland acreage has been constantly recruiting from small stand-size classes into larger classes. As a result, the number of acres in the sapling/seedling stand-size class decreased from an estimated 2.4 million acres in 1989 to 1.6 million acres in 2017.
Figure 7. Area of forestland by stand-size class, 1989-2017 (USDA Forest Service, 2020).
Forest ResourceConditions

a a25
Figure 8. Average annual gross growth, harvest removals, mortality, and net change in sound bole volume (million cubic feet ± sampling error at 68% confidence) on forestland during the seventh (2004), eighth (2009), and current (2017) forest inventory periods.
Forest ResourceConditions
Tree Volume All live tree volume (at least 5 inches dbh/drc) has increased slightly from 25.5 billion cubic feet following the 1999 inventory to 32.3 billion cubic feet in 2017. Live tree volume trends from 1999 to 2017 are in keeping with trends in stand-size class distribution. Live tree volume is recruiting from smaller diameter classes into larger diameter classes. The peak in distribution is shifting to larger diameter classes, indicating an aging forest resource.
Stand Origin Historically, rates of artificial regeneration have been low in Tennessee. In 1999, 604,000 acres bore clear evidence of artificial regeneration. This estimate decreased to 499,000 acres in 2004 before increasing to 683,300 acres in 2009. Currently, an estimated 673,000 acres of forestland originates from artificial regeneration. The majority of planted acres occurs in the loblolly pine forest type. Sizeable plantings also occurred in loblolly pine-hardwood, shortleaf pine, white oak-red oak-hickory, sweetgum-yellow-poplar, and mixed hardwood stands (USDA Forest Service, 2020).

a a26
Growth, Removals, and Mortality Current net change in sound bole volume is positive, indicating that the forest resource is growing faster than harvest removals and mortality (Figure 8). Average annual net growth for softwoods was 163 million cubic feet for the period 2011-2016, with heavy losses in eastern hemlock. Average annual net growth for hardwoods was 636 million cubic feet for the period 2011-2016. Net growth to removal ratios remain positive for hardwoods (2.1 million cubic feet of growth for every 1 million cubic feet removed), continuing a trend since 1999. At the 2007 inventory, net growth to removal ratios for softwoods was negative due to major losses of pine species to southern pine beetle outbreaks. By
the 2016 inventory, net growth to removal ratios for softwoods had reversed and become positive with 2.5 million cubic feet of growth for every 1 million cubic feet removed. Concurrently, average annual mortality for softwoods has decreased in the period 2011-2016 compared to 1999-2007 inventory estimates, but softwood average mortality remains higher today than in 1989-1999. Average annual mortality for hardwoods was 232 million cubic feet during 2011-2016 inventories, a slight decrease from 1999-2007 estimates reported in the 2010 Forest Resource Assessment and Strategy, but still significantly higher than the 160 million cubic feet recorded from 1989-1999.
Forest ResourceConditions
FOOTNOTE: Sound cubic-foot volume. For timber species (trees where the diameter is measured at breast height [DBH]), the volume of sound wood in the central stem of a sample tree >=5.0 inches in diameter from a 1-foot stump to a minimum 4-inch top diameter or to where the central stem breaks into limbs all of which are <4.0 inches in diameter. For woodland species (trees where the diameter is measured at root collar [DRC]), sound volume is the net volume of wood and bark from the DRC measurement point(s) to a minimum 1-1/2 inch top diameter; includes branches that are at least 1-1/2 inches in diameter along the length of the branch.
Tree: A woody plant usually having one or more erect perennial stems, a stem diameter at breast height of at least 3.0 inches, a more or less definitely formed crown of foliage, and a height of at least 15 feet at maturity.Forest land: Land at least 10-percent canopy cover by trees of any size, including land that formerly had such tree cover and that will be naturally or artificially regenerated. Forest land includes transition zones, such as areas between heavily forested and nonforested lands that are at least 10-percent canopy cover with trees and forest areas adjacent to urban and builtup lands. Also included are pinyon-juniper and chaparral areas in the West and afforested areas. The minimum area for classification of forest land is 1 acre and 120 feet wide measured stem-to-stem from the outer-most edge. Unimproved roads and trails, streams, and clearings in forest areas are classified as forest if less than 120 feet wide.

a a27
Tree Grade Tree grade considers the number of defects and straightness in the trunk of a tree. It is an estimate of quality with Grade 1 having the highest quality. Higher quality trees produce more defect-free lumber. Tree grade for all species has declined since 2004; declines in Grade 1 and Grade 2 are concurrent with increases in the Below-grade class (Figure 9). Volume of sawtimber trees in Grade 1 declined 57 percent from 2004 to 2009 (Figure 9). Likewise, volume of sawtimber trees in Grade 2 declined by 20 percent from 2004 to 2009 and declined a further 19 percent by 2017. Concurrently,
trees with grade-able logs that did not meet Grade 3 standards increased 146 percent from 2004 to 2009. Hardwood tree grade may have started its decline earlier than softwoods. For example, between 1999 and 2009 the proportion of hardwood sawtimber2 volume found in Grade 1 trees declined from 22 percent to 7 percent (Oswalt et al. 2012) with the current estimate at 8 percent (USDA Forest Service 2020). This staggering trend in declining tree grade is a result of sustained high-grading practices and a lack of diverse forest products markets that could create demand for low-grade trees.
Figure 9. Net merchantable bole volume of live trees (at least 5-inch dbh/drc), in million cubic feet (± sampling error at 68% confidence), on timberland in Tennessee during the seventh (2004), eighth (2009), and current (2017) forest inventory periods.
Forest ResourceConditions

a a28
Wood Availability Case StudiesForest products and the forest industry play a significant role in Tennessee’s economy. In an effort to support data-driven decision-making in the forest products industry, TDF assessed current status and trends of forested area, ownership, composition, volume, silviculture, health, and sustainability. TDF developed three case studies to understand issues that affect forest industry including ownership and parcel dynamics, forest conditions, wood volume and quality, and harvest sustainability. For each case study, a site was selected for a hypothetical sawmill and a procurement area was established in a 50-mile radius of the mill site. Mill site selection was based on current patterns of mill locations and harvesting trends, but none of the hypothetical mill
sites are meant to represent a currently active sawmill. The three case studies are located in Decatur, Macon, and Warren counties.
Tennessee is known for being a hardwood forest state with 53 percent in forest land cover and high rates of private land ownership. These statewide trends are reflected in the estimates of forest area within the three case studies’ procurement areas. The Decatur site had the highest percentage of land area in deciduous, evergreen, and mixed forest at 58 percent (2.9 million acres) and the Macon site had the lowest at 50 percent (2.5 million acres). Ownership patterns in the procurement areas were similar to statewide trends with more than 90 percent of forest in private ownership.
Table 2. Summary of forested area, ownership, and parcelization patterns, and forest conditions on timberland for three hypothetical mill sites in Decatur, Macon, and Warren counties.
Decatur Mill Site Macon Mill Site Warren Mill Site
Forested Area (ac), excl. wetlands 2,940,100 (58 percent) 2,496,300 (50 percent) 2,817,200 (56 percent)
Private : Public Ownership (percent) 94 : 6 94 : 6 91 : 9
Forest Eligible for Harvest (percent) 75 69 80
Common Forest Type Oak-hickory Oak-hickory Oak-hickory
Net Sawlog Volume, ¼-inch International
Rule (MMBF)117,688 13,870 19,031
Volume in Tree Grades 1 & 2
(percent)28 25 21
Growth-to-drain Ratio 1.7 2.7 2.4
Forest ResourceConditions

a a29
Unless a forested tract is in close proximity to a mill, logging crews are constrained by tract size with 20 acres often used as rule-of-thumb minimum harvest size. Using parcel information from the Tennessee Comptroller of the Treasury and remote-sensing analysis of forest land cover, the percent of forest that is eligible for harvest was calculated for each hypothetical mill site. Eligibility was defined as forested tracts of at least 20 acres within the 50-mile radius procurement area. Parcel data was available only for Tennessee; estimates of forest eligibility for harvest were extrapolated to portions of procurement areas that did not have parcel data (e.g., Alabama, Kentucky, Mississippi). The Warren site had the highest rate of forested tracts eligible for harvest at 80 percent. The Macon site had the lowest harvest eligibility at 69 percent, and this site also had the least land area occupied by forest.
The dominant forest type for all three sites was oak-hickory. Loblolly-shortleaf pine was fairly common (16 percent of forested area) around the Decatur site. Maple-beech-birch was uncommon around the Macon site, and loblolly-shortleaf pine and oak-pine was uncommon around the Warren site. Oak-gum-cypress and elm-ash-cottonwood were uncommon to rare forest types in all three procurement areas.
For each hypothetical mill site, forest structure, wood volume and quality, average annual growth, removals, mortality, and net change were calculated on timberland
(Table 2). Timberland is defined as being capable of producing at least 20 cubic feet per acre per year of industrial wood. All estimates are derived from the most recent FIA Program inventory, accessed via EVALIDator in June 2020 (USDA Forest Service 2020).
The stand-size classes utilized by FIA are small (majority of trees are < 5 inches dbh), medium (≥ 5 inches dbh), and large (≥ 9 inches dbh for softwoods and ≥ 11 inches dbh for hardwoods; Oswalt et al. 2009, Bechtold and Patterson 2005). The distribution of stand-size classes on timberland were skewed toward large-diameter class on public and private lands (Figure10). The percent of timberland in the large diameter class was 61 percent for the Decatur site, 73 percent for the Macon site, and 70 percent for the Warren site. All sites had similar rates of medium diameter stand-size class, ranging from 19 percent to 21 percent. The Decatur site had the greatest occurrence of small diameter stand-size class at 18 percent of total timberland; this class comprised 5 percent and 10 percent of timberland around the Macon and Warren sites, respectively. Patterns of stand-size class distribution are reflected in stand-age class distributions (Figure 11). The Decatur site had the highest occurrence of timberland in 0-10 and 10-20-year stand-age classes, congruent with the Decatur site’s high incidence of the small diameter stand-size class. These patterns are consistent with statewide trends in Tennessee.
Forest ResourceConditions
Figure 10. Distribution of stand-size classes on public and private timberland for the state of Tennessee and in 50-mile radius procurement areas for three hypothetical mills located in Decatur, Macon, and Warren counties.
Figure 11. Distribution of stand-age classes on public and private timberland for the state of Tennessee and in 50-mile radius procurement areas for three hypothetical mills located in Decatur, Macon, and Warren counties.

a a30
Tree grade is a classification that indicates the suitability of individual sawtimber-size trees to yield factory-grade lumber (e.g., for furniture, flooring, pallets) or construction-strength timbers (Oswalt et al. 2012). Tree grade differs from log grade in that tree grade applies to the entire tree and is generally evaluated before the tree is felled. Since at least 2004, tree grade in Tennessee has declined substantially for hardwood species. Statewide
trends in tree grade are reflected in the proportion of sawtimber volume found in grades 1, 2, 3, below-grade, and no log for each procurement area (Figure 12). The Decatur mill site appears to have a lesser proportion of sawlog volume in below-grade compared to the Macon and Warren sites, but these results should be treated with caution given the natural variability in tree grade and small sample sizes.
Average annual net change (gross growth [cubic feet] minus harvest removals [cubic feet] minus mortality [cubic feet]) of all live trees on timberland ranged from 86 million cubic feet at the Macon site to 99 million cubic feet at the Warren (Figure 13). All sites had a positive
growth-to-drain ratio, ranging from 1.7 at Decatur and 2.7 at Macon, indicating that the forest resource is growing in volume faster than harvest removals and mortality.
Figure 12. Net sawlog volume (± sampling error at 68% confidence) of tree grades of sawtimber-size (≥ 9 inches dbh for softwoods and ≥ 11 inches dbh for hardwoods) trees on public and private timberland for the state of Tennessee and in 50-mile radius procurement areas for three hypothetical mills located in Decatur, Macon, and Warren counties.
Forest ResourceConditions

a a31
Forest ResourceConditions
Figure 13. Average annual gross growth, harvest removals, mortality, and net change (± sampling error at 68% confidence) on public and private timberland in 50-mile radius procurement areas for three hypothetical mills located in Decatur, Macon, and Warren counties.
The three case studies for hypothetical mill sites in Decatur, Macon, and Warren counties do not exhibit apparent adverse conditions due to ownership patterns, parcelization, or wood volume. The forest resource is growing faster than the volume currently removed by harvests and mortality; however, the increases in wood volume may not be in tree and log grades that are suitable for use as factory-grade lumber or construction-strength materials. The decline of hardwood sawtimber tree grade has been a widespread issue in Tennessee since at least 1999. This decline is likely a legacy effect of past and current harvesting practices such as high-grading.
1Net board-foot volume in the sawlog portion. This is
the net volume (International 1/4-inch rule) of wood in the central stem of a timber species tree of sawtimber size (9.0 inches DIA minimum for softwoods, 11.0 inches DIA minimum for hardwoods), from a 1-foot stump to a minimum top diameter (7.0 inches for softwoods, 9.0 inches for hardwoods), or to where the central stem breaks into limbs all of which are less than the minimum top diameter.
2Sawtimber: A tree of commercial species containing at least a 12-foot saw log or two noncontiguous saw logs 8 feet or longer and meeting regional specifications for freedom from defect. Softwoods must be at least 9.0 inches dbh. Hardwoods must be at least 11.0 inches dbh.

a a32
To summarize private forestland ownership:
• 83 percent of the forest land in Tennessee is privately owned (USDA Forest Service FIA, 2020).
• Of the private ownerships, 81 percent are owned by families (Butler et al., 2020).
• 69 percent of family forest landowners acquired their property through purchases as opposed to inheritance (Butler et al., 2020).
• The majority of the family forest landowners are at least 55 years old. Nearly half of family forest landowners have held their land for at least 25 years, and less than 20 percent of family forest landowners have owned land for fewer than 10 years (Butler et al., 2020).
• Of the tracts greater than 500 acres, 38 percent are in private ownership (internal data from Tennessee Comptroller of the Treasury, 2020).
• 82 percent of parcels are less than 5 acres in size, and 94 percent of parcels are smaller than 50 acres (internal data from Tennessee Comptroller of the Treasury, 2020).
• Of the landowners who owned 20 acres or more, nearly 45 percent of their lands had logs harvested for sale. For this same group, 18 percent of acres are covered under a forest management plan (Butler et al., 2020).
According to the most recent available NWOS conducted between 2011 and 2013, there were no significant changes in private forest landownership characteristics. Private individuals (including family forest owners) own 83 percent of forest land in Tennessee, a slight decrease from the 2010 assessment (gains in ownership were made under state and local government ownership). Most of those private ownerships remained in the family ownership category, and these private forest ownerships were acquired mainly through purchases. Similar to what was reported in 2010, the average age of forest landowners remained 61 years, and they have owned their property for an average of 21.5 years. Thirty-six percent of forestland ownerships fall between 10 and 19 acres in size and it continues that over two thirds of ownership is less than 100 acres. Timber harvesting either for personal use or sale (46.1 percent) verses no harvesting (51.8 percent) pretty well broke even. For those owners who harvested timber, 84.5 percent did not use a professional forester where only 13.3 percent did engage a professional forester.
The following graphics (Figure 14) produced by the USDA summarize the characteristics of Tennessee private forest landowners from a survey conducted between 2011 and 2013.
Characteristics of Private Forestland Ownership
The USDA Forest Service FIA Program collects information about ownership of forested land in each state. Area, density, and volume estimates can be queried by ownership classes such as nonindustrial private forestland, public land, and forest industry (defined as forest landowners who also own a wood processing facility). Additionally, the FIA Program administrates the NWOS which surveys landowners to assess patterns of demographics, management objectives, concerns, and purpose of ownership.

a a33
Characteristics of Private Forestland Ownership
Figure 14. Characteristics of private forest landowners (USDA, 2011-2013).

a a34Figure 14. Characteristics of private forest landowners (USDA, 2011-2013).
Characteristics of Private Forestland Ownership

a a35
As shown below in Figure 15, public lands provide important ecological and socioeconomic services to residents and visitors of Tennessee. The largest tract of public land is the 650,000-acre Cherokee National Forest located in the Southern Appalachian Mountains of East Tennessee. The Cherokee National Forest is separated into two sections (northern and southern) by the Great Smoky Mountains National Park, and it adjoins the George Washington/Jefferson National Forest in Virginia, the Pisgah and Nantahala National Forests in North Carolina, and the Chattahoochee National Forest in Georgia. Other notable tracts of federally
owned public land include the Great Smoky Mountains National Park (239,000 acres within Tennessee) and Big South Fork National River and Recreation Area (91,300 acres within Tennessee) managed by the National Park Service, and the Hatchie National Wildlife Refuge (11,400 acres) managed by U.S. Fish and Wildlife Service. The largest tracts of state-owned public land are North Cumberland and Catoosa Wildlife Management Areas (130,200 and 79,400 acres, respectively) managed by Tennessee Wildlife Resources Agency. The largest State Parks, owned and managed by Tennessee Department of Environment and Conservation, include Frozen Head
Figure 15. Public forestland ownership in Tennessee.
Characteristics of Public Forestland Ownership

a a36
(42,000 acres), Justin P. Wilson Cumberland Trail (33,200 acres), and South Cumberland (29,700 acres). The largest holdings of TDF are Natchez Trace (36,600 acres), Chuck Swan (24,700 acres), and Prentice Cooper (24,700 acres) State Forests. Big South Fork National River and Recreation Area, North Cumberland and Catoosa WMAs, Frozen Head State Park, Chuck Swan State Forest, and others comprise a complex of ecologically rich public lands in the Cumberland Plateau and Mountains and Ridge and Valley ecoregions that sweep northward to the Daniel Boone National Forest in Kentucky.
Characteristics of Public Forestland Ownership

a a37
Characteristics of Protected Lands in Tennessee
Forestland ownership has changed in Tennessee over the past decade. Some of this change began during the 2010 FAP assessment period but did not have noticeable impacts until many years after it was published. According to Zhang, Butler, & Nagubadi (2012), industrial (vertically integrated forest products companies) ownership has declined over the last 30 years, which has given rise to more institutional timberland ownership. Examples of institutional investors can be timberland investment management
organizations (TIMOs) or real estate investment trusts (REITs). Specifically, in Tennessee, large industrial companies such as International Paper and MeadWestvaco divested themselves of their large timberland ownership between 2005 and 2010, and portions of that land were purchased by TIMOs or REITs. However, other portions were purchased by state or local governments, conservation organizations or the private sector and hereby referred to as “protected lands.”
Characteristics of Public Forestland Ownership

a a38
Characteristics of Protected Lands in Tennessee
The Protected Areas Database-US (PAD-US) contains ownership information and categorizes parcels base on their conservation status. For example, “protected conservation status” simply means that the land is held in public trust or for conservation and community benefits. However, these conservation categories can be vague. “Protected” does not specify or describe the removal of land from active management practices, extractive uses, or multi-use objectives unless specified as belonging to a specific class of protected lands (e.g., Gap Status 1 or 2) or in conflict with Endangered or Threatened species management plans. Gap Status 3 and 4 refer to “multiple use” or land that can be subjected to extractive uses; or land with no known mandate or restriction.
The majority of protected forestlands identified in PAD-US as fee simple (i.e., permanent and absolute tenure in land) were established as lands held in public trust prior to 1990. Pre-1990 fee simple land acquisitions constitute 109 parcels covering a total of 1,576,600 acres, including all land cover types and uses. A further 366 parcels covering 1,312,600 acres do not have an establishment date. Most parcels without an establishment date are likely to have been acquired prior to 1990 or have a long history of being leased and managed by a public entity whereby the final land sale did not impact land management or public use. The largest of these parcels with unknown establishment dates include North Cherokee National Forest & Wildlife Management Area (340,100 acres), a Tennessee Valley Authority property (142,600 acres), North Cumberland Wildlife Management Area (91,100 acres), Big South Fork National River and Recreation Area (71,900 acres), and Land Between the Lakes National Recreation Area (63,700 acres). Protected land acquisitions in the 1990s totaled 51 parcels of 51,700 acres, and numbers increased to 54 parcels of 87,200 acres in the 2000s. The 2010s saw the largest increase in protected land acquisitions totaling 17 parcels of 129,200 acres. This trend of increasing acreage of land acquired for conservation and public benefit from the 1990s to the 2000s to the 2010s may be partially explained by forest industry’s large-scale land divestiture during the 2000s and early 2010s.
As of the 2018 update, PAD-US reports that there are 2,832,400 forested acres protected in Tennessee (20 percent of the total forestland in the state). Of that 2.8 million acres, 1,513,600 acres are in Gap Status 3 or 4 (i.e., no legal restriction on extractive and multi-use or no known restriction, respectively). Thus, 53 percent
of the total protected forestland in Tennessee may be available for timber harvesting or some other forest health management activities. The majority of protected forestland is in government ownership: 44 percent is owned by the federal government, 28 percent owned by state government, and 27 percent is owned by the private sector (see data methods in appendix for a more detailed breakdown).
Another database that can be queried to understand land ownership trends is the National Conservation Easement Database (NCED). This is the national database of tabular and spatial conservation easement information compiled from land trusts and public agencies. A conservation easement is one of many tools that maintains a land use or cover (e.g., working farms, ranches, riparian buffers, and forests) while keeping the land in private ownership and on tax rolls (although tax rates may be reduced). Easements are generally a more cost-effective tool for conservation-minded entities compared to land acquisition. Because conservation easements are voluntary agreements between landowner and easement holder, the specifications, restrictions, and benefits of easements are highly variable. However, the NCED effort seeks to heighten visibility of conservation gains, improve strategic planning, identify opportunities for collaboration, and advance public accountability.
The NCED’s easement records, including easements on public land, in Tennessee indicate that most easements are fairly recent. Only five parcels of 49,500 acres are recorded as pre-1990 easement purchases consisting almost entirely of the Tennessee National Wildlife Refuge, established in 1945 to provide habitat for migratory birds. Easements have been used at an increasing rate—from 59 parcels of 10,500 acres in the 1990s, to 328 parcels of 77,400 acres in the 2000s, to 420 parcels of 94,400 acres in the 2010s. Compared to land acquisitions in PAD-US, easements are typically used on much smaller parcels. The cost-effectiveness and availability of landowner assistance programs (e.g., Wetland Reserve Program) that fund easements allow many more landowners with smaller parcels to be part of the conservation process.
As of December 2019, NCED contains records for over 234,000 acres across 19 easement holders in Tennessee (Figure 16). Of the total acreage, 58 percent (136,846 acres) is forested. Land ownership of properties with easements is overwhelmingly private (86 percent), while most easements are held and enforced by non-

a a39
Characteristics of Protected Lands in Tennessee
Figure 16. Map of protected forestlands in Tennessee, showing demarcation by TDF districts.
governmental organizations (122,309 acres, 52 percent) and federal agencies (100,849 acres, 43 percent). Easements held by non-governmental organizations tend to be forested (88,337 acres, 72 percent). Easements held by federal agencies largely support working farms (30,703 acres in agricultural land use) and protect waterways and riparian zones (55,088 acres). Easements held by public and non-profit entities in the state are estimated at reporting completeness rates of 95 percent or greater, making Tennessee one of the most complete states in having records for easements in the U.S.
According to the Protected Areas Database-US (PAD-US), there are 2.8 million acres of protected forest land in Tennessee, and over half of those forested acres are
in GAP status 3 & 4 (multi-use or no restrictions). This means that roughly 20 percent of Tennessee’s forests are protected, and over half that amount may be available for active forest management. Additionally, the National Conservation Easement Database contains records for over 234,000 acres in Tennessee under easement status. Management objectives on those acres vary as much as the diverse forests that grow on them, but they all have a reason for being protected. Those reasons vary from securing and protecting a critical water supply, to preserving habitat for rare or threatened species, to preventing large acreage of forest land from development and deforestation, or to provide a safe and dependable supply of raw material for the forest products industry.

a a40
Tennessee Forests Objectives
CONSERVE. ENHANCE.PROTECT.PROTECT. CONSERVE. ENHANCE.For each objective, the FAP provides a summary of the current status and an explanation of threats that must be addressed in order to achieve the objective. Following those discussions, goals, strategies, and action steps are detailed.
During the many iterations of this FAP, it became evident that identifying individual threats to Tennessee’s forest was difficult. Many of the threats identified in the early drafts essentially overlapped with other threats. Many of the goals and strategies identified to address those threats also overlapped. As the document took shape, it became more useful and effective to paint the picture of what success looked like rather than focusing on individual threats. By focusing on four main objectives (or priorities), any and all threats would be, by extension, mitigated. This represents a holistic approach to managing Tennessee’s forest that is based on healthy markets, communication and partnerships.
This strategic plan considers and incorporates the US Forest Service’s national priorities for State and Private Forestry: 1) Conserve and Manage Working Forest
Landscapes for Multiple Values and Uses, 2) Protect Forests from Threats, and 3)EnhancePublicBenefitsfromTreesand
Forests.
AS STATED IN THE INTRODUCTION, THIS FAP PRIORITIZES CONSERVATION ACTIONS AROUND FOUR MAIN OBJECTIVES:
• Enhancing Forest Health and Resilience
• Expanding Market Diversification
• Maintaining and Improving Connected Landscapes
• Strengthening Wildfire Resilient Communities

a a41
Current State Forest HealthSince at least the early 1990s, forest health has been a term used to describe the relative condition of forests and forested landscapes, particularly pertaining to the presence of insects, diseases, invasive plants, and other biological agents that may affect forested ecosystems. Abiotic influences such as drought, heat and cold damage, mechanical damage, air pollution, and others are also factors that can greatly influence forest health. The term “forest health” is nebulous. Nevertheless, there are certain concepts that must be considered in any definition of forest health:
• The entire forest ecosystem must be considered, not just individual trees.
• The forest can be a natural forest or a plantation (excluding Christmas trees, nursery plantations, etc.).
• The presence of native insects or diseases may or may not denote a healthy forest, depending upon their extent and effect upon the forestland.
• The presence of non-native insects, diseases, or plants may or may not denote a healthy forest, depending upon their extent and effect upon the forestland.
• Human needs are as important as ecological needs.
Tennessee’s physiological and climate conditions in the southern U.S. determine forest types and land uses within the state. These factors also help determine patterns of commerce which may provide potential pathways for pests. With increasing populations and economic activity, Tennessee has become a crossroads of these potential pathways. Highways and waterways are potential pathways for pest introduction and are cause for concern regarding several pests currently found in other regions of the continent, many of which are exotic pests. The list of damaging pests can include gypsy moth, emerald ash borer, and Asian longhorned beetle from the north; southern pine beetle and cogongrass from the south; hemlock woolly adelgid from the east; and thousand cankers disease from the west.
Current and future forest pests pose serious threats to Tennessee’s forests. No one agency can handle the demands of planning, funding, detection, delimiting,
eradication, suppression, or other management activities to eliminate or slow their spread. Public and landowner education, state and federal regulations and/or quarantines, research, and other measures are important initiatives to address these threats and help to maintain the integrity of forest health. Managing a forest for forest health must be an integrated approach. Monitoring, detection, treating, developing acceptable thresholds for damage, practicing timely and sustainable silviculture, and supporting forest industries are all necessary components for such an approach to be successful. Sound silvicultural practices help keep forest stands vigorous and at relative low risk from native and some non-native pests. Additionally, biological control efforts, regulations, quarantines, and pesticides offer alternatives that can minimize damages to Tennessee’s forests. Several federal grants, cost-share programs, and educational activities are being used to inform citizens of the challenges and threats to Tennessee’s forests. As of 2020, more new and foreign insects and diseases are threatening our nation’s forests, many of which will eventually threaten Tennessee’s forests. Transferring technology, enforcing laws, leveraging partnerships, and educating our citizens, among other activities, will be critical to ensure that the functions and benefits of Tennessee’s forested landscapes will remain important contributors to Tennessee’s overall forest sustainability.
Forest ResiliencyResiliency is the degree to which systems (e.g., a forest ecosystem, aquatic system, or human community) can recover from one or more disturbances without a major (and perhaps irreversible) shift in composition or function. Connected, resilient forests—due to their structural and species diversity—are a major reservoir of biodiversity, contain a significant amount of the global terrestrial carbon stocks, and provide for watershed protection and livelihood and products for people. One example of managing for resilience would be implementing a periodic reduction in stem densities and surface fuels to reduce fire severity in dry forest. Managing for resilient lands also requires considering key connected climate corridors and flow zones where the movement of plant and animal species is likely to become concentrated.
To assist with identifying and mapping resilient and connected corridors, this FAP incorporates robust national datasets and maps produced by TNC, using
Enhancing Forest Health and ResiliencyPROTECT.

a a42
Enhancing Forest Health and ResiliencyPROTECT.
the organization’s Resilient Land Mapping Tool. TNC’s land and water conservation vision is to conserve a network of resilient sites and connecting corridors that will sustain North America’s natural diversity by allowing species to adapt to land use change, lack of appropriate levels of disturbance and climate impacts, and thrive. TNC’s Natural Highways and Neighborhoods Study—the first of its kind—maps climate-resilient confirmed biodiversity locations and species movement areas (zones and corridors) across Eastern North America. The study involved 12 years of work by over 150 TNC scientists in collaboration with external partners and provides a blueprint for conservation that represents all habitats while allowing nature to adapt and change (Anderson et. al, 2016). For more information on this interface, contact the Tennessee Chapter of TNC.
Pollen and fire records have informed the Resilient and Connected Network Climate Corridors work that maps movement of species populations over time in response to climate and vulnerable ecosystems. The impacts of climate change on Tennessee are expected to manifest as prolonged, intense rain events followed by severe drying periods, with increases in the range of extreme conditions over the next ten years. These dynamic wet and dry weather events will continue to cause a shift in invasive plant species within Tennessee’s forests and may also lead to unpredictable disturbances, such as increased wildfire occurrence and intensity. Although some native tree species in Tennessee are adapted to low intensity fires, proper forest management, such as conducting prescribed burning, will be required to ensure that wildfire will not present additional hazards, agricultural losses, or ecological losses. Lastly, shifts in climate will lead to altered ecological processes within the region because of an increase in non-native insect and disease activity and the movement of both migratory and non-migratory species. The impacts of lack of disturbance—potentially leading to lack of tree age class diversity, reduced habitat diversity, and forests that become less resilient to storm events and insect/disease outbreaks—will take long term, deliberate actions by all conservation professionals to remedy. More active forest management that fosters native systems is the proactive action to address climate change and impacts from lack of disturbance.
Proactive and sustainable forest management practices provide the mechanism to ensure healthy, productive, and resilient forests. These forest at their highest ecological potential will benefit all who depend on the ecosystem services they provide. They will be better positioned to endure climatic, ecological, and
abiotic threats. Forest landowners and managers must collaborate to increase awareness, publish widespread research, and incentivize productive forest management practices.
How are Forest Health and Resiliency Threatened? Forest HealthTree mortality occurs in all forests at usually low and predictable rates that are offset by growth of the remaining live trees. The impact of insects and diseases is generally widely scattered rather than concentrated and can create snags used by wildlife (e.g., woodpeckers and nuthatches) and small-scale canopy openings, thereby allowing light to penetrate to the forest floor and encourage understory growth. In some cases, insects and diseases can result in extensive tree mortality that is greater than annual growth rates and is outside the considered normal ecological forest condition. These cases of intense pest-related tree mortality are generally encountered in forests that are already stressed (e.g., temperature extremes, drought, prolonged flooding) or damaged (e.g., severe scarring from wildfire), or when an insect or disease encounters a tree species that has no natural defense (e.g., American chestnut trees and chestnut blight).
At a national scale, root diseases, bark beetles, and oak decline are the leading contributors to risk of tree mortality in the lower 48 states. Since 2010, the emerald ash borer has been the most devastating and uncontrollable exotic forest pest in Tennessee. Climate change is expected to exacerbate outbreaks of many forest pests as trees in many areas of the U.S. experience increased drought stress. The 2013-2027 USFS National Insect and Disease Risk Map (NIDRM) estimates 71.7 million acres are at risk of pest-related hazard in the conterminous U.S., and more than 14 million acres (3.5 percent of forested area) is at risk in Forest Service Region 8—Southern Region. In Tennessee, only 2 percent of the forested area is at risk of insect and disease hazard (Figure 17). In 2018, USDA Forest Service, Forest Health Protection released an update that accounted for reduced risk due to disturbance events (e.g., fire and pest-induced mortality) and treatments, including forest harvesting operations. The 2018 update reduced the area at risk in the conterminous U.S. from 71.7 million acres to 53.1 million acres. Total forested acreage at risk (which is defined in

a a43
this text as a more concentrated mortality as opposed to dispersed mortality) in Tennessee is approximately
51,000 acres (<< 1 percent of the forested area). See data methods in Appendix A.
Insect & Disease Risk West TN Highland Rim Cumberland East TN
At-Risk 400 17,600 3,500 29,300 Reduced Risk 200 6,800 2,600 300
Not at Risk 6,357,100 7,606,800 6,448,300 6,199,000 Total Area (ac) 6,599,500 7,668,600 6,462,500 6,241,000
Percent At-Risk of Mortality < 1 percent < 1 percent < 1 percent < 1 percent
Enhancing Forest Health and ResiliencyPROTECT.
1Risk reduced due to disturbance events (e.g., fire-related mortality) and forest harvesting.
Table 3. Area (rounded to the nearest 100 acres) at risk of losing at least 25 percent of standing live basal area greater than one inch in diameter in the period 2013-2027 if remediation action is not taken (National Insect and Disease Risk Map, 2018 Update).
Figure17. Map of insect and disease risk in Tennessee as determined by the US Forest Service.

a a44
Enhancing Forest Health and ResiliencyPROTECT.
Climate change is expected to increase the extent and frequency in outbreaks of both native and non-native forest insects and disease pathogens across the southeastern United States (McNulty et al. 2013). Not only does climate change affect the viability and spread of insects and pathogens directly—for instance, by allowing greater winter survival of pests and pathogens—but it also can increase the susceptibility of host trees to outbreaks due to drought stress and other factors (Dale et al. 2001). Several insect species, including southern pine beetle and hemlock woolly adelgid have already caused considerable forest damage in parts of Tennessee (Duerr and Mistretta 2013). Higher average temperatures are expected to enhance winter survival and exacerbate outbreaks of both southern pine beetle and hemlock woolly adelgid, as well as contribute to their expansion northward (Gan 2004, Paradis et al. 2008). Indeed, studies suggest that climate change could increase the risk of southern pine beetle infestations across the Southeast by 2.5-5 times and could result in 4-7.5 times the current annual mortality of pines (Gan 2004). Persistence of the hemlock woolly adelgid is projected to lead to a complete loss of eastern hemlock from the Cumberland Plateau and Mountains region by the end of the century (Paradis et al. 2008, Evans and Gregoire 2007, Dale et al. 2009), in the absence of coordinated mitigative action.
Forest ResiliencyForest resiliency is also being threatened by climate change. Climate change is projected to contribute to significant changes in the composition of associated plant species in both forest and grassland systems across Tennessee due to direct changes in suitable climate conditions (e.g., increasing temperatures and changes in precipitation patterns) and indirect changes (e.g., altered disturbance regimes such as wildfire and insect outbreaks). Some impacts will occur in the near term, while others are likely to take decades. For example, although direct impacts of higher temperatures and changes in moisture on terrestrial habitats may be gradual, more extreme disturbances such as wildfires and catastrophic floods could lead to dramatic changes in habitat within a relatively short period (Dale et al., 2000).
Higher temperatures due to climate change are expected to contribute to an increase in the frequency and intensity of wildfires across the Southeast, including an increase in the total area burned and longer fire
seasons. As conditions become more favorable for wildfires in the state, managers will increasingly need to weigh the potential ecological benefits of the following actions: (1) employ the “confine and contain” strategy, (2) considering where and when prescribed burns will be appropriate to manage fuels or restore ecosystems, and (3) the need to suppress fires for purposes such as improved air quality and protection of property (Stanturf and Goodrick, 2013, Mitchell et al. 2014).
In order to address the short-term impacts, Tennessee will focus on strategies that will encourage strategic silvicultural disturbance events in forests to create tree age class and species diversity, spatial and vertical diversity, and habitat diversity. As a result, these forests will be more resilient to spikes in insect or disease populations, wildfires and other climate derived stressors. Additionally, riparian restoration activities such as tree planting and invasive species removal can improve the health and resiliency of these areas in both rural and urban settings.
Long-term strategies include developing awareness of our changing climate conditions and increasing markets to incentivize forest management techniques such as removal/treatment of invasive species, planting appropriate tree species, and managing for tree species that are appropriate for the location. For more information on the impacts of the changing climactic conditions on our forests see the 2015 Climate Change Vulnerability Assessment for Tennessee Wildlife and Habitats (Glick, et. al, 2015).
Goal and Strategies
Listed below are the goal, strategies, and a brief summary of each strategy developed to address this objective:
GOAL: To improve and sustain the health, diversity and resiliency of Tennessee’s forests.
Strategy 1. Strengthen forest health monitoring, treatment, prevention and management of forests that are threatened by invasive forest pests and plant species.
This challenge to Tennessee’s forests is not new. The transformation of American rural and urban forests by non-native insects and pathogens began hundreds of years ago. As international trade and environmental

a a45
pressures continue to accelerate, we need to continue and increase our efforts to protect forests and minimize and mitigate impacts.
Action 1. Use technology such as LIDAR, unmanned aerial vehicles, and Geographic Information Systems (GIS) to increasetheefficiencyofforesthealthmonitoringefforts.
Action 2. Secure and sustain funding for current and future strike teams to implement forest health treatments.
Action 3. Support initiatives, such as Firewood Scout and Don’t Move Firewood, to create awareness of non-native invasive pests in both urban and rural areas.
Action 4. Help initiate and support private sector service-based industries, such as invasive species consultingfirms,toimplementapplicable forest management prescriptions.
Action 5. Diversify the age structure and species composition of the forest by utilizing science-based forest stand regeneration practices.
Action 6. Maintain tree growth by utilizing science-based forest stand intermediate treatments.
The Tennessee Division of Forestry Hemlock Woolly Adelgid Strike Team Hemlock woolly adelgid (HWA), Adelges tsugae, is a non-native invasive insect causing extensive mortality and decline in eastern hemlock (Tsuga canadensis) and Carolina hemlock (Tsuga caroliniana) populations across Tennessee. It was first discovered in Tennessee in 2002 and has since spread westward to nearly all Tennessee counties in the native hemlock range. The potential ecological impacts of this exotic pest are comparable to that of Dutch elm disease and chestnut blight. Over the past 18 years, state and federal agencies, private non-governmental organizations (NGOs), research institutes, and other organizations have formed a variety of partnerships to combat the threat of HWA. Strategies of these partnerships have adjusted with the movement of this pest, but the common objectives of preserving representative populations of hemlocks on protected lands and educating the public on HWA management techniques have endured. In 2002, the Tennessee Hemlock Conservation Partnership (THCP) was officially formed and is in operation to this day.
In order to provide “boots on the ground” capacity to accomplish the tactical and operational strategies set forth by the THCP, TDF created the first ever Hemlock Woolly Adelgid Strike Team in 2014. To date, the HWA Strike Team has chemically treated over 53,800 hemlocks over 4,500 acres across state owned forests and forests that are protected by conservation easements (Figure 18); facilitated the release of tens of thousands of predator beetles reared at the Lindsay Young Beneficial Insects Laboratory at the University of Tennessee (Figure 19); and has hosted dozens of landowner workshops across the entire hemlock region, which have resulted in thousands of private citizens learning what HWA is, why treating for HWA is important, and how they can be a part of a bigger conservation story. With the continued support from the USDA Forest Service, the Department of Agriculture, and the partners in the THCP, TDA-DF will continue to operate the HWA Strike Team to manage this pervasive forest health threat and save the hemlock tree species.
Figure 18. Chemically treating hemlocks for HWA (photo courtesy of Jackie Broeker, TDF Strike Team Coordinator).
Figure 19. Preparing the release of biological control beetles for HWA (photo courtesy of Jackie Broeker, TDF Strike Team Coordinator).
Enhancing Forest Health and ResiliencyPROTECT.
SUCCESS STORY
Figure 18 Figure 19

a a46
Action 7. Ensure forest management practice recommendations by conservation professionals include appropriate measures that exclude, limit, or eradicate non-native forest pests (diseases, plants, and animals).
Action 8. Develop or support initiatives to maintain or restore historic diversity within ecoregions by maintaining or reestablishing native forest tree species: for example, the shortleaf pine and white oak initiative.
Action 9. Encourage and support native plant inventories and studies on state and private forestlands where native plant species knowledge is lacking.
Action 10. Increase the capacity to provide forest landowners with comprehensive, multi-resource forest management planning.
Enhancing Forest Health and ResiliencyPROTECT.
SUCCESS STORYThe Tennessee Division of Forestry Prescribed Fire Strike TeamPrescribed fire is an incredibly effective and economical tool to achieve certain forest management objectives. When implemented correctly, many immediate and long-term goals can be achieved. However, when implemented incorrectly, serious and irreparable damage can be done to a stand that could last for decades, or worse, the damage might require complete stand liquidation. Additionally, prescribed fire cannot be safely implemented without adequate staffing, equipment, and training by practitioners.
It was to this end that in 2018 the TDF created a dedicated team of prescribed fire experts to provide this service to public and private partners statewide (Figure 20). Equipped with specialized training and state of the art equipment, and the country’s most advanced wildland fire suppression bulldozers, this team uses prescribed fire in the most effective ways to achieve forest management objectives that include site preparation, competition control, hazardous fuel reduction, and wildlife habitat creation/enhancement.
Figure 20. A member of the TDF Prescribed Fire Strike Team burning a field for wildlife objectives (photo courtesy of Jackie Broeker, TDF Strike Team Coordinator).
Strategy 2. Maintain or re-establishfire-adaptedecologicalcommunities.
With limited resources and thousands of acres of forests that historically relied on fire to aid in their growth and productivity, it is important to utilize landscape level mapping and modeling to identify where those forests are located and take actions to improve those forests’ resiliency.
Widespread suppression of fire during the past century has changed forest species composition. In many situations this change is acceptable and beneficial. In other situations, the results have been a change in ecological processes that have created less resilient forests. There are situations, either due to

a a47
management objective or forest stand dynamics, where fire does not play a role in management. Conversely, there are situations, more prevalent than previously acknowledged, where fire is exactly the prescription to address the need. Land managers must be diligent in trying to understand the role of fire in altering forest ecological processes and apply, or continue to prevent its occurrence, based on landowner objectives, ecological function, and forest resiliency. With a better understanding of where prescribed fire is appropriate for forest management and fire’s role in impacting forest stand dynamics, land managers can slowly reintroduce prescribed fire to improve forest resiliency. As a secondary impact, prescribed fire will also aid in reducing fuels that may increase severity and frequency of wildland fire.
Action 1. Build capacity in Tennessee’sprescribedfireprogram and Tennessee’s Prescribed Fire Council to better provide objective-driven services and increased education and awareness of the roleofprescribedfireinforestmanagement.
Action 2. Establish and track annual accomplishments for prescribedfireinthestateofTennessee.
Action 3. Develop and implement a statewide Memorandum of Understanding (MOU) for all federal, state, and NGO partners to combine resources to collaboratively implement prescribedfire.
Action 4. Encourage the Prescribed Fire Council to
Managing for Restoration and Resilience through Collaboration In 2010, the Tennessee Chapter of The Nature Conservancy began a partnership with 12 other organizations to develop a consensus-based recommendation for the restoration and management of the North Zone of the Cherokee National Forest. The process used maps of the expected vegetation based on biological and physical settings called Ecozones and compared them to the current vegetation. This collaborative process (known as Landscape Conservation Forecasting) resulted in ground-breaking recommendations for the forest management and restoration of North Zone of the Cherokee National Forest. Since then, similar work has been done to develop collaborative recommendations for the restoration of the Great Smoky Mountains National Park and the South Zone of the Cherokee National Forest, as well as several other National Forests in adjacent states.
Figure 21. Prescribed fire in Tennessee forest (photo courtesy of Katherine Medlock, TNC).
Enhancing Forest Health and ResiliencyPROTECT.
SUCCESS STORY

a a48
Enhancing Forest Health and ResiliencyPROTECT.
championadvancingfirescience, partnering with entities such as TDF, TNC, University of Tennessee, the Oak Woodlands and Forests Fire Consortium (oakfirescience.com),andConsortium of Appalachian Fire Managers and Scientists (appalachianfire.org).
Most recently, these same collaborative methods (which are used to develop recommendations for managing our forests for resilience into the future) are being developed for forests of the Cumberland Plateau of Tennessee, which can include private and public land ownerships. Scaling this approach to the remainder of fire adapted forests in Tennessee is on the horizon. Recommendations will be to mimic ecological disturbances with prescribed fire and forest management techniques, as pictured in Figure 21.
Strategy 3. Expand reforestation, conservation, and protection efforts of forestlands along riparian zones, floodplains, and in source water watersheds.
Land-use change and increase in urbanization have resulted in Tennessee citizens experiencing flooding events outside of defined flood zones. Climate models and recent data demonstrate that Tennessee will continue to experience increased rain events (frequency and intensity), causing floods and thus a greater impact on people residing in flood plains. As large-scale human interaction with flooding is not reversable in these areas, the best action TDF and its partners can take against damaging flood events is to increase tree planting in riparian zones and floodplains. Additionally, as Tennessee’s population continues
SUCCESS STORYThe Elk and Duck River Watershed Forest and BufferInitiativeDue to its rich aquatic life, the Elk River ranks as one of the top three highest aquatic conservation priorities in Tennessee. The Duck River is among the most biodiverse freshwater bodies in the world. It is one of three major “hot spots” for fish and mussel diversity on the planet, according to the US Geological Survey. The Duck River’s wealth of freshwater animals was featured in an article appearing in the February 2010 issue of the National Geographic magazine. In this one river, 151 species of fish, 60 species of freshwater mussels, and 22 species of aquatic snails can be found. The Duck has more fish varieties per mile than any other river in North America. In addition to hosting incredible biological diversity, the Duck River serves as the sole water source for 250,000 people in Middle Tennessee. Therefore, maintaining and improving water quality of these rivers are of great importance not just for wildlife, but for the human population as well.
Conservation partners such as the Tennessee Forestry Association, TDF, TNC, NFWF, Natural Resources Conservation Service (NRCS), Tennessee Wildlife Resources Agency, and the US Fish and Wildlife Service have
provided grant funding and other assistance that has helped to identify critical riparian and forested areas, and they have also provided cost share incentives or technical assistance to landowners to install, maintain, or enhance these areas through active forest management, as shown in Figure 22. Initiatives such as these that protect riparian areas and keep forests as forests can serve as models to replicate in other watersheds that provide clean public water supplies.
Figure 22. White oak seedling protected by a tree tube and planted to restore a riparian area (photo courtesy of TDF Area Forester Chris Carney).

a a49
to grow substantially, people will continue to exert pressures on the state’s waters to provide clean water for communities. Forests play a vital role in cleaning our waters.
Action 1. Engage conservation partners to ensure that appropriate species and quantity of trees are being grown to address the resource need.
Action 2. Increase tree planting in strategically prioritized riparianzonesandfloodplains.
Action 3. Develop and support initiatives to establish or maintain forest cover that protects public water supply watersheds and streams, such as Farm Bill- and National Fish and Wildlife Foundation-funded programs.
Action 4. Engage in broader partnerships within and across Tennessee state borders to achievelargerfloodplainandriparian restoration goals.
Action 5. Increase awareness ofthebenefitsofforestedwatersheds and wetlands for providing sustainable and high-quality drinking water supply.
Action 6. Ensure landowners receive applicable technical assistance in identifying opportunities to create, enhance, and maintain riparian buffers.
Action 7. Establish forested corridors at landscape scale with more intact riparian zones and mixed hardwood corridors.
Action 8. Increase acreage of conserved and properly managed forestlands in source water watersheds.
Figure 23. Private landowners meet on-site with a local forestry consulting firm on the opening day of the forest carbon inventory of their property (photo courtesy of Trish Johnson, TNC).
Enhancing Forest Health and ResiliencyPROTECT.

a a50
Enhancing Forest Health and ResiliencyPROTECT.
Doe Mountain Recreation AuthorityIn 2012, TNC purchased the 8,600-acre Doe Mountain property in Johnson County on behalf of the state of Tennessee. Ownership was soon transferred to the Doe Mountain Recreation Authority, which provides local governance for Doe Mountain’s adventure-based, multi-use recreational trails system. Because the Authority does not receive an annual appropriation from the Tennessee Legislature, in 2019 the Authority’s Board of Directors chose to register the entire property as a forest carbon project, upon advice from TNC’s Working Woodlands Program. Revenues from carbon offset sales are dedicated to supporting Doe Mountain’s operating expenses and leveraging public grants for trail construction and maintenance, all the while ensuring the conservation of the property’s climate-resilient forest resources. A primary goal of the Doe Mountain project is to catalyze locally owned businesses such as campgrounds and guide services that attract jobs and tourism-based revenue to an Appalachian Regional Commission-designated, economically “at risk” county.
SUCCESS STORYStrategy 4. Support participation of private forest landowners across a wider range of ownership types and sizes in carbon markets.
As of 2020, only a few private forest landowners in Tennessee have been participating in voluntary and regulatory carbon markets and gaining the economic incentives to protect and improve their forests. The high costs of participation in markets means that typically 2,000 acres are needed to make projects feasible and attractive to landowners. Many partners and funders are needed to unlock the potential for smaller forest landowners, as well as publicly owned forests, to participate in carbon markets (Figure 23); their inclusion would result in greater potential for forests to mitigate the impacts of climate change.
Action 1. Engage extension agencies to develop outreach and educational programs to teach private forest landowners and corporations about the co-benefitsofcarbonprojectsandforest management.
Action 2. Educate decision-makers and policy-makers on the potential of carbon projects to provide economic opportunities to rural communities.
Action 3. Evaluate carbon projects on public owned property that can demonstrate carbon programs while providing economic value to rural communities.
Action 4. Implement forest carbon programs like Family Forest Carbon Initiative that

a a51
Enhancing Forest Health and ResiliencyPROTECT.
enable landowners who own less than 2,000 acres of forest land to participate in carbon markets (see Regional Initiatives for more information on this program).
Strategy 5. Support research and monitoringeffortswhichtrackchanges to forest composition.
Forest inventory data is pivotal in understanding landscape-level forests’ species composition and structural diversity. Utilizing and building on these data can help develop science-based forest management techniques and programs to create healthier, more resilient forest that are consistently monitored in the long term.
Action 1. Utilize and build upon existing data such as those procured and analyzed by USFS Forest Inventory and Analysis (FIA) program to understand composition shifts to help inform forest management activities.
Action 2. Explore and incorporate forest composition monitoring tools such as satellite imagery and forest disturbance mappers.
Strategy 6. Design and implement forest management prescriptions to achieve healthy and resilient forests.
Tennessee’s forests are in a 30-year trend of increasing inventory of declining tree grade, which is a result of sustained high-grading practices (e.g., removing the highest quality trees in the forest and leaving low-quality trees) and a lack of diverse forest products markets that could create demand for low-quality trees. The increasing inventory of declining tree grade
Figure 24. A mixed planting of white oak, shumard oak, and persimmon seedlings in Lincoln County (photo courtesy of TDF Area Forester Chris Carney).

a a52
Enhancing Forest Health and ResiliencyPROTECT.
indicates lessening of disturbance on the landscape, resulting in older forests lacking balanced age class distributions. At the landscape level, our state’s forests are less resilient and more vulnerable to devastating populations of insects, diseases, and other forest health stressors. Through the research and implementation of forest management prescriptions and best management practices (BMPs) that are specifically designed to promote forest resiliency, this trend can slowly be changed over several decades, as shown below in Figure 24 and Figure 25.
Tennessee’s abundance of karst geology and caves (over 10,000 features documented, more than any other state) poses an additional challenge for responsible forest management. In karst areas—which are characterized by caves, sinkholes, and underground drainages—groundwater and surface water are closely connected, and water often transitions easily between the surface and below ground as it moves through the soluble limestone of a karst watershed. Areas where karst geology overlap with forest management practices are especially sensitive to groundwater impacts.
Figure 25. Shortleaf pine and oak forest restoration project on TNC’s Bridgestone Nature Reserve at Chestnut Mountain, White County--left photo, 2019; below photo, 2020 (photos courtesy of Terry Cook, TNC).
a a53
Enhancing Forest Health and ResiliencyPROTECT.
In Tennessee, karst geology is highly concentrated in four major areas (within the Highland Rim, Cumberland and East TN TDF administrative boundaries). These areas are mapped in the TN SWAP, Chapter 1, page 3:
• The Cumberland Plateau escarpment• The Ridge and Valley• The Pennyroyal Plateau (a portion of the
Western Highland Rim running from Stewart to Sumner Counties)
• The Highland Rim Escarpments (East and West)
Of these areas, the Cumberland Plateau escarpment (Cumberland District in the TDF administrative boundaries) is especially vulnerable to water pollution impacts. The vertically integrated, porous geology of the Cumberland Plateau, combined with its high density of forest cover, places this area of Tennessee at the highest risk for water pollution resulting from land management practices that are not sensitive to karst geology. Through continued education, research and application of BMPs that target karst features, the risk to our groundwater can be lessened.
Action 1. Support silviculture research that explores the impact of various planting or natural regeneration patterns and species mixtures on ecosystem resilience, productivity, and carbon storage.
Action 2. Educate forest landowners and conservationprofessionalsonthebenefitsofmixed forest plantings or natural regeneration that results in long term forest health and resiliency.
Action 3. Promote federal and state cost-share programs that encourage mixed plantings, timber stand improvement, and natural regeneration.
Action 4. Promote research and implementation of cave and karst BMPs in forest management operations.
Karst geology in forested regions requires best management practices to include erosion and sediment controls, buffer zones, low gradient temporary roadways, adequate storm water runoff, and strict pollution controls. In addition, due to the sensitivity of karst ecosystems and freshwater sources, pesticides, herbicides and fertilizers should be used only outside of the established buffer zones. Waterways (above or
below ground) in karst regions should not be rerouted, and the proper management of debris and excess forest product should be exercised. BMPs can be implemented through marking karst features in order to establish buffer zones, minimize soil disturbance, and protect riparian areas and sensitive wildlife habitats.
Strategy7.Supporteffortstoincreasethenumberofcertifiedforestsandtheavailabilityofcertifiedlogs and wood products.
Certification creates a framework for forest management planning. It also drives significant improvements on the ground, such as the protection of high conservation-value habitats and plant and animal species; increased forest structure and habitat diversity; expanded riparian areas; better working conditions; and attention to community values. Log and wood product diversity will add to the tools that forest industry has to provide enabling conditions for more open-resource markets aiding in landowner ability to manage for forest health.
Action 1. Educate private forest landowners andprivateforestconsultantsonthedifferentcertificationsystems,suchasSustainableForestryInitiative, American Tree Farm, and Forest Stewardship Council.
Action 2. Investigate opportunities to incentivize private forest landowners to pursue third-party certification.
Action 3. Support the use of Landscape Level Management forest management plans to allow more private forest landowners to gain entry into third-partycertificationsystems.

a a54
Expanding Market DiversificationCONSERVE. ENHANCE.
Current State Market diversification in the forest products industry would help ensure there are adequate markets for most forest products found on any given landscape, allowing forest management to be performed commercially. This section of the FAP focuses on traditional forest product markets. However, it should be noted that other markets exist, such as carbon markets (as discussed in the Enhancing Forest Health and Resiliency section) that could incentivize forest landowners to be more active in managing their forests as well.
Although Tennessee is predominantly composed of hardwood forests, simply having high-volume hardwood markets does not satisfy true market diversity. These markets would need to be strong across all grades and
across the most dominant species. For example, red oak has a strong low-grade market but a weaker high-grade market. In contrast, hard maple markets are exactly the opposite. Cultivating markets that utilize a wider range of species for a wider range of uses could help bridge those gaps. True market diversity would include pallet stock and pulpwood classifications in hardwood as well. Although Tennessee forests are mostly hardwood, there is still a large volume of pine on the landscape. Market diversity would see markets for pulpwood, chip-n-saw, and sawtimber in the regions with heavier pine composition forests. Market diversification does not mean that every stem in a given stand has value, or even a component of dollar value attached; it does mean that there are broad choices for how to merchandise a majority of forest products across the state.
Figure 26. Primary wood-using mills in Tennessee.

a a55
Expanding Market DiversificationCONSERVE. ENHANCE.
Active Mills Total Firewood Sawlogs Chips Other
East TN District 40 2 23 1 14
Cumberland District 19 1 15 0 3
Highland Rim District 98 0 85 0 13
West TN District 43 0 40 0 3
Table 4. Wood using mills in Tennessee by type and administrative boundary.
In 2017, Tennessee’s forest industry accounted for 100,000 jobs and $24 billion in total economic impact (Menard, et. al, 2019). According to the 2017 Timber Product Output report, total timber output exceeds 230 billion cubic feet per year with over 50 percent being sawlogs. The Hardwood Federation reported that in 2016 Tennessee was ranked #2 in hardwood sawmill
production by total dollars output among all hardwood-producing states. The main production in Tennessee is hardwood grade lumber and railroad ties. Tennessee has over 200 active primary sawmills (Table 4, Figure 26) spread across the state. However, that number peaked at 255 and has been in steady decline since 2011.

a a56
Expanding Market DiversificationCONSERVE. ENHANCE.
Tennessee’s strong position in the national and international sawtimber market, coupled with a persistent lack of market availability for lower grade material, has perpetuated a continual degradation of overall sawlog grade across all stands. Recruitment of smaller stems into the sawtimber class continues, but the quality of those stems is gradually declining. As indicated in the Forest Assessment section of this plan, the area of forested land containing sawtimber has increased from 1999 to 2016. However, tree grade declined during that same assessment year, as gradeable logs that did not meet grade three standards increased from 15 percent to 46 percent.
To further illustrate this situation, a wood grade analysis using Forest Inventory and Analysis (FIA) data was conducted within a 50 linear mile radius of a Tennessee sawmill that produces hardwood lumber predominantly from oak, poplar, ash, cypress, cherry, walnut, and sugar maple. The period of assessment was between 2001 and 2016 (Figure 27).
FIA grades sawtimber-size trees as Grade 1, Grade 2, Grade 3, or Grade 4, but they also have a category of “graded but does not contain gradeable log” which has been abbreviated to “no log.” Because tree grade further restricts sample size, these analyses consider all landowners and all species.
Grade sawtimber dropped proportionally and dramatically over the period considered. Grades 1 and 2 made up 48 percent of sawtimber in 2001 but only 21 percent in 2016. And while the total amount of sawtimber available in the area of interest increased over the period, almost all of those gains (80 percent) were in the “Below Grade 3” category and the rest were in Grade 3. All other grade categories decreased between 2001 and 2016 despite the increase in total volume.
Figure 27. Percent of total board feet in each tree grade category for two decades of Forest Inventory and Analysis data collection around a Tennessee sawmill in the Cumberland District.

a a57
Expanding Market DiversificationCONSERVE. ENHANCE.
The decrease in tree Grade 1 is particularly concerning considering that timber is a slow growing crop and the markets ability to absorb volume in a given year is only a small portion of the total standing timber. In addition, the increase in volume of below grade timber influences the average grade of any given stand of timber, which raises economic barriers to harvest operations. White oak is a high value species that shows a concerning change in standing volume of grade timber.
The total volume of timber has not decreased, and in several cases has increased (Figure 28). Timber volume in tree Grade 1 and 2 has decreased dramatically, while timber volume in tree Grade 3 and below grade has increased. The number of large trees has not changed, but their quality has decreased.
Figure 28. Volume of timber, in each tree grade category for two decades of Forest Inventory and Analysis data collection around a Tennessee sawmill in the Cumberland District.
HowIsMarketDiversificationThreatened? The lack of adequate lower grade markets leads to the continual removal of more valuable logs while leaving the lower grade logs to remain in the forest (a practice referred to as high grading), which continues the trend of long-term stand degradation. For true sustainability in forest management, Tennessee needs to have markets that allow for all silvicultural prescriptions to take place in order to give stands the opportunity for grow to their maximum potential and remain healthy throughout their rotation. This lack of market diversification reduces the silvicultural choices for forest landowners, both public and private, and leaves them with the decision to “take the best and leave the rest.”
Tennessee’s forest industry faces several additional threats. Lack of staffing for logging and sawmills is a continual issue. The hard labor, lower wage jobs are susceptible to lack of staffing or high turnover. Trucking demand is much higher than the available supply of

a a58
Expanding Market DiversificationCONSERVE. ENHANCE.
drivers, which makes both shipping logs into the mill and lumber out of the mill a difficult challenge. The high cost of workers compensation insurance is likely to drive some mills out of business. According to the American Hardwood Export Council, 60 percent of all U.S. hardwood lumber production is exported, and as of 2018, 50 percent of all exports were sent to China. The overwhelming lack of diversification in export markets makes lumber production directly tied to manufacturing demands in China. In late 2018 and 2019, China’s strong influence was apparent as China curtailed imports, and total overall lumber production and lumber prices declined.
Goals and Strategies
Listed below are the goal, strategies, and a brief summary of each strategy developed to address this objective:
GOAL: To create, strengthen, and retain diverse, competitive sustainable forest products markets.
Strategy 1. Expand markets for low-quality hardwood forest products, including pulp, biomass, biofuels, and urban waste wood.
Many of our forests are currently in a degraded state from many rotations of “cutting the best and leaving the rest.” Silvicultural prescriptions in these forests that would result in more productive, healthy, resilient forests often are not financially viable because there is insufficient demand and processing capacity for the lower grades of wood that need to be removed.
Agriculture Enterprise Fund Helps Create MarketDiversificationThe wood products industry in Tennessee is still seeing growth. Northeast Forest Products in Morristown received a grant from TDA, Agriculture Enterprise Fund of $50,000 to offset cost of building a new sawmill that will create railroad ties and construction mats (Figure 29). This type of project that focuses specifically on the utilization of low-grade material for industrial use is a prime example of the types of market expansion needed in Tennessee.
Figure 29. TDA staff pictured with Senator Steve Southerland and Agriculture Enterprise Fund recipient Northeast Forest Products, LLC.
SUCCESS STORY

a a59
The need for diverse forest product markets is not unique to Tennessee; it is especially evident in states with predominantly hardwood forests. Longer rotation cycles require long-term financial commitments by the landowners, and an understanding that intermediate cashflows are necessary. Landowners will also need to maintain silvicultural manipulation to grow a high-quality saw logs of the needed species 80-100 years in the future at a profit. Otherwise, only the most valuable wood products can be removed cost-effectively, or high-graded, leaving even poorer growing stock on the land. Even with such high grading, the net present value most times is negative. However, generating intermediate income cashflow by removing non-crop trees can reduce cost. It can also increase crop tree value and help make the net present value positive. Still, viable markets for the wood removed in these intermediate treatments are needed to provide income or to at least cover costs.
Biomass and biofuels are examples of how to utilize smaller or low-quality stems either as an end rotation objective or as an intermediate treatment. However, currently there are no woody biomass facilities in Tennessee that process roundwood into biomass or biofuels. In 2019, the University of Tennessee was awarded nearly $1 million to study woody biomass feedstock logistics for commercial biorefineries in the southeastern United States. Investing in this type of research is critical to moving the biofuel industry forward in Tennessee.
Urban waste wood utilization has become a more common discussion since the emerald ash borer (EAB), which was detected in Tennessee in
ForestryWorks! ForestryWorks! is a collaborative effort of the Forest Workforce Training Institute and other partners within the forest industry to develop a pipeline of qualified workers for the logging and wood product manufacturing industries. The Tennessee Forestry Association is spearheading this effort to bring the ForestryWorks! Program to Tennessee, thus elevating the initiative to a regional level.
Expanding Market DiversificationCONSERVE. ENHANCE.
SUCCESS STORY

a a60
2010, has moved into 63 counties and at least three of the four major cities (Knoxville, Chattanooga, and Nashville). City managers and urban foresters are faced with major logistical challenges when developing a plan to treat and/or remove hundreds of thousands of ash trees that are at risk or have been killed by EAB. Urban waste wood markets such as boutique sawmills, boilers, or mulching facilities can provide these city managers with options to manage a significant influx of woody material while offsetting costs to manage the treatment, removal, and replanting operations.
Action 1. Develop, implement, and support information and education programs to create awareness in decision-makers and law-makers on how diverse markets can support healthy forest and active forest management.
Action 2. Continue to support TDA Business Development Divisioneffortstosustainexisting and new domestic and international forest products markets.
Action 3. Support research to identify low-quality wood utilization methods and businesses.
Action 4. Partner with the Department of Economic and Community Development to support and develop forest product markets.
Action 5. Broaden opportunities for using urban waste wood as an energy source.
Action 6. Incentivize a service industry capable of
Expanding Market DiversificationCONSERVE. ENHANCE.
The South Zone Collaborative Group - Cherokee National ForestIn 2016, the Cherokee National Forest initiated a collaborative group convened by TNC to establish priorities for ecological restoration in areas where white pine and Virginia pine are crowding out other native species, compromising the forest’s ecological integrity and habitat diversity. The South Zone Collaborative Group comprised 13 partners, representing diverse organizations and missions. Over the next two years, the South Zone Collaborative Group met to discuss the forest’s most pressing needs for ecological restoration. The Collaborative Group’s recommendations were submitted in December 2018. The USFS approved the Collaborative Group’s recommendations and will begin restoration of up to 62,000 acres over a 10-year period across the entire South Zone of Cherokee National Forest (Figure 30). As a result of restoration activities, timber will be harvested, which will create more economic activity into the local economies.
Figure 30. Tennessee conservationists viewing results of restoration on the South Zone of the Cherokee National Forest.
SUCCESS STORY

a a61
implementing applicable forest management prescriptions by targeting low-quality stem removal and timber stand improvement activities.
Action 7. Improve the ability for wood to be transported longer distances to available mills.
Action 8. Maintain and grow an international and domestic marketing campaign emphasizing the quantity and quality of Tennessee’s hardwood resource.
Strategy 2. Encourage forest landowners in woodshed counties to deliberately plan for and manage their forests sustainably into the future.
Woodshed counties are defined as the top 60 percent of primary forest product-producing counties based on the most recent Forest Inventory and Analysis Program’s Timber Products Output survey. According to Butler et. al (2013), forest landowners with management plans are 2.7 times more likely to meet management objectives including harvesting timber and 2.4 times more likely to reforest their property. By increasing the engagement of landowners in Tennessee woodshed counties to write management plans (stewardship, forest health, or prescription plans) and act on them, it can be assumed that the forest product markets in those areas will become stronger and new markets may become established.
Action 1. Provide education and incentives for forest landowners to engage in active forest management
Action 2. Encourage landowners
Stinging Forks Falls Natural Area Forest Management ProjectStinging Forks Falls Natural Area is in Rhea County. The 783-acre property is situated around the Stinging Fork gorge, which features a 30-foot waterfall. The waterfall empties into a meandering creek that flows through second growth forest communities of eastern hemlock, birch, maples, and ash. Mixed oak-pine forests can be found along the gorge bluffs, while a significant portion of the natural area is planted loblolly pine. The land was once owned by a nearby papermill, which divested itself of the property in the mid-2000s. It is now owned and managed by the Tennessee Department of Environment and Conservation.
In 2014, TDEC partnered with the TDF to treat the hemlocks in the Stinging Fork gorge to protect them from the hemlock woolly adelgid. Once that project was well under way, the two state agencies turned their attention to a different forest health threat, the southern pine beetle (SPB). Drought was prevalent in the summer and fall of 2016, causing managers to become concerned that the loblolly pine plantation, which had not been thinned or managed since TDEC took ownership of the property, was going to produce and harbor a SPB population that would eventually make its way onto the adjacent private land. In true partnership fashion, the two agencies leveraged their resources and developed a long-term traditional forest management plan for the pine plantations on the natural area. This was the first project of its kind in Tennessee. Even though traditional forest management is not the mission of TDEC, they were able to lean on their sister agency, TDF, to assist them in managing their forest resource.
In the fall of 2019, the first loblolly pine sale occurred on the Stinging Fork Natural Area. This was a tremendous accomplishment in demonstrating cooperation between two state agencies in managing public forests for forest health. This project also laid the foundation for future partnership projects that entail prescribed burning, managing for early successional habitat, shortleaf pine restoration, and additional forest management activities (Figure 32
Figure 31. Active pine harvesting operation at Stinging Forks Natural Area, Tennessee (photo courtesy of Jason Miller, TDEC).
Expanding Market DiversificationCONSERVE. ENHANCE.
SUCCESS STORY

a a62
to procure a professional forester to develop forest management plans that meet landowner objectives and result in increased management plans.
Action 3. Develop and implement a monitoring infrastructure to measure whether landowner objectives are being met.
Action 4. Develop and implement landscape-level contributions to which each forest landowner contributes and share the story with education decision-makers.
Action 5. Utilize remote communications technologiestomoreefficientlyandeffectivelyengage small groups of landowners.
Strategy 3. Identify and employ data collection methods to better understand wood removal
and utilization across all ownership types in Tennessee.
The USFS FIA Program facilitates a Timber Products Output survey that estimates industrial and non-industrial uses of roundwood in a state. All primary wood-using mills are surveyed, and the report includes size and composition of primary wood-using industries as well as use of roundwood by product, by species, and by geographic location. However, the statistics generated from the USFS FIA Timber Products Output survey do not address all questions concerning harvesting operations, harvest utilization, and exports. Therefore, TDF developed an additional survey to be implemented alongside the Timber Products Output survey to address questions from TN Department of Agriculture, Divisions of Business Development and Forestry. County level removals and wood product processing data
Expanding Market DiversificationCONSERVE. ENHANCE.
Figure 32. Primary mills in proximity to protected lands. Raw material can be sourced both from private property (white space) or from protected lands where timber harvesting can occur.

a a63
Expanding Market DiversificationCONSERVE. ENHANCE.
are extremely useful when engaging county officials or producing more region-specific analysis. Additionally, using remote detection of harvesting operations can help managers better understand where wood is being harvested and how to evaluate the sustainability of harvest. This remote-sensing analysis will be complementary to TPO and agency-developed surveys.
Action 1. Develop a synchronized Monitoring and Evaluation(M&E)programtomeasureeffectivewood removal practices by using both quantitative and qualitative data, which incorporates collaboration between existing databases.
Action 2. Utilize technology to identify change in presence or absence of forests to rapidly detect wood removal.
Action 3. Gain better understanding of Tennessee wood product export activities.
Strategy 4. Create and enhance a strong and sustainable forest industry workforce to provide opportunities for long-term career development.
In order to create and support a vibrant, diverse forest product marketplace, raw material must be available as well as a sufficient labor force. Tennessee’s forest industry is struggling to find non-skilled and skilled labor to meet workforce needs. These needs are not being met for several reasons. They include a general lack of awareness of job opportunities within the forestry sector; the physically demanding nature of these jobs; the location of many forest-industry jobs in rural areas; a scarcity of the required skill set to perform the more complex jobs; and social issues, such as drug use and the opioid crisis. All of these issues can disqualify potential employees from consideration.
The workforce challenges are especially prevalent in the logging sector. Loggers are the foundational link in the industry’s supply chain. They harvest and deliver the raw materials that drive the industry. Work is hard, in many cases not viewed with favor, and current generations have little interest in continuing established family logging businesses. The lack of stability in the logging workforce is causing some mills to downsize and/or hold off expansion projects. Workforce development programs should be created to provide education, training, and job placement support specific to the forest industry.
Action 1. Partner with institutions, industry associations, state and federal agencies, and non-profitorganizationstoleverageresourcesto develop programs to create jobs, and recruit, train, and retain employees for the forest products industry.
Action 3. Partner with the University of Tennessee Forest Products lab to address the technical and manufacturing needs of our current forest industry.
Action 4. Promote forest products utilization technology transfers as a means to help our current forest products industry remain competitive.
Action 5. Partner with the Department of Labor and Workforce Development to help develop forestindustry-specificworkforceprogramsandmake those programs available to the forest industry.
Strategy 5. Ensure sustainable wood supply by keeping forests working and encouraging responsible forest management.
Agriculture and forest industries are the top-ranking drivers of economic activity in rural Tennessee. The majority of the wood harvested to supply Tennessee’s forest industry comes from private ownership. However, forestland owned by public entities or conservation organizations can also have an important role to play in sustaining and improving rural economies. By maintaining forests as forests and keeping those forests as working forests through responsible and active forest management, the forest industry in rural Tennessee can continue to provide jobs and economic stability to those areas.
Action 1. Develop public and private land manager and conservation organization partnerships to encourage and implement active forest management on all protected lands to improve the health of forests and the growth of the local economy.
Action 2. Assess how changes in management trends of protected lands impact wood markets and identify proactive and innovative approaches to ensure local economies around those protected lands(Figure31)continuetobenefitfromthoseforests.

a a64
Current State
Forest Parcelization and Fragmentation
Parcelization and fragmentation have been identified as processes that significantly change the spatial arrangement and condition of forested landscapes. These two terms are not synonymous. In the context of forest land-use change, parcelization generally refers to the division of ownerships that result in smaller holdings, while fragmentation refers to isolation of forest tracts from one another (Southern Group of
State Foresters, 2007). How these processes interact to impact forested landscapes is not straightforward. One process is not a prerequisite for the other to occur, and each process brings a different set of impacts to the forest. A general relationship does seem to exist between forest parcelization and fragmentation in that a parcelized landscape is at greater risk of fragmentation.
The USFS FIA Program conducts a periodic National Woodland Owner Survey (NWOS) to better understand who owns Tennessee’s forests, why they own it, what have they done, and what will they do with it.
Maintaining and Improving Connected LandscapesPROTECT. CONSERVE.
Figure 33. Percentage of ownership and percentage of area of family forests in Tennessee.

a a65
One of the key points that Figure 33 illustrates is percent ownership by number of acres in categories. It can be noted that nearly 70 percent of the number of forestland ownerships falls within the 10-49 acres category, whereas a large portion of private forestland acreage is owned in large tracts by relatively few people. This trend has remained consistent for the past 15 years in Tennessee.
Forests that are fragmented through human activities (highways, deforestation, urban sprawl, building construction, etc.) can be detrimental to forest health and resilience. Fragmentation can degrade habitat, increase spread of invasive plants, insects or disease, and reduce biodiversity. Parcelization, urbanization, and deforestation can all contribute to fragmentation.
Urbanization Urbanization, in the context of forests and forestry, refers to the spread of urban land uses (residential, commercial, or industrial) into forested areas. In rural forests, urbanization can introduce exotic pests that have been transferred through urban ports and by residents who travel to rural communities for outdoor recreation. Fragmentation of forested landscapes occurs as infrastructure such as buildings and roads are built in forested areas. Urbanization has also caused increases in mismanaged forested areas that are typically used for recreational use. Additionally, urbanization often results in a decreased probability of timber harvesting practices. These impacts not only contribute to the removal of forests, but also disrupt the food and fiber supply that Tennesseans rely on.
The increase in urban sprawl, if not planned correctly, can also have detrimental impacts to the valued forests that reside within urban areas. Values such as improved air quality, green infrastructure, reduced heat island effects, increased property values, and positive influence on human health and wellness can be diminished with the increase in impervious surfaces or deforested streetscapes or parks. Impervious surface refers to any surface (pavement, roads, sidewalks, rooftops, highly compacted soils, etc.) that is covered by water-resistant material that prevents precipitation from being absorbed by the earth. These surfaces increase and accelerate stormwater runoff and can be a leading cause for flooding, water pollution, heat sinks, and degraded forest health both in urban and in rural areas. Healthy, plentiful, and diverse urban forests play significant roles in mitigating stormwater runoff and stabilizing riparian
buffers that protect the community’s water supply.
It should be noted that deforestation is also a type of land-use change that is a threat to forests. However, in Tennessee the amount of forestland has remained relatively steady over the past 20 years. Therefore, deforestation is not projected to become a significant threat to Tennessee within the next 10 years.
How Are Connected Landscapes Threatened?
Parcelization and Fragmentation Concern should be raised when parcelization and fragmentation severely compromise the benefits derived from a forested landscape. These benefits include timber products (lumber, furniture, paper, etc.), clean water, recreation opportunities (camping, hiking, hunting, etc.), aesthetics (scenic vistas, colorful fall foliage, etc.), and suitable environments for diverse plants and wildlife. A forest’s capacity to provide these benefits is significantly altered or completely lost with increased parcelization and fragmentation. Highly parcelized and fragmented forests are more vulnerable to the introduction of exotic and invasive plants, insects, and diseases. These areas also pose greater risks for property to be damaged by wildfire if residential and commercial land uses become intermingled with forestland.
Parcelization also threatens the sustainability of the logging industry, as moving entire logging operations from one tract to another is extremely expensive. Due to economies of scale, loggers prefer to stay on larger tracts for a longer period of time, which reduces the number of times they have to move their equipment. Smaller tracts can pose serious logistical and economic hardships for the logging industry. Similarly, implementation of some management activities such as prescribed burning can also be impacted by parcelization. Figure 34 illustrates development threat in woodshed counties that are defined as the top 60 percent of primary forest products processing counties based on the most recent FIA program’s Timber Products Output survey. In general, woodshed counties are not significantly threatened by development tied to urbanization or fragmentation within the next 10 years.
Maintaining and Improving Connected Landscapes
PROTECT. CONSERVE.

a a66
Landowner demographics, specifically age, do not suggest a high probability of Tennessee’s forestland tracts becoming increasingly subdivided due to changing ownership caused by death and inheritance. In fact, the 2006 NWOS indicated that 45 percent of family owned forestlands were owned by landowners 65 years old or older; whereas in the 2013 NWOS results, the majority of family owned forestlands has shifted to a younger group (45-54 years old).
Urbanization
SLEUTH, named for its input models (Slope, Land use, Excluded, Urban, Transportation, and Hillshade), captures the potential extent of future urbanization and was used to delineate areas at high risk of becoming urbanized by year 2030.
Nearly 2.2 million acres in Tennessee were currently urbanized in 2010, and the urban area could increase by over 1 million acres from the 2010 baseline by 2030 (Table 5, Figure 35).
Figure 34. Three urbanization/fragmentation layers were analyzed to determine the threat of development in woodshed counties.
Maintaining and Improving Connected LandscapesPROTECT. CONSERVE.

a a67
SLEUTH Class West TN Highland Rim Cumberland East TN
0.1-20 percent 262,000 326,700 301,000 266,300
21-40 percent 30,600 44,000 39,900 43,900
41-60 percent 18,400 26,300 26,700 28,400
61-80 percent 18,400 27,800 24,000 31,400
81-100 percent 199,400 303,600 229,300 357,600 Currently
Urban 410,700 561,100 478,400 749,600
Figure 35. Probability of urbanization by 2030 based on SLEUTH projections.
Maintaining and Improving Connected Landscapes
Table 5. Probability of urbanization of current land area (rounded to the nearest 100 acres) at 2030 compared to baseline estimate of urbanized area in 2010.
PROTECT. CONSERVE.

a a68
With the increase in urban areas, it is very likely that the amount of impervious surface will also increase. Coupled with the threat that climate change brings to the South (more frequent periods of heavy precipitation and prolonged periods of drought), the projected increase in impervious surfaces underscores the importance and necessity of protecting urban forests.
Table 6, Figure 36, and Figure 37 below illustrate the increase in impervious surface in each district over the next 10 years. The Highland Rim District will see the greatest increase in impervious surface as strong growth is projected to take place southward from Clarksville to Columbia and eastward towards Murfreesboro.
Stress Index Class West TN Highland Rim Cumberland East TN
Unstressed(<1 percent) 1,159,700 980,000 1,034,200 1,052,000
Lightly Stressed (1-5 percent) 5,007,300 5,964,400 4,988,500 4,317,900
Stressed(5-10 percent) 146,600 304,800 232,500 500,900
Impacted(10-25 percent) 158,500 281,100 169,200 301,600
Damaged(>25 percent) 127,300 138,400 38,200 68,600
Sum: Stressed to Damaged 432,400 724,200 439,800 871,100
Baseline (2010): Stressed to Damaged
421,500 669,400 444,000 857,000
Projected Increase from Baseline
(percent) 2.5 7.6 -1.0 1.6
Table 6. Projections of land area (acres) in five classes of the Impervious Surface Stress Index at year 2030. Stress Index classes are defined by percent area in impervious surface.
Maintaining and Improving Connected LandscapesPROTECT. CONSERVE.

a a69
Figure 36. Map of impervious surface stress index projected at 2030 in Tennessee.
A composite map overlaying three data layers that project development and urbanization is illustrated in Figure 37. Government officials, municipal planners, urban foresters, and other conservation professionals can use this map to guide implementation of the Goals and Strategies outlined in this chapter. Mitigating
the negative impacts of urbanization is important to approach from a landscape perspective. Consideration of values such as air quality, water quality, and conservation of wildlife, aquatic habitat, and high-value forests should be integral to the planning process as Tennessee’s human population grows.
Maintaining and Improving Connected LandscapesPROTECT. CONSERVE.

a a70
Maintaining and Improving Connected LandscapesPROTECT. CONSERVE.
Figure 37. Composite map indicating areas of high development in the next 10 years in Tennessee.
As referenced in the Priority Areas section of the 2020 FAP, the Resilient and Connected Landscapes data layer emphasizes the importance of connected forests. Parcelization, fragmentation, and urbanization all inhibit Tennessee’s goal of connecting forests to reduce the negative impacts of climate change and the lack of active forest management. In addition, reducing parcelization, fragmentation, and urbanization can help increase economic growth and economies of scale in forest product markets, and provide public health benefits to Tennessee’s residents.
As Tennessee forests experiences threats over the next decade, connected landscapes can help to sustain vulnerable populations of flora and fauna by providing natural corridors for species movement. The increased resiliency of native forests can also greatly benefit forest markets. As reflected in the Expanding Market Diversification section of this FAP, it is crucial to keep Tennessee forests working through maintaining sustainable rotations of forest products, implementing best management practices among landowners, and facilitating connectivity to reduce parcelization and fragmentation of forested tracts.

a a71
Lastly, connected forests and increased canopy cover in urban environments provide public health benefits such as clean air, higher water quality, flood reduction, and nutrient cycling. Through applying the following strategies, connected landscapes can expand over the next 10 years.
Goals and Strategies Listed below are the goal, strategies, and a brief summary of each strategy developed to address this objective:
GOAL: To retain and improve connectivity and function of urban and rural forested landscapes. Strategy 1. Strategically connect rural and urban working forests.
Working collaboratively with other resource agencies, forest industry professionals, nongovernmental organizations, and landowners on a landscape scale is a more effective way of influencing forest stewardship, and it should result in increased efficiency in forestry technical assistance; wider recognition of the value of forests and forest sustainability; and ultimately an increase in the health, productivity, diversity, and resiliency of Tennessee’s forests. Landscape-level management planning approaches can address issues and create opportunities within priority areas identified in the Tennessee’s FAP. This is accomplished by encouraging collaboration among all stakeholders within a priority area, including private and public forest landowners and industry professionals, to achieve their objectives within the context of the FAP, leading to a greater public benefit.
Action 1. Encourage strategic land acquisitions and approaches that keep working forests working and connected.
Action 2. Collaborate with conservation organizations and agencies to encourage alignment and synchronization of strategic plans and use of science-based forest connectivity models (e.g., TNC’s Resilient Land Mapping Tool).
Action 3. Develop working groups or communication platforms to share information and updates on land acquisition and how active forest management can improve connectivity.
Action 4. Support research and utilize the best available science to determine location and best approaches to ensure landscape connectivity.
Strategy 2. Aggregate small-forested parcels (e.g., cooperatives) to improve economies of scale for forest operations and market shares.
Small tracts of forests present challenges for loggers as moving heavy equipment to harvest a few stems is not economically feasible. The trend of parcelization is becoming more prevalent as larger tracts are being subdivided to smaller tracts. However, despite changing ownership, if those tracts remain forested, then the values those forests produce have not stopped. Those forests can still sequester carbon, provide wildlife habitat, deliver clean air and water, and if aggregated, can improve the economies of scale for a logger to sustainably and economically harvest timber to meet silviculture objectives. The concept of aggregation can also extend to non-timber forest products, such as those associated with agroforestry, or recreational uses, such as hunting or wildlife viewing.
Action 1. Identify geographic areas in Tennessee where timber and non-timber forest cooperatives will be most successful.
Action 2. Identify existing or emerging programs or leaders who can facilitate landowner participation.
Action 3. Partner with University of Tennessee Extension to develop outreach and educational/collaborative programs.
Strategy 3. Increase and maintain canopy cover in urban and riparian areas to protect water quality and establish resilient urban and riparian forests.
The term “canopy cover” not only pertains to street-side trees but also to intact groups of trees like those found in parks, flood zones, riparian areas, and undeveloped property. Improving and increasing urban canopy cover provides a multitude of environmental, public health, and societal benefits. Tactics to achieve improved canopy cover can be better informed by using technology such as LIDAR (Light Detection and Ranging) and ArcGIS at the outset to assess baseline canopy cover and prioritize projects to address problem areas.
Maintaining and Improving Connected LandscapesPROTECT. CONSERVE.

a a72
Maintaining and Improving Connected Landscapes
Healthy, wide, and vegetation-diverse riparian buffers help to stabilize streambanks, mitigate flooding events, filtrate water, regulate water temperature, and provide habitat and non-timber forest products. These buffers also can provide connectivity to larger tracts of forests. Functioning riparian forests can help mitigate devasting impacts of floods both in urban and rural settings. Riparian buffers can be protected through the use of best management practices (BMPs) when harvesting timber in preparation for development.
Action 1. Utilize current and emerging science to create action/protection plans to plant appropriate tree species in appropriate locations.
Action 2. Utilize remote-sensing technology and models to identify urban areas where strategic tree planting can mitigatetheeffectsoffloodingandstormwaterrunoff.
Action 3. Continue to build community engagement and programs to create and maintain green infrastructure.
Action 4. Create, enhance and maintainriparianbuffers.
Strategy 4. Reduce future environmental and social stressors caused by the impacts of urbanization in areas with accelerated urban growth.
By using models to project and map areas of accelerated urban growth, land use planners, urban foresters, and decision-makers can better prepare to conserve the many values provided by urban forests while making room for increasing human populations. Unplanned
The Nature Conservancy’s Cumberland Forest ProjectIn 2019, the Tennessee Chapter of The Nature Conservancy worked with the organization’s Kentucky, Virginia, and NatureVest business units to purchase 253,000 acres of Central Appalachian hardwood forestlands known as the Cumberland Forest Project (Figure 38). One of the largest TNC land deals in the Eastern U.S., Cumberland Forest employed private impact investment capital and sought to demonstrate how sustainable forestry and forest carbon storage practices may yield a financial return on investments while conserving part of the country’s most critical climate change adaptation corridors. The Tennessee portion of the project—46,000 acres—is slated for permanent public recreation access, sustainable timber harvesting, wildlife habitat creation and improvement, and carbon sequestration projects. This project will continue to support several forest-based industries, including forest products, hunting and wildlife viewing, and outdoor recreation. This project will also help develop a workforce to support these industries. The results will invigorate rural economic activity for some of the more economically depressed areas of the state.
Figure 38. Scenic overlook on The Nature Conservancy’s Cumberland Forest Project (photo courtesy of Byron Jorjorian).
SUCCESS STORYPROTECT. CONSERVE.

a a73
Green Infrastructure Project in GallatinThe city of Gallatin requires that new development projects are designed to infiltrate, capture, reuse, or evapotranspirate one inch of every 2-year/24-hour storm event using green infrastructure. This type of engineering encourages the distribution of green practices across a municipality to try to disconnect impervious areas and mitigate the amount and velocity of stormwater runoff generated by rain events. The increase in green space and trees available within a city naturally slows down the runoff and allows the trees and the ground to absorb and to filter the water. This effectively reduces the pollutant loading to our creeks and lakes. Open space and tree canopies also provide relief from heat as well as increased recreational opportunities. Additionally, green spaces have been shown to improve mental health and increase property values.
One of the first green infrastructure site design elements that was installed was a reforestation area in a subdivision (Figure 39). The low lying 4.89-acre open area provides both water quality and water quantity benefits. It serves as a floodplain after heavy rain events for the tributary to Old Hickory Lake that runs alongside it and as a beautiful park space for the community. The trees will mature and continue to provide health benefits to the community as well as pollutant-removal benefits for the local drinking water supply.
Figure 39. Green infrastructure reforestation project in Gallatin, 2015 (photo courtesy of Jennifer Watson, Stormwater Coordinator, Gallatin, Tennessee).
development patterns can lead to expensive remediation activities in the future if riparian areas, floodplains, high-value forests, and habitats are not prioritized and integrated into the planning process.
Action 1. Utilize urban growth models such as SLEUTH and the Impervious Surface Stress Index to prioritize forest conservation activities and aid in land use planning.
Action 2. Educate urban foresters and municipal planners to understand the connection between trees and human health.
Action 3. Collaborate with forestry and wildlife professionals to identify high-value forests and habitat anddevelopeffectiveforestavoidance, minimization, and mitigation strategies for development.
Maintaining and Improving Connected LandscapesPROTECT. CONSERVE.
SUCCESS STORY

a a74
StrengtheningWildfireResilient CommunitiesPROTECT.
Current State
The Wildland-Urban Interface (WUI) describes the trend of building residences in or near the edge of the forest or other undeveloped land. This situation puts these residences in close proximity to wildfires in areas where the local community may lack the fire protection capability needed to fully protect all homes. This in turn leads to losses of these residences when wildfires occur and these structures become fuels to spread wildfire.
From 2007 to 2019, there were 14,600 fires in Tennessee that burned 270,000 acres. The average size of fires was 19 acres. As illustrated in Figure 40, the largest number of fires occurred in the Cumberland District. The largest amount of acreage burned occurred in the East Tennessee District. Topography, forest distribution, and landowner type greatly influence the high number and frequency of fires in the East Tennessee and Cumberland Districts. Threats associated with wildland fire in the urban interface are also the greatest in these two districts.
Figure 40. Fire occurrences in Tennessee from 2007 to 2017.

a a75
StrengtheningWildfireResilient CommunitiesPROTECT.
Since 2016, TDF has invested millions of dollars in hazard mitigation as well as secured special grant opportunities from the USDA Forest Service for Sevier and Cocke counties. TDF continuously works with TEMA, planning associations, communities, fire departments, and the National Fire Protection Agency, and holds an annual Fire Adapted Communities Conference. Division personnel work to educate and engage community leaders in development of Community Wildfire Protection Plans containing hazard assessments, action plans and items, and coordinated timelines. In 2019, TDF hired its first Hazard Mitigation Program Specialist to oversee the program.
Prevention and awareness remain key to continuing to reduce the number of wildfires, which have successfully trended down, allowing historic reductions in TDF personnel and equipment to better align with suppression responsibilities. TDF supports prevention through advertising, publication printing, social media, outreach programs, and a robust burn permit program. Currently, TDF is developing a wildland fire website, which will encompass prevention, mitigation, fire weather, fuels, etc.

a a76
How Are Communities Threatened? Due to new development in or around forested areas, fighting wildland fire has become more complicated, involving greater risks of losing higher-valued property. The risk is increasing annually with population expansion and rural development. These situations also create greater public safety hazards, change priorities for allocating firefighting resources, and place forestland values at higher risk from wildfire. It is becoming more difficult to protect the scope of values at risk from wildfire. Homeowners residing in forested settings, and the public at large, are not well-informed of the dangers of wildfire, its impact on the environment, the expense of suppression, and how to avoid it. Forest fire protection begins with the public.
Analytical tools such as SouthWRAP can provide fire protection planning, identify wildland-urban interface areas and communities at risk, and support mitigation and prevention efforts. Several data layers are available through SouthWRAP including wildfire ignition density, characteristic fire intensity scale, community protection zones, WUI, and WUI risk index. The WUI risk index rates the potential impact of a wildfire on people and their property. Significant areas of at least moderate WUI risk classifications exist across Tennessee with dense pockets of high WUI risk evident in eastern Tennessee’s mountainous terrain, where firefighting activities can be difficult and more costly than in less topographically challenging regions. WUI risk and wildfire complexity are increasing year after year. The WUI risk index was used to demonstrate the importance of resource allocation to administrative regions with the greatest number of fires, acres burned, and risk to lives and property (see Table 7 and Figure 41).
WUI Risk Index Class West TN Highland Rim Cumberland East TN
Non-forest 4,374,600 3,418,800 3,316,500 2,865,400
Lowest Risk 449,500 553,200 296,400 206,400
Moderate Risk 458,700 938,500 731,500 1,171,000
High Risk 10,300 24,000 58,800 84,700
Highest Risk < 100 < 100 100 < 100
Sum: Moderate to Highest Risk 471,400 969,100 807,400 1,279,500
Total Area (ac) 6,599,500 7,668,600 6,462,500 6,241,000
Percent of Area in Moderate to
Highest Risk 7 percent 13 percent 12 percent 21 percent
Table 7. Area (rounded to the nearest 100 acres) in Wildland-Urban Interface (WUI) risk index classes in each of TDF’s district boundaries.
StrengtheningWildfireResilient CommunitiesPROTECT.

a a77
StrengtheningWildfireResilient CommunitiesPROTECT.
Figure 41. Wildland Urban Interface Risk Index in Tennessee by TDF District Boundaries.
Goal and Strategies
Listed below are the goal, strategies, and action steps and a brief summary of each strategy developed to address this objective:
GOAL: Improve the protection of urban communitiesfromtheimpactsofwildlandfire.
Strategy1.Developandimplementfiremanagement activities to reduce the frequency andseverityofwildfire.
The need for wildfire hazard mitigation practices continues to increase along with increased WUI expansion and population growth. Additionally, changing climates are prolonging fire seasons and
subsequent periods of elevated fire danger. Collectively, these environmental and sociological conditions track toward perpetually increasing wildland fire complexity. Thus, necessary hazard mitigation investments of equal measure are needed to keep pace. Wildfire hazard mitigation can be an effective tool to maintain balance between human values and forest-resource objectives.
Action 1. Develop and implement new strategies, programs, and tools for management of forests within the wildland-urban interface in order to mitigaterisksassociatedwithwildfire.
Action 2. Invest in strategic communication and marketingplanspromotingthebenefitsofwildfirehazard mitigation.

a a78
Action 3. Support technological advancements and opportunities to collect and analyze the naturally dynamic impacts of treatments to natural resources, communities, and important infrastructure.
Action4.Garnerpoliticalandfinancialsupportin recognition of current state and future needs for securing the necessary resources for on-the-ground treatments and information/outreach.
Action 5. Solicit multidisciplined, multiagency support for collaborative approaches to protect communities, natural resources, and important infrastructure.
Action 6. Invest in organizational expansion to manage increasing workforce demands.
Action 7. Develop a framework for a regional/state-basedwildfirehazardmitigationcounciltoaddresslandscape-levelmitigationissuesaffectingTennessee citizens.
Action 8. Encourage at-risk communities to engage incommunity-levelfirepreventionplanning.
Action9.Educatestateandlocalplanningofficialson development issues at the wildland-urban interface.
Action 10. Partner with Tennessee Emergency Management Agency (TEMA) to identify grant programs and funding resources to prioritize and supportwildfiremitigationprojectproposalsacross the state.
StrengtheningWildfireResilient CommunitiesPROTECT.
Figure 42. Map of Community Wildfire Protection Plans in Tennessee.

a a79
CommunityWildfireProtectionPlansinTennesseeA major component of wildfire hazard mitigation is a Community Wildfire Protection Plan (CWPP): a collaborative plan created by the fire department, state and local forestry staff, federal land managers, community leaders, and the public. A CWPP is used to identify high-risk WUI areas—where homes and businesses meet forests and fields (Figure 42). The plan also can serve as an opportunity to target potential hazard-fuel reduction projects, structure ignition concerns, training needs and prevention strategies, and other issues related to fire protection.
The minimum requirements for a CWPP are:
• Collaboration – A CWPP must be collaboratively developed. Local and state officials must meaningfully involve federal agencies that manage land in the vicinity of the community and other interested parties, particularly nongovernmental stakeholders.
• Prioritized Fuel Reduction – A CWPP must identify and prioritize areas for hazardous-fuel reduction treatments on both federal and non-federal land and recommend the types and methods of treatment that, if completed, would reduce the risk to the community.
• Treatment of Structural Ignitability – A CWPP must recommend measures that homeowners and communities can take to reduce the ignitability of structures throughout the area addressed by the plan.
An approved CWPP is required by TDF for a community to qualify for Hazard Mitigation Grant consideration.
StrengtheningWildfireResilient CommunitiesPROTECT.
SUCCESS STORYStrategy 2. Improve community wildfireresiliencethroughFireAdapted Community activities.
Tennessee’s approach to managing the threat of wildfire in the wildland-urban interface aligns with USDA Forest Service’s National Cohesive Wildland Fire Management Strategy. This is a strategic collaborative initiative among all stakeholders and across all landscapes, using the best science, to make meaningful progress towards three goals:
• Restore and maintain landscapes: Landscapes across all jurisdictions are resilient to fire-related disturbances in accordance with management objectives;
• Safe and Effective Wildfire Response: All jurisdictions participate in making and implementing safe, effective, efficient risk-based wildfire management decisions; and
• Fire Adapted Communities: Human populations and infrastructure can withstand a wildfire without loss of life and property.
A Fire Adapted Community is part of the natural landscape. The community understands its fire risk and takes action before, during, and after a wildfire, minimizing harm to residents, homes, businesses, parks, utilities, and other community assets. These collective actions empower all residents to be safer in their environment. The graphic below shows current elements and actions of the Fire Adapted Community concept. The elements have been evolving and changing over time, just as a community needs to be adapting over time. A community using the concept may

a a80
StrengtheningWildfireResilient CommunitiesPROTECT.
SUCCESS STORYCity of Newport Communication Tower WildfireProtectionProjectAn example of how TDF is leveraging resources to conduct community fire protection is illustrated through a wildfire mitigation project including fuel reduction, fire break installation, and ingress/egress elements designed to protect critical communication sites on English Mountain and in the city of Newport. These vulnerable locations contain three separate tower sites serving as two-way radio and cellular communication hubs for local emergency response agencies and emergency alert systems (Figure 43 and Figure 44). As a result of interagency planning and investment, this project highlights successful federal, state, and local collaboration solving real world problems before becoming real world emergencies.
Figure 43. City of Newport communication tower protection project (photo courtesy of Cliff King, Forestry Technician, TDF).
Figure 44. Topographic representation illustrating the site of the Newport city communication tower protection project.
not have to address all elements shown in Figure 45 below. However, it is important for a community to consider how important all elements are to the community. In a way, the elements of the graphic below can be considered as a checklist for the community to consider.
Firewise USA® and the Community Wildfire Protection Plan are actions that can be utilized by a Fire Adapted Community. TDF partners with the National Fire Protection Association (NFPA), serving as Tennessee’s NFPA liaison, and its federal partners to promote the Firewise USA® program. The Firewise USA® program provides a collaborative framework for neighbors to reduce wildfire risks at the local level. The national recognition program’s annual criteria are designed to empower and engage residents living in wildfire prone areas with plans and actions that can increase their home’s chances of surviving a wildfire. There are many participating Fire Adapted Communities across Tennessee and, currently 27 recognized Firewise USA® Communities with 7 additional working to develop community recognition.
Action 1. Improve community hazard risk awareness by utilizing the “Community Assessor for the South” risk Assessment tool, which will provide a standard risk assessment.
Action 2. Use Risk Assessments as a basis to develop additional CWPPs statewide.
Action 3. Leverage federal hazard mitigation program funding in collaboration with partners in order to update

a a81
StrengtheningWildfireResilient CommunitiesPROTECT.
Figure 45. Fire Adapted Community checklist.
hazard mitigation plans, identify disaster-risk reduction opportunities, and implement hazard reduction projects, which will reduce risk to vulnerable communities and landscapes.
Action 4. Work with HOAs, community groups, and homeowners to identify and mitigate home ignition hazards.
Action 5. Identify and work with communities to updateCWPPsfiveyearsoldorolder.
Strategy 3. Improve and increase emergency responder capacity in priority communities.
Annually, the Division of Forestry provides cost-share assistance and wildfire training to over 100 rural fire departments statewide. These fire departments are often the first responders to WUI fires and provide tremendous support on larger, more rural wildfires.
Understanding, supporting, and improving the response capacity, both temporally and spatially, of these rural fire departments is a major priority for TDF.
Action 1. Continue to provide cost-share programs thatpayforequipmenttoboostfirstresponderresources.
Action2.Partnerwiththelocalfiredepartmentsto map out response radius to identify gaps or overlapsinfirstresponderzones.
Action3.Collaboratewithfiredepartments,Tennessee Emergency Management Agency, and otherorganizationstoprovideannualwildfireprevention and suppression training.
Action 4. Organize and execute annual training drillsthatsimulatewildfiredeploymentactionsfrom a multitude of emergency response agencies.

a a82
Figure 46. Composite map highlighting priority forest landscapes in Tennessee.
Priority Areas
The previous sections of the FAP provide current forest inventory summaries, identify objectives for ensuring the sustainability of Tennessee’s forests, and delineate strategies to address those objectives. This section identifies the priority areas where those strategies will
be focused.
Three forest data layers build the foundation for these priority areas: USFS Forests to Faucets, the USFS FIA
Program’s Forest Carbon Stock Estimates, and TNC’s Connected and Resilient Landscapes. Each layer is described individually below and then overlaid to form a composite map (Figure 46) to further focus strategy implementation.

a a83
Forests naturally filter water and manage fluctuations in water flow, making forests key protectors of water quality and quantity. As populations increase across the South, so too does the demand for clean drinking water. However, development activities associated with growing populations often displace forestland that is critical for maintaining appropriate quality and quantity of surface drinking water for the influx of new residents.
The USDA Forest Service’s Forests to Faucets project addressed three questions that face foresters, conservation partners, and city planners alike: 1. What areas supply surface drinking water?
2. Where are forests most important for the protection of surface drinking water?
3. Where are forests important to surface drinking water and are under threat due to development, insects and disease, and wildfire?
Forests to Faucets used GIS to model and map the relative importance of land areas and forests to surface drinking water and assess threats to forests. Three sets of model input-outputs were created:
1. Surface drinking water importance areas were identified based on surface drinking water intake locations, population, and mean annual water supply.
2. Forest importance to surface drinking water was determined by the above-referenced surface drinking water importance areas, along with land cover and ownership information (e.g., National Forests, protected forests identified in PAD-US, privately owned forests).
3. Threatened forests important to surface drinking water were determined by wildfire potential, insect and disease risk, and expected increases in housing density.
For methods used for the drinking water protection model, proportional weights for upstream sub-watersheds, mean annual water supply model, and final index of importance to surface drinking water, refer to Weidner and Todd (2011). The importance of forests to surface drinking water (SDW) is displayed as a relative index with 1 indicating very low importance of forest to SDW and 100 indicating very high importance to SDW. The assessment and output layers were created for use in broad-scale planning, including state FAPs. The Forests to Faucets spatial data products can be incorporated into existing decision support tools for identifying key watersheds for conservation action.
Forests to Faucets output was used to identify areas of high priority for forest retention due to increasing populations and associated demands on water by Tennesseans (Table 8, Figure 47). Forest importance categories (1—lowest importance to 5—highest importance) were derived from quantile analysis, meaning that HUC12 watersheds were ordered from least to greatest forest importance to surface drinking water and then divided evenly into five categories (i.e., each category contains 20 percent HUC12 watersheds). Following quantile analysis, HUC12 watersheds were extracted through a layer of forest land cover using National Land Cover Database 2016 land classes: deciduous forest, evergreen forest, mixed forest, and woody wetlands (also called forested wetlands).
Forests to Faucets

a a84
Forests to FaucetsForest Importance to Surface
Drinking Water West TN Highland Rim Cumberland East TN
1 – Lowest importance 853,700 286,700 76,700 172,600
2 - Low to Moderate importance 1,149,500 785,100 359,000 320,800
3 – Moderate importance 595,500 1,055,400 775,900 577,900
4 - Moderate to High importance 188,100 1,533,100 1,082,200 1,101,200
5 – Highest importance 0 513,000 1,584,000 1,629,700
Sum: Moderate to High 783,500 3,101,500 3,442,100 3,308,800
Total Forested Area (ac) 2,786,600 4,173,300 3,877,900 3,802,200
Percent of Forest Area in Moderate to High 28 74 89 87
Total Area (ac) 6,599,500 7,668,600 6,462,500 6,241,000
Percent of Total Area in Moderate to High 12 40 53 53
Table 8. Forest area (round to the nearest 100 acres) classified in Forests to Faucet’s forest importance to surface drinking water, summarized by TDF’s District boundaries.

a a85
Forests to Faucets
Figure 47. Importance of forest to surface drinking water in Tennessee.

a a86
USFS Carbon Stock Estimates
The USDA Forest Service estimated forest carbon stocks, using FIA data, MODIS satellite imagery, and ancillary datasets, and provided estimates to the Environmental Protection Agency for the 2005-2011 National Greenhouse Gas Inventories of the United States (Smith et al. 2013). Past forest inventories were not designed to quantify forest ecosystem carbon stocks, thus necessitating conversion factors that bridge the gap between forest inventory plot data and carbon stocking. Carbon estimates for aboveground standing live and dead tree carbon stocks are based on biomass estimates obtained during annual forest inventory data collection. Ecosystem components of carbon stocks (e.g., forest floor or litter, soil organic matter, down dead wood, and belowground biomass) are calculated by FIA using models specific to geographic area, forest type, and, in some cases, stand age. The USDA Forest Service developed forest carbon accounting and spatially
continuous forest carbon maps using a methodology (Wilson et al. 2012) for producing maps of tree species occurrence and relative abundance based on FIA field plot data in conjunction with vegetation phenology, climate, topographic, and ecoregion data (Wilson et al. 2013).
In the Tennessee FAP2020, spatially explicit estimates of carbon stock inventory were used to identify areas of high importance for forest retention as part of TDF’s strategies for maintaining productive, healthy, and resilient forests (Figure 48). Tennessee’s forests hold 799 million metric tonnes of carbon stocks. Forests on private land holds the most carbon at 646 million metric tonnes (81 percent), National Forests hold 51 million metric tonnes (6 percent), and other public forests hold 103 million metric tonnes (13 percent) as evaluated by CCT v6.0 Carbon Calculation Tool, July 2014.
Forest ecosystems represent the largest terrestrial carbon sink on earth, and forest retention and management are effective strategies for offsetting greenhouse gas emissions (Pacala et al. 2001, Pan et al. 2011). Maintaining healthy forests is
one of the most cost-effective carbon storage strategies, and it encompasses restoration (e.g., returning forests to
an ecologically appropriate disturbance regime), rapid regeneration following
disturbance, and maintaining forest health through appropriate use of planned disturbances,
fire, and management of insects and diseases. Although many forest management practices (e.g., thinning, prescribed fire) necessitate the immediate release of some stored carbon, good forest management focuses growth and carbon storage in healthier, more resilient forests that are at lower risk of losing carbon and ecosystem function in response to major disturbance events (e.g., severe wildfire) and stressors (e.g., sustained drought).

a a87
USFS Carbon Stock Estimates
Figure 48. Total forest carbon stocking (metric tonnes of carbon/ ha) in Tennessee based on Forest Inventory and Analysis data, MODIS satellite imagery, and ancillary datasets (Wilson et al. 2012, Smith et al. 2013).

a a88
Resilient and Connected Landscapes
The Prioritized Network, which is 20 percent of land area included in TNC’s analysis of the eastern US, is composed of the following:
• Resilient areas: places buffered from climate change due to many connected micro-climates that create climate options for species;
• Climate corridors: narrow conduits that facilitate highly concentrated movement of plants and wildlife (e.g., riparian buffers);
• Climate flow zones: areas with high degrees of plant and animal movement that are less concentrated than climate corridors (e.g., intact forest regions); flow refers to the movement of species populations over time in response to climate changes;
• Resilient areas with confirmed diversity: a resilient area that contains known locations of rare species or unique communities;
• Climate corridor with confirmed diversity: a climate corridor that contains known locations of rare species or unique communities;
• Climate flow zone with confirmed diversity: a climate flow zone that contains known locations of rare species or unique communities.
The Tennessee FAP utilizes the Resilient and Connected Prioritized Network to prioritize programmatic priorities. The percent of total forested area contained in the Prioritized Network is highest in eastern Tennessee and declines as agriculture becomes more prevalent in western Tennessee (Table 9, Figure 49).
Land managers and conservation planners are under increasing pressure to improve adaptive capacity for a changing climate. The Nature Conservancy (TNC) developed the Resilient and Connected Prioritized Network to delineate secured and unsecured areas critical to forests and wildlife. An area is assumed to have higher resilience (i.e., to be more adaptive to climate change) if it contains micro-climates and micro-sites (e.g., a range of topographical features and elevation).
Table 9. Land area (acres, percent) of The Nature Conservancy’s Resilient and Connected Prioritized Network (Figure 49) that occurs in each of TDF’s administrative areas, and the extent to which the Network is currently protected (i.e., included in Protected Areas Database-US [PAD-US] or National Conservation Easement Database [NCED]). Acreage is rounded to the nearest 100 acres.
Resilient & Connected Prioritized Network
Administrative Area Forested Area (acres)in the Network
Percent of TotalForested Area
East TN 3,099,100 82
Cumberland 2,753,200 71 Highland Rim 2,620,700 63
West TN 1,023,900 37
Total 9,496,900 65

a a89
Resilient and Connected Landscapes
Sources: Esri, USGS, NOAA¯
0 40 80 120 16020Miles
Resilient & Connected LandscapesPrioritized Network
ResilientResilient Area with Confirmed DiversityClimate Flow ZoneClimate Flow Zone with Confirmed DiversityClimate CorridorTDF District BoundariesTennessee
Anderson, M. G., A. Barnett, M. Clark, J. Prince, A. Olivero Sheldon, and B.Vickery. 2016. Resilient and Connected Landscapes for Terrestrial Conservation.Boston, MA: The Nature Conservancy, Eastern Conservation Science, EasternRegional Office.Tennessee 2020 Forest Action Plan Map Series
Rachel Greene & Jeffrey Hill
Figure 49. The Nature Conservancy’s Resilient and Connected Prioritized Network in Tennessee.

a a90
Figure 50. Matrix indicating the resources needed by the State Forester to achieve the objectives, strategies and goals of the FAP.
Resources Necessary by the State Forester to Address Statewide Strategies
Obj
ecti
ve
Nat
iona
l Pri
orit
y
Goa
l
Strategies
Wor
kfor
ce
Dev
elop
men
t
Mar
ket
Dev
elop
men
t
Part
ners
hips
wit
h go
vern
men
t &
no
n-go
vern
men
t or
gani
zati
ons
Fina
ncia
l as
sist
ance
to
fore
st in
dust
ry
Fina
ncia
l as
sist
ance
to
com
mun
itie
s
Fina
ncia
l as
sist
ance
to
pri
vate
la
ndow
ners
Add
itio
nal
stat
e do
llars
for
prog
ram
del
iver
y
Add
itio
nal
fede
ral d
olla
rs fo
r pr
ogra
m d
eliv
ery
Incr
ease
d da
ta &
an
alyt
ical
cap
acit
y
Enha
ncin
g Fo
rest
Hea
lth a
nd R
esili
ency
Prot
ect F
ores
ts fr
om T
hrea
ts
To im
prov
e an
d su
stai
n th
e he
alth
, div
ersi
ty a
nd r
esili
ency
of T
enne
ssee
’s fo
rest
s.
1. Strengthen forest health monitoring, treatment,
prevention and management of forests that are threatened by invasive forest pests and
plant species.
X X
2. Maintain or reestablish forest diversity and
fire adapted ecological communities.
X X X X X X
3. Expand reforestation, conservation and protection efforts of forestlands along riparian zones, floodplains
and in source water watersheds.
X X X X
4. Support participation of private forest landowners of all ownership types and sizes
in carbon markets.X X X X
5. Support research and monitoring efforts which track changes to forest
composition.X X
6. Design and implement forest management
prescriptions to achieve healthy and resilient forests.
X X X X X X
7. Support efforts to increase the number of certified
forests and the availability of certified logs and wood
products.
X X X X X X
Exp
andi
ng M
arke
t Div
ersi
ficat
ion
Cons
erve
and
Man
age
Wor
king
For
est L
ands
cape
s fo
r M
ultip
le V
alue
s an
d U
ses;
Enh
ance
Pub
lic B
enefi
ts fr
om T
rees
and
For
ests
To c
reat
e, s
tren
gthe
n an
d re
tain
div
erse
, com
petit
ive
sust
aina
ble
fore
st
prod
ucts
mar
kets
1. Expand markets for low quality hardwood forest products, including pulp,
biomass, biofuels and urban waste wood.
X X X X X X
2. Encourage forest landowners in woodshed
counties to deliberately plan for and manage their forests sustainably into the future.
X X X X
3. Identify and employ data collection methods to better understand wood removal
and utilization across all ownership types as it impacts
Tennessee.
X X
4. Create and enhance a strong and sustainable forest industry workforce to provide
opportunities for long term career development.
X X X X X X X
5. Ensure sustainable wood supply by keeping forests working and encouraging
responsible forest management.
X X X X X X
Strategy Matrix and Resources Needed by the State Forester to Address Strategies

a a91
Resources Necessary by the State Forester to Address Statewide Strategies
Obj
ecti
ve
Nat
iona
l Pri
orit
y
Goa
l
Strategies
Wor
kfor
ce
Dev
elop
men
t
Mar
ket
Dev
elop
men
t
Part
ners
hips
wit
h go
vern
men
t &
no
n-go
vern
men
t or
gani
zati
ons
Fina
ncia
l as
sist
ance
to
fore
st in
dust
ry
Fina
ncia
l as
sist
ance
to
com
mun
itie
s
Fina
ncia
l as
sist
ance
to
pri
vate
la
ndow
ners
Add
itio
nal
stat
e do
llars
for
prog
ram
del
iver
y
Add
itio
nal
fede
ral d
olla
rs fo
r pr
ogra
m d
eliv
ery
Incr
ease
d da
ta &
an
alyt
ical
cap
acit
y
Mai
ntai
ning
& Im
prov
ing
Conn
ecte
d La
ndsc
apes
Cons
erve
and
Man
age
Wor
king
For
est L
ands
cape
s fo
r M
ultip
le V
alue
s an
d U
ses;
Pro
tect
For
ests
from
Thr
eats
To r
etai
n an
d im
prov
e co
nnec
tivity
and
func
tion
of u
rban
an
d ru
ral f
ores
ted
land
scap
es.
1. Strategically connect rural and urban working forests. X X X
2. Aggregate small forested parcels (e.g. cooperatives) to improve economies of scale
for forest operations and market shares.
X X X X X X
3. Increase and maintain canopy cover in urban and
riparian areas to protect water quality and establish resilient urban and riparian
forests.
X X X X
4. Reduce future environmental and social stressors caused by the
impacts of urbanization in areas with accelerated urban
growth.
X X
Str
engt
heni
ng W
ildfir
e Re
silie
nt
Com
mun
ities
Prot
ect F
ores
ts fr
om T
hrea
ts
Impr
ove
the
prot
ectio
n of
urb
an
com
mun
ities
from
the
impa
cts
of
wild
land
fire
.
1. Develop and implement fire management activities
to reduce the frequency and severity of wildfire.
X X X X X
2. Improve community wildfire resilience through Fire Adapted Community
activities.X X X X X
3. Improve and increase emergency
responder capacity in priority communities.
X X X X X X
Resource Definitions
Workforce Development Any funding and organization that has a mission or interest in developing the natural resource workforce
Market Development Any funding and organization that has a mission or interest in developing natural resource markets
Partnerships with government &non-government organizations Any state, federal, non-government, private, non-profit partner
Financial assistance to forest industry Any funding both state, private, federal that would go straight to the forest industry
Financial assistance to communities Any funding both state, private, federal that would go straight to the rural & urban communities
Financial assistance to private landowners Any funding both state, private, federal that would go straight to the forest landowner
Additional state dollars for program delivery Any funding that originates from state appropriations
Additional federal dollars for program delivery Any funding that originates from federal appropriations
Increased data & analytical capacity Any funding or other support that could be provided to any type of partner to increase their ability to gather and analyze data
Figure 50. Matrix indicating the resources needed by the State Forester to achieve the objectives, strategies and goals of the FAP.
Strategy Matrix and Resources Needed by the State Forester to Address Strategies

a a92
Regional InitiativesEnhancing Forest Health and Resiliency
Hemlock Woolly Adelgid Native to Asia, the hemlock woolly adelgid (HWA) is a small, aphid-like insect that poses the single greatest threat to the health and sustainability of eastern hemlock (Tsuga canadensis) and Carolina hemlock (Tsuga caroliniana) in the eastern United States. Since its detection in Tennessee in 2002, HWA has spread to 43 counties in East Tennessee and the Cumberland Plateau, as shown in Figure 51. On average, HWA has been
spreading from east to west at roughly 15 to 20 miles per year.
HWA is a threat to several states in Region 8: Tennessee, North Carolina, South Carolina, Georgia, Virginia, and Kentucky. Forest health specialists in each of those states have worked closely to manage this pest from a regional perspective. USDA Forest Service funds from the Landscape Scale Restoration Program (LSR) are critical to the continued success of this approach. Additionally, conservation partners such as other state agencies, The Nature Conservancy, and university agricultural extension services have been essential to the management of HWA chemically, biologically, and silviculturally.
Figure 51. USFS map of counties infested with Hemlock Woolly Adelgid.
HWA dectections in Canada in 2019HWA detections in 2019HWA detections before 2019HWA not detectedNative Range of Hemlock
±
Disclaimer: This map depicts jurisdictions with established HWA populations that are confirmed and reported by respective federal, state and provincial forest health officials. The coarse nature of the map does not provide site specific information and users should not assume that highlighted infested areas are entirely infested. The list of Infested jurisdictions reported by year and past years distribution maps can be found on the HWA website at http://hiro.ento.vt.edu/hwa/
0 160 32080 Miles
Map created 2/20/20 by AKS Morgantown Field Office
updated 3/6/20

a a93
Regional Initiatives Regional InitiativesLaurel Wilt Disease First discovered in 2002, laurel wilt disease (LWD) has rapidly become a disease of serious concern in the southeastern U.S. (Figure 52). The laurel wilt fungus can kill mature trees very quickly, is vectored by a small ambrosia beetle from Asia, and is spreading through the Southeast at approximately 20 miles per year. It affects plants of the Lauraceae family; most commonly redbay and sassafras. The disease has become a serious concern because avocado (an economically important crop in Florida) is also susceptible, and the disease
threatens the survival of several plant and animal species. Laurel Wilt was discovered in North Carolina in 2011 and in Tennessee and Kentucky in 2019.
Extensive mortality to redbay has occurred in coastal areas from North Carolina to Mississippi, with detection also occurring inland in Alabama, Louisiana, and Arkansas. In Tennessee and Kentucky, however, LWD can be devastating to sassafras and spicebush. Researchers and forest health specialists are collaborating to determine an appropriate treatment method.
AlabamaDana McReynolds [email protected]
ArkansasChandler [email protected]
FloridaJeff [email protected]
GeorgiaChip [email protected]
KentuckyAbe [email protected]
LouisianaBrent [email protected]
MississippiJohn [email protected]
North CarolinaRob [email protected]
South CarolinaDavid [email protected]
TennesseeCameron [email protected]
TexasShane [email protected]
Laurel Wilt Disease is a destructive disease of redbay (Persea borbonia), and other specieswithin the laurel family (Lauraceae) causes by a vascular wilt fungus (Raffaelea lauricola)that is vectored by the redbay ambrosia beetle (Xyleborus glabratus). The pathogen has beenconfirmed through laboratory analysis of host samples collected in the counties highlighted.
Year of Detection20042005200620072008200920102011201220132014201520162017201820192020Not yet detected
0 100 200 300 40050Miles
Initial Detection ofXyleborus glabratus
May 2002Port Wentworth, GA
October 2, 2020
Figure 52. Distribution of counties with Laurel Wilt Disease by year of initial detection.

a a94
Gypsy Moth The gypsy moth defoliates hardwood forests and has stressed many acres throughout the northeastern states (Figure 53). It is native to Europe and northern Africa but was brought to Massachusetts from Europe in 1869. Since then, it has spread southward through the northeastern states into southwestern Virginia and a major front is approaching Tennessee at a rate of seven miles per year. Successive defoliations severely impact forest health, and, in turn, diminish the value of Tennessee woodlands.
Tennessee is an active partner with the USDA Animal Plant Health Infection Service (APHIS), USDA Forest Service, and the Slow the Spread Foundation to cooperatively monitor, treat, and eradicate gypsy moth infestations in the state. Gypsy moth is a regional priority and threat to states like Virginia, Kentucky, and Tennessee due to the predominant oak forest types.
Figure 53. Map of counties that are under quarantine for Gypsy Moth.
Regional Initiatives

a a95
Emerald Ash Borer The emerald ash borer (EAB) was first identified in Michigan in 2002 and has rapidly spread throughout the United States (Figure 54). It was detected in Tennessee in 2010 and has since spread to 65 counties. EAB is a very destructive pest to all species of ash trees and has caused widespread ash mortality in every state in which it has been detected.
Outreach and education are the most effective tools to address this threat. Regional message campaigns like Don’t Move Firewood connect these types of forest threats to impactful actions such as buying firewood where it will be used as opposed to transporting it long distances. Many states in Region 8 have collaborated to ensure a consistent message has been delivered on a regional level.
Figure 54. Map of counties that are under quarantine for Emerald Ash Borer.
La ke Su p eri or
Lak
eM
ich
iga
n
LakeHur on
L ake Erie
Lake Ontario
A d a m s
Ale
xa
nd
er
B o n d
B o o n e
B r o w n
B u r e a u
C a lh o u n
C a r r o ll
C a s s
C h a m p a i g n
C h r is t i a n
C la r k
C la y
C li n t o n
C o le s
C o o k
C r a w f o r d
C u m b e r l a n d
D e K a l b
D e W it t
D o u g l a s
D u P a g e
E d g a r
Ed
wa
rd
s
E f f in g h a m
F a y e t t e
F o r d
F r a n k li n
F u lt o n
G a ll a t in
G r e e n e
G r u n d y
H a m il t o n
H a n c o c k
H a r d i n
H e n d e r s o n
H e n r y
I r o q u o is
J a c k s o n
J a s p e r
J e f f e r s o n
J e r s e y
J o D a v ie s s
J o h n s o n
K a n e
K a n k a k e e
K e n d a l l
K n o x
L a k e
L a S a ll e
L a w r e n c e
L e e
L iv i n g s t o n
L o g a n
Mc D o n o u g h
Mc H e n r y
Mc L e a n
Ma c o n
Ma c o u p i n
Ma d i s o n
Ma r i o n
Ma r s h a l l
Ma s o n
Ma s s a c
Me n a r d
Me r c e r
Mo n r o e
Mo n t g o m e r y
Mo r g a n
Mo u l t r ie
O g l e
P e o r ia
P e r ry
P ia t t
P ik e
P o p e
P u la s k i
P u tn a m
R a n d o lp h
R ic h l a n d
R o c k I sl a n d
S t . C l a ir
S a li n e
S a n g a m o n
S c h u y l e r
S c o t t
S h e l b y
S t a r k
S t e p h e n s o n
T a z e w e l l
U n i o n
V e r m i li o n
W a b a s h
W a rr e n
W a s h in g t o n
W a y n e
W h it e
W h it e s i d e
W il l
W il li a m s o n
W in n e b a g o
W o o d f o r d
A d a m s
A ll e n
B a r t h o lo me w
B e n t o nB la c k -
fo rd
B o o n e
B r o w n
C a r r o ll
C a s s
C la r k
C la y
C li n t o n
C r a w f o r d
D a v ie ss
D e a r b o r n
D e c a t u r
D e K a l b
D e l a w a r e
D u b o i s
E lk h a r t
F a y e t t e
F lo y d
F o u n t a in
F r a n k li n
F u lt o n
G ib s o n
G r a n t
G r e e n e
H a m il t o n
H a n c o c k
H a r r is o n
H e n d r i c k s
H e n r y
H o w a r d
Hu
nt
in
gt
on
J a c k s o n
J a s p e r
J a y
J e f f e r s o n
J e n n in g s
J o h n s o n
K n o x
K o s c iu s k o
L a G r a n g e
L a k e
L a P o r t e
L a w r e n c e
Ma d i s o n
Ma r i o n
Ma r s h a l l
Ma r t i n
Mi a m i
Mo n r o e
Mo n t g o m e r y
Mo r g a n
N e w t o n
N o b l e
O h i o
O r a n g e
O w e n
P a rk e
P e r ry
P ik e
P o r te r
P o s e y
P u la s k i
P u tn a m
R a n d o lp h
R ip l e y
R u s h
S t . J o s e p h
S c o t t
S h e l b y
S p e n c e r
S t a r k e
S t e u b e n
S u ll i va n
S w i t z e r la n d
T ip p e c a n o eT ip t o n
U n i o n
V a n d e r -
b u r g h
Ve
rm
ill
io
n
V ig o
W a b a s h
W a rr e n
W a rr i c k
W a s h in g t o n
W a y n e
W e ll s
W h it e
W h it l e y
A d a i r
A d a m s
A ll a m a k e e
A p p a n o o s e
A u d u b o n
B e n t o n
B la c k H a w k
B o o n e
B r e m e r
B u c h a n a n
B u e n a
V is t aB u t le r
C a lh o u n
C a r r o ll
C a s s
C e d a r
C e r r o
G o r d o
C h e r o k e e
C h ic k a s a w
C la r k e
C la y
C la y t o n
C li n t o n
C r a w f o r d
D a ll a s
D a v isD e c a t u r
D e l a w a r e
D e s Mo i n e s
D ic k in s o n
D u b u q u e
E m m e t
F a y e t t e
F lo y d
F r a n k li n
F r e m o n t
G r e e n e
G r u n d y
G u t h r ie
H a m il t o n
H a n c o c k
H a r d i n
H a r r is o n
H e n r y
H o w a r d
H u m b o ld t
I d a
I o w a
J a c k s o n
J a s p e r
J e f f e r s o n
J o h n s o n
J o n e s
K e o k u k
K o s s u t h
L e e
L in n
L o u is a
L u c a s
L y o n
Ma d i s o n Ma h a s k aMa r i o n
Ma r s h a l l
Mi ll s
Mi t c h e ll
Mo n o n a
Mo n r o eMo n t g o m e r y
Mu s c a t i n e
O ' B r i e n
O s c e o l a
P a g e
P a lo A l t o
P ly m o u t hP o c a h o n t a s
P o lk
P o tt a w a t t a m i e
P o w e s h i e k
R in g g o l d
S a c
S c o t tS h e l b y
S io u x
S t o r y
T a m a
T a y lo r
U n i o n
V a n B u r e n
W a p e ll o
W a rr e n
W a s h in g t o n
W a y n e
W e b s t e r
W in n e b a g o
W in n e s h i e k
W o o d b u r y
W o r th
W ri g h t
A d a i r
A ll e n
A n d e r s o n
B a ll a r d
B a r r e n
B a t h
B e ll
B o o n e
B o u r b o n
B o y d
B o y le
B r a c k e n
B r e a t h it tB r e c k in r i d g e
B u ll it t
B u t le r
C a ld w e ll
C a ll o w a y
Ca
mp
be
ll
C a r li s le
C a r r o ll
C a r t e r
C a s e y
C h r is t i a n
C la r k
C la y
C li n t o n
C r it t e n d e n
C u m b e r l a n d
D a v ie ss
E d m o n s o n
E ll io t t
E s t il l
F a y e t t e
F le m in g
F lo y d
F r a n k li n
F u lt o n
G a ll a t in
G a r r a r d
G r a n t
G r a v e s
G r a y s o n
G r e e n
G r e e n u p
H a n c o c k
H a r d i n
H a r la n
H a r r is o n
H a r t
H e n d e r s o n
H e n r y
H i c k m a n
H o p k i n s
J a c k s o n
J e f f e r s o n
J e s s a -
m i n e
J o h n s o n
K e n t o n
K n o t t
K n o x
L a r u e
L a u r e l
L a w r e n c e
L e e
L e s li e
L e t c h e r
L e w i s
L in c o l n
L iv i n g s t o n
L o g a nL y o nMc C r a c k e n
Mc C r e a r y
Mc L e a n
Ma d i s o n
Ma g o f f i n
Ma r i o n
Ma r s h a l l
Ma r t i n
Ma s o n
Me a d e
Me n i f e e
Me r c e r
Me t c a l f e
Mo n r o e
Mo
nt
go
me
ry
Mo r g a n
Mu h l e n b e r g
N e l s o n
N i c h o la s
O h i o
O l d h a m
O w e n
O w s l e y
P e n d le t o n
P e r ry
P ik e
P o w e l l
P u la s k i
R o b e r t -
so n
R o c k c a s t le
R o w a n
R u s s e ll
S c o t t
S h e l b y
S im p s o n
S p e n c e r
T a y lo r
T o d dT r ig g
T r im b l e
U n i o n
W a rr e n
W a s h in g t o n
W a y n e
W e b s t e r
W h it l e y
W o lf e
W o o d -
fo rd
A ll e g a n y
A n n e
A r u n d e l
B a lt i m o r e
C a lv e r t
C a r o li n e
C a r r o ll
C e c il
C h a r le s
D o r c h e s t e r
F r e d e r ic k
G a r r e t t
H a r f o r d
H o w a r d
K e n t
Mo n t g o m e r y
P ri n c e
G e o r g e ' s
Qu e e n
A n n e ' s
S t . M a r y 's
S o m e rs e t
T a lb o t
W a s h in g t o n
W ic o m ic o
W o r c e s te r
B a lt i m o r e
C it y
A lc o n a
A lg e r
A ll e g a n
A lp e n a
A n t r im
A r e n a c
B a r a g a
B a r r y
B a y
B e n z ie
B e r r ie n
B r a n c h
C a lh o u n
C a s s
C h a r le v o i x
C h e b o y g a n
C h ip p e w a
C la r e
C li n t o n
C r a w f o r d
D e l ta
D ic k in s o n
E a t o n
E m m e t
G e n e s e e
G la d w in
G o g e b i c
G r a n d
T r a v e r s e
G r a t io t
H i ll s d a le
H o u g h t o n
H u r o n
I n g h a m
I o n ia
I o s c o
I r o n
I s a b e ll a
J a c k s o n
K a la m a z o o
K a lk a s k a
K e n t
K e w e e n a w
L a k e
L a p e e r
L e e la n a u
L e n a w e e
L iv i n g s t o n
L u c e
Ma c k i n a c
Ma c o m b
Ma n i s t e e
Ma r q u e t t e
Ma s o n
Me c o s t a
Me n o m in e e
Mi d la n d
Mi s s a u k e e
Mo n r o e
Mo n t c a l m
Mo n t m o r e n c y
Mu s k e g o n
N e w a y g o
O a k l a n d
O c e a n a
O g e m a w
O n t o n a g o n
O s c e o l a
O s c o d a
O t s e g o
O t t a w a
P re s q u e I s l e
R o s c o m m o n
S a g in a w
S t . C l a ir
S t . J o s e p h
S a n il a c
S c h o o l c r a f t
S h i a w a s s e e
T u s c o la
V a n B u r e n
W a s h t e n a w
W a y n e
W e x f o r d
A it k i n
A n o k a
B e c k e r
B e lt r a m i
B e n t o n
B ig S t o n e
B lu e E a r t h
B r o w n
C a r lt o n
C a r v e r
C a s s
C h ip p e w a
C h is a g o
C la y
C le a r -
w a t e r
C o o k
C o t t o n w o o d
C r o w W in g
D a k o t a
D o d g e
D o u g l a s
F a r ib a u l t
F il lm o r eF r e e b o r n
G o o d h u e
G r a n t
H e n n e p i n
H o u s t o n
H u b b a r d
I s a n ti
I t a sc a
J a c k s o n
K a n a b e c
K a n d iy o h i
K it t s o n
K o o c h ic h in g
L a c q u i P a r l e
L a k e
L a k e o f
th e W o o d s
L e S u e u r
L in c o l n
L y o n
Mc L e o d
Ma h n o m e n
Ma r s h a l l
Ma r t i n
Me e k e r
Mi ll e
L a c s
Mo r r i s o n
Mo w e r
Mu r r a y
N i c o ll e t
N o b l e s
N o r m a n
O l m s t e d
O t t e r T a il
P e n n in g t o n
P in e
P ip e s t o n e
P o lk
P o p e
R a m s e y
R e d L a k e
R e d w o o d
R e n v il le
R ic e
R o c k
R o s e a u
S t . L o u i s
S c o t t
S h e r b u r n e
S ib le y
S t e a r n s
S t e e le
S t e v e n s
S w i f t
T o d d
T r a v e r s e
W a b a s h a
W a d e n a
W a s e c a
Wa
sh
ing
to
n
W a to n w a n
W il k in
W in o n a
W ri g h t
Y e ll o w
Me d i c i n e
A d a i r
A n d r e w
A t c h i s o n
A u d r a i n
B a r r y
B a r t o n
B a t e sB e n t o n
B o ll in g e r
B o o n e
B u c h a n a n
B u t le r
C a ld w e ll
C a ll a w a y
C a m d e n
C a p e
G ir a r d e a u
C a r r o ll
C a r t e r
C a s s
C e d a r
C h a r it o n
C h r is t i a n
C la r k
C la y
C li n t o n
C o le
C o o p e r
C r a w f o r d
D a d e
D a ll a s
D a v ie ss
D e K a l b
D e n t
D o u g l a s
D u n k l in
F r a n k li n
Ga
sc
on
ad
e
G e n t r y
G r e e n e
G r u n d y
H a r r is o n
H e n r y
H i c k o r y
H o l t
H o w a r d
H o w e l l
I r o n
J a c k s o n
J a s p e r
J e f f e r s o n
J o h n s o n
K n o x
L a c le d e
L a f a y e t t e
L a w r e n c e
L e w i s
L in c o l n
L in n
L iv i n g s t o n
Mc D o n a ld
Ma c o n
Ma d i s o n
Ma r i e s
Ma r i o n
Me r c e r
Mi ll e r
Mi s s is s i p p i
Mo n i t e a u
Mo n r o e
Mo n t -
g o m e r y
Mo r g a n
N e w
Ma d r i d
N e w t o n
N o d a w a y
O r e g o n
O s a g e
O z a r k
P e m i s c o t
P e r ry
P e t ti s
P h e lp s
P ik eP la t t e
P o lk
P u la s k i
P u tn a m
R a ll s
R a n d o lp h
R a y
R e y n o ld s
R ip l e y
S t . C h a r l e s
S t . C l a ir S t e .
G e n e v i e v eS t .
F r a n c o is
S t . L o u i s
S a li n e
S c h u y l e r
S c o t la n d
S c o t tS h a n n o n
S h e l b y
S t o d d a r d
S t o n e
S u ll i va n
T a n e y
T e x a s
V e r n o n
W a rr e n
W a s h in g t o n
W a y n e
W e b s t e r
W o r th
W ri g h t
S t . L o u i s
C it y
A lb a n y
A ll e g a n y
B r o n x
B r o o m e
C a t t a ra u g u s
C a y u g a
C h a u t a u q u a
C h e m u n g
C h e n a n g o
C li n t o n
C o lu m b i a
C o r t la n d
D e l a w a r e
D u t c h e s s
E r ie
E s s e x
F r a n k li n
F u lt o n
G e n e s e e
G r e e n e
H a m il t o n
H e r k i m e r
J e f f e r s o n
K in g s
L e w i s
L iv i n g s t o n
Ma d i s o n
Mo n r o e
Mo n t g o m e r y
N a s s a u
N i a g a r a
O n e i d a
O n o n d a g a
O n t a r i o
O r a n g e
O r l e a n s
O s w e g o
O s w e g o
O t s e g o
P u tn a m
Qu e e n s
R e n s s e la e r
R ic h -
m o n d
R o c k la n d
S t . L a w r e n c e
S a r a t o g a
S c h e n e c t a d y
S c h o h a r i e
S c h u y l e r
S e n e c a
S t e u b e n
S u f f o lk
S u ll i va n
T io g a
T o m p k in s
U ls t e r
W a rr e n
Wa
sh
ing
to
n
W a y n e
W e s t c h e s t e r
W y o m i n g
Y a t e s
A d a m s
A ll e n
A s h l a n d
A s h t a b u l a
A t h e n s
A u g l a iz e
B e lm o n t
B r o w n
B u t le r
C a r r o ll
C h a m p a i g n
C la r k
C le r m o n t
C li n t o n
C o lu m b i a n a
C o s h o c t o n
C r a w f o r d
C u y a h o g a
D a r k e
D e f i a n c e
D e l a w a r e
E r ie
F a ir f i e ld
F a y e t t e
F r a n k li n
F u lt o n
G a ll ia
G e a u g a
G r e e n e
G u e r n s e y
H a m il t o n
H a n c o c k
H a r d i n
H a r r is o n
H e n r y
H i g h la n d
H o c k i n g
H o l m e s
H u r o n
J a c k s o n
J e f f e r s o n
K n o x
L a k e
L a w r e n c e
L ic k i n g
L o g a n
L o r a in
L u c a s
Ma d i s o n
Ma h o n i n g
Ma r i o n
Me d i n a
Me i g s
Me r c e r
Mi a m i Mo n r o e
Mo n t -
g o m e r y
Mo r g a n
Mo r r o w
Mu s k i n g u m
N o b l e
O t t a w a
P a u ld i n g
P e r ry
P ic k a w a y
P ik e
P o r ta g e
P re b le
P u tn a m
R ic h l a n d
R o s s
S a n d u s k y
S c io t o
S e n e c a
S h e l b y
S t a r k
S u m m it
T r u m b u ll
T u s c a r a w a s
U n i o n
V a n W e rt
V in t o nW a rr e n
W a s h in g t o n
W a y n e
W il li a m s
W o o d
W y a n d o t
A d a m s
A ll e g h e n y
A r m s t r o n g
B e a v e r
B e d f o r d
B e r k s
B la i r
B r a d f o r d
B u c k s
B u t le r
C a m b r i a
C a m e r o n
C a r b o n
C e n t r e
C h e s t e r
C la r i o n
C le a r f i e ld
C li n t o nC o lu m b i a
C r a w f o r d
C u m b e r l a n d
D a u p h i n
D e l a w a r e
E lk
E r ie
F a y e t t e
F o r e s t
F r a n k li n
F u lt o n
G r e e n e
H u n t i n g d o n
I n d ia n a
J e f f e r s o n
J u n ia t a
L a c k a w a n n a
L a n c a s t e r
L a w r e n c e
L e b a n o n
L e h ig h
L u z e r n eL y c o m i n g
Mc K e a n
Me r c e r
Mi f f li n
Mo n r o e
Mo n t g o m e r y
Mo n t o u r
N o r t h a mp t o n
N o r t h u mb e r la n d
P e r ryP h il a d e l p h ia
P ik e
P o tt e r
S c h u y l k il l
S n y d e r
S o m e rs e t
S u ll i va n
S u s q u e h a n n a
T io g a
U n i o n
V e n a n g o
W a rr e n
W a s h in g t o n
W a y n e
W e s t m o r e l a n d
W y o m i n g
Y o r k
A n d e r s o n
B e d f o r d
B e n t o n
B le d so e
B lo u n t
B r a d le y
C a m p b e ll
C a n n o nC a r r o ll
C a r t e r
C h e a t h a m
C h e s t e r
C la i b o r n e
C la y
C o c k e
C o f f e e
C r o c k e t t
C u m b e r l a n d
D a v id s o n
D e c a t u r
D e K a l b
D ic k so n
D y e r
F a y e t t e
F e n t r e s s
F r a n k li n
G ib s o n
G il e s
Gr
ain
ge
r
G r e e n e
G r u n d y
H a m b le n
H a m il t o n
H a n c o c k
H a r d e m a n
H a r d i n
H a w k i n s
H a y w o o d
H e n d e r s o n
H e n r y
H i c k m a n
H o u s t o n
H u m p h r e y s
J a c k s o n
J e f f e r s o n
J o h n s o n
K n o x
L a k e
L a u d e r d a le
L a w r e n c e
L e w i s
L in c o l n
L o u d o n
Mc M i n n
Mc N a ir y
Ma c o n
Ma d i s o n
Ma r i o n
Ma r s h a l l
Ma u r y
Me
ig
s Mo n r o e
Mo n t g o m e r y
Mo o r e
Mo r g a n
O b i o n
O v e r t o n
P e r ry
P ic k e t t
P o lk
P u tn a m
R h e a
R o a n e
R o b e r t s o n
R u t h e r f o r d
S c o t t
S e q u a t c h i e
S e v ie r
S h e l b y
S m i t h
S t e w a r t
S u ll i va n
S u m n e r
T ip t o n
T r o u s d a le Un
ic
oi
U n i o n
V a n
B u r e nW a rr e n
Wa s h in g t o n
W a y n e
W e a k le y
W h it e
W il li a m s o n
W il s o n
A c c o m a c k
A lb e m a r l e
A ll e g h a n y
A m e li a
A m h e r s t
A p p o m a t to x
A r li n g t o n
A u g u s t a
B a t h
B e d f o r d
B la n d
B o t e t o u r t
B r u n s w i c k
B u c h a n a n
B u c k in g h a m
C a m p b e ll
C a r o li n e
C a r r o ll
C h a r le s
C it y
C h a r lo t t e
C h e s t e r f ie l d
C la r k e
C r a ig
C u lp e p e r
Cu
mb
er
la
nd
D ic k e n s o n
D in w id d ie
E s s e x
F a ir f a x
F a u q u ie r
F lo y d
F lu v a n n a
F r a n k li n
F r e d e r ic k
G il e s
G lo u c e st e r
G o o c h l a n d
G r a y s o n
G r e e n e
G r e e n s v il l eH a l if a x
H a n o v e r
H e n r i c o
H e n r y
H i g h la n d
I s le o f
W ig h t
K in g
a n d Qu e e n
K in g
G e o r g e
K in g Wi ll ia m
L a n c a s t e r
L e e
L o u d o u n
L o u is a
L u n e n b u r g
Ma d i s o n
Ma t h e w s
Me c k l e n b u r g
Mi d d l e s e x
Mo n t g o m e r y
N e l s o n N e w K e n t
N o r t h a m p t o n
N o r t h u mb e r la n d
N o t t o w a y
O r a n g e
P a g e
P a tr i c k
P it t s y lv a n i a
P o w h a t a n
P ri n c e
E d w a r d
P ri n c e G e o r g e
P ri n c e
W il li a m
P u la s k i
R a p p a -
h a n n o c k
R ic h m o n d
R o a n o k e
R o c k b r i d g e
R o c k in g h a m
R u s s e ll
S c o t t
S h e n a n d o a h
S m y t h
S o u t h a m p to n
S p o t s y lv a n i a
S t a f f o r d
S u r r y
S u s s e x
T a z e w e l l
W a rr e n
W a s h in g t o n
W e s t m o r e l a n d
W is e
W y th e
Y o r k
B e d f o r d C it y
B r is t o l
C h a r lo t t e s -
vi l le
C h e s a p e a k e
D a n v il l e
E m p o r i a
F r e d e r ic k sb u r g
G a la x
H a r r is o n b u r g
H o p e w e ll
L y n c h b u r g
Ma r t i n s v il le
N e w p o r t
N e w s
N o r f o l k
P e t e r s b u r g
P o r ts m o u t h
R ic h m o n d
C it y
S a le m
S t a u n t o n
S u f f o lk
V ir g i n ia
B e a c h
W il li a m s b u r g
W in c h e s t e r
B a r b o u r
B e r k e le y
B o o n e
B r a x t o n
Br
oo
ke
C a b e ll
C a lh o u n
C la y
D o d d r i d g e
F a y e t t e
G il m e r
G r a n t
G r e e n b r i e r
H a m p s h ir e
Ha
nc
oc
k
H a r d yH a r r is o n
J a c k s o n
Je
ff
er
so
n
K a n a w h a
L e w i s
L in c o l n
L o g a n
Mc D o w e l l
Ma r i o n
Ma r s h a l l
Ma s o n
Me r c e r
Mi n e r a l
Mi n g o
Mo n o n g a l i a
Mo n r o e
Mo r g a n
N i c h o la s
O h i o
P e n d le t o n
P le a s a n t s
P o c a h o n t a s
P re s to n
P u tn a m
R a le i g h
R a n d o lp h
R it c h i e
R o a n e
S u m m e r s
T a y lo r
T u c k e r
T y le r
U p s h u r
W a y n e
W e b s t e r
W e t z e l
W ir t
W o o d
W y o m i n g
A d a m s
A s h l a n d
B a r r o n
B a y f ie l d
B r o w n
B u f f a lo
B u r n e t t
C a lu m e t
C h ip p e w a
C la r k
C o lu m b i a
C r a w f o r d
D a n e
D o d g e
D o o r
D o u g l a s
D u n n
E a u C la i r e
F lo r e n c e
F o n d d u L a c
F o r e s t
G r a n t
G r e e n
G r e e n
L a k e
I o w a
I r o n
J a c k s o n
J e f f e r s o n
J u n e a u
K e n o s h a
K e w a u n e e
L a C r o s s e
L a f a y e t t e
L a n g la d eL in c o l n
Ma n i t o w o c
Ma r a t h o n
Ma r i n e t t e
Ma r q u e t t e
Me n o m in e e
Mi lw a u k e e
Mo n r o e
O c o n t o
O n e i d a
O u t a g a m ie
O z a u k e e
P e p in
P ie r c e
P o lk
P o r ta g e
P ri c e
R a c in e
R ic h l a n d
R o c k
R u s k
S t . C r o i x
S a u k
S a w y e r
S h a w a n o
S h e b o y g a n
T a y lo r
Tr
em
pe
ale
au
V e r n o n
V il a s
W a lw o r t h
W a s h b u r n
W a s h in g t o n
W a u k e s h a
W a u p a c a
W a u s h a r a W in n e b a g o
W o o d
F a ir f i e ld
H a r t f o r d
L it c h f i e ld
Mi d d l e s e x
N e w H a v e n
N e w L o n d o n
T o ll a n d W in d h a m
A ll e n
A n d e r s o n
A t c h i s o n
B a r b e r
B a r t o n
B o u r b o n
B r o w n
B u t le r
C h a s e
C h a u t a u q u aC h e r o k e e
C h e y e n n e
C la r k
C la y
C lo u d
C o f f e y
C o m a n c h eC o w l e y
C r a w f o r d
D e c a t u r
D ic k in s o n
D o n i p h a n
D o u g l a s
E d w a r d s
E lk
E ll is
E ll s w o r t h
F in n e y
F o r d
F r a n k li n
G e a r y
G o v e
G r a h a m
G r a n t
G r a y
G r e e le y
G r e e n w o o d
H a m il t o n
H a r p e r
H a r v e y
H a s k e l l
H o d g e m a n
J a c k s o n
J e f f e r s o n
J e w e l l
J o h n s o n
K e a r n y
K in g m a nK io w a
L a b e t t e
L a n e
Le
av
en
wo
rt
h
L in c o l n
L in n
L o g a n
L y o n
Mc P h e r s o nMa r i o n
Ma r s h a l l
Me a d e
Mi a m i
Mi t c h e ll
Mo n t g o m e r y
Mo r r i s
Mo r t o n
N e m a h a
N e o s h o
N e s s
N o r t o n
O s a g e
O s b o r n e
O t t a w a
P a w n e e
P h il li p s
P o tt a w a t o m i e
P ra t t
R a w l in s
R e n o
R e p u b l ic
R ic e
R il e y
R o o k s
R u s h
R u s s e ll
S a li n e
S c o t t
S e d g w i c k
S e w a r d
S h a w n e e
S h e r i d a n
S h e r m a n
S m i t h
S t a f f o r d
S t a n t o n
S t e v e n s
S u m n e r
T h o m a s
T r e g o
W a b a u n s e e
W a ll a c e
W a s h in g t o n
W ic h i t a
W il s o n
W o o d s o n
W y a n d o t t e
B a r n s t a b le
B e r k s h ir e B r is t o l
D u k e s
E s s e x
F r a n k li n
H a m p d e n
H a m p s h ir e
Mi d d l e s e x
N a n t u c k e t
N o r f o l k
P ly m o u t h
S u f f o lk
W o r c e s te r
B e lk n a p
C a r r o ll
C h e s h i re
C o o s
G r a f t o n
H i ll s b o r o u g h
Me r r i m a c k
R o c k in g h a m
S t r a f f o r d
S u ll i va n
A la m a n c e
A le x a n d e r
A ll e g h a n y
A n s o n
A s h e
A v e r y
B e a u f o r t
B e r t ie
B la d e n
B r u n s w i c k
B u n c o m b e
B u r k e
C a b a r r u s
C a ld w e ll
C a m d e n
C a r t e r e t
C a s w e l l
C a t a w b a
C h a t h a m
C h e r o k e e
C h o w a n
C la y
C le v e l a n d
C o lu m b u s
C r a v e n
C u m b e r l a n d
C u r r it u c k
D a r e
D a v id s o n
D a v ie
D u p l in
D u r h a m
E d g e c o m b e
F o r s y t h
F r a n k li n
G a s t o n
G a t e s
G r a h a m
G r a n v il le
G r e e n e
G u il f o r d
H a l if a x
H a r n e t t
H a y w o o d
H e n d e r s o n
H e r t f o r d
H o k e
H y d e
I r e d e ll
J a c k s o n
J o h n s t o n
J o n e s
L e eL e n o ir
L in c o l n
Mc D o w e l l
Ma c o n
Ma d i s o n
Ma r t i n
Me c k l e n b u r g
Mi t c h e ll
Mo n t g o m e r y
Mo o r e
N a s h
N e w
H a n o v e r
N o r t h a m p t o n
O n s l o w
O r a n g e
P a m l ic o
P a squ o ta n
k
P e n d e r
P e r q u im a n s
P e r s o n
P it t
P o lk
R a n d o lp h
R ic h m o n d
R o b e s o n
R o c k in g h a m
R o w a n
R u t h e r f o r d
S a m p s o n
S c o t la n d
S t a n ly
S t o k e sS u r r y
S w a i n
T r a n -
sy l v a n i a
T y r r e ll
U n i o n
V a n c e
W a k e
W a rr e n
W a s h in g t o n
W a ta u g a
W a y n e
W il k e s
W il s o n
Y a d k i n
Y a n c e y
A p p l in g
A t k in so n
B a c o n
B a k e r
B a ld w in
B a n k s
B a r r o w
B a r t o w
B e n H il l
B e r r ie n
B ib b
B le c k l e y
B r a n t le y
B r o o k s
B r y a n
B u ll o c h
B u r k eB u t t s
C a lh o u n
C a m d e n
C a n d le r
C a r r o ll
C a t o o s a
C h a r lt o n
C h a t h a m
C h a t t a -
h o o c h e e
C h a t t o o g a
C h e r o k e e
C la r k e
C la y
C la y t o n
C li n c h
C o b b
C o f f e e
C o lq u i t t
C o lu m b i a
C o o k
C o w e t a
C r a w f o r d
C r is p
D a d e
D a w s o n
D e c a t u r
D e K a l b
D o d g e
D o o l y
D o u g h e r t y
D o u g l a s
E a r ly
E c h o ls
E f f in g h a m
E lb e rt
E m a n u e l
E v a n s
F a n n in
F a y e t t e
F lo y d
F o r s y t h
F r a n k li n
F u lt o n
G il m e r
Gla
sc
oc
k
G ly n n
G o r d o n
G r a d y
G r e e n e
G w i n n e t t
Ha
be
rs
ha
m
H a l l
H a n c o c k
H a r a l so n
H a r r is
H a r t
H e a r d
H e n r y
H o u s t o n
I r w in
J a c k s o n
J a s p e r
J e f f
D a v is
J e f f e r s o n
J e n k i n s
J o h n s o n
J o n e sL a m a r
L a n ie r
L a u r e n s
L e e
L ib e r t y
L in c o l n
L o n g
L o w n d e s
L u m p k i n
Mc D u f f ie
Mc I n t o s h
Ma c o n
Ma d i s o n
Ma r i o n
Me r i w e t h e r
Mi ll e r
Mi t c h e ll
Mo n r o e
Mo n t -
g o m e r y
Mo r g a n
Mu r r a y
Mu s c o g e e
N e w t o n
O c o n e e
O g l e t h o r p e
P a u ld i n g
P e a c h
P ic k e n s
P ie r c e
P ik e
P o lk
P u la s k i
P u tn a m
Qu i t m a n
R a b u n
R a n d o lp h
R ic h m o n dRo
ck
da
le
S c h l e y
S c r e v e n
S e m i n o l e
S p a ld in g
S t e p h e n s
S t e w a r t
S u m t e r
T a lb o t
T a li a f e r r o
T a t t n a ll
T a y lo r
T e lf a i r
T e r r e ll
T h o m a s
T if t
T o o m b s
T o w n s
T r e u t le n
T r o u p
T u r n e r
T w i g g s
U n i o n
U p s o n
W a lk e r
W a lt o n
W a re
W a rr e n
W a s h in g t o n
W a y n e
W e b s t e r
W h e e le r
W h it eW h it f i e ld
W il c o x
W il k e s
W il k in s o n
W o r th
A d a m s
A la m o s a
A r a p a h o e
A r c h u l e t a
B a c a
B e n t
B o u ld e r
B r o o m f i e ld
C h a f f e e
C h e y e n n e
C le a r C r e e k
C o n e j o s C o s t il la
C r o w l e y
C u s t e r
D e l ta
D e n v e r
D o lo re s
D o u g l a s
E a g le
E lb e rt
E l P a s o
F r e m o n t
G a r f ie l d
G il p i n
G r a n d
G u n n is o n
H i n s d a le
H u e r f a n o
J a c k s o n
J e f f e r s o n
K io w a
K it C a r s o n
L a k e
L a P l a t a
L a r im e r
L a s A n im a s
L in c o l n
L o g a n
Me s a
Mi n e r a l
Mo f f a t
Mo n t e z u m a
Mo n t r o s e
Mo r g a n
O t e r o
O u r a y
P a rk
P h il li p s
P it k i n
P ro w e r s
P u e b lo
R io B l a n c o
R io G r a n d e
R o u t t
S a g u a c h e
S a n J u a n
S a n M i g u e l
S e d g w i c k
S u m m it
T e ll e r
W a s h in g t o n
W e ld
Y u m a
A t la n t i c
B e r g e n
B u r li n g t o n
C a m d e n
D C
C a p e
Ma y
C u m b e r l a n d
E s s e x
G lo u c e st e r
H u d s o n
H u n t e r d o n
Me r c e r
Mi
dd
le
se
x
Mo n m o u t h
Mo r r i s
O c e a n
P a ss a i c
S a le m
S o m e r-
se t
S u s s e x
W a rr e n
A r k a n s a s
A s h l e y
B a x t e rB e n t o n
B o o n e
B r a d le y
C a lh o u n
C a r r o ll
C h ic o t
C la r k
C la y
C le b u r n e
C le v e l a n d
C o lu m b i a
C o n w a y
C r a ig h e a d
C r a w f o r d
C r it t e n d e n
C r o s s
D a ll a s
D e s h a
D r e w
F a u lk n e r
F r a n k li n
F u lt o n
G a r la n d
G r a n t
G r e e n e
H e m p s t e a d
H o t S p r in g
H o w a r d
I n d e p e n d e n c e
I z a r d
J a c k s o n
J e f f e r s o n
J o h n s o n
L a f a y e t t e
L a w r e n c e
L e e
L in c o l n
L it t l e R i v e r
L o g a n
L o n o k e
Ma d i s o n
Ma r i o n
Mi ll e r
Mi s s is s i p p i
Mo n r o e
Mo n t g o m e r y
N e v a d a
N e w t o n
O u a c h i t a
P e r ry
P h il li p s
P ik e
P o in s e t t
P o lk
P o p e
P ra i r i e
P u la s k i
R a n d o lp h
S t . F r a n c i s
S a li n e
S c o t t
S e a r c y
S e b a s t i a n
S e v ie r
S h a r p
S t o n e
U n i o n
V a n B u r e n
W a s h in g t o n
W h it e
W o o d r u f f
Y e ll
A c a d i a
A ll e n
A s c e n s i o n
A s s u m p t i o n
A v o y e l le s
B e a u r e g a r d
B ie n v i ll e
B o s s ie r
C a d d o
C a lc a s i e u
C a ld w e ll
C a m e r o n
C a t a h o u la
C la i b o r n e
C o n c o r d ia
D e S o t o
E a s t
B a t o n
R o u g e
E a s t
C a r r o ll
E a s t
F e li c ia n a
E v a n g e li n e
F r a n k li n
G r a n t
I b e r ia
I b e r ia
I b e r v il le
J a c k s o n
J e f f e r s o n
J e f f e r s o n
D a v isL a f a y e t t e
L a f o u r c h e
L a S a ll e
L in c o l n
L iv i n g s t o n
Ma d i s o n
Mo r e h o u s e
N a t c h i t o c h e s
O r l e a n s
O u a c h i t a
P la q u e m in e s
P o in t e
C o u p e e
R a p id e s
R e d R iv e r
R ic h l a n d
S a b i n e
S t . B e r n a r d
S t .
C h a r le s
S t .
H e l e n a
S t .
J a m e s
S t . J o h n
th e B a p ti s t
S t . L a n d r y
S t .
Ma r t i n
S t . M a r ti n
S t . M a r y
S t . T a m m a n y
T a n g ip a h o a
T e n s a s
T e r r e b o n n eT e r r e b o n n e
T e r r e b o n n e
U n i o n
V e r m i li o n
V e r n o n
W a s h in g t o n
W e b s t e r
W e s t
B a t o n
R o u g e
W e s t
C a r r o ll
W e s t
F e li c ia n a
W in n
A n d e r s o n
A n d r e w s
A n g e l in a
A r a n s a s
A r c h e r
A r m s t r o n g
A t a s c o s a
A u s t in
B a il e y
B a n d e r a
B a s t r o p
B a y lo r
B e e
B e ll
B e x a r
B la n c o
B o r d e n
B o s q u e
B o w i e
B r a z o r ia
B r a z o s
B r e w s t e r
B r is c o e
B r o o k s
B r o w n
B u r le s o n
B u r n e t
C a ld w e ll
C a lh o u n
C a ll a h a n
C a m e r o n
C a m p
C a r s o n
C a s s
C a s t r o
C h a m b e r s
C h e r o k e e
C h il d r e s s
C la y
C o c h r a n
C o k e
C o le m a n
C o ll in
C o ll in g s w o r t h
C o lo r a d o
C o m a l
C o m a n c h e
C o n c h o
C o o k e
C o r y e ll
C o t t le
C r a n e
C r o c k e t t
C r o s b y
C u lb e r s o n
D a ll a m
D a ll a s
D a w s o n
D e a f S m i t h
D e l ta
D e n t o n
D e W i t t
D ic k e n s
D im m it
D o n l e y
D u v a l
E a s t la n d
E c t o r
E d w a r d s
E ll is
E l P a s o
E r a t h
F a ll s
F a n n in
F a y e t t e
F is h e r
F lo y d
F o a r d
F o r t B e n d
Fr
an
kli
n
F r e e s t o n e
F r io
G a in e s
G a lv e s t o n
G a r z a
G il le sp ie
G la s s c o c k
G o li a d
G o n z a l e s
G r a y
G r a y s o n
G r e g g
G r im e s
G u a d a l u p e
H a l e
H a l l
H a m il t o n
H a n s f o r d
H a r d e m a n
H a r d i n
H a r r is
H a r r is o n
H a r t le y
H a s k e l l
H a y s
H e m p h il l
H e n d e r s o n
H i d a lg o
H i ll
H o c k l e y
H o o d
H o p k i n s
H o u s t o n
H o w a r d
H u d s p e t h
H u n t
H u t c h i n s o n
I r io n
J a c k
J a c k s o n
J a s p e r
J e f f D a v is
J e f f e r s o n
J im H o g g
J im W e ll s
J o h n s o n
J o n e s
K a r n e s
K a u f m a n
K e n d a l l
K e n e d y
K e n t
K e r r
K im b le
K in g
K in n e y
K le b e r g
K n o xL a m a r
L a m b
L a m p a s a s
L a S a ll e
L a v a c a
L e e
L e o n
L ib e r t y
L im e s t o n e
L ip s c o m b
L iv e O a k
L la n o
L o v in g
L u b b o c k
L y n n
Mc C u l l o c h
Mc L e n n a n
Mc M u l le n
Ma d i s o n
Ma r i o n
Ma r t i n
Ma s o n
Ma t a g o r d a
Ma v e r i c k
Me d i n a
Me n a r d
Mi d la n d
Mi la m
Mi ll s
Mi t c h e ll
Mo n t a g u e
Mo n t g o m e r y
Mo o r e
Mo r r i s
Mo t l e y
N a c o g d o c h e s
N a v a r r o
N e w t o n
N o l a n
N u e c e s
O c h i lt r e e
O l d h a m
O r a n g e
P a lo P in t o
P a n o la
P a rk e r
P a rm e r
P e c o s
P o lk
P o tt e r
P re s id i o
R a in s
R a n d a ll
R e a g a n
R e a l
R e d R iv e r
R e e v e s
R e f u g io
R o b e r t s
R o b e r t s o n
R o c k w a l l
R u n n e ls
R u s k
S a b i n e
S a n
A u g u s t in e
S a n J a c in t o
S a n P a tr i c io
S a n S a b a
S c h l e ic h e r
S c u r r y
S h a c k e l f o r d
S h e l b y
S h e r m a n
S m i t h
S o m e rv e l l
S t a r r
S t e p h e n s
S t e r li n g
S t o n e w a l l
S u t t o n
S w i s h e r
T a r r a n t
T a y lo r
T e r r e ll
T e r r y
T h r o c k m o r to n
T it u s
T o m G r e e n
T r a v is
T r in i t y
T y le r
U p s h u r
U p t o n
U v a ld e
V a l V e r d e
V a n Z a n d t
V ic t o r i a
W a lk e r
W a ll e r
W a rd
W a s h in g t o n
W e b b
W h a r t o n
W h e e le r
W ic h i t a
W il b a r g e r
W il la c y
W il li a m s o n
W il s o n
W in k l e r
W is e
W o o d
Y o a k u m
Y o u n g
Z a p a t a
Z a v a la
A d a m s
A n t e l o p e
A r t h u r
B a n n e r
B la i n e
B o o n e
B o x B u t t e
B o y d
B r o w n
B u f f a lo
B u r t
B u t le r
C a s s
C e d a r
C h a s e
C h e r r y
C h e y e n n e
C la y
C o lf a x
C u m i n g
C u s t e r
D a k o t a
D a w e s
D a w s o n
D e u e l
D ix o n
D o d g e
D o u g l a s
D u n d y
F il lm o r e
F r a n k li n
F r o n t ie r
F u r n a s G a g e
G a r d e n
G a r f ie l d
G o s p e r
G r a n t
G r e e le y
H a l l H a m il t o n
H a r la n
H a y e s
H i tc h c o c k
H o l t
H o o k e r
H o w a r d
J e f f e r s o n
J o h n s o n
K e a r n e y
K e it h
K e y a P a h a
K im b a ll
K n o x
L a n c a s t e r
L in c o l n
L o g a n
L o u p
Mc P h e r s o n
Ma d i s o n
Me r r i c k
Mo r r i ll
N a n c e
N e m a h a
N u c k o l ls
O t o e
P a w n e e
P e r k in s
P h e lp s
P ie r c e
P la t t e
P o lk
R e d W il lo w
R ic h a r d so n
R o c k
S a li n e
S a r p y
S a u n d e r s
S c o t t s B lu f f
S e w a r d
S h e r i d a n
S h e r m a n
S io u x
S t a n t o n
T h a y e r
T h o m a s
T h u r s t o n
V a ll e y
W a s h in g t o n
W a y n e
W e b s t e r
W h e e le r
Y o r k
K e n t
N e w
C a s t le
S u s s e x
A u t a u g a
B a ld w in
B a r b o u r
B ib b
B lo u n t
B u ll o c k
B u t le r
C a lh o u n
C h a m b e r s
C h e r o k e e
C h il t o n
C h o c t a w
C la r k e
C la y
C le b u r n e
C o f f e e
C o lb e rt
C o n e c u h
C o o s a
C o v in g t o n
C r e n s h a w
C u ll m a n
D a le
D a ll a s
D e K a l b
E lm o r e
E s c a m b i a
E t o w a h
F a y e t t e
F r a n k li n
G e n e v a
G r e e n e
H a l e
H e n r y
H o u s t o n
J a c k s o n
J e f f e r s o n
L a m a r
L a u d e r d a le
L a w r e n c e
L e e
L im e s t o n e
L o w n d e s
Ma c o n
Ma d i s o n
Ma r e n g o
Ma r i o n
Ma r s h a l l
Mo b i l e
Mo n r o e
Mo n t g o m e r y
Mo r g a n
P e r ry
P ic k e n s
P ik e
R a n d o lp h
R u s s e ll
S t . C l a ir
S h e l b y
S u m t e r
T a ll a d e g a
T a ll a p o o s a
T u s c a lo o s a
W a lk e r
W a s h in g t o n
W il c o x
W in s t o n
A d a i r
A lf a l f a
A t o k a
B e a v e r
B e c k h a m
B la i n e
B r y a n
C a d d o
C a n a d ia n
C a r t e r
C h e r o k e e
C h o c t a w
C im a r r o n
C le v e l a n d
C o a l
C o m a n c h e
C o t t o n
C r a ig
C r e e k
C u s t e r
D e l a w a r e
D e w e y
E ll is
G a r f ie l d
G a r v in
G r a d y
G r a n t
G r e e r
H a r m o n
H a r p e r
H a s k e l l
H u g h e s
J a c k s o n
J e f f e r s o n
J o h n s t o n
K a y
K in g f i s h e r
K io w a
L a t im e r L e F l o r e
L in c o l n
L o g a n
L o v e
Mc C l a i n
Mc C u r t a i n
Mc I n t o s h
Ma j o r
Ma r s h a l l
Ma y e s
Mu r r a y
Mu s k o g e e
N o b l e
N o w a t a
O k f u s k e e
O k l a h o m a
O k m u lg e e
O s a g e
O t t a w a
P a w n e e
P a y n e
P it t s b u r g
P o n t o to c
P o tt a -
w a t o m i e
P u s h m a t a h a
R o g e r M i ll s
R o g e r s
S e m i n o l e
S e q u o y a h
S t e p h e n s
T e x a s
T il lm a n
T u ls a
W a g o n e r
Wa
sh
ing
to
n
W a s h it a
W o o d s
W o o d w a r d
A b b e v i ll e
A ik e n
A ll e n d a l e
A n d e r s o n
B a m b e rgB a r n w e l l
B e a u f o r t
B e r k e le y
C a lh o u n
C h a r le s t o n
C h e r o k e e
C h e s t e r
C h e s t e r f ie l d
C la r e n d o n
C o ll e t o n
D a r li n g t o n
D il l o n
D o r c h e s t e r
E d g e f i e ld
F a ir f i e ld
F lo r e n c e
G e o r g e t o w n
G r e e n v il l e
G r e e n w o o d
H a m p t o n
H o r r y
J a s p e r
K e r s h a w
L a n c a s t e r
L a u r e n sL e e
L e x in g t o n
Mc C o r m ic k
Ma r i o n
Ma r l b o r o
N e w b e r r y
O c o n e e
O r a n g e b u r g
P ic k e n s
R ic h l a n d
S a lu d a
S p a r t a n b u r g
S u m t e r
U n i o n
W il li a m s b u r g
Y o r k
A d d i s o n
B e n n in g t o n
C a le d o n ia
C a le d o n ia
C h it t e n d e n
E s s e xF r a n k li n
G r a n d
I s leL a m o i ll e
O r a n g e
O r l e a n s
R u t la n d
W a s h in g t o n
W in d h a m
W in d s o r
A u r o r a
B e a d l e
B e n n e t t
B o n H o m m e
B r o o k in g s
B r o w n
B r u le
B u f f a lo
B u t t e
C a m p b e ll
C h a r le s M ix
C la r k
C la y
C o d in g t o n
C o r s o n
C u s t e r
D a v is o n
D a y
D e u e l
D e w e y
D o u g l a s
E d m u n d s
F a ll R iv e r
F a u lk
G r a n t
G r e g o r y
H a a k o n
H a m li n
H a n d
H a n s o n
H a r d i n g
H u g h e s
H u t c h i n s o n
H y d e
J a c k s o n
J e r a u ldJ o n e s
K in g s b u r y
L a k e
L a w r e n c e
L in c o l n
L y m a n
Mc C o o k
Mc P h e r s o n
Ma r s h a l l
Me a d e
Me l le t t e
Mi n e r
Mi n n e h a h a
Mo o d y
P e n n in g t o n
P e r k in s
P o tt e r
R o b e r t s
S a n b o r n
O g l a la L a k o t a
S p in k
S t a n le y
S u ll y
T o d d
T r ip p
T u r n e r
U n i o n
W a lw o r t h
Y a n k t o n
Z ie b a c h
A n d r o -
sc o g g in
A r o o s t o o k
C u m b e r l a n d
F r a n k li n
H a n c o c k
K e n n e b e cK n o x
L in c o l n
O x f o r d
P e n o b s c o t
P is c a t a q u i s
S a g a d a h o c
S o m e rs e t
W a ld o
W a s h in g t o n
Y o r k
B r is t o l
K e n t
N e w p o r t
P ro vi d e n c e
W a s h in g t o n
N e w
Y o r k
CO
GA
LA
MD
MAMI
MNNH
NJ
NY
NC
OH
TX
VA
NE
DE
AL
SC
VT
SD
ME
RI
OK
WI
WV
TN
PA
MO KYKS
IA
INIL
CT
AR
[USDA, APHIS, PPQBrighton, MI
Data Source:USDA-APHIS-PPQ
Da te C rea t ed : 12 / 1/ 2 02 0
These data , and all the information contained therein, have been collected by the U.S. Department of Agriculture'sAnimal and Plant Health Inspection Service (APHIS), or by its cooperators on APHIS’ behalf, for restrictedgovernment purposes only and is the sole property of APHIS. See full disclaimer: www.aphis.usda.gov/help/map-disclaime r
EAB COUNTY DETECTIONS -- DECEMBER 1, 2020
Cooperative Emerald Ash Borer Project
0 200 400Miles
Coordinate System: North America Lamber t Conformal Conic 0 300 600Kilometers
United States Department of Agriculture
2020 EAB County Detections
EAB County Detections 2002-2019
Regional Initiatives Regional Initiatives

a a96
Oak Decline Oak decline is known as a disease complex that has been a major concern since the 1950s when it was first noticed that mature and otherwise healthy oaks would begin to decline and slowly die over the course of several years. The disease complex affects oaks in both forested and urban settings. Drought, defoliation, and secondary stress agents are common contributors. Oak decline is prevalent throughout Tennessee, North Carolina, Virginia, Kentucky, and northern Alabama and Georgia. Developing diverse, sustainable, and productive forest products markets is essential to providing land managers options and tools to manage for oak decline.
Invasive Plants Invasive plants can be native and non-native plants introduced into native forests. Invasive plants outcompete native vegetation disrupting forest ecology and succession, decreasing the value our forests
provide. In Tennessee, the Tennessee Exotic Plant and Pest Council estimated the cost of managing invasive plants alone to be $2.6 million. Invasive plants have invaded anywhere from 16-100 percent of subplots in the state of Tennessee (Figure 55).
Invasive plants are a major threat to forest sustainability and should be managed from a regional perspective. Since distribution of invasive plants can be attributed to a wide variety of causes (i.e., interstate/international commerce, intentional plantings, transportation via wildlife, wind, and water) and have been an issue since state settlement, the most effective approach to managing invasive plants is outreach and education. In some instances, an invasive plant has a high chance of being eradicated if detected early like cogongrass. Cogongrass was detected in Tennessee, but due to regional educational/monitoring programs, information sharing, and a collaborative treatment approach, forest health specialists were able to eradicate the plant before it became established in Tennessee.
Figure 55. USFS Forest Inventory and Analysis map of subplots containing invasive plants and estimated invasion-intensity. (https://www.srs.fs.usda.gov/compass/2016/01/05/a-big-picture-view-of-the-invasive-plant-problem/)
Regional Initiatives

a a97
American Forest Carbon InitiativeTNC’s Family Forest Carbon Initiative is a forest conservation program that aims to protect critical forest while increasing and improving private forest management, providing revenue for forest landowners, and mitigating climate change. Private landowners who enroll their property in Family Forest Carbon Initiative have an opportunity to sell carbon credits to businesses seeking to reduce their carbon footprint and have a positive impact on the environment. There are three programs associated with this initiative that are tailored to all sizes for private forest landowners: The Family Forest Carbon Initiative (focuses on 20-200-acre ownership); the Forest Carbon Coops (focuses on 200-2,000-acre ownership); and Working Woodlands (focuses on 2,000 acres or more ownership).
https://www.nature.org/en-us/about-us/where-we-work/united-states/working-woodlands/
White Oak Initiative The White Oak Initiative works to ensure the long-term sustainability of America’s white oak and the economic, social, and conservation benefits derived from white oak-dominated forests. While current white oak growing stocks are sufficient to meet demand, forest monitoring
and long-term projections indicate problems in maintaining high-quality white oak regeneration.
White oak is critical to many wildlife species and to industries making forest products such as furniture, flooring, cabinetry, and barrels for wine and spirits, as well as for recreational activities like hunting, generating billions of dollars to local economies throughout the white oak region.
https://www.whiteoakinitiative.org/
Shortleaf Pine Initiative The Shortleaf Pine Initiative (SPI) SPI represents a broad range of public and private organizations, as well as key state and federal agencies currently working in the shortleaf pine ecosystem to address the extensive and rapid loss of shortleaf pine habitats. Over the last 30 years, the shortleaf pine ecosystem has lost over 50 percent of its former acreage with the most significant decline taking places east of the Mississippi River. Massive pine beetle outbreaks in poorly managed stands, changes in timber management practices, altered fire regimes, disease, and land-use changes have contributed to this rapid decline.
http://shortleafpine.net/
Regional Initiatives Regional Initiatives

a a98
Workforce Development According to U.S. Census Bureau, the forest products industry workforce is aging and numbers are declining. In 2018, forest industry workers in the age class 35-64 made up 66 percent of the total forest industry labor force, while only 8 percent of the forest products workforce was between the ages of 19 and 24. Recruitment into this industry is stagnant as young people are leaving rural communities in search of other employment and opportunities. This circumstance is not unique to Tennessee as it is a recognized threat to the forest products industry in many other southern states. Additionally, the need for mid-skill workers is increasing as more and more young people chose to pursue college careers. The need for experienced heavy equipment operators, specialized mill workers, lumber graders, mill mechanics, and sawyers is greater now than ever before.
Export Market DevelopmentTennessee’s forest industry depends on a sustainable supply of wood products to remain viable and growing. The majority of the wood-processing facilities rely on hardwood timber for their manufacturing processes. Over the last decade, export markets, especially hardwood export markets, have developed to be a significant economic driver for Tennessee’s forest industry. Tennessee forest products
manufacturing facilities have worked hard to engage in the opportunities export markets provide. Forest businesses would struggle to survive without these markets.
Over the last few years several events have occurred that are placing tremendous strain on access to the forest products markets that our state’s forest industries need. Recent trade wars with China severely restricted access to lucrative markets for many of Tennessee’s hardwood producing mills, especially for species like red oak that had lost preference and favor in the domestic markets. From 2017 to 2019, Tennessee forest products exports dropped from $291 million to $177 million ($114 million decrease, 39 percent). Most of this decrease was associated with trade to China ($105 million decrease). In February, the Chinese phase 1 trade agreement was paving the way for re-access to these markets. Many of our state’s wood-processing mills are seeking survival strategies to stay in business until market situations improve.
To help address market needs, the TDA’s Divisions of Business Development and Forestry are working with forest-industry opinion leaders, the University of Tennessee, and national and regional state forester associations to identify export market development opportunities; to seek funding for market research and trade mission visits; and to provide technical assistance to help mills expand into overseas markets.
Expanding Market Diversification

a a99
Landscape Management Planning Nationally, fewer than 8 percent of forest landowners have a management plan and less than 10 percent have met with a natural resource professional. Given that there are more than 9.4 million acres of forest owned by non-industrial forest landowners in Tennessee and more than 145,000 individual owners of more than 10 acres of forestland, not every landowner can be provided comprehensive forest management planning assistance.
Working collaboratively with other resource agencies, forest industry professionals, nongovernmental organizations, and landowners at the landscape scale is a more effective way of influencing forest stewardship, and it should result in increased efficiency in assistance delivery; wider recognition of the value of forests and forest sustainability; and ultimately an increase in the productivity, health, diversity, and resiliency of private forests. Landscape-level management planning approaches can address issues and opportunities within priority areas identified in Tennessee’s FAP. This can be accomplished by encouraging collaboration among
all stakeholders within a priority area, including private forest landowners and industry professionals, to achieve their objectives within the context of the FAP, leading to a greater public benefit. The creation and implementation of a state-wide Landscape Management Plan (LMP) will allow natural resource professionals to deliver consistent and comprehensive information to better inform landowners of forest management practices at the landscape level and to make specific recommendations on practices that will lead to accomplishing landscape-level goals. The development of this LMP will support the engagement of family forest owners and aid the identification and accomplishment of their management objectives. This project will also significantly reduce the burden of individual management plan development, remove the barriers to forest certification and participation in the Forest Stewardship program, and provide additional access to certified materials for forest industry partners. In 2019, we partnered with Alabama Forestry Commission to fund the development of our state-wide LMP through a Landscape Scale Restoration Grant. Across the Southern Region, seven other states have either completed or begun the process of developing state-wide LMPs.
Maintaining and Improving Connected Landscapes

a a100
Forest Stewardship Coordinating CommitteeThis committee was engaged during the Tennessee Forestry Association annual meeting on Wednesday September 26, 2018 and Wednesday October 16, 2019.
Natural Resources Conservation Services (NRCS)NRCS was engaged multiple times through the authoring of this action plan either through presentations with Q & A sessions, most notably during a State Technical Committee meeting held in Murfreesboro, TN on November 11, 2019; or through one on one subject matter expert meetings.
State Wildlife Action Plan
State Wildlife Action Plans (SWAPs) are comprehensive plans to guide conservation of game and nongame species and their habitats that are developed by state wildlife agencies and updated every 10 years. SWAPs enable states to be eligible for funding from the State and Tribal Wildlife Grants Program, which provides a funding stream for species that have been traditionally underfunded. The State and Tribal Wildlife Grants Program is the nation’s core program for preventing species listings under the Endangered Species Act.
Tennessee Wildlife Resources Agency’s (TWRA) 2015 SWAP uses a habitat-based approach to identify priorities and facilitate species management (Tennessee State Wildlife Action Plan Team 2015). TWRA identified species of greatest conservation concern by analyzing thousands of species observation records, identifying habitat preferences and threats with potential impacts to species, and integrating spatial data into the SWAP database. The resulting maps of terrestrial, subterranean, and aquatic priorities ranked areas from Low to Very High depending on number of species, species status updates, and potential threats. The SWAP also designates Conservation Opportunity Areas (COAs) as areas with the greatest opportunity for conserving, preserving, or restoring habitat for species of greatest conservation need and provides a framework for voluntary and partnership-focused conservation actions.
Alignment between the FAP and SWAP priorities was assessed. The 2020 FAP focused on three conservation priorities: carbon storage, surface drinking water, and resilient and connected landscapes. FAP priorities capture 10.6 million acres of COAs, and 2.4 million acres are potentially eligible for Forest Legacy Program funding if management requirements are met. An analysis of SWAP terrestrial priorities found that 4.3 million acres of very high, .9 million acres of high, and 1.2 million acres of medium priorities for species of greatest conservation need are captured in FAP priority areas. The total overlap between FAP and SWAP priorities is 15.9 million acres, or 96 percent of FAP carbon, water, resilience, Forest Legacy Program, and Forest Stewardship Program priority areas, including non-forested lands and waters embedded in forest matrices. TWRA was engaged multiple times during this process either in group settings or in individual subject matter expert meetings. Most notably, TWRA was engaged during a “Saw and Claws” annual meeting between TWRA, TDF, and NRCS in Jackson, TN in July 2019.
Southeast Conservation Adaptation Strategy The Southeast Conservation Adaptation Strategy (SECAS) is a regional conservation initiative spanning the Southeastern U.S. and Caribbean that was started by the states of the Southeastern Association of Fish and Wildlife Agencies and the federal agencies of the Southeast Natural Resource Leaders Group. SECAS was a response to the unprecedented challenges facing natural and cultural resources, and a call for coordinated and collaborative conservation action and investment around a shared strategy. SECAS brought together state and federal agencies, nonprofit organizations, private businesses, tribes, partnerships, and universities to describe a shared vision and design a connected network of lands and waters to benefit ecosystems, species, and people. In 2018, SECAS adopted an overarching conservation goal for the Southeast region: a 10 percent or greater improvement in the health, function, and connectivity of Southeastern ecosystems by 2060. To track progress toward this long-term goal, SECAS has set near-term metrics of a 1 percent improvement in ecosystem health, function, and connectivity, accompanied by a corresponding 1 percent increase in conservation actions, every 4 years. Achieving the long-term goal will require considerable collaborative effort across the conservation community.
Complementary Planning Initiatives & Stakeholder Coordination

a a101
The Southeast Blueprint covers the entirety of 15 southeastern states and Puerto Rico (Figure 56). The Blueprint coordinates multiple smaller sub-regional plans, each based on different foundation datasets, incorporating the best available information about key species, ecosystems, and future threats. More than 1,700 people from 500 different organizations have actively participated in the Blueprint’s development to date. The Southeast Blueprint identifies areas of high and medium conservation value. High-value areas are defined as the most important for ecosystem health, function, and connectivity. Medium-value areas capture places that might require more restoration but are important for buffering high-value areas and maintaining connectivity.
TDF and its partners assessed how carbon, water, and resilience priorities targeted in Tennessee could
contribute to the SECAS 10 percent goal by comparing the spatial distribution of FAP priorities with the SECAS Blueprint. The SECAS Blueprint totals 11.6 million acres of high and medium conservation value areas in Tennessee. A total of 9.1 million acres (79 percent) of the SECAS Blueprint are captured in the FAP priorities, and 6.1 million acres (53 percent of the SECAS Blueprint total) are classified as being of high conservation value. This degree of overlap between FAP and SECAS priorities indicates that successful implementation of the FAP should result in concerted progress toward the SECAS 10 percent goal.
Following initial identification of programmatic priority areas eligible for the Forest Legacy Program and the Forest Stewardship Program, the TDF assessed the regional conservation value of these two programs using the Southeast Blueprint. In the Forest Legacy
Figure 56. The Southeastern Conservation Adaptation Strategy’s Southeast Blueprint.
Complementary Planning Initiatives & Stakeholder Coordination

a a102
Complementary Planning Initiatives & Stakeholder CoordinationProgram, 63 percent of the prioritized 3.2 million acres occurs in high conservation value areas of the Blueprint (Table 10). Tennessee’s Forest Stewardship Program is less aligned with the Southeast Blueprint compared to the Forest Legacy Program, but 60 percent of prioritized areas for Stewardship funding are considered to be of medium or high conservation value by SECAS. The reason for fairly high alignment between Tennessee’s
assistance programs and the SECAS Southeast Blueprint is due to the use of an in-common, underlying dataset. Both SECAS and the Tennessee 2020 FAP used data products from The Nature Conservancy’s Resilient and Connected Landscapes project. Thus, both SECAS and Tennessee are promoting conservation of landscapes with high biological and geomorphic diversity and resiliency.
Southeast Blueprint Value Forest Legacy Program Forest Stewardship Program
Acres percent Acres percent
Not a priority 158,000 5 2,347,000 40
Medium Conservation Value 1,054,000 32 1,402,000 24
High Conservation Value 2,052,000 63 2,082,000 36
Table 10. Alignment of the Tennessee 2020 FAP programmatic priorities with the Southeast Conservation Adaptation Strategy’s Southeast Blueprint.

a a103
Complementary Planning Initiatives & Stakeholder Coordination
CommunityWildfireProtectionPlans (CWPP) As discussed in the Strengthening Wildfire Resilient Communities Objective section narrative, Tennessee’s FAP prioritizes existing CWPPs and outlines a strategy to bolster and increase CWPPs statewide.
Tennessee Department of Economic and Community Development — Distressed CountiesIn 2017, the forest industry accounted for 3.5 percent of Tennessee’s economy, generating $24.3 billion in economic output, contributing $650.1 million in state and local tax revenue, employing 42,300 Tennesseans and indirectly providing an additional 55,700 jobs, and providing more than $3 billion in labor income (Menard et al. 2019). Forest management and industry activities tend to take place in rural counties where job opportunities may be limited, and the presence of a mill or paper manufacturing facility can fuel local economic growth. The importance of the forest industry in providing jobs and generating tax revenue is felt acutely in counties that rely on forestry.
The alignment of Tennessee’s FAP programmatic priorities with high-value Blueprint areas exemplifies a complementary landscape-scale approach to conservation that links TDF’s local actions with conservation outcomes on a broader geographic scale. Through constant and frequent engagement with SECAS, other federal and state agency stakeholders were engaged such as the US Forest Service and the US Fish and Wildlife Service.
a a104
The Appalachian Regional Commission uses an index-based county economic classification system to identify and monitor economic status with particular focus on Appalachian counties. A national index is derived using three economic indicators: three-year average unemployment rate, per capita market income, and poverty rate. These indicators are summed for each county and then averaged to create a county-based composite index. Each county is ranked based on composite index value with higher values indicating higher degrees of economic distress. The Appalachian Regional Commission classifies each county into one of five economic designations based on how the county’s composite index value ranks on the national list. The Appalachian Regional Commission economic status designation by national index value rank is as follows:
• Distressed Counties: Ranked in the worst 10 percent of U.S. counties.
• At-Risk Counties: Ranked in the worst 10.1 percent to 25 percent of U.S. counties.
• Transitional Counties: Ranked from worst 25 percent to best 25 percent of U.S. counties; designates counties that are transition between strong and weak economies.
• Competitive Counties: Ranked in the best 25 percent to 10+ percent of U.S. counties.
• Attainment Counties: Ranked in the best 10 percent of U.S. counties; the economically strongest counties.
Economically distressed counties in Tennessee are rural. While economic challenges exist in all four TDF districts, West Tennessee, Cumberland, and East Tennessee districts have a higher rate of Distressed and At-Risk counties than the Highland Rim. Fifteen counties were classified as Distressed by the Appalachian Regional Commission in 2020: Bledsoe, Clay, Cocke, Fentress, Grundy, Hancock, Hardeman, Jackson, Lake, Lauderdale, McNairy, Morgan, Perry, Scott, and Wayne. An additional 24 counties were classified as At-Risk. The Governor of Tennessee has set two long-term objectives related to economic distress: (1) to reduce the number of economically distressed counties to 10 by 2025, and (2) to achieve annual improvement in county economic status ranking in 70 percent of rural counties.
Many counties dependent on forest industry for jobs, wages, tax revenue, and other economic activities are listed as economically distressed or at-risk. Ten counties depend on forestry for 7-14 percent of economic activity (distressed counties in italic bold; at-risk counties in italic): Clay, Cocke, Houston, Humphreys, Loudon, Macon, McMinn, Rhea, Stewart, and Union counties. Four counties depend on forestry for 14-21 percent of economic activity: Claiborne, Lauderdale, Marion, and Wayne counties. Forestry sustains more than 21 percent of Hardin and Grainger counties’ economic activity, both of which are listed as at-risk. The direct impact of forest industry (i.e., excluding indirect and induced impacts) is highest in Van Buren County followed by Fentress, Grundy, Lewis, and Wayne counties, and all of these counties except Van Buren are distressed or at-risk.
Statewide and programmatic priorities established in the 2020 FAP were assessed to determine how they may impact rural and distressed counties. Areas that address the FAP’s priority issues of carbon storage, surface drinking water, and resilient and connected landscapes to a high degree are spatially identified as 16.5 million acres of Tennessee’s total land base. Approximately 3.3 million acres (20 percent) of FAP priorities are in Distressed counties, and a further 4.1 million acres (25 percent) are in At-Risk counties. Of the 35 counties identified for the Forest Stewardship Program, where forested tracts of at least 20 acres are eligible for funding, 4 and 13 are Distressed and At-Risk counties, respectively. Ten of the 15 counties designated as Distressed in 2020 have at least 25,000 acres eligible for Forest Legacy Program funding.
Complementary Planning Initiatives & Stakeholder Coordination

a a105
Appendix A. Overview of Data Products
Forest Inventory and Analysis
The Forest Inventory and Analysis (FIA) Program, administered by the USDA Forest Service in cooperation with states, private forestry, and National Forest systems, is a continuous forest census that assesses the condition of the nation’s forest resources. Data collected through the FIA Program enables evaluation of current forest management practices and policies on public and private lands. Through data collection on permanently established field plots, FIA reports status and trends in forest area and location; in the species, size, and health of trees; in total tree growth, mortality, and removals by harvest; in wood production and utilization rates of various products; and in forestland ownership and land-use change. In addition to these intensive plot measurements, the FIA Program recently expanded its scope of data collection to include soils, midstory, and understory vegetation; tree crown conditions; coarse woody debris; lichen community composition on a subsample of FIA field plots; and urban tree characteristics in select cities.
In Tennessee, the FIA Program is administered by a partnership between USDA Forest Service and TDF. The condition assessment of the forest resource in TDF’s 2020 FAP revision is based on FIA forest data. Specifically, TDF and its partners assessed changes in the distribution and abundance of forests, ownership, forest composition, stand-size class distribution, live tree volume, stand origin, average annual net growth, mortality, and removals by harvest. While analysts did consider forest inventory data from other sources and methodologies, the resource assessment is empirically displayed and summarized using FIA to be consistent with past TDF resource assessments dating back to 1989. The 2020 assessment used data stored in USDA Forest Service’s Forest Inventory EVALIDator.
National Woodland Owner Survey The National Woodland Owner Survey (NWOS) is conducted by the FIA Program at least once each decade to increase understanding of attitudes, behaviors, and demographics of three distinct private land ownership types: family (including individuals, trusts, and estates), corporate (e.g., timber investment management
organizations [TIMOs] and real estate investment trusts [REITs]), and other private (e.g., non-governmental organizations). The NWOS provides national, regional, and state-level information to policy makers, resource managers, educators, service providers, and others with the intention of facilitating decisions that integrate the social context of forest and woodland ownerships.
The NWOS asks landowners basic demographic questions: how owners came to possess their lands, reasons for retaining ownership, past practices and future intentions for their lands, and additional questions to gauge deeper characteristics, attitudes, and behaviors. Because NWOS is conducted at least once each decade, the FIA program and information end-users can track changes in demographics, attitudes, and behaviors. There are many benefits to monitoring trends in forest ownership characteristics including the following: understanding landowner concerns and forest use, gauging the relative importance of amenity and financial objectives, assessing effectiveness of programs and certifications, modifying communication and outreach to better suit landowner needs, and planning for emerging threats to retention and health of forests and woodlands. The NWOS uses FIA definitions of forest and woodland. Forest is land at least 120 feet wide and one acre in size with at least 10 percent cover (or equivalent stocking) by live trees including land that formerly had such tree cover and that will be naturally or artificially regenerated (Oswalt et al. 2014, p. 31). Woodland is land at least 120 feet wide and one acre in size with sparse trees capable of achieving 16.4 feet in height with a tree canopy of 5 to 10 percent combined with shrubs at least 6 feet in height to achieve an overall cover of greater than 10 percent of woody vegetation (Oswalt et al. 2014, p. 35)
For the 2011-2013 survey period, the NWOS sample design was based on an area-based sampling frame with the sample selection probabilities proportional to size. This means that the larger the size of forest and woodland holding, the higher the probability of being included in the NWOS sample. To ensure that samples were taken evenly across the state, Tennessee was divided into 6,000-acre hexagons. One sample point was randomly placed within each 6,000-acre hexagon. Each sample point was determined to be either forest/woodland or non-forest/non-woodland using remote sensing and field observation data. Sample points that fell in agricultural or urban land use were excluded from NWOS. For the forest and woodland sample points, publicly available property tax information was used
Appendix

a a106
to determine ownership, and if the owner was private, then the property was included in the NWOS sample. If more than one sample point occurred on a single property in Tennessee, then only one survey was sent to the property owner. For property owners with more than one property, the owners were asked to give information only for the property record coinciding with the NWOS sample point.
The NWOS was implemented following best practices outlined by Dillman et al. (2014) for administering and evaluating surveys. Owners at NWOS sample points were sent a pre-survey postcard identifying the survey’s purpose and timeline. Owners were mailed a copy of the NWOS questionnaire, business reply return envelope, and a cover letter stating the survey’s purpose and how the data would be used. If an owner did not respond within 25 days, a second copy of the NWOS questionnaire was mailed. Telephone follow-up interviews using a subset of survey questions were used to increase response rates and measure potential nonresponse bias (i.e., that answers to survey questions given by respondents and non-respondents differ with statistical significance, and that having high incidence of non-respondents biases survey outcomes). Post-survey testing for nonresponse bias did not detect any systematic biases.
For the entire U.S., a total of 10,092 family forest or woodland ownerships responded to NWOS between 2011 and 2013. Of these ownerships, 8,567 respondents held at least 10 acres of forest and woodland. The overall cooperation rate was 52 percent for the U.S. and ranged from 37 percent in Hawaii to 64 percent in Michigan. In general, the Northeast, Midwest, and Pacific Northwest exhibited relatively higher cooperation rates than the Southeast, South Central, and Intermountain West regions.
For holdings of at least 10 acres of forest or woodland in Tennessee, a total of 621 ownerships were selected for NWOS inclusion and 280 ownerships responded, yielding a 48.3 percent cooperation rate. The 2011-2013 NWOS estimated that 152,000 (standard error [SE] = 13,000) family and individual owners held 10,601,000 (SE = 246,000) acres on properties with at least 10 acres of forest or woodland. The acreage of forestland held by various ownership categories was estimated as follows: 9.4 million acres in family/individual, 2.2 million acres in corporate, less than 100,000 acres in other private (e.g., non-governmental organization), 1.4 million acres in federal, 0.8 million acres in state, and less than 100,000 acres in local for a total of 13.9 million acres of forest in Tennessee during the 2011-2013 survey period.
National Land Cover DatabaseThe National Land Cover Database (NLCD) consists of land cover and land cover change data-products that are produced nationally for complete, current, accurate, and consistent information suitable to a range of assessments and analyses critical to natural resource managers and policymakers. Data products are designed for application in a range of scientific and social disciplines including biology, climate, education, environmental planning, forestry, hydrology, land management, telecommunications, and visualizations.
The NLCD is generated by the Multi-Resolution Land Characteristics Consortium, a partnership of federal agencies, via remote sensing and automated-algorithm classification technologies (Yang, et al. 2018, Jin et al. 2019). Data are prepared using Landsat imagery selection, cloud detection, cloud filling, and 30 national-scale ancillary datasets. Following preparation, land cover change detection algorithms are applied, and land cover is established after a data training period and multiple classification runs (Jin et al. 2019). Data products, including land cover (Table 11), land cover change, forest canopy density, shrubland classifications, and urban imperviousness, are spatially explicit, conveyed on 30-by-30-meter grids. Modern NLCD products are released at five-year intervals (2001, 2006, 2011, and 2016) and additional satellite imagery has been analyzed recently to produce past land cover information on a two-to-three-year basis.
NLCD data products were used to visualize and contextualize trends in forestland area and location, land cover change and disturbance history, and urbanization and imperviousness. The NLCD products were used with FIA, projections of population and development growth, and biological datasets to form a comprehensive understanding of Tennessee’s forest resource and the resources that forests impact (e.g., water and wildlife). As the best available source of spatially explicit land cover, NLCD formed the foundational layer(s) for threat assessments and establishing programmatic priorities. Furthermore, continued analysis of NLCD products coupled with parcel information is critical to establishing statewide fragmentation and parcelization indices and to improve understanding of land ownership volatility; forest resiliency; spread of insects, diseases, and invasive species; and vulnerabilities to forested landscapes and wildlife corridors.
Appendix

a a107
Land Cover Class Acres Percent
Open Water 609,100 2
Developed, Open Space 1,573,700 6
Developed, Low Intensity 666,500 2
Developed, Medium Intensity 265,600 1
Developed, High Intensity 105,200 < 1
Barren Land 42,300 < 1
Deciduous Forest 10,301,800 38
Evergreen Forest 1,035,600 4
Mixed Forest 2,546,700 9
Shrub/Scrub 377,300 1
Herbaceous 401,600 1
Hay/Pasture 5,428,800 20
Cultivated Crops 2,745,100 10
Woody Wetlands 822,900 3
Emergent Herbaceous Wetlands 51,500 < 1
Total Forested Area 14,707,000 55
Total Area 26,973,800 100
Table 11. Area (acres, percent) of National Land Cover Database 2016 cover classifications in Tennessee. Forested land classes are in bold. Acreage is rounded to the nearest 100 acres.
Appendix

a a108
Protected Areas Database-USProtected Areas Database-US (PAD-US) is the national inventory of U.S. terrestrial and marine protected areas held in public trust, including all federal and most state lands, and many protected areas of regional and local scale. Each protected area has a set of attributes: size, ownership category, ownership name, manager name, date acquired, fee simple or easement, public access, conservation status, and others. Conservation status, or GAP status code, indicates management objective and permitted use(s):
• GAP Status Code 1: biodiversity objective with a mandated management plan; permanently protected from conversion of natural land cover; natural disturbances (e.g., wildfire) may proceed without interference or are mimicked as a means of preserving the protected area’s ecology and disturbance history.
• GAP Status Code 2: biodiversity objective with a mandated management plan; permanently protected from conversion of natural land cover; maintained in a primarily natural state, but may receive uses or management practices that degrade the quality of natural communities; natural disturbances (e.g., wildfire) may be suppressed.
• GAP Status Code 3: often referred to as “multi-use” areas; permanently protected from conversion of natural land cover, but subject to extractive uses (e.g., logging, mining, off-highway vehicle recreation); permissible activities will vary across protected areas in this GAP status category, particularly when federally-listed endangered or threatened species are present.
• GAP Status Code 4: no known mandate or deed restriction for management objective, land cover conversion, or permissible use.
The U.S. Geological Survey maintains PAD-US as part of the Gap Analysis Project (GAP). The goals of USGS GAP are twofold: 1) to provide landscape assessments of the conservation status of native vertebrate species and natural land cover types—for instance, overlaying maps of dominant ecological systems, species ranges, and/or predicted habitat distributions to identify conservation “gaps” in stewardship areas or plans; and 2) to facilitate the application of this information to land management activities. Regular updates to the database integrate
further attribute and spatial information that become available for existing protected areas and add protected areas, which are newly acquired in fee simple or easement. Easements on public lands are also included in the National Conservation Easement Database.
The PAD-US is most often used for regional or national analyses wherein data from multiple agencies needs inclusion. PAD-US was used to delineate protected forest in government and non-government ownership. The phrase “protected forest” begs the question: Protected from what? In the case of PAD-US, “protected” simply means that the land is held in public trust or for conservation and community benefits; “protected” does not specify the removal of land from active management practices, extractive uses, or multi-use objectives unless specified as belonging to a specific class of protected lands (e.g., Gap Status 1 or 2) or in conflict with Endangered or Threatened species management plans.
Appendix

a a109
Land Manager Area Area in GAP Status 3 & 4
Acres Percent Acres Percent
Federal Government 1,363,400 40 809,100 59
USDA Forest Service 1,060,000 31 719,800 68
National Park Service 91,000 3 83,200 91
Dept. of Defense 37,100 1 5,700 15
State Government 900,600 27 355,300 39
Division of Forestry 168,200 5 168,200 100
Tennessee Wildlife Resource Agency 487,700 14 3,800 < 1
Dept. of Environment & Conservation 198,700 6 198,400 ~ 100
Local Government 27,600 < 1 23,000 83
Non-Governmental Organization 10,900 < 1 2,600 24
Private & Other 1,071,800 32 655,900 61
TOTAL 3,374,400 100 1,845,900 55
Table 12. Total area (acres, percent) in Protected Areas Database-US (PAD-US) by landowner type and GAP Status. Acreage is rounded to the nearest 100 acres.
Appendix

a a110
Land Manager Area Area in GAP Status 3 & 4
Acres Percent Acres Percent
Federal Government 1,254,400 44 775,600 60
USDA Forest Service 1,025,100 36 694,200 68
National Park Service 85,300 3 77,700 91
Dept. of Defense 28,300 1 3,500 13
State Government 793,400 28 322,800 41
Division of Forestry 157,200 6 157,200 100
Tennessee Wildlife Resource Agency 415,700 15 2,600 < 1
Dept. of Environment & Conservation
177,100 6 176,800 ~ 100
Local Government 18,300 < 1 13,900 76
Non-Governmental Organization 10,500 < 1 2,400 23
Private & Other 755,900 27 398,800 53
TOTAL 2,832,400 100 1,513,600 53
Table 13. Forested area (acres, percent) in Protected Areas Database-US (PAD-US) by landowner type and GAP Status. Acreage is rounded to the nearest 100 acres.
Appendix

a a111
National Conservation Easement DatabaseThe National Conservation Easement Database (NCED) is the national database of tabular and spatial conservation easement information compiled from land trusts and public agencies. It is an initiative of the U.S. Endowment for Forestry and Communities, and the current NCED collaborative includes Ducks Unlimited, which records easements on private lands, and The Trust for Public Land, which records easements on public lands. NCED analysts collaborate with USGS GAP to populate PAD-US records of protected areas with easements. In some cases, land trusts request that spatial information be withheld from publicly available data. The current NCED contains over 130,000 easements, totaling 24.7 million acres. This represents an estimated 60 percent of all U.S. easements, and NCED is continuously updated as more agencies, land trusts, and other organizations choose to share data.
The NCED effort seeks to heighten visibility of conservation gains, improve strategic planning, identify opportunities for collaboration, and advance public accountability. A conservation easement is one of many tools that maintains a land use or cover (e.g., working farms, ranches, riparian buffers, and forests) while keeping the land in private ownership and on tax rolls (although tax rates may be reduced). Easements are generally a more cost-effective tool for conservation-minded entities compared to land acquisition. Because conservation easements are voluntary agreements between landowner and easement holder, the specifications, restrictions, and benefits of easements are highly variable. Benefits to conservation and communities often include constraints on subdivision and development, protection of drinking water and waterways by maintaining wetlands and riparian forest, provision of habitat for game and non-game species, sustaining scenic vistas, and sequestration of carbon, among other services.
NCED was used to summarize easements on public and private lands in terms of ownership, location, funding source, establishment date, potential land management objectives, and known restrictions. In addition, the analysis assessed the effect, if any, that conservation easements and public lands have on timber harvests in response to growing concerns from mill owners and operators regarding wood availability. While conservation easements can be time-limited
agreements, only permanent conservation easements were considered in our data analysis.Landowners and easement holders pursue easements for a diversity of reasons, and this is reflected in the types of properties recorded for Tennessee in NCED. The purchase of easements is enabled by a number of programs including Wetlands Reserve Program, Grassland Reserve Program, Healthy Forests Reserve Program, Forest Legacy Program, Department of Defense’s Readiness and Environmental Protection Integration, and The Nature Conservancy’s Working Woodlands. Properties with easements include working farms and forests, national and state historic sites, recreation areas such as the Fiery Gizzard hiking trail, and the Natchez Trace Parkway. One of the oldest and largest easement records includes the Tennessee National Wildlife Refuge (49,523 acres).
As of December 2019, NCED contains records for over 234,000 acres across 19 easement holders in Tennessee. Of the total acreage, 58 percent (136,846 acres) is forested (Table 14). Land ownership of properties with easements is overwhelmingly private (86 percent), while most easements are held and enforced by non-governmental organizations (122,309 acres, 52 percent) and federal agencies (100,849 acres, 43 percent; Table 14). Easements held by non-governmental organizations tend to be forested (88,337 acres, 72 percent); easements held by federal agencies largely support working farms (30,703 acres in agricultural land use) and protect waterways and riparian zones (55,088 acres). Easements held by public and non-profit entities are estimated at 95 percent or greater completeness rates, making Tennessee one of the most complete state records for easements in the U.S.
Appendix

a a112
Land Cover Acres Percent Land Cover Acres Percent
Deciduous Forest 85,200 36.4 Barren 300 < 1.0
Evergreen Forest 6,100 2.6 Open Water 27,400 11.7
Mixed Forest 13,200 5.8 Hay/Pasture 20,400 8.8
Forested Wetlands 32,400 13.8 Cultivated
Crops 37,000 15.8
Herbaceous Wetlands 3,700 1.6 Developed,
Open Space 3,500 1.5
Shrub-Scrub 1,900 < 1.0Developed, Low to High
Intensity800 < 1.0
Herbaceous 1,300 < 1.0
TOTAL 234,000 100
Table 14. Area (rounded to nearest 100 acres) of land cover types under conservation easement in Tennessee. Land cover types are derived from National Land Cover Database 2016 (Yang et al. 2018).1 Called “woody wetlands” in National Land Cover Database
Appendix

a a113
Table 15. Total land area and forestland area (rounded to the nearest 100 acres) of conservation easements by easement holder and ownership in Tennessee recorded in the National Conservation Easement Database.
Ownership Type Easement Holder Land Ownership
Percent Forested
Forest Land Acres
Total Land Acres
Percent Forested
Forest Land Acres
Total Land Acres
Federal 39 39,600 100,800 85 < 100 < 100
State 93 7,900 8,400 94 3,100 3,300
Joint 41 1,100 2,600 100 < 100 < 100
Local 13 < 100 < 100 49 3,000 6,200
Non-Governmental Organization
72 88,300 122,300 94 2,000 2,200
Private 0 0 0 57 114,500 201,200
Unknown 0 0 0 90 < 100 < 100
TOTAL 58 136,800 234,200 58 136,800 234,200
The NCED provides some indication of land management objective, and each easement is given a Gap Status Code (see description in Protected Areas Database-US). Across all easements, approximately 8,500 acres are in GAP Status 2; 7,200 acres are in GAP
Status 3; and 218,600 acres are in GAP Status 4. On private lands, approximately 8,500 acres are in GAP Status 2; 4,800 acres are in GAP Status 3; and 188,000 acres are in GAP Status 4. None of the easements are in GAP Status 1.
Appendix

a a114
Appendix B. Overview of Analytical Models
National Insect and Disease Risk MapTree mortality occurs in all forests at usually low and predictable rates that are offset by growth of the remaining live trees. The impact of insects and diseases is generally widely scattered rather than concentrated and can create snag used by wildlife (e.g., woodpeckers and nuthatches) and small-scale canopy openings, thereby allowing light to penetrate to the forest floor and encourage understory growth. In some cases, insects and diseases can result in intensive tree mortality that is greater than annual growth rates and is outside the considered normal ecological forest condition. These cases of intense pest-related tree mortality are generally encountered in forests that are already stressed (e.g., temperature extremes, drought, prolonged flooding) or damaged (e.g., severe scarring from wildfire), or when an insect or disease encounters a tree species that has no natural defense (e.g., American chestnut trees and chestnut blight).
The National Insect and Disease Risk Map (NIDRM) is a nationwide strategic assessment of the potential
hazard for tree mortality due to major forest insects and diseases. Hazard is defined as “the expectation that, without remediation, at least 25 percent of standing live basal area greater than one inch in diameter will die over a 15-year time frame (2013-2027) due to insects and diseases” (Krist et al. 2014). The NIDRM summarizes landscape-level patterns of potential insect and disease activity to promote science-based, transparent methods for allocating pest-management resources. At its core, the philosophy of NIDRM is to prioritize investment of pest management in areas where both the hazard is significant and effective treatment can be efficiently implemented.
The USDA Forest Service, Forest Health Protection-Forest Health Technology Enterprise Team completed a national assessment of pest-related hazards for the period 2013-2027 (Krist et al. 2014). This assessment includes 186 individual insect and disease models integrated with GIS to produce maps of pest-related hazards at various spatial and temporal scales. The process considers locations of host species for each insect and disease, host susceptibility, and host vulnerability in the mortality risk assessment. The NIDRM products have a spatial resolution of approximately 14 acres. For additional information on methodology, refer to Krist et al. 2010 and Krist et al. 2007.
Insect & Disease Risk West TN Highland Rim Cumberland East TN
At-Risk 400 17,600 3,500 29,300
Reduced Risk1 200 6,800 2,600 300
Not at Risk 6,357,100 7,606,800 6,448,300 6,199,000
Total Area (ac) 6,599,500 7,668,600 6,462,500 6,241,000
Percent At-Risk of Mortality < 1 percent < 1 percent < 1 percent < 1 percent
Table 16. Area (rounded to the nearest 100 acres) at risk of losing at least 25 percent of standing live basal area greater than one inch in diameter in the period 2013-2027 if remediation action is not taken (National Insect and Disease Risk Map, 2018 Update).
1 Risk reduced due to disturbance events (e.g., fire-related mortality) and forest harvesting.
Appendix

a a115
At a national scale, root diseases, bark beetles, and oak decline were the leading contributors to risk of tree mortality in the lower 48 states. Emerald ash borer was the most significant exotic forest pest. Climate change is expected to exacerbate outbreaks of many forest pests as trees in many areas of the U.S. experience increased drought stress. The 2013-2027 NIDRM estimates 71.7 million acres are at risk of pest-related hazard in the conterminous U.S., and more than 14 million acres (3.5 percent of forested area) is at risk in Forest Service Region 8—Southern Region. In Tennessee, only 2 percent of the forested area is at risk of insect and disease hazard (Table 16). In 2018, USDA Forest Service, Forest Health Protection released an update that accounted for reduced risk due to disturbance events (e.g., fire and pest-induced mortality) and treatments, including forest harvesting operations. The 2018 update reduced the area at risk in the conterminous U.S. from 71.7 million acres to 53.1 million acres. Total forested acreage at risk in Tennessee is approximately 51,000 acres (< 1 percent of the forested area).
SLEUTH Urbanization ModelsSLEUTH, named for its input models (Slope, Land Use, Excluded [i.e., protected lands and open water], Urban, Transportation, and Hillshade; Jantz et al. 2009, NCGIA 2011, Belyea and Terando 2017), captures the potential extent of future urbanization. SLEUTH models the rate and pattern of urbanization using four growth rules: spontaneous growth, new spreading centers, edge growth, and road-influenced growth. Due to the transportation input model and road-influenced growth rule, SLEUTH urbanization probability maps closely align with road networks. SLEUTH classifies land into 16 urbanization probability categories on a 60-by-60-meter grid. SLEUTH model outputs are available at 10-year time steps from 2020 through 2100.
SLEUTH was used to delineate areas at high risk of becoming urban by year 2030. Nearly 2.2 million acres in Tennessee were currently urbanized in 2010, and the urban area could increase by 1 million acres from the 2010 baseline by 2030 (Table 17).
SLEUTH Class West TN Highland Rim Cumberland East TN
0.1-20 percent 262,000 326,700 301,000 266,300
21-40 percent 30,600 44,000 39,900 43,900
41-60 percent 18,400 26,300 26,700 28,400
61-80 percent 18,400 27,800 24,000 31,400
81-100 percent 199,400 303,600 229,300 357,600
Currently Urban 410,700 561,100 478,400 749,600
Table 17. Probability of urbanization of current land area (rounded to the nearest 100 acres) at 2030 compared to baseline estimate of urbanized area in 2010. Tennessee encompasses approximately 26,971,400 acres.
Appendix
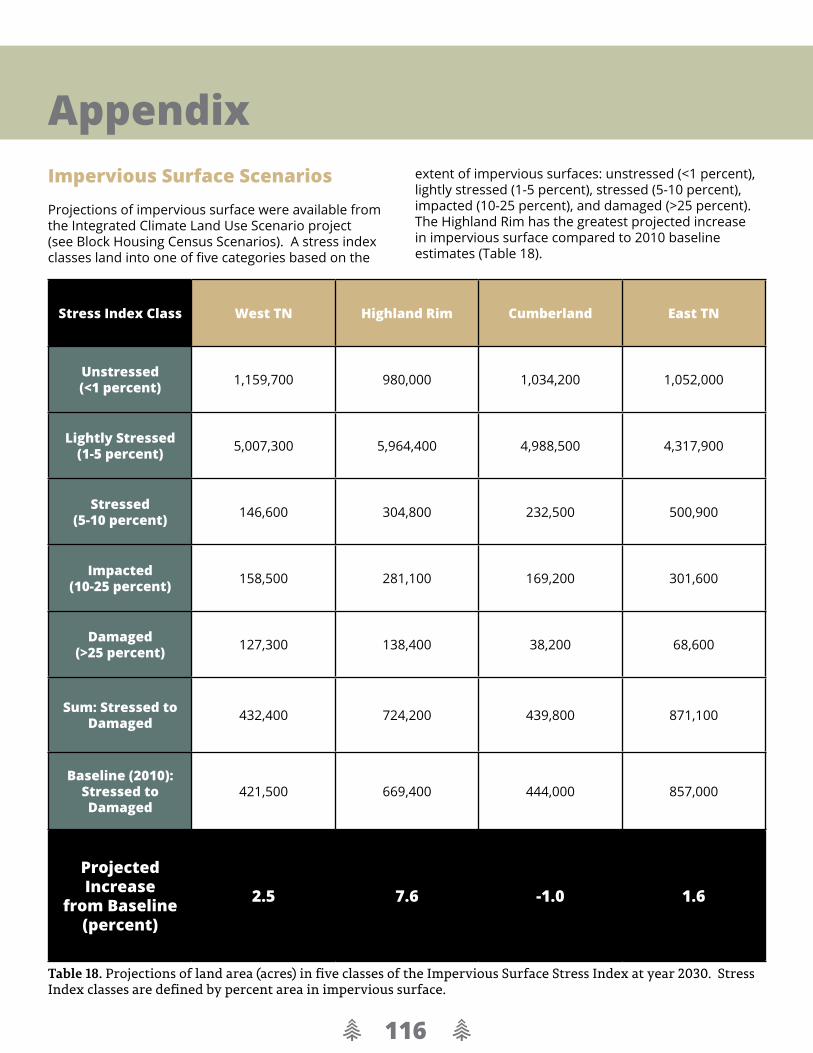
a a116
Impervious Surface ScenariosProjections of impervious surface were available from the Integrated Climate Land Use Scenario project (see Block Housing Census Scenarios). A stress index classes land into one of five categories based on the
extent of impervious surfaces: unstressed (<1 percent), lightly stressed (1-5 percent), stressed (5-10 percent), impacted (10-25 percent), and damaged (>25 percent). The Highland Rim has the greatest projected increase in impervious surface compared to 2010 baseline estimates (Table 18).
Table 18. Projections of land area (acres) in five classes of the Impervious Surface Stress Index at year 2030. Stress Index classes are defined by percent area in impervious surface.
Stress Index Class West TN Highland Rim Cumberland East TN
Unstressed(<1 percent) 1,159,700 980,000 1,034,200 1,052,000
Lightly Stressed (1-5 percent) 5,007,300 5,964,400 4,988,500 4,317,900
Stressed(5-10 percent) 146,600 304,800 232,500 500,900
Impacted(10-25 percent) 158,500 281,100 169,200 301,600
Damaged(>25 percent) 127,300 138,400 38,200 68,600
Sum: Stressed to Damaged 432,400 724,200 439,800 871,100
Baseline (2010): Stressed to Damaged
421,500 669,400 444,000 857,000
Projected Increase
from Baseline (percent)
2.5 7.6 -1.0 1.6
Appendix

a a117
SouthernWildfireRiskAssessmentPortalThe Southern Group of State Foresters developed the Southern Wildfire Risk Assessment Portal (SouthWRAP) in 2010 to provide fire protection planning, identify wildland-urban interface areas and communities at risk, and support mitigation and prevention efforts. The wildland-urban interface (WUI) describes the zone where the built environment intermixes with fuels (e.g., trees, shrubs, leaf litter) in the natural environment. Several data layers are available through SouthWRAP including wildfire ignition density, characteristic fire intensity scale, community protection zones, WUI, and WUI risk index. The WUI risk index is a rating of the potential impact of a wildfire on people and their property. The primary driver of the WUI risk index is the WUI, which reflects housing density (housing units/acres). A response function modeling approach, which assigns a net change in value to a resource or asset based on its susceptibility to a fire at various intensity levels. For example, an
area with very high housing density where typical fire behavior includes high flame lengths is at higher risk on the WUI risk index than an area with lower housing density or less severe fire characteristics. SouthWRAP used flame length as its measure of fire intensity, but other measures of fire intensity should be considered in future analyses of WUI risk. The SouthWRAP layers are available on a 30-by-30-meter grid and are intended for regional and county-level planning purposes.
The Cumberland District has the highest density of wildfire ignitions. Relative to other southern states, Tennessee has low characteristic fire intensity and low risk of wildfire damage to the WUI (Table 19). However, localized pockets of high WUI risk is evident in eastern Tennessee’s mountainous terrain where firefighting activities can be difficult and more costly than in less topographically challenging regions. The WUI risk index was used to demonstrate the importance of resource allocation to administrative regions with the greatest number of fires, acres burned, and risk to lives and property.
WUI Risk Index Class West TN Highland Rim Cumberland East TN
0 – Non-forest 4,374,600 3,418,800 3,316,500 2,865,400
1 – Lowest Risk 449,500 553,200 296,400 206,400
2 695,200 1,653,500 1,183,400 952,800
3 261,600 336,000 225,900 251,900
4 331,300 704,800 569,200 597,500
5 – Moderate Risk 458,700 938,500 731,500 1,171,000
6 17,100 34,800 64,800 88,800
7 – High Risk 10,300 24,000 58,800 84,700
8 2,300 6,500 16,900 23,800
9 – Highest Risk < 100 < 100 100 < 100
Sum: Moderate to Highest Risk 471,400 969,100 807,400 1,279,500
Total Area (ac) 6,599,500 7,668,600 6,462,500 6,241,000
Percent of Area in Moderate to
Highest Risk7 percent 13 percent 12 percent 21 percent
Table 19. Area (rounded to the nearest 100 acres) in Wildland-Urban Interface (WUI) Risk Index classes in each of Tennessee Division of Forestry’s administrative areas.
Appendix

a a118
Appendix C. Forest Stewardship ProgramTDF has professional foresters stationed across the state who provide technical assistance. They have been specifically trained to collect information on resources and work with landowners to develop forest management plans. The primary program for providing technical assistance is the Forest Stewardship Program.
The primary goal of the Forest Stewardship Program is to encourage the long-term stewardship of important state and private forest landscapes by assisting landowners to more actively manage their forest and forest-related resources. The program seeks to advance long-term productivity of multiple forest resources and produce healthy, resilient forest with special attention given to landowners with forest identified in state FAPs. The program provides landowners with professional planning and technical assistance and enhances their access to other USDA conservation programs, forest certification programs, and forest product and ecosystem service markets. A successful Forest Stewardship Program will create a stream of public benefits such as job creation, air and water quality protection, and wildlife habitat while addressing key issues identified in the applicable state FAP.
The Forest Stewardship Program is authorized by the Cooperative Forestry Assistance Act of 1978, as amended, 16 USC. 2103A.
Forest Stewardship Management Plans: Principles and Elements The following 16 natural resource elements are addressed in all Forest Stewardship Management Plans when they are present and applicable to the landowner and the management of the property:
1. Soil and water, including the description of best management practices (BMPs) to promote soil stability and water quality across diverse conditions and cover types that may occur on the property
2. Biological diversity, including a discussion of how landowner objectives can be achieved in concert with wildlife habitat management, promotion of aquatic and riparian areas, conservation of rare
species and communities, and protection of special geologic features
3. Rangeland, which provides a diverse and significant production of economic benefits (e.g., livestock production) and ecosystem goods and services (e.g., maintenance of native grasslands)
4. Agroforestry and silvopasture, which intentionally combine agriculture, often in the form of livestock production, with forestry to create integrated and sustainable land use systems; infrequently harvested trees may be managed for high-value saw logs while providing necessary shade and shelter for annual livestock and forage production
5. Aesthetic quality and desired timber species, which encompass conversion of agricultural fields to hardwood or pine forest, creating wooded buffer zones to protect riparian areas, and enhancing wildlife suitability
6. Recreation, such as birding, camping, fishing, hiking, and hunting, to be determined by the landowner
7. Woodandfiberproduction in pursuit of the Forest Stewardship Program objective of assisting landowners to sustainably manage productive, vigorous, and healthy forests
8. Fish and wildlife, which may be impacted by management practices if BMPs are not followed; habitat considerations for many wildlife species are given in state wildlife action plans
9. Threatened and endangered species, including federal- and state-protected species
10. Forest health and invasive species, which will be addressed using silviculture and prescribed fire to reduce risk from wildfire, pests, and some invasive species while promoting long-term forest health and vigor in fire-adapted ecosystems
11. Conservation-based estate and legacy planning that will enable future landowners to maintain working forests by addressing issues related to parcelization, fragmentation, and long-term silviculture recommendations
12. Archeological, cultural, and historic sites, referring to landscapes, structures, archeological artifacts, and vegetation that represent a culture or society of historic value
13. Wetlands, such as swamps, marshes, bogs, and fens, which are highly diverse and productive ecosystems that protect water quality and provide wildlife habitat
Appendix

a a119
14. Fire, through the utilization of prescribed fire to reduce hazardous fuels and competing midstory vegetation, and to provide habitat for woodland and early successional species
15. Carbon sequestration and climate resilience, since healthy, resilient forests store vast amounts of belowground carbon, sequester atmospheric carbon, and are well-positioned to withstand increased stress and shifting disturbance patterns associated with climate change
16. Forests of Recognized Importance, recognized for their unique combination of social, cultural, biological, and environmental values
Creating a Stewardship Management Plan TDF foresters conduct on-the-ground assessments to determine the condition of timber resources, forest health, cultural resources, wildlife habitat, and water quality. Foresters then prepare a comprehensive forest management plan based on landowner objectives and, if applicable, a Landscape Management Plan. Foresters also follow up with landowners to encourage the implementation of the plan.
Figure 57. Tennessee counties where USFS Stewardship activities will be reimbursable.
Appendix

a a120
Eligibility Private forest landowners with at least 10 acres of forestland in an eligible county may participate in the Forest Stewardship Program according to Stewardship principles.
Tennessee’s Forest Stewardship Program priorities focus on forested tracts in counties where the program has a proven track record, willing landowner participants, and value-added components such as forests that are highly important to protecting surface drinking water and resilient to climate change. Thus, priority Stewardship counties were determined using spatially explicit data analysis (i.e., geographic information systems [GIS]) that quantitatively evaluated all of Tennessee’s forestland and ranked counties in order of alignment with TDF’s Forest Stewardship Program goal, as depicted below in Figure 57.
Eligible counties were determined using five input data layers:
1. TDF’s SMART Stewardship records, as of December 2019.
2. USDA Forest Service’s Forest to Faucet—Forest Importance to Surface Drinking Water.
3. The Nature Conservancy’s Resilient and Connected Prioritized Network.
4. Tennessee Comptroller’s parcel records. 5. U.S. Geological Survey’s National Land Cover
Database (NLCD) 2016.
TDF’s SMART Stewardship records identify where the enabling conditions (e.g., landowner willingness, promotion of Program by area foresters) occur on Tennessee’s landscape. To be considered a Stewardship priority, a county must have at least 20 Stewardship plans written in the last decade.
Water and resilient and connected landscapes were identified as key factors for Stewardship priority designation. The USDA Forest Service’s Forests to Faucets project was used to identify watersheds where forests play a key role in maintaining surface drinking water. TDF and its partners gave greater weight in the analysis to watersheds with greater forest importance to surface drinking water. The Nature Conservancy developed the Resilient and Connected Prioritized Network to delineate areas critical to forests and wildlife that are more adaptive to climate change due to the presence of micro-climates, micro-sites, and biological
diversity. In the eastern U.S., the Prioritized Network is equivalent to 20 percent of total land area. Forests that occur within the Prioritized Network received greater weight in the analysis. Protected lands such as National Forests and Parks were not included in the analysis.
Finally, parcels were excluded that did not contain at least 20 acres of forest based on property parcel records and NLCD 2016.
A total of 5,853,300 acres of forest in 35 counties were identified as Forest Stewardship Program priorities. Prioritized counties occur in all four of TDF’s administrative districts (East Tennessee, Cumberland, Highland Rim, and West Tennessee). The prioritized counties tend to be rural, and 22 of the prioritized counties are considered “woodshed” counties (i.e., counties that contain a large timber basket and where a high proportion of timber is processed).
Appendix

a a121
Appendix D. Forest Legacy Program
Purpose of the Forest Legacy Program Implementation of the Forest Legacy Program (FLP) fills an important gap and provides a safety net to protect environmentally important resources in Tennessee. The FLP complements existing programs administered by state and local agencies, land trusts and conservancies, forest industries, and conservation organizations whose efforts are focused on conserving unprotected resources on private lands. The FLP process also provides improved coordination of effort by which all interested organizations and individuals can participate as partners to achieve protection of significant forest resources. The FLP offers landowners an opportunity to voluntarily protect important resources by donating or selling forested tracts. Through fee simple or conservation easements, these landowners protect property with key resource values, establish management goals, and implement land-use restrictions. In this way, the program can help maintain the forestland base, protect special forest resources, and provide opportunities for traditional forest uses for future generations. Although landowners that participate in FLP may choose to donate or sell partial interest to their lands by means of conservation easements, fee title acquisitions are the preferred method of protecting important forestlands. Fee title acquisitions enable perpetual conservation and management of acquired lands consistent with state and federal programmatic objectives. FLP acquisitions are from willing landowners only.
Authority The Cooperative Forestry Assistance Act (CFAA) of 1978, as amended, (16 USC 2101 et seq.) provides authority for the Secretary of Agriculture (Secretary) to provide financial, technical, educational, and related assistance to States, communities, and private forest landowners. Section 1217 of Title XII of the Food, Agriculture, Conservation and Trade Act of 1990 (P.L. 101-624:104 stat.3359; 16 USC 2103c), also referred to as the 1990 Farm Bill, amended the CFAA and directs the Secretary to establish the FLP to protect
environmentally important forest areas that are threatened by conversion to non-forest uses. This authority continues indefinitely. Through the 1996 Farm Bill (Federal Agricultural Improvement and Reform Act of 1996; Public Law 104-127; Title III - Conservation; Subtitle G - Forestry; Section 374, Optional State Grants for Forest Legacy Program), the Secretary is authorized, at the request of a participating State, to make a grant to the State to carry out the FLP in that State, including the acquisition by the state of lands and interests in lands.
Program Implementation TDF, the lead state agency in Tennessee, elects the state grant option pursuant to the provisions of the 1996 Farm Bill, Title III; Subtitle G, Section 374. Therefore, FLP acquisitions will be transacted by the state with the title vested in the state or a unit of state government. One exception to this policy involves donations where the donor may wish to donate to land trust, local, or federal government, and the potential receiving agency/organization agrees to accept the donation and to manage the lands or interest in perpetuity for FLP purposes.
Program Funding The Cooperative Forestry Assistance Act, as amended, and USDA Forest Service FLP Implementation Guidelines established a cost-sharing process for state FLPs. The maximum federal contribution may not exceed 75 percent of project costs and is subject to availability of federal appropriations. FLP costs that may be covered by federal funds include the purchase of conservation easements or other interests in land by the state or eligible non-profit land trusts. Activities that qualify for federal cost-sharing include inventories, mapping, baseline resources descriptions, title searches, initial appraisal work, surveys, and drafting and developing easement terms. (For a more comprehensive list of items covered by federal funds, refer to the Forest Legacy Program Implementation Guide.)
The remaining 25 percent of project costs must be paid with non-federal matching funds or in-kind contributions from state, local, and non-governmental sources. In addition to the donation of goods and
NOTE: THE FOREST LEGACY PROGRAM APPENDIX THAT FOLLOWS WAS AUTHORED BY THE TENNESSEE DIVISION OF FORESTRY, AND TDF IS SOLELY RESPONSIBLE FOR THE SECTION’S CONTENTS.
Appendix

a a122
services, the appraised value of conservation easements meeting Uniform Appraisal Standards for Federal Land Acquisitions (UASFLA), or “Yellow Book” standards accepted as donations to the program may qualify as a major part of the non-federal match.
Use of “bargain sales” by landowners will also be encouraged by the state. In such sales, landowners receive payment for portions of the fair market value (UASFLA) of the rights that are conveyed through conservation easements or other interests in land, and make a charitable donation of the remainder of that value.
Funding for subsequent monitoring and enforcement may include: (1) donations by landowners, non-profit organizations, or other sources; (2) contributions from participating landowners that might be generated by management activities; and (3) public appropriations for the purpose at the state and local level.
Tennessee Program Objectives Tennessee’s FLP objectives will be used to determine which eligible tracts will receive priority for participation in the program. Objectives are aimed at protecting forest resource values that constituencies and the public consider of greatest concern. The mission of Tennessee’s Forest Legacy Program is to protect environmentally important, private forestlands threatened with conversion to non-forest uses. The primary focus of the program is to maintain well-managed, working forests on the landscape. The objectives of the FLP in Tennessee are as follows:
• Prevent conversion of forestlands to other uses. • Preserve forestlands for current and future wood
production. • Preserve and protect water quality, fisheries, and water
supplies. • Preserve and protect riparian habitats. • Preserve and protect fish and wildlife habitats, rare
plants, and biological diversity. • Preserve and protect natural beauty. • Preserve and protect forest-based recreation
opportunities.
In ranking applicant proposals, the State Forest Stewardship Coordinating Committee (SFSCC) FLP Ranking Subcommittee will place priority on tracts that possess multiple significant resources and opportunities that will achieve two or more FLP objectives when
providing recommendations to the State Forester. Priority will also be given to tracts whose owners demonstrate their intentions to actively accomplish the objectives of the program. Additional consideration will be given to larger parcels, which may be able to utilize program resources more efficiently.
Program Management For projects involving conservation easements, TDF and easement holders are responsible for working cooperatively with participating landowners to develop the details of easements. Landowners will be responsible for managing the resources covered by easements. Federal law and FLP Guidelines require preparation of a Forest Stewardship Plan or Multi-Resource Management Plan that must be prepared and approved prior to conveying acquisition of the easement. For guidance on Multi-Resource Management Plans, see Section 17 – Multi-Resource Management Plans found in the Forest Legacy Program Implementation Guidelines. For guidance on Multi-Resource Management Plan content, see Appendix O -Sample Content of a Multi-Resource Management Plan found in the Forest Legacy Program Implementation Guidelines. The Forest Legacy Program Implementation Guidelines can be found at the following website: https://www.fs.usda.gov/sites/default/files/fs_media/fs_document/15541-forest-service-legacy-program-508.pdf
For Tennessee projects seeking to purchase a conservation easement, a current Multi-Resource Management Plan or abstract detailing landowner’s management intent must be established at the time of application. The management objectives identified within the Multi-Resource Management Plan (MRMP) or abstract detailing landowner’s management intent must be consistent with the purposes of the FLP and further Tennessee’s programmatic objectives through planned practices promoting forest health and active forest management. Multi-Resource Management Plans must clearly describe specific management objectives and strategies for significant resources identified in their easements. Management plans associated with third-party certifications are acceptable.
For projects involving fee simple acquisitions, the state agency responsible for management must ensure the acquired property is managed according to the tenets of the FLP. For tracts acquired in fee simple, a Multi-Resource Management Plan must be created for the FLP tract or the tract must be incorporated into an
Appendix

a a123
existing management plan for surrounding conservation lands. Multi-Resource Management Plans must include provisions to meet the purposes of the FLP. For projects involving fee simple acquisitions, a current Multi-Resource Management Plan or abstract detailing owner’s management intent must be established at the time of application. The management objectives identified within the Multi-Resource Management Plan or abstract detailing owner’s management intent must be consistent with the purposes of the Forest Legacy Program and further Tennessee’s programmatic objectives through planned practices promoting forest health and active forest management. Multi-Resource Management Plans identify the management objectives of the property and describe actions to protect and manage soil, water, aesthetic quality, recreation, timber, fish and wildlife resources, and other conservation values identified on the FLP tract. Management plans associated with third party certifications are acceptable. The State Forester or designee is responsible for approving the plan and ensuring it meets the FLP and Tennessee’s FLP requirements. Ongoing resource management plans of the managing state agency will suffice as evidence that properties are managed according to Forest Stewardship principles.
Monitoring Each conservation easement established under FLP requires annual monitoring to ensure that the terms of agreement are being honored, and that resources are being protected and conserved. Baseline descriptions of resources will be developed by easement holders and used to assess changes in resource conditions over time, including any resource enhancements such as management of rare plants or measures to improve water quality. Easement monitoring will involve annual visits to tracts by easement holder (TDF) and/or third parties acting as agents of TDF to conduct the monitoring. The State Lead Agency (TDF) and other governmental entities (as applicable) holding title to interests in land acquired with FLP funds (conservation easement or fee simple holders) are responsible for the monitoring and management of those interests in perpetuity. The holder may delegate or assign monitoring and management duties but must retain enforcement responsibilities. The delegation or assignment of responsibility must be documented by a written agreement, and the Forest Service Regional Forest Legacy Program Manager must be notified. Only individuals and/or
organizations that are clearly qualified to assess the condition of the resources under easement will conduct monitoring. Forest Legacy funds may not be used to conduct monitoring activities. Therefore, in the case of purchased conservation easements, the program participant (grantor or landowner) must assume the annual monitoring responsibility to be audited annually by TDF.
A fee simple purchase acquired under the FLP is not subject to annual monitoring requirements for conservation easements. Instead, for all FLP fee simple and cost-share tracts, the State Lead Agency must monitor the condition of each tract periodically, including those owned and managed by other governmental entities within the state (such as other state agencies or local governments). The Lead State Agency will also submit a self-certifying statement to the USDA Forest Service Regional Program Manager every 5 years as part of the State FLP program review. Similarly, for fee simple cost-share tracts held by a qualifying nonprofit conservation organization, the State Lead Agency must acquire from the fee interest holder a self-certifying statement for submission to the USDA Forest Service Regional Program Manager as part of the State FLP program review. The self-certifying statement must identify and document the condition of each fee tract, including changes in title, land conversions to non-forest uses, or uses inconsistent with the purposes of the FLP. If there are deviations from FLP purposes, the statement must describe the actions taken or to be taken to address documented deviations. Forest Legacy funds may not be used to conduct monitoring activities. Therefore, in the case of fee simple and cost-share tracts, the fee interest holder must assume monitoring responsibility to be audited periodically by TDF.
Forest Legacy Assessment and IdentificationofForestLegacyAreas Broadly speaking, Tennessee’s FAP guides the work of Tennessee’s forestry community. As the lead agency administering the FLP in Tennessee, TDF’s continued participation in the program requires periodic evaluation of current forest uses, trends and conditions, and factors influencing conversion to non-forest uses, all of which are integrated into the FAP. For purposes of the FLP, the FAP provides an assessment of forest conditions, uses and trends, provides the framework to identify priority forest landscapes, and addresses the following key components:
Appendix

a a124
• Forest resources and benefits including:
o Aesthetic and scenic values o Fish and wildlife habitat o Public recreation opportunities o Soil productivity o Forest products and timber management
opportunities o Watershed values including water-quality
protection o Present and future threat of conversion of forest
areas to non-forest uses o Historic or traditional uses of forest areas,
and trends and projected future uses of forest resources
o Current ownership patterns, size of tracts, and trends and projections of ownership patterns
o Cultural resources that can be effectively protected
o Outstanding geological features o Threatened and endangered species o Other ecological values o Mineral resource potential o Protected lands including Federal, State,
municipal lands, and private conservation organization lands
o Issues identified by the SFSCC and through the public-involvement process
PublicBenefitsDerivedfromTennessee’s Forest Legacy Areas
Protecting land through conservation easements or fee acquisition offers a variety of public benefits. Privately owned forests contribute significantly to the state’s supply of timber and timber products, while also providing important wildlife habitat, watershed protection, recreation opportunities, and aesthetic values. Forest Legacy Areas, whether through conservation easements or fee acquisition, reduce the rate at which land becomes fragmented, and they protect valuable ecosystems and the biological, economic and social values they provide. The FLP will help maintain the forestland base, protect special forest resources, and provide opportunities for traditional forest uses for future generations.
Eligibility Criteria for Tennessee’s Forest Legacy Areas The CFAA directs the Secretary to establish eligibility criteria for the designation of Forest Legacy Areas (FLAs), in consultation with State Foresters via recommendations of the SFSCC. These criteria should be based upon the FLP purpose to protect environmentally important forest areas that are threatened by conversion to non-forest uses, and these criteria should be further developed through the state FAP.
States are responsible for determining what defines “threatened” and “environmentally important forest areas” in the state. However, environmentally important forest areas shall contain one or more of the following public values, as defined by the states:
a. Timber and other forest commodities; b. Scenic resources; c. Public recreation opportunities; d. Riparian areas; e. Fish and wildlife habitat; f. Known threatened and endangered species; g. Known cultural resources; and h. Other ecological values.
TDF and its partners developed a set of criteria for determining Tennessee’s FLAs. These criteria differ from past criteria for setting FLAs, most notably in the emphasis placed on protecting working forests from fragmentation and land use conversion for the 2020 FAP cycle. The goal of Tennessee’s 2020 FLP is to prioritize forested tracts within high primary forest product producing counties while facilitating landscape connectivity and addressing risks to forest fragmentation and land-use conversion. The criteria for FLAs established in the 2020 FAP revision requires candidate properties must meet the following requirements:
a. Property is a forested tract with at least 20 acres of continuous forest.
b. Property is located in one of the top 60 percent of primary forest product-producing counties.
c. Property is in an area with significant risk of becoming lightly stressed, stressed, impacted, or damaged due to the extent of impervious surface area by 2030, or at high risk of becoming urbanized by 2030.
d. Property is identified in The Nature Conservancy’s Resilient and Connected Prioritized Network.
Appendix

a a125
Eligible properties are identified using spatial datasets and geographic information system (GIS) analytical software. In the analytical process, a data layer is created for each FLA requirement, and these data layers are then overlaid to identify properties that met all requirements.
The National Land Cover Database 2016 (Yang et al. 2018) is used to identify all forestland (deciduous, evergreen, mixed, wetlands). This spatial layer of forestland is then intersected with a property parcel dataset kept for state property and tax records. To meet requirement (a), a property must be at least 20 acres and contain at least 20 acres of continuous forest.
The Timber Products Output (TPO) data available from the USDA Forest Service Forest Inventory and Analysis (FIA) program is used to map primary forest product production activities for each county in Tennessee. The TPO dataset is developed from surveys of mills and reports the amount of timber processed at each mill site. A quantile analysis of TPO data identified the top 60 percent of counties of primary forest product producing counties. The TPO data is used as a proxy for harvest removals due to data limitations regarding the amount of timber harvested in each county. Due to the different land areas of counties, the TPO dataset is normalized on a per acre basis prior to quantile analysis.
Projections of impervious surface from the Environmental Protection Agency (EPA) are used to identify areas at high risk of forest health and surface drinking water issues arising from declining surface permeability. Impervious surface projections are based on data layers generated for the Integrated Climate and Land-Use Scenarios project. Impervious surface projections are stratified into stress index classes based on the extent of impervious surfaces: unstressed (<1 percent), lightly stressed (1-5 percent), stressed (5-10 percent), impacted (10-25 percent), and damaged (>25 percent). Areas projected to be classified as lightly stressed, stressed, impacted, or damaged by 2030 given current socio-economic and climate conditions (i.e., the base case scenario) are identified for inclusion in FLAs. Additionally, forests at 60 percent or greater probability of becoming urbanized or projected to be categorized as suburban, urban, or industrial by 2030 meet eligibility requirement (c). Probability of urbanization is determined using SLEUTH data. Projections of suburban, urban, and industrial land use classes are generated for the Integrated Climate and Land-Use Scenarios project.
Landscape connectivity and resilience to climate change is used as a key factor of FLA eligibility in addition to forest products potential and threat of land use conversion (i.e., development). The Nature Conservancy developed the Resilient and Connected Prioritized Network to delineate areas critical to forests and wildlife that are more adaptive to climate change due to the presence of micro-climates, micro-sites, and biological diversity. In the eastern U.S., the Prioritized Network is equivalent to 20 percent of total land area. Protected lands such as National Forests and Parks are excluded in the analysis. Forests contained in the Prioritized Network data layer meet eligibility criterion (d).
Description/IdentificationofTennessee’s Forest Legacy Areas
Using the process described above, the FLP in Tennessee includes approximately 3.2 million acres (Table 20) as of June 2020. Eligible properties are concentrated in the Cumberland Plateau, the Highland Rim corridor arcing north of the Nashville metropolitan area, and the Highland Rim corridor in proximity to the Tennessee River, as shown in Figure 58. The following counties have at least 100,000 acres eligible for FLP funding: Campbell, Cumberland, Fentress, Franklin, Hickman, Humphreys, Marion, Morgan, Perry, Scott, and Wayne.
TDF chose to identify FLAs at a smaller scale than county or watershed so that parcel size could be considered and mapped as a criterion for FLP funding. FLAs are often located near protected lands, such as the Tennessee Wildlife Refuge, Cherokee National Forest, state forests, parks, and wildlife management areas. This proximity to protected lands, either public or in private conservation easement, enhances the conservation potential of properties by creating blocks of forest protected from development.
Appendix
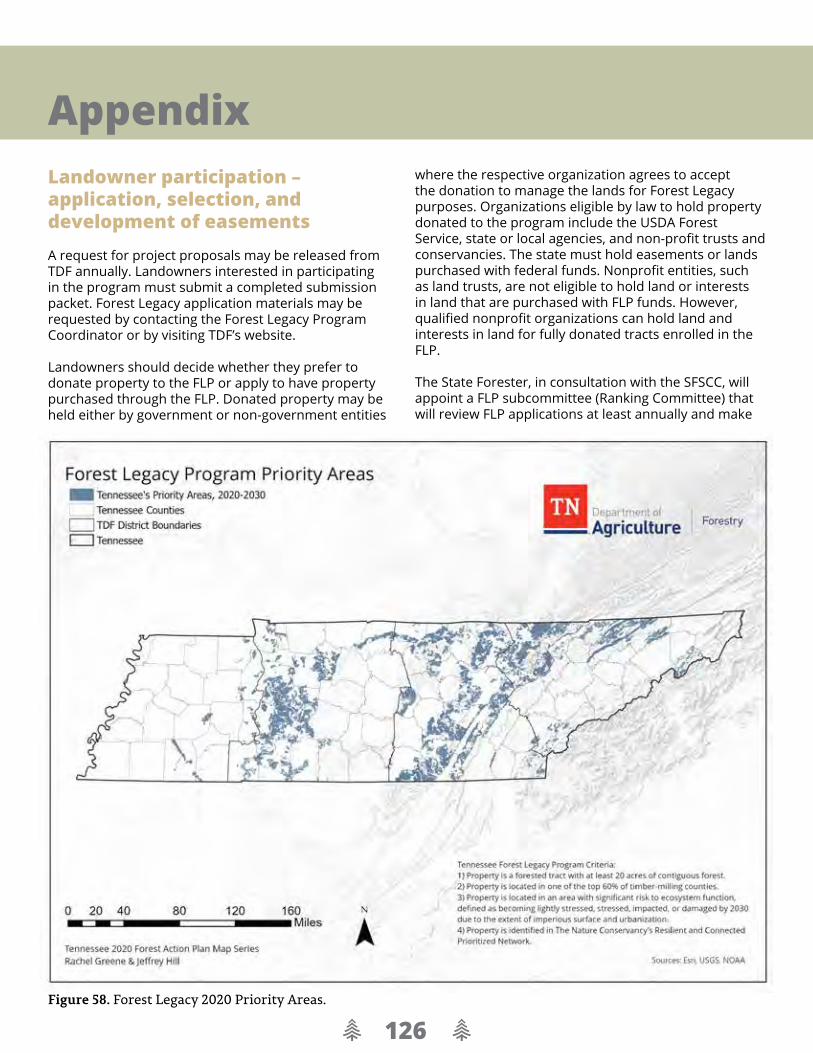
a a126Figure 58. Forest Legacy 2020 Priority Areas.
Landowner participation – application, selection, and development of easements A request for project proposals may be released from TDF annually. Landowners interested in participating in the program must submit a completed submission packet. Forest Legacy application materials may be requested by contacting the Forest Legacy Program Coordinator or by visiting TDF’s website.
Landowners should decide whether they prefer to donate property to the FLP or apply to have property purchased through the FLP. Donated property may be held either by government or non-government entities
where the respective organization agrees to accept the donation to manage the lands for Forest Legacy purposes. Organizations eligible by law to hold property donated to the program include the USDA Forest Service, state or local agencies, and non-profit trusts and conservancies. The state must hold easements or lands purchased with federal funds. Nonprofit entities, such as land trusts, are not eligible to hold land or interests in land that are purchased with FLP funds. However, qualified nonprofit organizations can hold land and interests in land for fully donated tracts enrolled in the FLP.
The State Forester, in consultation with the SFSCC, will appoint a FLP subcommittee (Ranking Committee) that will review FLP applications at least annually and make
Appendix

a a127
Table 20. Land area (rounded to the nearest 100 acres) of Tennessee counties eligible for Forest Legacy Program funding.
County Forest Legacy Area (ac) County Forest Legacy Area
(ac) Anderson 56,000 Lawrence 36,800 Benton 26,500 Lewis 78,700 Bledsoe 76,000 Macon 36,800 Bradley 7,500 Madison 15,000 Campbell 144,300 Marion 145,300 Cannon 70,600 McMinn 11,700 Carroll 4,600 McNairy 7,400
Cheatham 71,600 Monroe 46,800 Claiborne 76,200 Moore 1,600
Clay 48,900 Morgan 133,400 Cumberland 113,800 Overton 61,200 Decatur 21,500 Perry 108,000 Dickson 66,500 Pickett 18,300 Fentress 132,700 Polk 36,200 Franklin 100,600 Putnam 67,400 Giles 17,700 Rhea 51,800
Grainger 45,500 Scott 147,200 Grundy 77,700 Sequatchie 74,700 Hancock 68,000 Smith 22,200 Hardeman 33,000 Stewart 47,500 Hardin 42,200 Sumner 49,900 Hawkins 82,700 Unicoi 31,100
Henderson 2,400 VanBuren 57,000 Henry 11,200 Warren 50,200
Hickman 200,400 Washington 9,700 Houston 11,200 Wayne 110,500
Humphreys 123,700 White 34,400 Jackson 67,700
Total 3,263,600
Appendix

a a128
recommendations regarding the value of tracts to Tennessee’s FLP. The selection process will produce a list of landowner applications that will be prioritized for inclusion and potential funding. The prioritized list will be presented to the State Forester for final approval.
The State Forester-approved list will then be submitted to the USDA Forest Service’s Regional Office in Atlanta. The Forest Service will make the final determination as to which conservation easements or fee simple purchase projects will receive federal funds, or, in the case of donations, will be approved for inclusion in the FLP under cost-share agreements. All acquisitions will be made subject to availability of federal funds. Tracts successfully funded will be appraised using UASFLA standards, and landowners will be informed of the appraised value prior to formal closing of the conveyance.
Following completion of the prioritization and approval process, properties will be purchased or conveyed as charitable donations. State agencies such as TDF, Tennessee Department of Environment and Conservation (TDEC), or Tennessee Wildlife Resources Agency (TWRA) may hold purchased, fee simple properties.
In cases where conservation easements are involved, specific terms of easements will be negotiated between individual landowners and easement holders. Terms will be site specific and will provide for the permanent protection of forest resources targeted by the landowner for protection. All easement acquisitions must follow UASFLA appraisal standards and State procedures and standards for negotiation, appraisal review, title review, survey, and other requirements. TDF will exclusively hold title to all conservation easements acquired with federal funding through the FLP.
Forest Legacy Eligibility Requirements All projects must meet the minimum eligibility requirements further described as follows:
• The project is situated within (whole or in part) a designated FLA or adjacent to a previously purchased Forest Legacy tract
• The project has at least 75 percent forest cover (or can be reforested to at least 75 percent forest cover)
• The project can be managed consistent with the
purpose for which it was acquired by FLP • The landowner is willing to sell or donate the
interest in perpetuity • The County Mayor(s) have reviewed the project
proposal, which should include a summary of potential tax revenue impact and additional revenue sources (if applicable), and provided letters of support. Properties occurring in multiple counties need letters of support from each respective county.
• State Representative(s) and Senators have received a copy of the County Mayor(s) letter of support and reviewed the project proposal. Properties occurring in multiple congressional districts must have the project proposal sent for review by each respective state legislators.
• For fee acquisitions and projects seeking to sell a conservation easement: A current Multi-Resource Management Plan or abstract detailing owner’s management intent must be established at the time of application. The management objectives identified within the Multi-Resource Management Plan or abstract detailing owner’s management intent must be consistent with the purposes of the Forest Legacy Program and further Tennessee’s programmatic objectives through planned practices promoting forest health and active forest management.
Project Application Scoring This document provides guidance to the Tennessee Forest Legacy Ranking Committee on how to score individual Forest Legacy Program (FLP) projects, including additional clarification on the core national criteria, project readiness and other evaluation considerations used in this process. This guidance mimics the criteria used by the National Review Panel, who ultimately scores and ranks submissions from the states.
National Core Criteria:
IMPORTANCE
This criterion focuses on the attributes of the property and the environmental, social, and economic public benefits gained from the protection and management of the property and its resources. This criterion reflects the ecological assets and the economic and social values conserved by the project and its level of significance. National significance of a project is demonstrated in
Appendix

a a129
two ways: First, a project that solidly represents a majority of the attributes outlined is viewed as nationally significant because of its strong alignment with the purposes and Strategic Direction of the Forest Legacy Program.
Second, national significance can be demonstrated by a project that (1) supports Federal laws, such as Endangered Species Act, Safe Drinking Water Act, and Clean Water Act, (2) contributes to Federal initiatives, or (3) contains or enhances Federal designations such as Wild and Scenic Rivers, National Scenic Byways, National Recreation Trails, and cultural resources of national importance. When determining Federal importance, interstate/international resources (such as migratory species, or trail and waterways that cross state or international boundaries) should also be considered.
Scoring consists of evaluating a project for the attributes below and identifying a point score. More points will be given to projects that demonstrate multiple public benefits of significance, or benefits of national significance. Significance of attributes is demonstrated by the quality and scope of the attributes. More points will be given to projects that exemplify a particular attribute or combination of attributes.
ATTRIBUTES TO CONSIDER:
Economic Benefits from Timber and Potential Forest Productivity –This category includes three independent components: (1) Landowner demonstrates sustainable forest management in accordance with a management plan. Additional points should be given to land that is third party certified (such as Sustainable Forestry Initiative, Forest Stewardship Council, and American Tree Farm System). (2) Forestry activities contribute to the resource-based economy for a community or region. (3) The property contains characteristics (such as highly productive soils) to sustain a productive forest. 0-10 ____________
Economic Benefits from Non-timber Products – Provides non-timber revenue to the local or regional economy through activities such as hunting leases, ranching, non-timber forest products (pine straw, ginseng collection, etc.), guided tours (fishing, hunting, birdwatching, etc.), and recreation and tourism (lodging, rentals, bikes, boats, outdoor gear, etc.). 0-5 _________
Threatened or Endangered Species Habitat – The site has documented rare, threatened or endangered plants and animals or designated habitat. Documented occurrence and use of the property should be given more consideration in point allocation than if it is habitat without documented occurrence or use. Federally listed species should be given more consideration than state-only listed species when evaluating the significance of this attribute. 0-5 ________
Fish, Wildlife, Plants, and Unique Forest Communities - The site contains unique forest communities and/or important fish or wildlife habitat as documented by a formal assessment or wildlife conservation plan or strategy developed by a government or a non-governmental organization. The importance of habitat to an international initiative to support and sustain migratory species can be viewed as national importance if conserving the property will make a significant contribution. The mere occasional use of the property or a modest contribution to an international initiative does not raise the property to national importance. 0-5 ____________
Water Supply and Watershed Protection – (1) Property has a direct relationship with protecting the water supply or watershed, such as provides a buffer to public drinking water supply, contains an aquifer recharge area, or protects an ecologically important aquatic area, and/or (2) the property contains important riparian areas, wetlands, shorelines, river systems, or sensitive watershed lands. When allocating points, the importance of the resource and the scale of the contribution of the project should be considered. Merely being located within an aquifer recharge area or in a water supply area should not be given the same consideration as a project that makes a significant conservation contribution to a high-quality project of high-value. 0-5 ____________
Public Access – Protection of the property will maintain or establish access by the public for recreation; however, restrictions on specific use and location of recreational activities may exist. 0-5 ____________
Appendix

a a130
Scenic – The site is located within a viewshed of a government designated scenic feature or area (such as trail, river, or highway). Federal designation should be given more consideration than state-only designations when evaluating the significance of this attribute.0-5 ___________
Historic/Cultural/Tribal – The site contains features of historical, cultural, and/or tribal significance, formally-documented by a government or a non-governmental organization. A Federal designation should receive greater consideration.0 = no sites; 5 = designated sites ___________
TOTAL SCORE: Importance (possible maximum of 45 points) _______________
THREATENED
This criterion estimates the likelihood for conversion. More points will be given to projects that demonstrate multiple conditions; however, a project need not have all the conditions listed to receive maximum points for this category. During the evaluation of a threat, a good land steward interested in conserving land should not be penalized. The following will be considered:
• Third Party Ownership - If property has been acquired by a third party with the support of the State, threatened will be evaluated based on the situation prior to the third party acquisition.
• Lack of Protection- The lack of temporary or permanent protections (e.g. current zoning, temporary or permanent easements, moratoriums, and encumbrances that limit subdivision or conversion) that currently exists on the property and the likelihood of the threat of conversion.
• Land and Landowners Circumstances – land and landowner circumstances such as property held in an estate, aging landowner, future property retention by heirs is uncertain, property is up for sale or has a sale pending, landowner anticipates owning property for a short duration, landowner has received purchase offers, land has an approved subdivision plan, landowner has sold subdivisions of the property, etc.
• Adjacent Land Use- adjacent land use characteristics such as existing land status, rate of development
growth and conversion, rate of population growth (percent change), rate of change in ownership, etc.
• Ability to Develop- physical attributes of the property that will facilitate conversion, such as access, buildable ground, zoning, slope, water/sewer, electricity, etc.
Likelihood of conversion to non-forest uses. • Imminent/Likely – 16 - 30 points. Multiple conditions
exist that make conversion to non-forest uses likely. Circumstances indicate conversion may occur soon or within 5 years. Characteristics include: land has a subdivision plan, landowner has received offers from developers, landowner has sold off subdivisions of the property, land is located in a rapidly developing area, landowner(s) are elderly, or nearby comparable land has been recently sold for development.
• Possible – 1 - 15 points. A few conditions exist that make conversion to non-forest uses possible. Circumstances indicate conversion could occur within 5 to 10 years: Characteristics include: land is in an attractive location for development such as waterfront or an outdoor recreation area.
• Unlikely (within 10 years) – 0 points
Note: Individual project scores for threatened will be determined as a committee consensus
TOTAL SCORE: Threatened (maximum of 30 points)_______________
STRATEGIC
This criterion reflects the project’s relevance or relationship to conservation efforts on a broader perspective. When evaluating strategic variables, three considerations should be made: (1) the scale of a conservation initiative, strategy, or plan, (2) the scale of the project’s contribution to that initiative, strategy, or plan, and (3) the placement of the parcel within the area of the initiative, strategy, or plan. Relevant national or multi-state conservation plan or strategies include but are not limited to the Southern Forest Land Assessment, Lower Mississippi Valley Joint Venture Study, USFWS Habitat Conservation Plan strategy, Partners in Flight Land Conservation Plan, North American Waterfowl Management Plan, and TNC Ecoregional Conservation Planning strategy. Relevant state conservation strategies include but are not limited to TN Statewide Forest Resource Assessment and Strategy,
Appendix

a a131
TN Conservation Heritage Trust Fund Preliminary Assessment of Needs, and TN Statewide Wildlife Action Plan.
Attributes to consider:
Conservation Strategy - How the project fits within a larger conservation plan, strategy, or initiative as designated by either a government or non-governmental entity.
Compliment Protected Lands - How the project is strategically linked to enhance already protected lands including past FLP projects, already protected Federal, State, or non-governmental organization lands, or other Federal land protection programs (NRCS, NOAA, etc). • High - 31 - 40 points- The property significantly
advances a landscape-scale or watershed-based conservation strategy through infill and/or key linkages and supports previous conservation investments. (Ex. – A KEY property in a formally developed national, multi-state, or state conservation effort.)
• Average -16 - 30 points- The property makes a modest contribution to a conservation effort and is near already protected lands. (Ex. – A NON-KEY property in a formally developed national, multi-state, or state conservation effort.)
• Low - 0 - 15 points- The property is not part of a conservation plan, but will lead to locally-focused conservation effort. (Ex. – Property will compliment or lead to additional conservation action locally.
TOTAL SCORE: Strategic (maximum of 40 points)_______________
PROJECT READINESS
Project readiness is defined as the degree of due diligence completed. To demonstrate project readiness, completed items need to be specified (including completion date). Each due diligence item is worth 1 point, with a maximum score of 7 points for this section.• A Forest Stewardship plan or multi-resource
management plan is completed.• Project is a donation or fee title acquisition.• Cost share commitment has been obtained from a
specified source.• Documented support for the cost estimate, such as
completed market analysis or preliminary appraisal.• A signed option or purchase and sales agreement
is held by the State or at the request of the State, conservation easement or fee title is held by a third party.
• Title search is completed, including identifying any temporary or permanent protections.
• Minerals determination is completed.
TOTAL SCORE: Project Readiness (maximum of 7 points)_______________
TOTAL STATE CORE CRITERIA SCORE (maximum of 122 points):
Importance ____
+ Threat ____
+ Strategic ____
+ Project readiness ____
= Total _____
Appendix

a a132
Appendix E. 2015 Forest Action Plan UpdatesThe Tennessee Division of Forestry’s 2010 Forest Action Plan (initially titled Forest Resource Assessment and Strategy Plan), as well as the 2015 update for that plan can be found at:https://www.tn.gov/agriculture/forests/protection/ag-forests-action-plan.html
Appendix

a a133
Literature Citations
Anderson, M.G., Barnett, A., Clark, M., Prince, J., Olivero Sheldon, A. and Vickery B. 2016. Resilient and Connected Landscapes for Terrestrial Conservation. The Nature Conservancy, Eastern Conservation Science, Eastern Regional Office. Boston, MA.
Bailey, R. G. 1994. Ecoregions of the United States, rev. ed. (Map 1:7,500,000). Washington, DC: US Department of Agriculture, Forest Service.
Bailey, R. G., P. E. Avers, T. King, and W. H. McNab, eds. 1994. Ecoregions and subregions of the United States (map) (supplementary table of map unit descriptions compiled and edited by McNab, W.H. and R. G. Bailey). Washington, DC: US Department of Agriculture, Forest Service. Scale 1:7,500,000.
Bechtold, W. A., and P. L. Patterson, eds. 2005. The Enhanced Forest Inventory and Analysis Program: National Sampling Design and Estimation Procedures. Gen. Tech. Rep. SRS-80. Asheville, NC: US Department of Agriculture, Forest Service, Southern Research Station. 85 p.
Butler, B.J., Kilgore, M.A., Snyder, S.A., Markowski-Lindsay, M.A., Catanzaro, P.F., Kittredge, D.B., Andrejczyk, K., Dickinson, B.J., Eryilmaz, D., Hewes, J.H. and Randler, P., 2013. Evaluation of the Effectiveness and Reach of the Educational Programs and Technical Assistance Activities of the US Forest Service, Forest Stewardship Program.
Carman, J. B. 2001. Wildflowers of Tennessee. Tullahoma, TN: Highland Rim Press. 427 p.
Dale, V.H., L.A. Joyce, S.G. McNulty, and R.P. Neilson 2000. The interplay between climate change, forests, and disturbances. Science of the Total Environment 262: 201-204.
Dale, V.H., L.A. Joyce, S. McNulty, R.P. Neilson, M.P. Ayres, M.D. Flannigan, P.J. Hanson, L.C. Irland, A.E. Lugo, C.J. Peterson, D. Simberloff, F.J. Swanson, B.J. Stocks, and B.M. Wotton. 2001. Climate change and forest disturbances. BioScience 51: 723-734.
Dale, V.H., K.O. Lannom, M.L. Tharp, D.G. Hofges, and J. Fogel. 2009. Effects of climate change, landuse change, and invasive species on the ecology of the Cumberland forests. Canadian Journal of Forest Resources 39: 467-480.
Dale, V.H., M.L. Tharp, K.O. Lannom, and D.G. Hodges. 2010. Modeling transient response of forests to climate change. Science of the Total Environment 408: 1888-1901.
DeSelm, H. R. 1984. Potential National Natural Landmarks of the Appalachian Ranges Natural Region. US Department of the Interior, National Park Service.
Dillman, D. A., J. D. Smyth, and L. M. Christian. 2014. Internet, phone, mail, and mixed-mode surveys: The tailored design method. 4th ed. Hoboken, NJ: Wiley & Sons. 509 p.
Duerr, D.A., and P.A. Mistretta. 2013. Invasive pests – insects and diseases. Chapter 16 in: D.N. Wear and J.G. Greis (eds.). The Southern Forest Futures Project. Technical Report. USDA Forest Service, Southern Research Station, Ashville, N.C.: 457-491.
EPRI (Electric Power Research Institute). 2009. Potential Impact of Climate Change on Natural Resources in the Tennessee Valley Authority Region. Palo Alto, CA.
Evans, A.M., and T.G. Gregoire. 2007. A geographically variable model of hemlock woolly adelgid spread. Biological Invasions 9: 369-382.
Gallant, A. L., T. R. Whittier, D. P. Larsen, J. M. Omernik, and R. M. Hughes. 1989. Regionalization as a tool for managing environmental resources. Corvallis, OR: US Environmental Protection Agency EPA/600/3-89/060. 152 p.
Gan, J.B. 2004. Risk and damage of southern pine beetle outbreaks under global climate change. Forest Ecology and Management 191: 61-71.
Glick, P., S.R. Palmer, and J.P. Wisby. 2015. Climate Change Vulnerability Assessment for Tennessee Wildlife and Habitats. Report prepared by the National Wildlife Federation and The Nature Conservancy – Tennessee for the Tennessee Wildlife Resources Agency, Nashville, TN.
References

a a134
ReferencesGriffith, G. E., J. M. Omernik, T. F. Wilton, and S. M. Pierson. 1994. Ecoregions and subregions of Iowa—a framework for water quality assessment and management. The Journal of the Iowa Academy of Science 101 (1): 5-13.
Griffith, G. E., J. M. Omernik, and S. H. Azevedo. 1997. Ecoregions of Tennessee. Corvallis, OR: US Environmental Protection Agency EPA600R-97/022. 51 p.
Griffith, G., J. Omernik, and S. Azevedo. 1998. Ecoregions of Tennessee. (2 sided color poster with map, descriptive text, summary tables, and photographs). US Geological Survey, Reston, VA. Scale 1:940,000.
Hansen, A.J., R.P. Nielson, V.H. Dale, C.H. Flather, L.R. Iverson, D.J. Currie, S. Shafer, R. Cook, and P.J. Bartlein. 2001. Global change in forests: Responses of species, communities, and biomes. BioScience 51: 765-779.
Jenkins, C. N., K. S. Van Houtan, S. L. Pimm, and J. O. Sexton. 2015. US protected lands mismatch biodiversity priorities. Proceedings of the National Academy of Sciences USA 112(16): 5081-5086. Jin, S., C. Homer, L. Yang, P. Danielson, J. Dewitz, C. Li, Z. Zhu, G. Xian, and D. Howard. 2019. Overall methodology design for the United States National Land Cover Database 2016 products. Remote Sensing 11: 2971. https://doi.org/10.3390/rs11242971.
Keys, J. Jr., C. Carpenter, S. Hooks, F. Koenig, W. H. McNab, W. Russell, M. L. Smith. 1995. Ecological units of the eastern United States—first approximation (CD-ROM). Washington, DC: US Department of Agriculture, Forest Service.
Krist, F. J., Jr., F. J. Sapio, and B. M. Tkacz. 2007. Mapping Risk from Forest Insects and Diseases, 2006. FHTET 2007-06. Fort Collins, CO: US Department of Agriculture, Forest Service, Forest Health Technology Enterprise Team. 115 p.
Krist, F. J., Jr., F. J. Sapio, and B. M. Tkacz. 2010. A Multi-criteria Framework for Producing Local, Regional, and National Insect and Disease Risk Maps. Fort Collins, CO: US Department of Agriculture, Forest Service, Forest Health Technology Enterprise Team. 16 p.
Krist, F. J., Jr., J. R. Ellenwood, M. E. Woods, A. J. McMahan, J. P. Cowardin, D. E. Ryerson, F. J. Sapio, M. O. Zweifler, and S. A. Romero. 2014. 2013-2027 National Insect and Disease Forest Risk Assessment. FHTET-14-01. Washington, DC: US Department of Agriculture Forest Service, Forest Health Technology Enterprise Team. 209 p.
Martin, W. H. 1989. Forest patterns in the Great Valley of Tennessee. Journal of the Tennessee Academy of Science 64(3): 137-143.
McNulty, S., P. Caldwell, T.W. Doyle, K. Johnsen, Y. Liu, J. Mohan, J. Prestemon, and G. Sun. 2013. Forests and climate change in the Southeast USA. Chapter 8 in: Ingram, K., K. Dow, L. Carter, and J. Anderson (eds.). Climate of the Southeast United States: Variability, Change, Impacts, and Vulnerability.
Island Press, Washington, D.C.: 165-189.
Menard, J., B. C. English, and K. Jensen. 2019. Tennessee ag and forestry stats, 2017: Economic contributions of agriculture and forestry in Tennessee. Knoxville, TN: University of Tennessee, Department of Agricultural and Resource Economics, Agri-Industry Modeling and Analysis Group. 87 p.
Menard, J., English, B. and Jensen, K., 2019. Economic Impacts of Agriculture and Forestry in Tennessee, 2017. Agri-industry Modeling & Analysis Group Report RS#19-001.
Miller, R. A. 1974. The Geologic History of Tennessee. Bulletin 74. Tennessee Division of Geology. 63 p.
Mitchell, R.J., Y. Liu, J.J. O’Brien, K.J. Elliott, G. Starr, C.F. Miniat, and J.K. Hiers. 2014. Future climate and fire interactions in the southeastern region of the United States. Forest Ecology and Management, http://dx.doi.org/10.1016/j.foreco.2013.12.003 (accessed May 13, 2015).
Nuttli, O. W. 1973. The Mississippi Valley Earthquakes of 1811 and 1812: Intensities, Ground Motion, and Magnitude. Bulletin of the Seismological Society of America (Feb.).
Omernik, J. M. 1987. Ecoregions of the conterminous United States (map supplement). Annals of the Association of American Geographers 77(1): 118-125. Scale 1:7,500,00.

a a135
ReferencesOmernik, J. M. 1995. Ecoregions—a framework for environmental management. Pages 49-62 in Davis, W. S., and T. P. Simon, eds. Biological Assessment and Criteria—Tools for Water Resource Planning and Decision Making. Boca Raton, FL: Lewis Publishers.
Oswalt, C. M., S. N. Oswalt, T. G. Johnson, C. Brandeis, K. C. Randolph, and C. R. King. 2012. Tennessee’s Forests, 2009. Res. Bull. SRS-189. Asheville, NC: US Department of Agriculture, Forest Service, Southern Research Station. 136 p.
Oswalt, S. N., W. B. Smith, P. D. Miles, and S. A. Pugh. 2014. Forest resources of the United States, 2012: A technical document supporting the Forest Service update of the 2010 RPA assessment. Gen. Tech. Rep. WO-91. Washington, DC: US Department of Agriculture, Forest Service. 218 p.
Pacala, S. W., G. C. Hurtt, D. Baker, P. Peylin, R. A. Houghton, R. A. Birdsey, L. Heath, E. T. Sundquist, R. F. Stallard, P. Ciais, P. Moorcroft, J. P. Caspersen, E. Shevliakova, B. Moore, G. Kohlmaier, E. Holland, M. Gloor, M. E. Harmon, S.-M. Fan, J. L. Sarmiento, C. L. Goodale, D. Schimel, and C. B. Field. 2001. Consistent land- and atmostphere-based US carbon sink estimates. Science 292: 2316-2320. https://doi.org/10.1126/science.1057320.
Pan, Y., R. A. Birdsey, J. Fang, R. Houghton, P. E. Kauppi, W. A. Kurz, O. L. Phillips, A. Shvidenko, S. L. Lewis, J. G. Canadell, P. Ciais, R. B. Jackson, S. Pacala, A. D. McGuire, S. Piao, A. Rautiainen, S. Sitch, and D. Hayes. 2011. A large and persistent carbon sink in the world’s forests. Science 333: 988-993. https://doi.org/10.1126/science.1201609.
Paradis, A., J. Elkinton, K. Hayhoe, and J. Buonaccorsi. 2006. Role of winter temperature and climate change on the survival and future range expansion of the hemlock woolly adelgid (Adelges tsugae) in eastern North America. Mitigation and Adaptation Strategies for Global Change: doi: 10.1007/s11027-007-9127-0.
Poorter, H.C., and M.L. Navas. 2003. Plant growth and competition at elevated CO2: On winners, losers, and functional groups. New Phytologist 157: 175-198.
Prasad, A.M., L.R. Iverson, S. Matthews, and M. Peters. 2007-ongoing. A Climate Change Atlas for 134 Forest Tree Species of the Eastern United States [database]. USDA Forest Service, Northern Research Station, Delaware, OH. http://www.nrs.fs.fed.us/atlas/tree (accessed June 18, 2015).
Smith, J. E., L. S. Heath, and C. M. Hoover. 2013. Carbon factors and models for forest carbon estimates for the 2005-2011 National Greenhouse Gas Inventories of the United States. Forest Ecology and Management 307: 7-19. http://dx.doi.org/10.1016/j.foreco.2013.06.061.
Southern Group of State Foresters – Issue Paper. Forest Parcelization and Fragmentation (or Fractured Forests). June 2007.
Stanturf, J.A., and S.L. Goodrick. 2013. Chapter 17: Forests. In. D.N. Wear and J.G. Greis (eds.). The Southern Forest Futures Project. Technical Report. USDA Forest Service, Southern Research Station, Ashville, N.C.: 509-542.
Tennessee Division of Water Pollution Control. 2000. Tennessee Ecoregion Project 1994-1999. Tennessee Department of Environment and Conservation.
Tennessee State Wildlife Action Plan Team. 2015. Tennessee State Wildlife Action Plan 2015. Tennessee Wildlife Resources Agency. Nashville, TN.
Tennessee Wildlife Resources Agency. 2005. Tennessee’s Comprehensive Wildlife Conservation Strategy. Tennessee Wildlife Resources Agency.
USDA Forest Service, Forest Inventory and Analysis Program. June 1-24, 2020. Forest Inventory EVALIDator web-application Version 1.8.0.01. St. Paul, MN: US Department of Agriculture, Forest Service, Northern Research Station. [Available only on internet: http://apps.fs.usda.gov/Evalidator/evalidator.jsp]
US Department of Agriculture, Soil Conservation Science. 1981. Land resource regions and major land resource areas of the United States. Agriculture Handbook 296. 156 p.
US Environmental Protection Agency. 1997. Level III ecoregions of the continental United States (revision of Omernik 1987). Corvallis, OR: US Environmental Protection Agency, National Health and Environmental Effects Research Laboratory Map M-1, various scales.

a a136
ReferencesUS Forest Service. 2015. Who owns America’s trees, woods, and forests? Results from the US Forest Service 2011-2013 national woodland owner survey. NRS-INF-31-15. Newtown Square, PA: US Department of Agriculture, Forest Service, Northern Research Station. 12 p.
Weidner, E., and A. Todd. 2011. From the Forest to the Faucet: Drinking Water and Forests in the US, Methods Paper. Washington, DC: US Department of Agriculture Forest Service, State and Private Forestry, Ecosystem Services and Markets Program Area.
Wiken, E. 1986. Terrestrial ecozones of Canada. Ottawa: Environment Canada, Ecological Land Classification Series no. 19. 26 p.
Wilson, B. T., A. J. Lister, and R. I. Riemann. 2012. A nearest-neighbor imputation approach to mapping tree species over large areas using forest inventory plots and moderate resolution raster data. Forest Ecology and Management 271: 182-198.
Wilson, B. T., C. W. Woodall, and D. M. Griffith. 2013. Forest carbon stocks of the contiguous United States (2000-2009). Newtown Square, PA: US Department of Agriculture, Forest Service, Northern Research Station. https://doi.org/10.2737/RDS-2013-0004.
Yang, L., S. Jin, P. Danielson, C. Homer, L. Gass, S. M. Bender, A. Case, C. Costello, J. Dewitz, J. Fry, M. Funk, B. Granneman, G. C. Liknes, M. Rigge, and G. Xian. 2018. A new generation of the United States National Land Cover Database: Requirements, research priorities, design, and implementation strategies. ISPRS Journal of Photogrammetry and Remote Sensing 146: 108-123. https://doi.org/10.1016/j.isprsjprs.2018.09.006.
Zhang, D., Butler, B.J. and Nagubadi, R.V., 2012. Institutional timberland ownership in the US South: magnitude, location, dynamics, and management. Journal of Forestry, 110(7), pp.355-361.

a a137
ReferencesData Citations
Anderson, M. G., A. Barnett, M. Clark, J. Prince, A. Olivero Sheldon, and B. Vickery. 2016. Resilient and Connected Landscapes for Terrestrial Conservation. The Nature Conservancy, Eastern Conservation Science, Eastern Regional Office. Boston, MA.
Belyea, C. M., and A. J. Terando. 2017. Urban growth modeling for the SAMBI designing sustainable landscapes project. Biodiversity and Spatial Information Center, North Carolina State University. Available online at www.basic.ncsu.edu/dsl/urb.html. [Original data developed by Dr. Keith C. Clarke, University of California, Santa Barbara, Department of Geography; Modified by David I. Donato, US Geological Survey, Eastern Geographic Science Center.]
Butler, B. J., J. H. Hewes, B. J. Dickinson, K. Andrejczyk, S. M. Butler, and M. Markowski-Lindsay. 2016. USDA Forest Service National Woodland Owner Survey: National, regional, and state statistics for family forest and woodland ownerships with 10+ acres, 2011-2013. Res. Bull. NRS-99. Newtown Square, PA: US Department of Agriculture, Forest Service, Northern Research Station. 39 p.
Butler, Brett J.; Miles, Patrick D.; Hansen, Mark H. Tue Jul 21 14:44:12 UTC 2020. National Woodland Owner Survey Table Maker web-application version 2.0. Amherst, MA: US Department of Agriculture, Forest Service, Northern Research Station. [Available only on internet: http://fiatools.fs.fed.us/NWOS/tablemaker.jsp] sessionid=4C9972A1310AA17521A0D18E24A2F9B8
Butler, Brett J.; Butler, Sarah M. 2016. Family forest ownerships with 10+ acres in Tennessee, 2011-2013. Res. Note NRS-236. Newtown Square, PA: US Department of Agriculture, Forest Service, Northern Research Station. 2 p. http://dx.doi.org/10.2737/NRS-RN-236.
Ducks Unlimited and The Trust for Public Land. National Conservation Easement Database, December 18, 2019. Available online at https://www.conservationeasement.us/
Forest Health Protection. 2019. National Insect and Disease Composite Risk Map, 2018 Update. Digital Data. Fort Collins, CO: US Department of Agriculture, Forest Service, Forest Health Assessment and Applied Sciences Team.
Housing Density for the Conterminous USA, Integrated Climate and Land-Use Scenarios, v1.3. 2010. Washington, DC: US Environmental Protection Agency Office of Research and Development, National Center for Environmental Assessment, Global Change Research Program.
Impervious Surface Scenarios for the Conterminous USA, Integrated Climate and Land-Use Scenarios, v1.3. 2010. Washington, DC: US Environmental Protection Agency Office of Research and Development, National Center for Environmental Assessment, Global Change Research Program.
Southern Group of State Foresters. 2010. Wildland Urban Interface Risk Index, Southern Wildfire Risk Assessment Portal.
USDA Forest Service, Forest Inventory and Analysis Program, Tue Jul 21 14:47:49 GMT 2020. Forest Inventory EVALIDator web-application Version 1.8.0.01. St. Paul, MN: US Department of Agriculture, Forest Service, Northern Research Station. [Available only on internet: http://apps.fs.usda.gov/Evalidator/evalidator.jsp]
USDA Forest Service, Forest Inventory and Analysis Program, 2020. Forest Inventory EVALIDator web application Version 1.8.0.01. St. Paul, MN: US Department of Agriculture, Forest Service, Northern Research Station. [Available only on internet: http://apps.fs.usda.gov/Evalidator/evalidator.jsp]
US Geological Survey (USGS) Gap Analysis Project (GAP), 2018, Protected Areas Database of the United States (PAD-US): US Geological Survey data release, https://doi.org/10.5066.P955KPLE.Weidner, E., and A. Todd. 2011. Forest Importance to Surface Drinking Water. Forests to Faucets. Washington, DC: US Department of Agriculture Forest Service, State and Private Forestry, Ecosystem Services and Markets Program Area.
Yang, L., S. Jin, P. Danielson, C. Homer, L. Gass, S. M. Bender, A. Case, C. Costello, J. Dewitz, J. Fry, M. Funk, B. Granneman, G. C. Liknes, M. Rigge, and G. Xian. 2018. A new generation of the United States National Land Cover Database: Requirements, research priorities, design, and implementation strategies. ISPRS Journal of Photogrammetry and Remote Sensing 146: 108-123.

a a138
List of Figures & TablesFigures
Figure 1. A professional forester demonstrating how to measure a tree diameter. These types of measurements are key components to managing Tennessee’s forests and a simple way to educate the public on the value of collecting data to manage for forest health and resiliency (photo courtesy of Trish Johnson, TNC). � � � � � � � � � � � � � � � � � � 11
Figure 2. The Tennessee Division of Forestry administrative boundaries. � � � � � � � � � � 13
Figure 3. Ecoregions of Tennessee. � � � � � � � � � � � 15Figure 4. Percent of land area in forest land cover for
each county in Tennessee (National Land Cover Database 2016, from Yang et al. 2018). � � � � � � � � � � � � � � � � � � � � � � � � � � � 21
Figure 5. Parcelization and ownership dynamics in Tennessee based on 2020 parcel data from Tennessee Comptroller of the Treasury. � � 22
Figure 6. Forest type composition (USDA Forest Service, 2020). � � � � � � � � � � � � � � � � � � � � � � � 23
Figure 7. Area of forestland by stand-size class, 1989-2017 (USDA Forest Service, 2020). � � � � � 24
Figure 8. Average annual gross growth, harvest removals, mortality, and net change in sound bole volume (million cubic feet ± sampling error at 68% confidence) on forestland during the seventh (2004), eighth (2009), and current (2017) forest inventory periods. � � � � � � � 25
Figure 9. Net merchantable bole volume of live trees (at least 5-inch dbh/drc), in million cubic feet (± sampling error at 68% confidence), on timberland in Tennessee during the seventh (2004), eighth (2009), and current (2017) forest inventory periods. � � � � � � � � � � � � � � � 27
Figure 10. Distribution of stand-size classes on public and private timberland for the state of Tennessee and in 50-mile radius procurement areas for three hypothetical mills located in Decatur, Macon, and Warren counties. � � � 29
Figure 11. Distribution of stand-age classes on public and private timberland for the state of Tennessee and in 50-mile radius procurement areas for three hypothetical mills located in Decatur, Macon, and Warren counties. � � � 29
Figure 12. Net sawlog volume (± sampling error at 68% confidence) of tree grades of sawtimber-size (≥ 9 inches dbh for softwoods and ≥ 11 inches dbh for hardwoods) trees on public and private timberland for the state of Tennessee and in 50-mile radius procurement areas for three hypothetical mills located in Decatur, Macon, and Warren counties. � � � � � � � � 30
Figure 13. Average annual gross growth, harvest removals, mortality, and net change (± sampling error at 68% confidence) on public and private timberland in 50-mile radius procurement areas for three hypothetical mills located in Decatur, Macon, and Warren counties. � � � � � � � � � � � � � � � � � � � � � 31
Figure 14. Characteristics of private forest landowners (USDA, 2011-2013). � � � � � � � � � � � � � � � 33
Figure 15. Public forestland ownership in Tennessee. 35Figure 16. Map of protected forestlands in Tennessee,
showing demarcation by TDF districts. � � � 39Figure17. Map of insect and disease risk in Tennessee
as determined by the US Forest Service. � � 43Figure 20. A member of the TDF Prescribed Fire Strike
Team burning a field for wildlife objectives (photo courtesy of Jackie Broeker, TDF Strike Team Coordinator). � � � � � � � � � � � � � � � 46
Figure 21. Prescribed fire in Tennessee forest (photo courtesy of Katherine Medlock, TNC). � � � � 47
Figure 22. White oak seedling protected by a tree tube and planted to restore a riparian area (photo courtesy of TDF Area Forester Chris Carney). � � � � � � � � � � � � � � � � � � � � � � � � � � � 48
Figure 23. Private landowners meet on-site with a local forestry consulting firm on the opening day of the forest carbon inventory of their property (photo courtesy of Trish Johnson, TNC). � � 49
Figure 24. A mixed planting of white oak, shumard oak, and persimmon seedlings in Lincoln County (photo courtesy of TDF Area Forester Chris Carney). � � � � � � � � � � � � � � � � � � � � � � 51
Figure 25. Shortleaf pine and oak forest restoration project on TNC’s Bridgestone Nature Reserve at Chestnut Mountain, White County--left photo, 2019; below photo, 2020 (photos courtesy of Terry Cook, TNC). � � � � � � � � � 52
Figure 26. Primary wood-using mills in Tennessee. � 54

a a139
List of Figures & TablesFigure 27. Percent of total board feet in each tree grade
category for two decades of Forest Inventory and Analysis data collection around a Tennessee sawmill in the Cumberland District. � � � � � � � � � � � � � � � � � � � � � � � � � � � 56
Figure 28. Volume of timber, in each tree grade category for two decades of Forest Inventory and Analysis data collection around a Tennessee sawmill in the Cumberland District. � � � � � 57
Figure 29. TDA staff pictured with Senator Steve Southerland and Agriculture Enterprise Fund recipient Northeast Forest Products, LLC. � 58
Figure 30. Tennessee conservationists viewing results of restoration on the South Zone of the Cherokee National Forest. � � � � � � � � � � � � � � � � � 60
Figure 31. Active pine harvesting operation at Stinging Forks Natural Area, Tennessee (photo courtesy of Jason Miller, TDEC). � � � � � � � � � � � � � 61
Figure 32. Primary mills in proximity to protected lands. Raw material can be sourced both from private property (white space) or from protected lands where timber harvesting can occur. � � � � � 62
Figure 33. Percentage of ownership and percentage of area of family forests in Tennessee. � � � � � 64
Figure 34. Three urbanization/fragmentation layers were analyzed to determine the threat of development in woodshed counties. � � � � 66
Figure 35. Probability of urbanization by 2030 based on SLEUTH projections. � � � � � � � � � � � � � � 67
Figure 36. Map of impervious surface stress index projected at 2030 in Tennessee. � � � � � � � 69
Figure 37. Composite map indicating areas of high development in the next 10 years in Tennessee. � � � � � � � � � � � � � � � � � � � � 70
Figure 38. Scenic overlook on The Nature Conservancy’s Cumberland Forest Project (photo courtesy of Byron Jorjorian). � � � � � � � � � � � � � � � � � 72
Figure 39. Green infrastructure reforestation project in Gallatin, 2015 (photo courtesy of Jennifer Watson, Stormwater Coordinator, Gallatin, Tennessee). � � � � � � � � � � � � � � � � � � � � 73
Figure 40. Fire occurrences in Tennessee from 2007 to 2017. � � � � � � � � � � � � � � � � � � � � � � � � 74
Figure 41. Wildland Urban Interface Risk Index in Tennessee by TDF District Boundaries. � � 77
Figure 42. Map of Community Wildfire Protection Plans in Tennessee.� � � � � � � � � � � � � � � � � � � 78
Figure 43. City of Newport communication tower protection project (photo courtesy of Cliff King, Forestry Technician, TDF). � � � � � � � � � � � 80
Figure 44. Topographic representation illustrating the site of the Newport city communication tower protection project. � � � � � � � � � � � � � � � 80
Figure 45. Fire Adapted Community checklist. � � � � � 81Figure 46. Composite map highlighting priority forest
landscapes in Tennessee. � � � � � � � � � � � 82Figure 47. Importance of forest to surface drinking water
in Tennessee.� � � � � � � � � � � � � � � � � � � 85Figure 48. Total forest carbon stocking (metric tonnes
of carbon/ ha) in Tennessee based on Forest Inventory and Analysis data, MODIS satellite imagery, and ancillary datasets (Wilson et al. 2012, Smith et al. 2013). � � � � � � � � � � � � 87
Figure 49. The Nature Conservancy’s Resilient and Connected Prioritized Network in Tennessee. � � � � � � � � � � � � � � � � � � � � � � � � � � � 89
Figure 50. Matrix indicating the resources needed by the State Forester to achieve the objectives, strategies and goals of the FAP. � � � � � � � 90
Figure 51. USFS map of counties infested with Hemlock Woolly Adelgid. � � � � � � � � � � � � � � � � � 92
Figure 52. Distribution of counties with Laurel Wilt Disease by year of initial detection. � � � � � 93
Figure 53. Map of counties that are under quarantine for Gypsy Moth. � � � � � � � � � � � � � � � � � � � 94
Figure 54. Map of counties that are under quarantine for Emerald Ash Borer. � � � � � � � � � � � � � � 95
Figure 55. USFS Forest Inventory and Analysis map of subplots containing invasive plants and estimated invasion-intensity. (https://www.srs.fs.usda.gov/compass/2016/01/05/a-big-picture-view-of-the-invasive-plant-problem/) 96
Figure 56. The Southeastern Conservation Adaptation Strategy’s Southeast Blueprint. � � � � � � � � 101
Figure 57. Tennessee counties where USFS Stewardship activities will be reimbursable. � � � � � � � � 119
Figure 58. Forest Legacy 2020 Priority Areas. � � � � 126

a a140
List of Figures & TablesTables
Table 1. Area by land class between 1961 and 2017 (thousand acres). � � � � � � � � � � � � � � � � 20
Table 2. Summary of forested area, ownership, and parcelization patterns, and forest conditions on timberland for three hypothetical mill sites in Decatur, Macon, and Warren counties. � 28
Table 3. Area (rounded to the nearest 100 acres) at risk of losing at least 25 percent of standing live basal area greater than one inch in diameter in the period 2013-2027 if remediation action is not taken (National Insect and Disease Risk Map, 2018 Update). � � � � � � � � � � � � � � 43
Table 4. Wood using mills in Tennessee by type and administrative boundary. � � � � � � � � � � � 55
Table 6. Projections of land area (acres) in five classes of the Impervious Surface Stress Index at year 2030. Stress Index classes are defined by percent area in impervious surface. � � � � 68
Table 7. Area (rounded to the nearest 100 acres) in Wildland-Urban Interface (WUI) risk index classes in each of TDF’s district boundaries. 76
Table 8. Forest area (round to the nearest 100 acres) classified in Forests to Faucet’s forest importance to surface drinking water, summarized by TDF’s District boundaries. � 84
Table 9. Land area (acres, percent) of The Nature Conservancy’s Resilient and Connected Prioritized Network (Figure 49) that occurs in each of TDF’s administrative areas, and the extent to which the Network is currently protected (i.e., included in Protected Areas Database-US [PAD-US] or National Conservation Easement Database [NCED]). Acreage is rounded to the nearest 100 acres. 88
Table 10. Alignment of the Tennessee 2020 FAP programmatic priorities with the Southeast Conservation Adaptation Strategy’s Southeast Blueprint. � � � � � � � � � � � � � � � � � � � � � 102
Table 11. Area (acres, percent) of National Land Cover Database 2016 cover classifications in Tennessee. Forested land classes are in bold. Acreage is rounded to the nearest 100 acres. � � � � � � � � � � � � � � � � � � � � � � � � � � � 107
Table 12. Total area (acres, percent) in Protected Areas Database-US (PAD-US) by landowner type and GAP Status. Acreage is rounded to the nearest 100 acres. � � � � � � � � � � � � � � � � � � � � � 109
Table 13. Forested area (acres, percent) in Protected Areas Database-US (PAD-US) by landowner type and GAP Status. Acreage is rounded to the nearest 100 acres. � � � � � � � � � � � � � 110
Table 14. Area (rounded to nearest 100 acres) of land cover types under conservation easement in Tennessee. Land cover types are derived from National Land Cover Database 2016 (Yang et al. 2018). � � � � � � � � � � � � � � � � � � � � � � 112
Table 15. Total land area and forestland area (rounded to the nearest 100 acres) of conservation easements by easement holder and ownership in Tennessee recorded in the National Conservation Easement Database. � � � � � 113
Table 16. Area (rounded to the nearest 100 acres) at risk of losing at least 25 percent of standing live basal area greater than one inch in diameter in the period 2013-2027 if remediation action is not taken (National Insect and Disease Risk Map, 2018 Update). � � � � � � � � � � � � � � � 114
Table 17. Probability of urbanization of current land area (rounded to the nearest 100 acres) at 2030 compared to baseline estimate of urbanized area in 2010. Tennessee encompasses approximately 26,971,400 acres.� � � � � � � 115
Table 18. Projections of land area (acres) in five classes of the Impervious Surface Stress Index at year 2030. Stress Index classes are defined by percent area in impervious surface. � � � � 116
Table 19. Area (rounded to the nearest 100 acres) in Wildland-Urban Interface (WUI) Risk Index classes in each of Tennessee Division of Forestry’s administrative areas. � � � � � � � 117
Table 20. Land area (rounded to the nearest 100 acres) of Tennessee counties eligible for Forest Legacy Program funding. � � � � � � � � � � 127
Related Documents


