Ten years of GOME/ERS2 total ozone data—The new GOME data processor (GDP) version 4: 2. Ground-based validation and comparisons with TOMS V7/V8 D. Balis, 1 J.-C. Lambert, 2 M. Van Roozendael, 2 R. Spurr, 3 D. Loyola, 4 Y. Livschitz, 4 P. Valks, 4 V. Amiridis, 1 P. Gerard, 2 J. Granville, 2 and C. Zehner 5 Received 15 June 2005; revised 24 February 2006; accepted 24 August 2006; published 7 April 2007. [1] The atmospheric chemistry instrument Global Ozone Monitoring Experiment (GOME) was launched in April 1995 on the ERS-2 platform. The GOME data processor (GDP) operational retrieval algorithm has produced total ozone columns since July 1995. With a data record of over ten years, GOME has become important for ozone trend analysis. In 2004, GDP was upgraded to version 4.0, a new validation was performed, and the entire GOME data record was reprocessed. In the preceding paper (Van Roozendael et al., 2006), the GDP 4.0 algorithm was described. In this paper, we deal with geophysical validation of the GDP 4.0 algorithm and the retrieved ozone products. We present results of a validation exercise involving comparisons of GDP 4.0 total ozone with the Network for Detection of Stratospheric Change (NDSC) and the World Meteorological Organization (WMO)/Global Atmospheric Watch (GAW) ground- based networks. We compare these results with similar validations of earlier GDP ozone products. We also present ground-based validation of TOMS versions 7 and 8 total ozone products, and we contrast these with GDP 4.0 values. On a global basis, GDP 4.0 total ozone results lie between 1% and +1.5% of ground-based values for solar zenith angles less than 70°; accuracy is now comparable to that obtainable from ground-based stations. At higher solar zenith angles in polar regions, larger discrepancies of up to +5% are found; in these regimes, errors on both satellite and ground-based measurements are higher. The validation also showed marked improvement in TOMS total ozone performance for the version 8 algorithm. Citation: Balis, D., et al. (2007), Ten years of GOME/ERS2 total ozone data—The new GOME data processor (GDP) version 4: 2. Ground-based validation and comparisons with TOMS V7/V8, J. Geophys. Res., 112, D07307, doi:10.1029/2005JD006376. 1. Introduction 1.1. GOME Operation and Data Processor [2] The Global Ozone Monitoring Experiment (GOME) is one of several instruments on board the European Remote Sensing Satellite-2 (ERS-2), launched in April 1995. GOME is the successful predecessor of a number of new generation atmospheric chemistry sensors; these include Scanning Imaging Absorption Spectrometer for Atmospheric Cartography (SCIAMACHY) [Bovensmann et al., 1999], launched in 2002 as part of the Environmental Satellite (ENVISAT) payload, the Ozone Monitoring Instrument (OMI) on board the NASA’s Aura platform launched in July 2004 [Stammes et al., 1999], and the GOME-2 series of instruments, the first of which was launched in October 2006 on board the Meteorological Operational (METOP) platform. The primary aim of these atmospheric chemistry instruments is to provide global measurements of key ozone-related species for the assessment of current and future changes in atmospheric composition and chemistry atmosphere [Burrows et al., 1999]. GOME provides a global picture of atmospheric ozone (O 3 ); it is also the first orbiting instrument with the ability to measure the vertical column amount of nitrogen dioxide (NO 2 ). [3] GOME on ERS-2 is an across-track nadir-viewing spectrometer with four linear array detectors covering the spectral range 240 – 793 nm and with resolutions from 0.2 to 0.4 nm. The satellite has a sun-synchronous polar orbit at height 790 km, and the instrument swath is 960 km, with three forward scans (footprint 320 40 km 2 ) in nominal viewing mode. For the correction of polarization effects and for use in cloud fraction determination, GOME also has three broadband detectors (PMDs or Polarization Measure- ment Devices) measuring at subpixel read-out times. For more details on the GOME instrument, see the GOME Users Manual [ESA, 1995]. Since August 1996, GOME total O 3 and NO 2 column data have been processed with the JOURNAL OF GEOPHYSICAL RESEARCH, VOL. 112, D07307, doi:10.1029/2005JD006376, 2007 Click Here for Full Articl e 1 Aristotle University of Thessaloniki, Thessaloniki, Greece. 2 Belgian Institute for Space Aeronomy, Brussels, Belgium. 3 RT Solutions, Incorporated, Cambridge, Massachusetts, USA. 4 German Aerospace Center (DLR), Remote Sensing Technology Institute (IMF), Wessling, Germany. 5 European Space Agency Centre for Earth Observation (ESA/ESRIN), Frascati, Italy. Copyright 2007 by the American Geophysical Union. 0148-0227/07/2005JD006376$09.00 D07307 1 of 17

Welcome message from author
This document is posted to help you gain knowledge. Please leave a comment to let me know what you think about it! Share it to your friends and learn new things together.
Transcript
Ten years of GOME/ERS2 total ozone data—The new GOME data
processor (GDP) version 4:
2. Ground-based validation and comparisons with TOMS V7/V8
D. Balis,1 J.-C. Lambert,2 M. Van Roozendael,2 R. Spurr,3 D. Loyola,4 Y. Livschitz,4
P. Valks,4 V. Amiridis,1 P. Gerard,2 J. Granville,2 and C. Zehner5
Received 15 June 2005; revised 24 February 2006; accepted 24 August 2006; published 7 April 2007.
[1] The atmospheric chemistry instrument Global Ozone Monitoring Experiment(GOME) was launched in April 1995 on the ERS-2 platform. The GOME data processor(GDP) operational retrieval algorithm has produced total ozone columns sinceJuly 1995. With a data record of over ten years, GOME has become important for ozonetrend analysis. In 2004, GDP was upgraded to version 4.0, a new validation wasperformed, and the entire GOME data record was reprocessed. In the preceding paper(Van Roozendael et al., 2006), the GDP 4.0 algorithm was described. In this paper, wedeal with geophysical validation of the GDP 4.0 algorithm and the retrieved ozoneproducts. We present results of a validation exercise involving comparisons of GDP 4.0total ozone with the Network for Detection of Stratospheric Change (NDSC) and theWorld Meteorological Organization (WMO)/Global Atmospheric Watch (GAW) ground-based networks. We compare these results with similar validations of earlier GDP ozoneproducts. We also present ground-based validation of TOMS versions 7 and 8 total ozoneproducts, and we contrast these with GDP 4.0 values. On a global basis, GDP 4.0total ozone results lie between �1% and +1.5% of ground-based values for solar zenithangles less than 70�; accuracy is now comparable to that obtainable fromground-based stations. At higher solar zenith angles in polar regions, larger discrepanciesof up to +5% are found; in these regimes, errors on both satellite and ground-basedmeasurements are higher. The validation also showed marked improvement in TOMS totalozone performance for the version 8 algorithm.
Citation: Balis, D., et al. (2007), Ten years of GOME/ERS2 total ozone data—The new GOME data processor (GDP) version 4:
2. Ground-based validation and comparisons with TOMS V7/V8, J. Geophys. Res., 112, D07307, doi:10.1029/2005JD006376.
1. Introduction
1.1. GOME Operation and Data Processor
[2] The Global Ozone Monitoring Experiment (GOME)is one of several instruments on board the European RemoteSensing Satellite-2 (ERS-2), launched in April 1995.GOME is the successful predecessor of a number of newgeneration atmospheric chemistry sensors; these includeScanning Imaging Absorption Spectrometer for AtmosphericCartography (SCIAMACHY) [Bovensmann et al., 1999],launched in 2002 as part of the Environmental Satellite(ENVISAT) payload, the Ozone Monitoring Instrument(OMI) on board the NASA’s Aura platform launched inJuly 2004 [Stammes et al., 1999], and the GOME-2 series of
instruments, the first of which was launched in October2006 on board the Meteorological Operational (METOP)platform. The primary aim of these atmospheric chemistryinstruments is to provide global measurements of keyozone-related species for the assessment of current andfuture changes in atmospheric composition and chemistryatmosphere [Burrows et al., 1999]. GOME provides aglobal picture of atmospheric ozone (O3); it is also the firstorbiting instrument with the ability to measure the verticalcolumn amount of nitrogen dioxide (NO2).[3] GOME on ERS-2 is an across-track nadir-viewing
spectrometer with four linear array detectors covering thespectral range 240–793 nm and with resolutions from 0.2 to0.4 nm. The satellite has a sun-synchronous polar orbit atheight �790 km, and the instrument swath is 960 km, withthree forward scans (footprint 320 � 40 km2) in nominalviewing mode. For the correction of polarization effects andfor use in cloud fraction determination, GOME also hasthree broadband detectors (PMDs or Polarization Measure-ment Devices) measuring at subpixel read-out times. Formore details on the GOME instrument, see the GOMEUsers Manual [ESA, 1995]. Since August 1996, GOMEtotal O3 and NO2 column data have been processed with the
JOURNAL OF GEOPHYSICAL RESEARCH, VOL. 112, D07307, doi:10.1029/2005JD006376, 2007ClickHere
for
FullArticle
1Aristotle University of Thessaloniki, Thessaloniki, Greece.2Belgian Institute for Space Aeronomy, Brussels, Belgium.3RT Solutions, Incorporated, Cambridge, Massachusetts, USA.4German Aerospace Center (DLR), Remote Sensing Technology
Institute (IMF), Wessling, Germany.5European Space Agency Centre for Earth Observation (ESA/ESRIN),
Frascati, Italy.
Copyright 2007 by the American Geophysical Union.0148-0227/07/2005JD006376$09.00
D07307 1 of 17
GOME data processor [Loyola et al., 1997] at the GermanProcessing and Archiving Facility (D-PAF) established atthe German Aerospace Centre (DLR) on behalf of theEuropean Space Agency (ESA).[4] GOME has now been producing global distributions
of total ozone for ten years. The length and the long-termstability of this data record make it desirable for use in long-term ozone trend monitoring. Following the ESA’s call insummer 2002 for improved GOME total ozone algorithmsto meet trend analysis accuracy and stability requirements,three new Differential Optical Absorption Spectroscopy(DOAS)–based algorithms were developed to reprocessthe GOME total ozone record. These algorithms are (1) theWFDOAS algorithm [Coldewey-Egbers et al., 2005; Weberet al., 2005]; (2) the TOGOMI/TOSOMI algorithm [Eskeset al., 2005]; and (3) the GDOAS algorithm (this work).GDOAS was implemented operationally in the D-PAF atDLR. This GDOAS implementation has become GDP 4.0(version 4.0 of the GOME data processor). A description ofthe GDP 4.0 GDOAS algorithm was given in the precedingpaper [Van Roozendael et al., 2006].[5] The GOME data processing environment at D-PAF
was replaced recently by a fully redesigned system calledthe ‘‘Universal Processor for UV/visible Atmospheric Spec-trometers’’ (UPAS). The greater flexibility of the UPASenvironment has facilitated the implementation, verificationand validation of the new GDP 4.0 operational total columnretrieval algorithm. The complete reprocessing of the entireGOME total ozone record was finished in December 2004,and the reprocessed GOME data record, including historicaldata, is already available to the public via the ERS Help andOrder Desk.
1.2. Summary of the GDP 4.0 Algorithm
[6] In this section, we summarize the GDP 4.0 algorithm;more details are given by Van Roozendael et al. [2006]. Weshall also refer to the predecessor GDP 3.0 algorithm foroperational total column products; a description and vali-dation summary may be found in [Spurr et al., 2005].GDP 4.0 is a DOAS retrieval algorithm, comprising a leastsquares fitting for the slant column of ozone followed by anAir Mass Factor (AMF) computation to derive thecorresponding vertical column amount.[7] In addition to the ozone slant column, the DOAS part
of the algorithm also retrieves an effective temperature tocharacterize the Huggins-bands ozone absorption tempera-ture dependence, and two fitting amplitudes correspondingto additive reference spectra for undersampling andFraunhofer filling-in (Ring) effect [Van Roozendael et al.,2006, section 2.2]. There is also an explicit shift andsqueeze fitting to improve the wavelength registration ofthe earthshine radiance spectrum, plus an additional cross-correlation for the Level 1b irradiance spectrum in theregion of the DOAS fitting window (325–335 nm).[8] GDP 4.0 uses an iterative computation for the AMF
and vertical column density VCD, with the radiative transfercalculations based on the use of a column classified ozoneprofile climatology. This method was first used in GDP 3.0,where neural network functions were employed to deliverthe AMFs at 325.0 nm. In GDP 4.0, AMFs are calculateddirectly with calls to a radiative transfer model. Also inGDP 4.0, the improved TOMS version 8 ozone profile
climatology (P. K. Bhartia and C. Wellemeyer, TOMSversion 8 Algorithm Theoretical Basis Document, availableat http://toms.gsfc.nasa.gov, 2004-11-24, hereinafterreferred to as Bhartia and Wellemeyer, 2004) was used inplace of the version 7 data set for GDP 3.0, and the AMFswere calculated at 325.5 nm (the use of this wavelength hasimproved total ozone accuracy [see Van Roozendael et al.,2006, Figure 5]).[9] Perhaps the most important change from GDP 3.0 to
GDP 4.0 has been the introduction of a completely newalgorithm component to deal with the telluric filling-ininterference effects in ozone absorption signatures causedby inelastic rotational Raman scattering (RRS). This ‘‘mo-lecular Ring correction’’ generates a scaling on the effectiveslant column at each AMF/VCD iteration. It has resulted ina dramatic improvement in accuracy [Van Roozendael et al.,2006, section 4, Figure 6]. New parameterizations of themolecular Ring effect contribution were also incorporated inthe other two algorithms used for GOME total ozonereprocessing [Coldewey-Egbers et al., 2005; Eskes et al.,2005].[10] Last, a new cloud preprocessing step has been
introduced in GDP 4.0 for the treatment of clouds in theindependent pixel approximation (IPA). This replaces theGDP 3.0 system, which relied on databased selections ofcloud top albedo and height, and only retrieved the cloudfraction. In GDP 4.0 there are two new algorithms; the first(OCRA) uses data fusion techniques to derive the cloudfraction from the subpixel PMD measurements, while thesecond (ROCINN) derives the required cloud top informa-tion from the spectral fitting of reflectivity in and around theOxygen A band. For details, see Van Roozendael et al.[2006, section 5].[11] Improvements in total ozone accuracy were dis-
cussed by Van Roozendael et al. [2006] for a limitednumber of orbits, and a number of sensitivity tests werecarried out [Van Roozendael et al., 2006, section 6]. Animportant requirement for trend analysis is the lack ofdrift in the ozone record, and this has been a remarkablefeature of the GOME record. This point was given by VanRoozendael et al. [2006] (see, e.g., Figure 11). In the presentpaper we will present a thorough documentation of theimprovement in the accuracy of the new GDP 4.0 total ozoneproduct. This validation will be based on detailed comparisonswith ground-based networks and with results from the TOMSversion 7 and 8 algorithms for total ozone.
1.3. Introduction to the GDP 4.0 Delta Validation
[12] Prior to the implementation of any major change inthe operational GDP processing chain, it is essential toverify the accuracy and effectiveness of new modificationsand to assess the quality of the new data product. Such‘‘Delta Validations’’ of putative product improvementshave been executed after every major GDP upgrade by asubgroup of the GOME Validation Group responsible forthe investigation of GOME data product quality throughoutthe mission lifetime. In the context of the present GDPupgrade to version 4.0, a delta validation campaign was setup in 2004 with the main emphasis on the quality assess-ment of new ozone column amounts on the global scale andin the long term. The nitrogen dioxide (NO2) columnproduct has also been reprocessed. The GDP 4.0 validation
D07307 BALIS ET AL.: GDP 4 TOTAL OZONE VALIDATION
2 of 17
D07307
effort involved a team of scientists from the BelgianInstitute for Space Aeronomy (IASB-BIRA, Brussels,Belgium), the Laboratory of Atmospheric Physics (AUTH,Aristotle University of Thessaloniki, Greece), and DLR’sRemote Sensing Technology Institute (DLR-IMF, Oberp-faffenhofen, Germany).[13] Ground-based data have been compared with various
versions of GOME and TOMS satellite data: GDP 2.7,GDP 3.0, GDP 4.0, and TOMS versions 7 and 8 providedby NASA/GSFC. In the ground-based validation forGDP 2.7 total ozone [Lambert et al., 1999, 2000], therewere a number of marked dependencies in the total columndifferences on the season, the solar zenith angle, the ozonecolumn value itself, and the latitude. Validation of theGDP 3.0 total ozone product revealed that the ozone columndependence had nearly disappeared and the amplitudes ofthe other dependencies were reduced by about 50% onaverage [Lambert et al., 2002; Spurr et al., 2005]. WithTOMS V7 ozone product validation, seasonally varyingerrors showed lower amplitude, but a systematic offsetaffected the whole Southern Hemisphere, increasing withlatitude from a few percent in the Tropics to about 10% inAntarctica [Lambert et al., 2000]. Ozone column depen-dence was also found in TOMS V7. Effects of instrumentaldegradation were noted with both TOMS V7 and GDP 2.7,but these were corrected with GDP 3.0.[14] This paper describes the main results for total ozone
column validation from the GDP 4.0 Delta ValidationCampaign in 2004. The new GDP 4.0 total ozone productis characterized first by comparison with correlativemeasurements from extensive ground-based networksarchived in theWorld Ozone and UVData Center (WOUDC)operated at Toronto (Canada), and in the database of theNetwork for the Detection of Stratospheric Change (NDSC)operated at NOAA (National Oceanic and AtmosphericAdministration) and mirrored at NILU (Norwegian Institutefor Air Research). Secondly, a similar characterization isperformed for the Earth Probe (EP) TOMS total ozoneoverpass products as available from NASA Goddard SpaceFlight Center (GSFC), and the results compared with thosefrom GDP 4.0. Although the choice of GOME validationorbits is oriented toward validating the ten-year ozone recordfrom GDP 4.0, the advent of a recent major upgrade of theTOMS BUV total ozone algorithm gives us a unique oppor-tunity to extend the GDP 4.0 validation with a series ofcomparisons against TOMS data.[15] In chapter 2, we discuss the reference data sets used
for the GDP 4.0 delta validation, the selection procedure forground-based stations (section 2.1), the GOME orbitschosen for the exercise (section 2.2) and a summary ofthe TOMS measurements selected for the intercomparisons(section 2.3). In section 3 we deal with uncertainties inground-based data that might impact the validation ofsatellite ozone columns. Section 4 contains the validationresults. In section 4.1, we present results from test casestudies at an NDSC Alpine station and use them to illustratehow validation at the ‘‘percent level’’ is made feasibleowing to the integrated exploitation of complementarymeasurement types (Brewer and Dobson). We demonstratethe large-scale capability of ground-based networks toinvestigate major characteristics of the GDP 4.0 and TOMSV8 total ozone products in terms of global agreement
(section 4.2), seasonal dependency (section 4.3) and long-term stability (section 4.4). The remaining part of section 4focuses on the major dependencies due to solar zenith angle(section 4.5), total ozone column, especially in ozonehole scenarios (section 4.6), and fractional cloud cover(section 4.7).[16] Much more information is available in the GDP 4.0
Validation Report produced in December 2004 [Lambertand Balis, 2004]. This report may be downloaded from theWeb page http://wdc.dlr.de/sensors/gome/gdp4.html (under"GDP 4.0 Validation"), which accompanies this paper and itspredecessor [Van Roozendael et al., 2006]. Older validationdocumentation may also be downloaded from this site.
2. Selection of Validation Data Sets
2.1. Ground-Based Correlative Data Sets
[17] The present study is based on archived total ozonemeasurements provided by two major contributors to WorldMeteorological Organization (WMO)/Global AtmosphericWatch (GAW): Dobson and Brewer total ozone datarecords, as deposited at the WOUDC in Toronto, Canada(http://www.woudc.org); and UV-visible DOAS, Dobsonand Brewer total ozone data records acquired as part of theNDSC (public archive available via http://www.ndsc.ws).The WOUDC contains total ozone data mainly fromDobson and Brewer UV spectrophotometers and fromM-124 UV filter radiometers. The NDSC database containstotal ozone data from DOAS UV-visible and Fourier Trans-form infrared spectrometers, plus Dobson and Brewerinstruments at selected stations that routinely upload theirpreliminary data to WOUDC. In general, coincidencesoffered by the Dobson, Brewer and UV-visible networkswith the list of validation orbits are sufficient to investigatethe effects of the current GDP upgrade. For this and otherreasons (sparser records, fewer coincidences, some biases),ground-based measurements performed with FTIR spec-trometers and with M-124 radiometers have not beenconsidered in the GDP 4.0 total ozone validation. Totalozone data from a large number of the WOUDC and NDSCstations have already been used extensively both for trendstudies [e.g., WMO, 1998, 2003] as well as for validation ofsatellite total ozone data [e.g., Lambert et al., 1999; Fioletovet al., 1999; Lambert et al., 2000; Bramstedt et al., 2003;Labow et al., 2004].[18] To prepare ground-based data sets for GOME and
TOMS validation, we investigated the quality of the totalozone data of each station and instrument that depositeddata at NDSC and WOUDC for any periods during 1995–2004. We examined for each station a series of plots andstatistics based on GOME and TOMS comparisons. Asample of these plots is shown in Figure 1 for the Dobsonstation of Potsdam in Germany. Comparisons using directsun ultraviolet measurements, which offer a greateraccuracy (�1%) than those based on zenith-sky data, areperformed separately (Figure 1, right). For each station wechecked time series of the percent relative differences withthe satellite data on a daily basis (first row) and monthlymean basis (second and third rows), the distribution andscatter of these differences (fourth and fifth rows), andfinally the dependence of the difference on the solar zenithangle of the satellite observation for each season of the year
D07307 BALIS ET AL.: GDP 4 TOTAL OZONE VALIDATION
3 of 17
D07307
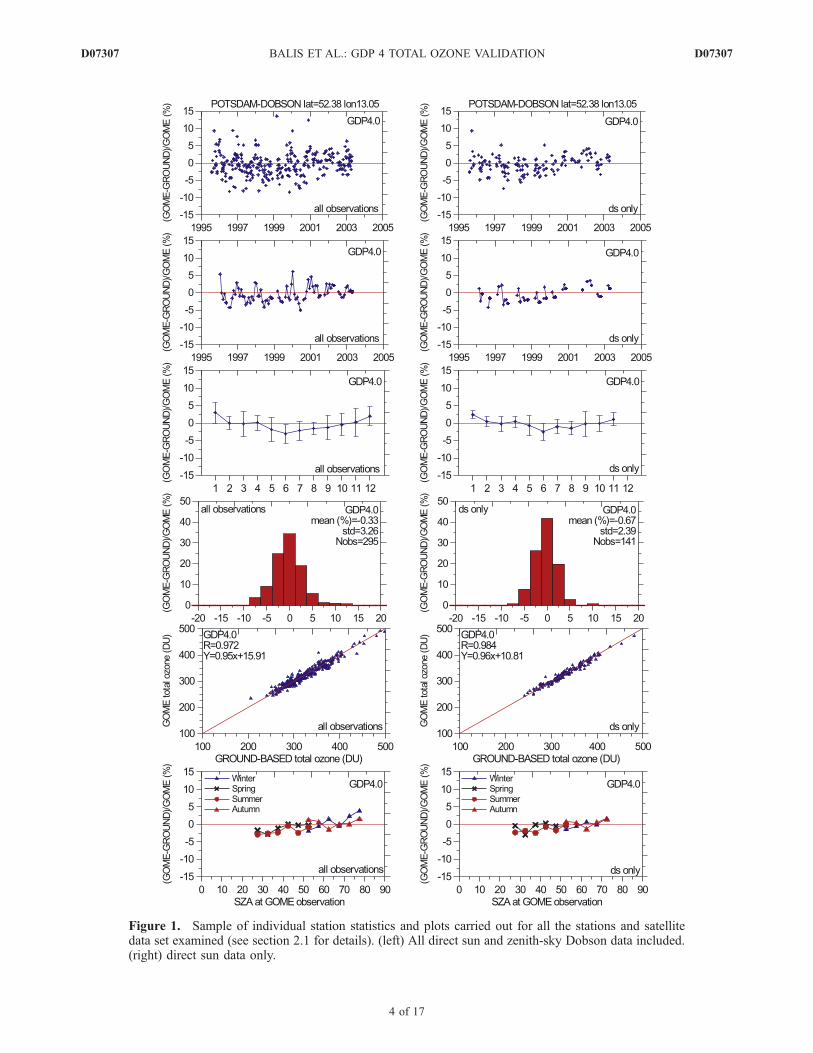
Figure 1. Sample of individual station statistics and plots carried out for all the stations and satellitedata set examined (see section 2.1 for details). (left) All direct sun and zenith-sky Dobson data included.(right) direct sun data only.
D07307 BALIS ET AL.: GDP 4 TOTAL OZONE VALIDATION
4 of 17
D07307
(last row). In some cases, there were systematic inconsis-tencies between comparisons from neighboring stations. Incertain cases, small correlation coefficients were foundbetween the ground-based and satellite data.[19] For the NDSC, there is a strict protocol on data
verification, resulting in a 2-year delay between data acqui-sition and the upload of consolidated data to the centralarchive. For the longer-term validation considered in thispaper, it was necessary to augment NDSC-endorsed datarecords with unconsolidated data reported in near real time.For the latter, an additional verification is based on clima-tological grounds. At ground stations where sufficientlylong time series are available, the verification procedureconsists in comparing fresh data to climatological meansand standard deviations that were calculated from low-passfiltered time series acquired since 1995. The proceduresingles out and records exceptions. First to be identifiedare the aberrant cases (e.g., Dobson data erroneouslyreferred to as polar night data). Second, ozone columnvalues deviating from the climatological mean by morethan 2 or 3 standard deviations (2s or 3s) are singled out.Groups of consecutive values lying outside the ±3s intervalare examined carefully to determine whether such persistentdeviations are due to data quality issues, to natural atmo-spheric variability, or to unexpected atmospheric featuressuch as the 2002 Antarctic vortex split. Single valuesoutside the ±3s interval that do not belong to a justifiable 2strain are flagged accordingly but are not rejected systemat-ically since they could reflect natural atmosphericvariability (e.g., high frequencies near the polar vortexboundary) or indicate special events such as troposphericpollution episodes.[20] From the above selection procedure, some 41 Brewer,
61 Dobson and 27 UV-visible DOAS instruments wereconsidered for the comparisons with GDP 3.0, GDP 4.0,and TOMS V8. A complete listing of all instruments used inthe validation may be found in the GDP 4.0 Delta-ValidationReport [Lambert and Balis, 2004], wherein the Brewer,Dobson, and DOAS instruments are catalogued respectivelyin Tables 1, 2 and 3 in the report.
2.2. Selection of GOME Orbits
[21] In 2002, a list of 2257 validation orbits was compiledfor the delta validation of the GDP upgrade to version 3.0[Lambert et al., 2002]. With a longer data record andadditional validation required to test algorithmic upgradesin GDP 4.0, the selection will be larger. The selection isbased on available ground-based data for the period 1995–2004, and it allows for delta-validation of total ozone fromGOME from 1995–2004, of EP-TOMS total ozone from1996–2004 and for the verification of GOME NO2 columndata from 1995–2004. The selection is large enough tocharacterize changes in cyclic errors, i.e., dependencies onthe season, the latitude, the ozone column value and thesolar zenith angle. Finally, results using the older GDP 3.0algorithm are consistent between the new set of validationorbits and the previous set of 2257 orbits used in 2002.[22] The current selection of about five thousand orbits
based on histograms of GOME/ground comparisons at a listof 40 stations from pole to pole. Among these stations, thereare 30 WMO/GAW stations equipped with Dobson and/orBrewer spectrophotometers, including the Canadian and
NOAA/CMDL subnetworks and a few NDSC sites, and20 NDSC sites operating UV/visible DOAS spectrometers.Orbits have been selected on the basis of proximity to themedian value of the relative difference in total ozone. Theselection has been constrained in such a way thatthe sampling of the column range and of its cyclic variations(with season, latitude and SZA) complies with both theNyquist and Central Limit theorems [Papoulis and Pillai,2002]. Another constraint is that there must be sufficientsampling of seasonal and meridian variations of the DOAS-derived effective temperature.[23] Coincidences between GOME and ground-based
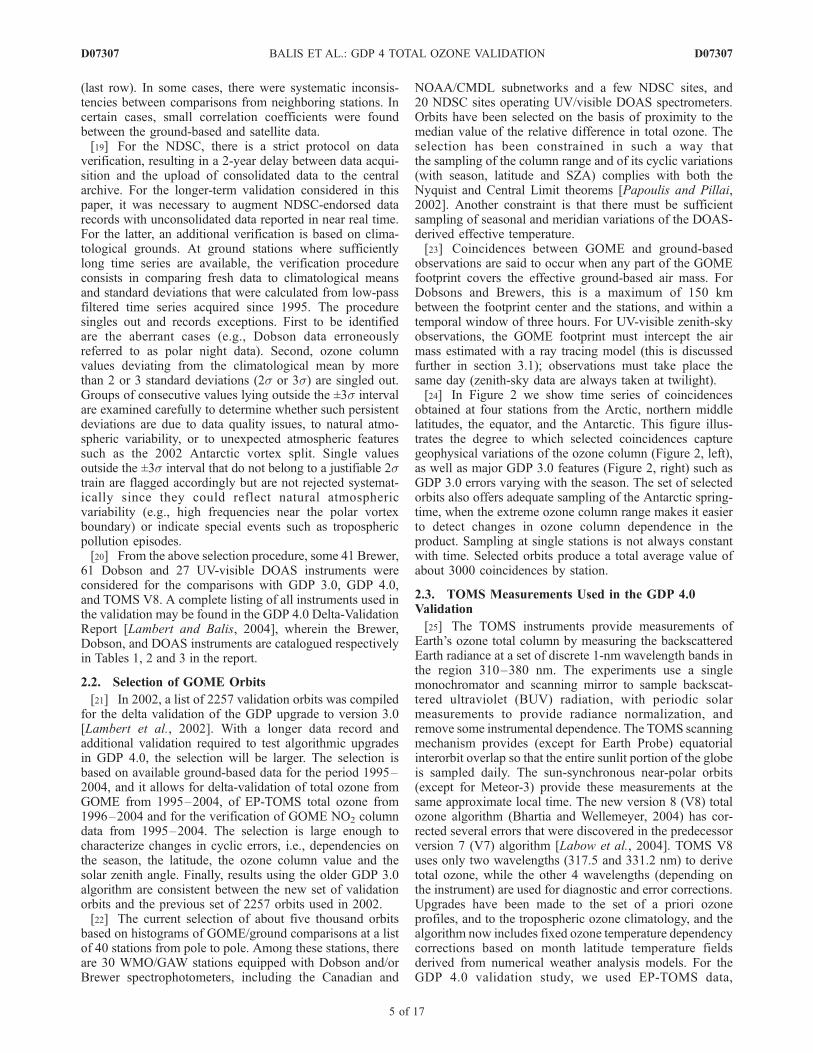
observations are said to occur when any part of the GOMEfootprint covers the effective ground-based air mass. ForDobsons and Brewers, this is a maximum of 150 kmbetween the footprint center and the stations, and within atemporal window of three hours. For UV-visible zenith-skyobservations, the GOME footprint must intercept the airmass estimated with a ray tracing model (this is discussedfurther in section 3.1); observations must take place thesame day (zenith-sky data are always taken at twilight).[24] In Figure 2 we show time series of coincidences
obtained at four stations from the Arctic, northern middlelatitudes, the equator, and the Antarctic. This figure illus-trates the degree to which selected coincidences capturegeophysical variations of the ozone column (Figure 2, left),as well as major GDP 3.0 features (Figure 2, right) such asGDP 3.0 errors varying with the season. The set of selectedorbits also offers adequate sampling of the Antarctic spring-time, when the extreme ozone column range makes it easierto detect changes in ozone column dependence in theproduct. Sampling at single stations is not always constantwith time. Selected orbits produce a total average value ofabout 3000 coincidences by station.
2.3. TOMS Measurements Used in the GDP 4.0Validation
[25] The TOMS instruments provide measurements ofEarth’s ozone total column by measuring the backscatteredEarth radiance at a set of discrete 1-nm wavelength bands inthe region 310–380 nm. The experiments use a singlemonochromator and scanning mirror to sample backscat-tered ultraviolet (BUV) radiation, with periodic solarmeasurements to provide radiance normalization, andremove some instrumental dependence. The TOMS scanningmechanism provides (except for Earth Probe) equatorialinterorbit overlap so that the entire sunlit portion of the globeis sampled daily. The sun-synchronous near-polar orbits(except for Meteor-3) provide these measurements at thesame approximate local time. The new version 8 (V8) totalozone algorithm (Bhartia and Wellemeyer, 2004) has cor-rected several errors that were discovered in the predecessorversion 7 (V7) algorithm [Labow et al., 2004]. TOMS V8uses only two wavelengths (317.5 and 331.2 nm) to derivetotal ozone, while the other 4 wavelengths (depending onthe instrument) are used for diagnostic and error corrections.Upgrades have been made to the set of a priori ozoneprofiles, and to the tropospheric ozone climatology, and thealgorithm now includes fixed ozone temperature dependencycorrections based on month latitude temperature fieldsderived from numerical weather analysis models. For theGDP 4.0 validation study, we used EP-TOMS data,
D07307 BALIS ET AL.: GDP 4 TOTAL OZONE VALIDATION
5 of 17
D07307
Figure 2. Time series of selected coincidences between GOME and ground-based ozone columnobservations at (top to bottom) the Arctic station of Thule (77�N, Danish Meteorological InstituteSAOZ), the northern midlatitude station of Uccle (50�N, Royal Meteorological Institute of BelgiumBrewer), the equatorial station of Singapore (1�N, Singapore Meteorological Office Dobson), and theAntarctic station of Rothera (68�S, British Antarctic Survey SAOZ). (left) Coincident ozone columnmeasurements; (right) percent relative difference of GDP 3 versus ground-based ozone column data. Notethat the vertical scale differs from one station to another. Gray dots show all coincidences between theavailable GOME and ground-based data records; the subset of coincidences plotted as red dots satisfiesminimal sampling requirements (Nyquist, Shannon, etc.) for the known errors of GDP 3.0; blue dotsshow actual coincidences with the selected set of delta validation orbits. Total amount of coincidences foreach subset of orbits is indicated in the legend.
D07307 BALIS ET AL.: GDP 4 TOTAL OZONE VALIDATION
6 of 17
D07307
processed at NASA/GSFC for the period 1996–2003. EP-TOMS time-dependent calibration is maintained (by usingthree on-board diffuser plates) to high accuracy by analyz-ing the degradation of the cover diffuser relative to theworking and reference diffusers. The 150 km overpasscriterion for GOME is also applied to the selection ofTOMS data. As overpass data files provided by NASA/GSFC report only one value a day, corresponding to theclosest ground pixel to the station, the total amount ofcoincidences by station is closer to 1000 for TOMS data, ascompared with an average of 3000 for GOME data - stillsufficient for reliable statistics (for details, see Lambert andBalis [2004]). In 2001, a bias in measurements made on oneside of the orbital track relative to measurements from theopposite side of the scan was discovered in EP-TOMS data.A correction was implemented to stabilise the calibrationrelative to NOAA-16 SBUV/2 in the equatorial zone(Bhartia and Wellemeyer, 2004). However, there is still alatitude-dependent error that cannot be corrected by asimple calibration correction; at 50 degrees latitude, thereare now �2% to �4% errors in TOMS. Because of thisproblem, NASA/GSFC recommends that data from 2002should not be used for trend analysis. However, thisvalidation exercise is a good opportunity to assess theperformance of the TOMS corrections with respect toground-based network data.
3. Error Sources in Ground-Based Data Sets
3.1. Ground-Based Errors and Mutual Consistency
[26] The present GDP 4.0 validation relies on the syner-gistic use of complementary ground-based network datacontributing to the WMO GAW program. More than 300Dobson [Dobson, 1957] and Brewer [Kerr et al., 1983]stations form the world’s primary total ozone monitoringnetwork archived at WOUDC. Dobson and Brewer spec-trophotometers derive total ozone from the ratio of directsunlight intensities measured at standard wavelengths in theHuggins band. In the framework of the NDSC, there arealso some 40 UV-visible DOAS spectrometers that monitortotal ozone at twilight (this includes the automated networkof 14 Systeme d’Analyse par Observation Zenithale(SAOZ) spectrometers [Pommereau and Goutail, 1988]measuring in the Chappuis bands). Here, ozone is derivedfrom measurement of UV-visible sunlight scattered at thezenith of the instrument. Established procedures for main-taining high quality with Brewer and Dobson instrumentsare described in detail by [Staehelin et al., 2003]. NDSCcertification requires participation for UV-visible spectrom-eters in blind intercomparison campaigns [see, e.g., Roscoeet al., 1999]. Ground-based stations delivering ozone col-umn data regularly to WOUDC and/or NDSC are expectedto provide well-controlled, long-term time series of data.However, there are several sources of uncertainty in the datathat are known to interfere with GDP validation, and wenow summarize these error sources.[27] The work of [Van Roozendael et al., 1998] has
shown that mutual agreements between Dobson, Brewerand UV-visible data can reach the ‘‘percent’’ level when themajor sources of discrepancy are properly accounted for.We summarize the main findings from this work. ForDobson instruments, the temperature dependence of the
ozone absorption coefficients used in the retrievals mightaccount for a seasonal variation in the error of ±0.9% in theAlps and ±1.7% at Sodankyla (Finland, 67.4�N), and for asystematic errors of up to 4% [Bernhard et al., 2005]. Theeffect can dramatically increase in extremely cold condi-tions (winter polar vortex). The effect is smaller for Brewerinstruments because of their use of wavelengths withreduced ozone absorption temperature dependency. Dobsonand Brewer instruments might also suffer from long-termdrift associated with calibration changes. Additional prob-lems arise at solar elevations lower than 15�, for whichdiffuse and direct radiation contributions can be of the sameorder of magnitude. Assuming that the Dobson and Brewerinstruments are well-calibrated, and that data are filtered toavoid air mass dependence, then the data can be correctedfor temperature dependence using formulas given by[Komhyr et al., 1993].[28] For zenith-sky UV-visible spectrometers measuring
ozone in the Chappuis band, the use of DOAS minimizesuncertainties associated with the temperature dependence ofthe absorption cross sections [Burkholder and Talukdar,1994]. Major uncertainties on the vertical column areassociated with the AMF conversion from spectrallyderived slant columns to vertical columns. Real-time SAOZdata are based on the a single-profile standard AMFcalculated at 60�N in winter and at sea level [Sarkissianet al., 1995]. However, it is essential to calculate air massfactors at the correct station altitude, as otherwise offsets ofup to 5% can appear in results from high mountain stations.Seasonal changes of the ozone profile and scattering geom-etry are responsible for a systematic bias of about 5–6%amplitude at 67�N, falling to 3–4% at 44�N. This is inaddition to the ±1% scatter that might result from short-termfluctuations. The use of the standard SAOZ AMF alsointroduces an average meridian dependence of �3% at67�N to +2.8% at the tropics.[29] Accounting for these Dobson, Brewer and SAOZ
effects, apparent seasonalities between Dobson/Brewer andSAOZ ozone column measurements vanish and the mutualconsistency can reach the ‘‘1% level’’ on average. However,we do not include these corrections in the standard NDSCand WOUDC ozone data products as used in this GDP 4.0validation; to do this would require a tremendous amountwork that is beyond the scope of this paper. Consequently,ground-based uncertainties (and the same is true forsmoothing errors described next) can be larger than differ-ences between improved satellite ozone column data (fromGOME GDP 4.0 and TOMS V8) and the ground-basedresults. Nevertheless, ground-based validation of satellitesat the ‘‘1% level’’ is feasible provided that the interpretationincludes an accounting of significant ground-based uncer-tainties. This will be done in sections 4 and 5 whendiscussing comparison results.
3.2. Smoothing Errors
[30] Validation comparisons require a sufficient degree ofcollocation of the air masses probed by the different sensors.In the GOME and TOMS ozone validation literature,collocation criteria are based on spatial windowing varyingfrom 100 to 600 km and temporal windows from 1 hour to1 day. The underlying assumptions in this procedure are thatall collocated instruments are reporting the integral of the
D07307 BALIS ET AL.: GDP 4 TOTAL OZONE VALIDATION
7 of 17
D07307
ozone distribution in a restricted vertical interval, and thatthe variability of the ozone field within this window issmaller than the anticipated data agreement. The reality isdifferent: Remote sensing instruments actually report athree-dimensional weighted average of the ozone field.The concepts and formalism for vertical smoothing aredescribed in detail by [Rodgers, 1990]. Horizontal smooth-ing has been much less studied.[31] Vertical and horizontal smoothing properties depend
not only on instrumental properties (e.g., viewing geometry,scanning strategy, field of view, etc.) but also on atmo-spheric and measurements parameters (solar elevation,aerosol loading, atmospheric profile of ozone, Rayleighscattering geometry, surface albedo, presence of clouds,etc.). The GOME scanning strategy limits the horizontalresolution to the footprint dimensions (320 � 40 km2 for thethree forward scans). The TOMS Field of View is 40 �40 km2. The GOME and TOMS backscatter spectra aresmoothed additionally since the measured radiation passestwice through the atmosphere (solar and scattered beams).Further, some solar and scattered radiation will pass throughparts of the atmosphere that are outside the ground pixelbox. Dobson and Brewer air masses are located between themeasuring station and a maximum distance of 80 km in thedirection of the sun. Zenith-sky air masses extend overseveral hundred kilometers in the azimuth of the rising andsetting sun. Selection criteria based on simple time/spacewindow limits can lead to comparisons based on verydifferent perceptions of the atmospheric ozone burdens.[32] Figure 3 illustrates this issue for a GOME/SAOZ
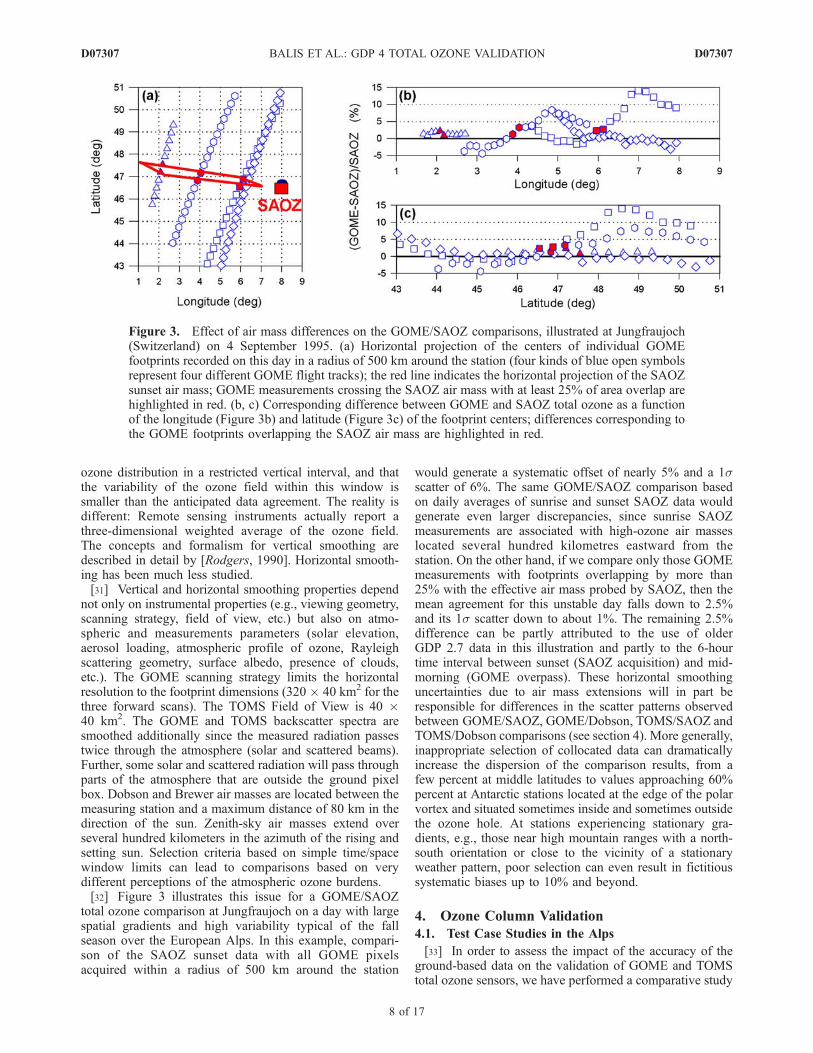
total ozone comparison at Jungfraujoch on a day with largespatial gradients and high variability typical of the fallseason over the European Alps. In this example, compari-son of the SAOZ sunset data with all GOME pixelsacquired within a radius of 500 km around the station
would generate a systematic offset of nearly 5% and a 1sscatter of 6%. The same GOME/SAOZ comparison basedon daily averages of sunrise and sunset SAOZ data wouldgenerate even larger discrepancies, since sunrise SAOZmeasurements are associated with high-ozone air masseslocated several hundred kilometres eastward from thestation. On the other hand, if we compare only those GOMEmeasurements with footprints overlapping by more than25% with the effective air mass probed by SAOZ, then themean agreement for this unstable day falls down to 2.5%and its 1s scatter down to about 1%. The remaining 2.5%difference can be partly attributed to the use of olderGDP 2.7 data in this illustration and partly to the 6-hourtime interval between sunset (SAOZ acquisition) and mid-morning (GOME overpass). These horizontal smoothinguncertainties due to air mass extensions will in part beresponsible for differences in the scatter patterns observedbetween GOME/SAOZ, GOME/Dobson, TOMS/SAOZ andTOMS/Dobson comparisons (see section 4). More generally,inappropriate selection of collocated data can dramaticallyincrease the dispersion of the comparison results, from afew percent at middle latitudes to values approaching 60%percent at Antarctic stations located at the edge of the polarvortex and situated sometimes inside and sometimes outsidethe ozone hole. At stations experiencing stationary gra-dients, e.g., those near high mountain ranges with a north-south orientation or close to the vicinity of a stationaryweather pattern, poor selection can even result in fictitioussystematic biases up to 10% and beyond.
4. Ozone Column Validation
4.1. Test Case Studies in the Alps
[33] In order to assess the impact of the accuracy of theground-based data on the validation of GOME and TOMStotal ozone sensors, we have performed a comparative study
Figure 3. Effect of air mass differences on the GOME/SAOZ comparisons, illustrated at Jungfraujoch(Switzerland) on 4 September 1995. (a) Horizontal projection of the centers of individual GOMEfootprints recorded on this day in a radius of 500 km around the station (four kinds of blue open symbolsrepresent four different GOME flight tracks); the red line indicates the horizontal projection of the SAOZsunset air mass; GOME measurements crossing the SAOZ air mass with at least 25% of area overlap arehighlighted in red. (b, c) Corresponding difference between GOME and SAOZ total ozone as a functionof the longitude (Figure 3b) and latitude (Figure 3c) of the footprint centers; differences corresponding tothe GOME footprints overlapping the SAOZ air mass are highlighted in red.
D07307 BALIS ET AL.: GDP 4 TOTAL OZONE VALIDATION
8 of 17
D07307
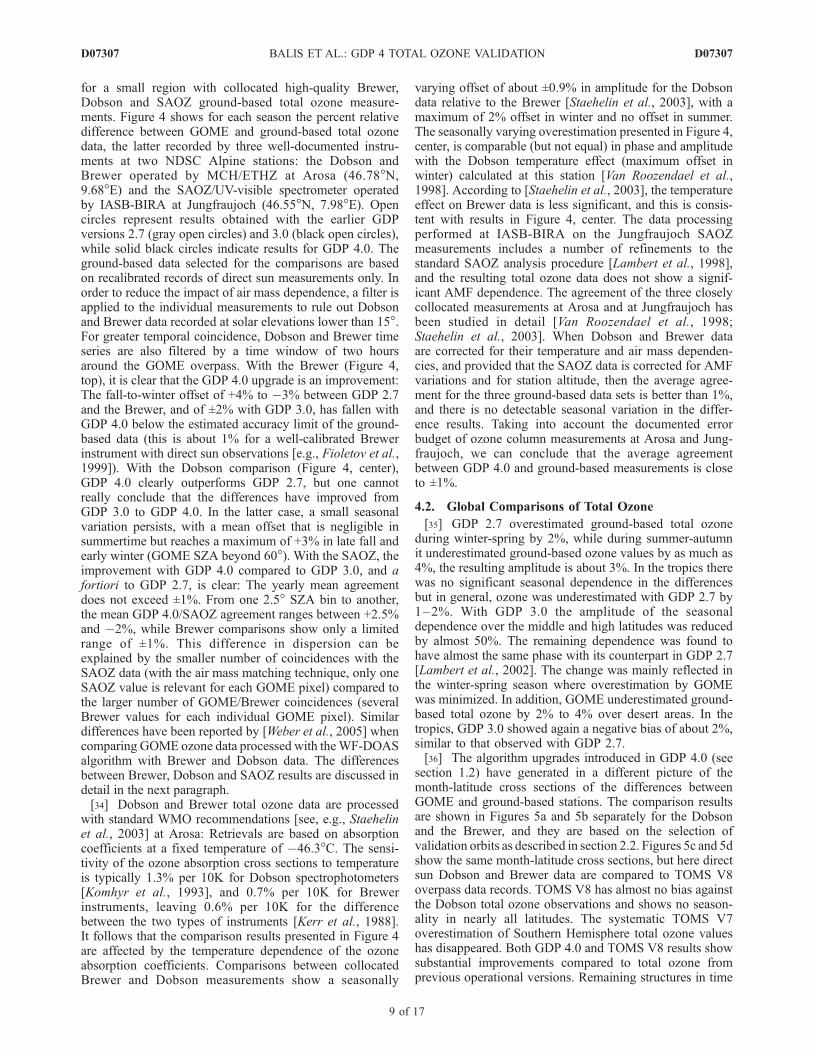
for a small region with collocated high-quality Brewer,Dobson and SAOZ ground-based total ozone measure-ments. Figure 4 shows for each season the percent relativedifference between GOME and ground-based total ozonedata, the latter recorded by three well-documented instru-ments at two NDSC Alpine stations: the Dobson andBrewer operated by MCH/ETHZ at Arosa (46.78�N,9.68�E) and the SAOZ/UV-visible spectrometer operatedby IASB-BIRA at Jungfraujoch (46.55�N, 7.98�E). Opencircles represent results obtained with the earlier GDPversions 2.7 (gray open circles) and 3.0 (black open circles),while solid black circles indicate results for GDP 4.0. Theground-based data selected for the comparisons are basedon recalibrated records of direct sun measurements only. Inorder to reduce the impact of air mass dependence, a filter isapplied to the individual measurements to rule out Dobsonand Brewer data recorded at solar elevations lower than 15�.For greater temporal coincidence, Dobson and Brewer timeseries are also filtered by a time window of two hoursaround the GOME overpass. With the Brewer (Figure 4,top), it is clear that the GDP 4.0 upgrade is an improvement:The fall-to-winter offset of +4% to �3% between GDP 2.7and the Brewer, and of ±2% with GDP 3.0, has fallen withGDP 4.0 below the estimated accuracy limit of the ground-based data (this is about 1% for a well-calibrated Brewerinstrument with direct sun observations [e.g., Fioletov et al.,1999]). With the Dobson comparison (Figure 4, center),GDP 4.0 clearly outperforms GDP 2.7, but one cannotreally conclude that the differences have improved fromGDP 3.0 to GDP 4.0. In the latter case, a small seasonalvariation persists, with a mean offset that is negligible insummertime but reaches a maximum of +3% in late fall andearly winter (GOME SZA beyond 60�). With the SAOZ, theimprovement with GDP 4.0 compared to GDP 3.0, and afortiori to GDP 2.7, is clear: The yearly mean agreementdoes not exceed ±1%. From one 2.5� SZA bin to another,the mean GDP 4.0/SAOZ agreement ranges between +2.5%and �2%, while Brewer comparisons show only a limitedrange of ±1%. This difference in dispersion can beexplained by the smaller number of coincidences with theSAOZ data (with the air mass matching technique, only oneSAOZ value is relevant for each GOME pixel) compared tothe larger number of GOME/Brewer coincidences (severalBrewer values for each individual GOME pixel). Similardifferences have been reported by [Weber et al., 2005] whencomparing GOME ozone data processed with theWF-DOASalgorithm with Brewer and Dobson data. The differencesbetween Brewer, Dobson and SAOZ results are discussed indetail in the next paragraph.[34] Dobson and Brewer total ozone data are processed
with standard WMO recommendations [see, e.g., Staehelinet al., 2003] at Arosa: Retrievals are based on absorptioncoefficients at a fixed temperature of �46.3�C. The sensi-tivity of the ozone absorption cross sections to temperatureis typically 1.3% per 10K for Dobson spectrophotometers[Komhyr et al., 1993], and 0.7% per 10K for Brewerinstruments, leaving 0.6% per 10K for the differencebetween the two types of instruments [Kerr et al., 1988].It follows that the comparison results presented in Figure 4are affected by the temperature dependence of the ozoneabsorption coefficients. Comparisons between collocatedBrewer and Dobson measurements show a seasonally
varying offset of about ±0.9% in amplitude for the Dobsondata relative to the Brewer [Staehelin et al., 2003], with amaximum of 2% offset in winter and no offset in summer.The seasonally varying overestimation presented in Figure 4,center, is comparable (but not equal) in phase and amplitudewith the Dobson temperature effect (maximum offset inwinter) calculated at this station [Van Roozendael et al.,1998]. According to [Staehelin et al., 2003], the temperatureeffect on Brewer data is less significant, and this is consis-tent with results in Figure 4, center. The data processingperformed at IASB-BIRA on the Jungfraujoch SAOZmeasurements includes a number of refinements to thestandard SAOZ analysis procedure [Lambert et al., 1998],and the resulting total ozone data does not show a signif-icant AMF dependence. The agreement of the three closelycollocated measurements at Arosa and at Jungfraujoch hasbeen studied in detail [Van Roozendael et al., 1998;Staehelin et al., 2003]. When Dobson and Brewer dataare corrected for their temperature and air mass dependen-cies, and provided that the SAOZ data is corrected for AMFvariations and for station altitude, then the average agree-ment for the three ground-based data sets is better than 1%,and there is no detectable seasonal variation in the differ-ence results. Taking into account the documented errorbudget of ozone column measurements at Arosa and Jung-fraujoch, we can conclude that the average agreementbetween GDP 4.0 and ground-based measurements is closeto ±1%.
4.2. Global Comparisons of Total Ozone
[35] GDP 2.7 overestimated ground-based total ozoneduring winter-spring by 2%, while during summer-autumnit underestimated ground-based ozone values by as much as4%, the resulting amplitude is about 3%. In the tropics therewas no significant seasonal dependence in the differencesbut in general, ozone was underestimated with GDP 2.7 by1–2%. With GDP 3.0 the amplitude of the seasonaldependence over the middle and high latitudes was reducedby almost 50%. The remaining dependence was found tohave almost the same phase with its counterpart in GDP 2.7[Lambert et al., 2002]. The change was mainly reflected inthe winter-spring season where overestimation by GOMEwas minimized. In addition, GOME underestimated ground-based total ozone by 2% to 4% over desert areas. In thetropics, GDP 3.0 showed again a negative bias of about 2%,similar to that observed with GDP 2.7.[36] The algorithm upgrades introduced in GDP 4.0 (see
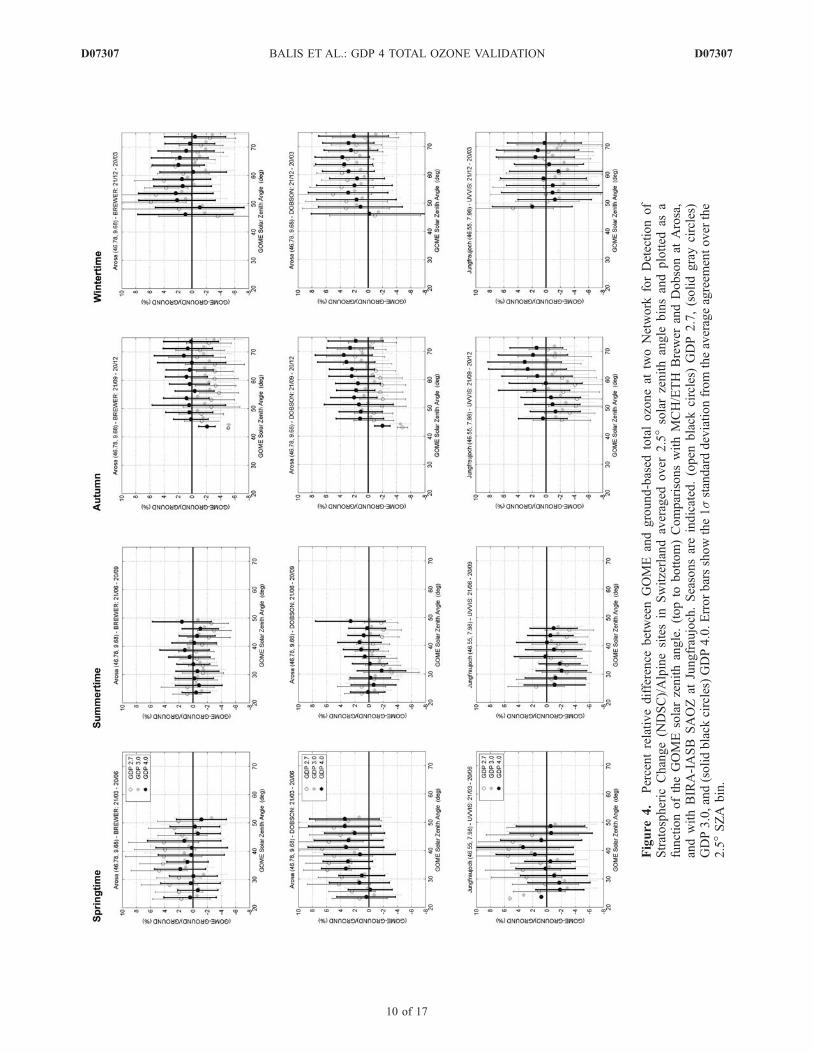
section 1.2) have generated in a different picture of themonth-latitude cross sections of the differences betweenGOME and ground-based stations. The comparison resultsare shown in Figures 5a and 5b separately for the Dobsonand the Brewer, and they are based on the selection ofvalidation orbits as described in section 2.2. Figures 5c and 5dshow the same month-latitude cross sections, but here directsun Dobson and Brewer data are compared to TOMS V8overpass data records. TOMS V8 has almost no bias againstthe Dobson total ozone observations and shows no season-ality in nearly all latitudes. The systematic TOMS V7overestimation of Southern Hemisphere total ozone valueshas disappeared. Both GDP 4.0 and TOMS V8 results showsubstantial improvements compared to total ozone fromprevious operational versions. Remaining structures in time
D07307 BALIS ET AL.: GDP 4 TOTAL OZONE VALIDATION
9 of 17
D07307
Figure
4.
Percentrelativedifference
betweenGOME
andground-based
totalozoneat
twoNetwork
forDetectionof
Stratospheric
Change(N
DSC)/Alpinesitesin
Switzerlandaveraged
over
2.5�solarzenithangle
binsandplotted
asa
functionoftheGOMEsolarzenithangle.(topto
bottom)ComparisonswithMCH/ETH
Brewer
andDobsonat
Arosa,
andwithBIRA-IASB
SAOZ
atJungfraujoch.Seasonsareindicated.(open
black
circles)
GDP2.7,(solidgraycircles)
GDP3.0,and(solidblack
circles)GDP4.0.Errorbarsshowthe1sstandarddeviationfrom
theaverageagreem
entover
the
2.5�SZA
bin.
D07307 BALIS ET AL.: GDP 4 TOTAL OZONE VALIDATION
10 of 17
D07307
and latitude will be discussed below in sections 4.3 and 4.4respectively. Systematic offsets of GDP 3.0 versus Brewer(�1.89%) and Dobson (�2.06%) data have all but vanishedwith GDP 4.0: to �0.17% for Brewer and 0.11% forDobson comparisons. Zonal mean agreement varies within±1–2%, with no marked meridian structure. Over the polarlatitudes of both hemispheres, GDP 4.0 results are based onfew measurements, especially at large SZA, and thereforethey do not have the same significance with results at otherlatitudes. Studies relevant to high latitude and large SZA aredetailed in section 4.5. TOMS has improved performance inall latitudes no meridian dependence of the differences.TOMS V8 data, when compared with Dobson instruments,have almost no offset (�0.3%), but they show a negativebias of about 1.5% compared with Brewer instruments.
4.3. Seasonal Dependence
[37] From Figures 5a–5d it can be concluded that there isstill a small mean seasonal dependence remaining in thecomparisons with the ground-based measurements north of
40�N and south of 40�S. The amplitude of this seasonalitydoes not exceed 1%�1.5% for the Dobson comparisons andis even less for the Brewer comparisons. Over the tropics,the comparisons show results between 0 and 1% with nearlyno seasonal variation. The GDP 4.0 seasonality is not inphase with the one observed in GDP 3.0, but it is rather inphase with the variation of the stratospheric temperatures(see 25�N–65�N zonal mean temperatures estimated byNOAA at 50 hPa (http://www.cpc.ncep.noaa.gov/products/stratosphere)): There is almost no bias to date during thewarm period, while a positive bias of about 2% occursduring the cold period (including ozone hole conditions).[38] As discussed in section 3 and in section 4.1 above,
the use of absorption coefficients at a fixed temperature forboth Dobson and Brewer total ozone measurements resultsin ozone column values dependent on stratospheric temper-ature variations. On the other hand, GDP 4.0 includes thespectral fitting of the effective temperature at which crosssections are calculated. Therefore GDP 4.0 should not
Figure 5. Month-latitude cross section of the relative difference between GOME and TOMS ground-based total ozone. GOME total ozone data are taken from the 4900 validation orbits processed withGDP 4.0, and the results obtained by comparison with (a) Dobsons and (b) Brewers are presentedseparately (note that nearly no Brewers operate in the Southern Hemisphere). TOMS version 8 totalozone overpass data are also compared separately with (c) Dobsons and (d) Brewers.
D07307 BALIS ET AL.: GDP 4 TOTAL OZONE VALIDATION
11 of 17
D07307
depend significantly on the variability of stratospherictemperatures. A seasonal signature with similar phase andamplitude is found when comparing colocated Brewer andDobson measurements from well-calibrated instruments fora long period (see examples at Hradec Kralove and Hohen-peibenberg given by Staehelin et al. [2003]).[39] Brewer comparisons have smaller amplitudes than
their Dobson counterparts. This indicates that a large part ofthe observed differences between GDP 4.0 and ground-
based measurements can be attributed to characteristics ofthe ground-based retrieval algorithms rather than to aspectsof the GDP 4.0 algorithm. This is supported by the fact thatthe seasonal behavior of the GDP4.0/ground differences isin phase with the variability of stratospheric temperature.This seasonal behavior is also consistent with comparisonsbetween collocated Brewer and Dobson measurements,which show similar degrees of phase and amplitude sea-sonality [Stahelin et al., 2003]. Further confirmation isprovided by the comparisons between Dobson, Brewerand TOMS V8 total ozone. Comparison results displayedin Figure 5c and 5d indicate that TOMS has almost no biasagainst the Dobson total ozone observations and shows noseasonality almost in every latitude belt. On the other handthe Brewer comparisons over middle latitudes show a smallnegative bias of �1% and a seasonal behavior with anamplitude of 0.5% in phase with the one found in GDP 4.0.Given that (1) the forward model of TOMS V8 uses a singletemperature profile for calculating radiances, and (2) theTOMS wavelengths are closer to those for the Dobsoninstruments, we can infer that TOMS V8 and Dobsonmeasurements have similar dependence on the lowerstratospheric temperature. In consequence, their temperature-related errors are likely to cancel out when calculatingtheir differences. This is also partly valid in the Brewercomparisons.
4.4. Long-Term Stability
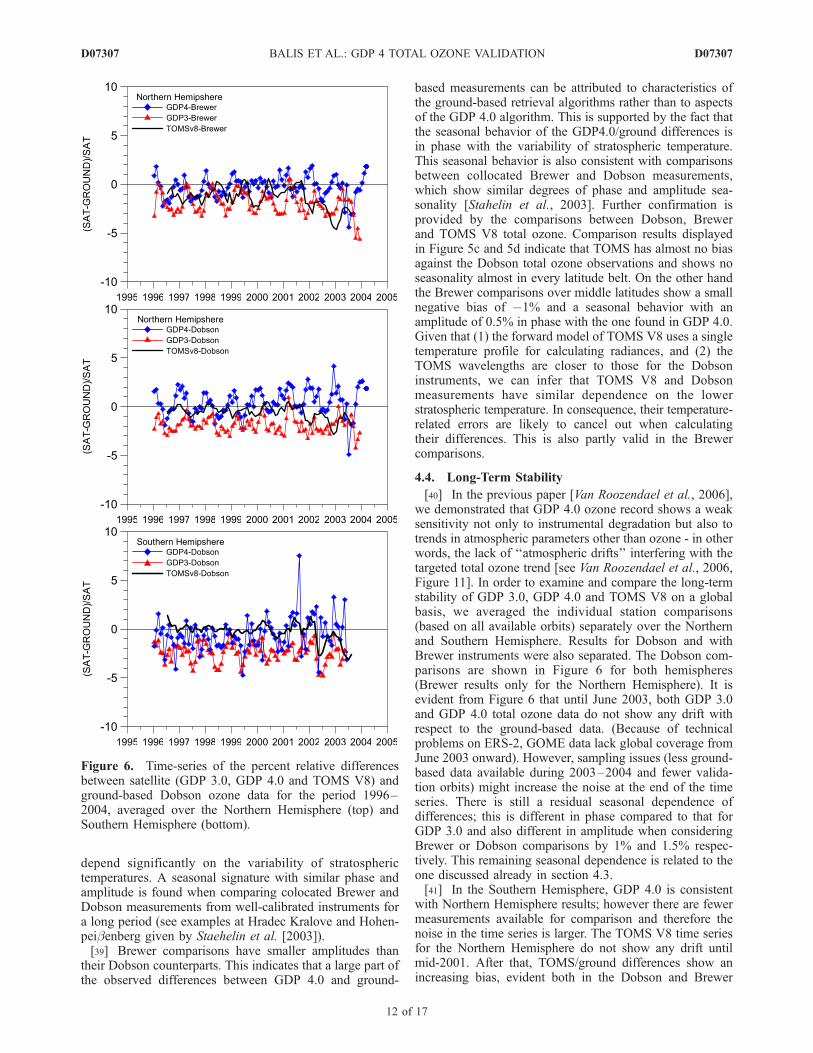
[40] In the previous paper [Van Roozendael et al., 2006],we demonstrated that GDP 4.0 ozone record shows a weaksensitivity not only to instrumental degradation but also totrends in atmospheric parameters other than ozone - in otherwords, the lack of ‘‘atmospheric drifts’’ interfering with thetargeted total ozone trend [see Van Roozendael et al., 2006,Figure 11]. In order to examine and compare the long-termstability of GDP 3.0, GDP 4.0 and TOMS V8 on a globalbasis, we averaged the individual station comparisons(based on all available orbits) separately over the Northernand Southern Hemisphere. Results for Dobson and withBrewer instruments were also separated. The Dobson com-parisons are shown in Figure 6 for both hemispheres(Brewer results only for the Northern Hemisphere). It isevident from Figure 6 that until June 2003, both GDP 3.0and GDP 4.0 total ozone data do not show any drift withrespect to the ground-based data. (Because of technicalproblems on ERS-2, GOME data lack global coverage fromJune 2003 onward). However, sampling issues (less ground-based data available during 2003–2004 and fewer valida-tion orbits) might increase the noise at the end of the timeseries. There is still a residual seasonal dependence ofdifferences; this is different in phase compared to that forGDP 3.0 and also different in amplitude when consideringBrewer or Dobson comparisons by 1% and 1.5% respec-tively. This remaining seasonal dependence is related to theone discussed already in section 4.3.[41] In the Southern Hemisphere, GDP 4.0 is consistent
with Northern Hemisphere results; however there are fewermeasurements available for comparison and therefore thenoise in the time series is larger. The TOMS V8 time seriesfor the Northern Hemisphere do not show any drift untilmid-2001. After that, TOMS/ground differences show anincreasing bias, evident both in the Dobson and Brewer
Figure 6. Time-series of the percent relative differencesbetween satellite (GDP 3.0, GDP 4.0 and TOMS V8) andground-based Dobson ozone data for the period 1996–2004, averaged over the Northern Hemisphere (top) andSouthern Hemisphere (bottom).
D07307 BALIS ET AL.: GDP 4 TOTAL OZONE VALIDATION
12 of 17
D07307
comparisons (see Lambert and Balis [2004] for details). Thesizes of the GOME (320� 40 km2) and TOMS (40� 40 km2)footprints will generate differences in spatial smoothing ofthe ozone field, and this could partly explain why thescatter in the comparisons depends on the remote sensinginstrument.
4.5. Dependence on Solar Zenith Angle
[42] Errors linked to the estimation of AMF and thecorrection for Raman scattering can result in a significantdependence of the vertical column product on the solarzenith angle (SZA) at which the observation was acquired.The SZA dependence in GDP 2.7 ozone columns possessedan average amplitude ranging from a few percent to ±15%,varying with latitude, season, vertical column amount, andsometimes from year to year [Lambert et al., 2000, 2002].With GDP 3.0, where the improved AMF calculation wasbased on an iterative neural network approach and the useof ozone profile climatology instead of modeling results, theamplitude of the SZA dependence was cut down by about50% on average [Lambert et al., 2002; Spurr et al., 2005].In GDP 4.0, with a new molecular Ring effect correctionprocedure and improvements in the AMF calculation, weexpect to see a drastic reduction of the SZA dependence.This section assesses this reduction.
[43] We have already remarked in previous sections that itis more difficult to conclude that there is a clear reduction ofthe SZA/seasonal dependence at high latitudes. This diffi-culty arises not only as a result of the smaller number ofdelta validation coincidences with latitude, but also becauseof increasing uncertainties on both the satellite and ground-based measurements at such large latitudes and/or solarzenith angles. To detect and quantify possible improvementsin the SZA dependences, we have first compared GOMEdata acquired during polar day at different solar elevations,to ground-based data acquired at fixed SZA values andtherefore free from any air mass or SZA dependence. Athigh latitudes, the polar orbit of ERS-2 together with polarconvergence of the meridians generates several daily over-passes. During polar summer, when the poles are illuminatedpermanently, GOME acquires measurements over the samehigh-latitude stations at least two times a day under differentsolar elevations. As the ozone field is usually relativelystable around the time of the summer solstice, this multipledaily overpass allows for the detection of the SZA depen-dence between GOME data acquired in the midmorning(medium SZA) and GOME data typical of midnight sunconditions (large SZA). Ground-based data are used in thecomparison as a standard transfer.
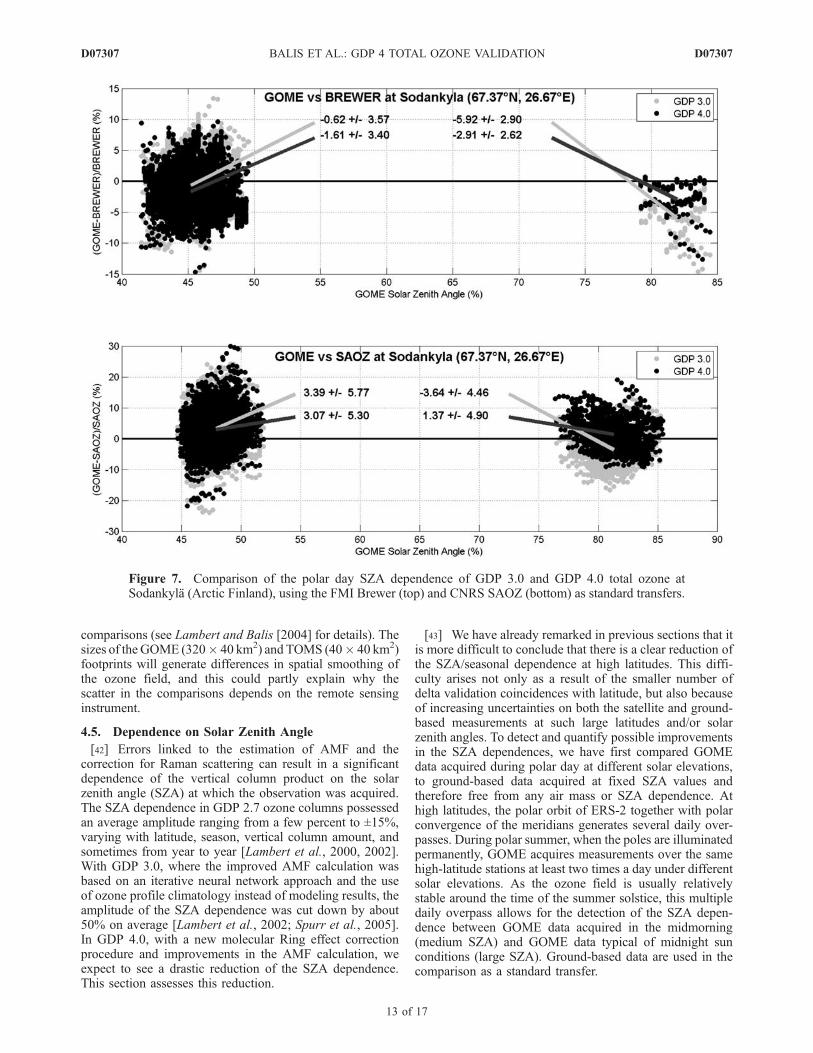
Figure 7. Comparison of the polar day SZA dependence of GDP 3.0 and GDP 4.0 total ozone atSodankyla (Arctic Finland), using the FMI Brewer (top) and CNRS SAOZ (bottom) as standard transfers.
D07307 BALIS ET AL.: GDP 4 TOTAL OZONE VALIDATION
13 of 17
D07307
[44] For the present study, the polar day technique wasapplied to 6 polar stations in both hemispheres. Figure 7shows GOME polar day SZA dependences with respect totwo ground-based sensors operated at the NDSC/Arcticstation of Sodankyla (67�N). Comparison with the FMIBrewer instrument (Figure 7, top) demonstrates that theaverage bias of about 6% observed between midmorning(moderate SZA) and midnight sun (large SZA) data withGDP 3.0 has reduced to a value of 1.5% with GDP 4.0.Comparison with the collocated CNRS/FMI SAOZ UV-visibleinstrument confirms this improvement. Similar comparisonswere performed with the British Antarctic Survey (BAS)Dobson instruments operated at the Antarctic stations ofRothera (68�S) and Halley (76�S) [see Lambert and Balis,2004]. At Rothera, the decrease of the polar day SZAdependence from 5.4% with GDP 3.0 to 0.9% with GDP4.0 is similar to that reported in the Arctic. At Halley, wherethere was already no clear polar day SZA dependence withGDP 3.0, we observe no change with GDP 4.0.[45] In Figure 8 (left), GOME total ozone data generated
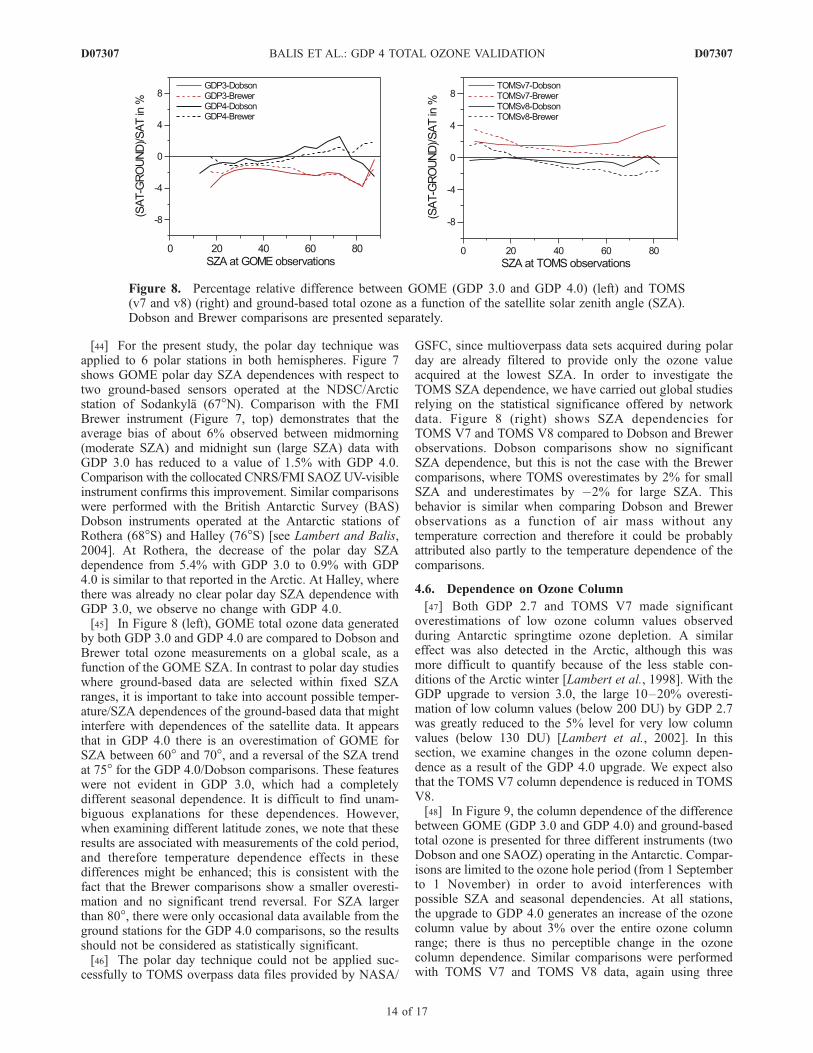
by both GDP 3.0 and GDP 4.0 are compared to Dobson andBrewer total ozone measurements on a global scale, as afunction of the GOME SZA. In contrast to polar day studieswhere ground-based data are selected within fixed SZAranges, it is important to take into account possible temper-ature/SZA dependences of the ground-based data that mightinterfere with dependences of the satellite data. It appearsthat in GDP 4.0 there is an overestimation of GOME forSZA between 60� and 70�, and a reversal of the SZA trendat 75� for the GDP 4.0/Dobson comparisons. These featureswere not evident in GDP 3.0, which had a completelydifferent seasonal dependence. It is difficult to find unam-biguous explanations for these dependences. However,when examining different latitude zones, we note that theseresults are associated with measurements of the cold period,and therefore temperature dependence effects in thesedifferences might be enhanced; this is consistent with thefact that the Brewer comparisons show a smaller overesti-mation and no significant trend reversal. For SZA largerthan 80�, there were only occasional data available from theground stations for the GDP 4.0 comparisons, so the resultsshould not be considered as statistically significant.[46] The polar day technique could not be applied suc-
cessfully to TOMS overpass data files provided by NASA/
GSFC, since multioverpass data sets acquired during polarday are already filtered to provide only the ozone valueacquired at the lowest SZA. In order to investigate theTOMS SZA dependence, we have carried out global studiesrelying on the statistical significance offered by networkdata. Figure 8 (right) shows SZA dependencies forTOMS V7 and TOMS V8 compared to Dobson and Brewerobservations. Dobson comparisons show no significantSZA dependence, but this is not the case with the Brewercomparisons, where TOMS overestimates by 2% for smallSZA and underestimates by �2% for large SZA. Thisbehavior is similar when comparing Dobson and Brewerobservations as a function of air mass without anytemperature correction and therefore it could be probablyattributed also partly to the temperature dependence of thecomparisons.
4.6. Dependence on Ozone Column
[47] Both GDP 2.7 and TOMS V7 made significantoverestimations of low ozone column values observedduring Antarctic springtime ozone depletion. A similareffect was also detected in the Arctic, although this wasmore difficult to quantify because of the less stable con-ditions of the Arctic winter [Lambert et al., 1998]. With theGDP upgrade to version 3.0, the large 10–20% overesti-mation of low column values (below 200 DU) by GDP 2.7was greatly reduced to the 5% level for very low columnvalues (below 130 DU) [Lambert et al., 2002]. In thissection, we examine changes in the ozone column depen-dence as a result of the GDP 4.0 upgrade. We expect alsothat the TOMS V7 column dependence is reduced in TOMSV8.[48] In Figure 9, the column dependence of the difference
between GOME (GDP 3.0 and GDP 4.0) and ground-basedtotal ozone is presented for three different instruments (twoDobson and one SAOZ) operating in the Antarctic. Compar-isons are limited to the ozone hole period (from 1 Septemberto 1 November) in order to avoid interferences withpossible SZA and seasonal dependencies. At all stations,the upgrade to GDP 4.0 generates an increase of the ozonecolumn value by about 3% over the entire ozone columnrange; there is thus no perceptible change in the ozonecolumn dependence. Similar comparisons were performedwith TOMS V7 and TOMS V8 data, again using three
Figure 8. Percentage relative difference between GOME (GDP 3.0 and GDP 4.0) (left) and TOMS(v7 and v8) (right) and ground-based total ozone as a function of the satellite solar zenith angle (SZA).Dobson and Brewer comparisons are presented separately.
D07307 BALIS ET AL.: GDP 4 TOTAL OZONE VALIDATION
14 of 17
D07307
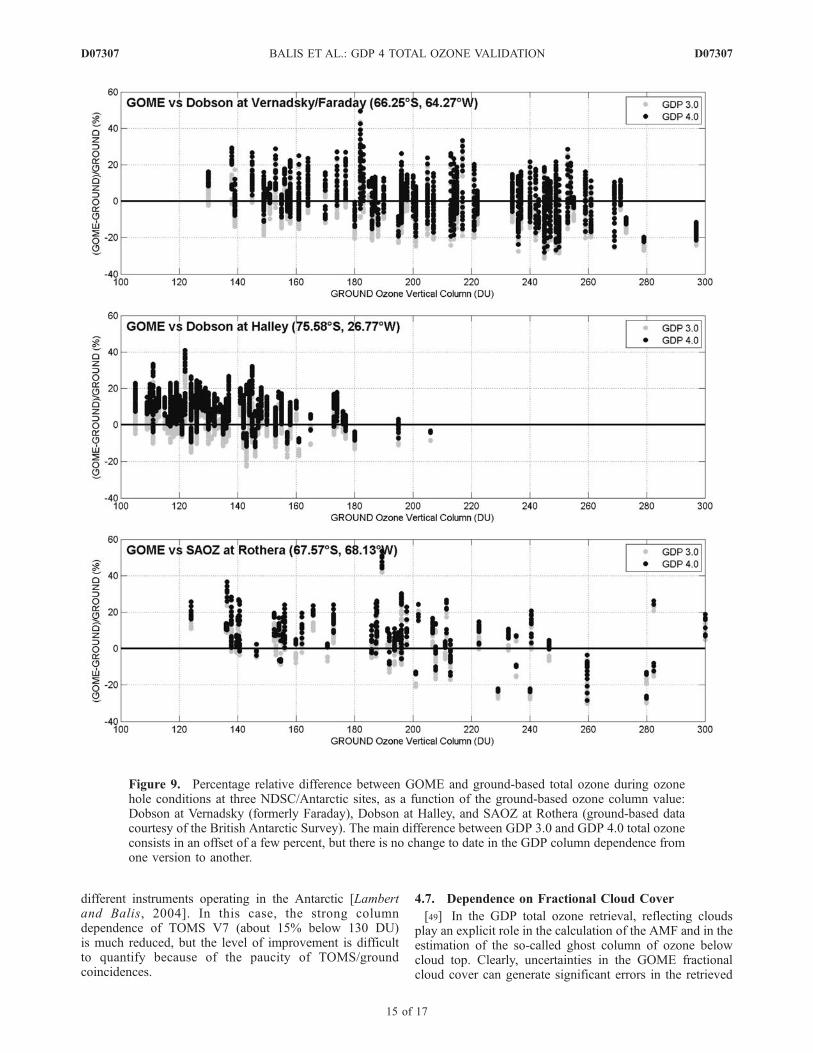
different instruments operating in the Antarctic [Lambertand Balis, 2004]. In this case, the strong columndependence of TOMS V7 (about 15% below 130 DU)is much reduced, but the level of improvement is difficultto quantify because of the paucity of TOMS/groundcoincidences.
4.7. Dependence on Fractional Cloud Cover
[49] In the GDP total ozone retrieval, reflecting cloudsplay an explicit role in the calculation of the AMF and in theestimation of the so-called ghost column of ozone belowcloud top. Clearly, uncertainties in the GOME fractionalcloud cover can generate significant errors in the retrieved
Figure 9. Percentage relative difference between GOME and ground-based total ozone during ozonehole conditions at three NDSC/Antarctic sites, as a function of the ground-based ozone column value:Dobson at Vernadsky (formerly Faraday), Dobson at Halley, and SAOZ at Rothera (ground-based datacourtesy of the British Antarctic Survey). The main difference between GDP 3.0 and GDP 4.0 total ozoneconsists in an offset of a few percent, but there is no change to date in the GDP column dependence fromone version to another.
D07307 BALIS ET AL.: GDP 4 TOTAL OZONE VALIDATION
15 of 17
D07307
total ozone value. To date, the largest effect with GDP 2.7was the 6% average offset identified in the Antarcticspringtime [Lambert et al., 2000, 2002]. This was due tothe combined effects of (1) the use of an unsuitable ozoneprofile database with too high tropospheric ozone values forthe given conditions; (2) a fractional cloud cover systemat-ically set to 1, thus ensuring maximum application of theghost column correction; and (3) a significant contributionof tropospheric ozone to the vertical column when strato-spheric ozone is depleted. With GDP 3.0, this particularoffset disappeared, thanks to the use of a more suitableozone profile database for both AMF and ghost columnestimations [Lambert et al., 2002; Spurr et al., 2005].[50] Compared to GDP 3.0 results, the dispersion
between GDP 4.0 and ground-based total ozone data hasimproved sometimes by a factor of two for clear skyscenarios. The situation is unchanged for cloudy scenes.(For examples of the changes in cloud fraction dependencebetween GDP 3.0 and GDP 4.0, see Figure 40 in [Lambertand Balis, 2004] for comparisons at the NDSC/Alpinestation of Arosa and Figure 41 at high-latitude stations).The reduced clear-sky dispersion is likely the result of thenew molecular Ring effect correction and improved AMFcalculations in GDP 4.0.
5. Conclusion
[51] For the upgrade to GDP 4.0, improvements in thealgorithm and their effects on the GOME total ozoneproducts have been validated using a variety of methodsbased on comparisons with correlative measurements fromextensive ground-based networks. In general, it is con-firmed that modifications implemented in GDP 4.0produced expected changes in the data products. However,it must be kept in mind that reported studies rely on arepresentative but limited set of orbits and unverified effectscannot therefore be ruled out.[52] Total ozone data processed with different versions of
the GOME data processor (GDP) have been validated frompole to pole through comparisons with ground-basedmeasurements from Brewer and Dobson UV spectropho-tometers and SAOZ/DOAS UV-visible spectrometers, asavailable from the WOUDC and NDSC data archives.TOMS V7 and V8 ozone column data have been studiedsimilarly. Special attention has been paid to the qualitycontrol and documentation of ground-based data sets.
5.1. GOME Total Ozone
[53] The main achievement with GDP 4.0 is the drasticreduction of nearly all the remaining dependences on thelatitude, SZA and season that persisted with GDP 3.0. Thereduced ozone column dependence of GDP 3.0 has notchanged with GDP 4.0. In general, the average agreement ofGDP 4.0 with correlative ozone column measurements isnow at the ‘‘percent level’’ at low and moderate SZA, thatis, within the precision level of ground-based sensors whenthe latter are corrected for their own dependences on theseason, solar elevation, temperature etc. At polar latitudes,and at GOME solar zenith angles larger than 80�, prelim-inary validation indicates that the agreement is slightlyworse; however, average differences at low solar elevationusually do not exceed 5%. As noted already, the total
column products do not suffer from any long-term drift ofquality from 1995 to 2003, despite instrument degradation;the stability of the GDP 4.0 ozone data record enables it tobe used confidently for ozone trend monitoring. In addition,the greatly improved quality of the GDP 4.0 ozone productsmakes them suitable for a wide variety of other geophysicalresearch applications, such as polar process studies.
5.2. TOMS Total Ozone
[54] The upgrade to TOMS V8 is a marked improvement(with respect to the seasonal, meridian, and ozone columndependences) over V7. The systematic offset observed withTOMS V7 over the whole Southern Hemisphere has beeneliminated. The TOMS V7 overestimation of extremely lowozone column values observed in the Antarctic springtimehas also been corrected with TOMS V8. Seasonal andlatitudinal dependencies still persist with TOMS V8 buttheir amplitudes are reduced to within 1% of ground-basedstations. Both TOMS algorithms exhibit clear sensitivity toinstrumental degradation: TOMS reports systematicallylower ozone column values by a few percent from thesecond part of 2001 onward, when compared to more stablemeasurement systems. This result confirms the recommen-dation expressed by NASA/GSFC that EP TOMS ozonedata acquired after 2000 should not be used for trendassessments.
5.3. GDP 4.0 Product
[55] The complete GOME data record from July 1995onward has been reprocessed with GDP 4.0 and is availableto the public via the ERS Help and Order desk. Documen-tation on GDP algorithms and products has been updated: anew algorithm theoretical basis document (ATBD) andValidation Report, a revised Product Specification Docu-ment (PSD), and GOME Data Disclaimer 2004. The GOMEvalidation Web site has also been updated. To order GOMEproducts or for further information, please contact EO HelpDesk, ESA ESRIN, Via Galileo Galilei, I-00044, Frascati,Italy, +39 06 94180 777 (phone); +39 06 94180 272 (fax);[email protected]; http://earth.esa.int/gome).
[56] Acknowledgments. We would like to acknowledge the numer-ous observers who have taken systematic total ozone measurements atground-based stations of the Global Ozone Observing System for some-times more than 40 years and who have made their data available throughthe WOUDC and NDSC archives. Their sustained support in interpretingsatellite/ground comparisons, and consequently in improving satellite dataproducts, is greatly appreciated. Many scientists at a number of institutionsin Europe and America have made contributions to the GOME dataprocessing effort. In particular, we would like to thank colleagues fromUni. Bremen (Germany), KNMI (Netherlands), Uni. Heidelberg(Germany), BIRA-IASB (Belgium), DLR (Germany), SAO (USA), SRON(Netherlands), NASA Goddard (USA), RAL (Great Britain) and AUTH(Greece). We would also like to thank colleagues from the followingagencies: ESA-ESTEC (Netherlands), ESA-ESRIN (Italy), and EUMET-SAT (Germany). We would like to thank our reviewers for detailedcomments; the paper has benefited significantly as a result. This workwas funded mainly through an ESA contract: Upgrade of the GOME dataprocessor for improved total ozone columns, ERSE-ESPR-EOPS-SW-04-0001. GOME-related activities at BIRA-IASB have also been supported byProDEx and the Belgian Science Policy (PEA 15151/01/NL/SFe(IC)). Inaddition, V. Amiridis acknowledges the support of GSRT-Greece.
ReferencesBernhard, G., R. D. Evans, G. J. Labow, and S. J. Oltmans (2005), Bias inDobson total ozone measurements at high latitudes due to approximationsin calculations of ozone absorption coefficients and air mass, J. Geophys.Res., 110, D10305, doi:10.1029/2004JD005559.
D07307 BALIS ET AL.: GDP 4 TOTAL OZONE VALIDATION
16 of 17
D07307
Bovensmann, H., J. Burrows, M. Buchwitz, J. Frerick, S. Noel, V. Rozanov,K. Chance, and A. Goede (1999), SCIAMACHY: Mission objectives andmeasurement modes, J. Atmos. Sci., 56, 127–150.
Bramstedt, K., J. Gleason, D. Loyola, W. Thomas, A. Bracher, M. Weber,and J. P. Burrows (2003), Comparison of total ozone from the satelliteinstruments GOME and TOMS with measurements from the Dobsonnetwork 1996–2000, Atmos. Chem. Phys., 3, 1409–1419.
Burkholder, J. B., and R. K. Talukdar (1994), Temperature dependence ofthe ozone absorption spectrum over the wavelength range 410 to 760 nm,J. Geophys. Res., 21, 581–584.
Burrows, J., et al. (1999), The Global Ozone Monitoring Experiment(GOME): Mission concept and first scientific results, J. Atmos. Sci.,56, 151–175.
Coldewey-Egbers, M., M. Weber, L. N. Lamsal, R. de Beek, M. Buchwitz,and J. P. Burrows (2005), Total ozone retrieval from GOME UV spectraldata using the weighting function DOAS approach, Atmos. Chem. Phys.,5, 1015–1025.
Dobson, G. M. B. (1957), Observer’s handbook for the ozone spectro-photometer, in Annales International Geophysical Year, V, Part I: Ozone,pp. 46–89, Elsevier., New York.
ESA (1995), GOME Global Ozone Monitoring Experiment Users Manual,edited by F. Bednarz, ESA SP-1182, Eur. Space Agency, Paris.
Eskes, H. J., R. J. van der A, E. J. Brinksma, J. P. Veefkind, J. F. de Haan,and P. J. M. Valks (2005), Retrieval and validation of ozone columnsderived from measurements of SCIAMACHY on Envisat, Atmos. Chem.Phys. Discuss., 5, 4429–4475.
Fioletov, V., J. Kerr, E. Hare, G. Labow, and R. McPeters (1999), Anassessment of the world ground-based total ozone network performancefrom the comparison with satellite data, J. Geophys. Res., 104, 1737–1747.
Kerr, J. B., C. T. McElroy, and W. F. J. Evans (1983), The automatedBrewer spectrophotometer for measurement of SO2, O3, and aerosols,in Proceedings of the WMO/AMS/CMOS Symposium on MeteorologicalObservations and Instrumentation, pp. 470–472, Am. Meteorol. Soc.,Boston, Mass.
Kerr, J. B., I. A. Asbridge, and W. F. J. Evans (1988), Intercomparison oftotal ozone measured by the Brewer and Dobson spectrophotometers atToronto, J. Geophys. Res., 93, 11,129–11,140.
Komhyr, W. D., C. L. Mateer, and R. D. Hudson (1993), Effective Bass-Paur 985 ozone absorption coefficients for use with Dobson ozone spec-trophotometers, J. Geophys. Res., 98, 20,451–20,465.
Labow, G. J., R. D. McPeters, and P. K. Bhartia (2004), A comparison ofTOMS, SBUV and SBUV/2 version 8 total column ozone data with datafrom ground stations, in Ozone: Proceedings of the XX QuadrennialOzone Symposium, 1–8 June 2004, Kos, Greece, edited by C. S. Zerefos,pp. 123–124, Univ. of Athens, Greece.
Lambert, J. C. (2000), Combined characterization of GOME and TOMStotal ozone measurements from space using ground-based observationsfrom the NDSC, Adv. Space Res., 26, 1931–1940.
Lambert, J.-C., et al. (1998), GOME and TOMS total ozone in northernwinter 1996/1997: Comparison with SAOZ/UV-visible ground-basedmeasurements in the Arctic and at middle latitude, in Polar StratosphericOzone 1997: Air Pollution Research Report 66. Proceedings of theFourth European Symposium 22 to 26 September 1997, Schliersee,Bavaria, Germany, edited by N. R. P. Harris, I. Kilbane-Dawe, andG. T. Amanatidis, pp. 696–699, Eur. Comm., Brussels.
Lambert, J.-C., M. Van Roozendael, M. De Maziere, P. C. Simon, J.-P.Pommereau, F. Goutail, A. Sarkissian, and J. F. Gleason (1999), Inves-tigation of pole-to-pole performances of spaceborne atmospheric chem-istry sensors with the NDSC, J. Atmos. Sci., 56, 176–193.
Lambert, J.-C., et al. (2002), ERS-2 GOME GDP3.0 Implementation andDelta Validation Report for GOME Level-1-to-2 data processor
Upgrade to Version 3.0, ESA Tech. Note ERSE-DTEX-EOAD-TN-02-0006, Eur. Space Agency, Paris.
Lambert, J.-C., and D. Balis (2004), Delta Validation Report for ERS-2GOME data processor Upgrade to Version 4.0, ESA Tech. Note ERSE-CLVL-EOPG-TN-04-0001, Eur. Space Agency, Paris.
Loyola, D., et al. (1997), Ground segment for ERS-2 GOME data processor,in 3rd Symposium on Space in the Service of our Environment, Florence,Italy, Eur. Space Agency Spec. Publ., ESA SP, 414, 591–597.
Papoulis, A., and S. Pillai (2002), Probability, Random Variables andStochastic Processes, 4th ed., McGraw-Hill, New York.
Pommereau, J.-P., and F. Goutail (1988), Ground-based measurements byvisible spectrometry during Arctic winter and spring 1988, Geophys. Res.Lett., 15, 891–894.
Rodgers, C. D. (1990), Characterization and error analysis of profilesretrieved from remote sounding measurements, J. Geophys. Res., 95,5587–5595.
Roscoe, H. K. (1999), Slant column measurements of O3 and NO2 duringthe NDSC intercomparison of zenith-sky UV-visible spectrometers inJune 1996, J. Atmos. Chem., 32, 281–314.
Sarkissian, A., H. Roscoe, D. Fish,M. Van Roozendael,M. Gil, A. Dahlback,L. Perliski, J.-P. Pommereau, and J. Lenoble (1995), Ozone and NO2 air-mass factors for zenith-sky spectrometers: Intercomparison of calculationswith different radiative transfer models, Geophys. Res. Lett., 22, 1113–1116.
Spurr, R., et al. (2005), GOME level 1-to-2 data processor version 3.0(2005): A major upgrade of the GOME/ERS-2 total ozone retrieval algo-rithm, Appl. Opt., 44, 7196–7209.
Staehelin, J., J. Kerr, R. Evans, and K. Vanicek (2003), Comparison of TotalOzone Measurements of Dobson and Brewer Spectrophotometersand Recommended Transfer Functions, WMO TD 1147, GAW Rep. 149,39 pp., World Meteorol. Org., Switzerland.
Stammes, P., P. Levelt, J. de Vries, H. Visser, B. Kruizinga, C. Smorenburg,G. Leppelmeier, and E. Hilsenrath (1999), Scientific requirements andoptical design of the ozone monitoring instrument on EOS-CHEM, inEarth Observing Systems IV, vol. SPIE 3750, edited by W. L. Barnes,pp. 221–232, Int. Soc. for Opt. Eng. (SPIE), Bellingham, Wash.
Van Roozendael, M., et al. (1998), Validation of ground-based UV-visiblemeasurements of total ozone by comparison with Dobson and Brewerspectrophotometers, J. Atmos. Chem., 29, 55–83.
Van Roozendael, M., et al. (2006), Ten years of GOME/ERS-2 total ozonedata—The new GOME data processor (GDP) version 4: 1. Algorithmdescription, J. Geophys. Res., 111, D14311, doi:10.1029/2005JD006375.
Weber, M., L. N. Lamsal, M. Coldewey-Egbers, K. Bramstedt, and J. P.Burrows (2005), Pole-to-pole validation of GOMEWFDOAS total ozonewith ground based data, Atmos. Chem. Phys., 5, 1341–1355.
WMO (1998), Scientific Assessment of Ozone Depletion: 1998, GlobalOzone Res. and Monit. Proj. Rep. 44, World Meteorol. Org., Geneva.
WMO (2003), Scientific Assessment of Ozone Depletion: 2002, GlobalOzone Res. and Monit. Proj. Rep. 47, World Meteorol. Org., Geneva.
�����������������������V. Amiridis and D. Balis, Aristotle University of Thessaloniki, Box 149,
54124 Thessaloniki, Greece.P. Gerard, J. Granville, J.-C. Lambert, and M. Van Roozendael, Belgian
Institute for Space Aeronomy, 3 Avenue Circulaire, B-1180 Brussels,Belgium.R. Spurr, RT Solutions, Inc., 9 Channing Street, Cambridge, MA 02138,
USA. ([email protected])Y. Livschitz, D. Loyola, and P. Valks, German Aerospace Center (DLR),
Remote Sensing Technology Institute (IMF), P.O. Box 1116, D-82234Wessling, Germany.C. Zehner, ESA/ESRIN, Via Galileo Galilei CP.64, 00044 Frascati, Italy.
D07307 BALIS ET AL.: GDP 4 TOTAL OZONE VALIDATION
17 of 17
D07307
Related Documents