PAGEOPH, Vol. 147, No. 1 (1996) 0033-4553/96/010147-1351.50 + 0.20]0 1996 Birkh/iuser Verlag, Basel Temporal Variations in the Fractal Properties of Seismicity in the North Anatolian Fault Zone between 31~ and 41~ ALl OSMAN (~)NCEL, 1"2 IAN MAIN, 2 (~)MER ALPTEKiN 1 and PATIENCE COWIE 2 Abstract--We investigate the nature of temporal variations in the statistical properties of seismicity associated with the North Anatolian Fault Zone between longitudes 31~176 during the instrumental period 1900-1992. Temporal variations in the seismic b value and the fractal (correlation) dimension D c of earthquake epicenters are examined for earthquakes of magnitude M s > 4.5, using sliding windows of 100 consecutive events, b varies temporally between 0.6 and 1.0, and Dc between 0.6 and 1.4, both representing significant fluctuations above the errors in measurement technique. A strong negative correlation (r = -0.85) is observed between b and De, consistent with previous observation of seismicity in Japan and southern California. Major events early in this century (Ms > 7) are associated with low b and high De, respectively consistent with greater stress intensity and greater spatial clustering of epicenters--both implying a greater degree of stress concentration at this time. Key words: Seismicity, fractal dimension, North Anatolian fault zone. I. Introduction The recognition of a wide variety of phenomena in nature as examples of scale-invariant or fractal sets (MANDELBROT, 1982) suggests that many complex natural phenomena--including faulting and earthquakes--may be described and interpreted in terms of their fractal geometry. For example one of the most widely-used statistical descriptions of seismicity is the Gutenberg-Richter b value, obtained from a frequency-magnitude distribution of the form: log N = a - brn, (1) where N is the number of events with magnitude greater than m and a is a constant. The b value represents a scaling exponent which may be related to the fractal dimension of earthquake magnitude (AKI, 1981; KING, 1983; TURCOTTE, 1986), and shows systematic variations before, during and after major earthquakes (SMITH, 1986). Similar variations are seen in laboratory experiments, and have been 1 Department of Geophysical Engineering, Istanbul University, 34850 Avcilar, Istanbul, Turkey. 2 Department of Geology and Geophysics, University of Edinburgh, Edinburgh EH9 3JZ, U.K.

Welcome message from author
This document is posted to help you gain knowledge. Please leave a comment to let me know what you think about it! Share it to your friends and learn new things together.
Transcript
PAGEOPH, Vol. 147, No. 1 (1996) 0033-4553/96/010147-1351.50 + 0.20]0 �9 1996 Birkh/iuser Verlag, Basel
Temporal Variations in the Fractal Properties of Seismicity in the North Anatolian Fault Zone between 31~ and 41~
ALl OSMAN (~)NCEL, 1"2 IAN MAIN, 2 (~)MER ALPTEKiN 1 a n d PATIENCE COWIE 2
A b s t r a c t - - W e investigate the nature of temporal variations in the statistical properties of seismicity associated with the North Anatolian Fault Zone between longitudes 31~176 during the instrumental period 1900-1992. Temporal variations in the seismic b value and the fractal (correlation) dimension D c of earthquake epicenters are examined for earthquakes of magnitude M s > 4.5, using sliding windows of 100 consecutive events, b varies temporally between 0.6 and 1.0, and Dc between 0.6 and 1.4, both representing significant fluctuations above the errors in measurement technique. A strong negative correlation (r = -0.85) is observed between b and De, consistent with previous observation of seismicity in Japan and southern California. Major events early in this century ( M s > 7) are associated with low b and high De, respectively consistent with greater stress intensity and greater spatial clustering of epicenters--both implying a greater degree of stress concentration at this time.
Key words: Seismicity, fractal dimension, North Anatolian fault zone.
I . I n t r o d u c t i o n
The recognition of a wide variety of phenomena in nature as examples of scale-invariant or fractal sets (MANDELBROT, 1982) suggests that many complex natural phenomena--including faulting and earthquakes--may be described and interpreted in terms of their fractal geometry. For example one of the most widely-used statistical descriptions of seismicity is the Gutenberg-Richter b value, obtained from a frequency-magnitude distribution of the form:
log N = a - brn , (1)
where N is the number of events with magnitude greater than m and a is a constant. The b value represents a scaling exponent which may be related to the fractal dimension of earthquake magnitude (AKI, 1981; KING, 1983; TURCOTTE, 1986), and shows systematic variations before, during and after major earthquakes (SMITH, 1986). Similar variations are seen in laboratory experiments, and have been
1 Department of Geophysical Engineering, Istanbul University, 34850 Avcilar, Istanbul, Turkey. 2 Department of Geology and Geophysics, University of Edinburgh, Edinburgh EH9 3JZ, U.K.
148 A.O. Oncel et al. PAGEOPH,
attributed to rock heterogeneity (MoGI, 1962) or stress (SCHOLZ, 1968). The most recent studies (MAIN et al., 1990) have extended and unified these observations into a single negative correlation between b and the degree of stress concentration mea- sured by the relative stress intensity factor K/K, , where K, is the fracture toughness.
Many studies based on earthquake catalogues have demonstrated that the clustering properties of earthquakes in space and time are also fractal, with a scaling exponent equal to the two-point correlation dimension D, (e.g., KAGAN and KNOPOFF, 1980; SADOWSKY et al., 1984). This observation is also confirmed on a laboratory scale (HIRATA et al., 1987). The morphology of the surface trace of the San Andreas fault has also been shown to be scale-invariant (AvILES et al., 1986; OKUBO and AKI, 1987) which exist only for a limited scale range (DAVY, 1993) using different techniques. These observations provide a rationale for the analysis of our data in terms of fractal scaling exponents.
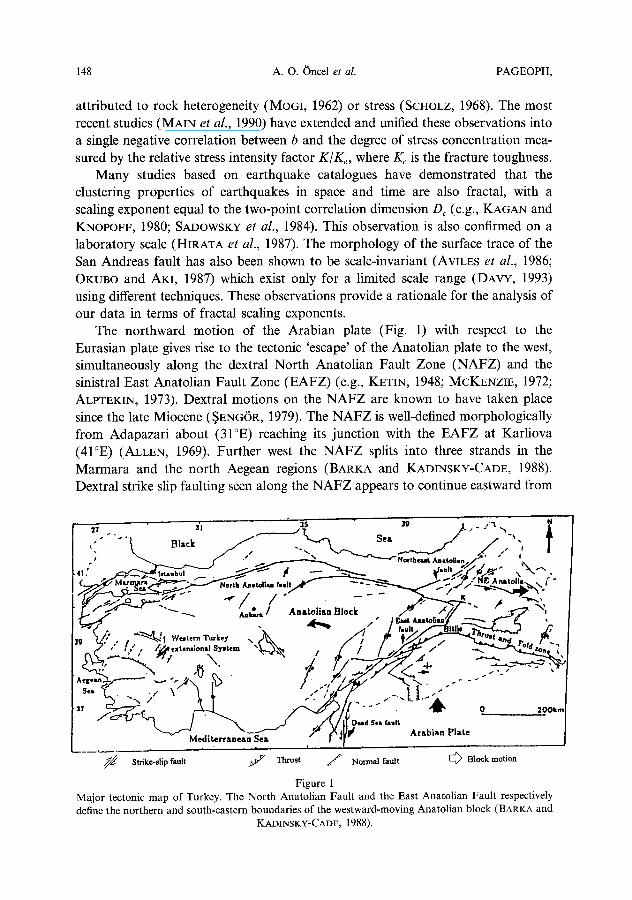
The northward motion of the Arabian plate (Fig. 1) with respect to the Eurasian plate gives rise to the tectonic 'escape' of the Anatolian plate to the west, simultaneously along the dextral North Anatolian Fault Zone (NAFZ) and the sinistral East Anatolian Fault Zone (EAFZ) (e.g., KETIN, 1948; MCKENZIE, 1972; ALPTEKIN, 1973). Dextral motions on the NAFZ are known to have taken place since the late Miocene ($ENG6R, 1979). The NAFZ is well-defined morphologically from Adapazari about (31~ reaching its junction with the EAFZ at Karliova (41~ (ALLEN, 1969). Further west the NAFZ splits into three strands in the Marmara and the north Aegean regions (BARKA and KADINSKY-CADE, 1988). Dextral strike slip faulting seen along the NAFZ appears to continue eastward from
," . . . . Black See. , "t
# ~ , / - "~ % ~ N o r t h l u t Anltollan ~'~i" �9 I
~<L. - /~ .~_~ 7 ~ - ~ - " - ~ " / / - - - . . . ' ~ - - - k - - a . - - . - . ,
' " >, ' \ I . - . t i t ; - : : ~ I " " ~ ' ~ / 7 / ( 1 : o.~ ,,. ,..,,
V M , d i ~ r r a n ~ - S ' ~ - - " X :I I~' Ar ,bh in Plate * i
. _ _ _ ~ .
Strike-slipfault f Thrust / Normalfault [~Blockmofion
Figure 1 Major tectonic map of Turkey. The North Anatolian Fault and the East Anatolian Fault respectively define the northern and south-eastern boundaries of the westward-moving Anatolian block (BARKA and
KADINSKY-CADE, 1988).
Vol. 147, 1996 Temporal Variations in the Fractal Properties of Seismicity 149
41~ but is not as continuous as it is along the NAFZ (JACKSON, 1992). The area of prime interest in this study (31~176 has a total length of about 1000- l l00km, about 900km of which has been ruptured in a series of six large earthquakes this century. These earthquakes show an apparent westward migration of epicenters along the trace of the fault from 1939 to 1967 (AMBRASEYS, 1970; BARKA, 1992). Some segments have remained unbroken during this suggested migration, and may therefore be potential seismic gaps to be broken in the future (ToKS6Z et al., 1979).
The main aim of this paper is to examine temporal variations in the fractal properties of earthquakes (M s >_ 4.5) occurring on this part of the NAFZ (between 31~176 between 1900 and 1992. In a separate paper (ONCEL et al., 1994) we investigate the spatial variations of similar properties along the Anatolian fault zones in a much larger geographical context. The data provide an opportunity to examine statistically significant temporal variations in b and D c which may reflect variations in the underlying physical processes.
2. Method of Analysis
b and Dc were estimated for sliding windows of 100 consecutive events, the window advancing by 10 events between each individual calculation. We prefer a window containing a fixed number of events, rather than one pertaining to a fixed period of time, because this leads to consistency in the statistical reliability of the results.
The b value was estimated using the maximum likelihood method (AKL 1965):
b - log10 e (m) -- m o (2)
where e is 2.71828 and (m) is the average magnitude and mo is the threshold magnitude for complete reporting of the earthquake magnitudes. The 95% confi- dence limits for this estimate are -t- 1.96b/,f~, where n is the number of points used (here n = 100). The b value ranges between 0.6 and 1.0 in the present work, implying a typical error of +0.1-0.2.
The fractal clustering properties of seismicity in space for the same time windows were characterized by the two-point correlation dimension (GRASS- BERGER and PROCACCIA, 1983), obtained from the distribution of earthquake epicenters. Epicenters were preferred over hypocenters because of the large horizon- tal scale of the study area compared with a seismogenic depth of 10 km or so, and because of the greater error in depth determination. We preferred the use of the correlation integral technique (giving a correlation dimension) to the box counting algorithm (which gives a fractal 'capacity' dimension) because of its greater reliability and sensitivity to small changes in clustering properties (e.g., KAGAN and
i50 A . O . <~ncel et al. PAGEOPH,
K N O P O F F , 1980 ; H I R A T A , 1989). The correlation dimension D~ is found from:
D+ = lim log C(r) ,.-+.0 log r (3)
where r is the distance between two epicenters, here represented by the arc of a circle measured on the earth's surface, and C(r) is the correlation function:
2 N R < r CCr) = (4)
n(n - 1)
where NR< + is the number of points separated by a distance R less than r. The distance R (in degrees) between two events is calculated from:
?" = C O S - - I ( c o s 0 i C O S Oj -}- sin 0i sin 0j cos(4h - qSj)) ( 5 )
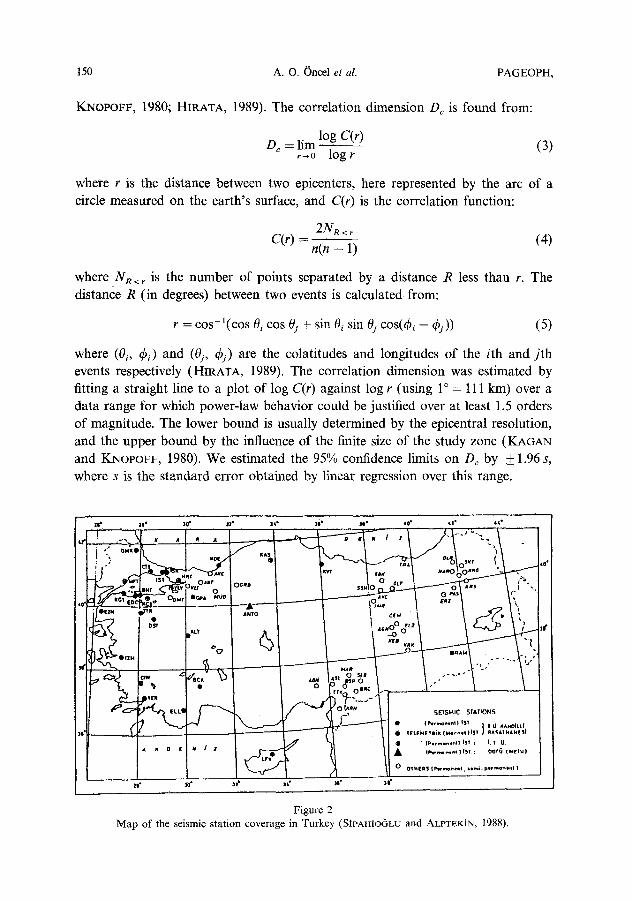
where (Oi, ~)i) and (0j., qSj.) are the colatitudes and longitudes of the ith and j th events respectively (HIRATA, 1989). The correlation dimension was estimated by fitting a straight line to a plot of log C(r) against log r (using 1 ~ = 111 km) over a data range for which power-law behavior could be justified over at least 1.5 orders of magnitude. The lower bound is usually determined by the epicentral resolution, and the upper bound by the influence of the finite size of the study zone (KAGAN a n d K N O P O F F , 1980). We estimated the 95% confidence limits on D+ by + 1.96 s, where s is the standard error obtained by linear regression over this range.
IIr ~I| ~ 30" 31 ~ 34" 31" 31" t.o ~ ++I" ,it.* [ ' . . . . . +-~+
+ - . ~ . ,, +, ,, ,, I ~ , / + I -~ -... �9 ( ' , . ; , e l " ' -
i l" ~1 + o i
5" ~,,7 ++'..~."~'..p,;, I oo+, [ t _ ' ,,, I ~ / ,~+. I'-"~+.~-.++..-I,,, < ' ~ e ''.+'- o I . . . . I , , ,!o . . 9 _ . _ . ~ , . o i , , , , I<-' "" "1,+_ "" *~ . . . . k - - -A- - - - - - t ' - ' - - - - t , , , I ' " + _ + ~. J
~,~7 I �9 t I t,,.oo ,,,/ 1 c . ~ 1~: _J , eL, q~~ 6 ~" 'd"
r ~ v' + �9 , o L.~"..;,r I_ +t'"
i + �9 . . . . . . . . ..... + ~ - ~ ~ I " - - - ' - + - ~ + ' - ' - ~ L : . ,tt*mlt'r.lt~r . . . . . . , , s , ]+~+++. . . . . . l~sl
I - Y ' - ~ " I~ t �9 q . . . . . m . . . . . . 0 , ,+,, ,
) t . ~ 1 7 6 . . . . . . . . . . , .......... ,
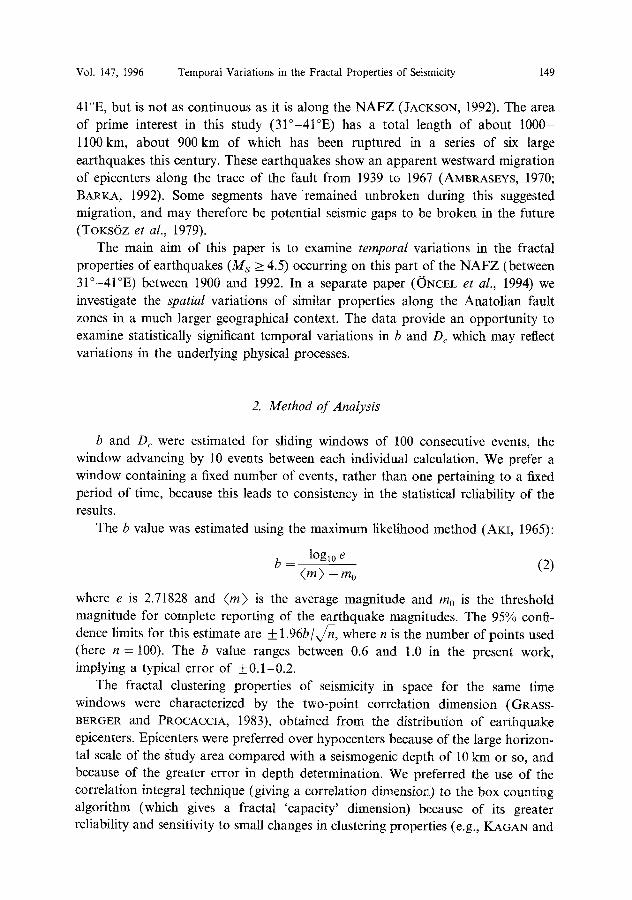
Figure 2 Map of the seismic station coverage in Turkey (StPAHtO6LU and ALPTEKiN, 1988).
o z E
~n
�9 2 P~
e-.
Figu
re 3
M
ap o
f th
e ep
icen
ter
dist
ribu
tion
of
eart
hqua
kes
of M
s
>_ 4
.0 b
etw
een
1900
-19
92.
The
are
a of
pre
sent
stu
dy (
NA
FZ
) is
out
lined
. ~,
,
152 A.O. Oncel et al. PAGEOPH,
3. The Data
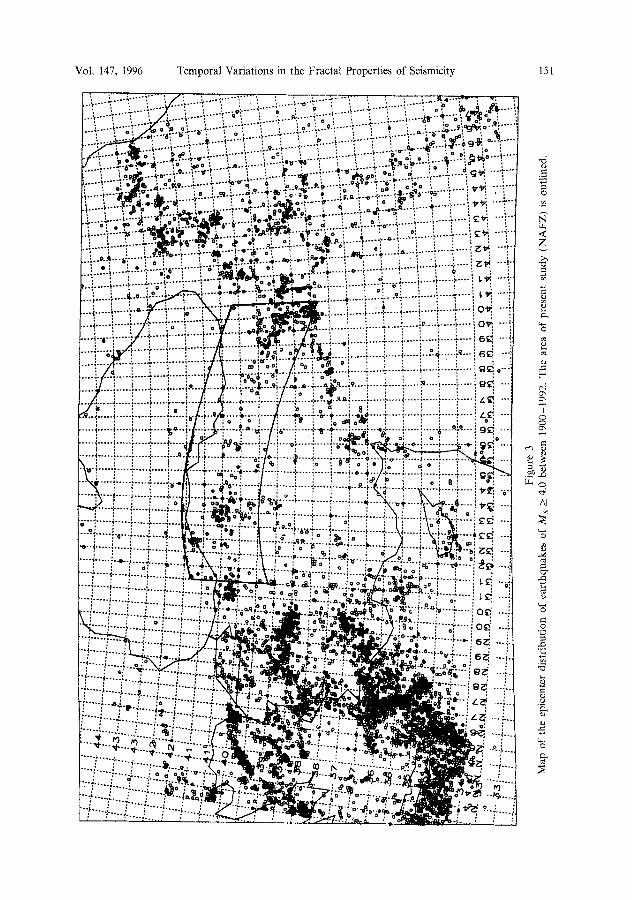
The earthquake catalogue for the NAFZ which is used in this study was compiled from the International Seismological Centre Data File, augmented by the Turkish national network and many local seismic networks shown in Figure 2. The spatial distribution of earthquake epicenters from the whole catalogue is shown in Figure 3, with the area of present interest outlined. Most of the stations in eastern
2
0-
-1
MA(~NITUDE DISTRIBUTION 1900-t945
2
3 4 5 6 7
MAGNITUDE
MAGNITUDE DISTRIBUTION '1946-t%o
Q �9
-1 3 4 5 6 7 s
MAGNITUDE MAGNITUDE DISTRIBUTION
3, 1%1-1992
S 6 7 s
MAGNITUDE
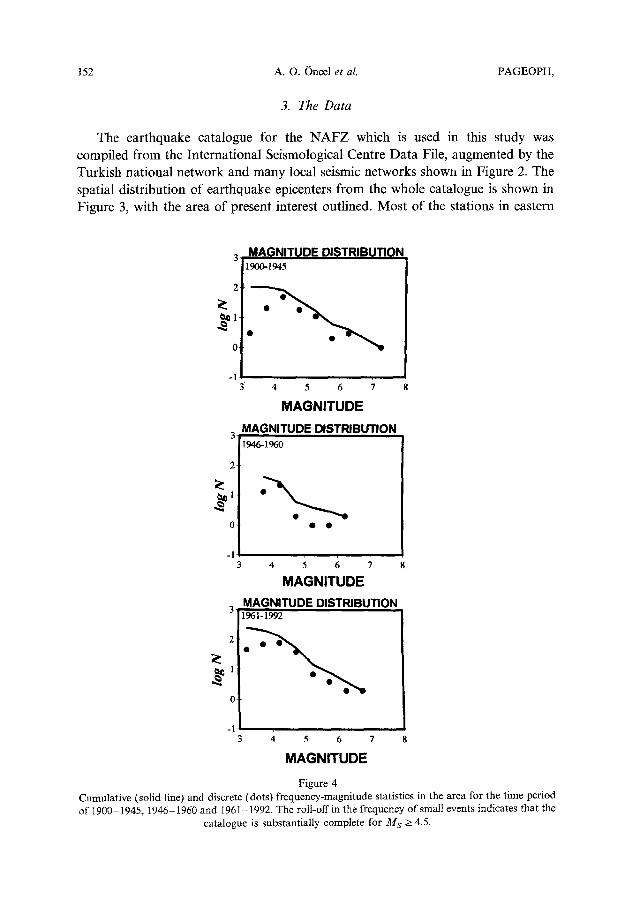
Figure 4 Cumulative (solid line) and discrete (dots) frequency-magnitude statistics in the area for the time period of 1900-1945, 1946-1960 and 1961-1992. The roll-off in the frequency of small events indicates that the
catalogue is substantially complete for M s > 4.5.
Vol. 147, 1996 Temporal Variations in the Fractal Properties of Seismicity 153
Anatolia have been semi-permanent since 1970 (SIPAHIOGLU and ALPTEKIN, 1988). The most reliable seismological data for smaller magnitudes has been obtained after the WWSSN was set up since about 1960. Figure 4 shows the discrete and cumulative frequency-magnitude distributions of M s > 3 for the three divided time period of interest, plotted with a bin size of half a magnitude unit. The straight line on the discrete rather than cumulative distribution plots implies that the catalogue is complete for magnitudes above 4 .5Ms , but the decreasing trend of the data below 4 . 5 M s is most likely due to incomplete reporting of the smaller events. (In the maximum likelihood calculation of equation (2) m 0 was taken as 4.45 since magnitudes are usually quoted to one decimal place.)
4. Results
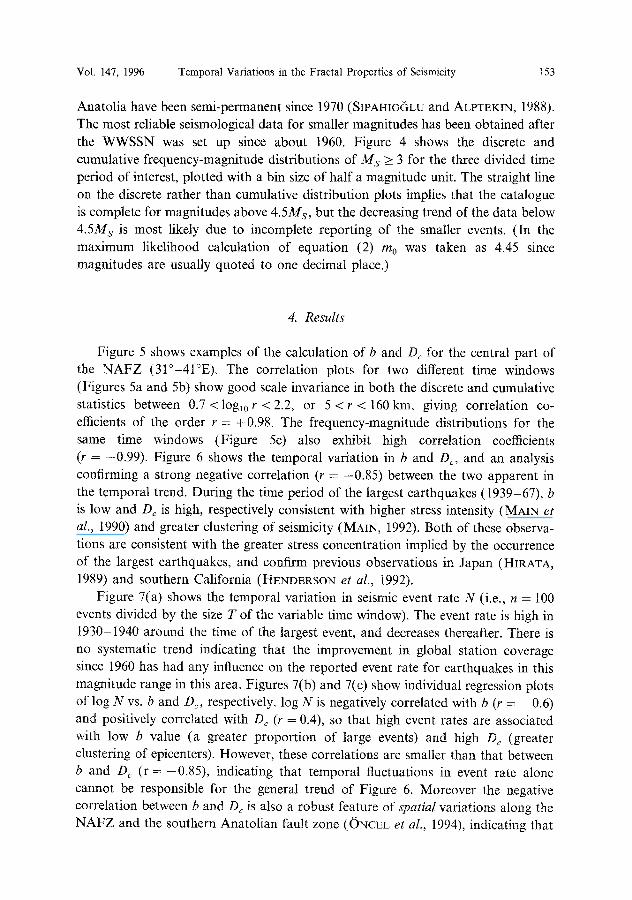
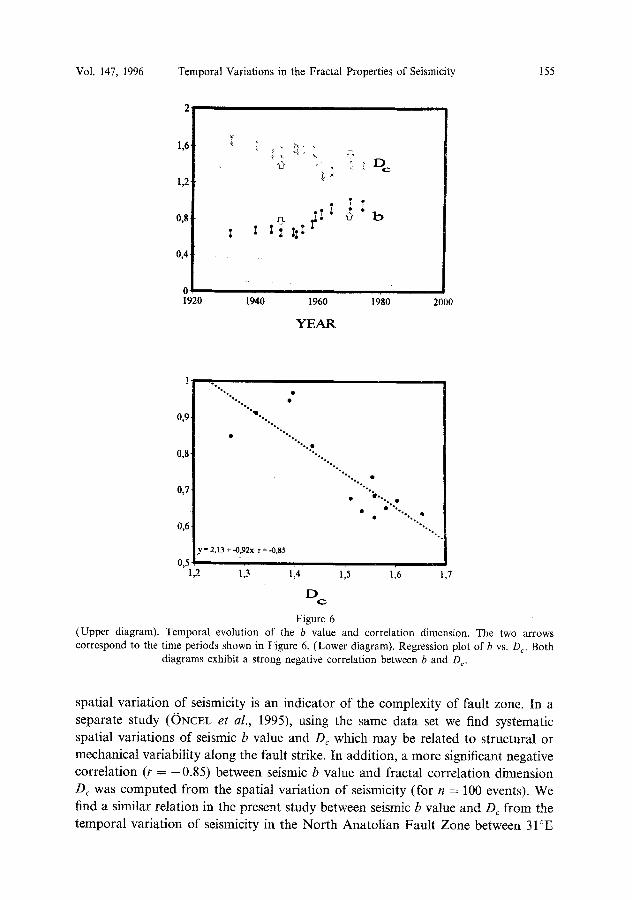
Figure 5 shows examples of the calculation of b and Dc for the central part of the NAFZ (31~176 The correlation plots for two different time windows (Figures 5a and 5b) show good scale invariance in both the discrete and cumulative statistics between 0.7 < log~0 r < 2.2, or 5 < r < 160 kin, giving correlation co- efficients of the order r = +0.98. The frequency-magnitude distributions for the same time windows (Figure 5c) also exhibit high correlation coefficients (r = -0.99). Figure 6 shows the temporal variation in b and De, and an analysis confirming a strong negative correlation (r = -0.85) between the two apparent in the temporal trend. During the time period of the largest earthquakes (1939-67), b is low and Dc is high, respectively consistent with higher stress intensity (MAIN et
al., 1990) and greater clustering of seismicity (MAIN, 1992). Both of these observa- tions are consistent with the greater stress concentration implied by the occurrence of the largest earthquakes, and confirm previous observations in Japan (HIRATA, 1989) and southern California (HENDERSON et al., 1992).
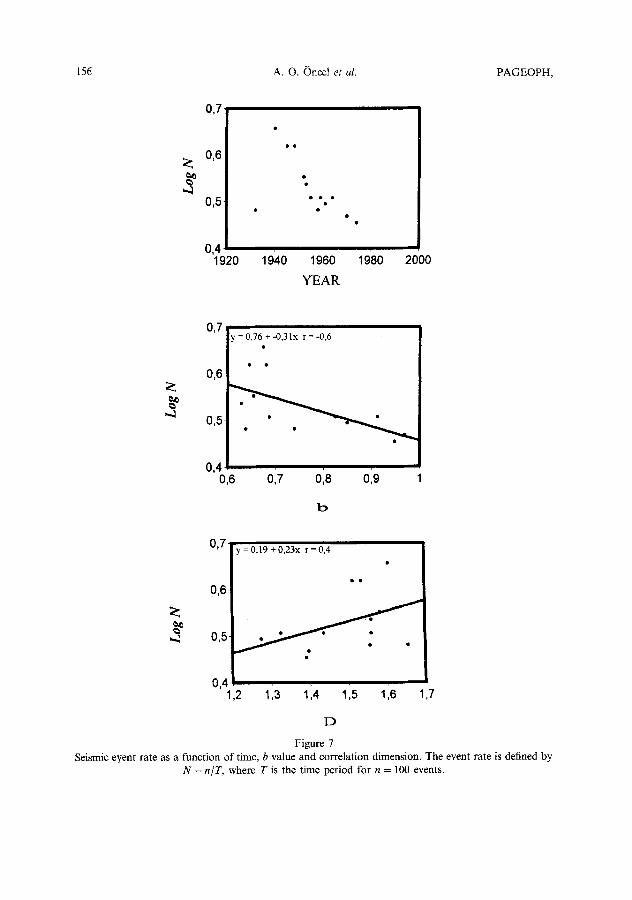
Figure 7(a) shows the temporal variation in seismic event rate N (i.e., n = I00 events divided by the size T of the variable time window). The event rate is high in 1930-1940 around the time of the largest event, and decreases thereafter. There is no systematic trend indicating that the improvement in global station coverage since 1960 has had any influence on the reported event rate for earthquakes in this magnitude range in this area. Figures 7(b) and 7(c) show individual regression plots of log N vs. b and D C, respectively, log N is negatively correlated with b (r = -0.6) and positively correlated with Dc (r = 0.4), so that high event rates are associated with low b value (a greater proportion of large events) and high Dc (greater clustering of epicenters). However, these correlations are smaller than that between b and D c ( r - - -0 .85) , indicating that temporal fluctuations in event rate alone cannot be responsible for the general trend of Figure 6. Moreover the negative correlation between b and D~ is also a robust feature of spatial variations along the NAFZ and the southern Anatolian fault zone (ONcEI~ et al., 1994), indicating that
154
1
0 �84 %
-2
-3 a) o
A. O. Oncel et al.
CORRELATION D I~IENSION
...::::::::::::. eoeOl~ '
i l
I - 2 LOGIo r
PAGEOPH,
CORRELATION DIMENSION l = " ! 0 a y = -3.52 - 1,53x r =0,99
I ..::::: - : i �9 �9
I �9 0 0
�9 0 0 0 . 3 i i i
0,7 l 1,3 1,6 1,9 -,2
LOGIo r 1936-1960
1
0
..d
- 2 �84
-3 b) 0
CORRELATION DIMENSION
..::::::.::::251 �9 O I
1 2 LOGlo r
CORRELATION DIMENSION
=-3 ,17+ i.4x r=0,99
~ , ~
I
0,7 i 1,3 1,6 1,9 _,2 LOGIo r
1953-1987
Z"
o)
MAGNITUDE DISTRIBUTION 3
2 "-I-,-.,. .
",lp''~L_ 1L 1 . *
o 1936-1960
-1 II 3 4 5 6 7
MAGNITUDE
3
2 z
o
-1 8
MAGNITUDE DISTRIBUTION I
": :::
[953-1987
4
* * 8-
5 6 7 8 MAGNITUDE
Figure 5 Example calculations for the correlation dimension and the seismic b value at two different time periods. In (a) and (b) the left-hand diagram gives the entire correlation plot, and the right-hand diagram gives the actual regression fit to the 1.5 orders of magnitude of data for which a linear fit could be obtained (r here in km). In (c) the frequency-magnitude distributions for the same two time periods are shown,
the left-hand column corresponding to time period.
this result reflects fundamen ta l processes of the mechanics of seismogenesis in this
area.
5. D i s c u s s i o n
The spatial and tempora l variat ions of seismicity are dependent on each other
and are associated with non l inea r s t ructural dynamics of faulting. Especially, the
Vol. 147, 1 9 9 6 Temporal Variations in the Fractal Properties of Seismicity 155
2
1,6.
1,2-
0,8i
0,4
0 1920
!
T ~,~'~ " ~ ' b
1940 1960
Y E A R
19'80 2000
1
0,9.
0,8-
0,7
0,6
y = 2,13 + --0,92x r = -0,85
0,5 1,2 113
i%"%~
%1, *.
�9 "%. "%..o
".,,.
114
D C
Figure 6
%.~ ~
~176176 �9 ~ -%
" . "'; . . . : , . �9 ~176
l;S 17
(Upper diagram). Temporal evolution of the b value and correlation dimension. The two arrows correspond to the time periods shown in Figure 6. (Lower diagram). Regression plot of b vs. D c. Both
diagrams exhibit a strong negative correlation between b and De.
spatial variation of seismicity is an indicator of the complexity of fault zone. In a
separate study (ONCEL et al., 1995), using the same data set we find systematic spatial variations of seismic b value and Dc which may be related to structural or mechanical variability along the fault strike. In addition, a more significant negative correlation (r = -0 .85) between seismic b value and fractal correlation dimension D c was computed from the spatial variation of seismicity (for n = 100 events). We find a similar relation in the present study between seismic b value and D c from the temporal variation of seismicity in the North Anatolian Fault Zone between 31 ~
156 A.O. Oncel et al. PAGEOPH,
0,7
0,6
0 , 5
0,4 192o 19,,o 198o 19'8o
YEAR
2000
0,7 = 0 , 7 6 + - 0 , 3 1 x r = - 0 , 6
0,6
0,5
0,4 0,6 017 0,8 0,9
b
0,7
0,6-
0,5.
=0,19 +0,23x r=0,4
0,4 1,2 1,3 1',4 11~ 116 ,7
ID
Figure 7 Seismic event rate as a function of time, b value and correlation dimension. The event rate is defined by
N = n / T , where T is the time period for n = 100 events.
Vol. 147, 1 9 9 6 Temporal Variations in the Fractal Properties of Seismicity 157
and 41~ This implies that spatio-temporal scaling of seismicity may be based on the same mechanical response.
The general form and physical significance of temporal fluctuations in seismic b value has been discussed by many authors (e.g., GIBOWICZ, 1973; MA, 1978; SMITH, 1986; HUANG and TURBOT, 1988; MAIN et al., 1990). The general observa- tion is that (1) the b value usually increases after a major event, and (2) the b value usually increases to a peak value and then decreases to a minimum at the time of occurrence of the next event. Our results show a general trend of increasing seismic b value following the largest earthquake in the catalogue ( M s = 7.9; near Erzincan in 1939). This is consistent with a decrease in stress intensity (MAIN et al., 1990) due either to a relaxation of stress following the Erzincan event (consistent with (1) above), or part of the preparation for the next event (consistent with (2) above). Unfortunately the data are not sufficient to resolve between these possibilities.
6. Conclusion
A strong negative correlation is observed in temporal fluctuations of the seismic b value and the fractal correlation dimension for earthquakes of M s >>_>_>_ 4.5 occurring this century in the central part of the NAFZ (r = -0.85). There is no apparent statistical trend in the event rate associated with variations in station coverage, implying that the results largely reflect the underlying physical mechanism of earthquake recurrence. We find that the largest events are associated with low b value and high De, respectively implying relatively high stress intensity and stronger clustering of epicenters. Both are consistent with the greater stress concentration at the time of major earthquakes. The results are in good agreement with previous studies in Japan and southern California showing a weaker negative correlation between b and De.
Acknowledgements
The work described above was carried out while AOO was a visiting researcher at the University of Edinburgh. We are grateful to David Sharrock and David Bowers for their assistance and advice during this period. A preliminary version of this study has been presented in the 1st International Symposium on Deformations held in Istanbul, Turkey. This work has been partially supported by the Ministry of Foreign Affairs of Turkey.
REFERENCES
AKI, K. (I965), Maximum Likelihood Estimate of b in the Formula logN =a -b in and its Confidence, Bull Earthq. Res. Inst. Tokyo Univ. 43, 237-239.
158 A.O. Oncel et al. PAGEOPH,
AKI, K, A probabilistie synthesis of precursory phenomena. In Earthquake Prediction--An International Review (Simpson, D. W., and P. G. Richards, eds.) (American Geophys. Union, Maurice Ewing Series 4, 1981) pp. 566-574.
ALLEN, C, (1969), Active Faulting in Northern Turkey, Contribution 1577, Div. of Geol. Sci., Calif. Inst. of Technol., Pasadena, 32 pp.
ALPTEKiN, (~. (1973), Focal Mechanisms of Earthquakes in Western Turkey and their Tectonic Implica- tions, Ph.D. Thesis, New Mexico Inst. of Mining and Teach., Socorro, New Mexico.
AMBRASEYS, N. (1970), Some Characteristic Features of the North Anatolian Fault Zone, Tectonophysics 9, 143-165.
AVILES, C. A., SCHOLZ, C. H., and BOATWRIGHT, J. (1986), Fractal Analysis Applied to Characteristics Segment of the San Andreas Fault, J. Geophys. Res. 92, 331-344.
BARKA, A. (1992), The North Anatolian Fault-Zone, Annales Tectonicae 6, 164-195. BARKA, A., and KADINSKY-CADE, K. (1988), Strike-slip Fault Geometry in Turkey and its Influence on
Earthquake Activity, Tectonics 7, 663-684. GIBOWlCZ, S. J. (1973), Variation of the Frequency-magnitude Relation during Earthquake Sequences in
New Zealand, Bull. Seismol. Soc. Am. 63, 517-528. GRASSBERGER, P., and PROCACCIA, I. (1983), Measuring the Strangeness of Strange Attractors, Physica
9D, 189-208. HENDERSON, J., MAIN, I. G., MEREDITH, P. G., and SAMMONDS, P. R. (1992), The Evolution of
Seismic#y: Observation, Experiment and a Fracture-mechanical Interpretation, J. Struct. Geol. 14, 905-913.
HIRATA, T. (1989), A Correlation between the b Value and the Fractal Dimension of Earthquakes, J. Geophys. Res. 94, 7507-7514.
HIRATA, T. SATOH, T., and ITO, K. (1987), Fractal Structure of Spatial Distribution of Microfracturing in Rock, Geophys. J. R. Astr. Soc. 90, 369-374.
HUANG, J., and TURBOT, D. L. (1988), Fractal Distributions of Stress and Strength and Variations of b Value, Earth Planet. Sci. Letts. 91, 223-230.
JACKSON, J. A. (1992), Partitioning of Strike-slip and Convergent Motion between Eurasia and Arabia in Eastern Turkey and the Caucasus, Geophys. J. 97, 12471-12479.
KAGAN, Y. Y., and KNOPOFF, L. (1980), Spatial Distribution of Earthquakes: The Two-point Correlation Function, Geophys. J. R. Astr. Soc. 62, 303-320.
KETIN, I. (1948), (Tber die tektonisch-mechanischen Folgerungen aus den grossen anatolischen Erdbeben des letzten Dezenniums, Geol. Rundsch. 36, 77-83.
MA, H. C. (1978), Variations of the b Values before Several Large Earthquakes Occurred in North China, Acta. Geophys. Sinica 21, 126-141.
MAIN, I, G. (1992), Damage Mechanics with Long-range Interactions: Correlation between the Seismic b Value and the Fraetal Two-point Correlation Dimension, Geophys. J. Int. 111, 531-541.
MAIN, I. G., MEREDITH, P. G., SAMMONDS, P. R., and JONES, C., Influence of fractal flaw distributions on rock deformation in the brittle field. In Deformation Mechanisms, Rheology and Tectonics (Knipe R. J., and E. H. Rutter, eds.) (Geol. Soc. London Special Publication 54, 1990) pp. 81-96.
MANDELBROT, B. B., The Fractal Geometry of Nature (Freeman Press, San Francisco 1982). MCKENZIE, D. D. (1972), Active Tectonics of the Alpine-Himalayan Belt: The Aegean Sea and
Surrounding Regions, Geophys. J. R. Astr. Soc. 30, 109-185. MOGI, K. (1962), Magnitude.frequency Relation for Elastic Shocks Accompanying Fractures of Various
Materials and Some Related Problems in Earthquakes, Bull. Earthq. Res. Inst. Tokyo Univ. 40, 831-853.
OKUBO, P. G., and AKI, K. (1987), Fractal Geometry in the San Andreas Fault System, J. Geophys. Res. 92, 345-355.
ONCEL, A. O., MAIN, I. G., ALPTEKIN, (~., and COWIE, P. A. (1994), Spatial Variations in the Fractal Properties of Seismicity in the North Anatolian Fault Zones, Tectonophysics (submitted).
SADOWSKY, M. A., GOLUBEVA, T. V., PISARENKO, V. F., and Sr~NIRMAN, M. G. (1984), Characteristic Dimensions of Rock and Hierarchy Properties of Seismicity, Izv. Ac. Sci. USSR Phys. Solid Earth 20, 87-96.
SCHOLZ, C. n . (1968), The Frequency-magnitude Relation of Mierofracturing in Rock and its Relation to Earthquakes, Bull. Seism. Soc. Am. 58, 399-415.
Vol. 147, 1 9 9 6 Temporal Variations in the Fractal Properties of Seismicity 159
SIPAHI~OGLU, S., and ALPTEKIN, (~. (1988), Present Appearance of Earthquake Problem in Turkey, Jeofizik 2, 151-183.
SMITH, W. D. (1986), Evidence for Precursory Changes in the Frequency-magnitude b Value, Geophys. J. R. Astron. Soc. 86, 815-838.
~ENG6R, A. M. C. (1979), The North Anatolian Transform Fault: Its Age, Offset and Tectonic Significance, J. Geol. Soc. London 136, 269-282.
TURCOTTE, D. L. (1986), Fractals and Fragmentation, J. Geophys. Res. 9I, 1921-1926. ToKs/Sz, M. N., SHAKAL, A. F., and MICHAEL, A. J. (1979), Space-time Migration of Earthquakes
along the N. Anatolian Fault Zone and Seismic Gaps, Pure and Appl. Geophys. 117, 1258-1269.
(Received February 22, 1995, accepted August 3, 1995)
Related Documents