ORIGINAL ARTICLE Temporal variations in arsenic concentration in the groundwater of Murshidabad District, West Bengal, India S. H. Farooq • D. Chandrasekharam • S. Norra • Z. Berner • E. Eiche • P. Thambidurai • D. Stu ¨ben Received: 20 July 2009 / Accepted: 5 March 2010 Ó Springer-Verlag 2010 Abstract Systematic investigations on seasonal varia- tions in arsenic (As) concentrations in groundwater in both space and time are scarce for most parts of West Bengal (India). Hence, this study has been undertaken to investi- gate the extent of As pollution and its temporal variability in parts of Murshidabad district (West Bengal, India). Water samples from 35 wells were collected during pre- monsoon, monsoon and post-monsoon seasons and ana- lyzed for various elements. Based on the Indian permissible limit for As (50 lg/L) in the drinking water, water samples were classified into contaminated and uncontaminated category. 18 wells were reported as uncontaminated (on average 12 lg/L As) and 12 wells were found contami- nated (129 lg/L As) throughout the year, while 5 wells could be classified as either contaminated or uncontami- nated depending on when they were sampled. Although the number of wells that alternate between the contaminated and uncontaminated classification is relatively small (14%), distinct seasonal variation in As concentrations occur in all wells. This suggests that investigations con- ducted within the study area for the purpose of assessing the health risk posed by As in groundwater should not rely on a single round of water samples. In comparison to other areas, As is mainly released to the groundwater due to reductive dissolution of Fe-oxyhydroxides, a process, which is probably enhanced by anthropogenic input of organic carbon. The seasonal variation in As concentra- tions appear to be caused mainly by dilution effects during monsoon and post-monsoon. The relatively high concen- trations of Mn (mean 0.9 mg/L), well above the WHO limit (0.4 mg/L), also cause great concern and necessitate fur- ther investigations. Keywords Arsenic Groundwater contamination Seasonal variations Introduction In many regions of the world, especially India (Das et al. 1994), Bangladesh (Ahmed et al. 2004), Vietnam (Berg et al. 2001), China (Sun 2004) etc., As concentrations in groundwater are significantly higher than the limit of 10 lg/L set by World Health Organization (WHO 2006). Arsenic contamination in groundwater of West Bengal and Bangladesh is well documented by various workers (Bhattacharya et al. 1997; Chakraborti et al. 1996; Chandrasekharam et al. 2001; Norra et al. 2005; Stu ¨ben et al. 2003; van Geen et al. 2008) and is described as the world’s biggest arsenic calamity (Chatterjee et al. 1995). The presence of naturally elevated levels of As in groundwater is confirmed in seven Indian states, namely West Bengal, Bihar, Uttar Pradesh, Assam, Jharkhand, Chattisgarh and Madhya Pradesh (Das et al. 1996; Chak- raborti et al. 2003; Ahamed et al. 2006; Paul and Kar 2004; Bhattacharjee et al. 2005; Acharyya et al. 2005; Chakrab- orti et al. 1999). In West Bengal, investigations suggest that nine districts, namely Malda, Murshidabad, Burdwan, Nadia, Hoogly, Howrah, Kolkata, 24 Parganas (North) and Electronic supplementary material The online version of this article (doi:10.1007/s12665-010-0516-4) contains supplementary material, which is available to authorized users. S. H. Farooq (&) D. Chandrasekharam P. Thambidurai Department of Earth Sciences, Indian Institute of Technology Bombay, Powai, Mumbai 400076, India e-mail: [email protected] S. H. Farooq S. Norra Z. Berner E. Eiche D. Stu ¨ben Institute of Mineralogy and Geochemistry, Karlsruhe Institute of Technology, Karlsruhe 76131, Germany 123 Environ Earth Sci DOI 10.1007/s12665-010-0516-4

Welcome message from author
This document is posted to help you gain knowledge. Please leave a comment to let me know what you think about it! Share it to your friends and learn new things together.
Transcript
ORIGINAL ARTICLE
Temporal variations in arsenic concentration in the groundwaterof Murshidabad District, West Bengal, India
S. H. Farooq • D. Chandrasekharam • S. Norra •
Z. Berner • E. Eiche • P. Thambidurai • D. Stuben
Received: 20 July 2009 / Accepted: 5 March 2010
� Springer-Verlag 2010
Abstract Systematic investigations on seasonal varia-
tions in arsenic (As) concentrations in groundwater in both
space and time are scarce for most parts of West Bengal
(India). Hence, this study has been undertaken to investi-
gate the extent of As pollution and its temporal variability
in parts of Murshidabad district (West Bengal, India).
Water samples from 35 wells were collected during pre-
monsoon, monsoon and post-monsoon seasons and ana-
lyzed for various elements. Based on the Indian permissible
limit for As (50 lg/L) in the drinking water, water samples
were classified into contaminated and uncontaminated
category. 18 wells were reported as uncontaminated (on
average 12 lg/L As) and 12 wells were found contami-
nated (129 lg/L As) throughout the year, while 5 wells
could be classified as either contaminated or uncontami-
nated depending on when they were sampled. Although the
number of wells that alternate between the contaminated
and uncontaminated classification is relatively small
(14%), distinct seasonal variation in As concentrations
occur in all wells. This suggests that investigations con-
ducted within the study area for the purpose of assessing
the health risk posed by As in groundwater should not rely
on a single round of water samples. In comparison to other
areas, As is mainly released to the groundwater due to
reductive dissolution of Fe-oxyhydroxides, a process,
which is probably enhanced by anthropogenic input of
organic carbon. The seasonal variation in As concentra-
tions appear to be caused mainly by dilution effects during
monsoon and post-monsoon. The relatively high concen-
trations of Mn (mean 0.9 mg/L), well above the WHO limit
(0.4 mg/L), also cause great concern and necessitate fur-
ther investigations.
Keywords Arsenic � Groundwater contamination �Seasonal variations
Introduction
In many regions of the world, especially India (Das et al.
1994), Bangladesh (Ahmed et al. 2004), Vietnam (Berg
et al. 2001), China (Sun 2004) etc., As concentrations in
groundwater are significantly higher than the limit of
10 lg/L set by World Health Organization (WHO 2006).
Arsenic contamination in groundwater of West Bengal and
Bangladesh is well documented by various workers
(Bhattacharya et al. 1997; Chakraborti et al. 1996;
Chandrasekharam et al. 2001; Norra et al. 2005; Stuben
et al. 2003; van Geen et al. 2008) and is described as the
world’s biggest arsenic calamity (Chatterjee et al. 1995).
The presence of naturally elevated levels of As in
groundwater is confirmed in seven Indian states, namely
West Bengal, Bihar, Uttar Pradesh, Assam, Jharkhand,
Chattisgarh and Madhya Pradesh (Das et al. 1996; Chak-
raborti et al. 2003; Ahamed et al. 2006; Paul and Kar 2004;
Bhattacharjee et al. 2005; Acharyya et al. 2005; Chakrab-
orti et al. 1999). In West Bengal, investigations suggest
that nine districts, namely Malda, Murshidabad, Burdwan,
Nadia, Hoogly, Howrah, Kolkata, 24 Parganas (North) and
Electronic supplementary material The online version of thisarticle (doi:10.1007/s12665-010-0516-4) contains supplementarymaterial, which is available to authorized users.
S. H. Farooq (&) � D. Chandrasekharam � P. Thambidurai
Department of Earth Sciences, Indian Institute of Technology
Bombay, Powai, Mumbai 400076, India
e-mail: [email protected]
S. H. Farooq � S. Norra � Z. Berner � E. Eiche � D. Stuben
Institute of Mineralogy and Geochemistry, Karlsruhe Institute
of Technology, Karlsruhe 76131, Germany
123
Environ Earth Sci
DOI 10.1007/s12665-010-0516-4
24 Parganas (South), are the most severely affected; and
nearly 50 million people are at risk due to consumption of As
contaminated water (http://soesju.org/arsenic/wb1.htm).
However, the processes causing the high As concentrations
in the affected aquifers are not fully understood yet, but it is
estimated that about 200 million people in Asia are exposed
to As contaminated drinking water (Sun et al. 2006).
The presence of As in groundwater is associated with a
number of adverse effects on human health. The USEPA
considers As to be a human carcinogen (US Environmental
Protection Agency, 1996). Long time exposure of As may
cause various diseases such as melanosis, keratosis, non-
petting oedema, gangrene, leucomelanosis, circulatory
system problems and an increased cancer risk, especially of
skin, bladder and lungs (Arnold et al. 1990; Chen et al.
1996; Karim 2000). A review of the health problems
associated with consumption of As is given in a report by
WHO (2006). Apart from clinical symptoms, a number of
social and societal problems are aggravating the situation
(Bhattacharya et al. 2002; Ahmed et al. 2007; Nriagu et al.
2008). Dissolution of marriages and avoidance of arseni-
cosis patients are reported in many areas.
The severity of the As problem in West Bengal and
Bangladesh (jointly called as Bengal delta plain) has
prompted many governmental and non-governmental
organizations to come forward and act immediately. As a
result, millions of wells were sampled and, depending upon
the results of analysis, areas were labeled as As contami-
nated or safe. These samples were, however, collected
without taking into consideration that As concentrations
may vary throughout the year due to seasonal effects (pre-
monsoon, monsoon and post-monsoon). Only a few studies
were conducted on seasonal variations of As concentrations
in West Bengal and Bangladesh, some of them (McArthur
et al. 2004; Kinniburgh and Smedley 2001; Cheng et al.
2005; Wagner et al. 2005) suggest absence of any signifi-
cant change in As concentration, while others (Savarimu-
thu et al. 2006; Yakota et al. 2001) show very pronounced
seasonal variations. Dhar et al. (2008) suggested that the
temporal variability of dissolved As concentrations is a
function of water age, which is closely related to specific
geomorphic units in which groundwater occurs. However,
additional factors might also play a role.
This study has been undertaken to (1) investigate whe-
ther As concentrations in groundwater fluctuate in response
to seasons in the study area, (2) assess if such fluctuations
are sufficient to cause an area to be classified as uncon-
taminated during one season but contaminated during the
rest of the year. Areas that experience large seasonal
fluctuations in As concentrations might require more
extensive monitoring programs before the groundwater can
be labeled as safe or contaminated for the affected
residents.
Sampling and analytical methods
Study area
The study area is located in the eastern part of Murshidabad
district (latitude: N24�1400–N24�1700, longitude: E88�3100–88�4300), West Bengal, India and occurs within the delta
plain of the meandering river Padda (a tributary of the river
Ganga). In the east, the area is confined by the international
boundary with Bangladesh (Fig. 1). The general ground-
water flow direction in West Bengal is north-west to south-
east (Das et al. 1996). Three interconnected aquifer systems
exist in the Bengal delta plain. The shallowest aquifer
extends up to 12–15 m below the groundwater level and is
unconfined in most parts of the delta. The shallow aquifer is
mainly composed of fine to medium grained sands with
occasional intercalation of clay lenses. The intermediate
(35–46 m) and deep aquifers (70–150 m) are reported to be
at shallower depth in the Murshidabad district (Stuben et al.
2003) where the study area is situated. For all domestic
purposes groundwater is mainly pumped from tube-wells
placed mostly in the shallow aquifer and occasionally in the
intermediate aquifer.
Water sampling and analysis
To investigate the magnitude of seasonal variability in As
concentrations, water samples were collected from 35 wells
(33 tube wells and 2 open wells) during the years 2005–
2006 on a random basis. Each well was sampled once for
all the three seasons: pre-monsoon (March 2005), monsoon
(August 2005) and post-monsoon (January 2006). These
sampled wells (mostly shallow tube wells, B30 m; as
shown in supplementary data sheet 1) are mainly used for
drinking water purposes (Fig. 1). Out of the 35 sampled
wells, 21 are actively used domestic wells, 11 are wells of
public utility placed near schools, bus stops etc., two are
open wells and one is used as irrigation well. The depth of
these wells varies from 3 to 98 m (24 wells are up to
20 m deep (shallow aquifer), 4 wells are between 21 and
40 m deep (mainly intermediate aquifer), 7 wells are
41–100 m deep (deep aquifer) which means that water
from all three aquifers is exploited. The two sampled open
dug wells (well number 7 and 31) are 5 and 3 m deep,
respectively. Information about the depth of wells was
acquired through personal communication with the well
owners. Each well site was geo-referenced using a Garmin
Global Positioning System (GPSMAP-76S) instrument.
Water samples from all wells include the collection of: (1)
filtered samples (0.45 lm cellulose nitrate filter) for analyses
of major anions; and (2) filtered (0.45 lm cellulose nitrate
filter) and acidified (with 5 mL 14 M ultrapure HNO3/L)
samples for major cation and trace element analyses. All
Environ Earth Sci
123

samples were tightly sealed and stored at low temperature
until further analyses.
The tube wells, which were not in active use, were
purged for a minimum of three casing volumes before
sampling, while actively used ones were purged for a
minimum of 2 min. pH values, temperature and electric
conductivity (EC) were measured in the field instantly after
collecting the samples. The pH value was measured with a
portable pH-meter (Orion 261S) using a combination
electrode (pH C2401–7) and EC by a conductivity meter
(Orion 250A?) with an operating range between 0 and
500 mS/cm.
Analysis for all major (cations) and trace elements was
done by high resolution ICP-MS (Axiom, Thermo/VG
Elemental, UK) at the Institute of Mineralogy and Geo-
chemistry, Karlsruhe Institute of Technology, Germany.
Sulfate (SO42-) concentrations were measured by spec-
trophotometer (Shimadzu UV-Visible spectrophotometer
160), alkalinity by titration and chloride (Cl-) by
Expandable Ionanalyzer 940A with a combination elec-
trode Orion ionplus 9817 BN.
Drinking water guidelines
The resulting dissolved As concentrations were compared
with the Permissible Indian Limit (PIL) and the WHO
drinking water standards. The Government of India has set
a provisional water quality standard of 50 lg/L of As in
drinking water, which is five times higher than the WHO
limit of 10 lg/L, the limit also set by various developed
countries. Effects of As consumption on human health are
not uniform and are controlled by many factors, such as
nutritional value of daily diet (Chen et al. 1988; National
Research Council 1999), standard of living etc.; thus, no
unambiguous threshold value can be defined as the
dividing line between ‘‘safe’’ and ‘‘unsafe’’. Further, WHO
guidelines for water quality apply to ‘‘finished water’’. For
most study wells, which were primarily domestic wells,
‘‘finished water’’ may not be equivalent to filtered water.
The data presented here may be slightly biased towards low
As concentrations as the samples were filtered to minimize
the colloids and to remove the sediments entrained during
pumping.
Results
In general, groundwater in the study area is nearly neutral
to mildly alkaline. The pH value ranges from 6.8 to 7.7 for
all three seasons (Table 1). During pre-monsoon season pH
values range from 7.2 to 7.7 (mean 7.4), while for monsoon
and post-monsoon the values range from 6.8 to 7.5 (mean
7.2) and 6.9–7.6 (mean 7.2), respectively.
Considerable temporal variations are observed for all
major ions (Table 1). Ca2? (55.3–276 mg/L) is the domi-
nating cation and HCO3- (231–958 mg/L) is the major
anionic species present in the groundwater irrespective of
seasons. Concentrations of other major cations such as Na?
(2.7–108 mg/L), K? (2.5–50.6 mg/L) and Mg2? (8.7–
123 mg/L) and anions such as Cl- (7.2–157 mg/L) and
SO42- (10.6–129 mg/L) also show a considerable vari-
ability. Mean SO42- concentrations for pre-monsoon,
monsoon and post-monsoon are 38.1, 36.2 and 34.7 mg/L,
respectively. As a whole, SO42- concentrations in the study
area are quite high (mean 36.3 mg/L) compared to other As
affected areas (Eiche et al. 2008; Smedley and Kinniburgh
2002), where they are frequently well below detection
limit. Chloride shows considerable seasonal variations in
mean concentrations (pre-monsoon 54 mg/L, monsoon
42 mg/L and post-monsoon 40.5 mg/L), as the mean Cl-
Fig. 1 Area map showing locations of water sample collection wells
Environ Earth Sci
123
concentration for pre-monsoon is 33% higher than for post-
monsoon.
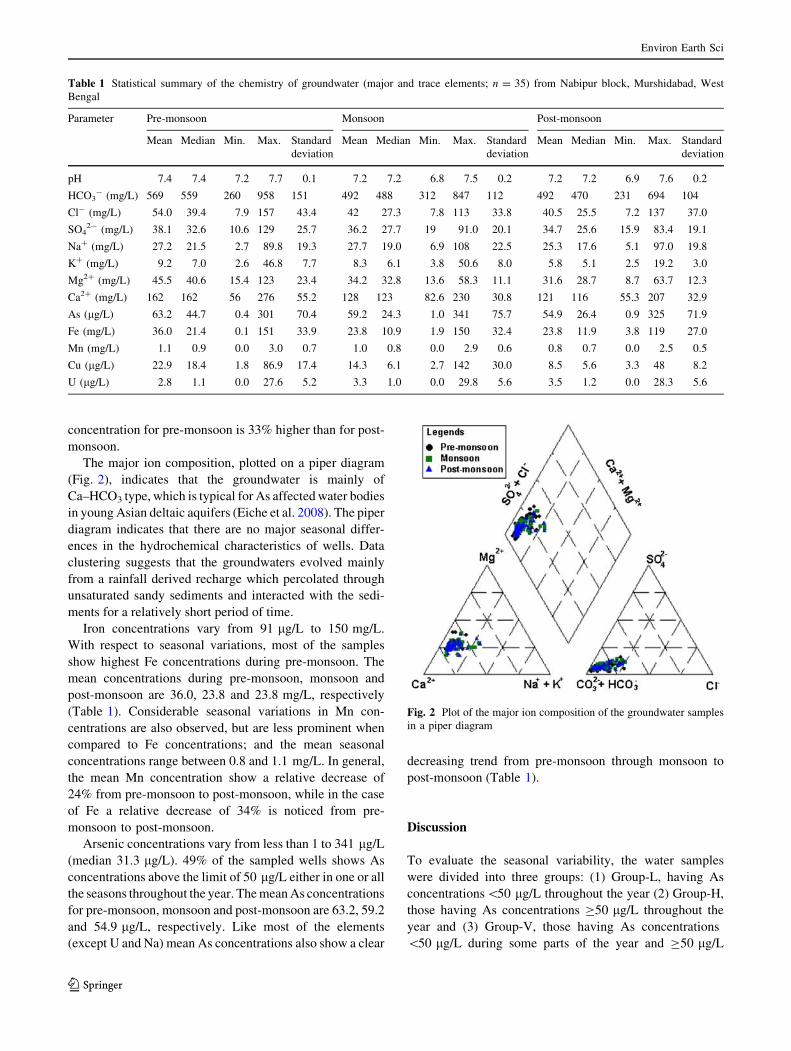
The major ion composition, plotted on a piper diagram
(Fig. 2), indicates that the groundwater is mainly of
Ca–HCO3 type, which is typical for As affected water bodies
in young Asian deltaic aquifers (Eiche et al. 2008). The piper
diagram indicates that there are no major seasonal differ-
ences in the hydrochemical characteristics of wells. Data
clustering suggests that the groundwaters evolved mainly
from a rainfall derived recharge which percolated through
unsaturated sandy sediments and interacted with the sedi-
ments for a relatively short period of time.
Iron concentrations vary from 91 lg/L to 150 mg/L.
With respect to seasonal variations, most of the samples
show highest Fe concentrations during pre-monsoon. The
mean concentrations during pre-monsoon, monsoon and
post-monsoon are 36.0, 23.8 and 23.8 mg/L, respectively
(Table 1). Considerable seasonal variations in Mn con-
centrations are also observed, but are less prominent when
compared to Fe concentrations; and the mean seasonal
concentrations range between 0.8 and 1.1 mg/L. In general,
the mean Mn concentration show a relative decrease of
24% from pre-monsoon to post-monsoon, while in the case
of Fe a relative decrease of 34% is noticed from pre-
monsoon to post-monsoon.
Arsenic concentrations vary from less than 1 to 341 lg/L
(median 31.3 lg/L). 49% of the sampled wells shows As
concentrations above the limit of 50 lg/L either in one or all
the seasons throughout the year. The mean As concentrations
for pre-monsoon, monsoon and post-monsoon are 63.2, 59.2
and 54.9 lg/L, respectively. Like most of the elements
(except U and Na) mean As concentrations also show a clear
decreasing trend from pre-monsoon through monsoon to
post-monsoon (Table 1).
Discussion
To evaluate the seasonal variability, the water samples
were divided into three groups: (1) Group-L, having As
concentrations\50 lg/L throughout the year (2) Group-H,
those having As concentrations C50 lg/L throughout the
year and (3) Group-V, those having As concentrations
\50 lg/L during some parts of the year and C50 lg/L
Table 1 Statistical summary of the chemistry of groundwater (major and trace elements; n = 35) from Nabipur block, Murshidabad, West
Bengal
Parameter Pre-monsoon Monsoon Post-monsoon
Mean Median Min. Max. Standard
deviation
Mean Median Min. Max. Standard
deviation
Mean Median Min. Max. Standard
deviation
pH 7.4 7.4 7.2 7.7 0.1 7.2 7.2 6.8 7.5 0.2 7.2 7.2 6.9 7.6 0.2
HCO3- (mg/L) 569 559 260 958 151 492 488 312 847 112 492 470 231 694 104
Cl- (mg/L) 54.0 39.4 7.9 157 43.4 42 27.3 7.8 113 33.8 40.5 25.5 7.2 137 37.0
SO42- (mg/L) 38.1 32.6 10.6 129 25.7 36.2 27.7 19 91.0 20.1 34.7 25.6 15.9 83.4 19.1
Na? (mg/L) 27.2 21.5 2.7 89.8 19.3 27.7 19.0 6.9 108 22.5 25.3 17.6 5.1 97.0 19.8
K? (mg/L) 9.2 7.0 2.6 46.8 7.7 8.3 6.1 3.8 50.6 8.0 5.8 5.1 2.5 19.2 3.0
Mg2? (mg/L) 45.5 40.6 15.4 123 23.4 34.2 32.8 13.6 58.3 11.1 31.6 28.7 8.7 63.7 12.3
Ca2? (mg/L) 162 162 56 276 55.2 128 123 82.6 230 30.8 121 116 55.3 207 32.9
As (lg/L) 63.2 44.7 0.4 301 70.4 59.2 24.3 1.0 341 75.7 54.9 26.4 0.9 325 71.9
Fe (mg/L) 36.0 21.4 0.1 151 33.9 23.8 10.9 1.9 150 32.4 23.8 11.9 3.8 119 27.0
Mn (mg/L) 1.1 0.9 0.0 3.0 0.7 1.0 0.8 0.0 2.9 0.6 0.8 0.7 0.0 2.5 0.5
Cu (lg/L) 22.9 18.4 1.8 86.9 17.4 14.3 6.1 2.7 142 30.0 8.5 5.6 3.3 48 8.2
U (lg/L) 2.8 1.1 0.0 27.6 5.2 3.3 1.0 0.0 29.8 5.6 3.5 1.2 0.0 28.3 5.6
Fig. 2 Plot of the major ion composition of the groundwater samples
in a piper diagram
Environ Earth Sci
123

during other parts of the year (Table 2). The separation of
these groups is based on the limit of 50 lg/L set by the
Government of India to classify water as polluted or
unpolluted with regard to dissolved As concentrations. In
addition to low As values (mean 12.2 lg/L), Group-L is
characterized by lower concentrations of redox-sensitive
elements such as Fe (mean 15.3 mg/L) and Mn (0.9 mg/L),
compared to Group-H (As (mean) 128 lg/L, Fe (mean)
47.5 mg/L, Mn (mean) 1.1 mg/L; Table 2). It is worth
mentioning that the water of Group-L wells might be safe
for drinking with regard to As concentrations but in many
wells the concentration of other elements (e.g. dissolved
Mn etc.) exceeded the WHO limits, which makes the water
from these wells unacceptable for drinking purposes.
It is noteworthy to observe the difference in uranium (U)
concentrations between the two groups (Group L and H)
because the redox behavior of this element is generally
opposite to that of Fe and Mn. This is reflected by the
roughly four times higher mean U concentrations in Group-
L (5.2 lg/L) as compared to Group-H (Table 2). Group-L
has also roughly 10% lower HCO3- concentrations
(507 mg/L as compared to 547 mg/L in Group-H). All the
other measured elements have more or less similar mean
values. These hydrochemical characteristics indicate that
the higher As concentrations appear preferentially in the
context of a low redox hydrogeochemical environment.
Consequently, it is reasonable to assume that high pro-
portions of dissolved As and Fe results from the reductive
dissolution of Fe-oxyhydroxides. It is widely accepted that
Fe-oxyhydroxides in the Bengal delta plain sediments
serve as the source of As, which is released under reducing
conditions (Bagla and Kaiser 1996; Bhattacharya et al.
1997; Nickson et al. 1998; Ravenscroft et al. 2001).
However, the absence of a strong correlation between
dissolved As and Fe in the water samples collected for this
study suggest that processes other than reductive dissolu-
tion are also involved in the release of As to groundwater.
86% of wells do not change their category and stay in
either of the two groups (Group-L; safe or Group-H;
unsafe) throughout the year. In the remaining 14% of wells
(Group-III), As concentrations vary throughout the year to
the extent that they change their association from one
group to the other. Thus, these wells can be labeled as
uncontaminated in some parts of the year whereas in the
other parts of the year they can be labeled as contaminated.
In both groups (Group-L and Group-H) some wells show
considerably large seasonal variations with regard to As
concentration. The standard deviation for the wells within
these groups vary between 0.3–25 and 2.1–36.7, respec-
tively, indicating that the seasonal variability of the As
concentration is considerably higher for Group-H as com-
pared to Group-L. The standard deviation for As concen-
trations in Group-V ranges from 22.6 to 99.5. These
variances indicate that the extent of the change in As
concentration is always relatively high when a well shifts
between the L and H groups.
In order to get a better understanding of the seasonal
variations, samples were further grouped into (1) Group-A
and (2) Group-B, based on the standard deviation of their
As concentrations in different seasons. The samples that
show coefficients of variation (CV) in As concentrations
\20% were allocated to Group-A while the samples that
show higher CV in As concentrations ([20%) were allo-
cated to Group-B (Table 3). 17 samples (49%) belong to
Group-A which include 7 samples with less than 50 lg/L
of As and 10 samples with more than 50 lg/L of As. The
Table 2 Statistical summary of the chemistry of groundwater (major and trace elements; n = 35) after dividing them into different groups
Parameter Group-L (Unpolluted, n = 18) Group-H (Polluted, n = 12) Group-V (n = 5)
Mean Median Min. Max. Standard
deviation
Mean Median Min. Max. Standard
deviation
Mean Median Min. Max. Standard
deviation
pH 7.3 7.3 7.0 7.7 0.2 7.2 7.2 6.8 7.5 0.2 7.3 7.3 7.0 7.6 0.2
HCO3- (mg/L) 507 491 231 958 128 547 527 359 847 134 486 459 368 790 105
Cl- (mg/L) 49.4 35.7 7.2 129 35.7 51.8 27.2 10.1 157 43.9 16.4 10.3 7.5 65.3 14.5
SO42- (mg/L) 36.9 31.1 12.3 84.1 19.2 41.1 30.8 11.0 129 26.5 23.0 22.3 10.6 49.8 9.1
Na (mg/L) 28.0 21.7 2.7 108 22.2 28.8 18.4 8.8 83.3 20.9 17.2 17.0 11.2 32.1 4.6
K (mg/L) 9.0 6.6 2.6 50.6 8.9 6.8 6.0 3.6 17.3 2.8 5.4 5.4 2.5 10.0 1.9
Mg (mg/L) 37.8 35.7 8.7 123 19.9 39.0 35.2 19.6 78.2 15.3 29.8 27.8 17.6 61.6 10.6
Ca (mg/L) 135 122 55.3 276 45.0 147 138 81.6 253 45.1 118 112 74.1 227 36.2
As (lg/L) 12.2 4.9 0.4 49.9 14.2 128 111 51.3 341 73.5 61.8 56.6 1.4 180 59.2
Fe (mg/L) 15.3 10.7 2.2 82.4 15.2 47.5 32.2 6.0 151 41.5 25.9 18.3 0.1 69.1 23.6
Mn (mg/L) 0.9 0.7 0.0 3.0 0.8 1.1 1.1 0.4 2.0 0.5 0.8 0.8 0.3 1.2 0.3
Cu (lg/L) 13.6 7.9 3.3 86.9 15.2 19.9 8.6 2.7 142 30.5 10.0 7.4 1.8 29.0 7.6
U (lg/L) 5.2 1.9 0.0 29.8 6.8 1.14 0.4 0.0 8.2 1.73 1.0 0.3 0.0 5.7 1.7
Environ Earth Sci
123

remaining 18 samples are in Group-B. The samples in
Group-B include 11 samples with less than 50 lg/L of As,
2 samples with more than 50 lg/L of As and 5 samples that
have\50 lg/L of As in some parts of the year and[50 lg/L
of As in the remaining part of the year. In addition to As,
samples of Group-B show greater variances in redox sen-
sitive elements (Table 3). A higher degree of variance in
Fe along with Cu and U in Group-B, suggests that a wide
fluctuation in the redox conditions in the aquifer is
responsible for the greater seasonal variation in As con-
centrations. The redox potential data from many previous
studies demonstrate that mild oxidizing to moderately and/
or strongly reducing conditions exists in the Bengal delta
plain (BGS and DPHE 2001; Bhattacharya et al. 2002).
Our study suggests a slight but continuous decrease of
the As concentrations from the pre-monsoon to post-
monsoon season due to dilution with percolating rain water
(Table 1). During the period preceding the monsoon sea-
son, this decrease is possibly offset by processes that lead
to a new episodic increase of the As concentrations.
Among the possible mechanisms one may consider are (1)
the mobilization of As under reducing conditions (Smedley
and Kinniburgh 2002; Nickson et al. 2000) generated by
the microbially mediated decay of natural organic matter
(NOM) and/or dissolved organic carbon (DOC) (Harvey
et al. 2002) and (2) the mobilization of As by organic acids
(a fraction of DOC) that may play an important role in
mineral degradation and metal mobilization (Baker 1973;
Kalbitz and Wennrich 1998; Bauer and Blodau 2006). In
West Bengal high quantities of organic matter are left over
in the paddy fields due to traditional paddy cultivation. In
paddy cultivation, harvested crop is cut from the middle of
stem and the remaining half of the stem and roots are
ploughed back for the next cultivation. During the mon-
soon, paddy fields are flooded with rain water and the
decomposition of such plant remains increases the avail-
ability of DOC in general and of organic acids in particular.
The availability of DOC and production of organic acids
during the monsoon season is further enhanced by the local
jute industry (biggest jute producer in the world), which
follows the traditional practice of decomposing the jute
crop in ponds in order to get jute fibres. In this way sub-
stantial quantities of DOC and organic acids are produced
(as shown in supplementary data sheet 2), which can per-
colate down with rain water, and, on their way to
groundwater react with mineral surfaces or act as electron
donor for microbes. As a consequence, the reductive dis-
solution of Fe-oxyhydroxides would be enhanced. This
might be one cause of the extremely high dissolved
Fe-concentrations (\151 mg/L) in some wells. Further-
more, the presence of DOC modifies the solubility and
mobility of many contaminants (Sensei et al. 1994). The
negatively charged DOC, for example, increases the
desorption of As from the binding sites through electro-
static effects (Bauer and Blodau 2006). A slight but quasi
constant decrease of the pH values from pre-monsoon
(mean 7.4) to monsoon/post-monsoon (mean monsoon 7.2,
post-monsoon 7.2) further suggests percolation and mixing
of organic acids, though some other factors may also play a
considerable role in the fluctuation of pH values (Fig. 3).
Higher pH values during pre-monsoon coupled with
relatively minor seasonal fluctuations but with a clear
Table 3 Grouping of samples based on the variance in seasonal As concentration
Parameter Group-A (Coefficient of variance in As concentrations\20%)
(n = 17)
Group-B (Coefficient of variance in As concentrations [20%)
(n = 18)
Mean Median Min. Max. Standard
deviation range
CV Mean Median Min. Max. Standard
deviation range
CV
pH 7.2 7.2 6.8 7.5 0.1–0.2 0.8–3.4 7.3 7.3 7.0 7.7 0.1–0.3 1.3–3.5
HCO3- (mg/L) 532 503 348 858 12–209 3.0–34.0 504 479 231 958 32–265 5.0–41.0
Cl- (mg/L) 49.6 29.4 10.1 157 0.3–29.5 2.9–62.8 41.6 29.9 7.2 145 0.2–27 1.7–74.7
SO42- (mg/L) 40.5 30.9 11 129 1.2–28.4 3.8–64.4 32.4 25.6 10.6 84.1 0.6–14.8 2.4–51.5
Na (mg/L) 29.3 19.1 8.8 89.8 0.9–33.6 2.5–65.5 24.4 18.3 2.7 108 0.5–28.8 2.9–56.3
K (mg/L) 8.3 6.1 3.1 50.6 0.3–24.9 4.0–72.5 7.2 6.2 2.5 22.5 0.8–8.0 11.7–86.9
Mg (mg/L) 39.2 37.7 19.6 123 1.9–51.6 5.7–81.3 35.1 30.5 8.7 118 2.1–48.9 7.4–79.1
Ca (mg/L) 141 124 82 270 8.7–93.6 7.6–57.8 133 120 55 276 3.1–93.2 2.7–55.3
As (lg/L) 84.4 70.8 1.2 341 0.3–28.8 1.0–19.7 35.2 20.1 0.4 180 0.3–99.5 23.5–157.5
Fe (mg/L) 31.4 16 3 151 1.4–18.5 7.7–106 24.6 13 0.1 93.8 1.1–41.4 5.6–136.2
Mn (mg/L) 937 793 83 1,990 47.1–412 4.9–87.1 961 862 23 3,000 7.8–785 5.0–48.8
Cu (lg/L) 17.8 7.9 3.3 143 1.4–65.5 10.5–132 12.8 7.8 1.8 86.9 2.9–47.3 35.9–147.1
U (lg/L) 3.2 1.0 0.0 27.6 0–11.7 0.9–82.1 3.2 1.2 0.0 29.8 0–13.6 2.5–94.4
CV = SD 9 100/mean
Environ Earth Sci
123

decreasing trend in mean sulphate concentration (pre-
monsoon 38.1 mg/L, monsoon 36.2 mg/L and post-mon-
soon 34.7) argue against the formation of sulphate by pyrite
oxidation, because pyrite oxidation would imply the low-
ering of pH (Das et al. 1996).
The samples that remain in Group-L (As \ 50 lg/L)
throughout the year show only a week correlation between
Fe and As (r2 = 0.34) during monsoon; however, the wells
from Group-H (r2 = 0.42) and specially Group-V show a
very strong correlation (r2 = 0.97) between As and Fe
concentrations during monsoon period (Fig. 4). This sug-
gests that the release of As and its high seasonal variability
is controlled not only by rain water dilution, but also to
some extent by changes in the redox environment.
Although dilution effects alone could cause a covariance
between As and Fe, the simultaneous increase of their
concentrations during the pre-monsoonal season, certainly
should have a different explanation. Furthermore, the wells
that fall in Group-V shows a higher correlation (r2 = 0.70)
between As and HCO3- during monsoon, which suggests
that the release of As is associated with the degradation of
organic material. The microbial degradation of organic
matter leads to the formation of HCO3-. The displacing
effect of HCO3- for As sorbed onto Fe oxyhydroxides is
well documented (Appelo et al. 2002). Sometimes higher
concentrations of HCO3- fosters the release of As into the
groundwater (Kim et al. 2000) and, consequently, be a
further source for dissolved As.
Apart from various other factors, distance from pools
rich in organic matter and organic acids (paddy fields,
ponds and waste dumping sites) may also play an important
role in the seasonal variation of As concentrations in
groundwater. Open (dug) wells, which are often located
away from organic matter pools (agricultural fields/jute
decomposing ponds), were found to have relatively low As
concentrations, often well below (1.7–3.2 lg/L) than the
WHO prescribed limit. These wells are just 3–5 m deep, a
depth range in which direct recharge through vertical flow
dominates, while mixing and recharge through horizontal
flow is assumed to be negligible. The rain water/run-off
which percolates from the surface into the groundwater,
feeding these wells, has very low organic matter content
and As concentrations.
Differences among wells with respect to the seasonal
fluctuation of As concentrations may additionally be con-
trolled by various local factors, such as the screening depth
of tube wells, the presence of clay intercalations/pockets in
the cap-rocks of the aquifer, the proximity of organic acid
production sites and of waste dumping sites, etc. There is
no clear relationship between well depth and As concen-
tration. Pockets and intermittent layers of clayey sedi-
ments, which are typical for deltaic sequences, prolongs the
percolation time of surface water. Thus provides longer
interaction time with the sediments that have higher spe-
cific surface area and abundant reactive sites for adsorption
or desorption of As. There is no information about the
hydrogeology of each well in order to further establish a
possible relationship between well depth and hydrogeo-
logical units.
Out of the five wells which shift their category in
response to seasonal changes, well numbers 10 and 15
show a decrease in As concentration during the monsoon
season probably due to dilution by rainwater. In both of
these wells As concentrations increase during post-mon-
soon season (Fig. 5a, b), which might reflect a delay in the
development of sufficiently reducing conditions. The
development of reducing conditions in these wells is
indicated by a significant increase of the Fe and HCO3-
concentrations during the post-monsoon season (as shown
in supplementary data sheet 1).
Wells 25 and 34 show a prominent ‘‘dilution effect’’
during post-monsoon rather than the monsoon season
(Fig. 5c, d). Both of these wells are screened at a greater
depth (46 and 98 m, respectively) as compared to the other
sampled wells. The water table is at a very shallow depth in
the study area (3 m) and the mixing of percolating rain
6.6
6.8
7.0
7.2
7.4
7.6
7.8
1 3 5 7 9 11 13 15 17 19 21 23 25 27 29 31 33 35
Well No.
pH
Pre-monsoonMonsoonPost-monsoon
Fig. 3 Variations in pH values in response to seasonal changes
R2(H)= 0.42
R2(V)= 0.97
R2(L)= 0.340
50
100
150
200
250
300
350
400
0 20 40 60 80 100 120 140 160
Fe (mg/L)
As
(ug
/L)
Group-L
Group-H
Group-V
Fig. 4 Graph showing Fe and As correlation during monsoon. The
samples which are allocated to Group-L show only a weak correlation
between Fe and As during monsoon (r2 = 0.34), while samples from
Group-H and Group-V show a moderate (r2 = 0.42, Group-II) to very
strong (r2 = 0.97; Group-V) correlation between Fe and As in the
same season
Environ Earth Sci
123

water with deeper groundwater is assumed to take longer
time. Clay lenses and clay patches that are common in
deltaic deposits exhibit very limited permeability. The slow
infiltration through such lithologies can effectively delay
the dilution of groundwater by precipitation derived water.
A significant increase in the As concentration during
monsoon in well 16 (Fig. 5e) could be due to some par-
ticular local conditions, which may affect As mobility.
Proximity of waste dumping site, heterogeneity of aquifer
characteristics, anthropogenic activity, etc. are potential
causes for such special conditions.
It is critical to monitor whether the inter-seasonal vari-
ability or total As concentrations increase with time;
therefore, it is necessary that monitoring should be carried
out over longer periods during all the three seasons. Even if
only 14% of the wells are misclassified by disregarding the
seasonal variability of As concentrations, the huge number
of wells in the Bengal delta means that such a wrong
labeling would affect the health of millions of people.
Savarimuthu et al. (2006) also point out seasonal variations
in As concentrations, but opposite to our results, the
highest As concentrations were found during monsoon and
the lowest in the pre-monsoon time. A monsoon season
with less intensive rainfall is likely to trigger greater sea-
sonal variations in As concentrations. A drop in average
rainfall will not only result in lesser dilution of As, but will
also lead to relatively high DOC and organic acids con-
centrations, thus inducing stronger reducing conditions.
The results of this study are only partly in line with the
findings of Dhar et al. (2008) conducted in Araihazar area
in Bangladesh, where over a monitoring period of
2–3 years the As concentrations in some wells were
increasing, while in others a decreasing trend was
observed, and some wells remained practically unchanged.
Conclusions
This study clearly shows that seasonal variability of dis-
solved As occurs in several wells but also suggests that a big
majority (86%) of wells did not show such a prominent
change in their As concentrations that they can be labeled as
contaminated in one season and uncontaminated in the
another. Nevertheless, a very high standard deviation in the
seasonal As concentrations of these wells highlight a dire
need for long term seasonal monitoring. Considering the
high population density in West Bengal and the huge number
of wells in the Bengal delta Plain, a wrong labeling of only a
low percentage of the wells can pose a severe health threat to
a considerably large human population. In general, this study
suggests a kind of cyclical seasonal pattern, characterized by
a decreasing trend of the As concentrations from the pre-
Fig. 5 a–e Pattern of As concentrations in wells that exhibit a change from one group to another in response to seasonal variations
Environ Earth Sci
123
monsoon to post-monsoon period, followed by an increase
during the shorter pre-monsoon time. The decreasing branch
of the cycle is dominated by dilution through run-off and by a
redox shift towards more oxic conditions, while the shorter
increasing branch is characterized by a more intensive water/
sediment interaction and the development of more reducing
conditions in the groundwater. There are also indications that
the well depth and lithology may have an influence on the
seasonal variability along with local peculiarities (dump
sites etc.). Arsenic release may also be heavily influenced by
the infiltration of organic carbon from agricultural processes;
however, its influence on the variability of dissolved As
concentrations could not be established from this study.
A more detailed study on temporal variations of As is
needed as it has important implications on the exposure and
precision of the risk assessments. In addition to the various
natural controls on As release from sediments to ground-
water, it is also important to consider the role that organic
matter plays in As mobility.
Acknowledgments The authors gratefully acknowledge support from
German Academic Exchange Service (DAAD) through research fel-
lowship. Our thanks are also due to Mrs. Claudia Mossner of the Institute
of Mineralogy and Geochemistry (IMG) for the chemical analyses.
References
Acharyya SK, Shah BA, Ashyiya ID, Panday Y (2005) Arsenic
contamination ion groundwater from parts of Ambagarh chowki
block, Chattisgarh, India: source and release mechanism.
Environ Geol 49:148–158
Ahamed S, Sengupta MK, Mukharjee A, Hossain AM, Das B, Nayak
B, Pal A et al (2006) Arsenic groundwater contamination and its
health effects in the state of Uttar Pradesh (UP) in upper and
middle Ganga plain, India: a severe danger. Sci Total Environ
370:310–322
Ahmed KM, Bhattacharya P, Hasan MA, Akhter SH, Alam SMM,
Bhuyian MAH, Imam MB, Khan AA, Sracek O (2004) Arsenic
enrichment in groundwater of the alluvial aquifers in Bangla-
desh: an overview. Appl Geochem 19:181–200
Ahmed S, Sayed MHS, Khan MH, Karim MN, Haque MA, Bhuiyan
MSA, Rahman MS, Faruquee MH (2007) Sociocultural aspects
of arsenicosis in Bangladesh: community perspective. J Environ
Sci Health A 42:1945–1958
Appelo CAJ, van der Weiden MH, Tournassat C, Charlet L (2002)
Surface complexation of ferrous ion and bicarbonate on ferrihy-
drite and the mobilization of arsenic. Environ Sci Technol
36:3096–3103
Arnold HL, Odam RB, James WD (1990) Disease of the skin: clinical
dermatology, 8th edn. WB Saunders, Philadelphia, p 121
Bagla P, Kaiser J (1996) India’s spreading health crisis draws global
arsenic experts. Science 274(5285):174–175
Baker WE (1973) The role of humic acids from Tasmanian podzolic
soils in mineral degradation and metal mobilization. Geochim
Cosmochim Acta 37:269–281
Bauer M, Blodau C (2006) Mobilization of arsenic by dissolved
organic matter from iron oxides, soils, and sediments. Sci Total
Environ 354:179–190
Berg M, Tran HC, Nguyen TC, Pham HV, Schertenleib R, Giger W
(2001) Arsenic contamination of groundwater and drinking
water in Vietnam: a human health threat. Environ Sci Technol
35:2621–2626
BGS and DPHE (2001) Arsenic contamination of groundwater in
Bangladesh, vol 2. Final Report, BGS Technical Report WC/00/
19
Bhattacharjee S, Chakravarty S, Maity S, Dureja V, Gupta KK (2005)
Metal contents in the groundwater of Sahebganj district,
Jharkhand, India, with special reference to arsenic. Chemosphere
58:1203–1217
Bhattacharya P, Chatteriee D, Jacks G (1997) Occurrence of arsenic
contaminated groundwater in alluvial aquifers from the Delta
Plains, eastern India: options for safe drinking water supply. Int J
Water Resour Manag 13:79–92
Bhattacharya P, Jacks G, Ahmed KM, Khan AA, Routh J (2002)
Arsenic in groundwater of the Bengal Delta Plain aquifers in
Bangladesh. Bull Environ Contam Toxicol 69:538–545
Chakraborti D, Das D, Samanta BK, Mandal BK, Chowdhury RT,
Chanda CR, Chowdhury PP, Basu GK (1996) Arsenic in
groundwater in six districts of West Bengal, India. Environ
Geochem Health 18:5–15
Chakraborti D, Biswas BK, Basu GK, Mandal BK, Chowdhury UK,
Mukherjee S, Gupta SD, Chaudhury SR, Rathore KC (1999)
Arsenic groundwater contamination and sufferings of people in
Rajnandgaon district, Madhya Pradesh, India. Curr Sci 77:502–
504
Chakraborti D, Mukherjee SC, Pati S, Sengupta MK, Rahman MM,
Chaudhury UK et al (2003) Arsenic groundwater contamination
in Middle Ganga plain, Bihar, India: a future danger. Environ
Health Prospect 111:1194–1201
Chandrasekharam D, Karmakar J, Berner Z, Stuben D (2001) Arsenic
contamination in groundwater, Murshidabad district, West
Bengal. In Cidu A (ed) Proceedings of the 10th international
symposium on water-rock interaction, vol 2, pp 1051–1054
Chatterjee A, Das D, Mandal B (1995) Arsenic in groundwater of six
districts of West Bengal: the biggest arsenic calamity in the
world. Part 1. Arsenic species in drinking water and urine of
affected people. Analyst 120:640–650
Chen CJ, Wu MM, Lee SS, Wang JD, Cheng SH, Wu HY (1988)
Atherogenicity and carcinogenicity of high-arsenic artesian well
water: multiple risk factors and related malignant neoplasms of
blackfoot diseases. Arteriosclerosis 8:452–460
Chen CJ, Chiou HY, Chiang MH, Lin LJ, Tai TY (1996) Dose-
response relationship between ischemic heart disease mortality
and long-term arsenic exposure. Arterioscler Thromb Vasc Biol
16(4):504–510
Cheng Z, van Geen A, Seddique AA, Ahmed KM (2005) Limited
temporal variability of arsenic concentrations in 20 wells
monitored for 3 years in Araihazar, Bangladesh. Environ Sci
Technol 39:4759–4766
Das D, Chatterjee A, Samanta G, Mandal B, Chowdhury TR, Samanta
G, Chowdhury PP, Chanda C, Basu G, Lodh D, Nandi S,
Chakraborty T, Mandal S, Bhattacharya SM, Chakraborti D
(1994) Arsenic contamination in ground water in six districts of
West Bengal: the biggest arsenic calamity in the world. Analyst
119:168–170
Das D, Samanta G, Mandal BK, Chowdhury TR, Chanda CR,
Chowdhury PP, Basu GK, Chakraborti D (1996) Arsenic in
groundwater in six districts of West Bengal, India. Environ
Geochem Health 18:5–15
Dhar RK, Zheng Y, Stute M, van Geen A, Cheng Z, Shanewaz M,
Shamshudduha M, Haque MA, Rahman MW, Ahmed KM
(2008) Temporal variability of groundwater chemistry in shallow
and deep aquifers of Araihazar, Bangladesh. J Contam Hydrol
99:97–111
Environ Earth Sci
123

Eiche E, Neumann T, Berg M, Weinman B, van Geen A, Norra S,
Berner Z, Pham TKT, Pham HV, Stuben D (2008) Geochemical
processes underlying a sharp contrast in groundwater arsenic
concentrations in a village on Red River Delta, Vietnam. Appl
Geochem 23:3143–3154
Harvey CH, Swartz C, Badruzzaman ABM, Keon-Blute N, Yu W, Ali
MA, Jay J, Beckie R, Niedan V, Brabander D, Oates P, Ashfaque
KN, Islam S, Hemond HF, Ahmed MF (2002) Arsenic mobility
and groundwater extraction in Bangladesh. Science 298:1602–
1606
Kalbitz K, Wennrich R (1998) Mobilization of heavy metals and
arsenic in polluted wetland soils and its dependence on dissolved
organic matter. Sci Total Environ 209:27–39
Karim M (2000) Arsenic in groundwater and health problems in
Bangladesh. Water Resour 34:304–310
Kim MJ, Nriagu J, Haack S (2000) Carbonate ions and arsenic
dissolution by groundwater. Environ Sci Technol 34:3094–3100
Kinniburgh DG, Smedley PL (2001) Arsenic contamination of
groundwater in Bangladesh, vol 2. Final Report, British
Geological Survey, BGS Technical Report No WC/00/19
McArthur JM, Banerjee DM, Hudson-Edwards KA, Mishra R,
Purohit R, Ravenscroft P, Cronin A, Howarth RJ, Chatterjee
A, Talukder T, Lowry D, Houghton S, Chadha DK (2004)
Natural organic matter in sedimentary basins and its relation to
arsenic in anoxic ground water: the example of West Bengal and
its worldwide implications. Appl Geochem 19:1255–1293
National Research Council (1999) Arsenic in drinking water. National
Academy Press, Washington, DC
Nickson RT, McArthur JM, Ravenscroft P, Burgess WG, Ahmed KM,
Rahman M (1998) Arsenic poisoning of Bengal groundwater.
Nature 395:338
Nickson RT, McArthur JM, Ravenscroft P, Burgess WG, Ahmed KM
(2000) Mechanism of arsenic release to groundwater, Bangla-
desh and West Bengal. Appl Geochem 15:403–413
Norra S, Berner Z, Aggarwala P, Wagner F, Chandrasekharam D,
Stuben D (2005) Impact of irrigation with As-rich groundwater
on soil and crops: a geochemical case study in Maldah District,
West Bengal. Appl Geochem 20:1890–1906
Nriagu JO, Bhattacharya P, Mukherjee AB, Bundschuh J, Zevenho-
ven R, Loeppert RH (2008) Arsenic in soil and groundwater: an
overview. In: Bhattacharya P, Mukherjee AB, Bundschuh J,
Zevenhoven R, Loeppert R (eds) Trace metals and other
contaminants in the environment. Elsevier, The Netherlands,
pp 3–63
Paul AB, Kar D (2004) Ground water arsenic in Assam: a report from
Brahmaputra and Barak valley. Environ Ecol 22:588–589
Ravenscroft P, McArthur JM, Hoque BA (2001) Geochemical and
paleohydrological controls on pollution of groundwater by
arsenic. In: Chappell W, Abernathy CO, Calderon R (eds)
Arsenic exposure, heals effects (IV). Elsevier, Oxford, pp 78–83
Savarimuthu X, Hira-Smith MM, Yuan Y, von Ehrenstein OS, Das S,
Ghosh N, Guha DN, Smith AH (2006) Seasonal variation of
arsenic concentration in tube wells in West Bengal, India. J
Health Popul Nutr 24:1–5
Sensei N, Brunetti G, La CP, Miano TM (1994) Adsorption of
alachlor by humic acids from sewage sludge and amended and
non-amended soils. Soil Sci 157:176–184
Smedley PL, Kinniburgh DG (2002) A review of the source,
behaviour and distribution of arsenic in natural waters. Appl
Geochem 17:517–568
Stuben D, Berner Z, Chandrasekharam D, Karmakar J (2003) Arsenic
enrichment in groundwater of West Bengal, India: geochemical
evidence for mobilization of As under reducing conditions. Appl
Geochem 18:1417–1434
Sun G (2004) Arsenic contamination and arsenicosis in China.
Toxicol Appl Pharmacol 198:268–271
Sun G, Li X, Pi J, Sun Y, Li B, Jin Y, Xu Y (2006) Current research
problems of chronic arsenicosis in China. J Health Popul Nutr
24(2):176–181
van Geen A, Radloff K, Aziz Z, Cheng Z, Huq MR, Ahmed KM,
Weinman B, Goodbred S, Jung HB, Zheng Y, Berg M, Trang
PTK, Charlet L, Metral J, Tisserand D, Guillot S, Chakraborty S,
Gajurel AP, Upreti BN (2008) Comparison of arsenic concen-
trations in simultaneously-collected groundwater and aquifer
particles from Bangladesh, India, Vietnam, and Nepal. Appl
Geochem 23:3244–3251
Wagner F, Berner ZA, Stuben D (2005) Arsenic in groundwater in
Bengal Delta Plain: geochemical evidences for small scale redox
zonation in the aquifer. In: Bundschuh J, Bhattacharya P,
Chandrasekharam D (eds) Natural arsenic in groundwater:
occurrence, remediation and management. Taylor & Francis
Group, London, pp 3–15
World Health Organization (2006) Guidelines for drinking-water
quality. Recommendations, vol 1, 3rd edn. World Health Orga-
nization, Geneva
Yakota H, Tanabe K, Sezaki M, Akiyoshi Y, Miyata T, Kawahara K,
Tsushima S, Hironaka H, Takafuji H, Rahaman M, Ahmad SKA,
Sayed MHSU, Faruquee MH (2001) Arsenic contamination of
ground and pond water and water purification system using pond
water in Bangladesh. Eng Geol 60:323–331
Environ Earth Sci
123
Related Documents