Author's personal copy Temporal observations of rip current circulation on a macro-tidal beach Martin Austin a, , Tim Scott a , Jeff Brown b , Jenna Brown c , Jamie MacMahan c , Gerd Masselink a , Paul Russell a a School of Marine Science and Engineering, University of Plymouth, Drake Circus, Plymouth PL4 8AA, UK b Center for Applied Coastal Research, University of Delaware, Newark, DE, USA c Oceanography Department, Naval Postgraduate School, Monterey, CA, USA article info Article history: Received 2 December 2009 Received in revised form 26 February 2010 Accepted 10 March 2010 Available online 18 March 2010 Keywords: Rip current Macro-tidal Surf zone Intermediate beach Drifters Cell circulation abstract A field experiment was conducted on a high energy macro-tidal beach (Perranporth, UK) to examine rip current dynamics over a low-tide transverse bar/rip system in response to changing tide and wave conditions. Hydrodynamic data were collected using an array of in situ acoustic doppler current meters and pressure transducers, as well as 12 GPS-tracked Lagrangian surf zone drifters. Inter-tidal and sub- tidal morphology were measured through RTK-GPS and echo-sounder surveys. Data were collected for eight consecutive days (15 tides) over a spring-neap tidal cycle with tidal ranges of 4–6.5 m and offshore significant wave heights of 1–2 m and peak periods of 5–12 s. The hypothesis that rip current dynamics in a macro-tidal setting are controlled by the combination of variations in wave dissipation and morphological flow constriction, modulated by changes in tidal elevation was tested. During the measurement period, rip circulation was characterised by a large rotational surf zone eddy O(200 m) extending offshore from the inner-surf zone to the seaward face of the inter-tidal transverse bar. During high- and mid-tide, water depth over the bars was too deep to allow wave breaking, and a strong longshore current dominated the surf zone. As the water depth decreased towards low-tide, wave breaking was concentrated over the bar crests initiating the rotational rip current eddy. Peak rip flow speeds of 1.3 m s 1 were recorded around low-tide when the joint effects of dissipation and morphological constriction were maximised. At low tide, dissipation over the bar crests was reduced by partial bar-emergence and observations suggested that rip flows were maintained by morphological constriction and the side-drainage of water from the transverse bars. & 2010 Elsevier Ltd. All rights reserved. 1. Introduction Previous investigations into beach hazards in the UK, Australia and the USA have indicated that rip currents present the single most significant cause of rescues and fatalities for recreational beach users (e.g. Short and Brander, 1999; Scott et al., 2007, 2008). Scott et al. (2008) identified that 68% of all incidents recorded by the Royal National Lifeboat Institution (RNLI) on UK beaches were due to rip currents. Furthermore, over 90% of recorded UK rip incidents were shown to occur on beaches with identifiable rip channel morphol- ogies (i.e. low tide bar/rip and low tide terrace + bar/rip). During periods of high rip current activity, environmental controls present an ‘optimum’ combination of beach morphological state (bar/rip morphology) and prevailing hydrodynamic conditions (waves and tides) (Scott et al., 2009). Combined with the tide-induced temporal variation of the beach hazard signature, these optimum conditions are observed to be a key factor in driving periods of high beach risk during busy summer months, which have been shown to be associated with coast-wide mass rescue events. Rip currents are a well studied phenomenon in micro- and meso-tidal environments (e.g. Shepard et al., 1941; McKenzie, 1958; Bowman et al., 1988; Huntley et al., 1988; Brander, 1999; Brander and Short, 2001; MacMahan et al., 2005, 2006) and have been shown to form an integral component of nearshore cell- circulation, returning water seawards from within the surf zone, largely as a confined energetic jet. Increasing interest and technological capability within the past decade have led to a greater number of quantitative studies of rip current dynamics; however, macro-tidal environments have been largely ignored with the recent exception of Bruneau et al. (2009) who investigated rip currents at a site spanning the meso–macro-tidal transition. The presence of rip currents is most commonly associated with intermediate-type beach morphology (Wright and Short, 1984) and in macro-tidal environments the effect of the tide is significant in shaping this morphology (Masselink and Short, 1993). Specifically, macro-tidal beaches frequently display a propensity to form rhythmic bar and trough systems during periods of smaller waves in the region seaward of mean low water neaps (MLWN) where ARTICLE IN PRESS Contents lists available at ScienceDirect journal homepage: www.elsevier.com/locate/csr Continental Shelf Research 0278-4343/$ - see front matter & 2010 Elsevier Ltd. All rights reserved. doi:10.1016/j.csr.2010.03.005 Corresponding author. Tel.: + 44 1752584716. E-mail address: [email protected] (M. Austin). Continental Shelf Research 30 (2010) 1149–1165

Welcome message from author
This document is posted to help you gain knowledge. Please leave a comment to let me know what you think about it! Share it to your friends and learn new things together.
Transcript
Author's personal copy
Temporal observations of rip current circulation on a macro-tidal beach
Martin Austin a,!, Tim Scott a, Jeff Brown b, Jenna Brown c, Jamie MacMahan c,Gerd Masselink a, Paul Russell a
a School of Marine Science and Engineering, University of Plymouth, Drake Circus, Plymouth PL4 8AA, UKb Center for Applied Coastal Research, University of Delaware, Newark, DE, USAc Oceanography Department, Naval Postgraduate School, Monterey, CA, USA
a r t i c l e i n f o
Article history:Received 2 December 2009Received in revised form26 February 2010Accepted 10 March 2010Available online 18 March 2010
Keywords:Rip currentMacro-tidalSurf zoneIntermediate beachDriftersCell circulation
a b s t r a c t
A field experiment was conducted on a high energy macro-tidal beach (Perranporth, UK) to examine ripcurrent dynamics over a low-tide transverse bar/rip system in response to changing tide and waveconditions. Hydrodynamic data were collected using an array of in situ acoustic doppler current metersand pressure transducers, as well as 12 GPS-tracked Lagrangian surf zone drifters. Inter-tidal and sub-tidal morphology were measured through RTK-GPS and echo-sounder surveys. Data were collected foreight consecutive days (15 tides) over a spring-neap tidal cycle with tidal ranges of 4–6.5m andoffshore significant wave heights of 1–2m and peak periods of 5–12 s.
The hypothesis that rip current dynamics in a macro-tidal setting are controlled by the combinationof variations in wave dissipation and morphological flow constriction, modulated by changes in tidalelevation was tested. During the measurement period, rip circulation was characterised by a largerotational surf zone eddy O(200m) extending offshore from the inner-surf zone to the seaward face ofthe inter-tidal transverse bar. During high- and mid-tide, water depth over the bars was too deep toallow wave breaking, and a strong longshore current dominated the surf zone. As the water depthdecreased towards low-tide, wave breaking was concentrated over the bar crests initiating therotational rip current eddy. Peak rip flow speeds of 1.3ms!1 were recorded around low-tide when thejoint effects of dissipation and morphological constriction were maximised. At low tide, dissipation overthe bar crests was reduced by partial bar-emergence and observations suggested that rip flows weremaintained by morphological constriction and the side-drainage of water from the transverse bars.
& 2010 Elsevier Ltd. All rights reserved.
1. Introduction
Previous investigations into beach hazards in the UK, Australiaand the USA have indicated that rip currents present the single mostsignificant cause of rescues and fatalities for recreational beach users(e.g. Short and Brander, 1999; Scott et al., 2007, 2008). Scott et al.(2008) identified that 68% of all incidents recorded by the RoyalNational Lifeboat Institution (RNLI) on UK beaches were due to ripcurrents. Furthermore, over 90% of recorded UK rip incidents wereshown to occur on beaches with identifiable rip channel morphol-ogies (i.e. low tide bar/rip and low tide terrace + bar/rip). Duringperiods of high rip current activity, environmental controls presentan ‘optimum’ combination of beach morphological state (bar/ripmorphology) and prevailing hydrodynamic conditions (waves andtides) (Scott et al., 2009). Combined with the tide-induced temporalvariation of the beach hazard signature, these optimum conditionsare observed to be a key factor in driving periods of high beach risk
during busy summer months, which have been shown to beassociated with coast-wide mass rescue events.
Rip currents are a well studied phenomenon in micro- andmeso-tidal environments (e.g. Shepard et al., 1941; McKenzie,1958; Bowman et al., 1988; Huntley et al., 1988; Brander, 1999;Brander and Short, 2001; MacMahan et al., 2005, 2006) and havebeen shown to form an integral component of nearshore cell-circulation, returning water seawards from within the surf zone,largely as a confined energetic jet. Increasing interest andtechnological capability within the past decade have led to agreater number of quantitative studies of rip current dynamics;however, macro-tidal environments have been largely ignoredwith the recent exception of Bruneau et al. (2009) who investigatedrip currents at a site spanning the meso–macro-tidal transition.
The presence of rip currents is most commonly associated withintermediate-type beachmorphology (Wright and Short, 1984) andin macro-tidal environments the effect of the tide is significant inshaping this morphology (Masselink and Short, 1993). Specifically,macro-tidal beaches frequently display a propensity to formrhythmic bar and trough systems during periods of smaller wavesin the region seaward of mean low water neaps (MLWN) where
ARTICLE IN PRESS
Contents lists available at ScienceDirect
journal homepage: www.elsevier.com/locate/csr
Continental Shelf Research
0278-4343/$ - see front matter & 2010 Elsevier Ltd. All rights reserved.doi:10.1016/j.csr.2010.03.005
! Corresponding author. Tel.: +441752584716.E-mail address: [email protected] (M. Austin).
Continental Shelf Research 30 (2010) 1149–1165

Author's personal copyARTICLE IN PRESS
there is sufficient tidal stationarity within a high-energy environ-ment to allow bar/trough systems to develop. The semi-rhythmicform of the inter-tidal bars results in a morphology characterisedby shallow shore-connected shoals incised by deeper rip channels.This leads to considerable longshore non-uniformity, variations inwave breaking and in turn cross- and longshore gradients in theradiation stress and the mean water surface driving water from thebars towards the channels (Bowen, 1969). The degree of morpho-logical development thus becomes a key factor in determining theflow kinematics of a macro-tidal rip system and hence rips arefrequently modulated at a seasonal scale (e.g. Brander, 1999).
Rip currents are known to be modulated by tide-inducedchanges in water depth with decreases in tidal stage increasingrip current flows to a relative maximum (e.g. Aagaard et al., 1997;Brander, 1999; Brander and Short, 2000, 2001; MacMahan et al.,2005, 2006; Bruneau et al., 2009). This modulation has beenlinked to temporal changes in the expression of the morphologycausing: (1) spatial and temporal variation in the pattern of wavedissipation; and (2) morphological flow constriction.
Sonu (1972), Haller et al. (2002) and MacMahan et al. (2006)state that wave breaking over nearshore bars is essential for theformation of rip circulation and that the intensity of breakingcorresponds with a proportionally stronger circulation. Consider-ing the case of low tide bar/trough morphology, at high- and mid-tide the amount of wave dissipation over the bars will be smalland hence the alongshore set-up gradient is small. Conversely, atlow tide, increased dissipation over the bar crests forces a largealongshore set-up gradient, water flows alongshore landwards ofthe bar crests, converging in the incised channels before flowingseawards—the rip current is now active. At some critical level ofwater depth over the bar, the set-up gradient and hence ripcurrent flow will be maximised.
Brander (1999) presents a conceptual model whereby themorphodynamic behaviour of rip currents is placed within thecontext of the Wright and Short (1984) beach state model withdown-state transitions linked to strengthening rip flows. The onsetof transverse bar/rip morphology (TBR) sees the infilling of thelongshore feeder channels, amplifying the morphological expres-sion of the rip channel and thus maximising the rip speed. Short(1985) hypothesizes that flow velocity is stable whilst constrainedwithin the channel, but that once the banks are overtopped withincreasing water depth the flow dramatically reduces. Moreover,Brander and Short (2001) suggest that topographic confinementenhances rip flow at lower tidal stages with the observation thatnarrow rip channels with pronounced banks were more sensitiveto tidally induced water depth changes.
Spatial and temporal variations in the distribution of wavedissipation and morphological flow constriction both have thepotential to modulate rip current flow in a macro-tidal environment.The purpose of this paper is to describe and quantify the dynamicbehaviour of a macro-tidal rip current system to test whether oneprocess is dominant, or alternatively whether both processes arecollectively responsible for the observed rip modulation. We use bothLagrangian and Eulerian field data collected from a high-energymacro-tidal beach during a period of large spring tides and moderatewaves to provide detailed measurements fromwithin a rip current aswell as the synoptic overview of the entire system at a time when therip hazard signature was at its seasonal maximum.
2. Methodology
2.1. Study site
An 8-day field experiment was conducted at Perranporthbeach, Cornwall, UK over a spring-to-neap tidal cycle between 01
and 08 August 2008 (Fig. 1). Perranporth is a macro-tidal beachwith semi-diurnal tidal regime and a mean spring range of 6.3m.It falls at the transition between the low tide bar/rip and dissipativebeach states and exhibits pronounced low tide bar/rip morphologywhich varies on a seasonal timescale. The intertidal beach isrelatively flat (tanb" 0.015–0.025) and the beach is composed ofmedium quartz sand (D50 " 0:2820:34mm). The beach faces west-northwest and is predominantly exposed to Atlantic swell, but alsoreceives locally generated wind waves; it has an annual averagesignificant wave height and peak period of Hs " 1:6m andTp " 10:5 s, respectively.
2.2. Field methods and instrumentation
The intertidal beach elevation was surveyed at low tide fromthe cliff foot to # 0:2m water depth using a real time kinematicGPS (RTK-GPS) mounted on an all-terrain vehicle (ATV) at thestart and end of the experiment. Additional lower-intertidalsurveys were performed during tides 3, 7, 9 and 13. A bathymetricsurvey was conducted during high tide 13–14 using RTK-GPS andan echo-sounder mounted on an RNLI inshore rescue boat to adepth of 16m and overlapping with the intertidal survey. Datawere Loess-interpolated onto a regular grid and transformed intoa local coordinate system $X,Y %, where X is directed cross-shoreand increases to seaward and Y is alongshore increasing to thesouth (Fig. 2). An Argus video system was also located atPerranporth. Time-averaged images were recorded every 30-minand merged and rectified onto the same local coordinate systemas the bathymetric measurements.
An array of in situ sensors were deployed around the mean lowwater spring (MLWS) tidal level to monitor the rip current flows(Fig. 2). Flow velocity and water depth within the rip channel andadjacent incised shore-parallel low-tide bar/feeder region weremeasured with Nortek Vector 3D-ADV’s equipped with anexternal pressure transducer (PT). The head of the ADV’s andco-located sensors were mounted 0.2m above the bed. Theinstruments were mounted onto free-standing frames and weredeployed between tides 3 and 9. The frames were removed aftertide 9 since the waning tidal range would have preventedrecovery until the following month. An RBR-instrumentsTWR2050 self-recording tide-wave recorder (TWR) located onthe crest of the intertidal bar recorded water depth for 2048-sample bursts every 10min. Tidal elevation data were alsopredicted through harmonic analysis of previous data from thefield site. All instruments sampled at 4Hz. In addition, adirectional wave rider (DWR) buoy located # 1:2km offshore in13m water depth provided offshore wave measurementsthroughout the field experiment.
The surf zone circulation associated with rip current flows wasmeasured using Lagrangian drifters. Rip drifter floats wereconstructed following a design similar to Schmit et al. (2003)and their position was monitored at 0.5Hz using GPS loggers thatwere post-processed from a survey-grade static base stationfollowing MacMahan et al. (2009). These provided estimates of ripcurrent flows with an accuracy for position and speed of o0:4mand o0:01ms!1, respectively. MacMahan et al. (2009) alsocompared drifter and dye releases indicating that drifter observa-tions are valid Lagrangian observations as well as comparing wellwith in situ observations. The positional data were qualitycontrolled to remove erroneous points (greater than threevelocity standard deviations from the mean) and gaps in the timeseries were linearly interpolated when 410 s and spline inter-polated when o10 s, consistent with drifter observations bySpydell et al. (2007). Drifters were released into the surf zone inclusters of 4 and allowed to circulate with the currents until they
M. Austin et al. / Continental Shelf Research 30 (2010) 1149–11651150
Author's personal copyARTICLE IN PRESS
either grounded at the shoreline or escaped from pre-definedlongshore and offshore boundaries.
3. Data processing
3.1. Hydrodynamic data
The continuous data collected by the in situ hydrodynamicinstruments (time series of water depth h, cross- and longshoreflow velocity u and v) were calibrated, de-spiked and organisedinto coincident 8.5-min bursts (2048-samples) every 10-min. Thetime series of uwas used to calculate the root mean square orbital
velocity Um ("!!!8
psu, where su is the standard deviation of the
cross-shore velocity record) and the mean flow velocity /uS(where brackets represent time-averaging); similar longshoreparameters were calculated for v. Using the hydrodynamicindicators calculated above, the Froude number Fr was definedas a non-dimensional measure of rip speed (Haller et al., 2002)
Fr "Ur!!!!!!gh
p , &1'
where Ur is the mean return speed ("!!!!!!!!!!!!!!!!!!!!!!!!!!!!!!/uS2(/vS2
q), g is the
gravitational acceleration and h the local water depth over the barcrest, in line with previous field and laboratory experiments.Parameters were removed from the analysis when individualsensors became emerged.
The relative wave height Hs=h provides a useful measure ofwave breaking within the nearshore zone (Ruessink et al., 1998)and has been used in previous rip studies as a proxy for wavedissipation. Hs=h can be computed using the offshore wave heightat the DWR, Hs,DWR=hbar (e.g. MacMahan et al., 2005, 2006) or in alocal form using the water depth measured on the crest of theintertidal bar Hs,bar=hbar; however, both of these approaches canbe problematic in a macro-tidal environment if the crest of theinter-tidal bar emerges at low water. In this situation,Hs,DWR=hbar-1 as un-attenuated offshore waves ‘propagate’ intonear-zero water depth on the bar. For the local case, Hs,bar=hbar-0as the water depth goes to zero at the shoreline but, across theisolated swash zone that develops on the bar crest, also tends to1 as large broken wave bores intermittently propagate across thedry crest. In an attempt to avoid these problems when quantifyingthe large spatial and temporal variations in rip flow recordedby the Lagrangian drifters an alternative parameterisation, thewave roller dissipation, was estimated from the remote videoobservations.
3.2. Wave roller dissipation
Estimates of the wave roller dissipation were obtained fromthe plan view Argus timex images of wave breaking intensity
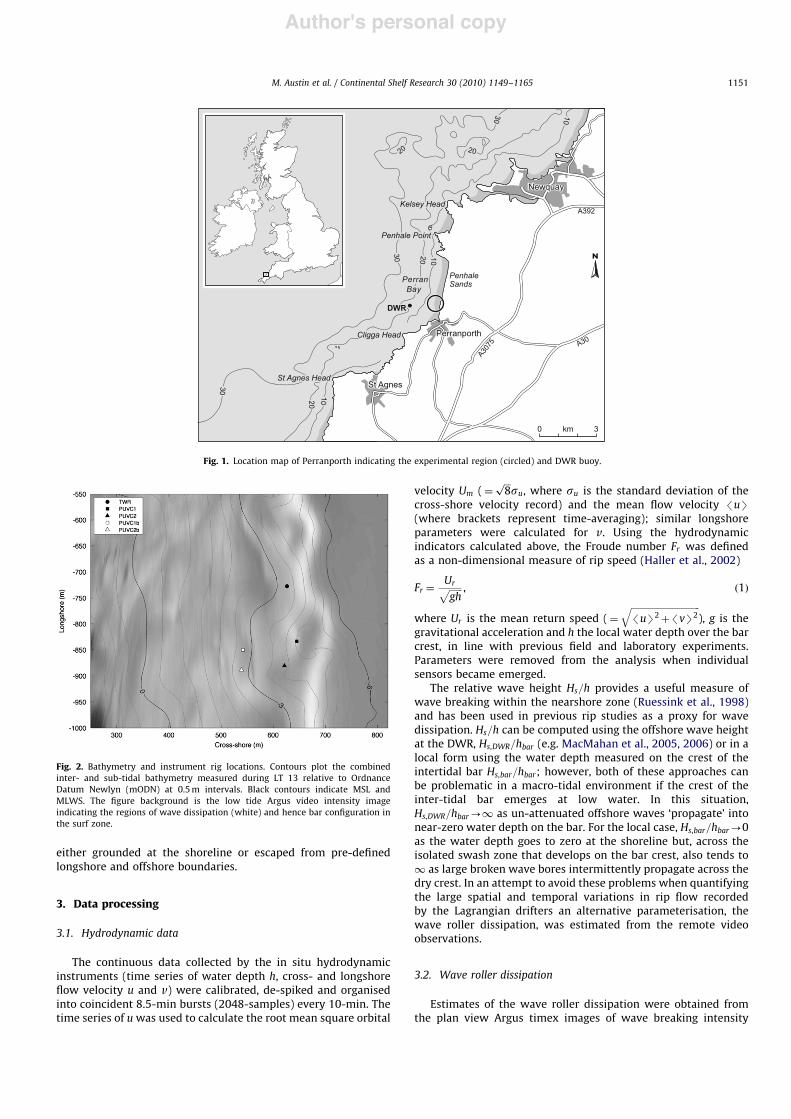
Fig. 1. Location map of Perranporth indicating the experimental region (circled) and DWR buoy.
Fig. 2. Bathymetry and instrument rig locations. Contours plot the combinedinter- and sub-tidal bathymetry measured during LT 13 relative to OrdnanceDatum Newlyn (mODN) at 0.5m intervals. Black contours indicate MSL andMLWS. The figure background is the low tide Argus video intensity imageindicating the regions of wave dissipation (white) and hence bar configuration inthe surf zone.
M. Austin et al. / Continental Shelf Research 30 (2010) 1149–1165 1151
Author's personal copyARTICLE IN PRESS
combined with the inshore water depth and wave height.The quantification procedure largely follows the method ofAarninkhof et al. (2005) and van Dongeren et al. (2008) andassumes that video intensity is a proxy for roller dissipation.
Firstly, the background intensity level is removed from themerged plan view dissipation map (timex image) Iv, since theoffshore areas (where no breaking occurs) should map to no wavedissipation (zero video intensity). This is achieved by determiningthe mean image intensity for each horizontal image line along theseaward boundary (non-breaking) of the domain in the regionx" 7502800m and subtracting this value from each image lineacross the entire domain; negative intensities are set to zero.
Secondly, the corrected image intensities are scaled such thatthey provide a quantitatively correct measure of roller dissipation.Accordingly, Iv is normalised so that the total normalised intensityin the domain equals unity and then scaled with the incomingwave energy flux along the seaward boundary of the domain,thereby providing a video-derived measure of roller dissipation D0
D0&x,y' "Iv&x,y'R
x
RyIv dxdy
!Z
yECgcosydy, &2'
where E is the wave energy at the DWR according toE" 1=8rgH2
rms, Cg is the wave group velocity and y is the angle ofwave incidence with respect to the shoreline. Hrms and y wereobtained from the DWR.
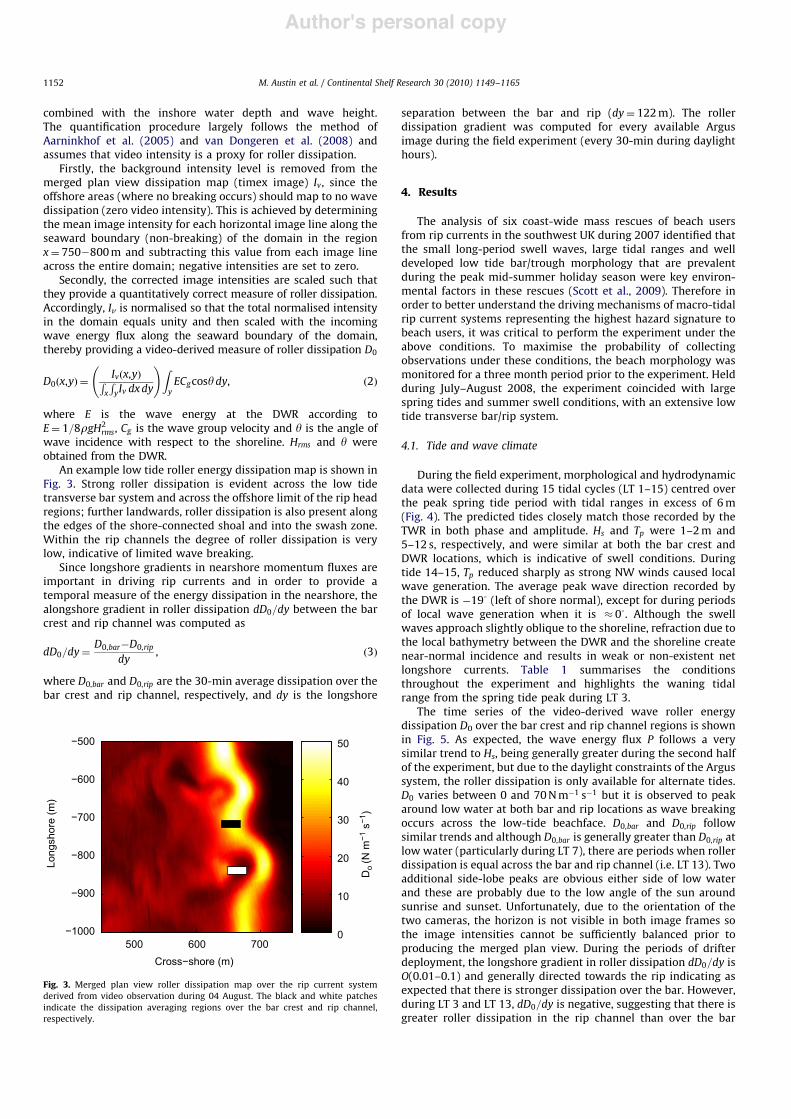
An example low tide roller energy dissipation map is shown inFig. 3. Strong roller dissipation is evident across the low tidetransverse bar system and across the offshore limit of the rip headregions; further landwards, roller dissipation is also present alongthe edges of the shore-connected shoal and into the swash zone.Within the rip channels the degree of roller dissipation is verylow, indicative of limited wave breaking.
Since longshore gradients in nearshore momentum fluxes areimportant in driving rip currents and in order to provide atemporal measure of the energy dissipation in the nearshore, thealongshore gradient in roller dissipation dD0=dy between the barcrest and rip channel was computed as
dD0=dy"D0,bar!D0,rip
dy, &3'
where D0,bar and D0,rip are the 30-min average dissipation over thebar crest and rip channel, respectively, and dy is the longshore
separation between the bar and rip (dy" 122m). The rollerdissipation gradient was computed for every available Argusimage during the field experiment (every 30-min during daylighthours).
4. Results
The analysis of six coast-wide mass rescues of beach usersfrom rip currents in the southwest UK during 2007 identified thatthe small long-period swell waves, large tidal ranges and welldeveloped low tide bar/trough morphology that are prevalentduring the peak mid-summer holiday season were key environ-mental factors in these rescues (Scott et al., 2009). Therefore inorder to better understand the driving mechanisms of macro-tidalrip current systems representing the highest hazard signature tobeach users, it was critical to perform the experiment under theabove conditions. To maximise the probability of collectingobservations under these conditions, the beach morphology wasmonitored for a three month period prior to the experiment. Heldduring July–August 2008, the experiment coincided with largespring tides and summer swell conditions, with an extensive lowtide transverse bar/rip system.
4.1. Tide and wave climate
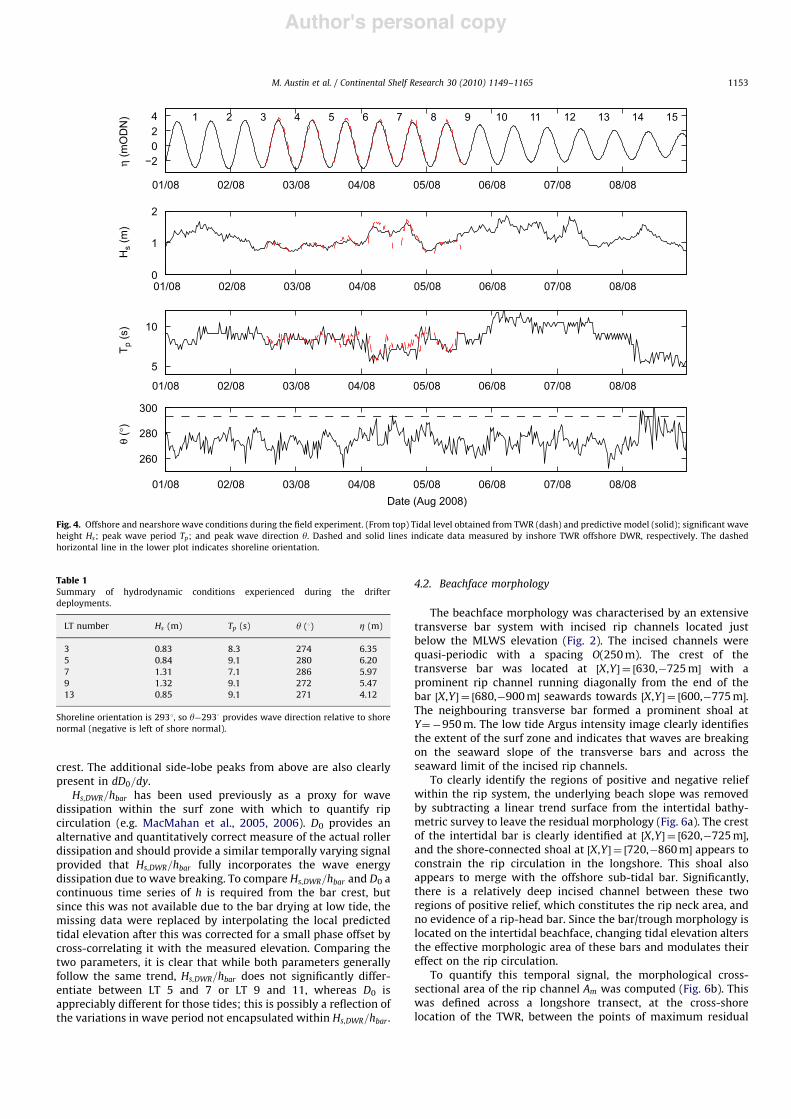
During the field experiment, morphological and hydrodynamicdata were collected during 15 tidal cycles (LT 1–15) centred overthe peak spring tide period with tidal ranges in excess of 6m(Fig. 4). The predicted tides closely match those recorded by theTWR in both phase and amplitude. Hs and Tp were 1–2m and5–12 s, respectively, and were similar at both the bar crest andDWR locations, which is indicative of swell conditions. Duringtide 14–15, Tp reduced sharply as strong NW winds caused localwave generation. The average peak wave direction recorded bythe DWR is !193 (left of shore normal), except for during periodsof local wave generation when it is ) 03. Although the swellwaves approach slightly oblique to the shoreline, refraction due tothe local bathymetry between the DWR and the shoreline createnear-normal incidence and results in weak or non-existent netlongshore currents. Table 1 summarises the conditionsthroughout the experiment and highlights the waning tidalrange from the spring tide peak during LT 3.
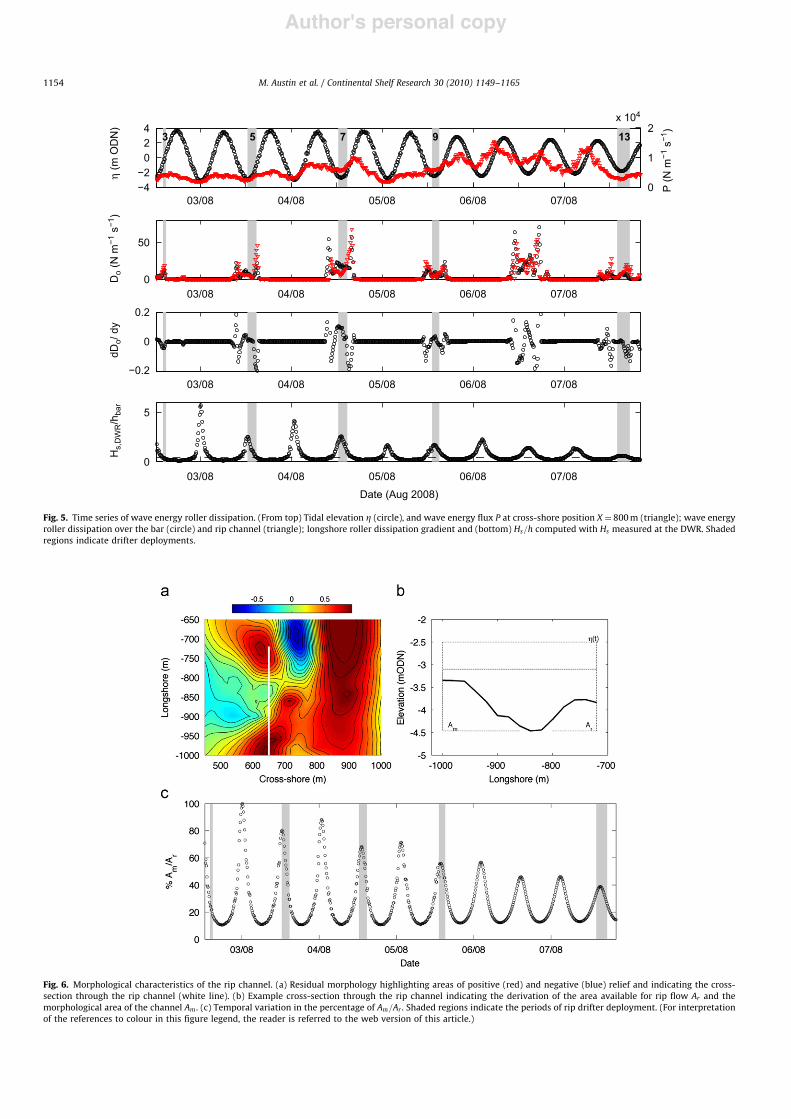
The time series of the video-derived wave roller energydissipation D0 over the bar crest and rip channel regions is shownin Fig. 5. As expected, the wave energy flux P follows a verysimilar trend to Hs, being generally greater during the second halfof the experiment, but due to the daylight constraints of the Argussystem, the roller dissipation is only available for alternate tides.D0 varies between 0 and 70Nm!1 s!1 but it is observed to peakaround low water at both bar and rip locations as wave breakingoccurs across the low-tide beachface. D0,bar and D0,rip followsimilar trends and although D0,bar is generally greater than D0,rip atlow water (particularly during LT 7), there are periods when rollerdissipation is equal across the bar and rip channel (i.e. LT 13). Twoadditional side-lobe peaks are obvious either side of low waterand these are probably due to the low angle of the sun aroundsunrise and sunset. Unfortunately, due to the orientation of thetwo cameras, the horizon is not visible in both image frames sothe image intensities cannot be sufficiently balanced prior toproducing the merged plan view. During the periods of drifterdeployment, the longshore gradient in roller dissipation dD0=dy isO(0.01–0.1) and generally directed towards the rip indicating asexpected that there is stronger dissipation over the bar. However,during LT 3 and LT 13, dD0=dy is negative, suggesting that there isgreater roller dissipation in the rip channel than over the bar
Cross!shore (m)
Long
shor
e (m
)
500 600 700!1000
!900
!800
!700
!600
!500
Do
(N m!1
s!1
)
0
10
20
30
40
50
Fig. 3. Merged plan view roller dissipation map over the rip current systemderived from video observation during 04 August. The black and white patchesindicate the dissipation averaging regions over the bar crest and rip channel,respectively.
M. Austin et al. / Continental Shelf Research 30 (2010) 1149–11651152
Author's personal copyARTICLE IN PRESS
crest. The additional side-lobe peaks from above are also clearlypresent in dD0=dy.
Hs,DWR=hbar has been used previously as a proxy for wavedissipation within the surf zone with which to quantify ripcirculation (e.g. MacMahan et al., 2005, 2006). D0 provides analternative and quantitatively correct measure of the actual rollerdissipation and should provide a similar temporally varying signalprovided that Hs,DWR=hbar fully incorporates the wave energydissipation due to wave breaking. To compare Hs,DWR=hbar and D0 acontinuous time series of h is required from the bar crest, butsince this was not available due to the bar drying at low tide, themissing data were replaced by interpolating the local predictedtidal elevation after this was corrected for a small phase offset bycross-correlating it with the measured elevation. Comparing thetwo parameters, it is clear that while both parameters generallyfollow the same trend, Hs,DWR=hbar does not significantly differ-entiate between LT 5 and 7 or LT 9 and 11, whereas D0 isappreciably different for those tides; this is possibly a reflection ofthe variations in wave period not encapsulated within Hs,DWR=hbar .
4.2. Beachface morphology
The beachface morphology was characterised by an extensivetransverse bar system with incised rip channels located justbelow the MLWS elevation (Fig. 2). The incised channels werequasi-periodic with a spacing O(250m). The crest of thetransverse bar was located at $X,Y% " $630,!725m% with aprominent rip channel running diagonally from the end of thebar $X,Y % " $680,!900m% seawards towards $X,Y % " $600,!775m%.The neighbouring transverse bar formed a prominent shoal atY"!950m. The low tide Argus intensity image clearly identifiesthe extent of the surf zone and indicates that waves are breakingon the seaward slope of the transverse bars and across theseaward limit of the incised rip channels.
To clearly identify the regions of positive and negative reliefwithin the rip system, the underlying beach slope was removedby subtracting a linear trend surface from the intertidal bathy-metric survey to leave the residual morphology (Fig. 6a). The crestof the intertidal bar is clearly identified at $X,Y % " $620,!725m%,and the shore-connected shoal at $X,Y % " $720,!860m% appears toconstrain the rip circulation in the longshore. This shoal alsoappears to merge with the offshore sub-tidal bar. Significantly,there is a relatively deep incised channel between these tworegions of positive relief, which constitutes the rip neck area, andno evidence of a rip-head bar. Since the bar/trough morphology islocated on the intertidal beachface, changing tidal elevation altersthe effective morphologic area of these bars and modulates theireffect on the rip circulation.
To quantify this temporal signal, the morphological cross-sectional area of the rip channel Am was computed (Fig. 6b). Thiswas defined across a longshore transect, at the cross-shorelocation of the TWR, between the points of maximum residual
01/08 02/08 03/08 04/08 05/08 06/08 07/08 08/08
!2024
! (m
OD
N) 1 3 5 7 9 10 11 12 13 14 15
01/08 02/08 03/08 04/08 05/08 06/08 07/08 08/080
1
2
Hs (
m)
01/08 02/08 03/08 04/08 05/08 06/08 07/08 08/08
5
10
T p (s
)
01/08 02/08 03/08 04/08 05/08 06/08 07/08 08/08
260
280
300
" (°
)
Date (Aug 2008)
2 4 6 8
Fig. 4. Offshore and nearshore wave conditions during the field experiment. (From top) Tidal level obtained from TWR (dash) and predictive model (solid); significant waveheight Hs; peak wave period Tp; and peak wave direction y. Dashed and solid lines indicate data measured by inshore TWR offshore DWR, respectively. The dashedhorizontal line in the lower plot indicates shoreline orientation.
Table 1Summary of hydrodynamic conditions experienced during the drifterdeployments.
LT number Hs (m) Tp (s) y (3) Z (m)
3 0.83 8.3 274 6.355 0.84 9.1 280 6.207 1.31 7.1 286 5.979 1.32 9.1 272 5.4713 0.85 9.1 271 4.12
Shoreline orientation is 2931, so y!2933 provides wave direction relative to shorenormal (negative is left of shore normal).
M. Austin et al. / Continental Shelf Research 30 (2010) 1149–1165 1153
Author's personal copyARTICLE IN PRESS
03/08 04/08 05/08 06/08 07/08!4!2
024
! (m
OD
N)
3 7 13
0
1
2x 10⁴
P (N
m!1
s!1
)
03/08 04/08 05/08 06/08 07/080
50
Do (
N m!1
s!1
)
03/08 04/08 05/08 06/08 07/08
0
0.2
dDo/
dy
03/08 04/08 05/08 06/08 07/080
5
Hs,
DW
R/h
bar
Date (Aug 2008)
!0.2
5 9
Fig. 5. Time series of wave energy roller dissipation. (From top) Tidal elevation Z (circle), and wave energy flux P at cross-shore position X " 800m (triangle); wave energyroller dissipation over the bar (circle) and rip channel (triangle); longshore roller dissipation gradient and (bottom) Hs=h computed with Hs measured at the DWR. Shadedregions indicate drifter deployments.
Fig. 6. Morphological characteristics of the rip channel. (a) Residual morphology highlighting areas of positive (red) and negative (blue) relief and indicating the cross-section through the rip channel (white line). (b) Example cross-section through the rip channel indicating the derivation of the area available for rip flow Ar and themorphological area of the channel Am . (c) Temporal variation in the percentage of Am=Ar . Shaded regions indicate the periods of rip drifter deployment. (For interpretationof the references to colour in this figure legend, the reader is referred to the web version of this article.)
M. Austin et al. / Continental Shelf Research 30 (2010) 1149–11651154

Author's personal copyARTICLE IN PRESS
morphological relief of the intertidal bar and shore-connectedshoal (cf. Brander, 1999), with the vertical limit defined as theminimum tidal elevation recorded during the experimentZm& "!3:1mODN'
Am "Z y " n
y " 1&z(Zm'dy: &4'
The total area available for rip current flow Ar was also defined,where Z&t' is the measured tidal elevation
Ar&t' "Z y " n
y " 1&z(Z&t''dy: &5'
The percentage of Am to Ar provides a quantitative measure of themorphological constriction placed on the rip circulation by thechannel morphology (Fig. 6c).
4.3. Eulerian rip current flows
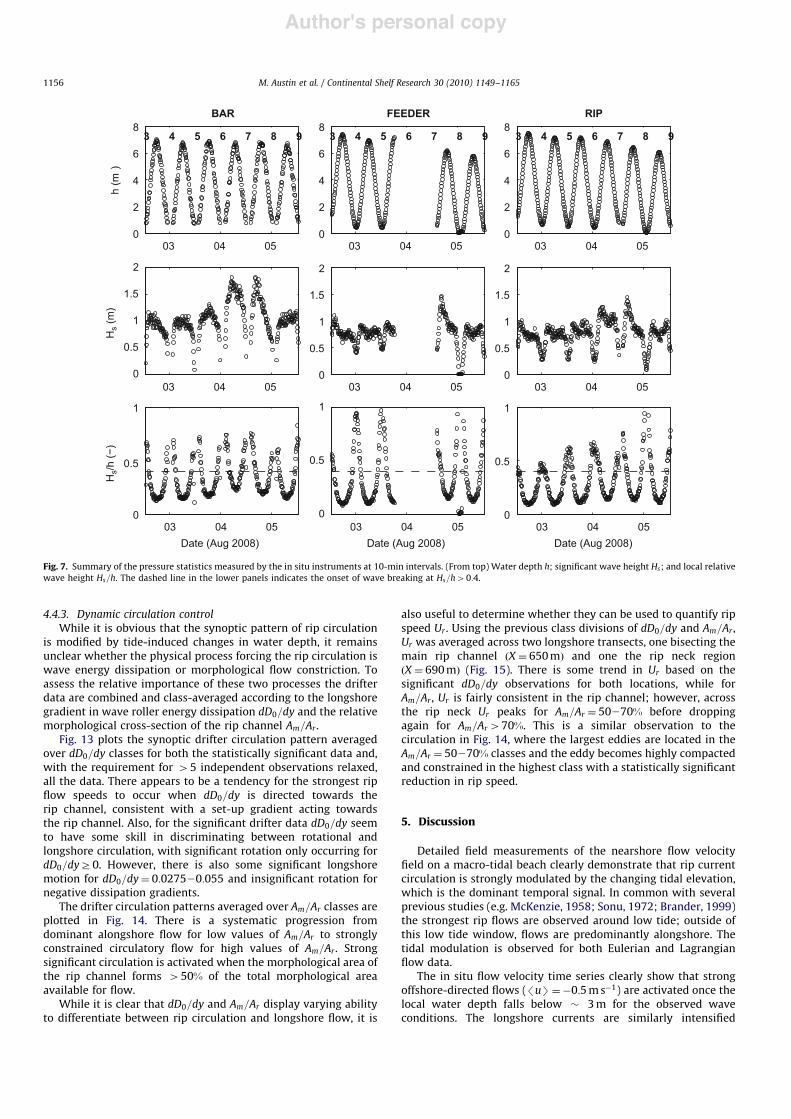
The in situ instruments were deployed below the MLWSelevation and the water depth over each tide typically variedbetween 0.5 and 7m (Fig. 7). The significant wave height wasO(1m), but increased to 1.5–2m during LT 7–8. The wave heightwas modulated by the variation in water depth and this was mostapparent over the bar rather than the deeper rip/feeder regions.The relative wave height Hs=h provides an indication of wavebreaking and suggests that during low tide wave breaking occursat all instrument stations (Hs=h40:6); however, the lowestproportion of breaking occurs in the rip channel. This isparticularly evident during LT 3–5, when there is significantwave breaking across the bar crest and feeder regions, butminimal breaking across the rip channel. Note that Hs=h over thebar crest is discontinuous around low tide as the bar crestemerges.
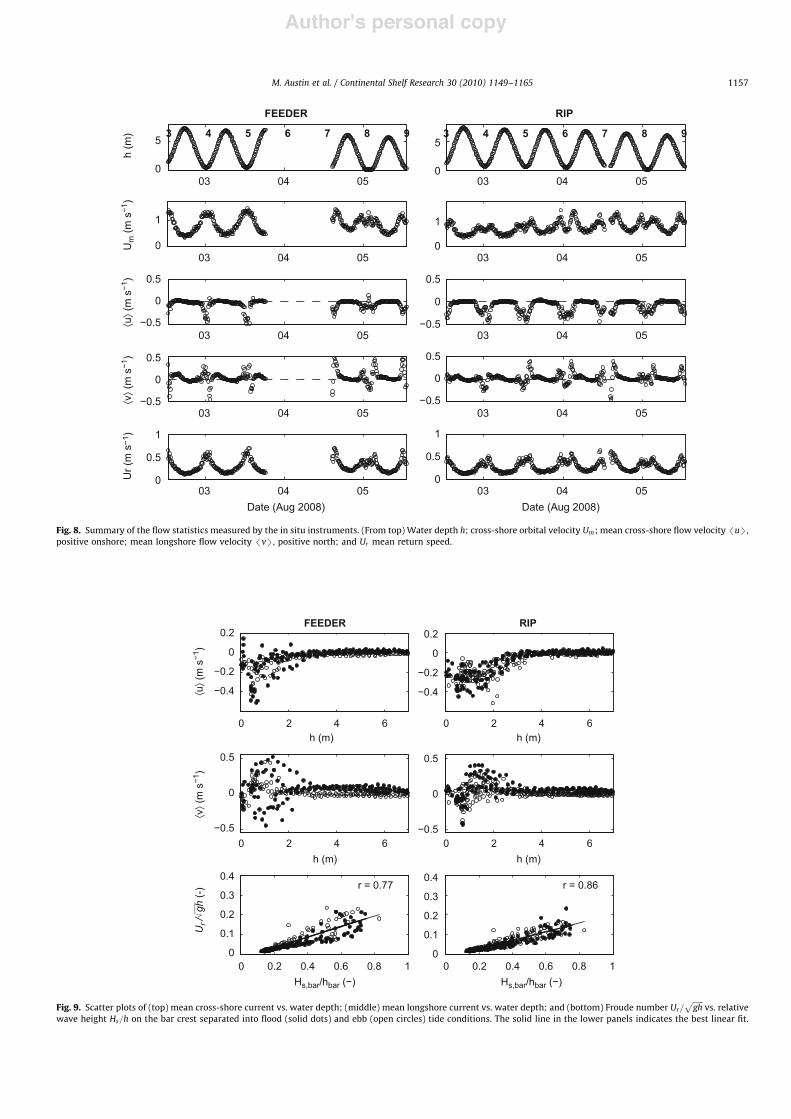
The flow velocity data display significant tidal modulation ofthe currents with maximum flows recorded around low water atboth the feeder and rip locations (Fig. 8). Cross-shore orbitalvelocities were 0.5–1.5ms!1, while the mean cross-shorecurrents /uS were generally offshore and reach !0.5ms!1.Mean longshore currents /vS were recorded up to 0.5ms!1 toboth the north and south. Due to the circulation present aroundthe bar/rip, flow was not always directed in either a cross- orlongshore direction so the mean return speed Ur was computedand indicates that maximum Ur coincides with low tide.
The mean current velocities display a clear dependence on thelocal water depth (tidal elevation) (Fig. 9). Mean cross-shorecurrents become increasingly offshore-directed once the waterdepth falls below # 3m, and while the longshore currents areobserved to flow in both directions, they are of a similarmagnitude to the cross-shore flows. There appears to be littledifferentiation between the magnitude of the mean currentsduring the flood and ebb tide periods.
Due to varying conditions on each day of the experiment, ripcurrent speeds display some dependence on wave energy. There-fore using the dimensionless rip current velocity parameterised asthe Froude number (Eq. (1)), rip speed scales well with therelative wave height, displaying a strong linear relationship with rvalues of 0.77 and 0.86 for feeder and rip locations, respectively.Note that D0 could not be used here since it was only sampled at30-min intervals so the relative wave height at the bar crest wasused (Hs,bar=hbar), rather than the offshore wave height alternativeas used by MacMahan et al. (2005).
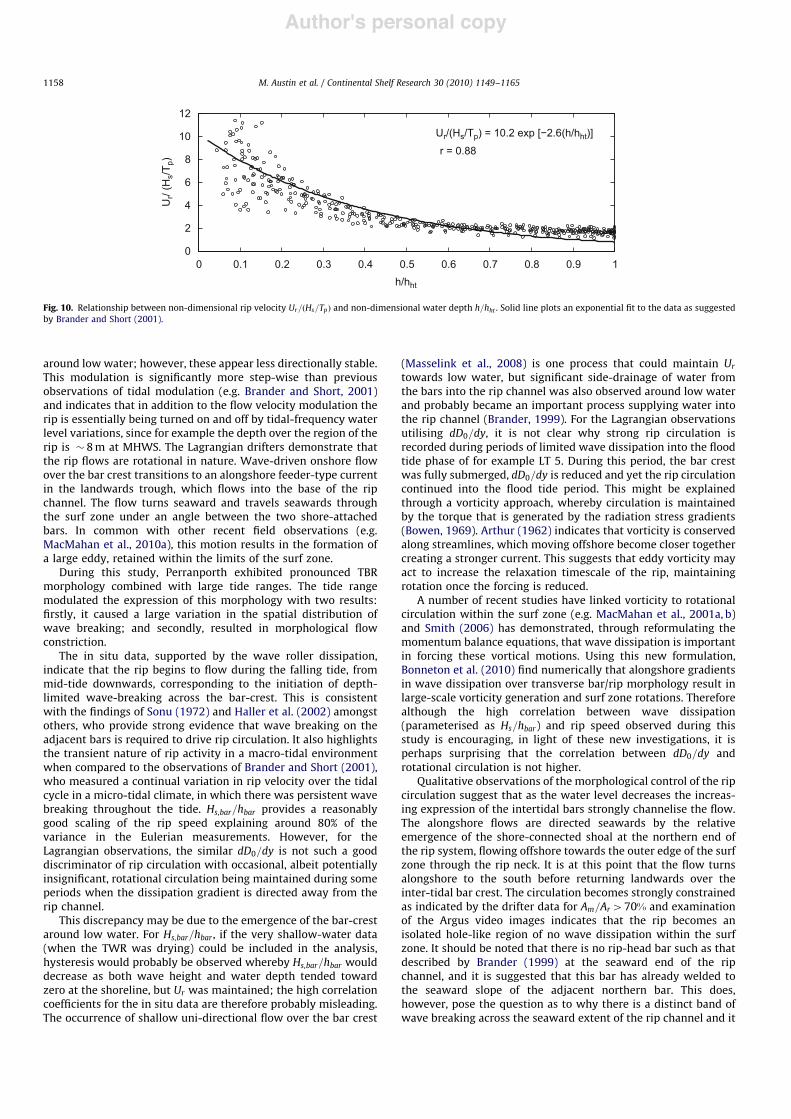
An alternative scaling relationship was proposed by Branderand Short (2001). To account for changing wave energy levelsbetween tides, Ur is normalised by the wave steepness Hs=Tp andto account for varying tidal elevations, h was normalised by thehigh tide water depth hht . Fig. 10 shows that Ur is strongly
modulated by the water depth indicating that rip speed increaseswith decreasing water depth, particularly after mid-tide (h=hht).An exponential fit, as suggested by Brander and Short (2001)models the data reasonably well, however, it underestimates theflow speeds at high water and overestimates the mid-tide speeds.
4.4. Lagrangian drifter observations
4.4.1. Mean circulationLagrangian observations obtained using GPS drifters during LT
3, 5, 7, 9 and 13 quantify the rip circulation pattern and speedover a large spatial area of the system compared to the in situEulerian measurements. The nearshore was split into 10m*10mbins and the drifter observations during each deployment wereaveraged within each bin. A drifter was considered as anindependent observation when within a particular bin. If a drifterre-entered the same bin it was considered a new independentobservation if t4 lg=U had elapsed, where t is time, lg is the binlength (10m) and U is the mean speed for all drifter observationswithin that bin (MacMahan et al., 2010a). Bins containing greaterthan 5 independent observations were considered statisticallysignificant following Spydell et al. (2007).
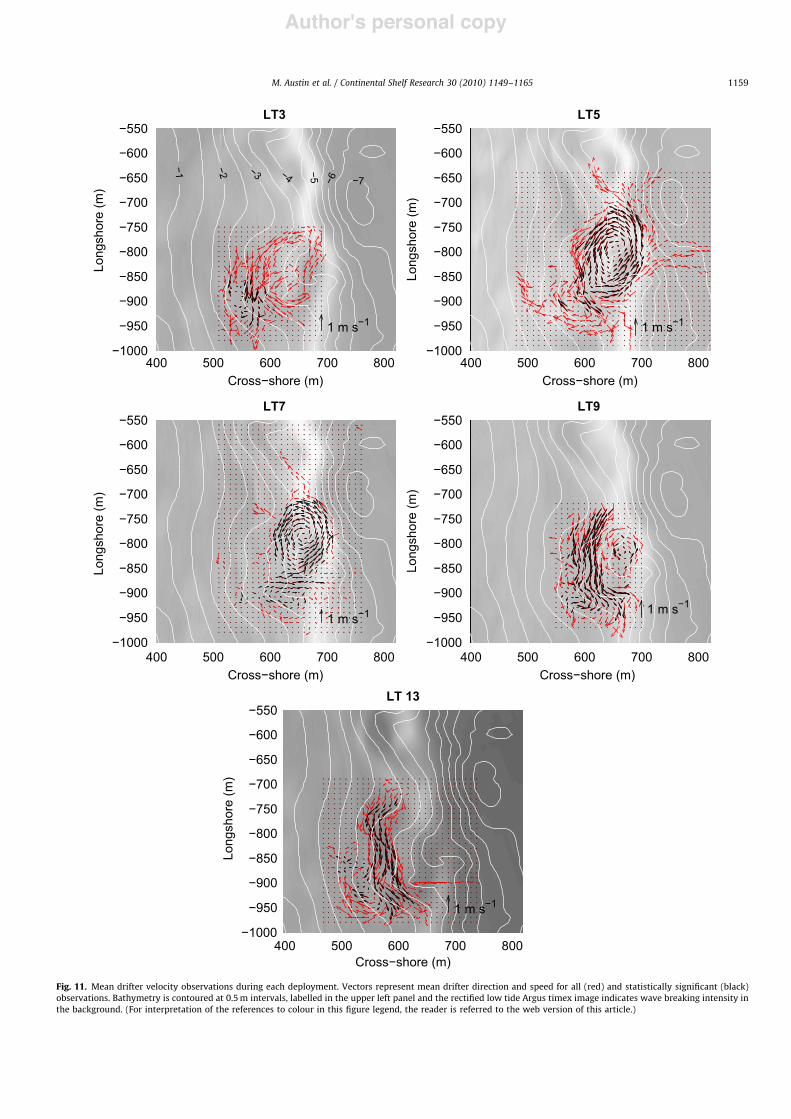
It is clear that a large rotational rip circulation system waspresent within the surf zone during periods of the fieldexperiment with cross- and longshore length scales O(200m)(Fig. 11). The rip circulation was anti-clockwise and flowedoffshore through the surf zone under an angle of # 453 untilreaching the seaward breaker line. The flow then turnedlongshore for # 75m before returning landwards over theshallow intertidal bar at $X,Y% " $650,!750m%. Additionally,there are several points during the circulation where drifterswould sometimes exit the surf zone to seawards, be incorporatedinto adjacent circulation cells or meander into very shallow waterto landwards.
The rotational eddy was present with varying degrees ofpersistence and speed for all tides except LT 13. The most highlydeveloped circulation cells were present during LT 5 and LT 7;conversely, LT 9 and LT 13 are dominated by alongshore currentswith very limited rotational circulation. The significant mean flowspeeds recorded by the drifters from within the circulation systemare 0:0121:27ms!1, with maximum speeds coincident with thestrongest circulation during LT 5 and LT 7. Modal drifter speedsduring the deployment ranged from 0.3 to 0:5ms!1 and werecomparable with the Eulerian speeds &0:3520:4ms!1); however,due to the large spatial area covered by the drifters the standarddeviation of rip speeds (sL " 0:19) is greater than for the in situmeasurements (sE " 0:07). It seems clear that when the ripcurrent is active, the flow is circulatory in nature; conversely,when the longshore motion is dominant there is little or nooffshore-directed flow through the rip channel.
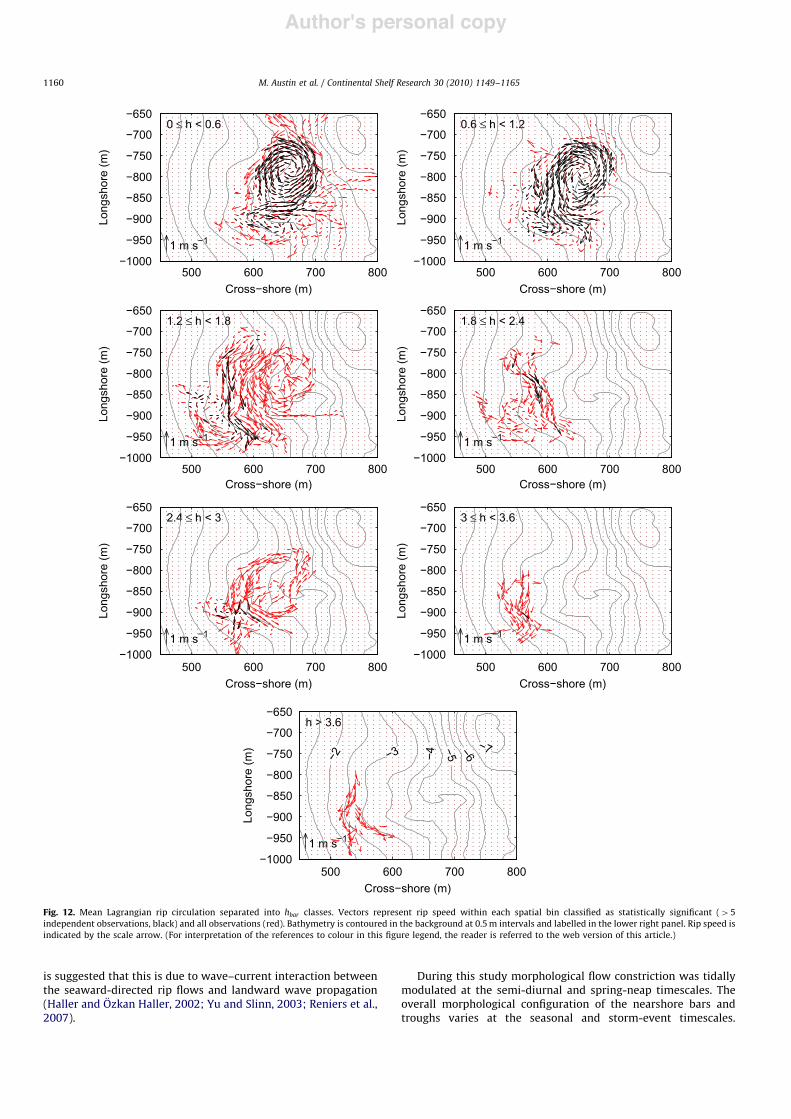
4.4.2. Kinematic circulation controlTo investigate the nature of the rip current circulation under a
range of tide conditions all drifter observations were combinedand classified according to the local water depth on the bar cresthbar measured at the time of drifter release (Fig. 12). The twopreviously identified modes of rip circulation appear to bedifferentiated by variations in h. For shallow water depths (ho1.8 m) strong rotational circulation is present, while for h41:8mthe alongshore current dominates and there is little offshore flowthrough the rip channel. The alongshore directed flows from thebar crest to the landward end of the rip channel are consistentlythe strongest, reaching 0:721ms!1. It is also noted that thedrifter circulation pattern is shifted slightly landwards as waterdepths increase, reflecting the shoreline migration.
M. Austin et al. / Continental Shelf Research 30 (2010) 1149–1165 1155
Author's personal copyARTICLE IN PRESS
4.4.3. Dynamic circulation controlWhile it is obvious that the synoptic pattern of rip circulation
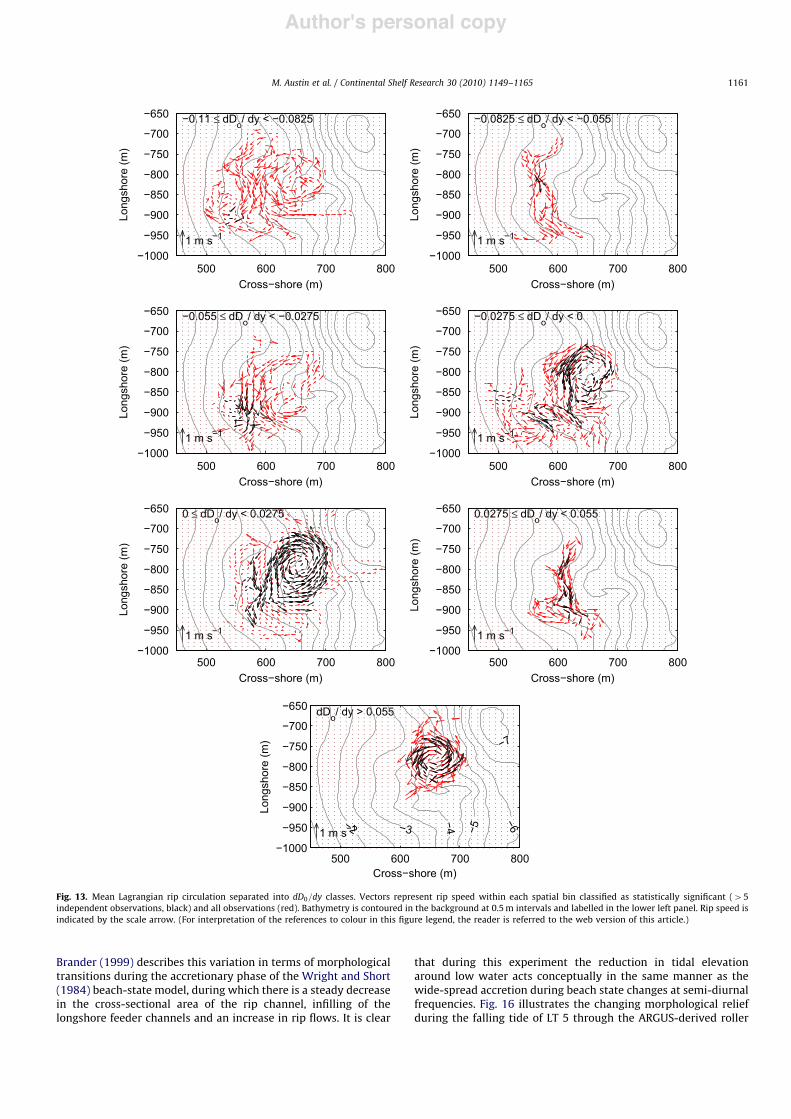
is modified by tide-induced changes in water depth, it remainsunclear whether the physical process forcing the rip circulation iswave energy dissipation or morphological flow constriction. Toassess the relative importance of these two processes the drifterdata are combined and class-averaged according to the longshoregradient in wave roller energy dissipation dD0=dy and the relativemorphological cross-section of the rip channel Am=Ar .
Fig. 13 plots the synoptic drifter circulation pattern averagedover dD0=dy classes for both the statistically significant data and,with the requirement for 45 independent observations relaxed,all the data. There appears to be a tendency for the strongest ripflow speeds to occur when dD0=dy is directed towards therip channel, consistent with a set-up gradient acting towardsthe rip channel. Also, for the significant drifter data dD0=dy seemto have some skill in discriminating between rotational andlongshore circulation, with significant rotation only occurring fordD0=dyZ0. However, there is also some significant longshoremotion for dD0=dy" 0:027520:055 and insignificant rotation fornegative dissipation gradients.
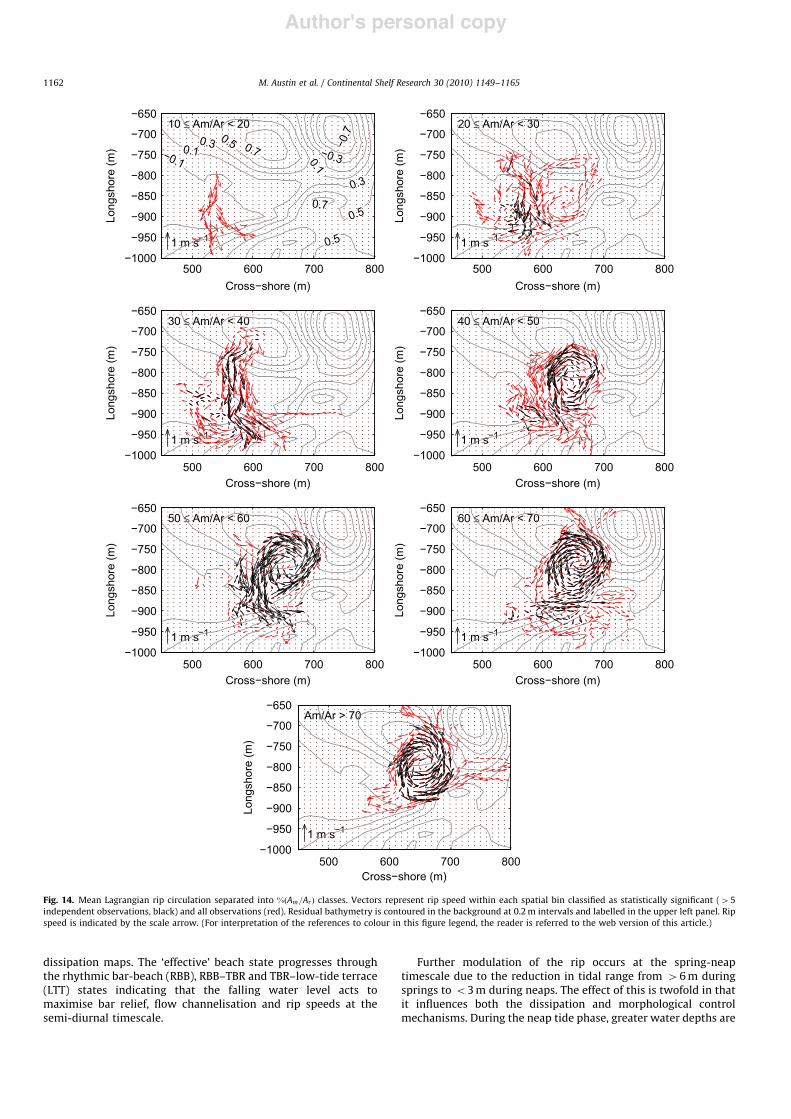
The drifter circulation patterns averaged over Am=Ar classes areplotted in Fig. 14. There is a systematic progression fromdominant alongshore flow for low values of Am=Ar to stronglyconstrained circulatory flow for high values of Am=Ar . Strongsignificant circulation is activated when the morphological area ofthe rip channel forms 450% of the total morphological areaavailable for flow.
While it is clear that dD0=dy and Am=Ar display varying abilityto differentiate between rip circulation and longshore flow, it is
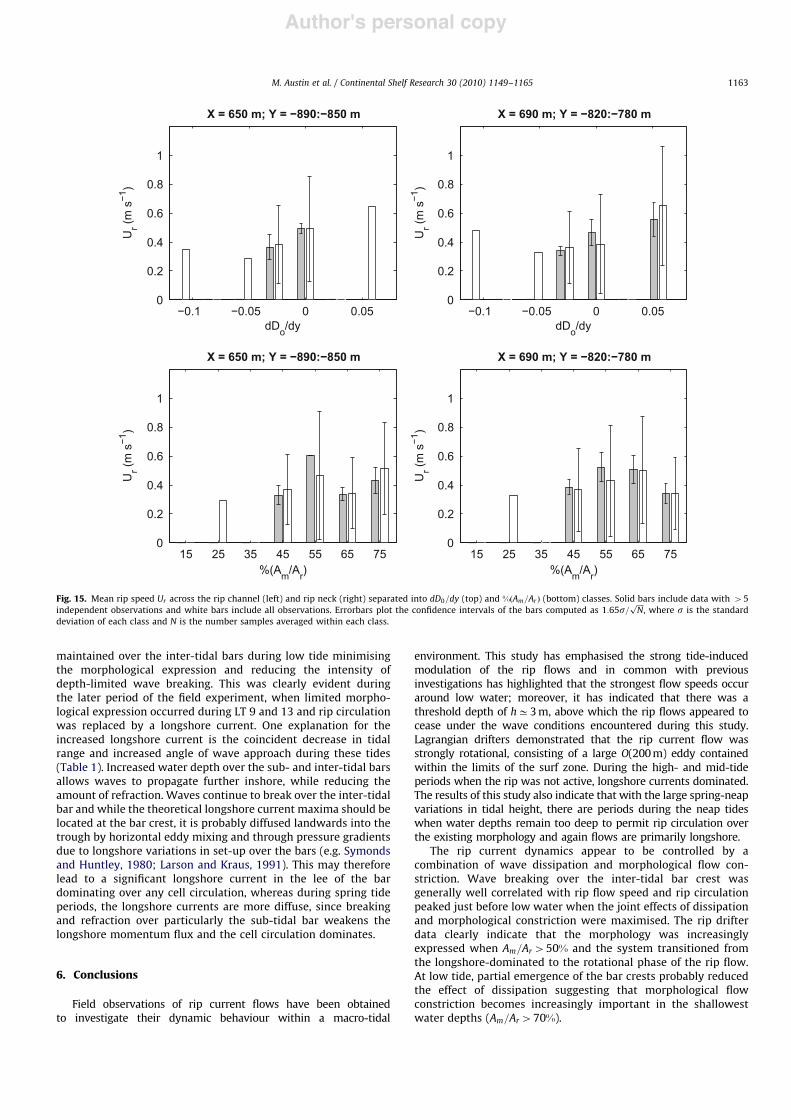
also useful to determine whether they can be used to quantify ripspeed Ur . Using the previous class divisions of dD0=dy and Am=Ar ,Ur was averaged across two longshore transects, one bisecting themain rip channel &X " 650m' and one the rip neck region&X " 690m' (Fig. 15). There is some trend in Ur based on thesignificant dD0=dy observations for both locations, while forAm=Ar , Ur is fairly consistent in the rip channel; however, acrossthe rip neck Ur peaks for Am=Ar " 50270% before droppingagain for Am=Ar470%. This is a similar observation to thecirculation in Fig. 14, where the largest eddies are located in theAm=Ar " 50270% classes and the eddy becomes highly compactedand constrained in the highest class with a statistically significantreduction in rip speed.
5. Discussion
Detailed field measurements of the nearshore flow velocityfield on a macro-tidal beach clearly demonstrate that rip currentcirculation is strongly modulated by the changing tidal elevation,which is the dominant temporal signal. In common with severalprevious studies (e.g. McKenzie, 1958; Sonu, 1972; Brander, 1999)the strongest rip flows are observed around low tide; outside ofthis low tide window, flows are predominantly alongshore. Thetidal modulation is observed for both Eulerian and Lagrangianflow data.
The in situ flow velocity time series clearly show that strongoffshore-directed flows (/uS"!0:5ms!1) are activated once thelocal water depth falls below # 3m for the observed waveconditions. The longshore currents are similarly intensified
03 04 050
2
4
6
8BAR
h (m
)
3 4 9
03 04 050
2
4
6
8FEEDER
3 4 7 9
03 04 050
2
4
6
8RIP
3 4 7 9
03 04 050
0.5
1
2
Hs (
m)
03 04 050
1
2
03 04 050
1
2
03 04 050
1
Hs/h
(!)
Date (Aug 2008)03 04 05
0
1
Date (Aug 2008)03 04 05
0
1
Date (Aug 2008)
0.5
1.5 1.5
0.5
0.5
1.5
0.5
0.5
5 6 7 8 5 6 8 5 6 8
Fig. 7. Summary of the pressure statistics measured by the in situ instruments at 10-min intervals. (From top) Water depth h; significant wave height Hs; and local relativewave height Hs=h. The dashed line in the lower panels indicates the onset of wave breaking at Hs=h40:4.
M. Austin et al. / Continental Shelf Research 30 (2010) 1149–11651156
Author's personal copyARTICLE IN PRESS
03 04 050
5
FEEDERh
(m) 3 5 7 9
03 04 050
5
RIP
3 5 7 9
03 04 050
1
Um
(m s!1
)
03 04 050
1
03 04 05
0
#u$ (
m s!1
)
03 04 05
0
03 04 05
0
#v$ (
m s!1
)
03 04 05
0
03 04 050
1
Ur (
m s!1
)
Date (Aug 2008)03 04 05
0
1
Date (Aug 2008)
0.5
0.5
!0.5
0.5
!0.5
0.5
!0.5
0.5
!0.5
0.5
4 6 8 4 6 8
Fig. 8. Summary of the flow statistics measured by the in situ instruments. (From top) Water depth h; cross-shore orbital velocity Um; mean cross-shore flow velocity /uS,positive onshore; mean longshore flow velocity /vS, positive north; and Ur mean return speed.
0 2 4 6
0
FEEDER
#u$ (
m s!1
)
0 2 4 6
RIP
0 2 4 6
0
#v$ (
m s!1
)
0 2 4 6
0 10
Ur /
gh
(-)
r = 0.77
0 1
r = 0.86
Hs,bar/hbar (!) Hs,bar/hbar (!)
h (m)h (m)
h (m) h (m)
0.2
!0.2
!0.4
0.5
!0.5
0.4
0.3
0.2
0.1
0
0
0
0.2
!0.2
!0.4
0.5
!0.5
0.4
0.3
0.2
0.1
0.2 0.4 0.6 0.8 0.2 0.4 0.6 0.8
%
Fig. 9. Scatter plots of (top) mean cross-shore current vs. water depth; (middle) mean longshore current vs. water depth; and (bottom) Froude number Ur=!!!!!!gh
pvs. relative
wave height Hs=h on the bar crest separated into flood (solid dots) and ebb (open circles) tide conditions. The solid line in the lower panels indicates the best linear fit.
M. Austin et al. / Continental Shelf Research 30 (2010) 1149–1165 1157
Author's personal copyARTICLE IN PRESS
around low water; however, these appear less directionally stable.This modulation is significantly more step-wise than previousobservations of tidal modulation (e.g. Brander and Short, 2001)and indicates that in addition to the flow velocity modulation therip is essentially being turned on and off by tidal-frequency waterlevel variations, since for example the depth over the region of therip is # 8m at MHWS. The Lagrangian drifters demonstrate thatthe rip flows are rotational in nature. Wave-driven onshore flowover the bar crest transitions to an alongshore feeder-type currentin the landwards trough, which flows into the base of the ripchannel. The flow turns seaward and travels seawards throughthe surf zone under an angle between the two shore-attachedbars. In common with other recent field observations (e.g.MacMahan et al., 2010a), this motion results in the formation ofa large eddy, retained within the limits of the surf zone.
During this study, Perranporth exhibited pronounced TBRmorphology combined with large tide ranges. The tide rangemodulated the expression of this morphology with two results:firstly, it caused a large variation in the spatial distribution ofwave breaking; and secondly, resulted in morphological flowconstriction.
The in situ data, supported by the wave roller dissipation,indicate that the rip begins to flow during the falling tide, frommid-tide downwards, corresponding to the initiation of depth-limited wave-breaking across the bar-crest. This is consistentwith the findings of Sonu (1972) and Haller et al. (2002) amongstothers, who provide strong evidence that wave breaking on theadjacent bars is required to drive rip circulation. It also highlightsthe transient nature of rip activity in a macro-tidal environmentwhen compared to the observations of Brander and Short (2001),who measured a continual variation in rip velocity over the tidalcycle in a micro-tidal climate, in which there was persistent wavebreaking throughout the tide. Hs,bar=hbar provides a reasonablygood scaling of the rip speed explaining around 80% of thevariance in the Eulerian measurements. However, for theLagrangian observations, the similar dD0=dy is not such a gooddiscriminator of rip circulation with occasional, albeit potentiallyinsignificant, rotational circulation being maintained during someperiods when the dissipation gradient is directed away from therip channel.
This discrepancy may be due to the emergence of the bar-crestaround low water. For Hs,bar=hbar , if the very shallow-water data(when the TWR was drying) could be included in the analysis,hysteresis would probably be observed whereby Hs,bar=hbar woulddecrease as both wave height and water depth tended towardzero at the shoreline, but Ur was maintained; the high correlationcoefficients for the in situ data are therefore probably misleading.The occurrence of shallow uni-directional flow over the bar crest
(Masselink et al., 2008) is one process that could maintain Ur
towards low water, but significant side-drainage of water fromthe bars into the rip channel was also observed around low waterand probably became an important process supplying water intothe rip channel (Brander, 1999). For the Lagrangian observationsutilising dD0=dy, it is not clear why strong rip circulation isrecorded during periods of limited wave dissipation into the floodtide phase of for example LT 5. During this period, the bar crestwas fully submerged, dD0=dy is reduced and yet the rip circulationcontinued into the flood tide period. This might be explainedthrough a vorticity approach, whereby circulation is maintainedby the torque that is generated by the radiation stress gradients(Bowen, 1969). Arthur (1962) indicates that vorticity is conservedalong streamlines, which moving offshore become closer togethercreating a stronger current. This suggests that eddy vorticity mayact to increase the relaxation timescale of the rip, maintainingrotation once the forcing is reduced.
A number of recent studies have linked vorticity to rotationalcirculation within the surf zone (e.g. MacMahan et al., 2001a, b)and Smith (2006) has demonstrated, through reformulating themomentum balance equations, that wave dissipation is importantin forcing these vortical motions. Using this new formulation,Bonneton et al. (2010) find numerically that alongshore gradientsin wave dissipation over transverse bar/rip morphology result inlarge-scale vorticity generation and surf zone rotations. Thereforealthough the high correlation between wave dissipation(parameterised as Hs=hbar) and rip speed observed during thisstudy is encouraging, in light of these new investigations, it isperhaps surprising that the correlation between dD0=dy androtational circulation is not higher.
Qualitative observations of the morphological control of the ripcirculation suggest that as the water level decreases the increas-ing expression of the intertidal bars strongly channelise the flow.The alongshore flows are directed seawards by the relativeemergence of the shore-connected shoal at the northern end ofthe rip system, flowing offshore towards the outer edge of the surfzone through the rip neck. It is at this point that the flow turnsalongshore to the south before returning landwards over theinter-tidal bar crest. The circulation becomes strongly constrainedas indicated by the drifter data for Am=Ar470% and examinationof the Argus video images indicates that the rip becomes anisolated hole-like region of no wave dissipation within the surfzone. It should be noted that there is no rip-head bar such as thatdescribed by Brander (1999) at the seaward end of the ripchannel, and it is suggested that this bar has already welded tothe seaward slope of the adjacent northern bar. This does,however, pose the question as to why there is a distinct band ofwave breaking across the seaward extent of the rip channel and it
0 10
2
4
6
8
10
12
Ur/
(Hs/T
p)
Ur/(Hs/Tp) = 10.2 exp [!2.6(h/hht)]
0.20.1 0.3 0.4h/hht
0.5 0.6 0.7 0.8 0.9
r = 0.88
Fig. 10. Relationship between non-dimensional rip velocity Ur=&Hs=Tp' and non-dimensional water depth h=hht . Solid line plots an exponential fit to the data as suggestedby Brander and Short (2001).
M. Austin et al. / Continental Shelf Research 30 (2010) 1149–11651158
Author's personal copyARTICLE IN PRESS
400 500 600 700 800!1000
!950
!900
!850
!800
!750
!700
!650
!600
!550LT3
Long
shor
e (m
)
Cross!shore (m)
1 m s!1
!1 !2 !3 !4
!5 !6 !7
400 500 600 700 800!1000
!950
!900
!850
!800
!750
!700
!650
!600
!550LT5
Long
shor
e (m
)
Cross!shore (m)
1 m s!1
400 500 600 700 800!1000
!950
!900
!850
!800
!750
!700
!650
!600
!550LT7
Long
shor
e (m
)
Cross!shore (m)
1 m s!1
400 500 600 700 800!1000
!950
!900
!850
!800
!750
!700
!650
!600
!550LT9
Long
shor
e (m
)
Cross!shore (m)
1 m s!1
400 500 600 700 800!1000
!950
!900
!850
!800
!750
!700
!650
!600
!550LT 13
Long
shor
e (m
)
1 m s!1
Cross!shore (m)
Fig. 11. Mean drifter velocity observations during each deployment. Vectors represent mean drifter direction and speed for all (red) and statistically significant (black)observations. Bathymetry is contoured at 0.5m intervals, labelled in the upper left panel and the rectified low tide Argus timex image indicates wave breaking intensity inthe background. (For interpretation of the references to colour in this figure legend, the reader is referred to the web version of this article.)
M. Austin et al. / Continental Shelf Research 30 (2010) 1149–1165 1159
Author's personal copyARTICLE IN PRESS
is suggested that this is due to wave–current interaction betweenthe seaward-directed rip flows and landward wave propagation(Haller and Ozkan Haller, 2002; Yu and Slinn, 2003; Reniers et al.,2007).
During this study morphological flow constriction was tidallymodulated at the semi-diurnal and spring-neap timescales. Theoverall morphological configuration of the nearshore bars andtroughs varies at the seasonal and storm-event timescales.
1 m s!1
0 & h < 0.6
Long
shor
e (m
)
Cross!shore (m)500 600 700 800
!1000
!950
!900
!850
!800
!750
!700
!650
1 m s!1
0.6 & h < 1.2
Long
shor
e (m
)
Cross!shore (m)500 600 700 800
!1000
!950
!900
!850
!800
!750
!700
!650
1 m s!1
1.2 & h < 1.8
Long
shor
e (m
)
Cross!shore (m)500 600 700 800
!1000
!950
!900
!850
!800
!750
!700
!650
1 m s!1
1.8 & h < 2.4
Long
shor
e (m
)
Cross!shore (m)500 600 700 800
!1000
!950
!900
!850
!800
!750
!700
!650
1 m s!1
2.4 & h < 3
Long
shor
e (m
)
Cross!shore (m)500 600 700 800
!1000
!950
!900
!850
!800
!750
!700
!650
1 m s!1
3 & h < 3.6
Long
shor
e (m
)
Cross!shore (m)500 600 700 800
!1000
!950
!900
!850
!800
!750
!700
!650
1 m s!1
h > 3.6
Long
shor
e (m
)
Cross!shore (m)
!2 !3 !4
!5 !6
!7
500 600 700 800!1000
!950
!900
!850
!800
!750
!700
!650
Fig. 12. Mean Lagrangian rip circulation separated into hbar classes. Vectors represent rip speed within each spatial bin classified as statistically significant (45independent observations, black) and all observations (red). Bathymetry is contoured in the background at 0.5m intervals and labelled in the lower right panel. Rip speed isindicated by the scale arrow. (For interpretation of the references to colour in this figure legend, the reader is referred to the web version of this article.)
M. Austin et al. / Continental Shelf Research 30 (2010) 1149–11651160
Author's personal copyARTICLE IN PRESS
Brander (1999) describes this variation in terms of morphologicaltransitions during the accretionary phase of the Wright and Short(1984) beach-state model, during which there is a steady decreasein the cross-sectional area of the rip channel, infilling of thelongshore feeder channels and an increase in rip flows. It is clear
that during this experiment the reduction in tidal elevationaround low water acts conceptually in the same manner as thewide-spread accretion during beach state changes at semi-diurnalfrequencies. Fig. 16 illustrates the changing morphological reliefduring the falling tide of LT 5 through the ARGUS-derived roller
1 m s!1
!0.11 & dDo/ dy < !0.0825Lo
ngsh
ore
(m)
Cross!shore (m)500 600 700 800
!1000
!950
!900
!850
!800
!750
!700
!650
1 m s!1
!0.0825 & dDo/ dy < !0.055
Long
shor
e (m
)
Cross!shore (m)500 600 700 800
!1000
!950
!900
!850
!800
!750
!700
!650
1 m s!1
!0.055 & dDo/ dy < !0.0275
Long
shor
e (m
)
Cross!shore (m)500 600 700 800
!1000
!950
!900
!850
!800
!750
!700
!650
1 m s!1
!0.0275 & dDo/ dy < 0
Long
shor
e (m
)
Cross!shore (m)500 600 700 800
!1000
!950
!900
!850
!800
!750
!700
!650
1 m s!1
0 & dDo/ dy < 0.0275
Long
shor
e (m
)
Cross!shore (m)500 600 700 800
!1000
!950
!900
!850
!800
!750
!700
!650
1 m s!1
0.0275 & dDo/ dy < 0.055
Long
shor
e (m
)
Cross!shore (m)500 600 700 800
!1000
!950
!900
!850
!800
!750
!700
!650
1 m s!1
dDo/ dy > 0.055
Long
shor
e (m
)
Cross!shore (m)
!2 !3
!4 !5
!6
!7
500 600 700 800!1000
!950
!900
!850
!800
!750
!700
!650
Fig. 13. Mean Lagrangian rip circulation separated into dD0=dy classes. Vectors represent rip speed within each spatial bin classified as statistically significant (45independent observations, black) and all observations (red). Bathymetry is contoured in the background at 0.5m intervals and labelled in the lower left panel. Rip speed isindicated by the scale arrow. (For interpretation of the references to colour in this figure legend, the reader is referred to the web version of this article.)
M. Austin et al. / Continental Shelf Research 30 (2010) 1149–1165 1161
Author's personal copyARTICLE IN PRESS
dissipation maps. The ‘effective’ beach state progresses throughthe rhythmic bar-beach (RBB), RBB–TBR and TBR–low-tide terrace(LTT) states indicating that the falling water level acts tomaximise bar relief, flow channelisation and rip speeds at thesemi-diurnal timescale.
Further modulation of the rip occurs at the spring-neaptimescale due to the reduction in tidal range from 46m duringsprings to o3m during neaps. The effect of this is twofold in thatit influences both the dissipation and morphological controlmechanisms. During the neap tide phase, greater water depths are
1 m s!1
10 & Am/Ar < 20Lo
ngsh
ore
(m)
Cross!shore (m)
!0.10.1
0.3 0.5 0.7
0.1
!0.3
!0.7
0.3
0.5
0.5
0.7
500 600 700 800!1000
!950
!900
!850
!800
!750
!700
!650
1 m s!1
20 & Am/Ar < 30
Long
shor
e (m
)
Cross!shore (m)500 600 700 800
!1000
!950
!900
!850
!800
!750
!700
!650
1 m s!1
30 & Am/Ar < 40
Long
shor
e (m
)
Cross!shore (m)500 600 700 800
!1000
!950
!900
!850
!800
!750
!700
!650
1 m s!1
40 & Am/Ar < 50
Long
shor
e (m
)
Cross!shore (m)500 600 700 800
!1000
!950
!900
!850
!800
!750
!700
!650
1 m s!1
50 & Am/Ar < 60
Long
shor
e (m
)
Cross!shore (m)500 600 700 800
!1000
!950
!900
!850
!800
!750
!700
!650
1 m s!1
60 & Am/Ar < 70
Long
shor
e (m
)
Cross!shore (m)500 600 700 800
!1000
!950
!900
!850
!800
!750
!700
!650
1 m s!1
Am/Ar > 70
Long
shor
e (m
)
Cross!shore (m)500 600 700 800
!1000
!950
!900
!850
!800
!750
!700
!650
Fig. 14. Mean Lagrangian rip circulation separated into %&Am=Ar' classes. Vectors represent rip speed within each spatial bin classified as statistically significant (45independent observations, black) and all observations (red). Residual bathymetry is contoured in the background at 0.2m intervals and labelled in the upper left panel. Ripspeed is indicated by the scale arrow. (For interpretation of the references to colour in this figure legend, the reader is referred to the web version of this article.)
M. Austin et al. / Continental Shelf Research 30 (2010) 1149–11651162
Author's personal copyARTICLE IN PRESS
maintained over the inter-tidal bars during low tide minimisingthe morphological expression and reducing the intensity ofdepth-limited wave breaking. This was clearly evident duringthe later period of the field experiment, when limited morpho-logical expression occurred during LT 9 and 13 and rip circulationwas replaced by a longshore current. One explanation for theincreased longshore current is the coincident decrease in tidalrange and increased angle of wave approach during these tides(Table 1). Increased water depth over the sub- and inter-tidal barsallows waves to propagate further inshore, while reducing theamount of refraction. Waves continue to break over the inter-tidalbar and while the theoretical longshore current maxima should belocated at the bar crest, it is probably diffused landwards into thetrough by horizontal eddy mixing and through pressure gradientsdue to longshore variations in set-up over the bars (e.g. Symondsand Huntley, 1980; Larson and Kraus, 1991). This may thereforelead to a significant longshore current in the lee of the bardominating over any cell circulation, whereas during spring tideperiods, the longshore currents are more diffuse, since breakingand refraction over particularly the sub-tidal bar weakens thelongshore momentum flux and the cell circulation dominates.
6. Conclusions
Field observations of rip current flows have been obtainedto investigate their dynamic behaviour within a macro-tidal
environment. This study has emphasised the strong tide-inducedmodulation of the rip flows and in common with previousinvestigations has highlighted that the strongest flow speeds occuraround low water; moreover, it has indicated that there was athreshold depth of hC3m, above which the rip flows appeared tocease under the wave conditions encountered during this study.Lagrangian drifters demonstrated that the rip current flow wasstrongly rotational, consisting of a large O(200m) eddy containedwithin the limits of the surf zone. During the high- and mid-tideperiods when the rip was not active, longshore currents dominated.The results of this study also indicate that with the large spring-neapvariations in tidal height, there are periods during the neap tideswhen water depths remain too deep to permit rip circulation overthe existing morphology and again flows are primarily longshore.
The rip current dynamics appear to be controlled by acombination of wave dissipation and morphological flow con-striction. Wave breaking over the inter-tidal bar crest wasgenerally well correlated with rip flow speed and rip circulationpeaked just before low water when the joint effects of dissipationand morphological constriction were maximised. The rip drifterdata clearly indicate that the morphology was increasinglyexpressed when Am=Ar450% and the system transitioned fromthe longshore-dominated to the rotational phase of the rip flow.At low tide, partial emergence of the bar crests probably reducedthe effect of dissipation suggesting that morphological flowconstriction becomes increasingly important in the shallowestwater depths (Am=Ar470%).
!0.1 !0.05 0 0.050
0.2
0.4
0.6
0.8
1
dDo/dy
Ur (m
s!1
)X = 650 m; Y = !890:!850 m
!0.1 !0.05 0 0.050
0.2
0.4
0.6
0.8
1
dDo/dy
Ur (m
s!1
)
X = 690 m; Y = !820:!780 m
15 25 35 45 55 65 750
0.2
0.4
0.6
0.8
1
%(Am/Ar)
Ur (m
s!1
)
X = 650 m; Y = !890:!850 m
15 25 35 45 55 65 750
0.2
0.4
0.6
0.8
1
%(Am/Ar)
Ur (m
s!1
)
X = 690 m; Y = !820:!780 m
Fig. 15. Mean rip speed Ur across the rip channel (left) and rip neck (right) separated into dD0=dy (top) and %&Am=Ar' (bottom) classes. Solid bars include data with 45independent observations and white bars include all observations. Errorbars plot the confidence intervals of the bars computed as 1:65s=
!!!!N
p, where s is the standard
deviation of each class and N is the number samples averaged within each class.
M. Austin et al. / Continental Shelf Research 30 (2010) 1149–1165 1163

Author's personal copyARTICLE IN PRESS
Although this study has attempted to determine whethermacro-tidal rip circulation can be attributed to either wavedissipation or morphological control, it seems that both processesultimately combine to force the rip current. Variations in thepattern of wave dissipation and hence set-up gradients appear totrigger the rip circulation, but there are periods, particularly whenwater depths are very shallow and dissipation is limited to swashaction over the bar crest, when morphological control appears toassume dominance. Flows became strongly canalised during thistime with the circulation, which is maintained by side-drainageoff the bars, constrained within the rip channel and rip neckregions.
Acknowledgements
We would like to thank our excellent field team Saul Reynolds,Iain Fairly, Tim Poate, Matt Hilton, Will Hibberd and James Moonfor their efforts throughout the experiment. We are also indebtedto the RNLI for their logistical support. Austin was supported byfunds made available through the Wave Hub Impacts on Seabedand Shoreline Processes (WHISSP) project, funded by thePeninsular Research Institute for Marine Renewable Energy(PRIMaRE). Scott was supported by a HEIF2/RNLI award to theUniversity of Plymouth. MacMahan was supported by ONRcontract #N0001409WR20221, N0001409WR20222, and the NSFOCE 0728324. Brown (JW) was supported by the DE Sea Grant, Uof Delaware and the NSF OCE 0728324. Brown (JA) was supportedDE Sea Grant, U of Delaware and the NSF OCE 0728324.
References
Aagaard, T., Greenwood, B., Nielsen, J., 1997. Mean currents and sedimenttransport in a rip channel. Marine Geology 140 (1–2), 25–45.
Aarninkhof, S.G.J., Ruessink, B.G., Roelvink, J.A., Reniers, A.J.H.M., 2005. 2DH-quantification of surf zone bathymetry from video. In: Proceedings CoastalDynamics ’05, pp. 1–14.
Arthur, R.S., 1962. A note on the dynamics of rip currents. Journal of GeophysicalResearch 67 (7), 2777–2779.
Bonneton, P., Bruneau, N., Castelle, B., 2010. Large-scale vorticity generation due todissipating waves in the surf zone. Discrete and Continuous DynamicalSystems—Series B 13 (4), 729–738.
Bowen, A.J., 1969. Rip currents. 1. Theoretical investigations. Journal ofGeophysical Research 74, 5467–5478.
Bowman, D., Rosen, D.S., Kit, E., Arad, D., Slavicz, A., 1988. Flow characteristics atthe rip current neck under low energy conditions. Marine Geology 79 (1–2),41–54.
Brander, R., 1999. Field observations on the morphodynamic evolution of a low-energy rip current system. Marine Geology 157 (3–4), 199–217.
Brander, R.W., Short, A.D., 2000. Morphodynamics of a large-scale rip currentsystem at Muriwai Beach, New Zealand. Marine Geology 165 (1–4), 27–39.
Brander, R.W., Short, A.D., 2001. Flow kinematics of low-energy rip currentsystems. Journal of Coastal Research 17 (2), 468–481.
Bruneau, N., Castelle, B., Bonneton, P., Pedreros, R., Almar, R., Bonneton, N., Bretel,P., Parisot, J.-P., Senechal, N., 2009. Field observations of an evolving rip currenton a meso-macrotidal well-developed inner bar and rip morphology.Continental Shelf Research 29, 1650–1662.
Haller, M., Dalrymple, R., Svendesen, I., 2002. Experimental study of nearshoredynamics on a barred beach with rip channels. Journal of GeophysicalResearch 107 (14), 1–21.
Haller, M.C., Ozkan Haller, H.T., 2002. Wave breaking and rip current circulation.In: Proceedings 28th International Conference on Coastal Engineering. ACSE,Cardiff, UK, pp. 705–717.
Huntley, D.A., Hendry, M.D., Haines, J., Greenidge, B., 1988. Waves and rip currentson a Caribbean pocket beach. Journal of Coastal Research 4 (1), 69–79.
Larson, M., Kraus, N.C., 1991. Numerical model of longshore current for bar andtrough beaches. Journal of Waterway, Port, Coastal and Ocean Engineering117, 326–347.
MacMahan, J.H., Thornton, E.B., Reniers, A.J.H.M., 2006. Rip current review. CoastalEngineering 53 (2–3), 191–208.
MacMahan, J.H., Brown, J.W., Brown, J.A., Morrison, J., Thornton, E.B., Reniers,A.J.H.M., Henriquez, M., Gallagher, E.L., Morrison, J., Austin, M.J., Scott, T.M.,Senechal, N., 2010a. Mean Lagrangian flow behavior on an open coast rip-channeled beach. Marine Geology 268 (1-4), 1–15.
MacMahan, J.H., Reniers, A.J.H.M., Thornton, E.B., 2010b. Vortical surfzone velocityfluctuations with O(10) minute period. Journal of Geophysical Research, in press,doi:10.1029/2009JC005383.
MacMahan, J.H., Brown, J.W., Thornton, E.B., 2009. Low-cost hand-held globalpositioning system for measuring surfzone currents. Journal of CoastalResearch 25 (3), 744–754.
MacMahan, J.H., Thornton, E.B., Stanton, T.P., Reniers, A.J.H.M., 2005. RIPEX:observations of a rip current system. Marine Geology 218 (1–4), 113–134.
Masselink, G., Austin, M.J., Tinker, J., O’Hare, T., Russell, P.E., 2008. Cross-shoresediment transport and morphological response on a macro-tidal beachwith intertidal bar morphology, Truc Vert, France. Marine Geology 251,141–155.
Masselink, G., Short, A.D., 1993. The effect of tide range on beach morphodynamicsand morphology. Journal of Coastal Research 9, 785–800.
McKenzie, P., 1958. Rip-current systems. Journal of Geology 66 (2), 103–113.
Cross!shore (m)
Long
shor
e (m
)
RBB ! 10:30
400 600 800
!1000
!800
!600
!400
!200
Cross!shore (m)
RBB!TBR ! 11:00
400 600 800
!1000
!800
!600
!400
!200
Cross!shore (m)
TBR!LTT ! 13:00
400 600 800
!1000
!800
!600
!400
!200
Do (N m!1 s!1)3 6 9 12 15 18 21
Fig. 16. Roller dissipation maps for LT 5 showing the progressive change in effective morphological beach state from RBB through to TBR–LTT during the falling tide.
M. Austin et al. / Continental Shelf Research 30 (2010) 1149–11651164

Author's personal copyARTICLE IN PRESS
Reniers, A.J.H.M., MacMahan, J.H., Thornton, E.B., Stanton, T.P., 2007. Modelingvery low frequency motions during ripex. Journal of Geophysical Research112(C07013), doi:10.1029/2005JC003122.
Ruessink, B.G., Houwman, K.T., Hoekstra, P., 1998. The systematic contribution oftransporting mechanisms to the cross-shore sediment transport in waterdepths of 3–9m. Marine Geology 152, 295–324.
Schmit, W.B., Woodward, K., Millikan, R., Guza, R.T., Raubenheimer, B., Elgar, S.,2003. A GPS-tracked surf zone drifter. Journal of Atmospheric and OceanTechnology 20, 1069–1075.
Scott, T.M., Russell, P.E., Masselink, G., Wooler, A., 2008. High volume sedimenttransport and its implications for recreational beach risk. In: Proceedings 31stInternational Conference on Coastal Engineering. ASCE, Hamburg, Germany,pp. 4250–4262.
Scott, T.M., Russell, P.E., Masselink, G., Wooler, A., 2009. Rip current variability andhazard along a macro-tidal coast. Journal of Coastal Research SI 56, 895–899.
Scott, T.M., Russell, P.E., Masselink, G., Wooler, A., Short, A.D., 2007. Beach rescuestatistics and their relation to nearshore morphology and hazards: a case studyfor southwest England. Journal of Coastal Research SI 50, 1–6.
Shepard, F.P., Emery, K.O., LaFond, E.C., 1941. Rip currents: a process of geologicalimportance. Journal of Geology XLIX, 337–369.
Short, A.D., 1985. Rip-current type, spacing and persistence, Narrabeen Beach,Australia. Marine Geology 65(1–2), 47–71.
Short, A.D., Brander, R.W., 1999. Regional variations in rip density. Journal ofCoastal Research 15 (3), 813–822.
Smith, J.A., 2006. Wave-current interactions in finite depth. Journal of PhysicalOceanography 36, 1403–1419.
Sonu, C.J., 1972. Field observation on nearshore circulation and meanderingcurrents. Journal of Geophysical Research 77, 3232–3247.
Spydell, M., Feddersen, F., Guza, R.T., Schmit, W.E., 2007. Observing surf-zonedispersion with drifters. Journal of Physical Oceanography 37 (12), 2920–2939.
Symonds, G., Huntley, D.A., 1980. Waves and currents over nearshore bar systems.In: Proceedings of the Canadian Coastal Conference. National Research Council,Canada, pp. 64–78.
van Dongeren, A., Plant, N., Cohen, A., Roelvink, J.A., Haller, M., Catalan, P., 2008.Beach wizard: nearshore bathymetry estimation through assimilation of modelcomputations and remote observation. Coastal Engineering 55, 1016–1027.
Wright, L.D., Short, A.D., 1984. Morphodynamic variability of surf zones andbeaches: a synthesis. Marine Geology 56, 93–118.
Yu, J., Slinn, D.N., 2003. Effects of wave-current interaction on rip currents. Journalof Geophysical Research 108, 3088 , doi:10.1029/2001JC001105.
M. Austin et al. / Continental Shelf Research 30 (2010) 1149–1165 1165
Related Documents