Accepted Manuscript Temporal dynamics in a shallow coastal benthic food web: insights from fatty acid biomarkers and their stable isotopes Ulrike Braeckman, Pieter Provoost, Koen Sabbe, Karline Soetaert, Jack J. Middelburg, Magda Vincx, Jan Vanaverbeke PII: S0141-1136(15)00065-3 DOI: 10.1016/j.marenvres.2015.04.010 Reference: MERE 3995 To appear in: Marine Environmental Research Received Date: 15 December 2014 Revised Date: 23 April 2015 Accepted Date: 26 April 2015 Please cite this article as: Braeckman, U., Provoost, P., Sabbe, K., Soetaert, K., Middelburg, J.J., Vincx, M., Vanaverbeke, J., Temporal dynamics in a shallow coastal benthic food web: insights from fatty acid biomarkers and their stable isotopes, Marine Environmental Research (2015), doi: 10.1016/ j.marenvres.2015.04.010. This is a PDF file of an unedited manuscript that has been accepted for publication. As a service to our customers we are providing this early version of the manuscript. The manuscript will undergo copyediting, typesetting, and review of the resulting proof before it is published in its final form. Please note that during the production process errors may be discovered which could affect the content, and all legal disclaimers that apply to the journal pertain.

Welcome message from author
This document is posted to help you gain knowledge. Please leave a comment to let me know what you think about it! Share it to your friends and learn new things together.
Transcript
Accepted Manuscript
Temporal dynamics in a shallow coastal benthic food web: insights from fatty acidbiomarkers and their stable isotopes
Ulrike Braeckman, Pieter Provoost, Koen Sabbe, Karline Soetaert, Jack J.Middelburg, Magda Vincx, Jan Vanaverbeke
PII: S0141-1136(15)00065-3
DOI: 10.1016/j.marenvres.2015.04.010
Reference: MERE 3995
To appear in: Marine Environmental Research
Received Date: 15 December 2014
Revised Date: 23 April 2015
Accepted Date: 26 April 2015
Please cite this article as: Braeckman, U., Provoost, P., Sabbe, K., Soetaert, K., Middelburg, J.J.,Vincx, M., Vanaverbeke, J., Temporal dynamics in a shallow coastal benthic food web: insights fromfatty acid biomarkers and their stable isotopes, Marine Environmental Research (2015), doi: 10.1016/j.marenvres.2015.04.010.
This is a PDF file of an unedited manuscript that has been accepted for publication. As a service toour customers we are providing this early version of the manuscript. The manuscript will undergocopyediting, typesetting, and review of the resulting proof before it is published in its final form. Pleasenote that during the production process errors may be discovered which could affect the content, and alllegal disclaimers that apply to the journal pertain.

MANUSCRIP
T
ACCEPTED
ACCEPTED MANUSCRIPT
1
Temporal dynamics in a shallow coastal benthic food web: insights from fatty 1
acid biomarkers and their stable isotopes 2
Ulrike Braeckman1*, Pieter Provoost2, Koen Sabbe3, Karline Soetaert2, Jack J. Middelburg4 , Magda 3
Vincx1 and Jan Vanaverbeke1 4
1Ghent University, Department of Biology, Marine Biology Research Group, Krijgslaan 281/S8, 9000 5
Ghent, Belgium (tel) +32 9 264 85 33; (fax) +32 9 264 85 98 6
2Royal NIOZ Yerseke, Centre for Estuarine and Marine Ecology, PO Box 140 4400 AC Yerseke, The 7
Netherlands 8
3Ghent University, Department of Biology, Protistology and Aquatic Ecology, Krijgslaan 281/S8, 9000 9
Ghent, Belgium 10
4Utrecht University, Department of Earth Sciences, P.O. Box 80021, 3508 TA Utrecht, The 11
Netherlands 12
ABSTRACT 13
We investigated the temporal variation of pelagic and benthic food sources in the diet of benthic 14
taxa at a depositional site in the Southern Bight of the North Sea by means of fatty acid (FA) 15
biomarkers and compound-specific stable isotope analysis (CSIA). The taxa were the non-selective 16
deposit feeding nematodes (Sabatieria spp. and ‘other nematodes’), and three dominant 17
macrobenthic species: two true suspension-deposit feeders (the bivalve Abra alba and the tube 18
dwelling polychaete Owenia fusiformis) and the suspected predatory mud-dwelling anemone 19
Sagartia sp.. These species make up on average 16% (Abra alba), 17% (Sagartia sp.) and 20% 20
(Owenia fusiformis) of the biomass in the Abra alba–Kurtiella bidentata community in this area. 21
Phytoplankton dynamics in the suspended particulate matter of the water column as inferred from 22
cell counts, chlorophyll-a and organic carbon content were clearly visible in animal FA composition 23
as well, whereas phytodetritus dynamics in the sediment FA composition were less clear, probably 24
due to patchy distribution or stripping of FA by macrofauna. Nematodes appeared to assimilate 25
mainly Polyunsaturated Fatty Acids (PUFAs) from their sedimentary environment and were further 26
non-selectively accumulating more (Sabatieria spp.) or less (‘other nematodes’) FA from the 27
deposited phytodetritus. In contrast, Abra alba FA composition was consistent with a diatom-28
dominated diet and consumption of Phaeocystis was observed in Owenia fusiformis, whereas 29
Sagartia sp. showed evidence of a predatory behaviour. While the total FA content in Owenia 30
fusiformis remained constant throughout the year, Sagartia sp. doubled and Abra alba increased its 31
FA level more than 10-fold in response to the organic matter deposition from the phytoplankton 32
bloom. This leads to the conclusion that there is no resource partitioning between non-selective 33
deposit feeding nematodes and the suspension-deposit feeding macrobenthic organisms, suggesting 34
they belong to separate parts of the benthic food web. 35
MANUSCRIP
T
ACCEPTED
ACCEPTED MANUSCRIPT
2
Key-words: nematodes - macrobenthos – phytoplankton bloom – fatty acid composition – resource 36
partitioning – competition 37
*corresponding author: [email protected] 38
1. INTRODUCTION 39
Owing to intensive primary production and shallow water depth, a close coupling generally exists 40
between the pelagic and benthic compartments in coastal ecosystems (e.g. Marcus and Boero, 41
1998). Benthic organisms living in the aphotic subtidal zone are strongly dependent on the organic 42
matter that is produced in the surface waters during the annual spring phytoplankton bloom (Graf, 43
1992). Although the bulk of phytoplankton production is mineralized in the water column by micro-44
zooplankton and bacteria (Rousseau et al., 2000), about a quarter is deposited on the sediment of 45
the Belgian part of the North Sea (BPNS), 65% of it being Phaeocystis colonies (Lancelot et al., 2005). 46
By cutting up and breaking apart the algal material during ingestion and defaecation, sediment-47
dwelling organisms facilitate microbial decomposition of the organic matter (Boon and Duineveld, 48
2012; Rhoads, 1974; van Nugteren et al., 2009) to the essential nutrients that are then released back 49
to the water column to fuel the next phytoplankton bloom. During this process, benthic organisms 50
transform the pelagically produced organic matter and facilitate assimilation by other benthos that 51
is not in direct contact with the water column (Braeckman et al., 2011; Levin et al., 1997; van 52
Nugteren et al., 2009), or might impose interference (i.e. direct, with interactions among organisms) 53
or exploitative competition (i.e. indirect, by limiting resources for the other organisms) on the 54
smaller competitors (Braeckman et al., 2011; Nascimento et al., 2011; Van Colen et al., 2009). 55
56
Many functional groups of benthic organisms are involved in this processing of organic matter. 57
Suspension-deposit feeders and filter feeders like bivalves, sessile polychaetes and sea anemones 58
are thought to directly rely on the pelagically produced organic matter which they catch from the 59
water, but might also show trophic plasticity according to the seasonal variation in available food 60
sources (Okamura 1990; Levinton 1991; Dubois et al 2007; Kuerten et al 2013). Other organisms take 61
up food after it has been deposited on and/or incorporated into the sediment. In coastal food webs, 62
nematodes are believed to play a crucial role in processing sedimentary organic matter, through 63
stimulation of bacterial breakdown of fresh organic matter (Nascimento et al., 2012), their 64
intermediate trophic position (between bacteria/detritus/microalgae and macrofauna/megafauna) 65
and high metabolic and reproductive rates, in conjunction with their ubiquity and high standing 66
stock (Giere, 2009). 67

MANUSCRIP
T
ACCEPTED
ACCEPTED MANUSCRIPT
3
However, nematode diet and food processing pathways are under debate. Nematode diet appears 68
to be very difficult to unravel: originally, the morphology of the buccal cavity was used to distinguish 69
different feeding types (Wieser, 1953). However, in situ observations (Guilini et al., 2013, 2010; 70
Moens and Vincx, 1997; Pape et al., 2013) tend to contradict this classification. In addition, pulse-71
chase experiments with labelled material (DOC, bacteria, algae) show very little uptake of fresh 72
organic matter by nematodes. Only between 0-5% of their daily carbon needs appear to be fulfilled 73
by such labile food sources (Braeckman et al., 2011; Franco et al., 2008a; Gontikaki et al., 2011; 74
Guilini et al., 2010), with a single exception of up to 120% by bacterivorous deep sea seamount 75
nematodes (Pape et al., 2013). Although the daily carbon requirements of nematodes might be 76
overestimated (Braeckman et al., 2013), the enigma of the extremely limited uptake of algal or 77
bacterial material in these pulse-chase studies remains. In contrast, some coastal field studies tend 78
to suggest a direct dependence on primary produced material, as upon arrival of the phytoplankton 79
bloom in spring, nematode abundances drastically increase in number (Franco et al., 2008b; 80
Vanaverbeke et al., 2004), indicating their affinity for the fresh algal material. Other shallow-water 81
studies, e.g., Braeckman et al. (2011) showed a lack of competition between suspension-deposit 82
feeding macrofauna and a nematode community mainly composed of non-selective deposit feeders, 83
suggesting that the first ones feed on fresh organic matter, while the latter feed on detritus. 84
Nematode dependence on (semi-labile) detritus has also been suggested for deep-sea nematodes 85
(Gontikaki et al., 2011; Guilini et al., 2013; van Oevelen et al., 2012; Veit-Köhler et al., 2013). 86
87
To unravel the links between the pelagic and benthic realm, and as such diet sources of sediment-88
dwelling organisms, biomarkers can be helpful as tracers. Lipid biomarkers are frequently used in 89
trophic ecology (see reviews of Sargent and Whittle 1981; Dalsgaard et al. 2003; Budge et al. 2006; 90
Parrish 2013). Polar lipids ([PL], phospholipid-derived fatty acids [PLFA] and glycolipids) are 91
important constituents of cell membranes (Dalsgaard et al., 2003). Some PLFA are specific for 92
bacteria and phytoplankton (e.g. Viso and Marty 1993; Dunstan et al. 1993) and are turned over 93
within days after cell death, which makes them good biomarkers for living biomass (Boschker and 94
Middelburg, 2002). Since it is energetically more efficient to incorporate FA and to catabolize dietary 95
carbohydrates, and because some essential PUFAs like eicosapentaenoic acid (EPA; 20:5ω3) and 96
docosahexaenoic acid (DHA; 22:6ω3) cannot be synthetized de novo by most animals, FA from the 97
diet are partly routed intact or with minor modification into consumer tissues (Ruess et al., 2005). 98
Therefore, the neutral lipid derived FA [NLFA] found in the reserve lipids of the primary consumers 99
are to a great extent left unmodified during trophic transfer (Caramujo et al., 2008), which makes 100
them useful in identifying food sources and feeding modes on the short-term. However, the PLFA 101

MANUSCRIP
T
ACCEPTED
ACCEPTED MANUSCRIPT
4
fraction (cell membranes) of consumers is genetically predetermined (Kuerten et al., 2013a) and 102
more under metabolic control and only provide long-term dietary information (Koussoroplis et al., 103
2010). Since no single FA can be assigned uniquely to any one species and not even to any single 104
group of phytoplankton or bacteria (Dalsgaard et al., 2003), a combination of FA biomarkers and the 105
stable isotope signature of these FA might help in the diet characterization. This compound-specific 106
isotope analysis (CSIA) of FA can provide important insights into the biogeochemical conditions 107
under which carbon fixation occurred (Bieger et al., 1997), and can be used to distinguish possible 108
sources of organic matter in the diet of organisms (Budge et al., 2008; de Kluijver et al., 2012; 109
Middelburg, 2014; Ramos et al., 2003; Van den Meersche et al., 2009; Van Gaever et al., 2009). As 110
such, carbon from a FA of a certain food source is incorporated into the tissue of consumers such 111
that the carbon isotopic ratio (13C:12C) generally reflects that of the diet. However, the isotopic 112
composition of individual FA in a consumer can differ from the FA in its diet according to the isotopic 113
fractionation accompanying metabolism and biosynthesis in the animals (Murphy and Abrajano, 114
1994; Ruess et al., 2005; Treignier et al., 2009). This combined approach of lipid analysis with CSIA 115
has been used to distinguish species diet sources but there are only few studies investigating 116
temporal dynamics (Braeckman et al., 2012; Budge et al., 2008; Gladyshev et al., 2012; Kuerten et 117
al., 2013a, 2013b). 118
119
In this study, we investigated the temporal variation in the importance of benthic and pelagic food 120
sources for selected nematode taxa and three dominant macrobenthic species in the Abra alba-121
Kurtiella bidentata community (Van Hoey et al., 2004) at a depositional, fine-sandy site in the 122
Southern Bight of the North Sea by means of FA biomarkers and their stable carbon isotopes (CSIA). 123
The area is characterized by strong tidal currents (1-2 m s-1) and is located in a high turbidity field 124
(Fettweis and Van den Eynde, 2003). These conditions give rise to high organic matter input (van 125
Oevelen et al., 2009) fueling the Abra alba-Kurtiella bidentata community, considered the most 126
diverse and productive macrobenthic community in the Belgian part of the North Sea (Van Hoey et 127
al., 2004). The tube-dwelling polychaete Owenia fusiformis (Hartmann-Schröder, 1996) and bivalve 128
Abra alba (Dame, 2011) are suspension-deposit feeders feeding on sediment detritus and micro-129
organisms suspended in the water column. Sagartia spp. are known as suspension-deposit feeding 130
anemones with an omnivore (Schaal et al., 2008) to a likely predatory behavior (van Oevelen et al., 131
2009). These species make up on average 16% (Abra alba), 17% (Sagartia sp.) and 20% (Owenia 132
fusiformis) of the biomass in the Abra alba–Kurtiella bidentata community in this area (data from 133
(Braeckman et al., 2014). The nematode genus Sabatieria are non-selective deposit feeders (Wieser, 134
1953), that show opportunistic feeding responses to phytoplankton sedimentation (Franco et al., 135

MANUSCRIP
T
ACCEPTED
ACCEPTED MANUSCRIPT
5
2008a). The ‘other nematode’ group in this study mainly comprised smaller nematodes: 136
bacterivores, detritus feeders and non-selective deposit feeders (Steyaert, 2003; Vanaverbeke et al., 137
2011), but few predators. Our field study on the temporal variation in the diet of several members of 138
the benthic food-web investigates their role in linking the pelagic and the benthic realm. We tested 139
whether (1) the temporal succession in phytoplankton composition could be traced with biomarkers 140
and their compound-specific stable isotopes, (2) the diet composition of the benthic organisms could 141
be determined, (3) the temporal variation in the relative abundance of pelagic and benthic food 142
sources in the diet of these species could be assessed, and whether (4) there is resource partitioning 143
between nematodes and the selected macrobenthic species. 144
2. MATERIAL AND METHODS 145
2.1. Study site and sampling 146
From February to September 2010, the suspended matter in the water column (SPM) and sediment 147
from a fine sandy coastal station in the Belgian part of the North Sea (51°9.50’N, 2°37.82’E, 15.5 m 148
depth, 3 km offshore) were sampled 6 times (Table 1) with respectively a Niskin bottle and a Reineck 149
Boxcorer from the RV Zeeleeuw. 150
We sampled the pelagic food sources by means of a 10 l Niskin bottle, 3 m below the surface and 151
filtered between 150 mL (bloom period) and 1200 mL (post-bloom period) of these seston samples 152
(without sieving) on pre-combusted GF/F glass microfiber filters for pigment and lipid analysis. Data 153
on phytoplankton composition and abundance were retrieved from the closest monitoring station, 7 154
km east (51°10.19’N, 2°42.94’E, 12 m depth, 1.5 km offshore). The Belgian coastal area is spatially 155
quite homogeneous in terms of phytoplankton composition (Rousseau et al., 2006). There might be 156
a small temporal lag of about 1 month in phytoplankton bloom arrival between the south western 157
area and the north eastern area of the Belgian part of the North Sea (Muylaert et al., 2006). 158
However, since both the sampling and the monitoring station are situated in the south-western area, 159
we are confident that these stations were at each sampling time similar in terms of phytoplankton 160
composition. For the monitoring of phytoplankton composition, 1 l samples for phytoplankton 161
counts were collected monthly or fortnightly (during the spring bloom) with a Niskin bottle; samples 162
were fixed with a gluteraldehyde-lugol solution (final concentration 1%) and stored in the dark. In 163
addition, live samples were collected for Phaeocystis colony counts (see below) and stored cool and 164
dark until analysis. Counts of diatoms, dinoflagellates and non-colonial Phaeocystis cells were 165
performed with a Zeiss Axiovert inverted microscope using the Utermöhl method (Hasle, 1978). For 166
Phaeocystis colonies, within 24 hours of sampling, live samples were put in sedimentation chambers 167
and fixed with 2 or 3 drops of a gluteraldehyde-lugol solution. After > 8 hours of sedimentation > 100 168
colonies were counted and sized. The number of cells in a colony was then estimated based on the 169

MANUSCRIP
T
ACCEPTED
ACCEPTED MANUSCRIPT
6
average volume of a colony and a conversion factor proposed by (Rousseau et al., 1990). The total 170
Phaeocystis cell number is a sum of the cell numbers of both colonial and non-colonial cells. 171
Benthic food sources were sampled by means of three 8 ml (4 cm deep into the surface layer) 172
sediment subsamples of a Reineck Box corer (0.018 m2) that was deployed several times. These 173
subsamples were used for the determination of chlorophyll-a, particulate organic carbon (POC) and 174
lipid analysis of the sediment organic matter. Chlorophyll-a samples were stored at -80 °C until 175
analysis. 176
Sediment samples (approx. 3 g of sediment) and SPM filters for lipid analysis were immediately 177
transferred to extraction liquid (methanol/chloroform). Chlorophyll-a was determined by HPLC 178
(Gilson) analysis according to Wright and Jeffrey (1997). Following acid treatment for removal of 179
inorganic carbon, total organic C content was analysed with a FLASH 2000 NC Elemental Analyzer. 180
Nematodes - The sediment from the Reineck box corer was also subsampled with 4 to 5 3.6 cm ∅ 181
Perspex cores. Sediment collected on 8 sampling events (Table 1) was sliced in 1 cm sections from 182
which only the 0-1 cm (“surface”) and 3-4 cm (“deep”) horizons were immediately frozen in liquid 183
nitrogen and stored in the lab at -80 °C. In the laboratory, meiobenthos (> 38 µm) was extracted 184
with Ludox, using the well-rinsed supernatant after centrifugation (Heip et al., 1985, p. 1985). 185
Nematodes were hand-picked with a fine needle under a stereomicroscope, cleared of adhering 186
particles and rinsed with Milli-Q before being transferred to 2.5 ml GC vials that were frozen at -80 187
°C and subsequently freeze-dried. Since nematode biomass was small, we made sure to minimize 188
the contamination risk. Therefore, all equipment was sterile. In addition, samples were ice-cooled to 189
prevent degradation during the time-consuming processing. Samples were processed within 2 h and 190
broken or leaking nematodes were not selected. Nematodes clearly belonging to the Sabatieria 191
genus were picked separately from ‘other nematodes’. Depending on the available biomass, one to 192
three pseudoreplicates were gathered from each sampling occasion, containing between 75 to 244 193
nematodes. 194
Macrobenthos was sampled on 6 occasions (Table 1) using a Van Veen grab and sieved on board. For 195
every sampling event, two adult specimens of Abra alba, Owenia fusiformis and Sagartia sp. (further 196
referred to as ‘Abra’, ‘Owenia’ and ‘Sagartia’) were selected. On board and within at most 6h, 197
organisms were taken out of their shells or tubes and cleaned of debris; their tissue was blended to 198
a slurry and transferred to extraction liquid (methanol/chloroform). Immediate elaboration of the 199
samples (one specimen per sample) using slurries precluded dry weight estimation of the animals. 200
Owenia was not present in the samples from February, while Abra was absent in March. 201

MANUSCRIP
T
ACCEPTED
ACCEPTED MANUSCRIPT
7
2.2. Fatty acid extraction and analysis 202
We used the polar lipids as biomarkers for food sources (algae and bacteria) in the SPM and 203
sediment, and neutral lipids for tracing these food sources in the diet of macrobenthos. Due to 204
limited biomass of nematodes, we used the total FA extract to trace their food sources. 205
The lipids were extracted from the suspended matter, sediment and macrobenthic slurries using a 206
modified Bligh and Dyer method (Boschker, 2004; Boschker et al., 1999). In short, total lipid samples 207
were extracted in chloroform–methanol–water (1:2:0.8/v:v:v) and fractionated on a heat-activated 208
silicic acid column (Silica 60 Merck, Darmstadt, Germany) by sequential elution with chloroform, 209
acetone and methanol to obtain two polarity fractions: neutral lipids containing the Triacyl-glycerol 210
reserve lipids (NLFA) in the chloroform fraction and polar lipids containing mainly membrane lipids 211
(PLFA) in the methanol fractions. The acetone fraction containing mostly pigments was not retained. 212
Fatty acid methyl esters (FAME) were obtained from both polar and neutral lipid extracts using 213
derivatisation by mild alkaline transmethylation. FAME concentrations were determined by gas 214
chromatograph-combustion-interface-isotope ratio mass spectrometer (GC-c-IRMS, Hewlett Packard 215
G1530 GC; polar BPX-70 column 50 m, 0.32 mm film 0.25 µm, SGE054607; Type-III 216
combustion interface; Thermo Finnigan Delta-plus IRMS). Samples were injected in splitless mode 217
and concentrations were calculated based on the added amount of the internal standard (19:0). The 218
use of GC-c-IRMS for concentration measurement and CSIA implies a higher detection limit for 219
individual compounds than when using GC-MS or GC-FID. Identification of FAME was based on the 220
comparison of relative retention times and compared to those of internal standards (12:0, 16:0, 221
19:0) and FAME reference sediment mixtures which were also used to check the accuracy of the 222
isotopic ratios determined by the GC-c-IRMS. 223
The modified Bligh and Dyer method could not be used for the nematode samples, because of their 224
small biomass. For these samples, a modified Masood extraction protocol was used to extract total 225
fatty acids (Van Gaever et al., 2009). In short, fatty acid extraction and preparation of methyl esters 226
(FAME) were carried out according to Masood et al. (2005) with reagent volumes adapted for use in 227
this 2.5 ml GC-vials using FAME C19:0 as internal standard to calculate the concentration of FAs. These 228
individual samples were analyzed separately for their FA compositions employing a large volume 229
splitless injection method on a Thermo Finnigan Trace Ultra GC with the following configuration: large 230
volume liner with glass wool, pre-column deactivated silica 5 m x 0.53 µm and analytical column SGE 231
BPX-70 50 m x 0.32 mm x 0.25 µm. 232
Stable carbon isotope data are expressed in the delta notation (δ13C) relative to Vienna Pee Dee 233
Belemnite (V-PDB). The δ13C of individual FA (PLFA, NLFA or Total) were calculated by correcting for 234

MANUSCRIP
T
ACCEPTED
ACCEPTED MANUSCRIPT
8
methyl C atoms added during derivatisation following: δ13CFA = ((n+1) x δ13CFAME – 1 x δ13CMethanol)/n, 235
where n is the number of C atoms in the FA, δ13CFAME is the isotope ratio of measured methylated FA 236
and δ13CMethanol is the isotopic ratio of the used methanol. Blanks and a standard mixture were 237
measured regularly in between the samples to check for system stability and possible contamination 238
(sd for 19:0 standard over all 142 samples: 0.67 ‰). For most of the FA we use shorthand notation of 239
the form A:BωX, where A represents the number of carbon atoms, B gives the number of double 240
bounds and X gives the position of the double bond closest to the terminal methyl group (Guckert et 241
al., 1985). The common eicosapentaenoic acid (EPA; 20:5ω3) and docosahexaenoic acid (DHA; 242
22:6ω3) will also be presented with their common abbreviations. FA were allocated as biomarkers of 243
food sources according to references listed in Table 2. 244
2.3. Data analysis 245
Results are expressed in terms of relative FA biomarker composition within the PLFA (SPM and 246
sediment), TFA (nematodes) and NLFA (macrofauna) fraction. The temporal variations in the totals 247
of pelagic and benthic food sources (PLFA), macrobenthic diet (NLFA) and structural FA (PLFA) and 248
nematode TFA were explored with univariate analyses, while their composition was explored with 249
multivariate analyses (not for macrofauna PLFA since these do not reflect short-term diet). 250
Multifactorial, fully crossed permutational ANOVAs (PERMANOVA) were carried out to test the 251
effect of the fixed factors Species [Sp], Months [M] and for nematodes also sediment depth [D] on 252
the relative abundance of all biomarkers (multivariate data with Bray-Curtis resemblance matrix; 253
univariate data with Euclidean resemblance matrix). For nematodes, analyses on relative 254
abundances were compared to tests on absolute abundances to estimate the effect of total 255
abundances. Two sediment samples (1 in mid-March and 1 in mid-April) were not taken into account 256
because they had very atypical, noisy FA profiles without clear peak separation that were not 257
trustworthy. Also one Owenia sample (mid-March) and one Abra alba sample (September) were 258
omitted because they contained hardly any FA. For analyses, the sum of all unidentified peaks was 259
included as “unknowns”. In case a significant effect of a factor was found, pair-wise tests within this 260
factor were carried out, with p-values drawn from Monte Carlo [MC] permutations, because of the 261
restricted number of possible permutations (Anderson and Robinson, 2003). The same analysis was 262
performed only on δ13C signatures of biomarker FA that were present in all samples, because 263
absence of a biomarker FA cannot be simply be indicated by a “zero” δ13C signature. This implied we 264
had to pool all bacterial FA (ΣBacterial FA = 10Me16:0, 10Me17:0, 10Me18:0, i-14:0, ai-15:0, i-265
15:0/14:1ω5c, i-16:0, i-16:0/15:1ω5c, i-17:0, ai-17:0, 18:1ω7c) and all saturated fatty acids (ΣSFA = 266
13:0, 14:0, 15:0, 16:0, 17:0, 18:0, 20:0, 21:0, 23:0, 24:0). For this analysis, however, we used a 267
Euclidean distance matrix that can cope with the negative signatures. Principal Coordinates Analysis 268

MANUSCRIP
T
ACCEPTED
ACCEPTED MANUSCRIPT
9
[PCO] on the same resemblance matrices as were used for PERMANOVA analysis visualised those FA 269
from NLFA and PLFA that correlated at least 75% with one of the first 2 PCO-axes (but further 270
specified in the figure captions). All analyses were performed within PRIMER v6 with PERMANOVA 271
add-on software (Anderson et al., 2008; Clarke and Gorley, 2006). 272
3. RESULTS 273
3.1. Microscopic observations of phytoplankton in the water column 274
Diatom abundances were low in January – February, but peaked between the end of March (day 85) 275
and the end of April (day 117) and a second time at the end of May (day 151). Dinoflagellates 276
attained lower abundances with small blooms in mid-March (day 74) and mid-April (day 104) (Figure 277
1A). The short Phaeocystis bloom occurred at the end of April (day 117) (Figure 1B). These 278
phytoplankton counts delineate clear periods with respect to the bloom: a pre-bloom period 279
(February – Mid-March), a bloom period (Mid-March – June), and a post-bloom period (June – 280
September). 281
3.2. Biochemical characterization of suspended matter in the water column and sediment 282
3.2.1. Chlorophyll-a and carbon content 283
The phytoplankton blooms were traced in SPM chl-a, which peaked in April, maintaining high 284
concentrations until mid-May (day 137) (Figure 1C). About one month later, a peak in chl-a in the 285
sediment was observed (end of June; day 173). The chl-a concentrations in both SPM and sediment 286
were strongly reduced by mid-July (day 194). These patterns were also mirrored in % organic carbon 287
(Figure 1D) and total PLFA fatty acid content (Figure 1E; Table 3) of SPM and sediment with a strong 288
distinguishable peak (pair-wise tests, p < 0.05), however with high variability in the magnitude of the 289
sediment peak at the end of June (day 173). 290
3.2.2. Composition of fatty acids in phospholipid-derived fatty acids (PLFAs) 291
PLFA composition of the suspended particular matter in the water column (relative abundances) was 292
characterised by low relative contributions of bacterial FAs (< 10%) but high amounts of 293
Polyunsaturated Fatty Acids (PUFAs; 51-65%; Table Appendix). There was a clear temporal gradient 294
in the FA composition of the SPM in the water column (Table 3; Figure 2A). February and March 295
were the only months being similar in PLFA composition. PCO clearly displays this temporal pattern 296
with a high percentage of the total variation explained by axis 1 (74.8%) separating April (bloom 297
period) from February and March (pre-bloom period) with June and September (post-bloom period) 298
in between (Figure 2A). Biomarkers that correlated strongly with this time-separating 1st PCO axis 299
were the Phaeocystis markers 18:1ω9c and 18-PUFAs (Table 2) on the one hand, and 16:2ω7 and 300

MANUSCRIP
T
ACCEPTED
ACCEPTED MANUSCRIPT
10
20:4ω3 on the other hand, all attaining higher concentrations during the bloom period in April. The 301
pre- and post-bloom samples were characterised by higher amounts of the diatom markers 16:1ω7c 302
and 20:5ω3 (Table 2) and an incompletely separable peak of 18:1ω9t/16:4ω1 and 16:3ω4. 303
Sediment PLFA composition (%) was more characterised by high concentrations of bacterial FA (26-304
34%) but lower amounts of PUFAs (13-25%; Table Appendix). A temporal gradient was also present 305
in the sedimentary PLFA composition, but to a lesser extent compared to water column SPM. The 306
deposition of the phytoplankton bloom was not easily traceable in the FA composition (Table 3, 307
Figure 2B): jointly, the two PCO-axes explained 77.1% of the total explained variance and separated 308
the pre-bloom samples of February from the later samples. The sediment samples obtained during 309
the bloom in the water column were more variable in composition. However, only February differed 310
in PLFA composition from the other months (except mid-April) as the relative abundances of both 311
bacterial and diatom markers were lower in February than in the other months (Figure2B). Relative 312
PLFA composition of sediment was not different between the other months. 313
3.2.3. δ 13C signature of fatty acids in Polar Lipids 314
δ13C signatures of bacterial and saturated FA, 20:5ω3 (EPA), 22:6ω3 (DHA) and 16:1ω7c in the 315
suspended matter in the water column were strongly temporally structured (Table 3; Figure 2C), 316
with enriched values in bacterial and saturated FA in February and March and enriched values of 317
EPA, DHA and 16:1ω7 during the bloom period (April) (Figure 2C, Appendix Figure 2). This temporal 318
pattern was not found in δ13C signatures of the main biomarkers in the sediment (Figure 2D). 319
Therefore, no biomarker vectors are shown in Figure 2D. 320
321
3.3. Lipid composition of nematodes 322
3.3.1. Composition of fatty acids in total lipids 323
Nematode FA profiles were composed of moderate amounts of bacterial FA (6-12%) and relatively 324
high amounts of PUFAs (32-47%) and Saturated Fatty Acids (SFAs; 8-22%; Table Appendix). DHA/EPA 325
ratio was always > 1, while 16:1ω7c/16:0 ratio remained < 1, which in combination suggest a 326
flagellate-based diet (Table 2). Absolute individual FA concentrations (µg ind.-1) differed significantly 327
among Species x Date and among Species x Depth (PERMANOVA: p < 0.05; Table 3; Figure 3A). When 328
relative concentrations (% ind.-1) were considered, lipid composition differed only among Species 329
(Table 3; Figure 3B). This implies that nematode FA profiles differ in total concentration among 330
depth layers and dates. In fact, ‘other nematodes’ had significantly higher FA concentrations in the 331
surface layer (23.96 ± 2.00 µg ind.-1) than in the deep layer (18.74 ± 1.58 µg ind.-1) (Figure 4; Table 3). 332

MANUSCRIP
T
ACCEPTED
ACCEPTED MANUSCRIPT
11
‘Other nematodes’ had also higher FA concentrations in February and March (pre-bloom period) as 333
compared to April and later months (bloom and post-bloom period) (Figure 4; Table 3). Upon bloom 334
deposition, the average total FA concentration in Sabatieria nematodes doubled (Figure 4), but due 335
to a high variability among replicate samples, this difference was not detected by the statistical 336
analysis. More than 60% of the explained variation in the total abundance FA profiles of the 337
nematodes was accounted for by the distinction between Sabatieria and ‘other nematodes’ (Figure 338
3A), which also indicates that Sabatieria have higher total FA concentrations per individual. Absolute 339
FA concentrations per individual depend on the biomass and lipid content of an organism. However, 340
this difference in lipid composition holds also with relative concentrations, but only 14% of the total 341
explained variance is related to the difference between Sabatieria and ‘other nematodes’ (Figure 342
3B). This difference was mainly made up by slightly higher abundances of EPA and DHA in Sabatieria 343
(Figure 3B, Appendix Figure 1). 344
3.3.2. d13C signature of fatty acids in total lipids 345
Seven biomarkers were detected over the entire sampling period (ΣBacterial, ΣSFA, EPA, DHA, 346
16:1ω7c, 18:1ω9c, 18-PUFA) and could as such be compared with PERMANOVA analysis. Jointly, the 347
δ13C signature of these biomarkers differed among Species x Date (PERMANOVA: p < 0.05; Table 3, 348
Figure 5). Pair-wise comparison detected no temporal differences in δ13C of Sabatieria biomarkers, 349
but some were detected in ‘other nematodes’, however unrelated to temporal phytoplankton 350
dynamics. On species level, Sabatieria FA had significantly more enriched δ13C signatures than ‘other 351
nematodes’ before the bloom (February, March) and more depleted signatures long after the bloom 352
(September). During bloom and its deposition (April, May, June), d13C signatures of the FA of both 353
nematode groups converged (pairwise tests p < 0.05; Figure 5). 354
3.4. Lipid composition of macrobenthos 355
3.4.1. Total FA in reserve lipids (NLFA) and structural lipids (PLFA) 356
The total concentration of extracted FA (NLFA + PLFA) per individual from the selected macrobenthic 357
species followed a clear, and species-specific temporal pattern which is probably a combination of 358
an increase in biomass and lipid content (PERMANOVA, Species x Date: p < 0.05; Table 3): Sagartia 359
doubled its FA levels by mid-April, and by the end of April, Abra had even increased them more than 360
10-fold (pair-wise tests p < 0.05; Figure 6). The FA concentrations in Owenia remained constant 361
throughout the year (pair-wise tests p > 0.05). The proportion of reserve lipids in the total amount of 362
extracted FA was more or less coupled to this temporal pattern (Table 3), with higher NLFA 363

MANUSCRIP
T
ACCEPTED
ACCEPTED MANUSCRIPT
12
proportions around mid-April and lower in September (pairwise tests p < 0.05). Owenia also had a 364
significantly higher proportion of NLFA than Sagartia (pairwise tests p < 0.05). 365
3.4.2. Composition of fatty acids in reserve lipids (NLFA) 366
Macrofauna reserve lipids were characterised by moderate amounts of bacterial FA (0-14%) and a 367
wide range of SFA (18-50%) and PUFA concentrations (21-53%) (Table Appendix). The standardized 368
FA concentrations of macrofauna differed among Species x Date (PERMANOVA: p < 0.05; Table 3; 369
Figure 7A). While the FA composition of the different species was significantly different (pair-wise 370
test, p <0.05), the FA composition remained constant throughout the sampling period (p > 0.05 for 371
all investigated dates within species). Abra and Sagartia had similar FA profiles at the end of April 372
and September, but differed on all other dates. Owenia differed in FA profile from Abra alba and 373
Sagartia only in mid-April (pair-wise tests: p < 0.05). Sagartia FA profiles clustered clearly apart from 374
Abra and Owenia profiles (PCO; Figure 7A). Sagartia was characterized by higher relative 375
abundances of longer chain PUFAs such as DHA, 22:5ω3 (Figure 7A), a DHA/EPA ratio mostly > 1 376
(Table Appendix), indicative of a flagellate component in the diet (Table 2), and 2-5% 20:1ω9c (Table 377
Appendix), a biomarker for copepods (Table 2), all pointing to predation. Abra samples 378
demonstrated higher percentages of 16-PUFAs, a 16:1ω7c/16:0 ratio mostly > 1 and DHA/EPA ratio 379
mostly < 1 (Table Appendix), evidence of a diatom-based diet (Table 2). Owenia showed higher 380
relative contributions of 18:1ω9c (Figure 7A) and 18-PUFAs (Figure 1 Appendix) (Phaeocystis marker; 381
Table 2) and a DHA/EPA and 16:1ω7c/16:0 ratio both < 1, indicating a diet that is neither composed 382
of diatoms nor flagellates (Table 2). 383
3.4.3. δ13
C signature of fatty acids in reserve lipids 384
The 5 biomarkers present at all sampling events in the macrobenthic individuals differed among 385
Species and among Dates (PERMANOVA: p < 0.05; Table 3, Figure 7B). Sagartia had significantly 386
more depleted δ13C signatures of these biomarkers than Abra and Owenia (pair-wise tests p < 0.05, 387
Appendix Figure 2). The δ13C signature of the bacterial and saturated FA in all investigated species 388
became gradually more depleted towards the end of June, whereas EPA and DHA in macrofaunal 389
NLFA were more enriched during this bloom deposition period (pair-wise tests p < 0.05). 390
4. DISCUSSION 391
The temporal succession in phytoplankton composition could clearly be traced using FA biomarkers 392
and their compound-specific stable isotopes. The FA composition of nematodes appeared to be 393
uncoupled from the temporal dynamics in primary production, while FA abundance of the selected 394
macrobenthic suspension-deposit feeders depended strongly on the pelagically produced organic 395

MANUSCRIP
T
ACCEPTED
ACCEPTED MANUSCRIPT
13
matter. The relative abundance of pelagic and benthic food sources in the FA composition of these 396
suspension-feeders was less clear. Attributing PLFA biomarkers to unique phytoplankton taxa is not 397
straightforward since there is no single marker for a single plankton group (Parrish et al., 2000). In 398
addition, it is also challenging to undoubtedly interpret the FA profiles of the studied invertebrates. 399
In the first place because we were bound to use different lipid fractions for nematodes (total FA) as 400
for macrobenthos (NLFA). The NLFA fraction of the macrobenthos is expected to give an insight into 401
the diet preferences, without being influenced by metabolic control or genetic predetermination. 402
The TL fraction extracted from the nematodes is a mixture of reserve lipids (NLFA) and membrane 403
lipids (PLFA), of which the latter are genetically predetermined (Kuerten et al., 2013a) and more 404
under metabolic control (Koussoroplis et al., 2010). Therefore these PLFA are geographically and 405
seasonally set (Ventrella et al., 2008) and might blur patterns in the more diet-reflecting reserve 406
lipids of the nematodes. This would explain the less evident temporal patterns in nematode FA 407
composition as opposed to macrobenthic FA composition. Secondly, the applicability of FA 408
biomarkers to assess patterns in the diet of higher trophic level organisms and its temporal dynamics 409
is constrained by the degree to which they alter their FA signature through de novo biosynthesis and 410
breakdown (oxidation) of dietary FA (Caramujo et al., 2008). Since no feeding experiments were 411
conducted (McLeod et al., 2013), differences in species or season specific physiology cannot be ruled 412
out completely when interpreting differences in FA composition between invertebrate taxa. Keeping 413
these considerations in mind, we will discuss various characteristics of the benthic food web. We 414
compare these to the patterns observed in bulk δ13C in SPM, sediment and macrobenthos (van 415
Oevelen et al., 2009) and nematodes (Franco et al., 2008b) and organic matter mineralization 416
(Provoost et al., 2013) at a very similar study site within a few 100m from our station and FA 417
composition accompanied by CSIA in SPM, sediment and polychaetes at a comparable depositional 418
site 20 km to the east (Braeckman et al., 2012). Finally, we address the possibility of resource 419
partitioning between the different metazoan components of the benthic food web. 420
4.1. Temporal dynamics in SPM in the water column and sediment 421
The expected temporal dynamics in phytoplankton in the Belgian part of the North Sea (Rousseau et 422
al., 2002) were clearly observed in the suspended matter in the water. An early diatom bloom was 423
observed in March and was reflected in higher EPA, 16:1ω7c and 16:3ω4 concentrations. The main 424
cause of increase in chl-a and organic matter as well as total lipids in the SPM can be explained by a 425
Phaeocystis bloom at the end of April, characterised by elevated concentrations in 18-PUFAs and 426
18:1ω9c (Braeckman et al., 2012; Dalsgaard et al., 2003; Hamm and Rousseau, 2003) and more 427
enriched δ13C values of the diatom, dinoflagellate and Phaeocystis markers (16:1ω7c, EPA, DHA and 428
18:1ω9c), reflecting potentially higher specific growth rates or use of 13C enriched dissolved 429

MANUSCRIP
T
ACCEPTED
ACCEPTED MANUSCRIPT
14
inorganic carbon pools during the bloom (Laws et al., 1995). During the post-bloom period, the 430
signatures became more depleted in d13C, which is related to sinking of senescent algae to the sea 431
floor and replenishment with new communities. This temporal pattern in compound-specific stable 432
isotope signatures of FA is in accordance with the bulk δ13C signature of water column SPM in the 433
same area (Kuerten et al., 2013b; van Oevelen et al., 2009). 434
The main phytodetritus pulse to the sediment in our study was detected at the end of June, 1-2 435
months after the peak bloom in the water column, by an increase in sediment chl-a and organic 436
carbon content, as well as by elevated total fatty acid concentrations in the sediment samples. This 437
timing is in accordance with the seasonal dynamics of oxygen consumption and benthic communities 438
in this shallow coastal system (Braeckman et al., 2012; Franco et al., 2008b; Provoost et al., 2013; 439
van Oevelen et al., 2009). However, the composition and δ13C signatures of sedimentary FA did not 440
change drastically. This is in contrast with earlier observations of clear peaks of diatom and 441
dinoflagellate marker concentrations in the sediment shortly after the water column blooms 442
(Braeckman et al., 2012). Still, we have to keep in mind that the bulk of the organic matter from 443
primary production is mineralized in the water column (Rousseau et al., 2000) and only 25% of this 444
matter arrives at the sea floor in our study area (Lancelot et al., 2005). The variances observed for 445
variables measured on the sediment samples obtained during the phytoplankton bloom were high 446
(see large error bars in chl-a, TOC and total PLFA fatty acid content as well as spread in PCO graphs 447
on FA composition), probably indicating patchy distribution of the phytodetritus, which we may 448
therefore not have representatively sampled given the small sampling area (surface of 10 mL 449
syringe: < 1cm²). An alternative explanation would be resuspension of the surface layer, as has been 450
suggested for other sites in the Southern Bight of the North Sea (Boon and Duineveld, 1996; Boon et 451
al., 1999; Wieking and Kröncke, 2005). However, our study site is located in a gully where organic 452
matter is rather trapped than resuspended. Macrobenthic deposit-feeders are well adapted for fast 453
consumption of uniformly spread, concentrated food and can spatially redistribute this organic 454
matter within the sediment matrix (van Nugteren et al., 2009). Through the activity of macrofauna, 455
freshly deposited organic matter can be also strongly modified during efficient assimilation and gut 456
passage, with essential PUFAs and even less essential bacterial FA being stripped from food sources 457
as has been shown for sediment reworking animals like Hediste diversicolor and Yoldia limatula 458
(Bradshaw et al., 1990; Sun et al., 1999; Woulds et al., 2014). An abundant and active macrobenthic 459
community (van Oevelen et al., 2009) could thus partially explain why sediment organic matter FA 460
do not mirror phytoplankton dynamics in the SPM of the water column. In addition, PUFAs also 461
degrade quickly under microbial activity in the sediment (Carrie et al., 1998; Leduc et al., 2009). 462
MANUSCRIP
T
ACCEPTED
ACCEPTED MANUSCRIPT
15
4.2. Nematode diet composition and temporal patterns 463
Very little information exists on FA in marine free-living nematodes (Guilini et al., 2013; Leduc and 464
Probert, 2009; Leduc, 2009; Leduc et al., n.d.; Lins et al., 2015; Van Gaever et al., 2009). In line with 465
these studies, we also found elevated PUFA levels in the investigated nematode groups, which 466
confirms that nematodes can be considered a high-quality food source for higher trophic levels, 467
although the total amount of lipids in the nematodes can be low (Guilini et al., 2013). Sabatieria had 468
higher total FA concentrations per individual than ‘other nematodes’. This is most probably related 469
to the higher individual biomass of Sabatieria as compared to ‘other nematodes’ (U. Braeckman, 470
pers. obs.). Relatively, Sabatieria contained more EPA and DHA than ‘other nematodes’, which 471
makes them a better quality food source to higher trophic levels. 472
A DHA/EPA ratio > 1 in combination with 16:1ω7c/16:0 ratio < 1 suggest a flagellate–based diet 473
(Dalsgaard et al., 2003). As for many FA biomarkers, care has to be taken when attributing them to 474
specific food sources (Dalsgaard et al., 2003; Parrish et al., 2000). For nematodes, a diet mainly 475
composed of flagellates by the entire nematode community throughout the year seems unlikely, 476
based on the diversity in morphology of their buccal cavity (Wieser, 1953), but see ‘Introduction’ for 477
criticisms on this study). In fact, EPA levels in the nematodes were similarly low as the EPA 478
concentrations in the sediment, whereas DHA levels in nematodes were 5-fold the DHA 479
concentrations in the sediment. Biosynthesis is a possible explanation and has been shown for 480
nematodes before, but DHA is seldom biosynthesised in nematodes (Honnens et al., 2014; Leduc 481
and Probert, 2009; Schlechtriem et al., 2004; Watts and Browse, 2002). We cannot fully exclude this 482
biosynthesis of DHA though, since intermediate products (22:5ω3; Kelly and Scheibling, 2012) in its 483
biosynthesis were detected in small amounts (2.07 ± 0.45% on average ± SD; Table Appendix), while 484
the concentrations of 22:5ω3 in SPM and sediment were < 0.7%. An alternative explanation is that 485
nematodes selectively assimilated the PUFAs from the sediment and accumulated them, as has been 486
shown for polychaetes (Woulds et al., 2014), echinoderms (Boon and Duineveld, 2012) and 487
copepods (Graeve et al., 2005; Mayor et al., 2011) and tentatively suggested for deep-sea 488
nematodes (Guilini et al., 2013; Lins et al., 2015). 489
Apart from these PUFAs, nematode FA composition seemed to be complemented with bacterial FA 490
(< 10% of total FA concentrations), indicating assimilation of bacterial derived organic matter. The 491
‘other nematodes’ seemed to rely more on sedimentary bacteria than Sabatieria (see similar δ13C 492
signatures of bacterial markers in ‘other nematodes’ and sediment signatures, Figure 2 Appendix). 493
Before and long after the bloom, Sabatieria δ13C signatures of bacterial biomarkers and MUFAs were 494
more enriched than those of ‘other nematodes’ and were situated between the δ13C signatures of 495

MANUSCRIP
T
ACCEPTED
ACCEPTED MANUSCRIPT
16
the bacterial markers and MUFAs in the sediment and SPM. During the bloom and its deposition 496
(April, May, June), δ13C signatures of both nematode groups converged to similar signatures 497
probably reflecting a mixture between fresh input from the SPM in the water column and more 498
degraded matter in the sediment. Interestingly, this diverges from Franco et al (2008b) who did not 499
find differences in bulk δ13C between ‘other nematodes’ and Sabatieria. This shows the advantage of 500
CSIA on more food source-specific biomarkers as opposed to bulk δ13C analysis of the entire body. 501
Total absolute fatty acid concentrations in ‘other nematodes’ were on average 28% higher in surface 502
nematodes than in deep-dwelling nematodes, but the actual FA composition remained similar. This 503
indicates that ‘other nematodes’ at the surface that are supposed to have access to fresher organic 504
matter actually accumulate higher fat reserves and/or grow bigger. The latter cannot be excluded 505
since individual biomass data are not available for our dataset. The individual abundances of FA 506
biomarkers in Sabatieria, however, were equal in both surface and deep-dwelling groups, which 507
suggests access to the same quantities of food, supporting the hypothesis of vertical migration in the 508
sediment (Franco et al., 2008b) or even genetic predetermination (Kuerten et al., 2013a). Nematode 509
bulk δ13C signature at the same station differed among nematodes inhabiting contrasting depth 510
layers, especially for ‘other nematodes’ (Franco et al., 2008b). The authors attributed this difference 511
to depth-segregated food webs. The ‘other nematodes’ in the present study did not show depth-512
related differences in δ13C signatures of the main biomarkers, but there was a shorter distance 513
between our depth layers (deepest layer in this study: 3-4 cm; 4-5 cm in Franco et al. 2008). As 514
deeper layers contain nematodes feeding on older material (Franco et al., 2008b), the difference 515
between our surface layer and deep layer was expected to be smaller than that in Franco et al. 516
(2008b). 517
Meiobenthic bulk δ13C signature changed little over time and was decoupled from temporal patterns 518
in SPM and sediment, which indicates selective feeding (Franco et al., 2008b). This was also the case 519
for Sabatieria FA CSIA in this study, whereas ‘other nematodes’ seemed to experience some 520
temporal fluctuations in their δ13C signature, however, unrelated to the deposition of the 521
phytoplankton bloom. Together with high PUFA levels, essential energy-rich compounds to maintain 522
their metabolism (Arts et al., 2001), this decoupling from temporal phytoplankton dynamics 523
corroborates the results for deep-sea nematodes (Guilini et al., 2013; Lins et al., 2015; Veit-Köhler et 524
al., 2013) where continuous feeding throughout the year on degraded matter was suggested. Only 525
during phytoplankton bloom deposition, nematodes have access to and accumulate more FA. 526
Interestingly, this suggests that irrespective of the region and extent in food supply, nematodes do 527
not change their diet throughout the year. 528

MANUSCRIP
T
ACCEPTED
ACCEPTED MANUSCRIPT
17
4.3. Macrofauna diet composition and temporal patterns 529
Abra and Owenia seem to share the same food sources throughout the year, except during the 530
phytoplankton bloom, when Owenia seemed to assimilate at least some of the abundant 531
Phaeocystis in the SPM, while Abra consumed strictly diatoms. Since diatom abundances during the 532
Phaeocystis bloom were roughly two orders of magnitude lower than Phaeocystis abundances, this 533
means that Abra was selectively taking out the diatoms from the SPM. Abra spp. are known to select 534
particles by size from the sediment (Hughes, 1975), but our data now also indicate that this bivalve 535
can selectively pick up diatoms from deposited phytoplankton that consists mainly of Phaeocystis 536
(Lancelot et al., 2005). It has been shown that the gelatinous Phaeocystis colonies have a low 537
nutritional value and tend to have adverse effects, such as clogging of gills (Weisse et al., 1994). 538
Selection of food particles is a common feature among suspension- and deposit-feeding 539
invertebrates in relatively rich coastal environments (Boon and Duineveld, 2012; Ward and 540
Shumway, 2004). For deposit-feeders, one would expect elevated bacterial FA concentrations. 541
Indeed, Abra spp. can also distinguish between microbially coated particles and clean particles 542
(Hughes, 1975). In the suspension-deposit feeding Abra and Owenia, however, bacterial 543
contributions were low. Only during the deposition of the phytoplankton bloom on the sediment, 544
both species accumulated > 10% of bacterial biomarkers in their reserve lipids, probably attached to 545
the algal detritus in the SPM. Altogether, this shows that Abra and Owenia are primary consumers 546
selectively feeding on the fresh particulate organic matter of the water column. 547
Sagartia had a very different FA composition from Abra and was characterized by higher PUFA 548
levels. The δ13C signatures of the PUFAs in Sagartia were 3-4‰ depleted as compared to the 549
sediment and SPM signatures. This could be evidence of biosynthesis from other FA (Ruess et al., 550
2005; Treignier et al., 2009); 22:5ω3 as an intermediate product in the synthesis of DHA was present 551
in relatively high concentrations (6.7 ± 2.1% average ± SD). However, biosynthesis is thought to be a 552
slower process than assimilation of FA in the neutral lipids (Graeve et al., 2005; Woulds et al., 2014). 553
Taking into account an estimated decrease in δ13C of PUFA of ~3.2‰ per trophic level increase (Bec 554
et al., 2011; Gladyshev et al., 2014), this suggests rather predation. In addition, Sagartia is the only 555
investigated species where 20:1ω9c, a biomarker for copepods (2.6-5.3%) was detected. This is in 556
agreement with gut content observations of other burrowing anemones (Holohan et al., 1998). 557
Together with elevated DHA levels, DHA/EPA ratio > 1, this confirms the suggestion of van Oevelen 558
et al. (2009) that Sagartia is a predatory anemone capturing flagellates and copepods. 559
Abra and Sagartia started to replenish their total FA reserves from the moment the phytoplankton 560
bloom in the water column started. Especially Abra experienced strong variations in the reserve lipid 561

MANUSCRIP
T
ACCEPTED
ACCEPTED MANUSCRIPT
18
concentrations, which declined strongly after the phytoplankton bloom. Similar to other 562
invertebrates, this might be related to the period of spawning, since PUFAs are crucial for 563
reproduction of bivalves (Hendriks et al., 2003; Wacker and Von Elert, 2003) and also for sea 564
anemones (Pernet et al., 2002). Unexpectedly, we observed very little influence of season on the FA 565
composition of Abra, Owenia and Sagartia. Although the diet composition of bivalves and 566
polychaetes for example, has been shown to depend on seasonal variations in resource availability 567
(Braeckman et al., 2012; Ezgeta-Balić et al., 2012; Lefebvre et al., 2009; Richoux et al., 2014) other 568
studies contradict this (Dubois et al., 2014; Kuerten et al., 2013a; Legeżyńska et al., 2014). Similar to 569
the nematodes, biosynthesis can complicate the interpretation of CSIA, as PUFAs can be 570
biosynthesized by cnidarians, bivalves and polychaetes (Monroig et al., 2013; Thurber, 2014). PUFAs 571
can also be selectively retained by polychaetes and echinoids (Boon and Duineveld, 2012; Woulds et 572
al., 2014), especially in periods of nutritional shortage (Boon and Duineveld, 2012; Freites et al., 573
2002), which would then obscure the higher uptake of PUFA during accumulation of fresh organic 574
matter. Similarly, PUFA levels in marine bivalves are typically at levels > 50% and remain relatively 575
stable over time (Freites et al., 2002; Ventrella et al., 2008). On the other hand, the δ13C signature of 576
the bacterial and saturated FA in all investigated species became gradually more depleted towards 577
the end of June, whereas EPA and DHA in macrofaunal reserve lipids were more enriched during this 578
bloom deposition period. The latter is probably a mirror from the δ13C signature of the SPM in the 579
water column and constitutes this replenishment of lipid reserves (Lorrain et al., 2002; van Oevelen 580
et al., 2009). 581
4.4. Benthic food web 582
In this study, we investigated the benthic food web from a fine-sandy depositional site in the 583
Southern bight of the North Sea. The seasonal input of fresh pelagically produced organic matter to 584
the sediment is strongly mediated by suspension-deposit feeders through herbivory (e.g. by the 585
bivalve Abra alba and polychaetes like Owenia fusiformis and Lanice conchilega) and predation (e.g. 586
by the polychaete Nephtys hombergii and anemone Sagartia sp.) (van Oevelen et al 2009; 587
Braeckman et al 2012; this study). Since the nematode FA biomarkers show a strong similarity to the 588
benthic food sources in the sediment and experience little variation in time with respect to 589
phytoplankton bloom deposition (Franco et al 2008; this study), we believe that the nematodes rely 590
on different food sources than those preferred by the macrobenthic species mentioned above 591
(Maria et al., 2012; van Oevelen et al., 2009). In the present study and a previous one (Braeckman et 592
al., 2012), we chose to focus on the temporal variation in the diet of few selected species, in case of 593
nematodes ‘groups’, at the expense of covering the diet of the entire community. As such, we miss 594

MANUSCRIP
T
ACCEPTED
ACCEPTED MANUSCRIPT
19
detailed information on the diet composition and seasonal variation of true deposit feeders of the 595
Abra alba–Kurtiella bidentata community (Van Hoey et al., 2004). Although ex situ experiments with 596
suspension-deposit feeders and nematodes already excluded strong resource competition 597
(Braeckman et al., 2011), additional information on the diet composition of macrobenthic deposit 598
feeders would allow making stronger statements about trophic competition between the entire 599
macrobenthic community and the nematode community mainly composed of non-selective deposit 600
feeders present in depositional sites such as present in the Southern Bight of the North Sea. In such 601
high energy systems at least, macrobenthos seems to be imposing stronger interference competition 602
on meiobenthos than in systems with low food availability (Nascimento et al., 2011). 603
5. CONCLUSIONS 604
The phytoplankton dynamics in the Belgian Part of the North Sea were clearly mirrored in the FA 605
biomarkers of the SPM in the water column, but less pronounced in the sediment, probably due to 606
patchy distribution, microbial decomposition processes or stripping of FA by macrofauna. The 607
macrobenthic suspension-deposit feeders Abra and Owenia seemed to rapidly assimilate the fresh 608
organic matter from the SPM, while Sagartia showed evidence of a predatory diet. Since these three 609
consumers can make up 50% of the biomass of the entire macrobenthic community in the area, their 610
rapid consumption could quickly deplete the easily degradable matter of the phytoplankton bloom 611
once deposited on the sediment. Together with the sediment-resembling FA signatures of the 612
nematodes, this is again evidence that macrobenthos and nematodes belong to two different food 613
webs (Maria et al., 2012; van Oevelen et al., 2009) and at least the suspension-deposit feeding 614
macrobenthos and non-selective deposit feeding nematodes do not compete for fresh organic 615
matter from the phytoplankton bloom (Braeckman et al., 2011). 616
ACKNOWLEDGMENTS 617
Special thanks to the crew of the RV Zeeleeuw for help with sampling, to Annick Van Kenhove and 618
Guy De Smet for precious help with picking 12 871 nematodes, to Dirk Van Gansbeke for pigment 619
analysis, to Lennart Van Ijzerloo for help with the Masood extraction, to Pieter Van Rijswijk for help 620
with PLFA and NLFA extractions and interpretation of FAME chromatograms and to Marco 621
Houtekamer for FAME and CSIA analysis. We are grateful to Dick van Oevelen for discussions and to 622
Katja Guilini for comments on an earlier draft of the manuscript. Two anonymous reviewers greatly 623
improved the manuscript with very constructive comments. U.B. was financially supported by FWO 624
project nr G.0033.11. Additional funding was provided by the Special Research Fund of Ghent 625
University (BOF-GOA 01GA1911W). 626

MANUSCRIP
T
ACCEPTED
ACCEPTED MANUSCRIPT
20
LITERATURE CITED 627
Ahlgren, G., Gustafsson, I.B., Boberg, M., 1992. Fatty Acid Content and Chemical 628
Composition of Freshwater Microalgae. J. Phycol. 28, 37–50. 629
Al-Hasan, R.H., Ali, A.M., Radwan, S.S., 1990. Lipids, and their constituent fatty acids, of 630
Phaeocystis sp. from the Arabian Gulf. Mar. Biol. 105, 9–14. 631
Anderson, M.J., Gorley, R.N., Clarke, K.R., 2008. PERMANOVA+ for PRIMER: guide to 632
software and statistical methods, Primer-E Plymouth. ed. 633
Arts, M.T., Ackman, R.G., Holub, B.J., 2001. “Essential fatty acids” in aquatic ecosystems: a 634
crucial link between diet and human health and evolution. Can. J. Fish. Aquat. Sci. 635
58, 122–137. 636
Bec, A., Perga, M.-E., Koussoroplis, A., Bardoux, G., Desvilettes, C., Bourdier, G., Mariotti, 637
A., 2011. Assessing the reliability of fatty acid–specific stable isotope analysis for 638
trophic studies. Methods Ecol. Evol. 2, 651–659. 639
Bieger, T., Abrajano, T.A., Hellou, J., 1997. Generation of biogenic hydrocarbons during a 640
spring bloom in Newfoundland coastal (NW Atlantic) waters. Org. Geochem. 26, 641
207–218. 642
Boon, A.R., Duineveld, G.C.A., 2012. Phytopigments and fatty acids in the gut of the 643
deposit-feeding heart urchin Echinocardium cordatum in the southern North Sea: 644
Selective feeding and its contribution to the benthic carbon budget. J. Sea Res. 67, 645
77–84. 646
Boon, A.R., Duineveld, G.C.A., 1996. Phytopigments and fatty acids as molecular markers 647
for the quality of near-bottom particulate organic matter in the North Sea. J. Sea Res. 648
35, 279–291. 649
Boon, A.R., Duineveld, G.C.A., Kok, A., 1999. Benthic organic matter supply and 650
metabolism at depositional and non-depositional areas in the North Sea. Estuar. Coast. 651
Shelf Sci. 49, 747–761. 652
Boschker, H.T.S., 2004. Linking microbial community structure and functioning: stable 653
isotope (13C) labeling in combination with PLFA analysis, in: Molecular Microbial 654
Ecology Manual II. Springer, pp. 1673–1688. 655
Boschker, H.T.S., De Brouwer, J.F.C., Cappenberg, T.E., 1999. The contribution of 656
macrophyte-derived organic matter to microbial biomass in salt-marsh sediments: 657
stable carbon isotope analysis of microbial biomarkers. Limnol. Ocean. 44, 309–319. 658
Boschker, H.T.S., Middelburg, J.J., 2002. Stable isotopes and biomarkers in microbial 659
ecology. FEMS Microbiol. Ecol. 40, 85–95. 660
Bradshaw, S.A., O’Hara, S.C.M., Corner, E.D.S., Eglinton, G., 1990. Dietary lipid changes 661
during herbivory and coprophagy by the marine invertebrate Nereis diversicolor. J. 662
Mar. Biol. Assoc. UK 70, 771–787. 663
Braeckman, U., Foshtomi, M.Y., Van Gansbeke, D., Meysman, F., Soetaert, K., Vincx, M., 664
Vanaverbeke, J., 2014. Variable importance of macrofaunal functional biodiversity 665
for biogeochemical cycling in temperate coastal sediments. Ecosystems 17, 720–737. 666
Braeckman, U., Provoost, P., Moens, T., Middelburg, J.J., Soetaert, K., Vincx, M., 667
Vanaverbeke, J., 2011. Biological vs. physical mixing effects on benthic food web 668
dynamics. Plos One 6, e18078. 669
Braeckman, U., Provoost, P., Sabbe, K., Middelburg, J.J., Soetaert, K., Vincx, M., 670
Vanaverbeke, J., 2012. Temporal variation in macrobenthic diet as inferred from fatty 671
acid biomarkers. J. Sea Res. 68, 6–19. 672
Braeckman, U., Vanaverbeke, J., Vincx, M., van Oevelen, D., Soetaert, K., 2013. Meiofauna 673
Metabolism in Suboxic Sediments: Currently Overestimated. Plos One 8, e59289. 674

MANUSCRIP
T
ACCEPTED
ACCEPTED MANUSCRIPT
21
Budge, S.M., Iverson, S.J., Koopman, H.N., 2006. Studying Trophic Ecology in Marine 675
Ecosystems Using Fatty Acids: A Primer on Analysis and Interpretation. Mar. 676
Mammal Sci. 22, 759–801. 677
Budge, S.M., Wooller, M.J., Springer, A.M., Iverson, S.J., McRoy, C.P., Divoky, G.J., 2008. 678
Tracing carbon flow in an arctic marine food web using fatty acid-stable isotope 679
analysis. Oecologia 157, 117–129. 680
Caramujo, M.-J., Boschker, H.T.S., Admiraal, W., 2008. Fatty acid profiles of algae mark the 681
development and composition of harpacticoid copepods. Freshw. Biol. 53, 77–90. 682
Carrie, R.H., Mitchell, L., Black, K.D., 1998. Fatty acids in surface sediment at the 683
Hebridean shelf edge, west of Scotland. Org. Geochem. 29, 1583–1593. 684
Clarke, K.R., Gorley, R.N., 2006. Primer v6: User Manual/Tutorial. PRIMER-E: Plymouth. 685
Claustre, H., Poulet, S.A., Williams, R., Marty, J.C., Coombs, S., Mlih, F.B., Hapette, A.M., 686
Jezequel-Martin, V., 1990. A biochemical investigation of a Phaeocystis sp. bloom in 687
the Irish Sea. J. Mar. Biol. Assoc. Uk 70, 197–207. 688
Dalsgaard, J., St. John, M., Kattner, G., Müller-Navarra, D., Hagen, W., 2003. Fatty acid 689
trophic markers in the pelagic marine environment. Academic Press, pp. 225–340. 690
Dame, R.F., 2011. Ecology of Marine Bivalves: An Ecosystem Approach, Second Edition. 691
CRC Press. 692
De Kluijver, A., Yu, J., Houtekamer, M., Middelburg, J.J., Liu, Z., 2012. Cyanobacteria as 693
carbon source for zooplankton in eutrophic Lake Taihu, China, measured by 13C 694
labeling and fatty acid biomarkers. Limnol. Ocean. 57, 1245. 695
Dubois, S., Blanchet, H., Garcia, A., Massé, M., Galois, R., Grémare, A., Charlier, K., 696
Guillou, G., Richard, P., Savoye, N., 2014. Trophic resource use by macrozoobenthic 697
primary consumers within a semi-enclosed coastal ecosystem: stable isotope and fatty 698
acid assessment. J. Sea Res. 88, 87–99. 699
Dubois, S., Orvain, F., Marin-Leal, J.C., Ropert, M., Lefebvre, S., 2007. Small-scale spatial 700
variability of food partitioning between cultivated oysters and associated suspension-701
feeding species, as revealed by stable isotopes. Mar. Ecol.-Prog. Ser. 336, 151–160. 702
Dunstan, G.A., Volkman, J.K., Barrett, S.M., Leroi, J.-M., Jeffrey, S.W., 1993. Essential 703
polyunsaturated fatty acids from 14 species of diatom (Bacillariophyceae). 704
Phytochemistry 35, 155–161. 705
Ezgeta-Balić, D., Najdek, M., Peharda, M., Blažina, M., 2012. Seasonal fatty acid profile 706
analysis to trace origin of food sources of four commercially important bivalves. 707
Aquaculture 334, 89–100. 708
Falk-Petersen, S., Hopkins, C.C.E., Sargent, J.R., 1990. Trophic relationships in the pelagic, 709
Arctic food web, in: Trophic Relationships in the Marine Environment. Proceedings 710
of 24th European Marine Biology Symposium. pp. 315–333. 711
Fettweis, M., Van den Eynde, D., 2003. The mud deposits and the high turbidity in the 712
Belgian-Dutch coastal zone, southern bight of the North Sea. Cont. Shelf Res. 23, 713
669–691. 714
Franco, M.A., Soetaert, K., Costa, M.J., Vincx, M., Vanaverbeke, J., 2008a. Uptake of 715
phytodetritus by meiobenthos using C-13 labelled diatoms and Phaeocystis in two 716
contrasting sediments from the North Sea. J. Exp. Mar. Biol. Ecol. 362, 1–8. 717
Franco, M.A., Soetaert, K., Van Oevelen, D., Van Gansbeke, D., Costa, M.J., Vincx, M., 718
Vanaverbeke, J., 2008b. Density, vertical distribution and trophic responses of 719
metazoan meiobenthos to phytoplankton deposition in contrasting sediment types. 720
Mar. Ecol.-Prog. Ser. 358, 51–62. 721
Freites, L., Fernández-Reiriz, M.J., Labarta, U., 2002. Fatty acid profiles of Mytilus 722
galloprovincialis (Lmk) mussel of subtidal and rocky shore origin. Comp. Biochem. 723
Physiol. B Biochem. Mol. Biol. 132, 453–461. 724

MANUSCRIP
T
ACCEPTED
ACCEPTED MANUSCRIPT
22
Giere, O., 2009. Meiobenthology: the microscopic motile fauna of aquatic sediments. 725
Springer Verlag. 726
Gladyshev, M.I., Sushchik, N.N., Kalachova, G.S., Makhutova, O.N., 2012. Stable Isotope 727
Composition of Fatty Acids in Organisms of Different Trophic Levels in the Yenisei 728
River. Plos One 7, e34059. 729
Gladyshev, M.I., Sushchik, N.N., Makhutova, O.N., Kalachova, G.S., 2014. Trophic 730
fractionation of isotope composition of polyunsaturated fatty acids in the trophic 731
chain of a river ecosystem, in: Doklady Biochemistry and Biophysics. Springer, pp. 732
4–5. 733
Gontikaki, E., van Oevelen, D., Soetaert, K., Witte, U., 2011. Food web flows through a sub-734
arctic deep-sea benthic community. Prog. Ocean. 91, 245–259. 735
Graeve, M., Albers, C., Kattner, G., 2005. Assimilation and biosynthesis of lipids in Arctic 736
Calanus species based on feeding experiments with a C-13 labelled diatom. J. Exp. 737
Mar. Biol. Ecol. 317, 109–125. 738
Graeve, M., Kattner, G., Piepenburg, D., 1997. Lipids in Arctic benthos: does the fatty acid 739
and alcohol composition reflect feeding and trophic interactions? Polar Biol. 18, 53–740
61. 741
Graf, G., 1992. Benthic-pelagic coupling: a benthic view. Ocean. Mar. Biol. 30, 149–190. 742
Guckert, J.B., Antworth, C.P., Nichols, P.D., White, D.C., 1985. Phospholipid, ester-linked 743
fatty acid profiles as reproducible assays for changes in prokaryotic community 744
structure of estuarine sediments. FEMS Microbiol. Lett. 31, 147–158. 745
Guilini, K., van Oevelen, D., D., Soetaert, K., Middelburg, J.J., Vanreusel, A., 2010. 746
Nutritional importance of benthic bacteria for deep-sea nematodes from the Arctic ice 747
margin: results of an isotope tracer experiment. Limnol. Oceanogr. 55, 1977–1989. 748
Guilini, K., Veit-Koehler, G., De Troch, M., Van Gansbeke, D., Vanreusel, A., 2013. 749
Latitudinal and temporal variability in the community structure and fatty acid 750
composition of deep-sea nematodes in the Southern Ocean. Prog. Oceanogr. 110, 80–751
92. 752
Hamm, C.E., Rousseau, V., 2003. Composition, assimilation and degradation of Phaeocystis 753
globosa-derived fatty acids in the North Sea. J. Sea Res. 50, 271–283. 754
Hartmann-Schröder, G., 1996. Annelida, Borstenwürmer, Polychaeta. Gustav Fischer. 755
Hasle, G.R., 1978. Settling: the inverted-microscope method. Monogr. Ocean. Methodol. 6, 756
88–96. 757
Heip, C., Vincx, M., Vranken, G., 1985. The ecology of marine nematodes. Ocean. Mar. 758
Biol. Annu. Rev. 23, 399–489. 759
Hendriks, I.E., van Duren, L.A., Herman, P.M., 2003. Effect of dietary polyunsaturated fatty 760
acids on reproductive output and larval growth of bivalves. J. Exp. Mar. Biol. Ecol. 761
296, 199–213. 762
Holohan, B.A., Klos, E.G., Oviatt, C.A., 1998. Population density, prey selection, and 763
predator avoidance of the burrowing anemone (Ceriantheopsis americanus) in 764
Narragansett Bay, Rhode Island. Estuaries 21, 466–469. 765
Honnens, H., Assheuer, T., Ehlers, R.-U., 2014. Enrichment of the nematode Panagrolaimus 766
sp., a potential live food for marine aquaculture, with essential n-3 fatty acids. Aquac. 767
Int. 22, 399–409. 768
Hughes, T.G., 1975. The sorting of food particles by Abra sp. (Bivalvia: Tellinacea). J. Exp. 769
Mar. Biol. Ecol. 20, 137–156. 770
Kelly, J.R., Scheibling, R.E., 2012. Fatty acids as dietary tracers in benthic food webs. Mar. 771
Ecol. Prog. Ser. 446, 1–22. 772
Koussoroplis, A.M., Bec, A., Perga, M.E., Koutrakis, E., Desvilettes, C., Bourdier, G., 2010. 773
Nutritional importance of minor dietary sources for leaping grey mullet Liza saliens 774

MANUSCRIP
T
ACCEPTED
ACCEPTED MANUSCRIPT
23
(Mugilidae) during settlement: insights from fatty acid d13C analysis. Mar. Ecol.-Prog. 775
Ser. 404, 207–217. 776
Kuerten, B., Frutos, I., Struck, U., Painting, S.J., Polunin, N.V.C., Middelburg, J.J., 2013a. 777
Trophodynamics and functional feeding groups of North Sea fauna: a combined stable 778
isotope and fatty acid approach. Biogeochemistry 113, 189–212. 779
Kuerten, B., Painting, S.J., Struck, U., Polunin, N.V.C., Middelburg, J.J., 2013b. Tracking 780
seasonal changes in North Sea zooplankton trophic dynamics using stable isotopes. 781
Biogeochemistry 113, 167–187. 782
Lancelot, C., Spitz, Y., Gypens, N., Ruddick, K., Becquevort, S., Rousseau, V., Lacroix, G., 783
Billen, G., 2005. Modelling diatom and Phaeocystis blooms and nutrient cycles in the 784
Southern Bight of the North Sea: the MIRO model. Mar. Ecol.-Prog. Ser. 289, 63–78. 785
Laws, E.A., Popp, B.N., Bidigare, R.R., Kennicutt, M.C., Macko, S.A., 1995. Dependence of 786
phytoplankton carbon isotopic composition on growth rate and [CO2]aq: Theoretical 787
considerations and experimental results. Geochim. Cosmochim. Acta 59, 1131–1138. 788
Leduc, D., 2009. Description of Oncholaimus moanae sp. nov. (Nematoda: Oncholaimidae), 789
with notes on feeding ecology based on isotopic and fatty acid composition. J. Mar. 790
Biol. Assoc. UK 89, 337–344. 791
Leduc, D., Brown, J.C.S., Bury, S.J., Lörz, A.-N., in press. High intraspecific variability in 792
the diet of a deep-sea nematode: Stable isotope and fatty acid analyses of 793
Deontostoma tridentum on Chatham rise, southwest pacific. Deep Sea Res. Part 794
Ocean. Res. Pap. doi:10.1016/j.dsr.2014.11.002 795
Leduc, D., Probert, P.K., 2009. The effect of bacterivorous nematodes on detritus 796
incorporation by macrofaunal detritivores: A study using stable isotope and fatty acid 797
analyses. J. Exp. Mar. Biol. Ecol. 371, 130–139. 798
Leduc, D., Probert, P.K., Duncan, A., 2009. A multi-method approach for identifying 799
meiofaunal trophic connections. Mar. Ecol. Prog. Ser. 383, 95–111. 800
Lefebvre, S., Marín Leal, J.C., Dubois, S., Orvain, F., Blin, J.-L., Bataillé, M.-P., Ourry, A., 801
Galois, R., 2009. Seasonal dynamics of trophic relationships among co-occurring 802
suspension-feeders in two shellfish culture dominated ecosystems. Estuar. Coast. 803
Shelf Sci. 82, 415–425. 804
Legeżyńska, J., Kędra, M., Walkusz, W., 2014. Identifying trophic relationships within the 805
high Arctic benthic community: how much can fatty acids tell? Mar. Biol. 161, 821–806
836. 807
Levin, L., Blair, N., DeMaster, D., Plaia, G., Fornes, W., Martin, C., Thomas, C., 1997. 808
Rapid subduction of organic matter by maldanid polychaetes on the North Carolina 809
slope. J. Mar. Res. 55, 595–611. 810
Levinton, J.S., 1991. Variable feeding behavior in three species of Macoma (Bivalvia: 811
Tellinacea) as a response to water flow and sediment transport. Mar. Biol. 110, 375–812
383. 813
Lins, L., da Silva, M.C., Hauquier, F., Esteves, A.M., Vanreusel, A., 2015. Nematode 814
community composition and feeding shaped by contrasting productivity regimes in 815
the Southern Ocean. Prog. Oceanogr. 816
Lorrain, A., Paulet, Y.M., Chauvaud, L., Savoye, N., Donval, A., Saout, C., 2002. 817
Differential d13C and d15N signatures among scallop tissues: implications for ecology 818
and physiology. J. Exp. Mar. Biol. Ecol. 275, 47–61. 819
Mansour, M.P., Holdsworth, D.G., Forbes, S.E., Macleod, C.K., Volkman, J.K., 2005. High 820
contents of 24:6(n-3) and 20:1(n-13) fatty acids in the brittle star Amphiura 821
elandiformis from Tasmanian coastal sediments. Biochem. Syst. Ecol. 33, 659–674. 822

MANUSCRIP
T
ACCEPTED
ACCEPTED MANUSCRIPT
24
Marcus, N.H., Boero, F., 1998. Minireview: the importance of benthic-pelagic coupling and 823
the forgotten role of life cycles in coastal aquatic systems. Limnol. Oceanogr. 763–824
768. 825
Maria, T.F., Vanaverbeke, J., Esteves, A.M., De Troch, M., Vanreusel, A., 2012. The 826
importance of biological interactions for the vertical distribution of nematodes in a 827
temperate ultra-dissipative sandy beach. Estuar. Coast. Shelf Sci. 97, 114–126. 828
Masood, A., Stark, K.D., Salem, N., 2005. A simplified and efficient method for the analysis 829
of fatty acid methyl esters suitable for large clinical studies. J. Lipid Res. 46, 2299–830
2305. 831
Mayor, D.J., Cook, K., Thornton, B., Walsham, P., Witte, U.F.M., Zuur, A.F., Anderson, 832
T.R., 2011. Absorption efficiencies and basal turnover of C, N and fatty acids in a 833
marine Calanoid copepod. Funct. Ecol. 25, 509–518. 834
McLeod, R.J., Hyndes, G.A., Hurd, C.L., Frew, R.D., 2013. Unexpected shifts in fatty acid 835
composition in response to diet in a common littoral amphipod. Mar. Ecol. Prog. Ser. 836
479, 1–12. 837
Middelburg, J.J., 2014. Stable isotopes dissect aquatic food webs from the top to the bottom. 838
Biogeosciences 11, 2357–2371. 839
Moens, T., Vincx, M., 1997. Observations on the feeding ecology of estuarine nematodes. J. 840
Mar. Biol. Assoc. UK 77, 211–227. 841
Monroig, Ó., Tocher, D.R., Navarro, J.C., 2013. Biosynthesis of Polyunsaturated Fatty Acids 842
in Marine Invertebrates: Recent Advances in Molecular Mechanisms. Mar. Drugs 11, 843
3998–4018. 844
Murphy, D.E., Abrajano, T.A., 1994. Carbon Isotope Compositions of Fatty Acids in Mussels 845
from Newfoundland Estuaries. Estuar. Coast. Shelf Sci. 39, 261–272. 846
Muylaert, K., Gonzales, R., Franck, M., Lionard, M., Van der Zee, C., Cattrijsse, A., Sabbe, 847
K., Chou, L., Vyverman, W., 2006. Spatial variation in phytoplankton dynamics in 848
the Belgian coastal zone of the North Sea studied by microscopy, HPLC-CHEMTAX 849
and underway fluorescence recordings. J. Sea Res. 55, 253–265. 850
Nascimento, F.J., Karlson, A.M., Näslund, J., Elmgren, R., 2011. Diversity of larger 851
consumers enhances interference competition effects on smaller competitors. 852
Oecologia 166, 337–347. 853
Nascimento, F.J., Näslund, J., Elmgren, R., 2012. Meiofauna enhances organic matter 854
mineralization in soft sediment ecosystems. Limnol. Oceanogr. 57, 338. 855
Okamura, B., 1990. Behavioural Plasticity in the Suspension Feeding of Benthic Animals, in: 856
Hughes, R.N. (Ed.), Behavioural Mechanisms of Food Selection, NATO ASI Series. 857
Springer Berlin Heidelberg, pp. 637–660. 858
Pape, E., van Oevelen, D., Moodley, L., Soetaert, K., Vanreusel, A., 2013. Nematode feeding 859
strategies and the fate of dissolved organic matter carbon in different deep-sea 860
sedimentary environments. Deep Sea Res. Part Ocean. Res. Pap. 80, 94–110. 861
Parrish, C., Abrajano, T., Budge, S., Helleur, R., Hudson, E., Pulchan, K., Ramos, C., 2000. 862
Lipid and Phenolic Biomarkers in Marine Ecosystems: Analysis and Applications, in: 863
Marine Chemistry. pp. 193–223. 864
Parrish, C.C., 2013. Lipids in Marine Ecosystems. Int. Sch. Res. Not. 2013, e604045. 865
Pernet, V., Gavino, V., Gavino, G., Anctil, M., 2002. Variations of lipid and fatty acid 866
contents during the reproductive cycle of the anthozoan Renilla koellikeri. J. Comp. 867
Physiol. B 172, 455–465. 868
Provoost, P., Braeckman, U., Vanaverbeke, J., Middelburg, J.J., Soetaert, K., 2013. Benthic 869
oxygen consumption and benthic-pelagic coupling at a shallow station in the Southern 870
North Sea. Estuar. Coast. Shelf Sci. 120, 1–11. 871

MANUSCRIP
T
ACCEPTED
ACCEPTED MANUSCRIPT
25
Ramos, C.S., Parrish, C.C., Quibuyen, T.A.O., Abrajano, T.A., 2003. Molecular and carbon 872
isotopic variations in lipids in rapidly settling particles during a spring phytoplankton 873
bloom. Org. Geochem. 34, 195–207. 874
Rhoads, D.C., 1974. Organism-Sediment Relations on the Muddy Sea Floor. Ocean. Mar. 875
Biol. 12, 263–300. 876
Richoux, N.B., Vermeulen, I., Froneman, P.W., 2014. Fatty acid profiles reveal temporal and 877
spatial differentiation in diets within and among syntopic rocky shore suspension-878
feeders. Mar. Ecol. Prog. Ser. 495, 143–160. 879
Rousseau, V., Becquevort, S., Parent, J.Y., Gasparini, S., Daro, M.H., Tackx, M., Lancelot, 880
C., 2000. Trophic efficiency of the planktonic food web in a coastal ecosystem 881
dominated by Phaeocystis colonies. J. Sea Res. 43, 357–372. 882
Rousseau, V., Leynaert, A., Daoud, N., Lancelot, C., 2002. Diatom succession, silicification 883
and silicic acid availability in Belgian coastal waters (Southern North Sea). Mar. 884
Ecol.-Prog. Ser. 236, 61–73. 885
Rousseau, V., Mathot, S., Lancelot, C., 1990. Calculating carbon biomass of Phaeocystis sp. 886
from microscopic observations. Mar. Biol. 107, 305–314. 887
Rousseau, V., Park, Y., Ruddick, K., Vyverman, W., Parent, J.-Y., Lancelot, C., Rousseau, 888
V., Lancelot, C., Cox, D., 2006. Phytoplankton blooms in response to nutrient 889
enrichment 45–59. 890
Ruess, L., Tiunov, A., Haubert, D., Richnow, H.H., Häggblom, M.M., Scheu, S., 2005. 891
Carbon stable isotope fractionation and trophic transfer of fatty acids in fungal based 892
soil food chains. Soil Biol. Biochem. 37, 945–953. 893
Sargent, J.R., Whittle, K.J., 1981. Lipids and hydrocarbons in the marine food web. 894
Longhurst Ar Ed 1981 Anal. Mar. Ecosyst. 491–533. 895
Schaal, G., Riera, P., Leroux, C., 2008. Trophic coupling between two adjacent benthic food 896
webs within a man-made intertidal area: a stable isotopes evidence. Estuar. Coast. 897
Shelf Sci. 77, 523–534. 898
Schlechtriem, C., Tocher, D.R., Dick, J.R., Becker, K., 2004. Incorporation and metabolism 899
of fatty acids by desaturation and elongation in the nematode, Panagrellus redivivus. 900
Nematology 6, 783–796. 901
Steyaert, M., 2003. Spatial and temporal scales of nematode communities in the North Sea 902
and Westerschelde. Phd Thesis Ghent Univ. Ghent Belg. 114 pp. 903
Sun, M.Y., Aller, R.C., Lee, C., Wakeham, S.G., 1999. Enhanced degradation of algal lipids 904
by benthic macrofaunal activity: Effect of Yoldia limatula. J. Mar. Res. 57, 775–804. 905
Thurber, A.R., 2014. Diet-dependent incorporation of biomarkers: implications for food-web 906
studies using stable isotope and fatty acid analyses with special application to 907
chemosynthetic environments. Mar. Ecol. n/a–n/a. 908
Treignier, C., Tolosa, I., Grover, R., Reynaud, S., Ferrier-Pagès, C., 2009. Carbon isotope 909
composition of fatty acids and sterols in the scleractinian coral Turbinaria reniformis: 910
Effect of light and feeding. Limnol. Oceanogr. 54, 1933–1940. 911
Van Colen, C., Montserrat, F., Verbist, K., Vincx, M., Steyaert, M., Vanaverbeke, J., 912
Herman, P.M.J., Degraer, S., Ysebaert, T., 2009. Tidal flat nematode responses to 913
hypoxia and subsequent macrofauna- mediated alterations of sediment properties. 914
Mar. Ecol.-Prog. Ser. 381, 189–197. 915
Van den Meersche, K., Van Rijswijk, P., Soetaert, K., Middelburg, J.J., 2009. Autochthonous 916
and allochthonous contributions to mesozooplankton diet in a tidal river and estuary: 917
Integrating carbon isotope and fatty acid constraints. Limnol. Oceanogr. 918
Van Gaever, S., Moodley, L., Pasotti, F., Houtekamer, M., Middelburg, J.J., Danovaro, R., 919
Vanreusel, A., 2009. Trophic specialisation of metazoan meiofauna at the Häkon 920

MANUSCRIP
T
ACCEPTED
ACCEPTED MANUSCRIPT
26
Mosby Mud Volcano: fatty acid biomarker isotope evidence. Mar. Biol. 156, 1289–921
1296. 922
Van Hoey, G., Degraer, S., Vincx, M., 2004. Macrobenthic community structure of soft-923
bottom sediments at the Belgian Continental Shelf. Estuar. Coast. Shelf Sci. 59, 599–924
613. 925
Van Nugteren, P., Herman, P.M., Moodley, L., Middelburg, J.J., Vos, M., Heip, C.H.., 2009. 926
Spatial distribution of detrital resources determines the outcome of competition 927
between bacteria and a facultative detritivorous worm. Limnol. Oceanogr. 54, 1413–928
1419. 929
Van Oevelen, D., Soetaert, K., Franco, M.A., Moodley, L., van IJzerloo, L., Vincx, M., 930
Vanaverbeke, J., 2009. Organic matter input and processing in two contrasting North 931
Sea sediments: insights from stable isotope and biomass data. Mar. Ecol.-Prog. Ser. 932
380, 19–32. 933
Van Oevelen, D., Soetaert, K., Heip, C., 2012. Carbon flows in the benthic food web of the 934
Porcupine Abyssal Plain: The (un) importance of labile detritus in supporting 935
microbial and faunal carbon demands. Limnol Oceanogr. 57, 645–664. 936
Vanaverbeke, J., Merckx, B., Degraer, S., Vincx, M., 2011. Sediment-related distribution 937
patterns of nematodes and macrofauna: Two sides of the benthic coin? Mar. Environ. 938
Res. 71, 31–40. 939
Vanaverbeke, J., Soetaert, K., Vincx, M., 2004. Changes in morphometric characteristics of 940
nematode communities during a spring phytoplankton bloom deposition. Mar. Ecol.-941
Prog. Ser. 273, 139–146. 942
Veit-Köhler, G., Guilini, K., Peeken, I., Quillfeldt, P., Mayr, C., 2013. Carbon and nitrogen 943
stable isotope signatures of deep-sea meiofauna follow oceanographical gradients 944
across the Southern Ocean. Prog. Oceanogr. 110, 69–79. 945
Ventrella, V., Pirini, M., Pagliarani, A., Trombetti, F., Manuzzi, M.P., Borgatti, A.R., 2008. 946
Effect of temporal and geographical factors on fatty acid composition of M. 947
galloprovincialis from the Adriatic sea. Comp. Biochem. Physiol. B Biochem. Mol. 948
Biol. 149, 241–250. 949
Viso, A.C., Marty, J.C., 1993. Fatty acids from 28 marine microalgae. Phytochemistry 34, 950
1521–1533. 951
Volkman, J.K., Jeffrey, S.W., Nichols, P.D., Rogers, G.I., Garland, C.D., 1989. Fatty acid 952
and lipid composition of 10 species of microalgae used in mariculture. J. Exp. Mar. 953
Biol. Ecol. 128, 219–240. 954
Wacker, A., Von Elert, E., 2003. Food quality controls reproduction of the zebra mussel 955
(Dreissena polymorpha). Oecologia 135, 332–338. 956
Ward, E.J., Shumway, S.E., 2004. Separating the grain from the chaff: particle selection in 957
suspension-and deposit-feeding bivalves. J. Exp. Mar. Biol. Ecol. 300, 83–130. 958
Watts, J.L., Browse, J., 2002. Genetic dissection of polyunsaturated fatty acid synthesis in 959
Caenorhabditis elegans. Proc. Natl. Acad. Sci. 99, 5854–5859. 960
Weisse, T., Tande, K., Verity, P., Hansen, F., Gieskes, W., 1994. The trophic significance of 961
Phaeocystis blooms. J. Mar. Syst. 5, 67–79. 962
Wieking, G., Kröncke, I., 2005. Is benthic trophic structure affected by food quality? The 963
Dogger Bank example. Mar. Biol. 146, 387–400. 964
Wieser, W., 1953. Die Beziehung zwischen Mundhöhlengestalt, Ernährungsweise und 965
Vorkommen bei freilebenden marinen Nematoden. Eine ökologisch-morphologische 966
Studie. Ark. Zool. 4, 439–483. 967
Woulds, C., Middelburg, J.J., Cowie, G.L., 2014. Alteration of organic matter during infaunal 968
polychaete gut passage and links to sediment organic geochemistry. Part II: Fatty 969
acids and aldoses. Geochim. Cosmochim. Acta 136, 38–59. 970

MANUSCRIP
T
ACCEPTED
ACCEPTED MANUSCRIPT
27
971
FIGURE LEGENDS 972
973
Figure 1: Seasonal variation in A. Diatom (●) and Dinoflagellate (x10 for clarity purposes) (○) cell 974
density in suspended matter; B. Phaeocystis cell density in suspended matter; C. Average ± SE (n = 3) 975
integrated chlorophyll-a content in suspended matter ± SE (15.5 m) (●) and sediment (4 cm) (▲); D. 976
Average ± SE (n = 3) % organic carbon in suspended matter (●) and in sediment (x5) (▲), and E. 977
average ± SE (n = 3) integrated polar lipids in suspended matter (●) and sediment (x5 for clarity 978
purposes) (▲). 979
Figure 2: Principal Coordinates plots of lipid composition of suspended particulate matter in the 980
water column (A: relative abundances; C: δ13C signature) and sediment (B: relative abundances; D: 981
δ13C signature). Symbol colours represent the time course (18/2 ○ 15/3 ○ 14/4 ○ 27/4 ● 22/6 ● 20/9 982
● ). Vectors represent specific FA biomarkers correlagng > 80% (composigon in sediment) – 90% 983
(composition SPM in water column) with the first 2 PCO axes or represent all selected biomarkers 984
(δ13C of FA in SPM in water column). 985
Figure 3: PCO analysis of total (A) and relative (B) abundance of fatty acids in Sabatieria spp. (∆) and 986
‘other nematodes’ (○). Vectors represent specific FA biomarkers correlagng > 75% (relagve) - 85% 987
(total) with the first 2 PCO axes. 988
Figure 4: Total Fatty Acids (µg ind.-1) in ‘other nematodes’ and Sabatieria at the surface (0-1 cm; ●) 989
and in deep sediment (3-4 cm; ●). 990
Figure 5: PCO analysis of δ13C signatures of selected nematode fatty acid biomarkers. Sabatieria spp. 991
(∆) and ‘other nematodes’ (○). Colour codes: 18/2 □ 15/3 ■ 30/3 ■ 14/4 ■ 27/4 ■ 17/5 ■ 22/6 ■ 20/9 992
■). All biomarkers included in the analysis are shown as vectors. 993
Figure 6: Total FA in neutral lipid (■) and polar lipid (■) fraction in Abra alba, Owenia fusiformis and 994
Sagartia sp. 995
Figure 7: PCO analysis of relative abundance (A) and δ13C signature (B) of FA in Neutral Lipids in Abra 996
alba (∆), Owenia fusiformis (□) and Sagartia sp. (○) over the gme course (colour codes: 18/2 □ 15/3 997
□ 14/4 □ 27/4 ■ 22/6 ■ 20/9 ■ ). Vectors represent specific FA biomarkers correlating > 80% with 998
the first 2 PCO axes (A) or represent all selected FA biomarkers (B). 999
TABLES 1000
Table 1. Overview of sampling occasions and sampled food web compartments 1001

MANUSCRIP
T
ACCEPTED
ACCEPTED MANUSCRIPT
28
Date Julian day Sample
19/02/2010 49 SPM, sediment, nematodes, macrofauna (no Owenia)
15/03/2010 74 SPM, sediment, nematodes, macrofauna (no Abra)
30/03/2010 89 Nematodes
14/04/2010 104 SPM, sediment, nematodes, macrofauna
27/04/2010 117 SPM, sediment, nematodes, macrofauna
17/05/2010 137 Nematodes
22/06/2010 173 SPM, sediment, nematodes, macrofauna
20/09/2010 263 SPM, sediment, nematodes, macrofauna
1002
1003

MANUSCRIP
T
ACCEPTED
ACCEPTED MANUSCRIPT
29
Table 2: Most important PLFA biomarkers in phytoplankton 1004
1005
1006
Polar Lipid Fatty Acid biomarker Group Reference
Short branched PL: i-14:0, i-15:0,
ai-15:0, i-16:0, -i17:0, ai-17:0
bacterial: Cytophaga –
Flavobacteria and Gram-positive
bacteria
Dalsgaard et al., 2003
18:1ω7c bacterial, mainly Gram-negative
Proteobacteria
16:1ω7c diatoms, bacteria Dalsgaard et al., 2003
16:4ω1 diatoms Viso and Marty 1993;
Dunstan et al., 1993
16:2, 16:3 diatoms Ahlgren et al. 1992; Dunstan
et al. 1993; Volkman et al.
1989
20:5ω3 (EPA), 22:5ω3 diatoms (Bacillariophyceae) Volkman et al., 1989;
Ahlgren et al., 1992;
Dunstan et al., 1993
18 :1ω9c Phaeocystis Al-Hasan et al. 1990;
Claustre et al. 1990
High amounts of 18:5ω3 and 18-
PUFA in general
Phaeocystis, dinoflagellates Dalsgaard et al., 2003;
Hamm and Rousseau 2003
22:6ω3 (DHA) dinoflagellates, Phaeocystis
Dalsgaard et al., 2003
20:1ω9, 22:1ω11 carnivorous feeding (directly or
indirectly on copepods)
Budge et al. 2006; Dalsgaard
et al. 2003; Mansour et al.
2005
High 18 :1ω9/18 :1ω7 and
DHA/EPA ratio
carnivorous feeding Dalsgaard et al. 2003; Falk-
Petersen et al. 1990; Graeve
et al. 1997

MANUSCRIP
T
ACCEPTED
ACCEPTED MANUSCRIPT
30
Table 3. Results of PERMANOVA tests for differences in fatty acid abundance, composition and δ13C 1007
signature in suspended matter in the water column (Polar Lipid fraction), sediment (Polar Lipid 1008
fraction), nematodes (total lipids) and macrofauna (Neutral Lipid fraction). Only factors and/or 1009
interactions significantly (at p < 0.05) distinguishing groups are displayed. 1010
Compartment Parameter Factor pseudo-F p (perm)
Water PLFA Total abundance (µg L-1) Date 60.53 0.001
Composition (%) Date 30.05 0.001
δ13C Date 12.52 0.001
Sediment PLFA Total (µg g-1) Date 3.19 0.027
Composition (%) Date 4.10 0.001
Nematodes TL Total (µg ind.-1) Species x Date 3.57 0.013
Depth 6.66 0.019
Absolute concentration (µg
ind.-1) Species x Depth 3.16 0.019
Species x Date 2.36 0.003
Composition (%) Species 9.44 0.001
Date 4.19 0.001
δ13C Species x Date 2.17 0.012
Macrofauna NLFA+PLFA Total (µg ind.-1) Species x Date 4.45 0.027
% NLFA of NLFA+PLFA Species 3.19 0.049
Date 4.00 0.048
Macrofauna NLFA Total (µg ind.-1) Species x Date 4.68 0.016
Composition (%) Species x Date 2.04 0.006
δ13C Species 6.51 0.001
Date 7.16 0.003
1011
Appendix Table: see Excel file 1012

MANUSCRIP
T
ACCEPTED
ACCEPTED MANUSCRIPT
0500000
100000015000002000000
0 100 200 300
Dia
tom
s: c
ells
l−1
Din
o: c
ells
l−1x1
0
A. Diatoms and Dinoflagellates
0e+001e+072e+073e+07
0 100 200 300ce
lls l−1
B. Phaeocystis
0300600900
1200
0 100 200 300
mg
m−2
C. Chlorophyll−a
2468
0 100 200 300
wat
er: %
sedi
men
t: %
x5
D. % Carbon
50010001500
0 100 200 300Julian Day
wat
er: m
g m
−2
sedi
men
t: m
g m
−2 x
5
E. Total PLFA
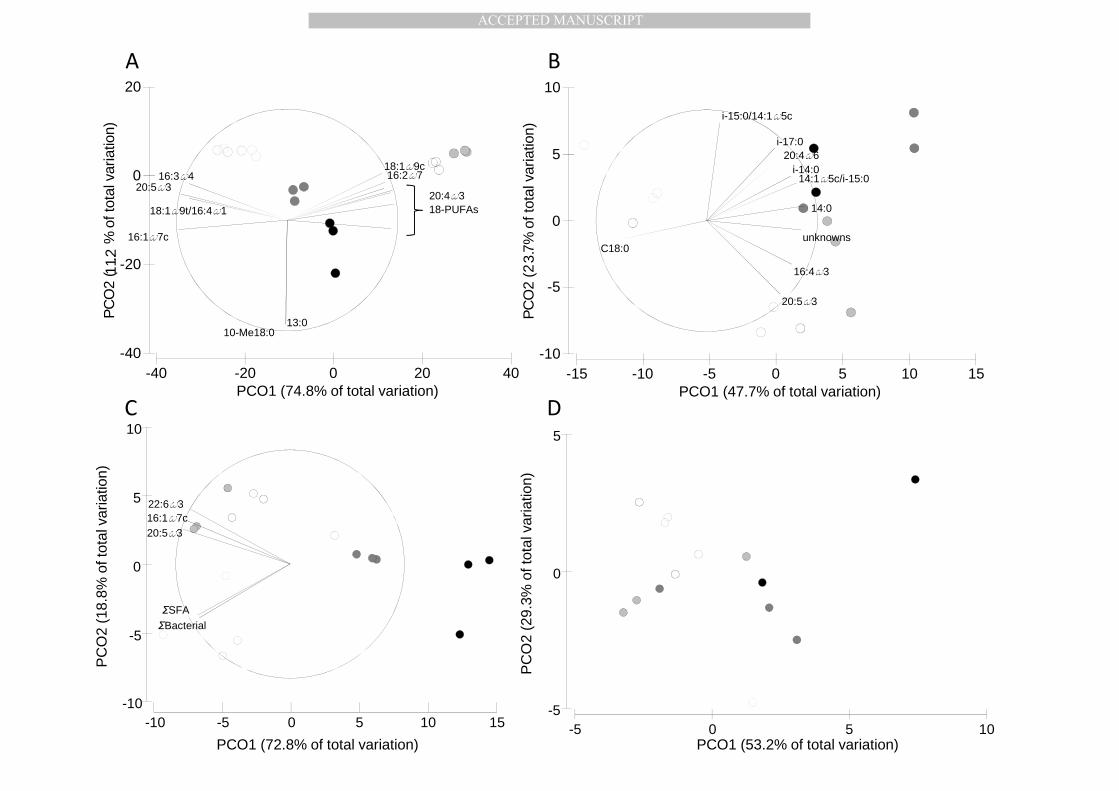
MANUSCRIP
T
ACCEPTED
ACCEPTED MANUSCRIPT
-40 -20 0 20 40PCO1 (74.8% of total variation)
-40
-20
0
20
PC
O2
( 11..
2%
ofto
talv
aria
tion)
10-Me18:013:0
16:1ω7c
16:2ω716:3ω418:1ω9c
18:1ω9t/16:4ω1 18-PUFAs20:4ω3
20:5ω3
-15 -10 -5 0 5 10 15PCO1 (47.7% of total variation)
-10
-5
0
5
10
PC
O2
(23.
7%of
tota
lvar
iatio
n)
14:0
14:1ω5c/i-15:0
16:4ω3
C18:0
20:4ω6
20:5ω3
unknowns
i-14:0
i-15:0/14:1ω5c
i-17:0
A B
C D
-5 0 5 10PCO1 (53.2% of total variation)
-5
0
5
PC
O2
(29.
3% o
f tot
al v
aria
tion)
-10 -5 0 5 10 15-10
-5
0
5
10
ΣBacterial
16:1ω7c20:5ω3
22:6ω3
ΣSFA
PCO1 (72.8% of total variation)
PC
O2
(18.
8% o
f tot
al v
aria
tion)

MANUSCRIP
T
ACCEPTED
ACCEPTED MANUSCRIPT
A B
-40 -20 0 20 40 60PCO1 (63.1% of total variation)
-20
0
20
40
60
PCO
2(1
4.8%
ofto
talv
aria
tion)
ai-17:0
13 tri methyl
15:0
16:0
16:1ω7c
17:0
18:1ω7c
18:1ω9c18:2ω6c18:3ω3
18:4ω3/ 20:0
18:5ω320:5ω3
22:2(350)
22:5ω322:6ω3
i-17:0
-20 0 20 40 60PCO1 (49.2% of total variation)
-20
0
20
PCO
2(1
4.2
%of
tota
lvar
iatio
n)
16:0
18:020:5ω3
22:6ω3
unknowns

MANUSCRIP
T
ACCEPTED
ACCEPTED MANUSCRIPT
‘other nematodes’ Sabatieria
0.1
0.2
0.3
0.4
0 100 200 300 0 100 200 300Julian Day
µg
ind−1
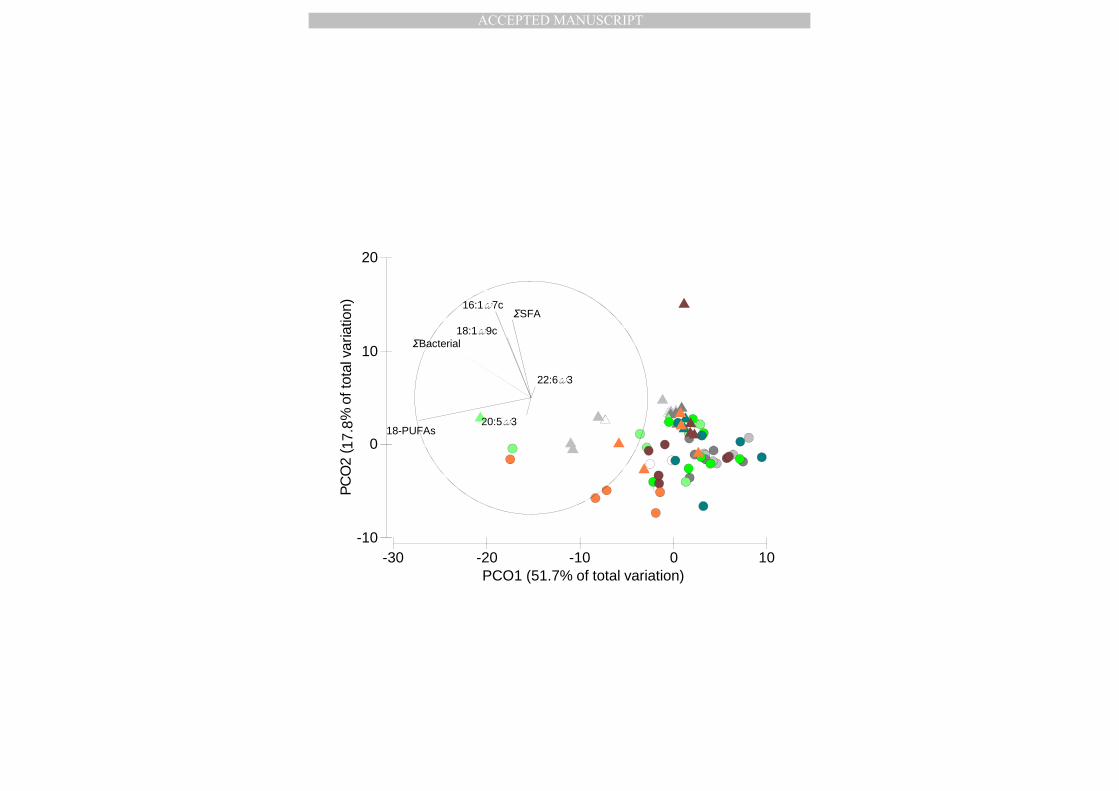
MANUSCRIP
T
ACCEPTED
ACCEPTED MANUSCRIPT
-30 -20 -10 0 10PCO1 (51.7% of total variation)
-10
0
10
20
PC
O2
( 17.
8%of
tota
lvar
iatio
n)ΣBacterial
16:1ω7c
18:1ω9c
18-PUFAs20:5ω3
22:6ω3
ΣSFA

MANUSCRIP
T
ACCEPTED
ACCEPTED MANUSCRIPT

MANUSCRIP
T
ACCEPTED
ACCEPTED MANUSCRIPT
-20 -15 -10 -5 0 5 10PCO1 (74.4% of total variation)
-10
-5
0
5
10
PC
O2
(17 .3
%of
tota
lvar
iatio
n)
ΣBacterial
20:5ω3
22:6ω3
A B
-40 -20 0 20 40PCO1 (44,7% of total variation)
-40
-20
0
20
40
PCO
2(2
5,8%
ofto
talv
ariat
ion)
14:0
16:1ω7c
18:1ω9c
20:5ω322:5ω3
22:6ω3

MANUSCRIP
T
ACCEPTED
ACCEPTED MANUSCRIPT
Highlights
1. Benthic diet in Southern Bight of the North Sea was investigated with FA and CSIA.
2. Phytoplankton dynamics are mirrored in animal FA abundance, not in composition
3. Macrobenthic FA composition was consistent with literature on diet composition
4. Nematodes non-selectively accumulated deposited phytodetritus
5. There is no resource partitioning between the studied nematodes and macrobenthos

MANUSCRIP
T
ACCEPTED
ACCEPTED MANUSCRIPT
16:1ω7c 18-PUFAs 18:1ω9c 20:1ω9c
20:5ω3 22:6ω3 ΣBacterial ΣSFA
10
20
30
0
10
20
30
0
2
4
6
0.0
2.5
5.0
7.5
10
20
30
40
0
10
20
0
5
10
15
20
10
20
30
40
50
50 100 150 200 250 50 100 150 200 250 50 100 150 200 250 50 100 150 200 250Julian Day
FA c
once
ntra
tion
(%)
Species
Abra alba
Owenia fusiformis
Sagartia troglodytes
‘other nematodes’
Sabatieria
Sediment
Water

MANUSCRIP
T
ACCEPTED
ACCEPTED MANUSCRIPT
16:1ω7c 18-PUFAs 18:1ω9c 20:1ω9c
20:5ω3 22:6ω3 ΣBacterial ΣSFA
-30.0
-27.5
-25.0
-22.5
-30
-20
-10
0
-28
-26
-24
-36
-32
-28
-24
-33
-30
-27
-24
-21
-18
-28
-24
-20
-20
-10
-30
-25
-20
-15
-10
50 100 150 200 250 50 100 150 200 250 50 100 150 200 250 50 100 150 200 250Julian Day
δ13
C in
FA
bio
mar
kers
Species
Abra alba
Owenia fusiformis
Sagartia troglodytes
‘other nematodes’
Sabatieria
Sediment
Water
Related Documents