Temporal and Spatial Variations of Sea Surface Temperature and Chlorophyll a in Coastal Waters of North Carolina Team Members: Brittany Maybin Yao Messan Chelsea Goins Phillip Moore Mentor: Dr. Jinchun Yuan

Temporal and Spatial Variations of Sea Surface Temperature and Chlorophyll a in Coastal Waters of North Carolina Team Members: Brittany Maybin Yao Messan.
Dec 22, 2015
Welcome message from author
This document is posted to help you gain knowledge. Please leave a comment to let me know what you think about it! Share it to your friends and learn new things together.
Transcript

Temporal and Spatial Variations of Sea Surface Temperature and Chlorophyll a in Coastal Waters of North CarolinaTeam Members:Brittany MaybinYao MessanChelsea GoinsPhillip Moore
Mentor:Dr. Jinchun Yuan

Outline•Abstract•Background History•Data and Methodology•Results and Discussion
▫ Seasonal Variation of Chlorophyll a▫ Temporal Variation of area Averaged
Chlorophyll a and Sea Surface Temperature
▫ Animation of Chlorophyll a and Sea Surface Temperature Distributions
•Conclusion•Acknowledgement
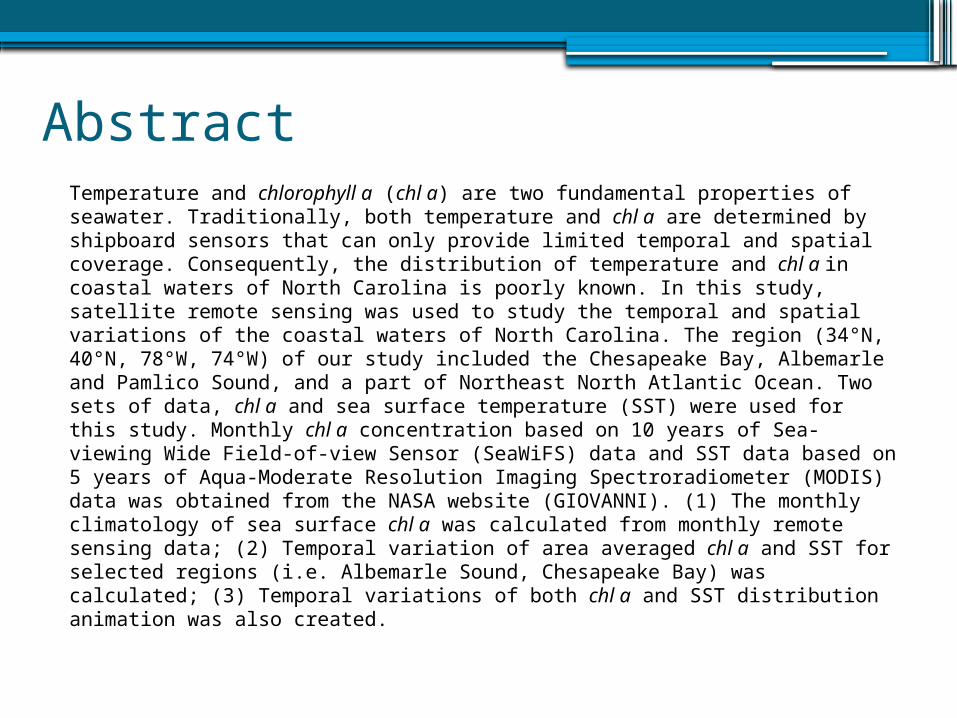
AbstractTemperature and chlorophyll a (chl a) are two fundamental properties of seawater. Traditionally, both temperature and chl a are determined by shipboard sensors that can only provide limited temporal and spatial coverage. Consequently, the distribution of temperature and chl a in coastal waters of North Carolina is poorly known. In this study, satellite remote sensing was used to study the temporal and spatial variations of the coastal waters of North Carolina. The region (34°N, 40°N, 78°W, 74°W) of our study included the Chesapeake Bay, Albemarle and Pamlico Sound, and a part of Northeast North Atlantic Ocean. Two sets of data, chl a and sea surface temperature (SST) were used for this study. Monthly chl a concentration based on 10 years of Sea-viewing Wide Field-of-view Sensor (SeaWiFS) data and SST data based on 5 years of Aqua-Moderate Resolution Imaging Spectroradiometer (MODIS) data was obtained from the NASA website (GIOVANNI). (1) The monthly climatology of sea surface chl a was calculated from monthly remote sensing data; (2) Temporal variation of area averaged chl a and SST for selected regions (i.e. Albemarle Sound, Chesapeake Bay) was calculated; (3) Temporal variations of both chl a and SST distribution animation was also created.

Background History • Chlorophyll a• Chesapeake Bay• Albemarle Sound
Chesapeake Bay
Albemarle Sound

Data and Methodology• Giovanni – an online visualization and analysis
tool that provides a simple and intuitive way to visualize, analyze, and access vast amounts of Earth science remote sensing data.
• Sea-viewing Wide Field-of-view Sensor (SeaWiFS) – provides quantitative data on global ocean bio-optical properties.
• Moderate Resolution Imaging Spectroradiometer (MODIS-Aqua) – is a key instrument aboard the Terra (EOS AM) and Aqua (EOS PM) satellites mapping the entire Earth's surface.

JanuaryThis image displays the distribution of chlorophyll a in the North Carolina coastal regions using SeaWiFS data. The data is averaged for the month of January during the years of 1998 to 2007. The chlorophyll a is measured in mg/m^3. The red part is the area that has a high chlorophyll a concentration, and the blue identifies the area with a low chlorophyll a concentration.
Example of SeaWiFS Data Collected to Calculate Chlorophyll a Concentration

Seasonal Variation of Chlorophyll a Concentration fromJanuary 1998 to December 2007

Chl a Concentrations of the Albemarle Sound from January 1998 December 2007

SST of the Albemarle Sound from July 2002 to February 2008

Chl a Concentrations of the Chesapeake Bay from January 1998 December 2007

SST of the Chesapeake Bay from July 2002 to February 2008

Animation of Sea Surface Temperature from July 2002 to February 2008
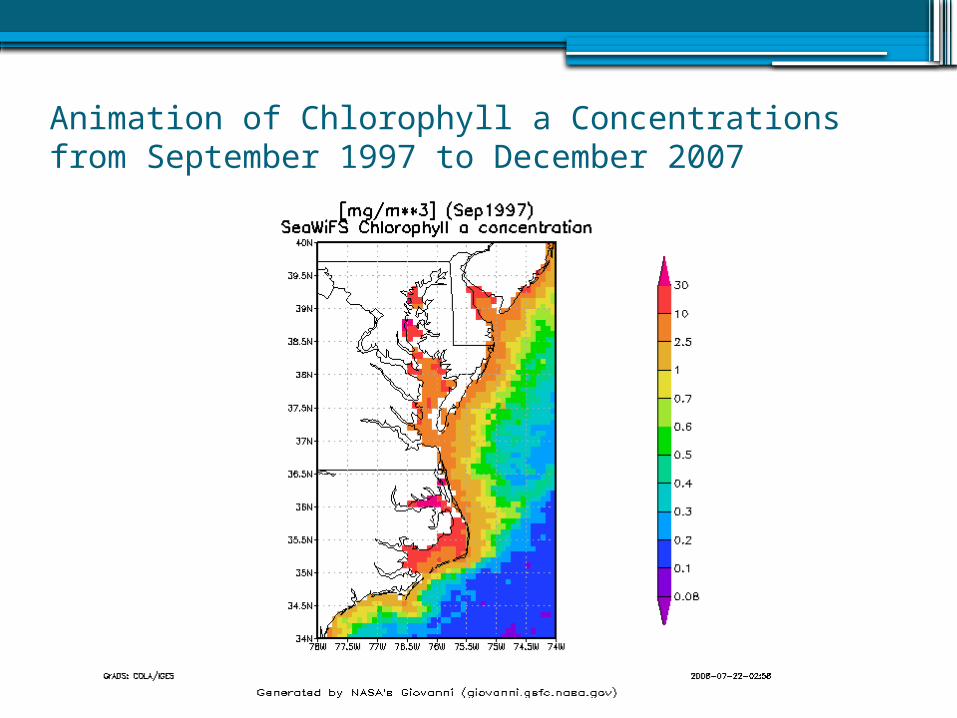
Animation of Chlorophyll a Concentrations from September 1997 to December 2007
Conclusion
• Before 2003, chlorophyll a concentrations in Chesapeake Bay were significantly lower than after 2003.
• Chl a concentrations are higher near the coast and lower in the open ocean.
• In the summer, the concentration of chlorophyll a is high on the coast but as the year progresses concentrations in the open ocean increase.
• SST reach high temperatures in the summer and lower temperatures in the winter.
• SST decreases moving farther north away from the equator.

Future Research
•Use the microwave scatterometer (QuikSCAT) data to calculate and correlate the sea surface winds to SST and chl a concentrations in this area
•Study the cause of the increase of chlorophyll a in Chesapeake Bay in 2003
•Factor any improvements to the Aqua-MODIS and SeaWiFS into our data

Acknowledgements
•We would like to thank our mentor Dr. Jinchun Yuan, Dr. Hayden, and the other mentors for their direction and guidance throughout this program. Your continued support was truly appreciated.

References• [1]Yuan, Dongliiang. (2007). Cross- Shelf Circulation in the Yellow
and east China Seas Indicated by MODIS Satellite Observations. Baton Rouge, Louisiana: Journal of Marine Systems
• [2]Shen, Suhung. (2007). Seasonal Variations of Chlorophyll a Concentration in the North South China Sea. Fairfax, Virginia: National Aeronautics and Space Administrations
• [3]Yuan, Jinchun. (2007). Comment on “Reduction of Production and Changing of Nutrient Ratio in the East China Sea: Effect of the Three Gorges Dam” by Gwo-Ching Gong et al. Elizabeth City, North Carolina: American Geophysical Union
• [4]Gong, Gwo-Ching. (2006). Reduction of Production and Changing of Nutrient Ratio in the East China Sea: Effect of the Three Gorges Keelung, Taiwan: American Geophysical Union.
Related Documents