Temporal and spatial trends of residential energy consumption and air pollutant emissions in China Dan Zhu, Shu Tao ⇑ , Rong Wang, Huizhong Shen, Ye Huang, Guofeng Shen, Bin Wang, Wei Li, Yanyan Zhang, Han Chen, Yuanchen Chen, Junfeng Liu, Bengang Li, Xilong Wang, Wenxin Liu Laboratory for Earth Surface Processes, College of Urban and Environmental Sciences, Peking University, Beijing 100871, China highlights " Two new concepts of HD and HDD p were introduced to predict residential fuel use. " Temporal variation of energy use was characterized by space-for-time substitution. " Residential energy use and pollutant emissions in China were mapped at 1° 1°. " Seasonality of energy use and pollutant emissions in China were characterized. " Effects of climate warming on energy use and pollutant emission were quantified. article info Article history: Received 13 September 2012 Received in revised form 2 December 2012 Accepted 14 January 2013 Available online 10 February 2013 Keywords: Residential energy Emission Climate warming Seasonality Space-for-time substitution abstract Residential energy consumptions of both electricity and fuels are associated with emissions of many air pollutants. Temporally and spatially resolved energy consumption data are scarce in China, which are critical for a better understanding of their environmental impacts. In this study, a space-for-time substi- tution method was proposed and two models for predicting fuel and electricity consumptions in residen- tial sector of China were developed using provincial data. It was found that fuel consumption was not directly proportional to heating degree day and was also affected by heating day, defined as the number of days when heating is required in a year. The models were validated against a set of historical annual data and two sets of survey data on seasonal variations. The models were applied to predict spatial and temporal variations of residential energy consumptions and emissions of various pollutants and to pre- dict net effects of climate warming on energy consumptions and pollutant emissions. The emissions of black carbon (BC), carbon monoxide (CO), and polycyclic aromatic carbons (PAHs) in winter were signif- icantly higher than those in other seasons. For the emissions of carbon dioxide (CO 2 ), sulfur dioxide (SO 2 ), and nitrogen oxides (NO x ), there were two peaks in winter and summer, with the latter increasing grad- ually over years. It was predicted that per-capita residential energy consumptions would reach 0.43, 0.33, and 0.26 toe/cap in 2050 for IPCC scenarios of A1B, B1, and A2, respectively. Climate warming in the future would lead to less residential fuel but more electricity consumptions. Consequently, emissions of BC, CO, and PAHs would decrease mainly in cold climate zones, while emissions of CO 2 , SO 2 , and NO x would increase largely in southeast China. Ó 2013 Elsevier Ltd. All rights reserved. 1. Introduction Energy is of fundamental importance to our society. However, the acquisition, production, and utilization of energy have great adverse impacts on environment by emitting pollutants, green- house gases, and heat [1]. A portion of energy, mainly electricity and fuels, is used in residential sector for heating, cooling, cooking, lighting, and appliances. According to the National Bureau of Sta- tistics of China, electricity and various fuels account for 11% and 89% of the total residential energy consumption in China, respec- tively [2]. Although the quantities of fuels, mainly coal and biomass fuel, used in residential sector contribute to a relatively small frac- tion of total energy consumption, the environmental impacts of residential fuel consumption cannot be ignored due to relatively low combustion efficiencies and high emission factors [3–6]. For example, it was estimated that over 50% of black carbon and approximately 70% of polycyclic aromatic hydrocarbons (PAHs) emitted in China were from residential fuel combustions [7,8]. Residential energy consumption is affected by temperature and socioeconomic conditions [9,10], both of which vary in space (hot or cold, rich or poor) and over time (month–month, year–year), 0306-2619/$ - see front matter Ó 2013 Elsevier Ltd. All rights reserved. http://dx.doi.org/10.1016/j.apenergy.2013.01.040 ⇑ Corresponding author. Tel.: +86 10 62751938. E-mail address: [email protected] (S. Tao). Applied Energy 106 (2013) 17–24 Contents lists available at SciVerse ScienceDirect Applied Energy journal homepage: www.elsevier.com/locate/apenergy

Welcome message from author
This document is posted to help you gain knowledge. Please leave a comment to let me know what you think about it! Share it to your friends and learn new things together.
Transcript
Temporal and spatial trends of residential energy consumption and airpollutant emissions in China
Dan Zhu, Shu Tao ⇑, Rong Wang, Huizhong Shen, Ye Huang, Guofeng Shen, Bin Wang, Wei Li,Yanyan Zhang, Han Chen, Yuanchen Chen, Junfeng Liu, Bengang Li, Xilong Wang, Wenxin LiuLaboratory for Earth Surface Processes, College of Urban and Environmental Sciences, Peking University, Beijing 100871, China
h i g h l i g h t s
" Two new concepts of HD and HDDp were introduced to predict residential fuel use." Temporal variation of energy use was characterized by space-for-time substitution." Residential energy use and pollutant emissions in China were mapped at 1! ! 1!." Seasonality of energy use and pollutant emissions in China were characterized." Effects of climate warming on energy use and pollutant emission were quantified.
a r t i c l e i n f o
Article history:Received 13 September 2012Received in revised form 2 December 2012Accepted 14 January 2013Available online 10 February 2013
Keywords:Residential energyEmissionClimate warmingSeasonalitySpace-for-time substitution
a b s t r a c t
Residential energy consumptions of both electricity and fuels are associated with emissions of many airpollutants. Temporally and spatially resolved energy consumption data are scarce in China, which arecritical for a better understanding of their environmental impacts. In this study, a space-for-time substi-tution method was proposed and two models for predicting fuel and electricity consumptions in residen-tial sector of China were developed using provincial data. It was found that fuel consumption was notdirectly proportional to heating degree day and was also affected by heating day, defined as the numberof days when heating is required in a year. The models were validated against a set of historical annualdata and two sets of survey data on seasonal variations. The models were applied to predict spatial andtemporal variations of residential energy consumptions and emissions of various pollutants and to pre-dict net effects of climate warming on energy consumptions and pollutant emissions. The emissions ofblack carbon (BC), carbon monoxide (CO), and polycyclic aromatic carbons (PAHs) in winter were signif-icantly higher than those in other seasons. For the emissions of carbon dioxide (CO2), sulfur dioxide (SO2),and nitrogen oxides (NOx), there were two peaks in winter and summer, with the latter increasing grad-ually over years. It was predicted that per-capita residential energy consumptions would reach 0.43, 0.33,and 0.26 toe/cap in 2050 for IPCC scenarios of A1B, B1, and A2, respectively. Climate warming in thefuture would lead to less residential fuel but more electricity consumptions. Consequently, emissionsof BC, CO, and PAHs would decrease mainly in cold climate zones, while emissions of CO2, SO2, andNOx would increase largely in southeast China.
" 2013 Elsevier Ltd. All rights reserved.
1. Introduction
Energy is of fundamental importance to our society. However,the acquisition, production, and utilization of energy have greatadverse impacts on environment by emitting pollutants, green-house gases, and heat [1]. A portion of energy, mainly electricityand fuels, is used in residential sector for heating, cooling, cooking,lighting, and appliances. According to the National Bureau of Sta-tistics of China, electricity and various fuels account for 11% and
89% of the total residential energy consumption in China, respec-tively [2]. Although the quantities of fuels, mainly coal and biomassfuel, used in residential sector contribute to a relatively small frac-tion of total energy consumption, the environmental impacts ofresidential fuel consumption cannot be ignored due to relativelylow combustion efficiencies and high emission factors [3–6]. Forexample, it was estimated that over 50% of black carbon andapproximately 70% of polycyclic aromatic hydrocarbons (PAHs)emitted in China were from residential fuel combustions [7,8].
Residential energy consumption is affected by temperature andsocioeconomic conditions [9,10], both of which vary in space (hotor cold, rich or poor) and over time (month–month, year–year),
0306-2619/$ - see front matter " 2013 Elsevier Ltd. All rights reserved.http://dx.doi.org/10.1016/j.apenergy.2013.01.040
⇑ Corresponding author. Tel.: +86 10 62751938.E-mail address: [email protected] (S. Tao).
Applied Energy 106 (2013) 17–24
Contents lists available at SciVerse ScienceDirect
Applied Energy
journal homepage: www.elsevier .com/locate /apenergy
resulting in spatial and temporal variations in residential energy con-sumptions. The concept of degree-day, defined as the accumulated de-gree deviations from predefined base temperatures, is widely appliedto characterize the relationship between energy use and temperature[11–14]. Both heating degree day (hdd) and cooling degree day (cdd)are used by assuming that the heating (or cooling) energy requirementis proportional to hdd (or cdd) [10,15,16]. However, this assumption isquestionable for hdd because an ‘initial fuel (a minimum quantity offuel to be used to start a fire for heating no matter how far the temper-ature below the base temperature)’ has to be consumed once the ambi-ent temperature drops below a given base temperature. Moreover,heating demand may not increase linearly as the difference betweenthe base and daily temperature increases.
In long term, rise in temperature due to climate warming mayalso lead to a change in residential energy consumption. The effectsof climate warming on energy consumptions have been demon-strated previously [17–19]. In general, reduction in heating require-ment would outweigh the increase in cooling requirement in regionswith cold climate, and vice versa in cooling-dominated hot climates[12,20]. For example, Pilli-Sihvola et al. found that in north and cen-tral Europe, electricity consumption would decrease since heatingdemand decreases as temperature rises, while in the south, incre-ment in summer cooling electricity would exceed the reduction inwinter heating [18]. Similar results were also found in Australia [19].
Effects of climate change on energy consumption in China havebeen investigated by several researchers [21–23]. Lam et al. developeda regression model to predict electricity consumed by air conditionersin Hong Kong based on meteorological variables, and concluded thataverage annual consumptions during the periods from 2039 to 2068and from 2069 to 2100 would be 12.8% and 18.4% higher than that from1979 to 2008 for B1 scenario [21]. However, the method can hardly beapplied to other parts of China due to lack of monthly data. Lam et al.and Wan et al. used principal component analysis to study heatingand cooling loads in office buildings in Hong Kong and other four citiesin China, and found a decreasing trend in heating load and an increas-ing trend in cooling load, with overall variations from 4.2% reduction inHarbin in north China to 4.3% increase in Hong Kong in south China[22,23]. To the best of our knowledge, no study has been conductedon energy consumptions in rural China thus far.
In this study, equivalency of spatial and temporal variations inresidential energy consumptions was proposed as a hypothesis tobe tested. Space-for-time method is occasionally used in plant suc-cession studies to infer the series of communities forming the suc-cession, based on the assumption that temporal dynamics in thecommunity are autogenic and thus all sites had the same trajectoryand endpoint. As such, a number of parameters, such as species com-position, dominance, and richness, were used as independent vari-ables in space-for-time studies of succession, to extrapolatetemporal trend based on the observations on different sites [24].For residential energy consumption, it is assumed that spatial andtemporal variations in energy use are primarily affected by a sameset of factors including ambient temperature and household income.If this assumption is hold, the difference in residential energy con-sumptions among various areas is comparable to the change overtime. Consequently, it is possible to develop regression modelsbased on spatial data and apply these models to predict the temporalchange over time (intra- and inter-annual) in the case when onlyspatial data, rather than temporal data, are available.
2. Methods
2.1. General approach
To test the hypothesis in this study, provincial data of annualresidential energy consumptions, ambient temperatures, and a
number of socioeconomic parameters from 2001 to 2007 were col-lected and used to identify the main factors affecting residentialfuel and electricity consumptions. Accordingly, multivariateregression models were developed for predicting energy consump-tions based on the key factors identified. After validation, the mod-els were applied to predict time trends (seasonal and inter-annual)and high resolution (1! ! 1!) spatial variations of residential en-ergy consumptions and pollutant emissions in China. The modelswere also used to characterize potential net effects of future cli-mate warming on residential energy consumptions and emissionsof CO2 and air pollutants in China.
2.2. Energy data
Residential energy was classified into fuels (crop residues, fire-wood, coal, liquefied petroleum gas (LPG), coal gas, natural gas,central heating) and electricity. Annual fuel and electricity con-sumptions for all provinces from 2001 to 2007 were collected[25]. Outliers (13%), defined as those with at least 35% relative dif-ference from the mean values of the previous and following years,were not included in the study, assuming that these data were re-corded with significant error. Fuels were all converted into heatvalues (Table S1) and added up as the total fuel consumptions.Per-capita consumptions of fuel (Fcap) and electricity (Ecap) are pre-sented as ton of oil equivalent (toe) per capita.
2.3. Modeling
A number of climate and socioeconomic parameters were tested fortheir influences on Fcap and Ecap using stepwise multiple regression. Theclimate parameters tested included two from the literature (hdd andcdd) and two defined in this study (heating day, HD, and power func-tion based hdd, HDDp). hdd (cdd) is heating (cooling) degree day definedasRk(Tb–Ti), where Tb and Ti are base and daily mean temperatures. Forhdd, k is 0 when Tb < Ti, or 1 when Tb P Ti. For cdd, k is"1 when Tb < Ti,or 0 when Tb P Ti. HD is defined as the number of days when daily tem-perature is below the base temperature and heating is required. To takeinto consideration of possible non-linear response of fuel consumptionto temperature, HDDp was introduced and defined as Rk(Tb–Ti)n. Thedeviation of the exponent (n), which was derived from least-square fit-ting, from 1 indicates non-linear relationship. The tested socioeco-nomic variables included per-capita gross domestic production(GDPcap, RMB), per-capita income (Icap, RMB), urbanization rate (Ru, ra-tio of urban population over total population), and energy intensity.Theoretically, energy consumptions should be affected by energy price[14,17]. However, electricity price in residential sector is not market-driven in China, which is controlled by government at a below-costprice and twisted by subsidies [26–28], and the result of a preliminarymodeling demonstrated that there is no significant effect of price onresidential electricity consumption in China. Moreover, biomass fuels,which dominate residential energy in rural China, are generally notcommercially available and are freely collected by users. Therefore,energy price was not taken into consideration in this study. As a re-sult, the model can only be used for such a specific case in China forthe modeled period. The effect of price on electricity consumptionwas taken into consideration in future predictions.
The models were validated against a set of annual consumptiondata not used in the model development (provincial data in 1995,1996, and 2000, and national data from 1991 to 2007) [29] and twosets of monthly consumption data of fuel and electricity from theliterature [30,31].
2.4. Climate and socioeconomic data
For hdd, 5 !C was adopted as the base temperature according to‘‘Code for Design of Heating, Ventilation and Air Conditioning’’
18 D. Zhu et al. / Applied Energy 106 (2013) 17–24
[32]. 25 !C was adopted as the base temperature for cdd based on atry-and-error approach. Annual hdd and cdd for a province werecalculated using population-weighted daily degree-days derivedfrom 1! ! 1! gridded temperature [33] and population data [34].The predicted monthly average temperatures from 2008 to 2050at 1! ! 1! resolution were from National Climate Center of China[35]. Data on population, income, and GDP at provincial level from2001 to 2007 were from Statistical Yearbooks [36]. Icap for eachprovince was calculated as population weighted average of per-ca-pita annual disposable income of urban residents and per-capitaannual net income of rural residents based on the classificationin the Yearbooks. For the county level predictions, Icap were calcu-lated using a GDPcap proxy (Supplementary S2) and Ru were esti-mated using a provincial data based regression model withGDPcap as the independent variable (R2 = 0.80, Supplementary S3).
2.5. Emission estimation
Emissions of CO2, CO, SO2, NOx, BC, and PAHs were derivedbased on the energy consumptions and corresponding emissionfactors (Table S2). To calculate emissions from residential fuel con-sumptions, fractions of fuel subtypes were collected (Tables S3 andS4). For electricity, power generation efficiency (Table S5) wasadopted to convert electricity to primary energy. The emissionsfrom hydro, nuclear, wind, and solar power stations were omitted,due to relatively small contributions to total energy consumptionand low emission factors. Proportions of coal-, oil-, and gas-firedpower plants were collected (Table S5). CO2 emission from biomassburning is not discussed because of the carbon neutrality [37].
2.6. Prediction
Residential energy consumptions from 2008 to 2050 were pre-dicted for IPCC scenarios of A1B, B1, and A2 using the models devel-oped in this study. The predicted monthly mean temperatures wereused for hdd and cdd calculations at each grid. The calculated provin-cial and national hdd and cdd were weighted by population, assum-ing that the spatial distribution of population will not changesignificantly. Future population data were from UN-DESA [38]. Icap
for the 3 scenarios from 2010 to 2050 were calculated (Supplemen-tary S2) based on the growth rate of GDPcap projected by CIESIN [39].According to NDRC [40], Ru will be 0.49, 0.63, 0.70, 0.74, and 0.79 in2010, 2020, 2030, 2040, and 2050, respectively, and those in otheryears were linearly interpolated. The influence of price on electricityconsumption was taken into consideration by subtracting a correc-tion value (1.4% for 2011–2015 and 0.75% for 2016–2050, respec-tively) from the annual growth rate of electricity consumption,which was derived from the estimated price increase rate (5% from2011 to 2015 and 2.68% from 2016 to 2050) [41] and an average priceelasticity of"0.28 [42]. To evaluate the potential impacts of climatewarming, residential energy consumptions and pollutant emissionswere calculated for both cases with and without climate warmingand the net effects of climate warming were estimated by the differ-ence between them. In the case without climate warming, averageHDDp, HD, and cdd during a period of 2001–2010 was adopted. Foremission prediction, although there is an increasing trend in usageof natural gas and LPG [25], these clean fuels are mainly used forcooking rather than heating, while climate change affects the latterpredominantly. Therefore, the fractions of fuel subtypes in 2007were used to calculate the net effects of climate warming on futureemissions.
2.7. Uncertainty analysis
The overall uncertainties of the model-predicted residential en-ergy consumptions and pollutant emissions were characterized
using Monte Carlo simulation, which was run 5000 times. Coeffi-cients of variation for the predicted HDDp, HD, cdd, Icap, and Ru wereassumed to be 0.05 in 2010 and to increase linearly to 0.2 by 2050.Coefficients of variation for price elasticity and price increase ratewere assumed to be 0.1. Medians and semi-interquartile ranges(R50, 75th " 25th percentiles range) were applied to present thepredicted results and the uncertainty.
3. Results and discussion
3.1. Modeling residential energy consumption
One of the most important factors affecting residential energyconsumptions is temperature because of heating and coolingrequirement [43]. Significant correlations (p < 0.05) were found be-tween Fcap and hdd and between Ecap and cdd for all data collected(Fig. S3). Linear correlation between per-capita residential coalconsumption and mean hdd for 29 Chinese cities was previouslyreported [44]. No significant correlation was found between Ecap
and hdd, likely due to the fact that electric heating is not commonlyused in China, especially in the north or rural areas where centralheating or residential stoves are still dominating [45].
The correlation between Fcap and HDDp with different n valueswere tested, and the largest correlation coefficient occurred whenn equaled to 0.9 (r = 0.80), indicating that the heating fuel demanddepends non-linearly on the difference between base and dailytemperature. As the temperature difference increases, the growthin heating energy consumption slows down. Moreover, it was real-ized that once the ambient temperature drops below the base tem-perature, a minimum quantity of ‘initial fuel’ has to be consumedno matter how cold it is. Therefore, HD was defined to describe ini-tial fuel in the model. Initial fuel concept can better simulate thesituation in the vast central heating-dominated regions. For exam-ple, only 11% and 27% of the households possess local space heatersin Urumqi and Xi’an, two typical northern cities, while districtheating is all-pervading [45].
In Fcap model, both HDDp and HD were significant (p < 0.05) inthe regression, while none of the socioeconomic parameters was.This is because heating and cooking are basic needs and free orcheap biomass fuels are readily available. A regression model withtwo independent variables of HD and HDDp was fitted to the datacollected in this study.
Fcap ¼ 5:95! 10"5HDDp þ 3:92! 10"4HDþ 0:147 R2 ¼ 0:66;
where n in the HDDp definition equals to 0.9, and 5.95, 3.92, and0.147 were regression coefficients derived from least-square fitting.
Unlike fuel consumptions, residential electricity consumptionsare affected by many socio-economic factors in addition to ambi-ent temperature. Of these factors, Icap, Ru, and cdd are significant(p < 0.05) in the stepwise multivariate regression. The significanceof cdd suggests the dependence of electricity consumed by air con-ditioning on temperature. However, it is recognized that the use ofair conditioners also depends on living standard [46]. Accordingly,a combined term of Icap
m%cdd was introduced empirically to replacecdd in the model to describe the influence of ambient temperatureas well as the interaction between temperature and economics.Using the data collected, the fitted equation is as follows:
Ecap ¼ 1:47! 10"6Icap þ 0:019Ru þ 4:96! 10"11I1:4cap % cddþ 0:0008
R2 ¼ 0:92:
For the equation, Icap alone can explain 91% of the Ecap variation,indicating that economic status is the primary factor affecting elec-tricity consumptions. The contributions of the other two variablesare orders of magnitude lower than that of Icap.
D. Zhu et al. / Applied Energy 106 (2013) 17–24 19
According to the results of the modeling, future consumption ofresidential electricity, but not residential fuels, will be affected sig-nificantly by anticipated economic development. The hidden cool-ing requirement would be further exploited, leading to a moresensitive response of electricity consumption to temperature rising.This is in accordance with the result revealed by Hekkenberg et al.,who indicated that existing heating demand has been met due tothe accessibility of heating fuels, while much of the cooling demandis still latent, and future economic development may change thetemperature dependence pattern of cooling energy [47].
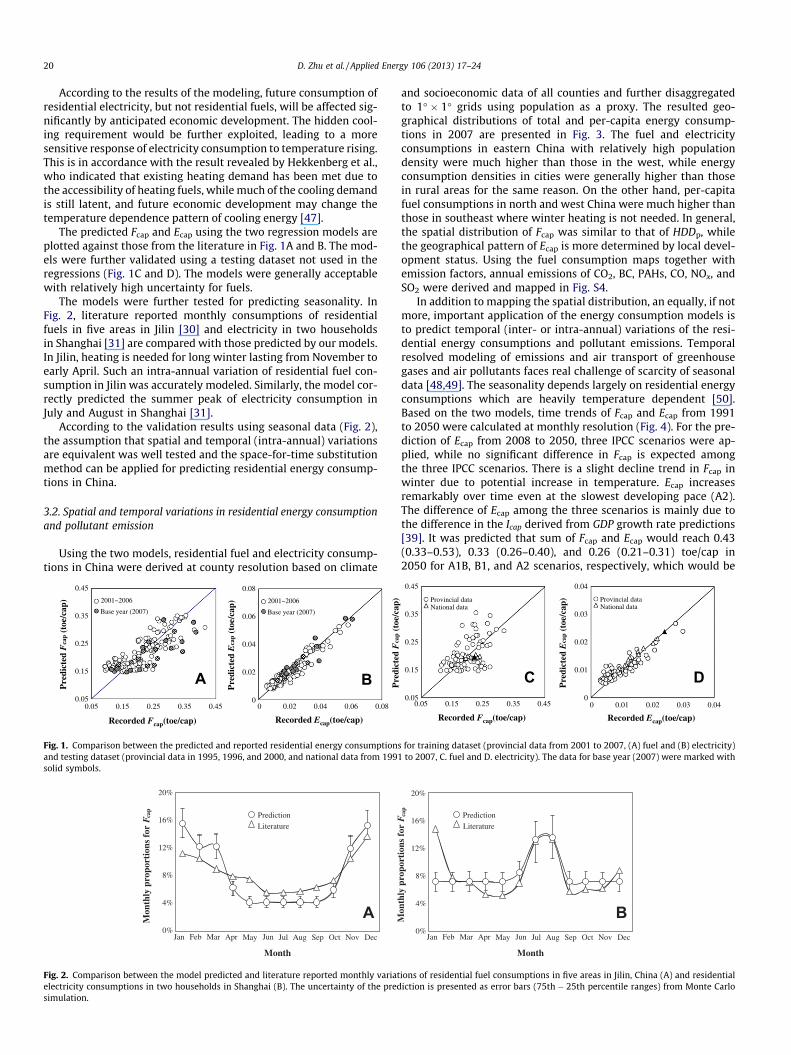
The predicted Fcap and Ecap using the two regression models areplotted against those from the literature in Fig. 1A and B. The mod-els were further validated using a testing dataset not used in theregressions (Fig. 1C and D). The models were generally acceptablewith relatively high uncertainty for fuels.
The models were further tested for predicting seasonality. InFig. 2, literature reported monthly consumptions of residentialfuels in five areas in Jilin [30] and electricity in two householdsin Shanghai [31] are compared with those predicted by our models.In Jilin, heating is needed for long winter lasting from November toearly April. Such an intra-annual variation of residential fuel con-sumption in Jilin was accurately modeled. Similarly, the model cor-rectly predicted the summer peak of electricity consumption inJuly and August in Shanghai [31].
According to the validation results using seasonal data (Fig. 2),the assumption that spatial and temporal (intra-annual) variationsare equivalent was well tested and the space-for-time substitutionmethod can be applied for predicting residential energy consump-tions in China.
3.2. Spatial and temporal variations in residential energy consumptionand pollutant emission
Using the two models, residential fuel and electricity consump-tions in China were derived at county resolution based on climate
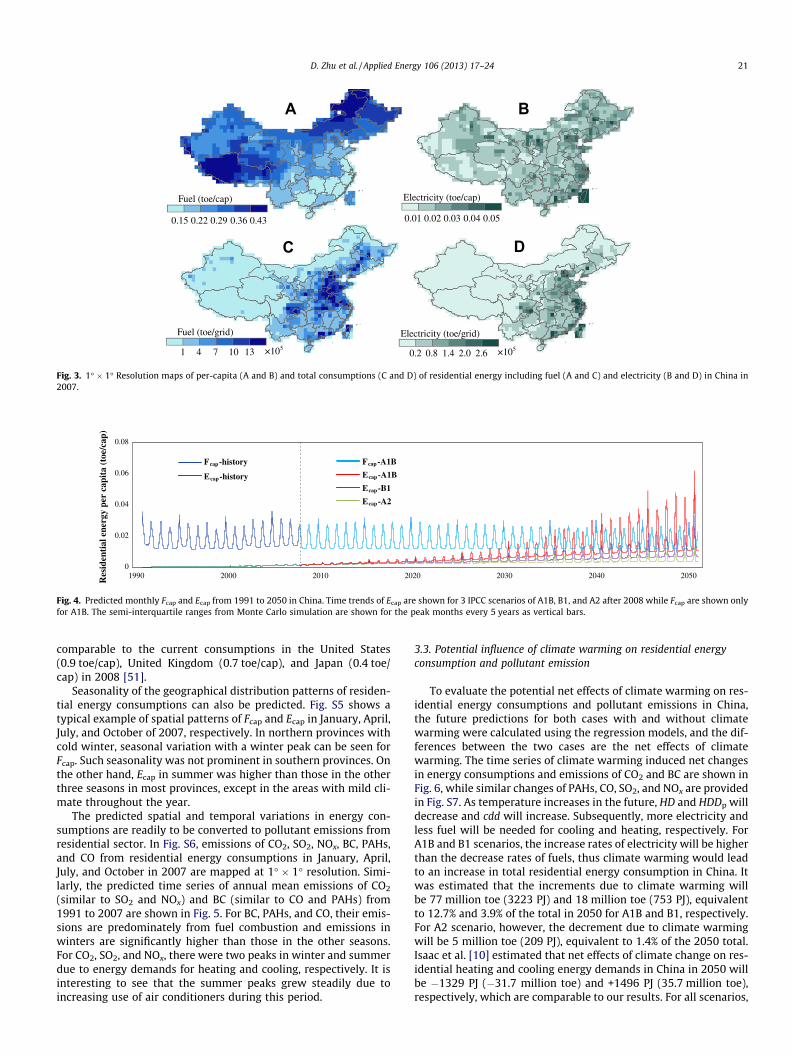
and socioeconomic data of all counties and further disaggregatedto 1! ! 1! grids using population as a proxy. The resulted geo-graphical distributions of total and per-capita energy consump-tions in 2007 are presented in Fig. 3. The fuel and electricityconsumptions in eastern China with relatively high populationdensity were much higher than those in the west, while energyconsumption densities in cities were generally higher than thosein rural areas for the same reason. On the other hand, per-capitafuel consumptions in north and west China were much higher thanthose in southeast where winter heating is not needed. In general,the spatial distribution of Fcap was similar to that of HDDp, whilethe geographical pattern of Ecap is more determined by local devel-opment status. Using the fuel consumption maps together withemission factors, annual emissions of CO2, BC, PAHs, CO, NOx, andSO2 were derived and mapped in Fig. S4.
In addition to mapping the spatial distribution, an equally, if notmore, important application of the energy consumption models isto predict temporal (inter- or intra-annual) variations of the resi-dential energy consumptions and pollutant emissions. Temporalresolved modeling of emissions and air transport of greenhousegases and air pollutants faces real challenge of scarcity of seasonaldata [48,49]. The seasonality depends largely on residential energyconsumptions which are heavily temperature dependent [50].Based on the two models, time trends of Fcap and Ecap from 1991to 2050 were calculated at monthly resolution (Fig. 4). For the pre-diction of Ecap from 2008 to 2050, three IPCC scenarios were ap-plied, while no significant difference in Fcap is expected amongthe three IPCC scenarios. There is a slight decline trend in Fcap inwinter due to potential increase in temperature. Ecap increasesremarkably over time even at the slowest developing pace (A2).The difference of Ecap among the three scenarios is mainly due tothe difference in the Icap derived from GDP growth rate predictions[39]. It was predicted that sum of Fcap and Ecap would reach 0.43(0.33–0.53), 0.33 (0.26–0.40), and 0.26 (0.21–0.31) toe/cap in2050 for A1B, B1, and A2 scenarios, respectively, which would be
Pre
dict
ed F
cap
(toe
/cap
)
0.05
0.15
0.25
0.35
0.45
0.05 0.15 0.25 0.35 0.45
A
2001~2006
Base year (2007)
0
0.02
0.04
0.06
0.08
B
2001~2006
Base year (2007) National data
0.05
0.15
0.25
0.35
0.45
0 0.02 0.04 0.06 0.08 0.05 0.15 0.25 0.35 0.45
C
Provincial data Provincial data National data
0
0.01
0.02
0.03
0.04
0 0.01 0.02 0.03 0.04
D
Pre
dict
ed E
cap
(toe
/cap
)
Pre
dict
ed F
cap
(toe
/cap
)
Pre
dict
ed E
cap
(toe
/cap
)
Recorded Fcap(toe/cap) Recorded Ecap(toe/cap) Recorded Fcap(toe/cap) Recorded Ecap(toe/cap)
Fig. 1. Comparison between the predicted and reported residential energy consumptions for training dataset (provincial data from 2001 to 2007, (A) fuel and (B) electricity)and testing dataset (provincial data in 1995, 1996, and 2000, and national data from 1991 to 2007, C. fuel and D. electricity). The data for base year (2007) were marked withsolid symbols.
Prediction Literature
Month
Mon
thly
pro
port
ions
for
F cap
0%
4%
8%
12%
16%
20%
Jan Feb Mar Apr Jun Jul Sep OctAugMay Nov Dec
A
Month
Mon
thly
pro
port
ions
for
F cap
0%
4%
8%
12%
16%
20%
Jan Feb Mar Apr Jun Jul Sep OctAugMay Nov Dec
B
Prediction Literature
Fig. 2. Comparison between the model predicted and literature reported monthly variations of residential fuel consumptions in five areas in Jilin, China (A) and residentialelectricity consumptions in two households in Shanghai (B). The uncertainty of the prediction is presented as error bars (75th " 25th percentile ranges) from Monte Carlosimulation.
20 D. Zhu et al. / Applied Energy 106 (2013) 17–24
comparable to the current consumptions in the United States(0.9 toe/cap), United Kingdom (0.7 toe/cap), and Japan (0.4 toe/cap) in 2008 [51].
Seasonality of the geographical distribution patterns of residen-tial energy consumptions can also be predicted. Fig. S5 shows atypical example of spatial patterns of Fcap and Ecap in January, April,July, and October of 2007, respectively. In northern provinces withcold winter, seasonal variation with a winter peak can be seen forFcap. Such seasonality was not prominent in southern provinces. Onthe other hand, Ecap in summer was higher than those in the otherthree seasons in most provinces, except in the areas with mild cli-mate throughout the year.
The predicted spatial and temporal variations in energy con-sumptions are readily to be converted to pollutant emissions fromresidential sector. In Fig. S6, emissions of CO2, SO2, NOx, BC, PAHs,and CO from residential energy consumptions in January, April,July, and October in 2007 are mapped at 1! ! 1! resolution. Simi-larly, the predicted time series of annual mean emissions of CO2
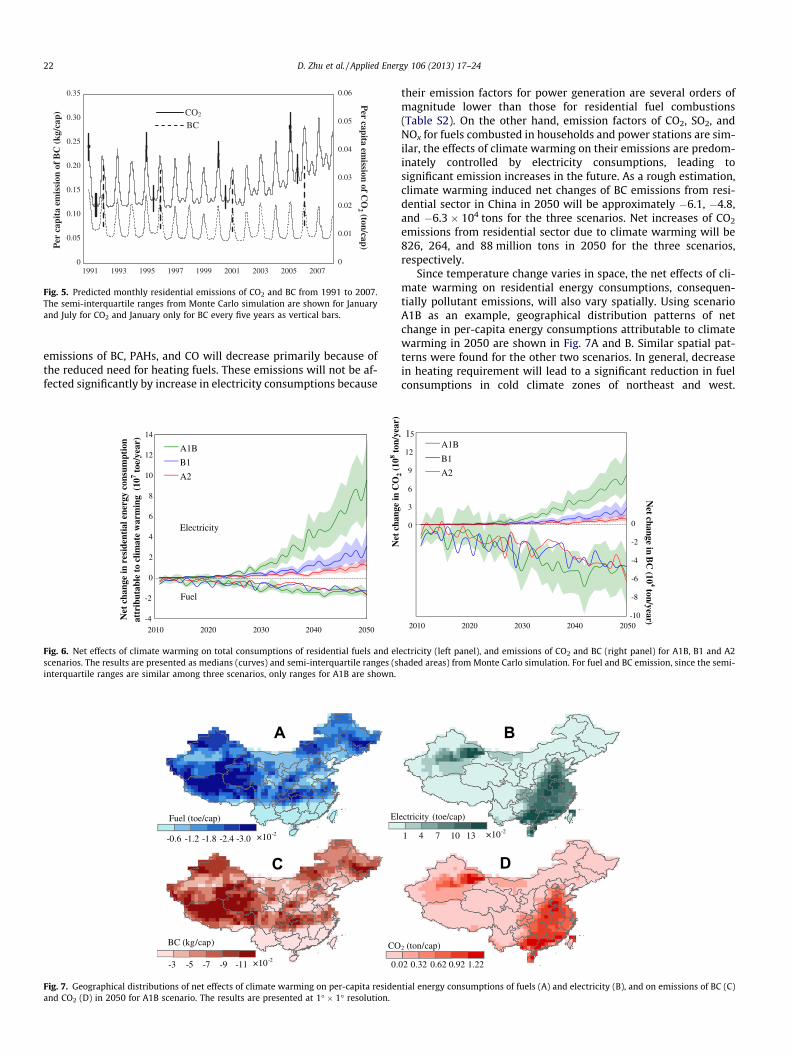
(similar to SO2 and NOx) and BC (similar to CO and PAHs) from1991 to 2007 are shown in Fig. 5. For BC, PAHs, and CO, their emis-sions are predominately from fuel combustion and emissions inwinters are significantly higher than those in the other seasons.For CO2, SO2, and NOx, there were two peaks in winter and summerdue to energy demands for heating and cooling, respectively. It isinteresting to see that the summer peaks grew steadily due toincreasing use of air conditioners during this period.
3.3. Potential influence of climate warming on residential energyconsumption and pollutant emission
To evaluate the potential net effects of climate warming on res-idential energy consumptions and pollutant emissions in China,the future predictions for both cases with and without climatewarming were calculated using the regression models, and the dif-ferences between the two cases are the net effects of climatewarming. The time series of climate warming induced net changesin energy consumptions and emissions of CO2 and BC are shown inFig. 6, while similar changes of PAHs, CO, SO2, and NOx are providedin Fig. S7. As temperature increases in the future, HD and HDDp willdecrease and cdd will increase. Subsequently, more electricity andless fuel will be needed for cooling and heating, respectively. ForA1B and B1 scenarios, the increase rates of electricity will be higherthan the decrease rates of fuels, thus climate warming would leadto an increase in total residential energy consumption in China. Itwas estimated that the increments due to climate warming willbe 77 million toe (3223 PJ) and 18 million toe (753 PJ), equivalentto 12.7% and 3.9% of the total in 2050 for A1B and B1, respectively.For A2 scenario, however, the decrement due to climate warmingwill be 5 million toe (209 PJ), equivalent to 1.4% of the 2050 total.Isaac et al. [10] estimated that net effects of climate change on res-idential heating and cooling energy demands in China in 2050 willbe "1329 PJ ("31.7 million toe) and +1496 PJ (35.7 million toe),respectively, which are comparable to our results. For all scenarios,
Fuel (toe/cap)
0.15 0.22 0.360.29 0.43
Electricity (toe/cap)
0.01 0.02 0.040.03 0.05
Fuel (toe/grid)
1 4 107 13 ×105
Electricity (toe/grid)
0.2 0.8 2.01.4 2.6 ×10⁵
A B
DC
Fig. 3. 1! ! 1! Resolution maps of per-capita (A and B) and total consumptions (C and D) of residential energy including fuel (A and C) and electricity (B and D) in China in2007.
0
0.02
0.04
0.06
0.08
1990 2000 2010 2020 2030 2040 2050
Fcap-history
Ecap-history
Fcap-A1B
Ecap-A1B
Ecap-B1
Ecap-A2
Res
iden
tial
ene
rgy
per
capi
ta (t
oe/c
ap)
Fig. 4. Predicted monthly Fcap and Ecap from 1991 to 2050 in China. Time trends of Ecap are shown for 3 IPCC scenarios of A1B, B1, and A2 after 2008 while Fcap are shown onlyfor A1B. The semi-interquartile ranges from Monte Carlo simulation are shown for the peak months every 5 years as vertical bars.
D. Zhu et al. / Applied Energy 106 (2013) 17–24 21
emissions of BC, PAHs, and CO will decrease primarily because ofthe reduced need for heating fuels. These emissions will not be af-fected significantly by increase in electricity consumptions because
their emission factors for power generation are several orders ofmagnitude lower than those for residential fuel combustions(Table S2). On the other hand, emission factors of CO2, SO2, andNOx for fuels combusted in households and power stations are sim-ilar, the effects of climate warming on their emissions are predom-inately controlled by electricity consumptions, leading tosignificant emission increases in the future. As a rough estimation,climate warming induced net changes of BC emissions from resi-dential sector in China in 2050 will be approximately "6.1, "4.8,and "6.3 ! 104 tons for the three scenarios. Net increases of CO2
emissions from residential sector due to climate warming will be826, 264, and 88 million tons in 2050 for the three scenarios,respectively.
Since temperature change varies in space, the net effects of cli-mate warming on residential energy consumptions, consequen-tially pollutant emissions, will also vary spatially. Using scenarioA1B as an example, geographical distribution patterns of netchange in per-capita energy consumptions attributable to climatewarming in 2050 are shown in Fig. 7A and B. Similar spatial pat-terns were found for the other two scenarios. In general, decreasein heating requirement will lead to a significant reduction in fuelconsumptions in cold climate zones of northeast and west.
1991 1993 1995 1997 1999 2001 2003 2005 2007
Per
capi
ta e
mis
sion
of B
C (k
g/ca
p)
Per capita emission of C
O2 (ton/cap)
0
0.01
0.02
0.03
0.04
0.05
0.06
0
0.05
0.10
0.15
0.20
0.25
0.30
0.35
CO2
BC
Fig. 5. Predicted monthly residential emissions of CO2 and BC from 1991 to 2007.The semi-interquartile ranges from Monte Carlo simulation are shown for Januaryand July for CO2 and January only for BC every five years as vertical bars.
2010 2020 2030 2040 2050
A1B
B1
A2
Net
cha
nge
in r
esid
enti
al e
nerg
y co
nsum
ptio
n at
trib
utab
le to
clim
ate
war
min
g (1
07 toe/
year
)
Electricity
Fuel
-4
-2
0
2
4
6
8
10
12
14
Net
cha
nge
in C
O2 (
108 to
n/ye
ar)
-8
-10
-6
-4
-2
0
2010 2020 2030 2040 2050
A1B
B1
A2
Net change in B
C( 10
4ton /year )
0
3
6
9
12
15
Fig. 6. Net effects of climate warming on total consumptions of residential fuels and electricity (left panel), and emissions of CO2 and BC (right panel) for A1B, B1 and A2scenarios. The results are presented as medians (curves) and semi-interquartile ranges (shaded areas) from Monte Carlo simulation. For fuel and BC emission, since the semi-interquartile ranges are similar among three scenarios, only ranges for A1B are shown.
Fuel (toe/cap)
-0.6 -1.2 -2.4-1.8 -3.0
Electricity (toe/cap)
-3 -5 -9-7 -11
BC (kg/cap)
1 4 107 13 ×10-2
CO2 (ton/cap)
0.02 0.32 0.920.62 1.22
A B
DC×10-2
×10-2
Fig. 7. Geographical distributions of net effects of climate warming on per-capita residential energy consumptions of fuels (A) and electricity (B), and on emissions of BC (C)and CO2 (D) in 2050 for A1B scenario. The results are presented at 1! ! 1! resolution.
22 D. Zhu et al. / Applied Energy 106 (2013) 17–24
Meantime, increase in electricity need will occur mainly in south-east due to increasing cooling demand. Similar geographical pat-terns are expected for emissions of air pollutants such as BC andCO2 (Fig. 7C and D).
4. Conclusion
Based on annual residential fuel and electricity consumptiondata at provincial level, the effects of a number of climate andsocioeconomic parameters on the residential energy consumptionswere studied and quantified. A hypothesis that spatial and tempo-ral variations in residential energy consumptions are driven by thesame factors was successfully tested. Based on the regression mod-els developed for residential fuel and electricity consumptions inChina, relatively highly spatial (1! ! 1!) and temporal (monthly)resolved inventories of fuel consumption, electricity consumption,and emissions of a number of greenhouse gases and air pollutantswere projected. Difference in seasonality between emissions ofregular pollutants (CO2, SO2, and NOx) and incomplete combustionby-products (BC, CO, and PAHs) were found. Winter peaks occur forall pollutants studied while summer peaks were found only for theformer. Based on the three IPCC scenarios of A1B, B1, and A2, theper-capita residential energy consumptions would reach 0.43,0.33, and 0.26 toe/cap in 2050, respectively. In case of climatewarming in the future, less residential fuel but more electricitywould be consumed. As a result, emissions of BC, CO, and PAHswould decrease mainly in cold climate zones of north China, whileemissions of CO2, SO2, and NOx would increase largely in southeastChina.
Acknowledgements
Funding for this study was provided by the National NaturalScience Foundation of China (41130754 and 41001343), Ministryof Environmental Protection (201209018), and Beijing MunicipalGovernment (YB20101000101).
Appendix A. Supplementary material
Supplementary data associated with this article can be found, inthe online version, at http://dx.doi.org/10.1016/j.apenergy.2013.01.040.
References
[1] Lamarque JF, Bond TC, Eyring V, Granier C, Heil A, Klimont Z, et al. Historical(1850–2000) gridded anthropogenic and biomass burning emissions ofreactive gases and aerosols: methodology and application. Atmos Chem Phys2010;10(15):7017–39.
[2] National Bureau of Statistics of China. China energy statistical yearbook2007. Beijing: China Statistics Press; 2008.
[3] Streets DG, Bond TC, Carmichael GR, Fernandes SD, Fu Q, He D, et al. Aninventory of gaseous and primary aerosol emissions in Asia in the year 2000. JGeophys Res-Atmos 2003;108:D21.
[4] Zhang Q, Streets DG, Carmichael GR, He KB, Huo H, Kannari A, et al. Asianemissions in 2006 for the NASA INTEX-B mission. Atmos Chem Phys2009;9(14):5131–53.
[5] Shen GF, Yang YF, Wang W, Tao S, Zhu C, Min YJ, et al. Emission factors ofparticulate matter and elemental carbon for crop residues and coals burned intypical household stoves in China. Environ Sci Technol 2010;44:7157–62.
[6] Shen GF, Wang W, Yang YF, Ding JN, Xue M, Min YJ, et al. Emissions of PAHsfrom indoor crop residue burning in a typical rural stove: emission factors, sizedistributions, and gas-particle partitioning. Environ Sci Technol2011;45:1206–12.
[7] Wang R, Tao S, Wang WT, Liu JF, Shen HZ, Shen GF, et al. Black carbonemissions in China from 1949 to 2050. Environ Sci Technol2012;46(14):7595–603.
[8] Zhang YX, Dou H, Chang B, Wei Z, Qiu W, Liu S, et al. Emission of polycyclicaromatic hydrocarbons from indoor straw burning and emission inventoryupdating in China. Ann NY Acad Sci 2008;1140(1):218–27.
[9] Krigger J, Dorsi C. Residential energy. Upper Saddle River: Prentice Hall; 2009.
[10] Isaac M, van Vuuren DP. Modeling global residential sector energy demand forheating and air conditioning in the context of climate change. Energy Policy2009;37(2):507–21.
[11] Jager J. Climate and energy systems: a review of their interactions. NewYork: John Wiley & Sons; 1983.
[12] Li DHW, Yang L, Lam JC. Impact of climate change on energy use in the builtenvironment in different climate zones – a review. Energy 2012;42(1):103–12.
[13] Schaeffer R, Szklo AS, Pereira de Lucena AF, Moreira Cesar Borba BS, PupoNogueira LP, Fleming FP, et al. Energy sector vulnerability to climate change: areview. Energy 2012;38(1):1–12.
[14] Soldo B. Forecasting natural gas consumption. Appl Energy 2012;92:26–37.[15] Sarak H. The degree-day method to estimate the residential heating natural
gas consumption in Turkey: a case study. Energy 2003;28(9):929–39.[16] Mourshed M. The impact of the projected changes in temperature on heating
and cooling requirements in buildings in Dhaka, Bangladesh. Appl Energy2011;88(11):3737–46.
[17] Amato AD, Ruth M, Kirshen P, Horwitz J. Regional energy demand responses toclimate change: methodology and application to the commonwealth ofmassachusetts. Climatic Change 2005;71(1–2):175–201.
[18] Pilli-Sihvola K, Aatola P, Ollikainen M, Tuomenvirta H. Climate and electricityconsumption e witnessing increasing or decreasing use and costs? EnergyPolicy 2010;38:2409–19.
[19] Wang X, Chen D, Ren Z. Assessment of climate change impact on residentialbuilding heating and cooling energy requirement in Australia. Build Environ2010;45(7):1663–82.
[20] Lam JC, Wan KKW, Wong SL, Lam TNT. Long-term trends of heat stress andenergy use implications in subtropical climates. Appl Energy2010;87(2):608–12.
[21] Lam TNT, Wan KKW, Wong SL, Lam JC. Impact of climate change oncommercial sector air conditioning energy consumption in subtropical HongKong. Appl Energy 2010;87(7):2321–7.
[22] Lam JC, Wan KKW, Cheung KL. An analysis of climatic influences on chillerplant electricity consumption. Appl Energy 2009;86(6):933–40.
[23] Wan KKW, Li DHW, Liu D, Lam JC. Future trends of building heating andcooling loads and energy consumption in different climates. Build Environ2011;46(1):223–34.
[24] Pickett STA. Space-for-time substitution as an alternative to long-term studies.In: Likens GE, editor. Long-term studies in ecology: approaches andalternatives. New York: Springer; 1989.
[25] National Bureau of Statistics of China. China energy statistical yearbook 2001–2007. Beijing: China Statistics Press; 2002–2008.
[26] Lam PL. Pricing of electricity in China. Energy 2004;29:287–300.[27] Lin BQ, Jiang ZJ. Designation and influence of household increasing block
electricity tariffs in China. Energy Policy 2012;421:64–173.[28] Wang B. An imbalanced development of coal and electricity industries in
China. Energy Policy 2007;35(10):4959–68.[29] National Bureau of Statistics of China. China energy statistical yearbook 1991–
2000. Beijing: China Statistics Press; 1992–2001.[30] Qin F, Liu HY, Jing L, Liu W, Yin J, Wei XD. The investigation of energy
consumption in the village of Jilin province. J Jilin Architect Civil Eng Ins2007;24(2):37–40 [in Chinese].
[31] Li ZH, Sun J, Hiroshi Y. Field measurement and analysis of the residentialenergy consumption structure of Shanghai (in Chinese). J Tongji University(Natural Sci) 2009;37(3):384–9.
[32] MOHURD (Ministry of Housing and Urban–Rural Development of the People’sRepublic of China). Code for design of heating, ventilation and air conditioning(GB50019-2003).
[33] NOAA-ARL (NOAA Air Resources Laboratory). Global NOAA-NCEP/NCARpressure level reanalysis data archive. <http://ready.arl.noaa.gov/archives.php>.
[34] ORNL (Oak Ridge National Laboratory). Land scan global population 2007database.
[35] NCCC (National Climate Center of China). The world climate researchprogramme’s (WCRP’s) coupled model intercomparison project phase 3multi-model dataset (CMIP3). <http://ncc.cma.gov.cn/Website/index.php?ChannelID=112&WCHID=110>.
[36] National Bureau of Statistics of China. China statistical yearbook 2001–2007. Beijing: China Statistics Press; 2002–2008.
[37] van der Werf GR, Randerson JT, Giglio L, Collatz GJ, Mu M, Kasibhatla PS, et al.Global fire emissions and the contribution of deforestation, savanna, forest,agricultural, and peat fires (1997–2009). Atmos Chem Phys Discuss2010;10(6):16153–230.
[38] UN-DESA (United Nations, Department of Economic and Social Affairs). Worldpopulation prospects: the 2008 revision. <http://esa.un.org/unpd/wpp/index.htm>.
[39] CIESIN (Center for International Earth Science Information Network). Country-level GDP and downscaled projections based on the SRES A1, A2, B1, and B2scenarios; 1990–2100. <http://www.ciesin.columbia.edu/datasets/downscaled>.
[40] NDRC (National Development and Reform Commission). China’s low carbondevelopment pathways by 2050 scenario analysis of energy demand andcarbon emissions. Beijing: Science press; 2009.
[41] CEC (China Electricity Council). Research report on the 12th five-year plan ofpower industry; 2012. <http://www.cec.org.cn/yaowenkuaidi/2012-03-09/81451.html>.
[42] Espey JA, Espey M. Turning on the lights: a meta-analysis of residentialelectricity demand elasticities. J Agri Appl Econ 2004;36(1):65–81.
D. Zhu et al. / Applied Energy 106 (2013) 17–24 23

[43] Considine TJ. The impacts of weather variations on energy demand and carbonemissions. Resour Energy Econ 2000;22:295–314.
[44] Yuan S, Qian H. Relations of energy consumption to climate in China: astatistical analysis (in Chinese). Meteor Sci Technol 2003:29–32.
[45] Chen S, Li N, Yoshino H, Guan J, Levine MD. Statistical analyses on winterenergy consumption characteristics of residential buildings in some cities ofChina. Energy Build 2011;43(5):1063–70.
[46] Sailor DJ, Pavlova AA. Air conditioning market saturation and long-termresponse of residential cooling energy demand to climate change. Energy2003;28(9):941–51.
[47] Hekkenberg M, Moll HC, Uiterkamp AJMS. Dynamic temperature dependencepatterns in future energy demand models in the context of climate change.Energy 2009;34(11):1797–806.
[48] Gurney KR. Sensitivity of atmospheric CO2 inversions to seasonal andinterannual variations in fossil fuel emissions. J Geophys Res 2005;110:D10.
[49] de Meij A, Krol M, Dentener F, Vignati E, Cuvelier C, Thunis P. The sensitivity ofaerosol in Europe to two different emission inventories and temporaldistribution of emissions. Atmos Chem Phys 2006;6:4287–309.
[50] Sailor DJ, Munoz JR. Sensitivity of electricity and natural gas consumption toclimate in the USA – methodology and results for eight states. Energy1997;22(10):987–98.
[51] IEA (International Energy Agency). World energy balances; 2009. <http://wds.iea.org/WDS/ReportFolders/ReportFolders.aspx>.
24 D. Zhu et al. / Applied Energy 106 (2013) 17–24
Related Documents