Temporal and Spatial Characteristics of the Diatom Ditylum brightwellii in the Western Isles Region of the Bay of Fundy J.L. Martin, C.D. Hastey, M.M. LeGresley and F.H. Page Science Branch, Maritimes Region Fisheries and Oceans Canada Biological Station 531 Brandy Cove Road, St. Andrews, NB E5B 2L9 2008 Canadian Technical Report of Fisheries and Aquatic Sciences 2779 Fisheries and Oceans Pêches et Océans Canada Canada

Welcome message from author
This document is posted to help you gain knowledge. Please leave a comment to let me know what you think about it! Share it to your friends and learn new things together.
Transcript

Temporal and Spatial Characteristics of the Diatom Ditylum brightwellii in the Western Isles Region of the Bay of Fundy J.L. Martin, C.D. Hastey, M.M. LeGresley and F.H. Page
Science Branch, Maritimes Region Fisheries and Oceans Canada Biological Station 531 Brandy Cove Road, St. Andrews, NB E5B 2L9
2008
Canadian Technical Report of Fisheries and Aquatic Sciences 2779
Fisheries and Oceans Pêches et Océans Canada Canada
Canadian Technical Report of Fisheries and Aquatic Sciences
Technical reports contain scientific and technical information that contributes to existing knowledge but which is not normally appropriate for primary literature. Technical reports are directed primarily toward a worldwide audience and have an international distribution. No restriction is placed on subject matter and the series reflects the broad interests and policies of the Department of Fisheries and Oceans, namely, fisheries and aquatic sciences.
Technical reports may be cited as full publications. The correct citation appears above the abstract of each report. Each report is abstracted in Aquatic Sciences and Fisheries Abstracts and indexed in the Department’s annual index to scientific and technical publications.
Numbers 1-456 in this series were issued as Technical Reports of the Fisheries Research Board of Canada. Numbers 457-714 were issued as Department of the Environment, Fisheries and Marine Service, Research and Development Directorate Technical Reports. Numbers 715-924 were issued as Department of Fisheries and the Environment, Fisheries and Marine Service Technical Reports. The current series name was changed with report number 925. Technical reports are produced regionally but are numbered nationally. Requests for individual reports will be filled by the issuing establishment listed on the front cover and title page. Out-of-stock reports will be supplied for a fee by commercial agents.
Rapport technique canadien des sciences halieutiques et aquatiques
Les rapports techniques contiennent des renseignements scientifiques et techniques qui constituent une contribution aux connaissances actuelles, mais qui ne sont pas normalement appropriés pour la publication dans un journal scientifique. Les rapports techniques sont destinés essentiellement à un public international et ils sont distribués à cet échelon. Il n’y a aucune restriction quant au sujet; de fait, la série reflète la vaste gamme des intérêts et des politiques du ministère des Pêches et des Océans, c’est-à-dire les sciences halieutiques et aquatiques. Les rapports techniques peuvent être cités comme des publications complètes. Le titre exact parait au-dessus du résumé de chaque rapport. Les rapports techniques sont résumés dans la revue Résumés des sciences aquatiques et halieutiques, et ils sont classés dans l’index annuel des publications scientifiques et techniques du Ministère.
Les numéros 1 à 456 de cette série ont été publiés à titre de rapports techniques de l’Office des recherches sur les pêcheries du Canada. Les numéros 457 à 714 sont parus à titre de rapports techniques de la Direction générale de la recherche et du développement, Service des pêches et de la mer, ministère de l’Environnement. Les numéros 715 à 924 ont été publiés à titre de rapports techniques du Service des pêches et de la mer, ministère des Pêches et de l’Environnement. Le nom actuel de la série a été établi lors de la parution du numéro 925.
Les rapports techniques sont produits à l’échelon régional, mais numéroté à l’échelon national. Les demandes de rapports seront satisfaites par l’établissement auteur dont le nom figure sur la couverture et la page du titre. Les rapports épuisés seront fournis contre rétribution par des agents commerciaux.

i
Canadian Technical Report of
Fisheries and Aquatic Sciences 2779
February 2008
Temporal and spatial characteristics of the diatom Ditylum brightwellii in the
Western Isles region of the Bay of Fundy
by
J. L. Martin, C. D. Hastey, M. M. LeGresley and F. H. Page
Fisheries and Oceans Canada, Biological Station, 531 Brandy Cove Road,
St. Andrews, New Brunswick, Canada E5B 2L9
This is the two hundred and seventy-fifth Technical Report of the Biological Station, St. Andrews, NB

ii
© Her Majesty the Queen in Right of Canada, 2008
Cat. No. Fs 97-6/2779E ISSN 0706-6457 Correct citation for this publication: Martin, J. L., Hastey, C. D. LeGresley, M. M. and Page, F. H. 2008. Temporal and spatial
characteristics of the diatom Ditylum brightwellii in the Western Isles region of the Bay of Fundy. Can. Tech. Rep. Fish. Aquat. Sci. 2779: iv+ 22 p.
iii
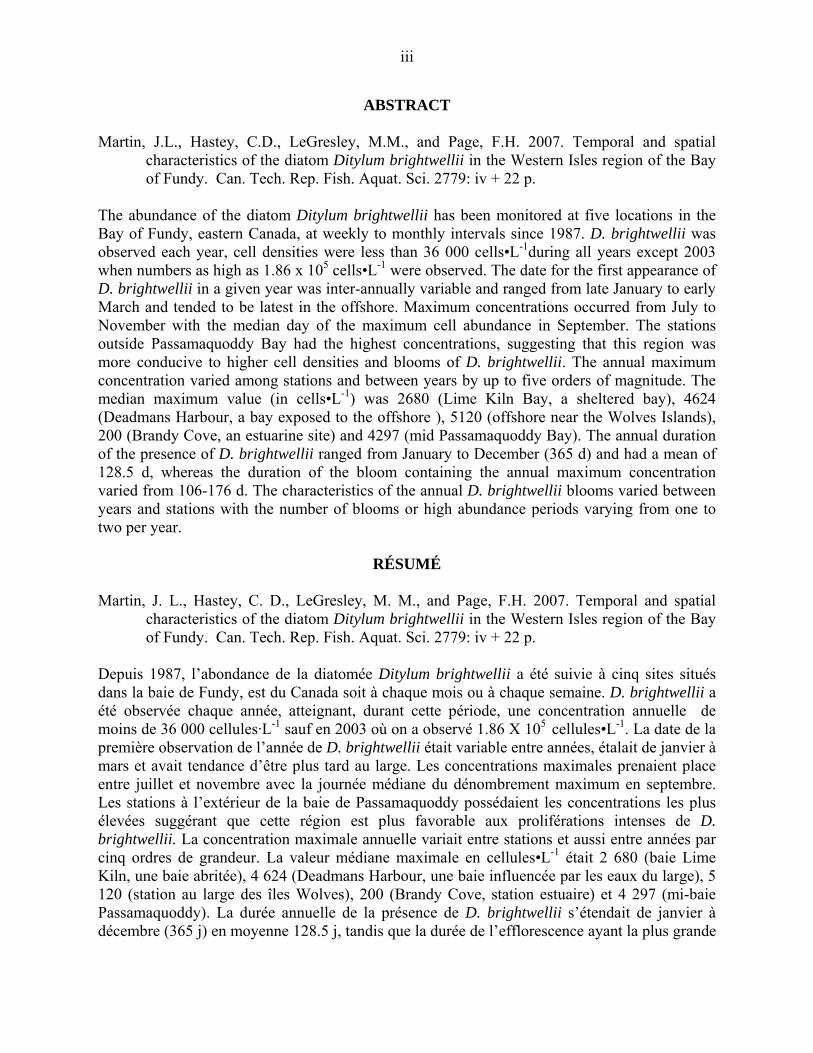
ABSTRACT Martin, J.L., Hastey, C.D., LeGresley, M.M., and Page, F.H. 2007. Temporal and spatial
characteristics of the diatom Ditylum brightwellii in the Western Isles region of the Bay of Fundy. Can. Tech. Rep. Fish. Aquat. Sci. 2779: iv + 22 p.
The abundance of the diatom Ditylum brightwellii has been monitored at five locations in the Bay of Fundy, eastern Canada, at weekly to monthly intervals since 1987. D. brightwellii was observed each year, cell densities were less than 36 000 cells•L-1during all years except 2003 when numbers as high as 1.86 x 10⁵ cells•L-1 were observed. The date for the first appearance of D. brightwellii in a given year was inter-annually variable and ranged from late January to early March and tended to be latest in the offshore. Maximum concentrations occurred from July to November with the median day of the maximum cell abundance in September. The stations outside Passamaquoddy Bay had the highest concentrations, suggesting that this region was more conducive to higher cell densities and blooms of D. brightwellii. The annual maximum concentration varied among stations and between years by up to five orders of magnitude. The median maximum value (in cells•L-1) was 2680 (Lime Kiln Bay, a sheltered bay), 4624 (Deadmans Harbour, a bay exposed to the offshore ), 5120 (offshore near the Wolves Islands), 200 (Brandy Cove, an estuarine site) and 4297 (mid Passamaquoddy Bay). The annual duration of the presence of D. brightwellii ranged from January to December (365 d) and had a mean of 128.5 d, whereas the duration of the bloom containing the annual maximum concentration varied from 106-176 d. The characteristics of the annual D. brightwellii blooms varied between years and stations with the number of blooms or high abundance periods varying from one to two per year.
RÉSUMÉ Martin, J. L., Hastey, C. D., LeGresley, M. M., and Page, F.H. 2007. Temporal and spatial
characteristics of the diatom Ditylum brightwellii in the Western Isles region of the Bay of Fundy. Can. Tech. Rep. Fish. Aquat. Sci. 2779: iv + 22 p.
Depuis 1987, l’abondance de la diatomée Ditylum brightwellii a été suivie à cinq sites situés dans la baie de Fundy, est du Canada soit à chaque mois ou à chaque semaine. D. brightwellii a été observée chaque année, atteignant, durant cette période, une concentration annuelle de moins de 36 000 cellules·L-1 sauf en 2003 où on a observé 1.86 X 10⁵ cellules•L-1. La date de la première observation de l’année de D. brightwellii était variable entre années, étalait de janvier à mars et avait tendance d’être plus tard au large. Les concentrations maximales prenaient place entre juillet et novembre avec la journée médiane du dénombrement maximum en septembre. Les stations à l’extérieur de la baie de Passamaquoddy possédaient les concentrations les plus élevées suggérant que cette région est plus favorable aux proliférations intenses de D. brightwellii. La concentration maximale annuelle variait entre stations et aussi entre années par cinq ordres de grandeur. La valeur médiane maximale en cellules•L-1 était 2 680 (baie Lime Kiln, une baie abritée), 4 624 (Deadmans Harbour, une baie influencée par les eaux du large), 5 120 (station au large des îles Wolves), 200 (Brandy Cove, station estuaire) et 4 297 (mi-baie Passamaquoddy). La durée annuelle de la présence de D. brightwellii s’étendait de janvier à décembre (365 j) en moyenne 128.5 j, tandis que la durée de l’efflorescence ayant la plus grande

iv
concentration annuelle variait de 106-176 j. Les caractéristiques des efflorescences annuelles de D. brightwellii diffèrent entre années et entre stations et varient d’une à deux proliférations par année.

1
INTRODUCTION Although the majority of phytoplankton species occur in the environment without causing adverse effects, there are a few that are known to cause harm. When these harmful algal blooms (HABs) occur in areas where Atlantic salmon (Salmo salar) farming is conducted, the health of the caged salmon can be compromised. Farmed fish are particularly vulnerable to harmful phytoplankton blooms because they do not have the luxury of being able to swim away to avoid blooms, and heavy mortality can occur within hours. The salmonid mariculture industry in southwest New Brunswick consists of more than 90 active farms which could potentially be impacted by HABs.
Impacts to fisheries from HABs have been observed in various regions of the world (White 1980; Anderson et al. 2001; Landsberg 2002; Kim et al. 2004; Doucette et al. 2006), and particularly to salmon in regions such as: Atlantic Canada - Bay of Fundy: Alexandrium fundyense, and Mesodinium rubrum (Martin et al. 2001a, 2006a), Nova Scotia: Alexandrium tamarense (Cembella et al. 2002); Faroe Islands – Alexandrium (formerly Gonyaulax) excavata (Mortensen 1985); Northwest Pacific - Chaetoceros convolutus, Chaetoceros concavicornis and Corethron sp. (Gaines and Taylor 1986; Rensel et al. 1989; Speare and Ferguson 1989; Horner et al. 1990, 1997; Albright et. al.1993; Rensel 1993); Europe - Gyrodinium aureolum (Dahl and Tangen 1990, 1993; Romdhane et al. 1998), Chile - Leptocylindrus minimus (Clément and Lembeye 1993).
HABs have been known to affect fish through either of the following methods: neurotoxins, gill irritation/damage (mechanically or through the production of hemolytic substances) or asphyxiation (oxygen depletion). Farmed fish are particularly vulnerable to harmful phytoplankton blooms. The result may be mortality or stress in both smolts and market size salmon and loss of growth during a severe bloom event. These effects have caused millions of dollars of lost revenue to the affected salmon farmers and insurance companies are interested in knowing what farmers are doing to mitigate potential phytoplankton related losses. In cases where there is an anticipation of a problem, market size fish could be harvested, feeding could be reduced or the introduction of fall smolts into cages may need to be delayed due to sensitivity to phytoplankton blooms. Salmon operations in the southwestern New Brunswick region of the Bay of Fundy have been impacted by HABs several times within the past decade. Those farms located within the Passamaquoddy and Bocabec Bay areas have been impacted more so than those elsewhere. Although HABs occur less frequently to farms outside Passamaquoddy Bay, blooms only occurred in the Grand Manan area in 2003 and caused severe economic losses at several farms in eastern Grand Manan. In 2004, blooms occurred in the region between Letang and Seeleys Cove, affecting salmon farms in that area as well (Fig. 1).
A phytoplankton monitoring program was initiated in the Western Isles region of the Bay of Fundy in 1987 due to growing concerns that the incidents involving HABs seemed to be increasing in intensity, frequency and geographic distribution throughout the world (Anderson 1989; Smayda 1990; Hallegraeff 1993, 1995). The purposes of the phytoplankton study when it was initiated were: to establish baseline data on phytoplankton populations in the lower Bay of

2
Fundy, since little detailed work had been published since studies by Gran and Braarud (1935); to identify harmful algal species that could potentially cause harm to the aquaculture industry; to provide an early warning to the aquaculture industries by sorting and identifying samples soon after collection; and to determine patterns and trends in phytoplankton populations. Another purpose of the study was to determine whether there were environmental changes, such as changing trends in phytoplankton populations as a result of the salmon industry. Incidences of fish mortalities, especially those held captive in net pens, had also been increasing in other regions of the world. Some of these increases can be attributed to increased awareness, both in the scientific and public communities, as well as the increased use of inshore coastal waters for aquaculture, tourism and other activities. It is well known that phytoplankton blooms are notoriously difficult to predict. Scientists in various parts of the world have been working on this for decades with little success to date. Two decades of monitoring phytoplankton within the southwestern New Brunswick area of the Bay of Fundy have indicated that the general seasonal timing of the blooms of some species is quite consistent and hence predictable to this extent. Some initial statistical analyses have indicated that sophisticated time series analysis techniques have potential for forecasting of phytoplankton abundance. A research program was funded under the Department of Fisheries and Oceans (DFO) Aquaculture Collaborative Research Development Program (ACRDP) to study data analysis strategies to provide information concerning (Chang et al. 2005; 2007):
1) the temporal and spatial scales of variability in the concentration of potentially harmful phytoplankton species;
2) the effectiveness of sampling and data analyses approaches for detecting the presence of potentially harmful phytoplankton species; and
3) the effectiveness of the sampling and data analyses approaches for detecting and projecting a temporal trend in the abundance of a harmful algal species.
This manuscripts is part of a series dealing with: determining temporal and spatial characteristics of particular blooms of harmful algae in the southwestern New Brunswick area from existing phytoplankton monitoring data since 1987; evaluating the statistical potential of these time series to give an early indication of a pending HAB; and determining the similarity between time series of phytoplankton collected at individual locations. Although a number of species of phytoplankton were selected from the dataset for analyses, this particular paper focuses on the diatom Ditylum brightwellii. A total of 10 species are being addressed as part of the project and include species that have been suggested to have caused problems with salmon in either the Bay of Fundy or species observed in the Bay of Fundy that have been implicated in fish problems elsewhere in the world, such as Eucampia zodiacus, D. brightwellii, M. rubrum, Chaetoceros socialis, C. concavicornis, C. convolutus, Corethron criophilum, L. minimus, A. fundyense and Pseudo-nitzschia spp. Results for A. fundyense have been published previously (Page et al. 2004, 2005, 2006) As part of this series, reports on E. zodiacus and M. rubrum have been completed (Martin et al. 2007a, 2007b).
3
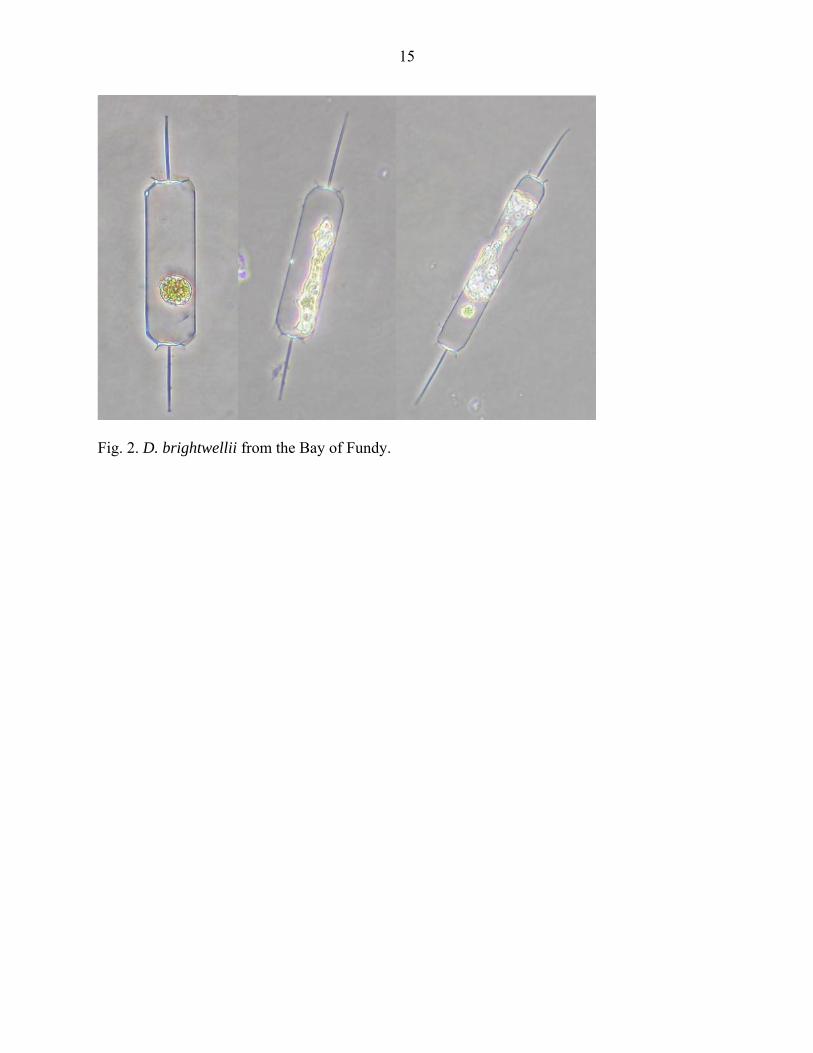
D. brightwellii (West) Grunow (Fig. 2) is a diatom that appears to be cosmopolitan, except in polar waters (Horner 2002). Cells are 80-130 μm long and 25-100 μm in diameter. It generally occurs singly but can be in short chains (or occasionally long chains). It is free-living, rectangular from the girdle view with a single spine arising from the center of each valve (Round et al. 1990). Although it has not been documented to have caused problems with aquaculture operations anywhere in the world, D. brightwellii was observed at high concentrations during an A. fundyense bloom when salmon mortalities were observed in the Bay of Fundy (Martin et al. 2006a). D. brightwellii has been documented to have had a negative effect to the copepod, Calanus pacificus, where the percent hatching success for eggs was zero when exposed to high concentrations of D. brightwellii (Ban et al. 1997).
MATERIALS AND METHODS Sampling was initiated in 1987 at Lime Kiln Bay (Station 3 – Letang estuary where a number of aquaculture sites are located) and at the following three stations in 1988: Brandy Cove (Station 17 – a brackish site influenced by the Saint Croix River estuary), Deadmans Harbour (Station 15 – an open bay with offshore influence), and the Wolves Islands (Station16 – an offshore indicator site). An extra sampling site (Station 25) was added in mid-Passamaquoddy Bay in 1999 following the observation that Brandy Cove was not a good indicator site for cell densities of algal blooms within Passamaquoddy Bay (Fig. 1). Sampling was conducted aboard the research vessel, CCGC PANDALUS III. Weekly samples were collected from early May to the end of September or October, depending on the decline of the fall phytoplankton blooms. Biweekly sampling was conducted in the shoulder bloom months such as April and October (when phytoplankton cell densities had begun to increase or decrease) and monthly during all other colder months. Phytoplankton samples were collected at the surface by bucket from all five stations, and at depths of 10 m, 25 m, and 50 m with a Niskin bottle at Station 16. Water samples (250 mL) were immediately preserved with 5 mL formaldehyde:acetic acid. Later, 50-mL subsamples were settled in counting chambers for 16 h. Phytoplankton greater than 5 µm were identified and enumerated (as cells•L-1) with the Utermöhl technique using a Nikon inverted microscope (Sournia 1978). Following analyses for phytoplankton abundance and distribution, the results were entered into a Microsoft Access database with the following fields: survey type, sampling station, date, organism (species name), code (“1” – dinoflagellate, “2” – diatom and “3” other which included ciliates and smaller zooplankton), and depth (only surface samples were used for this report although samples were collected at other depths at selected sites). Counts for cells were recorded as cells•L-1. The dataset was used to generate a time-series of the near surface abundance of D. brightwellii for each of the five primary sampling stations. Data was retrieved from Access using queries for the first occurrence, maximum occurrence, etc., and copied into an Excel spreadsheet for sorting and data manipulation. Three point running medians and logarithms were calculated using Excel. Data were then imported into SigmaPlot (2001) for plotting. SigmaPlot

4
was used for plotting time series versus abundance, 3 point running medians and bubble plots for each station. Lattice plots showing annual first appearance versus year, date of maximum occurrence versus year, length of maximum bloom versus year and maximum concentration versus year were created using “R” (v. 2.4.0): A Programming Environment for Data Analysis and Graphics (R Development Core Team 2007). Data from phytoplankton analyses of the total community for 1987- 2000 have been previously published (Wildish et al. 1990; Martin et al. 1995, 1999, 2001b, 2006b); the data from 2001-04 is not as yet published (J.L. Martin, Biological Station, 531 Brandy Cove Road, St. Andrews, NB E5B 2L9, pers. commun.).
RESULTS The number of sample days for each station for each year from 1987- 2004 shows that sample days varied between the stations from 177 days at Station 25 to 513 days at Station 3 (Table 1). Table 1. Number of sampling days/station for each year from 1987-2004. n/a means that samples were not collected.
Year
Station 3 Lime Kiln
Bay
Station 15 Deadmans Harbour
Station 16 The Wolves
Islands
Station 17 Brandy Cove
Station 25 Passamaquoddy
Bay 1987 20 n/a n/a n/a n/a 1988 28 23 25 25 n/a 1989 31 30 25 31 n/a 1990 31 28 25 29 n/a 1991 32 32 22 32 n/a 1992 29 29 24 29 n/a 1993 29 29 26 29 n/a 1994 27 27 19 27 n/a 1995 27 27 27 27 n/a 1996 25 24 22 24 n/a 1997 25 26 23 24 n/a 1998 29 28 27 29 n/a 1999 29 28 28 29 26 2000 29 30 31 31 31 2001 30 30 30 31 31 2002 28 25 24 27 26 2003 33 33 30 33 32 2004 31 31 31 31 31 Total 513 480 439 488 177
Variables, such as the fact that sampling occurred only at Station 3 in 1987 and the first part of 1988, resulted in the higher number of sample days at that particular location. Station 17 was sampled on a regular basis once sampling was initiated due to its easy access and close proximity to the Biological Station. Very occasionally it was not possible to sample Station 15 due to weather or the fact that the harbour was shut off for herring fishing. Sampling at Station
5
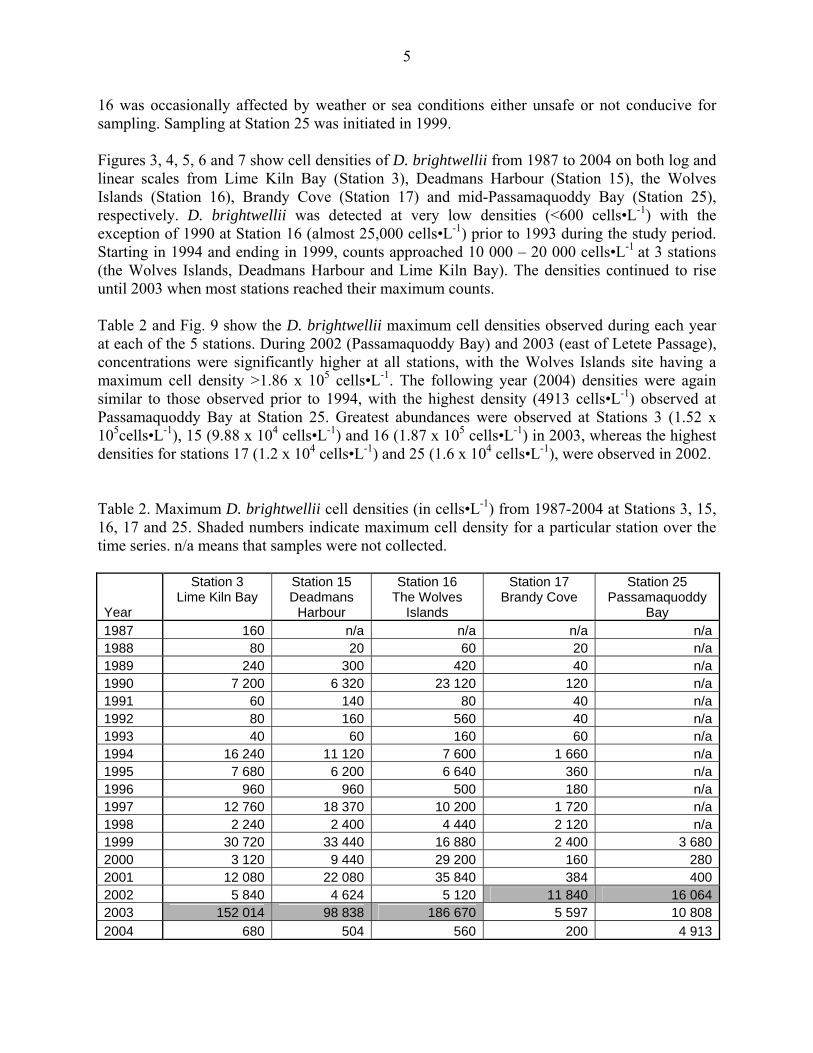
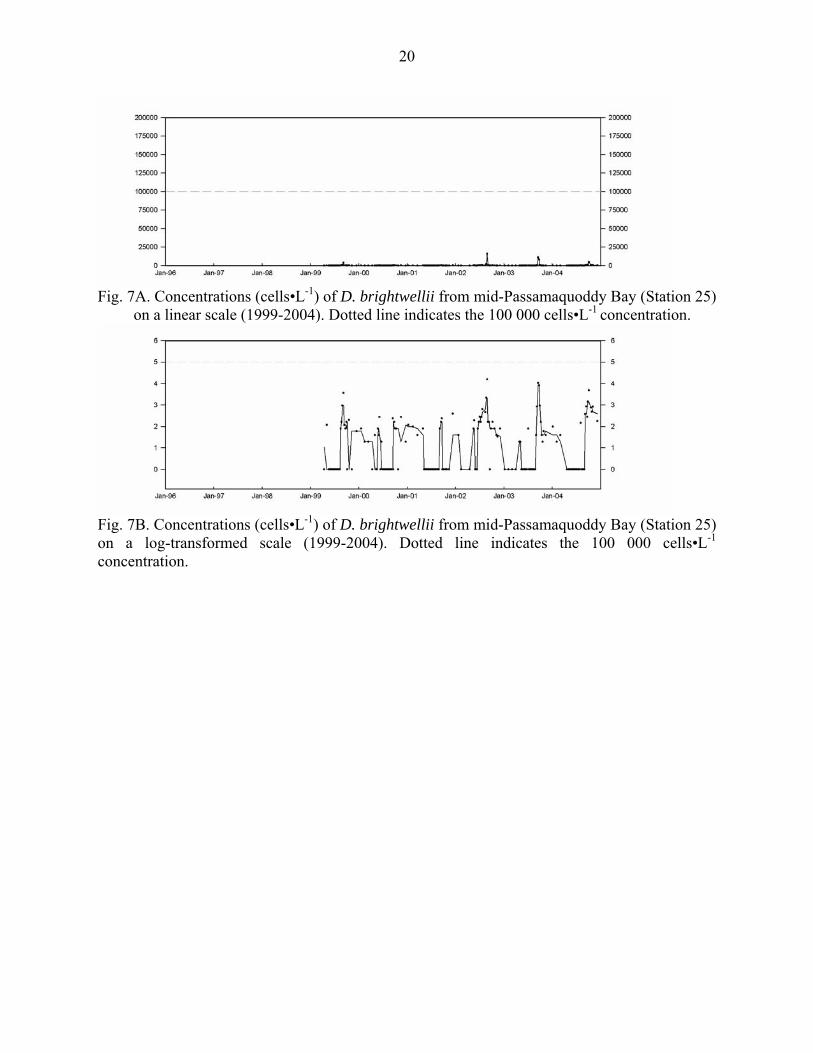
16 was occasionally affected by weather or sea conditions either unsafe or not conducive for sampling. Sampling at Station 25 was initiated in 1999. Figures 3, 4, 5, 6 and 7 show cell densities of D. brightwellii from 1987 to 2004 on both log and linear scales from Lime Kiln Bay (Station 3), Deadmans Harbour (Station 15), the Wolves Islands (Station 16), Brandy Cove (Station 17) and mid-Passamaquoddy Bay (Station 25), respectively. D. brightwellii was detected at very low densities (<600 cells•L-1) with the exception of 1990 at Station 16 (almost 25,000 cells•L-1) prior to 1993 during the study period. Starting in 1994 and ending in 1999, counts approached 10 000 – 20 000 cells•L-1 at 3 stations (the Wolves Islands, Deadmans Harbour and Lime Kiln Bay). The densities continued to rise until 2003 when most stations reached their maximum counts. Table 2 and Fig. 9 show the D. brightwellii maximum cell densities observed during each year at each of the 5 stations. During 2002 (Passamaquoddy Bay) and 2003 (east of Letete Passage), concentrations were significantly higher at all stations, with the Wolves Islands site having a maximum cell density >1.86 x 10⁵ cells•L-1. The following year (2004) densities were again similar to those observed prior to 1994, with the highest density (4913 cells•L-1) observed at Passamaquoddy Bay at Station 25. Greatest abundances were observed at Stations 3 (1.52 x 10⁵cells•L-1), 15 (9.88 x 10⁴ cells•L-1) and 16 (1.87 x 10⁵ cells•L-1) in 2003, whereas the highest densities for stations 17 (1.2 x 10⁴ cells•L-1) and 25 (1.6 x 10⁴ cells•L-1), were observed in 2002. Table 2. Maximum D. brightwellii cell densities (in cells•L-1) from 1987-2004 at Stations 3, 15, 16, 17 and 25. Shaded numbers indicate maximum cell density for a particular station over the time series. n/a means that samples were not collected.
Year
Station 3 Lime Kiln Bay
Station 15 Deadmans
Harbour
Station 16 The Wolves
Islands
Station 17 Brandy Cove
Station 25 Passamaquoddy
Bay 1987 160 n/a n/a n/a n/a1988 80 20 60 20 n/a1989 240 300 420 40 n/a1990 7 200 6 320 23 120 120 n/a1991 60 140 80 40 n/a1992 80 160 560 40 n/a1993 40 60 160 60 n/a1994 16 240 11 120 7 600 1 660 n/a1995 7 680 6 200 6 640 360 n/a1996 960 960 500 180 n/a1997 12 760 18 370 10 200 1 720 n/a1998 2 240 2 400 4 440 2 120 n/a1999 30 720 33 440 16 880 2 400 3 680 2000 3 120 9 440 29 200 160 280 2001 12 080 22 080 35 840 384 400 2002 5 840 4 624 5 120 11 840 16 064 2003 152 014 98 838 186 670 5 597 10 808 2004 680 504 560 200 4 913
6
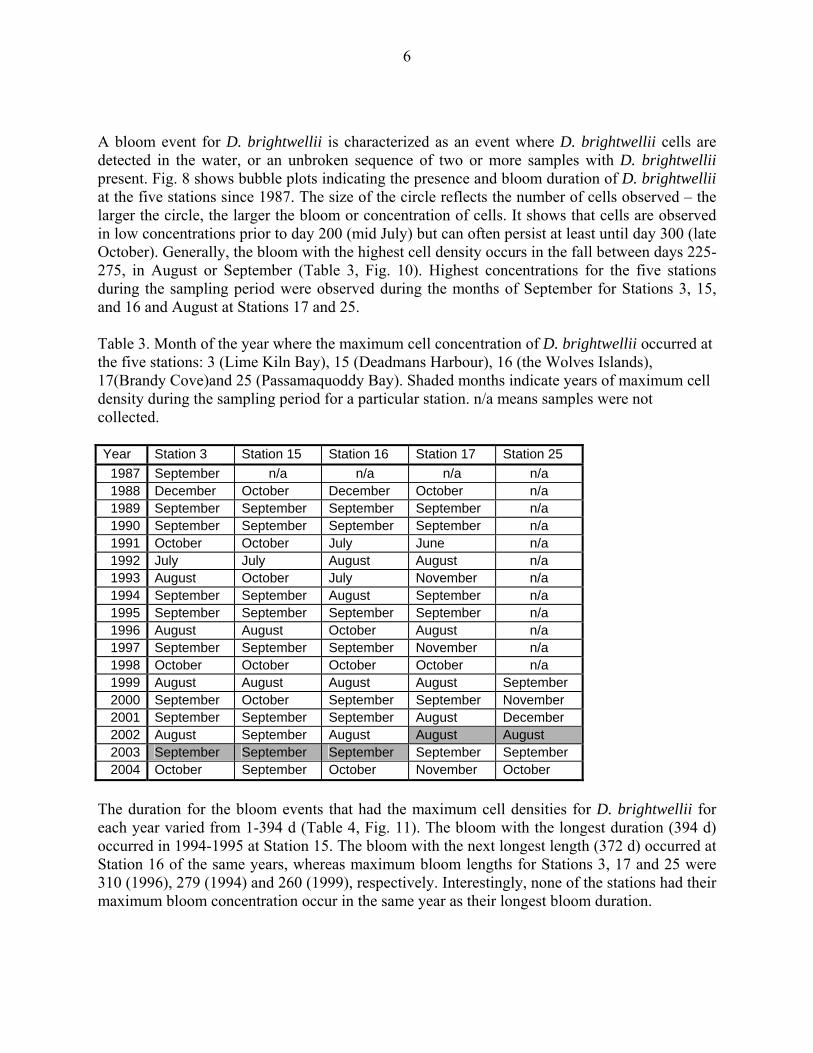
A bloom event for D. brightwellii is characterized as an event where D. brightwellii cells are detected in the water, or an unbroken sequence of two or more samples with D. brightwellii present. Fig. 8 shows bubble plots indicating the presence and bloom duration of D. brightwellii at the five stations since 1987. The size of the circle reflects the number of cells observed – the larger the circle, the larger the bloom or concentration of cells. It shows that cells are observed in low concentrations prior to day 200 (mid July) but can often persist at least until day 300 (late October). Generally, the bloom with the highest cell density occurs in the fall between days 225-275, in August or September (Table 3, Fig. 10). Highest concentrations for the five stations during the sampling period were observed during the months of September for Stations 3, 15, and 16 and August at Stations 17 and 25. Table 3. Month of the year where the maximum cell concentration of D. brightwellii occurred at the five stations: 3 (Lime Kiln Bay), 15 (Deadmans Harbour), 16 (the Wolves Islands), 17(Brandy Cove)and 25 (Passamaquoddy Bay). Shaded months indicate years of maximum cell density during the sampling period for a particular station. n/a means samples were not collected. Year Station 3 Station 15 Station 16 Station 17 Station 25
1987 September n/a n/a n/a n/a 1988 December October December October n/a 1989 September September September September n/a 1990 September September September September n/a 1991 October October July June n/a 1992 July July August August n/a 1993 August October July November n/a 1994 September September August September n/a 1995 September September September September n/a 1996 August August October August n/a 1997 September September September November n/a 1998 October October October October n/a 1999 August August August August September 2000 September October September September November 2001 September September September August December 2002 August September August August August 2003 September September September September September 2004 October September October November October
The duration for the bloom events that had the maximum cell densities for D. brightwellii for each year varied from 1-394 d (Table 4, Fig. 11). The bloom with the longest duration (394 d) occurred in 1994-1995 at Station 15. The bloom with the next longest length (372 d) occurred at Station 16 of the same years, whereas maximum bloom lengths for Stations 3, 17 and 25 were 310 (1996), 279 (1994) and 260 (1999), respectively. Interestingly, none of the stations had their maximum bloom concentration occur in the same year as their longest bloom duration.

7
Table 4. Length (in days) of the maximum bloom for each station in each year. Shaded numbers indicate the longest bloom period for a given station during the study period. n/a means that samples were not collected.
Year Station 3
Lime Kiln Bay Station 15 Deadmans
Harbour
Station 16 The Wolves
Islands
Station 17 Brandy Cove
Station 25 Passamaquoddy
Bay 1987 41 n/a n/a n/a n/a1988 1 48 78 28 n/a1989 62 97 159 21 n/a1990 135 99 84 99 n/a1991 43 14 7 1 n/a1992 28 1 27 27 n/a1993 1 106 15 25 n/a1994 279 394 372 279 n/a1995 154 314 314 124 n/a1996 310 153 310 161 n/a1997 112 15 126 154 n/a1998 289 310 219 261 n/a1999 162 245 344 181 260 2000 277 198 226 190 232 2001 55 27 247 155 43 2002 119 175 119 210 168 2003 190 197 34 41 183 2004 105 84 91 91 91
The date of first occurrence for D. brightwellii was fairly consistent between stations (Table 5, Fig. 12) and ranged from Day 1 (January 1) to Day 249 (September 6). It tended to occur earlier in the Passamaquoddy Bay station (25) than in the offshore and exposed sites. The mean day of the first occurrence ranged from Day 35-90 (February 4 – March 31) and the median day ranged from 19-64.5 (January 19 - March 5 or 6). Table 5. Ranges of days for first occurrences of D. brightwellii, including mean and median days of occurrences for the five stations.
Station 3 Lime Kiln
Bay
Station 15 Deadmans
Harbour
Station 16Wolves Islands
Station 17 Brandy Cove
Station 25 Passamaquoddy
Bay Range for 1st occurrence 2 - 229 6 - 249 6 - 229 6 - 249 6 - 119
Mean 66 68 90 66 35 Median 25 31.5 64.5 20 19
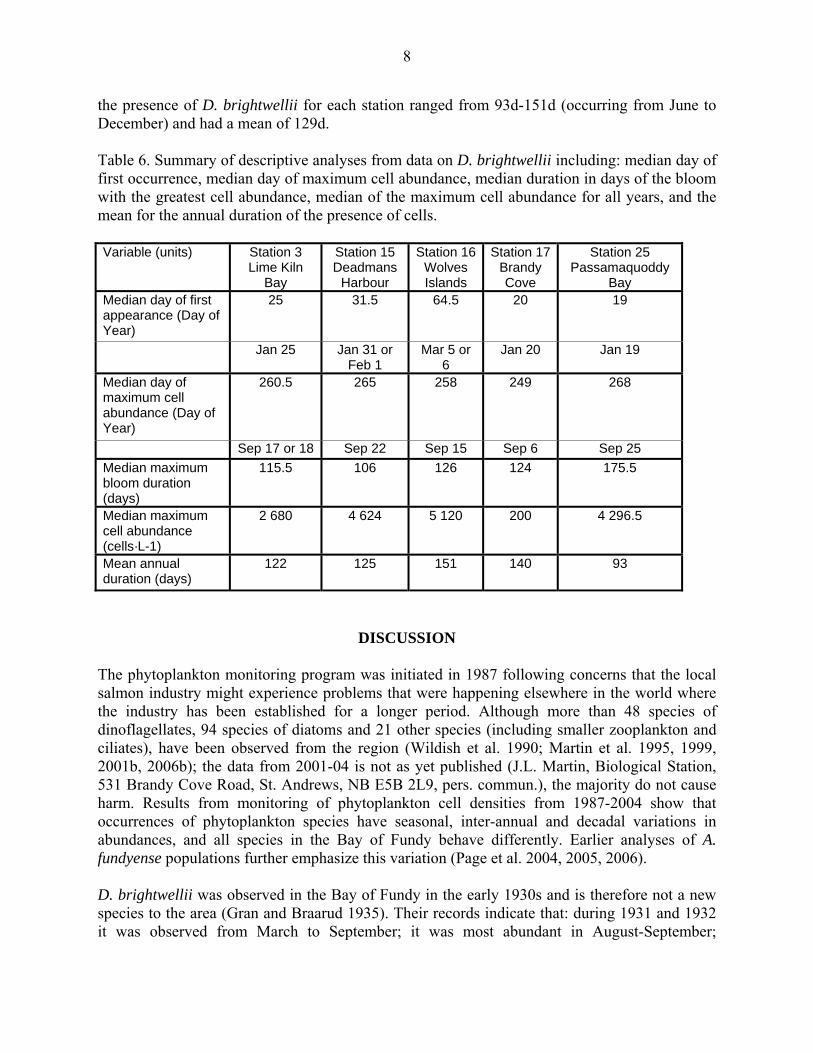
Further information on the description of the blooms of D. brightwellii indicate that the median day of the maximum cell abundance ranged from day 249 – day 268 or from September 6 – September 25 (Table 6). Median duration of the blooms ranged from 106d – 175.5d; and the median maximum cell abundance ranged from 200-5120 cells•L-1. The mean annual duration of
8
the presence of D. brightwellii for each station ranged from 93d-151d (occurring from June to December) and had a mean of 129d. Table 6. Summary of descriptive analyses from data on D. brightwellii including: median day of first occurrence, median day of maximum cell abundance, median duration in days of the bloom with the greatest cell abundance, median of the maximum cell abundance for all years, and the mean for the annual duration of the presence of cells. Variable (units) Station 3
Lime Kiln Bay
Station 15 Deadmans
Harbour
Station 16Wolves Islands
Station 17Brandy Cove
Station 25 Passamaquoddy
Bay Median day of first appearance (Day of Year)
25 31.5 64.5 20 19
Jan 25 Jan 31 or Feb 1
Mar 5 or 6
Jan 20 Jan 19
Median day of maximum cell abundance (Day of Year)
260.5 265 258 249 268
Sep 17 or 18 Sep 22 Sep 15 Sep 6 Sep 25 Median maximum bloom duration (days)
115.5 106 126 124 175.5
Median maximum cell abundance (cells·L-1)
2 680 4 624 5 120 200 4 296.5
Mean annual duration (days)
122 125 151 140 93
DISCUSSION The phytoplankton monitoring program was initiated in 1987 following concerns that the local salmon industry might experience problems that were happening elsewhere in the world where the industry has been established for a longer period. Although more than 48 species of dinoflagellates, 94 species of diatoms and 21 other species (including smaller zooplankton and ciliates), have been observed from the region (Wildish et al. 1990; Martin et al. 1995, 1999, 2001b, 2006b); the data from 2001-04 is not as yet published (J.L. Martin, Biological Station, 531 Brandy Cove Road, St. Andrews, NB E5B 2L9, pers. commun.), the majority do not cause harm. Results from monitoring of phytoplankton cell densities from 1987-2004 show that occurrences of phytoplankton species have seasonal, inter-annual and decadal variations in abundances, and all species in the Bay of Fundy behave differently. Earlier analyses of A. fundyense populations further emphasize this variation (Page et al. 2004, 2005, 2006). D. brightwellii was observed in the Bay of Fundy in the early 1930s and is therefore not a new species to the area (Gran and Braarud 1935). Their records indicate that: during 1931 and 1932 it was observed from March to September; it was most abundant in August-September;

9
maximum cell densities were 1420 cells•L-1 in September 1931 and 1000 in August 1932, and it was most abundant offshore around Grand Manan Island. This is consistent with the present analysis which shows highest concentrations in the offshore area and the most abundant periods being August and September. Our study revealed that D. brightwellii was observed at very low cell densities (<1000 cells•L-1) at all of our sampling sites prior to 1990, from 1991 to 1993 and in 1996. It is a very distinct (and relatively large) species, so it would not have been easily missed during either our counts or earlier counts by Gran and Braarud (1935). As the appearances and abundances of D. brightwellii appear to vary greatly between years, and the study in the early 1930’s was only for a 2-yr period, we do not know whether there have been periods of higher cell density in the interim. It was interesting to see that in 2003 for Stations 3, 15 and 16, cell concentrations were almost five times higher than previously observed. In 2002, for Stations 17 and 25, they were almost twice as much as previously observed. The highest concentrations (1.87 x 10⁵ cells•L-1, 1.52 x 10⁵ cells•L-1 and 9.88 x 10⁴ cells•L-1) were in 2003 at the Wolves Islands, Lime Kiln Bay and Deadmans Harbour, respectively, in areas east of Letete Passage and influenced by the offshore Bay of Fundy. The more inshore areas, mid-Passamaquoddy Bay and Brandy Cove, had much lower concentrations at 1.6 x 10⁴
cells•L-1 and 1.2 x 10⁴ cells•L-1, respectively, and these occurred in 2002. Analyses from the study period suggest that the Passamaquoddy Bay region was less conducive to the higher cell densities and blooms of D. brightwellii. The inshore area has more freshwater influence, shallower water, and less mixing and flushing. Additionally, conditions in 2003 must have been more conducive to blooms of D. brightwellii as the highest concentrations were observed during those years. The high cell densities in that year were the highest recorded in the 18 yr of the phytoplankton monitoring program. These high numbers coincided with problems associated with salmon farms in the Grand Manan Island area when high concentrations of A. fundyense were linked to fish mortalites (Martin 2006a; J.L. Martin, Biological Station, 531 Brandy Cove Road, St. Andrews, NB E5B 2L9, unpublished data). These observations suggest that if concentrations reach levels that were detected in 2003, there might be problems with salmon farmed in the area. Further exposure of Atlantic salmon to D. brightwellii under laboratory conditions would also need to be conducted as preliminary initial experiments exposing salmon to high concentrations of D. brightwellii (1.0 x 10⁶ cells•L-1) for 24 h did not result in fish mortalities (Les E. Burridge, Biological Station, 531 Brandy Cove Road, St. Andrews, NB E5B 2L9, pers. commun.). This synthesis provides information on the patterns and trends of populations of D. brightwellii from 1987-2004 in the southwestern New Brunswick region of the Bay of Fundy area. It is an initial phase of analysis of the data and the first documentation of the trends for this particular species from the Fundy region. This phytoplankton monitoring program is ongoing, with additional data being collected each year. Continued studies with this valuable long time series and analyses of the phytoplankton data in association with related physical, chemical and environmental data will aid and further improve our predictive/hindcasting capabilities and the search for relationships between the linkages and variables influencing the blooms.
10
ACKNOWLEDGEMENTS Funding for the analyses was provided through Fisheries and Oceans Canada Aquaculture Collaborative Research Development Program (ACRDP). We thank Art Wilson, Jim Martin, Michelle Ringuette, Aline Saulnier, Paul McCurdy and the crew of the CCGC Pandalus III (Captain Wayne Miner and Danny Loveless) who have helped with the field work. Alex Hanke helped in designing the statistical analyses. Shawn Chase, Heidi Corrigan, and Derek Knox helped with entering data and quality control. Blythe Chang and Jim Martin reviewed the manuscript. Charlotte McAdam edited and Sheila Gidney formatted the manuscript.
REFERENCES Albright, L.J., Yang, C.Z., and Johnson, S. 1993. Sub-lethal concentrations of the harmful
diatoms, Chaetoceros concavicornis and C. convolutus, increase mortality rates of penned Pacific salmon. Aquaculture 117: 215-225.
Anderson, D.M. 1989. Toxic algal blooms and red tides: a global perspective. In Red tides.
Edited by T. Okaichi, D.M. Anderson, and T. Nemoto. Elsevier, New York. pp. 11-16. Anderson, D.M., Andersen, P., Bricelj, V.M., Cullen, J.J., and Rensel, J.E. 2001. Monitoring
and management strategies for harmful algal blooms in coastal waters, APEC #201-MR-01.1, Asia Pacific Economic Program, Singapore, and Intergovernmental Oceanographic Commission Technical Series No. 59, Paris.
Ban, S., Burns, C., Castel, J., Chaudron, Y., Christou, E., Escribano, R., Fonda Umani, S.,
Gasparini, S., Guerrero Ruiz, F., Hoffmeyer, M., Ianora, A., Kang, H., Laabir, M., Lacoste, A., Miralto, A., Ning, X., Poulet, S., Rodriguez, V., Runge, J., Shi, J., Starr, M., Uye, S., Wang, Y. 1997. The paradox of diatom-copepod interactions. Mar. Ecol. Prog. Ser. 157: 287-293.
Cembella, A.D., Quilliam, M.A., Lewis, N.I., Bauder, A.G., Dell’Aversano, C., Thomas, K.,
Jellett, J., and Cusack, R.R. 2002. The toxigenic marine dinoflagellate Alexandrium tamarense as the probable cause of mortality of caged salmon in Nova Scotia. Harmful Algae 1: 313-325.
Chang, B.D., Page, F.H., Martin, J.L., Harrison, G., Horn, E., Burridge, L.E., LeGresley, M.M.,
Hanke, A.R., McCurdy, P., and Smith, J.A. 2005. Phytoplankton early warning approaches for salmon farmers in southwestern New Brunswick. Bulletin of the Aquaculture Association of Canada, Special Publication 9: 20-23.
Chang, B.D., J.L. Martin, F.H. Page, W.G. Harrison, L.E. Burridge, M.M. LeGresley, A.R.
Hanke, E.P. McCurdy, R.J. Losier, E.P.W. Horne and M.C. Lyons. 2007. Phytoplankton early warning approaches for salmon farmers in southwestern New Brunswick: Aquaculture Collaborative Research and Development Program Final Project Report. Can. Tech. Rep. Fish. Aquat. Sci. 2715: iv + 108 p.
11
Clément, A., and Lembeye, G. 1993. Phytoplankton monitoring program in the fish farming region of South Chile. In Toxic phytoplankton blooms in the sea. Edited by T.J. Smayda and Y. Shimizu. Elsevier, The Netherlands. pp. 223-228.
Dahl, E., and Tangen, K. 1990. Gyrodinium aureolum bloom along the Norwegian coast in
1988. In Toxic marine phytoplankton. Edited by E. Granéli, B. Sundström, L. Edler and D.M. Anderson. Elsevier, New York, New York. pp. 123-127.
Dahl, E., and Tangen, K. 1993. 25 years experience with Gyrodinium aureolum in Norwegian
waters. In Toxic phytoplankton blooms in the sea. Edited by T.J. Smayda and Y. Shimizu. Elsevier, The Netherlands. pp. 15-21.
Doucette, G.J., Maniero, I., Riveiro, I., and Stevensen, C. 2006. Phycotoxin pathways in aquatic
food webs: transfer, accumulation, and degradation. In Ecology of harmful algae. Edited by E. Granéli and J.T. Turner. Springe, Heidelberg, Germany. pp. 283-295.
Gaines, G. and Taylor, F.J.R. 1986. A mariculturist’s guide to potentially harmful marine
phytoplankton of the Pacific coast of North America. Ministry of the Environment, Marine Resources Section, Fisheries Branch. Info. Rep. 10. British Columbia.
Gran, H.H., and Braarud, T. 1935. A quantitative study of the phytoplankton in the Bay of
Fundy and the Gulf of Maine (including observations on hydrography, chemistry, and turbidity). J. Biol. Board Can. 1: 279-467.
Hallegraeff, G.M. 1993. A review of harmful algal blooms and their apparent global increase.
Phycologia 32: 79-99. Hallegraeff, G.M. 1995. Harmful algal blooms: a global overview. In Manual of harmful marine
microalgae. Edited by G.M. Hallegraeff, D.M. Anderson, and A.D. Cembella. IOC Manuals and Guides No. 33 UNESCO. pp. 1-24.
Horner, R.A. 2002. A taxonomic guide to some common marine phytoplankton. Biopress Ltd.
Bristol, England. 195 pp. Horner, R.A., Postel, J.R., and Rensel, J.E. 1990. Noxious phytoplankton blooms in western
Washington waters. A review. In Toxic marine phytoplankton. Edited by E. Granéli, B. Sundström, L. Edler and D.M. Anderson. Elsevier, New York. pp. 171-176.
Horner, R.A., Garrison, D.L., and Plumey, F.G. 1997. Harmful algal blooms and red tide
problems on the U.S. west coast. Limnol. Oceanogr. 42: 1076-1088. Kim, D-I., Nagasoe, S., Oshima, Y., Yoon, Y.H., Imada, N., and Honjo, T. 2004. A massive
bloom of Cochlodinium polykrikoides in the Yatshiro Sea, Japan in 2000. In Harmful algae 2002, Edited by K.A. Steidinger, J.H. Landsberg, C.R. Thomas and G.A. Vargo. Florida Fish and Wildlife Conservation Commission, Florida Institute of Oceanography, and Intergovernmental Oceanic Commission of UNESCO. pp. 83-85
12
Landsberg, J.H. 2002. The effects of harmful algal blooms on aquatic organisms. In Reviews of
fisheries science. Edited by R.R. Stickney. CRC Press LLC. Boca Raton, Florida. Vol. 10. pp. 113-390.
Martin, J.L., Wildish, D.J., LeGresley, M.M., and Ringuette, M.M. 1995. Phytoplankton
monitoring in the southwestern Bay of Fundy during 1990-1992. Can. Manuscri. Rep. Fish. Aquat. Sci. 2277: 154 p.
Martin, J.L., LeGresley, M.M., Strain, P.M., and Clement, P. 1999. Phytoplankton monitoring in
the southwest Bay of Fundy during 1993-96. Can. Tech. Rep. Fish. Aquat. Sci. 2265: 132 p.
Martin, J.L., LeGresley, M.M. and Page, F.H. 2001a. Aquaculture and phytoplankton blooms in
the southwest Bay of Fundy. In Proceedings of the 17th annual meeting of the Aquaculture Association of Canada May 28-31, 2000. Edited by C.I. Hendry and S.E. McGladdery. Aquacul. Assoc. Can. Spec. Publ. 4, 2001. pp. 103-106.
Martin, J.L., LeGresley, M.M., and Strain, P.M. 2001b. Phytoplankton monitoring in the
western isles region of the Bay of Fundy during 1997-98. Can. Tech. Rep. Fish. Aquat. Sci. 2349: 85 p.
Martin, J.L., LeGresley, M.M., Haya, K., Sephton, D.H., Burridge, L.E. Page, F.H., and Chang,
B.D. 2006a. Salmon mortalities associated with a bloom of Alexandrium fundyense in 2003 and subsequent early warning approaches for industry. In Harmful algae 2004, Edited by G.C. Pitcher, T.A. Probyn and H.M. Verheye. African J. Mar. Sci. pp. 431-434.
Martin, J.L., LeGresley, M.M. and Strain, P.M. 2006b. Plankton monitoring in the western Isles
region of the Bay of Fundy during 1999-2000. Can. Tech. Rept. Fish. Aquat. Sci. 2629: iv + 88 p.
Martin, J. L., C. D. Hastey, M. M. LeGresley and F.H. Page. 2007a. Temporal and spatial
characteristics of the diatom Eucampia zodiacus in the Western Isles region of the Bay of Fundy. Can. Tech. Rep. Fish. Aquat. Sci. 2705: iii + 22 p.
Martin, J. L., C. D. Hastey, M. M. LeGresley and F.H. Page. 2007b. Temporal and spatial
characteristics of the diatom Mesodinium rubrum in the Western Isles region of the Bay of Fundy. Can. Tech. Rep. Fish. Aquat. Sci. 2714: iii + 27p.
Mortensen, A.M. 1985. Massive fish mortalities in the Faroe Islands caused by a Gonyaulax
excavata red tide. In Toxic dinoflagellates. Edited by D.M. Anderson, A.W. White and D.G. Baden. Elsevier, New York. pp. 165-170.
Page, F.H., Martin, J.L., Hanke, A. and LeGresley, M.M. 2004. The relationship of Alexandrium
fundyense to the temporal and spatial pattern in phytoplankton community structure within the Bay of Fundy, eastern Canada. In Harmful algae 2002, Edited by K.A.
13
Steidinger, J.H. Landsberg, C.R. Thomas and G.A. Vargo. Florida Fish and Wildlife Conservation Commission, Florida Institute of Oceanography, and Intergovernmental Oceanic Commission of UNESCO. pp. 92-94.
Page, F.H., Hanke, A., Martin, J.L., LeGresley, M. and Chang, B. 2005. Characteristics of
Alexandrium fundyense blooms that affect caged salmon in the Bay of Fundy. Aquac. Assoc. Can. Spec. Publ. 9: 27-30.
Page, F.H., Martin, J.L., Hanke, A. and LeGresley, M.M. 2006. Temporal and spatial variability
in the characteristics of Alexandrium fundyense blooms in the coastal zone of the Bay of Fundy, eastern Canada. In Harmful algae 2004. Edited by G.C. Pitcher, T.A. Probyn and H.M. Verheye. African J. Mar. Sci. pp. 203-208.
R Development Core Team. 2007. R: A language and environment for statistical computing. R
Foundation for Statistical Computing, Vienna, Austria. ISBN 3-900051-07-0, URL http://www.R-project.org.
Rensel, J.E. 1993. Severe blood hypoxia of Atlantic salmon (Salmo salar) exposed to the marine
diatom Chaetoceros concavicornis. In Toxic phytoplankton blooms of the sea. Edited by T.J. Smayda and Y. Shimizu. Elsevier, Amsterdam. pp. 625-630.
Rensel, J. E., Horner, R.A. and Postel, J.R. 1989. Effects of phytoplankton blooms on salmon
aquaculture in Puget Sound, Washington: initial research. N.W. Environ. J. 5: 53-69. Romdhane, M.S., Eilersten, H.C., Yahia, O.K.D. and Yahia, M.N.D. 1998. Toxic dinoflagellate
blooms in Tunisian lagoons: causes and consequences for aquaculture. In Harmful algae. Edited by B. Reguera, J. Blanco, M.L. Fernández and T. Wyatt. Xunta de Galicia and Inter-governmental Oceanographic Commission of UNESCO 1998. pp. 80-83.
Round, F.E., Crawford, R.M. and Mann, D.G. 1990. The Diatoms. Biology and Morphology of
the Genera. Cambridge University Press, Cambridge. 747 pp. SigmaPlot. 2001. Windows Version 7.101. Smayda, T.S. 1990. Novel and nuisance phytoplankton blooms in the sea: evidence for a global
epidemic. In Toxic marine phytoplankton. Edited by E. Granéli, B. Sundström, L. Edler and D.M. Anderson. Elsevier, New York, New York. pp. 29-40.
Sournia, A. 1978. Phytoplankton Manual. Paris, IOC-UNESCO. (Monographs on
Oceanographic Methodology 4.6). Speare, D.J. and Ferguson, H.W. 1989. Fixation artefacts in rainbow trout (Salmo gairdneri)
gills: a morphometrics evaluation. Can. J. Fish. Aquat. Sci. 46: 780-785.

14
White, A.W. 1980. Recurrence of kills of Atlantic Herring (Clupea harengus harengus) caused by dinoflagellate toxins transferred through herbivorous zooplankton. Can. J. Fish. Aquat. Sci. 37: 2262-2265.
Wildish, D.J., Martin, J.L., Wilson, A.J. and Ringuette, M. 1990. Environmental monitoring of
the Bay of Fundy salmonid mariculture industry during 1988-89. Can. Tech. Rep. Fish. Aquat. Sci. 1760: 123 p.
Fig. 1. Map showing sampling stations Brandy Cove (Station17), Lime Kiln Bay (Station 3),
Deadmans Harbour (Station 15), the Wolves Islands (Station 16) and mid-Passamaquoddy Bay (Station 25). Assorted shapes indicate locations of salmon aquaculture sites.
15
Fig. 2. D. brightwellii from the Bay of Fundy.

16
Fig. 3A. Concentrations (cells·L-1) of D. brightwellii from Lime Kiln Bay (Station 3) from 1987-2004 on a linear scale. Upper portions of figures are the 9 yr 1987-95 and the lower portions are the 9 yr 1996-2004. Dotted line indicates the 100 000 cells•L-1 concentration.
Fig. 3B. Concentrations (cells·L-1) of D. brightwellii from Lime Kiln Bay (Station 3) from 1987-2004 on a log-transformed scale. Upper portions of figures are the 9 yr 1987-95 and the lower portions are the 9 yr 1996-2004. Dotted line indicates the 100 000 cells•L-1
concentration.

17
Fig. 4A. Concentrations (cells•L-1) of D. brightwellii from Deadmans Harbour (Station 15) from 1988-2004 on a linear scale. Upper portions of figures are the 8 yr 1988-95 and the lower portions are the 9 yr 1996-2004. Dotted line indicates the 100 000 cells•L-1
concentration.
Fig. 4B. Concentrations (cells•L-1) of D. brightwellii from Deadmans Harbour (Station 15) from 1988-2004 on a log-transformed scale. Upper portions of figures are the 8 yr 1988-95 and the lower portions are the 9 yr 1996-2004. Dotted line indicates the 100 000 cells•L-1
concentration.

18
Fig. 5A. Concentrations (cells•L-1) of D. brightwellii from the Wolves Islands (Station 16) from 1988-2004 on a linear scale. Upper portions of figures are the 8 yr 1988-95 and the lower portions are the 9 yr 1996-2004. Dotted line indicates the 100 000 cells•L-1
concentration.
Fig. 5B. Concentrations (cells•L-1) of D. brightwellii from the Wolves Islands (Station 16) from 1988-2004 on a log-transformed scale. Upper portions of figures are the 8 yr 1988-95 and the lower portions are the 8 yr 1996-2004. Dotted line indicates the 100 000 cells•L-1
concentration.

19
Fig. 6A. Concentrations (cells•L-1) of D. brightwellii from the Brandy Cove (Station 17) from
1988-2004 on a linear scale. Upper portions of figures are the 8 yr 1988-95 and the lower portions are the 9 yr 1996-2004. Dotted line indicates the 100 000 cells•L-1 concentration.
Fig. 6B. Concentrations (cells•L-1) of D. brightwellii from Brandy Cove (Station 17) from 1988-2004 on a log-transformed scale. Upper portions of figures are the 8 yr 1988-95 and the lower portions are the 9 yr 1996-2004. Dotted line indicates the 100 000 cells•L-1
concentration.
20
Fig. 7A. Concentrations (cells•L-1) of D. brightwellii from mid-Passamaquoddy Bay (Station 25)
on a linear scale (1999-2004). Dotted line indicates the 100 000 cells•L-1 concentration.
Fig. 7B. Concentrations (cells•L-1) of D. brightwellii from mid-Passamaquoddy Bay (Station 25) on a log-transformed scale (1999-2004). Dotted line indicates the 100 000 cells•L-1
concentration.

21
Fig. 8. Bubble graphs showing the D. brightwellii bloom durations from 1987-2004. Size of the
circles indicates the cell concentrations (cells•L-1). Station #25 was not sampled prior to 1999.

22
Fig. 9. Maximum density (cells•L-1) of D. brightwellii at Stations 3, 15, 16, 17, and 25 on a log-
transformed scale. Solid line indicates the mean of the log cell concentrations.
Fig. 10. Day of the year that the maximum cell density was observed. Solid line indicates the mean.
Fig. 11. Length of the bloom containing the maximum cell density for each year 1987-2004.
Fig. 12. Date of the first appearance of D. brightwellii cells in a given year.

Related Documents