Welcome message from author
This document is posted to help you gain knowledge. Please leave a comment to let me know what you think about it! Share it to your friends and learn new things together.
Transcript

1
Memphis, TN-MS-AR Area Designations for the
2008 Ozone National Ambient Air Quality Standards
The table below identifies the areas in Arkansas, Mississippi and Tennessee that EPA is designating as nonattainment for the 2008 ozone national ambient air quality standards (2008 ozone NAAQS) as part of the Memphis, TN-MS-AR area. In accordance with section 107(d) of the Clean Air Act (CAA), EPA must designate an area (county or part of a county) “nonattainment” if it is violating the 2008 ozone NAAQS or if it is contributing to a violation of the 2008 ozone NAAQS in a nearby area. The technical analyses supporting the boundaries for this nonattainment area is provided below. Table 1: Final Nonattainment Area for the Memphis, TN-MS-AR Area
State Recommended Nonattainment Counties*
EPA’s Final Designation Nonattainment Counties
Memphis, TN-MS-AR
Arkansas (None) Crittenden Mississippi (None) DeSoto (partial) Tennessee (None) Shelby
*Mississippi and Tennessee based their nonattainment recommendations on 2009-2011. Arkansas based its nonattainment recommendation on 2008-2010 air quality data EPA is designating the remaining counties (or portions thereof) in Arkansas and Mississippi as “unclassifiable/attainment” for the 2008 8-hour ozone NAAQS. EPA is designating as unclassifiable/attainment all counties in Tennessee other than those included in the table above or included in the Knoxville, TN nonattainment area (see the separate technical support document for this area). The analysis below provides the basis for intended nonattainment area boundaries. It relies on EPA’s analysis of whether and which monitors are violating the 2008 ozone NAAQS, based on certified air quality monitoring data from 2008-2010 and an evaluation of whether nearby areas are contributing to such violations. EPA has evaluated contributions from nearby areas based on a weight of evidence analysis considering the factors identified below. EPA issued guidance on December 4, 2008 that identified these factors as ones EPA would consider in determining nonattainment area boundaries and recommended that states consider these factors in making their designations recommendations to EPA.1
1. Air quality data (including the design value calculated for each Federal Reference Method monitor or Federal Equivalent Method (FEM) monitor in the area);
2. Emissions and emissions-related data (including location of sources and population, amount of emissions and emissions controls, and urban growth patterns);
3. Meteorology (weather/transport patterns); 4. Geography and topography (mountain ranges or other basin boundaries); 5. Jurisdictional boundaries (e.g., counties, air districts, existing nonattainment areas, Indian
country, metropolitan planning organizations (MPOs))
1 The December 4, 2008 guidance memorandum “Area Designations for the 2008 Revised Ozone National Ambient Air Quality Standards” refers to 9 factors. In this technical support document we have grouped the emissions-related factors together under the heading of “Emissions and Emissions-Related Data,” which results in 5 categories of factors.

2
Ground-level ozone generally is not emitted directly into the air, but is created by chemical reactions between oxides of nitrogen (NOx) and volatile organic compounds (VOC) in the presence of sunlight. Because NOx and VOC emissions from a broad range of sources over a wide area typically contribute to violations of the ozone standards, EPA believes it is important to consider whether there are contributing emissions from a broad geographic area. Accordingly, EPA chose to examine the 5 factors with respect to the larger of the Combined Statistical Area (CSA) or Core Based Statistical Area (CBSA) associated with the violating monitor(s).2 All data and information used by EPA in this evaluation are the latest available to EPA. In EPA’s designations guidance for the 2008 ozone NAAQS EPA recommended examining CSA/CBSAs because certain factors used to establish CSAs and CBSAs are similar to the factors EPA is using in this technical analysis to determine if a nearby area is contributing to a violation of the 2008 ozone NAAQS. Congress required a similar approach in 1990 for areas classified as serious or above for the 1-hour ozone NAAQS, and EPA used the same basic approach in the designation process for the 1997 ozone NAAQS. Section 107(d) of the CAA requires a designation of nonattainment for areas that are violating the NAAQS or contributing to violations in a nearby area. Section 107(d)(1)(A)(i) defines “nonattainment” as an area that “does not meet (or that contributes to ambient air quality in a nearby area that does not meet)” the NAAQS. Where a violating monitor is not located in a CSA or CBSA, EPA’s guidance recommended using the boundary of the county containing the violating monitor as the starting point for considering the nonattainment area’s boundary.
2 Lists of CBSAs and CSAs and their geographic components are provided at www.census.gov/population/www/metroareas/metrodef.html. The lists are periodically updated by the Office of Management and Budget. EPA used the most recent update, based on 2008 population estimates, issued on December 1, 2009 (OMB Bulletin No. 10-02).
3
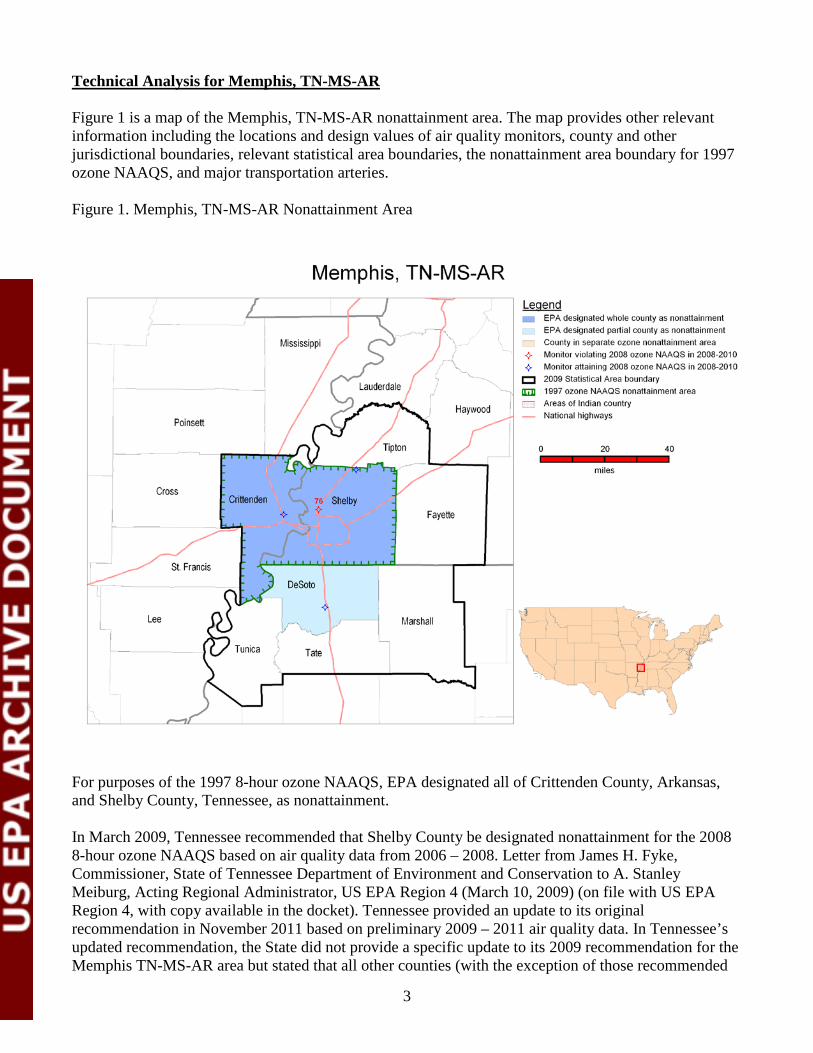
Technical Analysis for Memphis, TN-MS-AR Figure 1 is a map of the Memphis, TN-MS-AR nonattainment area. The map provides other relevant information including the locations and design values of air quality monitors, county and other jurisdictional boundaries, relevant statistical area boundaries, the nonattainment area boundary for 1997 ozone NAAQS, and major transportation arteries. Figure 1. Memphis, TN-MS-AR Nonattainment Area
For purposes of the 1997 8-hour ozone NAAQS, EPA designated all of Crittenden County, Arkansas, and Shelby County, Tennessee, as nonattainment. In March 2009, Tennessee recommended that Shelby County be designated nonattainment for the 2008 8-hour ozone NAAQS based on air quality data from 2006 – 2008. Letter from James H. Fyke, Commissioner, State of Tennessee Department of Environment and Conservation to A. Stanley Meiburg, Acting Regional Administrator, US EPA Region 4 (March 10, 2009) (on file with US EPA Region 4, with copy available in the docket). Tennessee provided an update to its original recommendation in November 2011 based on preliminary 2009 – 2011 air quality data. In Tennessee’s updated recommendation, the State did not provide a specific update to its 2009 recommendation for the Memphis TN-MS-AR area but stated that all other counties (with the exception of those recommended
4
for the Knoxville area) should be designated unclassifiable/attainment. These data are from FEM monitors sited and operated in accordance with 40 CFR Part 58. Letter from Robert J. Martineau Jr, Commissioner, State of Tennessee Department of Environment and Conservation to Gwendolyn Keyes Fleming, Regional Administrator, US EPA Region 4 (November 8, 2011) (on file with US EPA Region 4, with copy available in the docket). Also, in March 2009, Mississippi recommended that DeSoto County, Mississippi be designated as a nonattainment area separate from the Memphis nonattainment area for the 2008 ozone NAAQS based on air quality data from 2006-2008. Mississippi provided an update to the original recommendation in October 2011 based on air quality data from 2008 – 2010, and preliminary data from 2009-2011. In its updated recommendation, Mississippi recommended that all counties in the State be designated attainment for the 2008 ozone NAAQS. These data are from FEM monitors sited and operated in accordance with 40 CFR Part 58. Letter from Haley Barbour, Governor of the State of Mississippi to A. Stanley Meiburg, Acting Regional Administrator, US EPA Region 4 (March 3, 2009) and Gwendolyn Keyes Fleming, Regional Administrator US EPA Region 4 (October 27, 2011) (on file with US EPA Region 4 and rulemaking docket). Additionally, in March 2009, Arkansas recommended that Crittenden County, Arkansas be designated nonattainment based on 2006-2008 air quality data. This data is from an FEM monitor sited and operated in accordance with 40 CFR Part 58. Letter from Mike Beebe, Governor of the State of Arkansas to Lawrence E. Starfield, Acting Regional Administrator, US EPA Region 6 (March 10, 2009) (on file with US EPA Region 6, with copy available in the docket). Arkansas did not update its 2009 ozone recommendation prior to December 9, 2011. On December 9, 2011, EPA initiated the 120 day consultation process by notifying Arkansas, Mississippi and Tennessee that based on EPA’s technical analysis of the 8-county Memphis, TN-MS-AR CBSA, EPA intended to designate one county in Arkansas, a partial county in Mississippi, and one county in Tennessee (identified in Table 2 below) as “nonattainment” for the 2008 ozone NAAQS as part of the Memphis, TN-MS-AR nonattainment area. In this December 2011 letter, EPA also requested that if the States of Arkansas, Mississippi and Tennessee wished to provide additional information on EPA’s intended designation or to use early certified 2011 monitoring data for designation, they should provide comments or early certify by February 29, 2012. Table 2. State's Recommended and EPA’s Intended Designated Nonattainment Counties for Memphis, TN-MS-AR from December 9, 2011.
Memphis, TN-MS-AR State-Recommended Nonattainment Counties
EPA Intended Nonattainment Counties
Arkansas Crittenden Crittenden Mississippi None DeSoto (partial) Tennessee None Shelby
On February 27, 2012, the State of Tennessee provided an update to their November 2011 recommendation. This update was based on certified air quality data from 2009 – 2011, and was provided in response to EPA’s preliminary boundary determination for the Memphis, TN-MS-AR CBSA. Tennessee recommended that Shelby County, Tennessee be designated attainment based on the State’s early certification of the 2009 – 2011 air quality data which showed levels below the 2008 ozone NAAQS for the monitor in Shelby County, Tennessee. However, in the February 27, 2012, update, Tennessee also offered an alternative recommendation for Shelby County for a potential nonattainment

5
designation requesting EPA consider only the Memphis city limits for nonattainment because 70% of the county population resided within the city limits. On April 5, 2012, Tennessee provided EPA with more supplemental information for Shelby County reiterating that Shelby County be designated attainment based on early certified 2009 – 2011 data which showed levels below the 2008 ozone NAAQS and requested that Fayette and Tipton Counties be designated attainment. In addition, Tennessee provided an alternative recommendation for Shelby County regarding a nonattainment designation requesting EPA consider the Memphis City limits of Bartlett, Germantown and Collierville and the census tracts containing the Dupont and Atofina chemical facilities. Likewise, in comments on intended ozone nonattainment area designations submitted to EPA on February 23, 2012, Arkansas withdrew its original recommendation for Crittenden County and revised it to recommend a designation of unclassifiable/attainment, based on the 2008 – 2010 design value for the ozone monitor located in the county. On February 28, 2012, the State of Mississippi also submitted additional technical information to EPA in response to EPA’s preliminary boundary determination for the Memphis, TN-MS-AR CBSA and maintained the State’s recommendation that DeSoto County be designated attainment for the 2008 8-hour ozone NAAQS. Mississippi also submitted certified updated air quality data based on the 2009 – 2011 monitoring period. EPA originally started with the CSA or CBSA areas for evaluating what areas violate and contribute to violations of the ozone NAAQS, and for final determinations refined its evaluation based on additional technical information provided by the states and tribes. After considering these recommendations and based on EPA's technical analysis described below, EPA is designating one county in Arkansas, a portion of a county in Mississippi, and one county in Tennessee (identified in Table 1 above) as nonattainment for the 2008 ozone NAAQS as part of the Memphis, TN-MS-AR multi-state nonattainment area. Factor Assessment Factor 1: Air Quality Data For this factor, EPA considered 8-hour ozone design values (in parts per billion (ppb)) for air quality monitors in counties in the Memphis, TN-MS-AR CBSA based on data for the 2008-2010 period (i.e., the 2010 design value), which are the most recent years with fully-certified air quality data for all three states. Although Mississippi and Tennessee certified their 2009 – 2011 monitoring data early for EPA to consider for designations, Arkansas did not provide its 2009 – 2011 monitoring data for EPA to use for designations. Thus the most recent full set of certified data for all portions of the Memphis, TN-MS-AR CBSA is for the 2008-2010 period. A monitor’s design value is the metric or statistic that indicates whether that monitor attains a specified air quality standard. The 2008 ozone NAAQS are met at a monitor when the annual fourth-highest daily maximum 8-hour average concentration, averaged over 3 years is 75 ppb or less. A design value is only valid if minimum data completeness criteria are met. See 40 CFR part 50 Appendix P. Where several monitors are located in a county (or a designated nonattainment area or maintenance area), the design value for the county or area is determined by the monitor with the highest level.
6
The 2010 design values for the ozone NAAQS for counties in the Memphis, TN-MS-AR CBSA are provided in Table 3 below. The locations of the design value monitors are indicated in Figure 1 above. A more detailed map of the Memphis area monitoring network is provided in Figure 2 in the attachments. Table 3. Air Quality Data3.
County State Recommended Nonattainment*
2008-2010 Design Value (ppb)
Crittenden, AR No 74 DeSoto, MS No 73 Shelby, TN No 76
*Mississippi and Tennessee based their nonattainment recommendations on 2009-2011. Arkansas based its nonattainment recommendation on 2008-2010 air quality data Based on 2008-2010 monitoring data, Shelby County, Tennessee shows a violation of the 2008 ozone NAAQS, therefore this County is included in the Memphis, TN-MS-AR nonattainment area. A county (or partial county) must also be designated nonattainment if it contributes to a violation in a nearby area. Each county without a violating monitor that is located near a county with a violating monitor has been evaluated, as discussed below, based on the five factors to determine whether it contributes to the nearby violation. Arkansas provided comments and a technical analysis of 8-hour ozone design value trends and meteorological conditions for the Memphis area, which was prepared by ICF International. A key point of the analysis prepared by ICF International is that previous studies, such as the Arkansas-Tennessee- Mississippi Ozone Study (ATMOS) study, indicate that the monitor site with the maximum design value for the area varies from year to year based on the frequency of occurrences of meteorological conditions (primarily wind directions) that are conducive to high ozone concentrations at the specific monitoring sites, and that this finding indicates that it is important to consider the monitoring sites as a group, as well as individually, in making attainment designation determinations. Factor 2: Emissions and Emissions-Related Data EPA evaluated emissions of ozone precursors (NOx and VOC) and other emissions-related data that provide information on areas contributing to violating monitors. Emissions Data EPA evaluated county-level emission data for NOx and VOC derived from the 2008 National Emissions Inventory (NEI), version 1.5, which was the most recent available at the time of the analyses (See http://www.epa.gov/ttn/chief/net/2008inventory.html). Significant emissions levels in a nearby area indicate the potential for the area to contribute to observed violations. EPA also considered any additional information we received on changes to emissions levels that are not reflected in recent inventories.
3 Only counties in the Memphis CBSA that have ozone monitors are included in this table.
7
As mentioned above, EPA received additional information from the States of Arkansas, Mississippi and Tennessee since the time EPA notified States of the preliminary boundary determination for the Memphis, TN-AR-MS nonattainment area, and this information was considered for this final designations. Arkansas provided some commentary on emissions, population, and VMT data referenced in the TSD and also submitted additional data on Crittenden County and statewide VMT data. The additional VMT data submitted by Arkansas is summarized below in the section on traffic, VMT and commuter data. While Tennessee provided information on point sources outside of the CBSA the state did not provide any additional emissions-related data for EPA to consider. Tennessee noted that some point sources in Arkansas, located outside of the Memphis, TN-MS-AR CBSA, are not subject to the same level of federal controls as sources within the area (i.e. NOx SIP call) and thus could be contributing to ozone formation in the Memphis area. Tennessee also relied on a source-category analysis of county NOx and VOC emissions. Mississippi provided supplemental emissions-related data specifically for on-road (i.e. heavy-duty diesel truck traffic along area interstate roadways) and non-road (i.e. rail, barge and freight) emission sources including a technical study on forecasting on-road mobile-source emissions for DeSoto County. Mississippi also noted in its supplemental information that the State used the same data source for emissions-related and population growth rate data. However, Mississippi stated they analyzed the population growth rate data slightly different from EPA’s analysis; Mississippi used absolute numbers rather than percentages to describe the population change over a 10-year period. Additionally, Mississippi commented on EPA’s use of the National Oceanic and Atmospheric Administration Hybrid Single Particle Lagrangian Integrated Trajectory Model (NOAA HYSPLIT) model to determine potential ozone transport on days with high monitored ozone concentrations. EPA considered all the additional information provided by the states in the analysis below. The precursor emission source-category percentages used below and throughout the document were derived from emissions data from the 2008 NEI version 1.5 referenced above. Table 4 provides emissions of NOx and VOC (given in tons per year (tpy)) for counties in the Memphis, TN-MS-AR CBSA that EPA considered for inclusion in the Memphis, TN-MS-AR nonattainment area.

8
Table 4. Total 2008 NOx and VOC Emissions.
County1 State Recommended Nonattainment NOx (tpy) VOC (tpy)
Crittenden, AR No 4,047 3,805 DeSoto, MS2 No 5,080 5,222 Fayette, TN No 2,385 1,406 Marshall, MS No 1,769 1,527 Shelby, TN No 39,519 27,929 Tate, MS No 3,102 1,392 Tipton, TN No 2,119 2,251 Tunica, MS No 1,598 1,096 Area-wide: 59,619 44,628
1Counties that EPA is designating as nonattainment are shown in bold. 2EPA designating only a portion of the county nonattainment. Shelby County contributes about 66 percent of the NOx and 63 percent of the VOC precursor emissions in the CBSA. Of the County’s 39,519 tpy NOx emissions, 35 percent are from point and 35 percent from on-road mobile sources, 20 percent from area source emissions and 10 percent from non-road emissions. Of the County’s 27, 929 tpy VOC emissions, 36 percent is derived from mobile sources and 32 percent is derived from area sources. DeSoto County contributes about 9 percent NOx and 12 percent VOC precursor emissions in the CBSA. The county’s 5,080 tpy NOx emissions are mostly comprised of 45 percent from area sources, 35 percent from on-road mobile sources and 17 percent from non-road sources. DeSoto County’s total VOC emissions include 44 percent from area sources and 34 percent from on-road mobile sources. Crittenden County contributes 6.8 percent and 8.5 percent of the CBSA NOx and VOC emissions, respectively. Of the county’s total NOx emissions listed in Table 1, 45 percent are from mobile sources, 34 percent from area sources and 16 percent from non-road emissions. The county’s total VOC emissions include 35 percent from area sources and 31 percent from mobile sources, and 5 percent of the county’s NOx emissions are from point sources. Fayette and Tipton Counties in Tennessee and Marshall, Tate, and Tunica Counties in Mississippi all contribute 5 percent or less of the total NOx and VOC precursor emissions in the CBSA. Together, Shelby, DeSoto and Crittenden Counties account for 82 percent of the NOx emissions and 84 percent of the VOC emissions for the 8-county area.
9
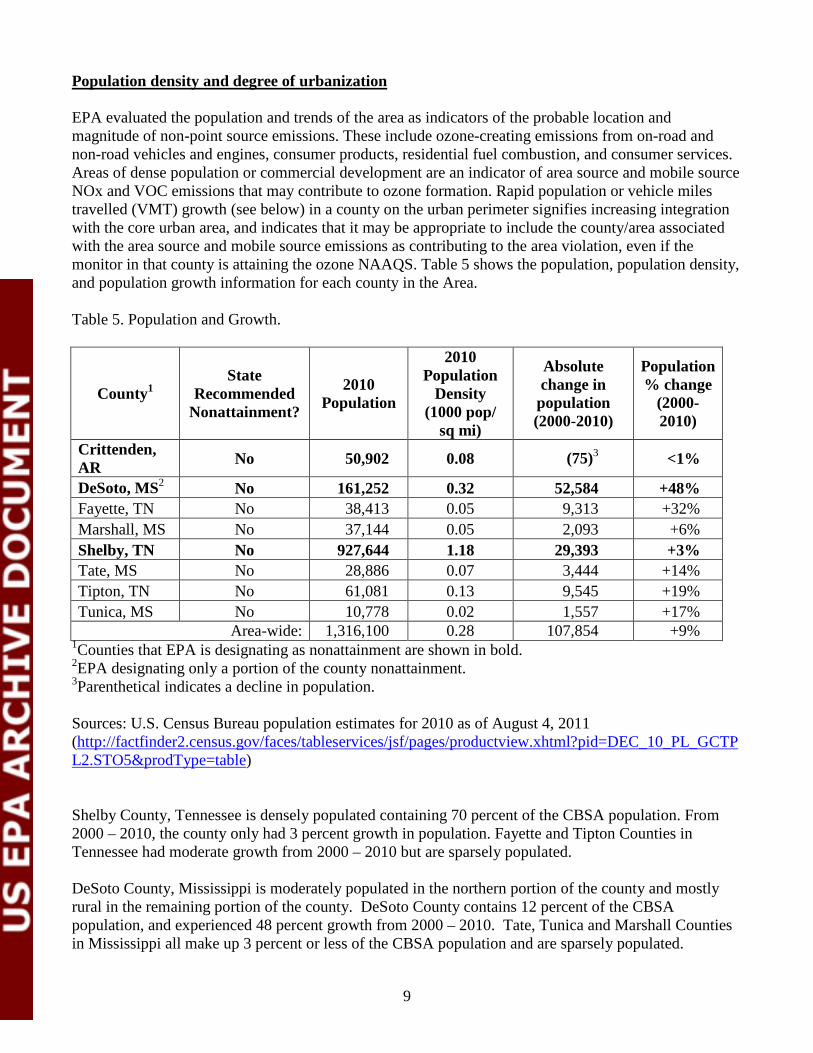
Population density and degree of urbanization EPA evaluated the population and trends of the area as indicators of the probable location and magnitude of non-point source emissions. These include ozone-creating emissions from on-road and non-road vehicles and engines, consumer products, residential fuel combustion, and consumer services. Areas of dense population or commercial development are an indicator of area source and mobile source NOx and VOC emissions that may contribute to ozone formation. Rapid population or vehicle miles travelled (VMT) growth (see below) in a county on the urban perimeter signifies increasing integration with the core urban area, and indicates that it may be appropriate to include the county/area associated with the area source and mobile source emissions as contributing to the area violation, even if the monitor in that county is attaining the ozone NAAQS. Table 5 shows the population, population density, and population growth information for each county in the Area. Table 5. Population and Growth.
County1 State
Recommended Nonattainment?
2010 Population
2010 Population
Density (1000 pop/
sq mi)
Absolute change in
population (2000-2010)
Population % change
(2000-2010)
Crittenden, AR No 50,902 0.08 (75)3 <1%
DeSoto, MS2 No 161,252 0.32 52,584 +48% Fayette, TN No 38,413 0.05 9,313 +32% Marshall, MS No 37,144 0.05 2,093 +6% Shelby, TN No 927,644 1.18 29,393 +3% Tate, MS No 28,886 0.07 3,444 +14% Tipton, TN No 61,081 0.13 9,545 +19% Tunica, MS No 10,778 0.02 1,557 +17% Area-wide: 1,316,100 0.28 107,854 +9%
1Counties that EPA is designating as nonattainment are shown in bold. 2EPA designating only a portion of the county nonattainment. 3Parenthetical indicates a decline in population. Sources: U.S. Census Bureau population estimates for 2010 as of August 4, 2011 (http://factfinder2.census.gov/faces/tableservices/jsf/pages/productview.xhtml?pid=DEC_10_PL_GCTPL2.STO5&prodType=table) Shelby County, Tennessee is densely populated containing 70 percent of the CBSA population. From 2000 – 2010, the county only had 3 percent growth in population. Fayette and Tipton Counties in Tennessee had moderate growth from 2000 – 2010 but are sparsely populated. DeSoto County, Mississippi is moderately populated in the northern portion of the county and mostly rural in the remaining portion of the county. DeSoto County contains 12 percent of the CBSA population, and experienced 48 percent growth from 2000 – 2010. Tate, Tunica and Marshall Counties in Mississippi all make up 3 percent or less of the CBSA population and are sparsely populated.

10
Crittenden County, Arkansas contains 4 percent of the CBSA population. The attachment to this document contains Figure 2, Memphis, TN-MS-AR Area Ozone and Ozone Precursor Monitoring Network, with Population Density, Figure 3a, Population Density Change Percentage Between 2000 and 2010 Census for Memphis, TN-MS-AR Area Ozone and Ozone Precursor Monitoring Network and Figure 3b, 2010 Population Density for Memphis, TN-MS-AR Area U.S. Census Groups and Tracts all present graphical information on population density and growth for the Memphis Area. Traffic VMT data and commuting patterns EPA evaluated the commuting patterns of residents, as well as the total VMT for each county in the Memphis, TN-MS-AR CBSA. In combination with the population/population density data and the location of main transportation arteries (see above), this information helps identify the probable location of non-point source emissions. A county with high VMT is generally an integral part of an urban area and indicates the presence of motor vehicle emissions that may contribute to ozone formation that contributes to nonattainment in the area. Rapid population or VMT growth in a county on the urban perimeter signifies increasing integration with the core urban area, and indicates that the associated area source and mobile source emissions may be appropriate to include in the nonattainment area. Table 6 provides total 2008 VMT for each county and 2010 worker data from the U.S. Census indicating the number of workers in each county and how many citizens work in a county with a violating monitor. Table 6. Worker and VMT Data.
County1 State
Recommended Nonattainment
2008 VMT3
(million miles)
Number of County
Workers4
(2010 data)
Number of County
Workers that Work in
Counties with Violating Monitors4
Percent of County
Workers that Work in
Counties with
Violating Monitors4
Crittenden, AR No 903 20,550 6,148 29.9% DeSoto, MS2 No 1,629 67,878 32,744 48.2% Fayette, TN No 573 16,482 10,816 65.6% Marshall, MS No 725 13,693 4,512 33.0% Shelby, TN No 8,789 376,250 324,192 86.2% Tate, MS No 376 10,854 2,170 20.8% Tipton, TN No 401 23,037 13,775 59.8% Tunica, MS No 337 4472 205 4.6%
Areawide: 13,733 1Counties that EPA is designating as nonattainment are shown in bold. 2EPA designating only a portion of the county nonattainment. 3MOBILE model VMTs are those inputs into the 2008 NEI version 1.5. 4Source: U.S. Census Bureau http://onthemap.ces.census.gov/
11
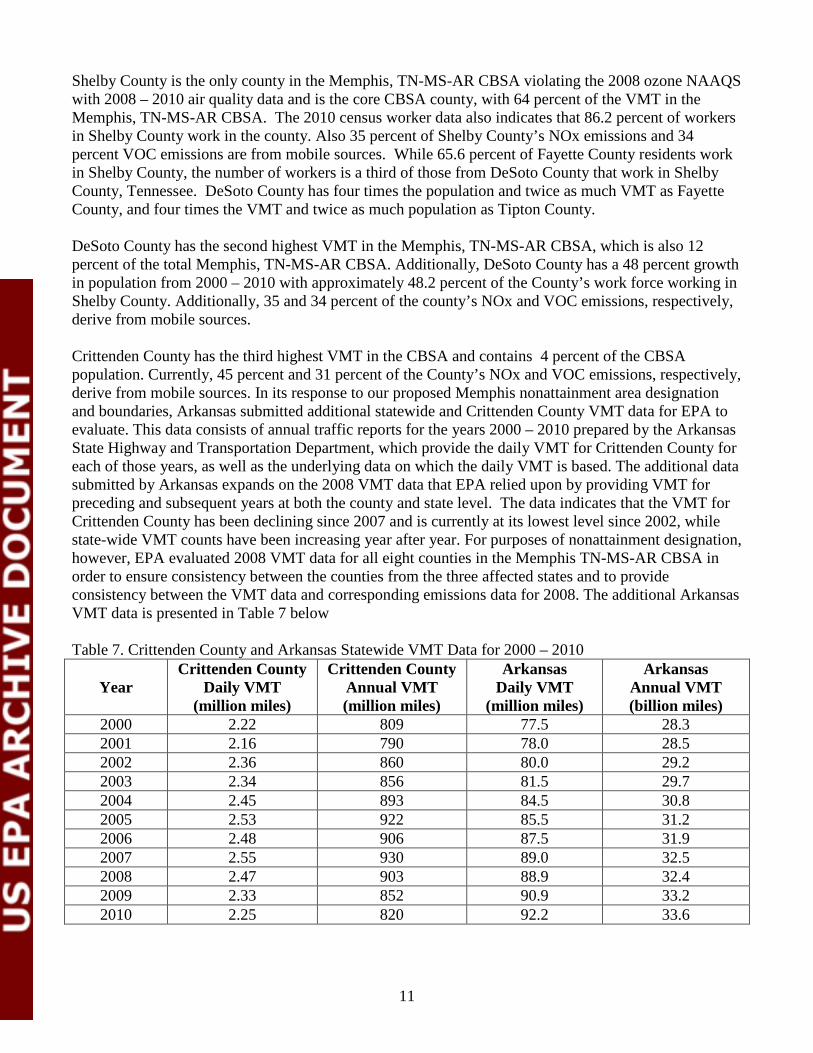
Shelby County is the only county in the Memphis, TN-MS-AR CBSA violating the 2008 ozone NAAQS with 2008 – 2010 air quality data and is the core CBSA county, with 64 percent of the VMT in the Memphis, TN-MS-AR CBSA. The 2010 census worker data also indicates that 86.2 percent of workers in Shelby County work in the county. Also 35 percent of Shelby County’s NOx emissions and 34 percent VOC emissions are from mobile sources. While 65.6 percent of Fayette County residents work in Shelby County, the number of workers is a third of those from DeSoto County that work in Shelby County, Tennessee. DeSoto County has four times the population and twice as much VMT as Fayette County, and four times the VMT and twice as much population as Tipton County. DeSoto County has the second highest VMT in the Memphis, TN-MS-AR CBSA, which is also 12 percent of the total Memphis, TN-MS-AR CBSA. Additionally, DeSoto County has a 48 percent growth in population from 2000 – 2010 with approximately 48.2 percent of the County’s work force working in Shelby County. Additionally, 35 and 34 percent of the county’s NOx and VOC emissions, respectively, derive from mobile sources. Crittenden County has the third highest VMT in the CBSA and contains 4 percent of the CBSA population. Currently, 45 percent and 31 percent of the County’s NOx and VOC emissions, respectively, derive from mobile sources. In its response to our proposed Memphis nonattainment area designation and boundaries, Arkansas submitted additional statewide and Crittenden County VMT data for EPA to evaluate. This data consists of annual traffic reports for the years 2000 – 2010 prepared by the Arkansas State Highway and Transportation Department, which provide the daily VMT for Crittenden County for each of those years, as well as the underlying data on which the daily VMT is based. The additional data submitted by Arkansas expands on the 2008 VMT data that EPA relied upon by providing VMT for preceding and subsequent years at both the county and state level. The data indicates that the VMT for Crittenden County has been declining since 2007 and is currently at its lowest level since 2002, while state-wide VMT counts have been increasing year after year. For purposes of nonattainment designation, however, EPA evaluated 2008 VMT data for all eight counties in the Memphis TN-MS-AR CBSA in order to ensure consistency between the counties from the three affected states and to provide consistency between the VMT data and corresponding emissions data for 2008. The additional Arkansas VMT data is presented in Table 7 below Table 7. Crittenden County and Arkansas Statewide VMT Data for 2000 – 2010
Year Crittenden County
Daily VMT (million miles)
Crittenden County Annual VMT (million miles)
Arkansas Daily VMT
(million miles)
Arkansas Annual VMT (billion miles)
2000 2.22 809 77.5 28.3 2001 2.16 790 78.0 28.5 2002 2.36 860 80.0 29.2 2003 2.34 856 81.5 29.7 2004 2.45 893 84.5 30.8 2005 2.53 922 85.5 31.2 2006 2.48 906 87.5 31.9 2007 2.55 930 89.0 32.5 2008 2.47 903 88.9 32.4 2009 2.33 852 90.9 33.2 2010 2.25 820 92.2 33.6

12
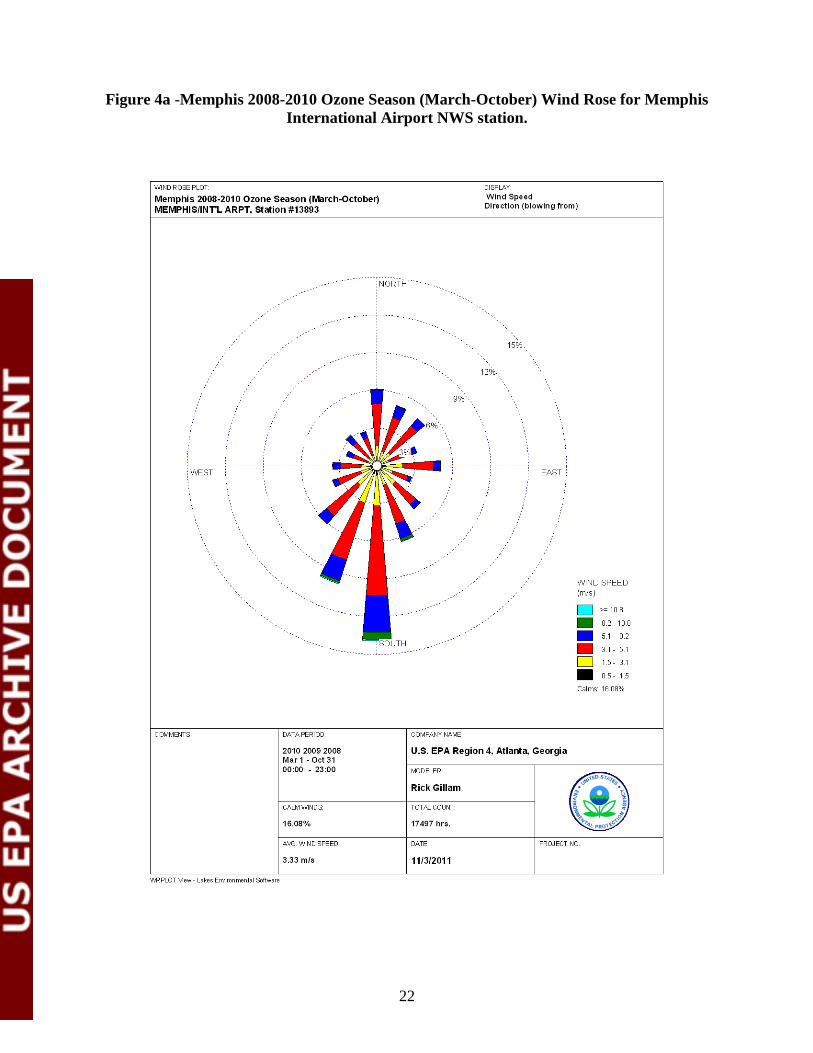
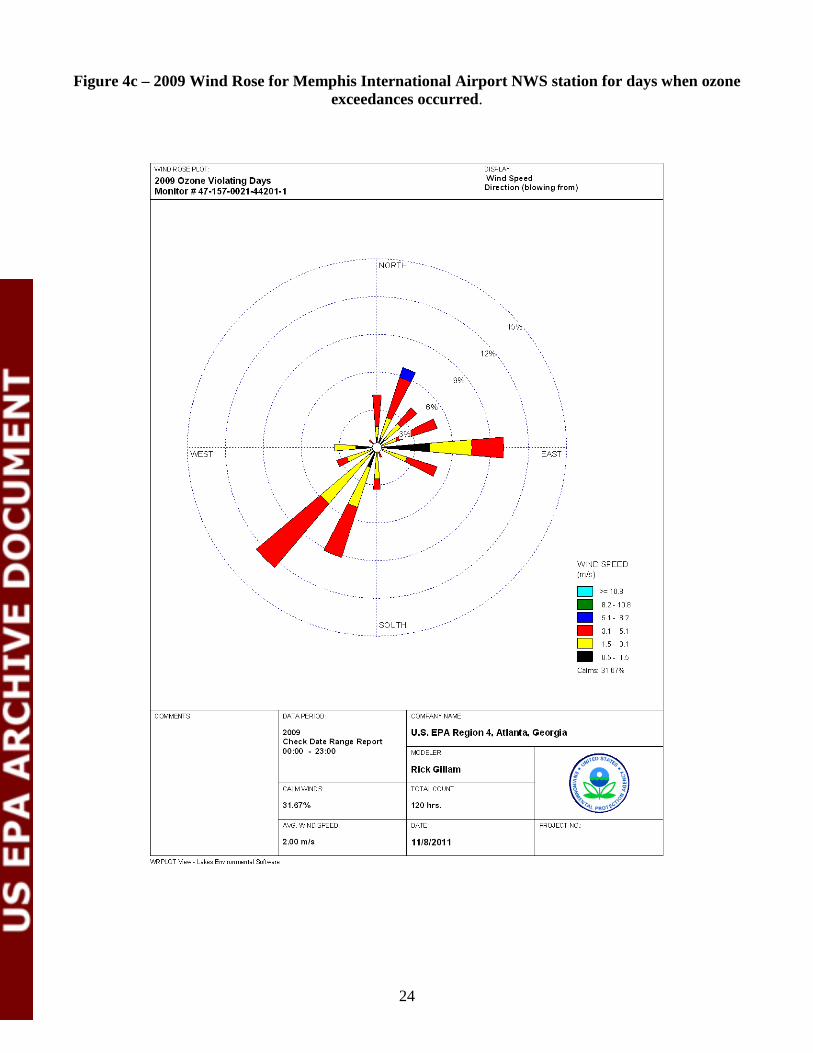
Of the 8-county area, Crittenden County, Arkansas, DeSoto County, Mississippi, and Shelby County, Tennessee are all characterized by comparatively high VMT that exceed 900 million miles. Collectively, these counties account for 82 percent of the total VMT in the eight-county area. Factor 3: Meteorology (weather/transport patterns) For this factor, EPA analyzed 30-years of National Weather Service (NWS) wind speed and wind direction data collected at the Memphis International Airport (NWS Station 13893) to help determine transport patterns and source contributions. EPA initially assessed wind direction and speed for the 2008-2010 “ozone season” (March through October) in the Memphis CBSA and also evaluated only days when area ozone monitors exceeded the 2008 ozone NAAQS (See Figures 4a – 4d). EPA’s analysis of just the 2008-2010 NWS data indicates predominate south and south-southwest component for the Memphis CBSA. However, an examination of days when monitors in DeSoto County (Hernando) exceeded the 2008 ozone NAAQS suggested a northerly component. Additionally, on days when other monitors in Shelby County exceeded the 2008 NAAQS, the data indicated a southerly wind component. We performed these and other analyses to better understand the fate and transport of precursor emissions contributing to ozone formation in the Memphis Area. While the current Design Value for the Memphis CBSA monitors is typically set at one of the three monitors in Tennessee or Arkansas, exceedances at the other monitors will also have to be assessed in order to bring the area into attainment. Arkansas provided a conceptual ozone analysis report and a summary analysis report for periods when exceedances have occurred at the Memphis CBSA monitors.4 This report indicates that the site with the maximum design value and highest frequency of exceedances varies from year to year based on frequency of occurrence of meteorological conditions (primarily wind directions) that are conducive to high ozone at the specific sites. Arkansas’s information indicated that high ozone days measured at the:
• Shelby County monitors were characterized by southerly, southwesterly, west-southwesterly and northeasterly winds on the surface;
• Crittenden County’s Marion monitor were characterized by southeasterly and some easterly surface winds;
• Desoto County’s Hernando monitor were characterized by northwesterly through northeasterly and some easterly surface winds.
A key summary point of the analysis provided by Arkansas is that since the monitor site with the maximum design value for the area varies from year to year based on the frequency of occurrences of meteorological conditions (primarily wind directions) that are conducive to high ozone concentrations at the specific monitoring sites, they make a finding indicating that it is important to consider the monitoring sites as a group, as well as individually, in making attainment designation determinations. Overall, both EPA and ADEQ’s analyses of the NWS surface wind analyses indicate that on exceedance days at Memphis area monitors (Shelby, Desoto, and Crittenden County monitors), surface winds are much lighter and range from northeasterly to southwesterly (through easterly) on these days with less occurrences of westerly flows. Analyses also indicate that the DV monitor moves based on the more
4 Attachments to Arkansas Governor letter and ADEQ report, “Conceptual Description for 8-Hour Ozone for Crittenden County, Arkansas and the Memphis Metropolitan Area Final Report”, June 22, 2006
13
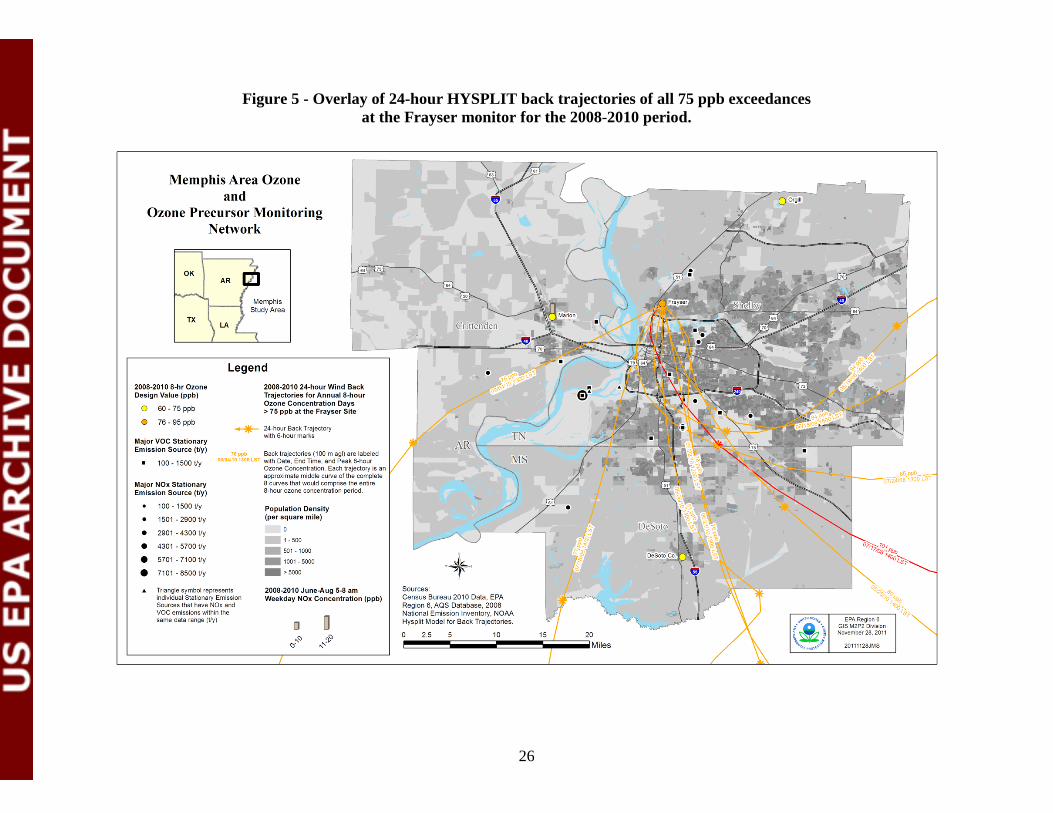
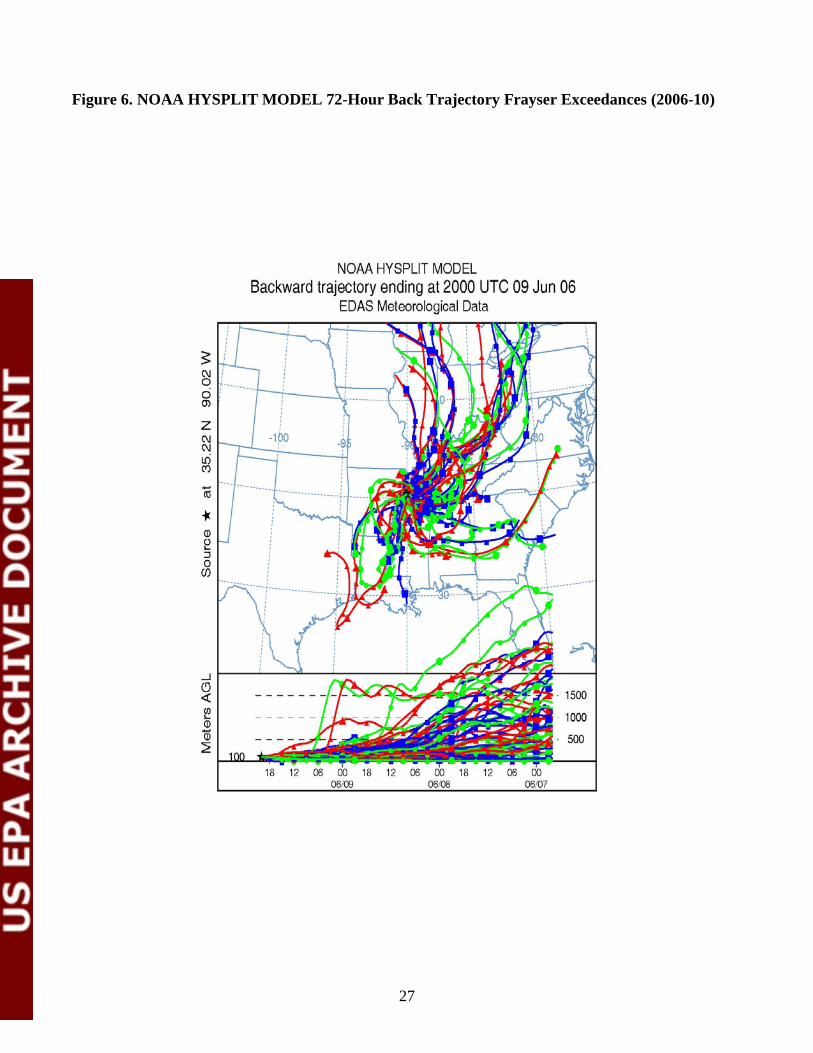
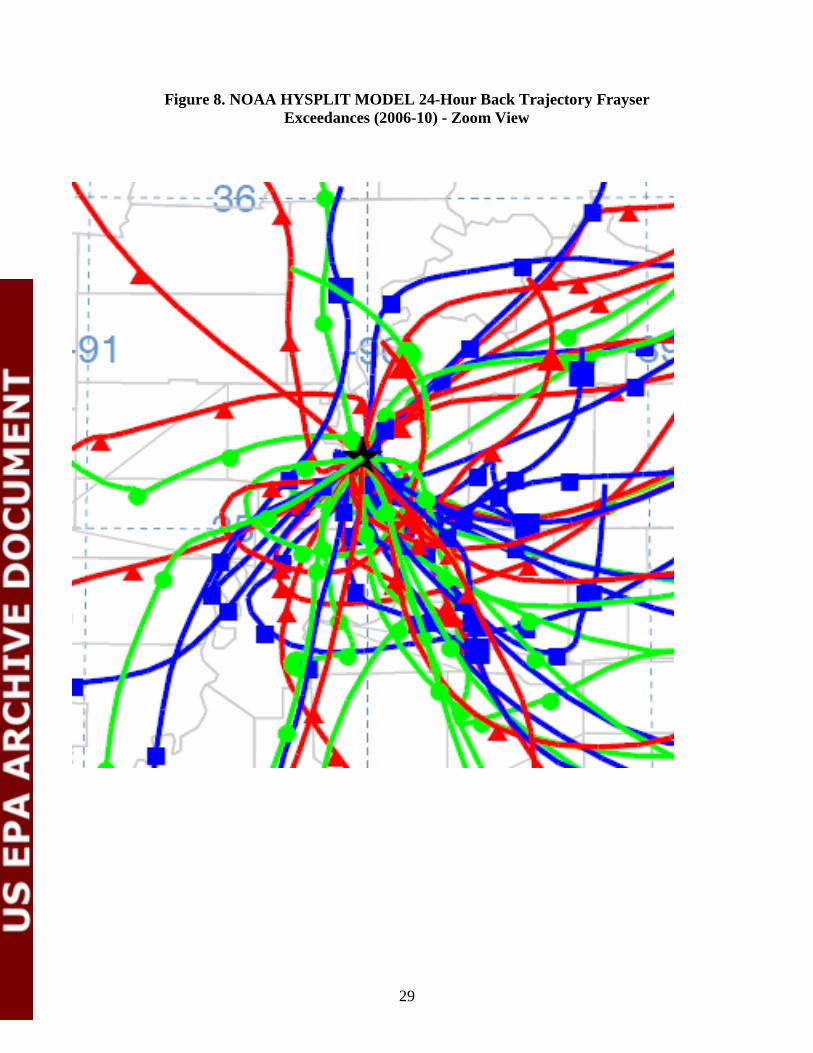
predominant winds during a three year period and all monitors should be considered due to the variability meteorology when ozone exceedances occur. In addition to the NWS surface data analysis EPA evaluated wind back trajectories (which are an analysis of meteorological patterns) specifically on days when the current ozone design value monitor in Shelby County (Frayser monitor) exceeded the 2008 NAAQS. These analyses were conducted to better understand the fate and transport of precursor emissions contributing to ozone formation. To conduct wind back trajectory analyses, we initially utilized the NOAA HYSPLIT model to assess all exceedances at the Frayser monitor for the years 2008 – 2010. An examination of the meteorological data indicates that, for the 2008 – 2010 days with ozone concentrations above 75 ppb at the Memphis 2008 – 2010 Design Value site in Shelby County (Frayser monitor), the wind back trajectories primarily go back through Shelby County, Tennessee (on 10 out of 10 days) and DeSoto County, MS (on 7 out of 10 days), with back trajectories going back through Crittenden County, AR on 1 out of 10 days. HYSPLIT trajectories alone do not conclusively indicate contribution to monitored violations of the ozone NAAQS and therefore cannot be used to determine inclusion or exclusion of an area with regard to ozone designations. Rather, HYSPLIT trajectories are useful supporting information that complement other meteorological information, as well as information concerning the other factors, (emissions, etc.). For this reason, one can not set any interpretative thresholds, such as the percentage of trajectories that must traverse an area, for an area to be considered as contributing Since the 2008 – 2010 data is only for three years and has only 10 exceedance days, we evaluated more years to better understand the meteorological transport conditions that exist during ozone exceedances. Normally when we are developing a conceptual model understanding of what yields ozone exceedances in an area we will evaluate 5 to 10 years worth of meteorological data. Therefore we decided to evaluate all days that had ozone exceedances at the Design Value monitor (Frayser) for the 2006 – 2010 period. The 2006 and 2007 years had more meteorology that was conducive for ozone formation than the years of 2008, 2009, and 2010. Figure 6 in the attachment to this document includes 72-hour back trajectories for 2006 – 2010 ozone exceedances at the Shelby County Frayser monitor using HYSPLIT. To further understand the meteorological transport conditions within the regional area around Memphis, we also refined and evaluated 24-hour back trajectories for the 2006-2010 time-periods using the NOAA HYSPLIT model. The results of these back trajectories are included in the attachment to this document as Figure 7 with a further zoom in view in Figure 8. Evaluation of Figures 7 and 8 further supports our previous conclusions based on the 2008-2010 back trajectories when the Memphis area Frayser monitor has ozone exceedances. The 2006-2010 data further supports that most of the centerlines of the back trajectories passes through Shelby County Tennessee, and many of the back trajectory centerlines pass through DeSoto County in northern Mississippi with a smaller percentage passing through Crittenden County, Arkansas. EPA’s meteorological assessment of the area monitors ozone exceedances and specifically the wind back trajectory analysis at the Shelby County Frayser monitor indicate that emissions from Shelby, DeSoto and Crittenden Counties likely contribute to exceedances of the 2008 NAAQS at the Frayser monitor. See Figure 9 - Memphis, TN-MS-AR Area 2008-2010 Back Trajectories from the Shelby County, Tennessee Frayser monitor that Cross DeSoto County, Mississippi, and also Figure 10 - Memphis, TN-MS-AR Area 2008-2010 Back Trajectories from the Shelby County, Tennessee Frayser monitor for Ozone NAAQS exceedances. As stated above, HYSPLIT back trajectories alone do not determine inclusion or exclusion of an area with regard to ozone designations but in fact are supporting information that compliments other

14
meteorological information as well as information concerning the other factors such as emissions, population growth and urbanization and, traffic/worker patterns. See Figures 2, 3a and 3b. Figure 2, Memphis Area Ozone and Ozone Precursor Monitoring Network and Figure 5 present graphical information on 24-hour back trajectories for exceedances in 2008-2010 at the Frayser monitor, locations of major stationary sources, and locations of ambient monitors with their design values. Figure 3a presents the Memphis Area population density percent change between 2000 and 2010 U.S. Census and ozone monitor locations. Figure 3b illustrates the Memphis Area 2010 population density based on census groups and tracts. Arkansas also provided an analysis of wind directions on exceedance days at the Shelby County Frayser monitor for the last 15 years (1996-2010) and estimated that 15.6% of the exceedance days had one or more hours of southwest to northwest winds. Based on this analysis they concluded emissions from Crittenden County had the potential to contribute to an ozone exceedance 2.8 days per year on average. Arkansas also provided an analysis that used a combination of wind frequency from Crittenden to exceedance days at Frayser multiplied by the ratio of Crittenden County Emissions divided by the total 3 county emissions total (Shelby County, TN; Crittenden County, AR, and DeSoto County emissions). This assumes that emissions from the three county area contribute equally and linearly to a monitored ozone exceedance. There is a wide variety of reaction rates for differing VOC compounds that make up the total VOCs. This metric also assumes that all emissions in the three county area evenly added to a monitored ozone exceedance. Since not all emissions in the 3-county area would ever converge to impact one monitor this is not a reasonable approach. Furthermore, ozone chemistry is not linear and is also dependent upon a number of parameters. We disagree with the use of this metric and the conclusions that Arkansas made based on this data that Crittenden does not significantly contribute to exceedances in the area. We also disagree with the conclusions of Arkansas’ wind analysis and the wind and emission ratio analysis. These analyses only concentrated on the Frayser monitor which conflicts with conclusions that are in ADEQ’s conceptual model report for ozone exceedances in Memphis. The report indicates that analyses should be done for all the monitors in the Memphis area network, since changes in predominant wind patterns results in other monitor(s) than the Frayser monitoring being the monitor that sets the area design value. Furthermore, to bring the area into attainment, all the area monitors and meteorological regimes will have to be addressed in an attainment demonstration as Arkansas’ Conceptual model report indicates and summarized elsewhere in this TSD. EPA also performed a wind speed and transport analysis using data from the Memphis International Airport NWS station in combination with HYSPLIT back trajectories to further evaluate the potential for emissions from DeSoto County, Mississippi, to contribute to exceedances of the ozone standard measured at the Frayser monitor during the 2008-2010 timeframe. The analysis considered the surface-level wind speeds and directions, temperatures and cloud cover conditions, which are all important factors for ozone formation during the peak ozone concentration events at the Shelby County (Frayser monitor). See Figure 9 - Memphis, TN-MS-AR Area 2008-2010 Back Trajectories from the Shelby County Frayser monitor that Cross DeSoto County, Mississippi. This analysis indicated that the range of transport times for DeSoto County precursor emissions to the Frayser ozone monitor is approximately 3-8 hours with average wind speeds of 3-5 miles per hour. The high temperatures ranged from the high 80's through mid-90's during the peak ozone times in the afternoon with clear skies for almost the entire period. This combination of clear skies (high incoming solar radiation), low wind speeds and high temperatures are favorable conditions for ozone formation. Under these conditions, it is very possible that the NOx and VOC emissions from the local sources, including sources in DeSoto County, are contributing to the elevated ozone concentrations measured at the Shelby County Frayser monitor. Information evaluated also supports that Crittenden County emissions contribute to elevated ozone
15
concentrations when winds are from the west-southwest and southwest and also during light wind conditions (See figure 10). EPA’s wind speed and transport analysis and the HYSPLIT trajectory analyses indicate that emissions from Shelby County, Tennessee, DeSoto County, Mississippi, and Crittenden County, Arkansas, are impacting measured ozone concentrations in the area and emissions from other counties in the CBSA are less likely to affect ozone levels. Factor 4: Geography/topography (mountain ranges or other air basin boundaries) The geography/topography analysis evaluates the physical features of the land that might affect the air shed and, therefore, the distribution of ozone over the area. The Memphis, TN-MS-AR CBSA does not have any geographical or topographical barriers limiting air pollution transport within its air shed. Therefore, this factor did not play a significant role in this evaluation. Factor 5: Jurisdictional boundaries Once EPA identified the general areas that the Agency anticipated would be included in the nonattainment area, EPA then considered existing jurisdictional boundaries for the purpose of providing a clearly defined legal boundary and to help identify the areas appropriate for carrying out the air quality planning and enforcement functions for nonattainment areas. Examples of jurisdictional boundaries include existing/prior nonattainment area boundaries for ozone or other urban-scale pollutants, county lines, air district boundaries, township boundaries, area covered by an MPO, state lines, Areas of Indian Country, and urban growth boundary. Where existing jurisdictional boundaries were not adequate or appropriate to describe the nonattainment area, other clearly defined and permanent landmarks or geographic coordinates were considered. Memphis, TN-MS-AR CBSA has previously established nonattainment boundaries associated with both the 1-hour ozone and 1997 8-hour ozone NAAQS. The Memphis nonattainment boundary for the 1-hour ozone NAAQS included Shelby County, Tennessee in its entirety. Whereas the Memphis nonattainment boundary for the 1997 8-hour ozone NAAQS included Crittenden County, Arkansas and Shelby County, Tennessee in their entireties. In the 120-consultation period, Tennessee, Mississippi and Arkansas provided information and requests for their individual counties to be designated attainment. The Memphis Urban Area MPO is within the Memphis, TN-MS-AR, CBSA and is considered the multi-jurisdictional agency responsible for the implementation and coordination of urban transportation planning for all of Shelby County, Tennessee, the western four miles of Fayette County, Tennessee and the northern twelve miles of DeSoto County, Mississippi. The portion of the Memphis Urban MPO in DeSoto County captures the more urbanized portion of the county that has experienced continuous growth and is the boundary that EPA recommended as part of the Memphis, TN-MS-AR nonattainment area in December 2011.

16
Conclusion Based on the assessment of the factors described above, EPA is designating the following counties as nonattainment for the Memphis, TN-MS-AR area because they are either violating the 2008 ozone NAAQS or contributing to a violation in a nearby area: Crittenden County, Arkansas, and Shelby County, Tennessee in their entireties, and the portion of DeSoto County that is included in the Memphis MPO boundary. Two of these counties (i.e., Crittenden County, Arkansas and Shelby County, Tennessee) were included in the Memphis nonattainment area for the 1997 ozone NAAQS. One of the air quality monitors in Shelby County indicates violation of the 2008 ozone NAAQS based on 2008-2010 design values, therefore this county is included in the nonattainment area. Crittenden County, Arkansas, and DeSoto County, Mississippi are nearby counties that do not have monitors indicating a violation of the NAAQS based on 2008-2010 design values. However, EPA has determined that these counties (or portions thereof) contribute to the ozone concentrations in violation of the 2008 ozone NAAQS through population-based emissions from mobile and area sources (e.g., vehicles and other small area sources). Source category emissions data indicate that mobile sources and area sources are the primary drivers of contribution to ozone formation in the Memphis, TN-MS-AR CBSA. Thus, population-based emissions such as total population or population growth, area 2009 workforce patterns and precursor emission transport would indicate a county (or portions thereof) with contribution in the Memphis, TN-MS-AR CBSA. Additionally, EPA’s meteorological assessment of the Memphis area indicates that emissions of ozone precursors from sources in Shelby County, Tennessee, DeSoto County, Mississippi, and Crittenden County, Arkansas, are contributing to ozone exceedances measured at monitors in the area. Shelby County, Tennessee dominates the CBSA in terms of urbanization, precursor emission contribution and transport which indicate population-based emission (mobile and area sources) contribution to violations of monitors in the Memphis, TN-MS-AR CBSA. Although the county population growth was less than 5 percent from 2000-2010, it is densely populated with 70 percent of the CBSA population and five times DeSoto County’s population. Shelby County makes up over 60 percent of the area’s NOx and VOC emissions. Of the county’s 39,519 tpy NOx emissions, 35 percent are from point and 35 percent from on-road mobile sources, 20 percent from area source emissions and 10 percent from non-road emissions. Of the County’s 27, 929 tpy VOC emissions, 36 percent is derived from mobile sources and 32 percent is derived from area sources. Also, EPA’s analysis of meteorology and the conceptual model for high ozone events in the Memphis area and 2010 worker data indicate that Shelby County is contributing to violations at monitors in the Memphis, TN-MS-AR CBSA and should be designated nonattainment for the Memphis, TN-MS-AR nonattainment area. The population in DeSoto County, Mississippi has grown steadily from 2000-2010 (particularly the northern portion of the county) with a 48 percent increase, even though it only makes up 12 percent of the total population in the CBSA. The county also has the CBSA’s second highest VMT. More than 30 percent of the county’s NOx and VOC emissions are from mobile sources and over 40 percent are from area sources. In addition, EPA’s analysis of meteorology and the conceptual model for high ozone events in the Memphis area suggests that DeSoto County is contributing to the violation in Shelby County due to southerly transport of mobile and area emissions as well as back trajectories indicating wind direction from DeSoto County on high ozone days at the monitors in the Memphis, TN-MS-AR CBSA. While DeSoto County does not have a monitor violating the 2008 ozone NAAQS, the area and mobile emissions in the portion of DeSoto County that is being designated nonattainment indicate that it is an integral part of the Memphis, TN-MS-AR CBSA, and contributes to violations at monitors in the Memphis, TN-MS-AR CBSA.
17
Crittenden County, Arkansas contains 4 percent of the CBSA population and makes up 6.8 percent and 8.5 percent of the CBSA NOx and VOC emissions respectively. Also, Crittenden County has over 40 percent of its NOx emissions deriving from area sources, which are considered a primary contributor to the formation of ozone in the Memphis, TN-MS-AR CBSA. In addition, EPA’s analysis of meteorology and the conceptual model for high ozone events in the Memphis area indicates that the county’s emissions contribute at times to violations of the 2008 ozone NAAQS in the area. The remaining Tennessee (Tipton, Fayette) and Mississippi (Marshal, Tate, and Tunica) counties all have low population and urbanization, and precursor emission contribution suggesting that these areas do not contribute to violations at the monitors in the Memphis, TN-MS-AR CBSA. These areas have not previously been included as part of the Memphis nonattainment area for other ozone NAAQS.
18
ATTACHMENTS
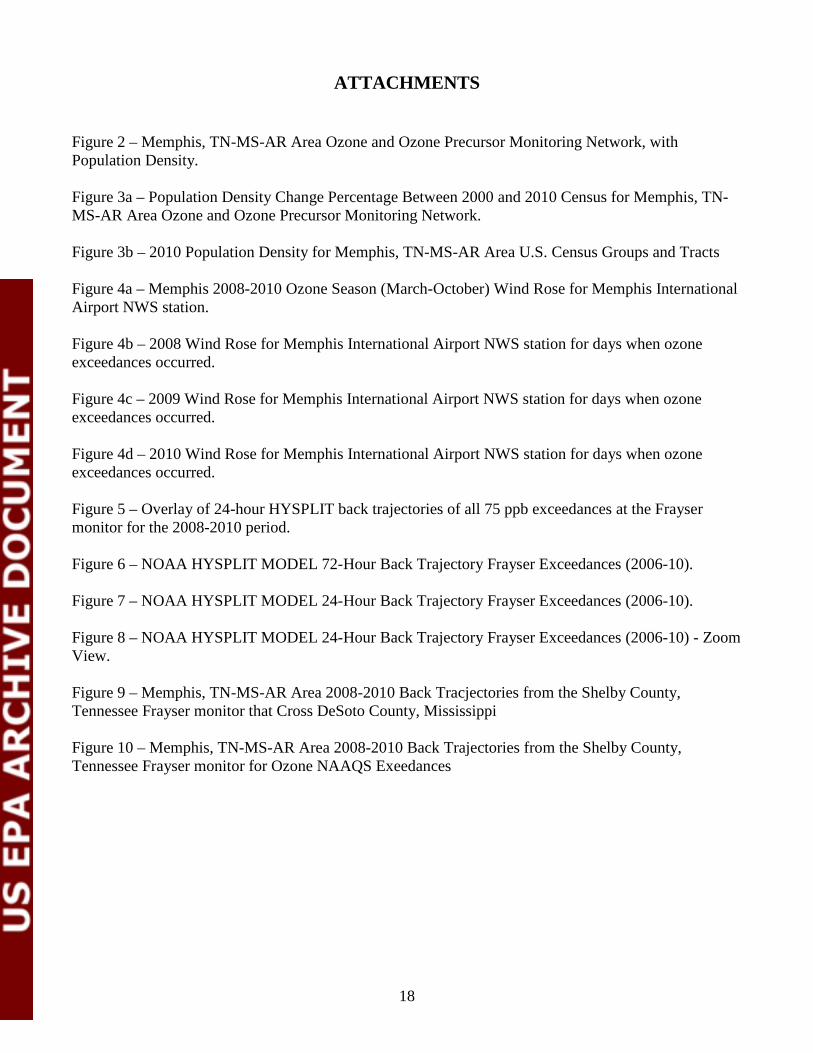
Figure 2 – Memphis, TN-MS-AR Area Ozone and Ozone Precursor Monitoring Network, with Population Density. Figure 3a – Population Density Change Percentage Between 2000 and 2010 Census for Memphis, TN-MS-AR Area Ozone and Ozone Precursor Monitoring Network. Figure 3b – 2010 Population Density for Memphis, TN-MS-AR Area U.S. Census Groups and Tracts Figure 4a – Memphis 2008-2010 Ozone Season (March-October) Wind Rose for Memphis International Airport NWS station. Figure 4b – 2008 Wind Rose for Memphis International Airport NWS station for days when ozone exceedances occurred. Figure 4c – 2009 Wind Rose for Memphis International Airport NWS station for days when ozone exceedances occurred. Figure 4d – 2010 Wind Rose for Memphis International Airport NWS station for days when ozone exceedances occurred. Figure 5 – Overlay of 24-hour HYSPLIT back trajectories of all 75 ppb exceedances at the Frayser monitor for the 2008-2010 period. Figure 6 – NOAA HYSPLIT MODEL 72-Hour Back Trajectory Frayser Exceedances (2006-10). Figure 7 – NOAA HYSPLIT MODEL 24-Hour Back Trajectory Frayser Exceedances (2006-10). Figure 8 – NOAA HYSPLIT MODEL 24-Hour Back Trajectory Frayser Exceedances (2006-10) - Zoom View. Figure 9 – Memphis, TN-MS-AR Area 2008-2010 Back Tracjectories from the Shelby County, Tennessee Frayser monitor that Cross DeSoto County, Mississippi
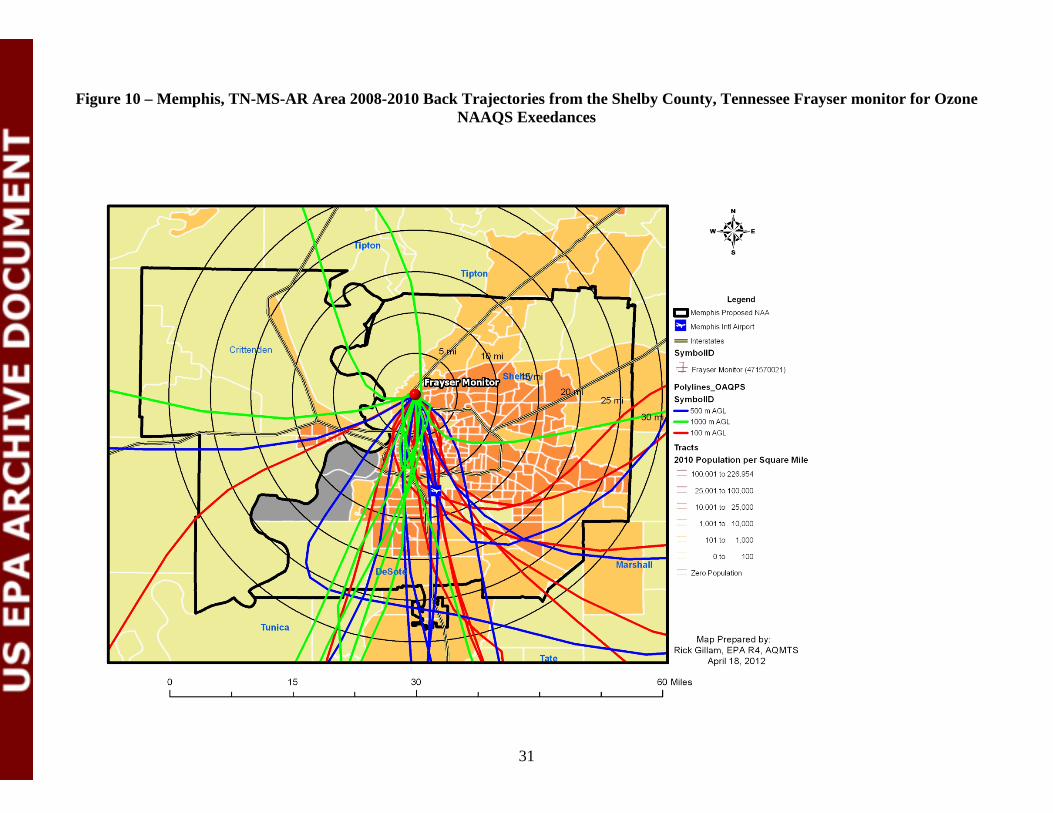
Figure 10 – Memphis, TN-MS-AR Area 2008-2010 Back Trajectories from the Shelby County, Tennessee Frayser monitor for Ozone NAAQS Exeedances

19
Figure 2 – Memphis, TN-MS-AR Area Ozone and Ozone Precursor Monitoring Network, with Population
Density.

20
Figure 3a – Population Density Change Percentage Between 2000 and 2010 Census for Memphis, TN-MS-AR Area Ozone and Ozone Precursor Monitoring Network

21
Figure 3b – 2010 Population Density for Memphis, TN-MS-AR Area U.S. Census Groups and Tracts
22
Figure 4a -Memphis 2008-2010 Ozone Season (March-October) Wind Rose for Memphis
International Airport NWS station.

23
Figure 4b – 2008 Wind Rose for Memphis International Airport NWS station for days when ozone exceedances occurred.
24
Figure 4c – 2009 Wind Rose for Memphis International Airport NWS station for days when ozone exceedances occurred.

25
Figure 4d – 2010 Wind Rose for Memphis International Airport NWS station for days when ozone exceedances occurred
26
Figure 5 - Overlay of 24-hour HYSPLIT back trajectories of all 75 ppb exceedances
at the Frayser monitor for the 2008-2010 period.
27
Figure 6. NOAA HYSPLIT MODEL 72-Hour Back Trajectory Frayser Exceedances (2006-10)

28
Figure 7. NOAA HYSPLIT MODEL 24-Hour Back Trajectory Frayser Exceedances (2006-10)
29
Figure 8. NOAA HYSPLIT MODEL 24-Hour Back Trajectory Frayser
Exceedances (2006-10) - Zoom View

30
Figure 9 – Memphis, TN-MS-AR Area 2008-2010 Back Tracjectories from the Shelby County, Tennessee Frayser monitor that Cross DeSoto County, Mississippi
31
Figure 10 – Memphis, TN-MS-AR Area 2008-2010 Back Trajectories from the Shelby County, Tennessee Frayser monitor for Ozone
NAAQS Exeedances
Related Documents

![12 Ways Employers Violate FMLA [Data Driven]](https://static.cupdf.com/doc/110x72/58775ec81a28ab4e4f8b636b/12-ways-employers-violate-fmla-data-driven.jpg)