Temperature sensitivity of soil respiration Supervisor: Petr Čapek Date: 28.09.2016 Group: 3 Students: Miriam Ahrens, Gabrielle Almecija, Daria Ashmarina, Petra Polická, David Sednev, Sabrina Tichy

Welcome message from author
This document is posted to help you gain knowledge. Please leave a comment to let me know what you think about it! Share it to your friends and learn new things together.
Transcript

0
Temperature sensitivity of soil respiration
Supervisor: Petr Čapek
Date: 28.09.2016
Group: 3
Students:
Miriam Ahrens, Gabrielle Almecija, Daria Ashmarina,
Petra Polická, David Sednev, Sabrina Tichy

1
Table of Contents
1. Introduction ................................................................................................................................... 2
2. Material and methods ................................................................................................................... 5
3. Results........................................................................................................................................... 6
4. Discussion ................................................................................................................................... 10
4.1 Comparison with Gershenson et al. (2009) ............................................................................ 10
4.2 Potential problems ................................................................................................................. 11
5. Bibliography ............................................................................................................................... 12

2
1. Introduction
Decomposition is an important process involving many factors (Wardle et al, 2006) as temperature
(Batjes, 1996), microorganisms (Parkinson & Coleman, 1991), substrate availability (Gershenson et
al, 2009). This process is responsible for carbon recycling. The soil is a global stock of organic
matter, twice bigger than is the atmosphere (Shimel, 1995). The carbon arrives from leaves, roots
detritus and animal corpse (Davidson & Janssens, 2006). There is also a rate of soil respiration (flux
of CO2). This production of CO2 in soils comes from root respiration and microbial decomposition
of organic matter (Davidson & Janssens, 2006). This soil respiration is essential to understand the
potential feedbacks to climate change (Schlesinger & Andrews, 2000).
Figure 1 represents the exponential curve of decomposition dependent on temperature. The
temperature sensitivity is explained by the Q10. This Q10 is defined as a factor by which the rate of
decomposition increases with a 10°C rise in temperature (Davidson & Janssens, 2006).
Figure 1: Rate of decomposition dependent on temperature and Q10 value

3
For now, two theories could explain the relation between the decomposition rate and the temperature
– the kinetic theory and the metabolic theory.
The first kinetic theory is mainly focused on activation energy of decomposing material. Basically,
the higher is a temperature the higher soil respiration rate occurs. However, this kinetic theory says
that the sensitivity of rise with the temperature (represented by Q10) will be higher in the presence of
hardly decomposable material in the soil organic matter (Figure 2), as cellulose, than on easily
decomposable material, as glucose.
The second theory is the metabolic theory (Gillooly et al, 2001). This theory includes microbes as
well as all other organisms. Microorganisms decompose the organic matter and their activity depends
on the temperature (Gillooly et al, 2001). With the temperature increase growths also the activity of
microbes and this activity is linked to the respiration rate (figure 3). Gillooly et al explained that the
Q10 is always similar (2.4) for all organisms between 0°C and 40°C. Even if there are more microbes
in the soil the shape of the curve is the same which says that the Q10 is independent of body mass.

4
Even though both these theories seem to be right, Gershenson et al, 2009 presents some problems.
They found that with an increase of substrate availability, the temperature sensitivity increases. These
results cannot be explained by both theories therefore in our study we aimed to verify one or both
theories by another experiment and find out how Q10 varies with the temperature and the availability
of substrate. For this experiment, we used one organic soil and one mineral soil to which we added
some glucose and cellulose and measured the respiration rate of soil.
Figure 3: Respiration rate of microbes

5
2. Material and methods
Soil sampling
Soil sample was collected from randomly chosen location in spruce forest of Sumava mountains.
During the sampling soil was divided into organic and mineral part. All soil samples were brought to
the laboratory, get off visible roots and homogenized. Each sample of organic and mineral soil was
divided into nine 20 g aliquots; each aliquot was placed in a separate flask. The flasks were separated
into three groups with three samples – first was treated by glucose (G+), second with cellulose (Ce)
and the last was a control (C) sample. Amount of added glucose and cellulose was calculated on the
basis of presumed quantity of microorganisms in soil samples. Accordingly, to the flasks with mineral
soil was added 3,5 g of glucose and 3,15 g of cellulose and to the flasks with organic soil 8 g of
glucose and 7,2 g of cellulose. Then each flask from each group were divided among three
temperature treatments (10, 20 and 30 °C) and put into the incubators. The experiment was started
two days from the initial collection of samples and passed during 24 hours.
Measuring soil respiration
After keeping samples in incubators via gas chromatograph we measured CO2 concentrations which
detect soil respiration. Briefly, gas chromatograph is a chemical analysis instrument for separating
chemicals in a complex sample. A gas chromatograph uses a flow-through narrow tube known as
the column, through which different chemical constituents of a sample pass in a gas stream (carrier
gas, mobile phase) at different rates depending on their various chemical and physical properties and
their interaction with a specific column filling, called the stationary phase. As the chemicals exit the
end of the column, they are detected and identified electronically. In our case using gas
chromatograph we recorded the concentration of CO2 in the sample. Respiration measurement for
one sample lasted approximately 2 min. The rate of substrate-induced respiration remained constant
during the measurement period.
Data processing
After measuring the respiration of soil types at different temperatures, we processed the data using
the programs Excel and STATISTIKA, plotted dependence of respiration rate on temperature and
calculated Q10 for each type of soil sample.
The Q10 was calculated for each type of soil from respiration rates for the three different temperatures.
For the calculation was used a statistical programme STATISTICA – the nonlinear estimation
regression. From this regression we obtained the “a” parameter and the Q10 was calculated according
to the equation EXP (a*10) and the 95% confidence intervals of Q10 estimate were calculated.

6
3. Results
If the kinetic theory works, Q10 should increase with cellulose in comparison to glucose in both soil
types because, according to this theory, Q10 only depends on the activation energy, which is higher
for cellulose than for glucose.
If the metabolic theory works, Q10 should be in both soil types and for all substrates the same (around
2.4) as it doesn‘t depend on the biomass.
Of each sample, the respiration rate was measured at the three different temperatures 10, 20 and 30°C.
Based on these three measurements of each sample, an exponential graph was approached. For the
calculation was used a statistical programme STATISTICA – the nonlinear estimation regression.
As you can see in figure 4 there is a positive relation between respiration rate (μmol C/g*h) and
temperature (°C). In each sample a higher respiration rate in the organic soil could be detected than
in the mineral soil. The highest respiration rate has the sample with glucose, in organic soil as well
as in mineral soil, the lowest have the ones with cellulose in both soil types.
So we can say the higher the temperature the higher the respiration rate in each sample.
Fig. 4: Respiration rate as a function of the Temperature in °C. OC: Organic Control, OG: Organic
soil with Glucose, Oce: Organic Soil with Cellulose. MC: Organic Control, MG: Organic soil with
Glucose, MCe: Organic Soil with Cellulose

7
From the regression we obtained the “a” parameter and the Q10 was calculated according to the
equation EXP (a*10). The calculation included the pH of the samples and the resultant dissolved parts
of CO2 in the hydrous part of the soil as HCO3- and H2CO3 to get accurate Q10 values. The results are
shown in figure 5 and table 1.
Fig. 5: Q10 values and the confidence interval of the different soil types with the different substrates.
OC: Organic Control, OG: Organic soil with Glucose, Oce: Organic Soil with Cellulose. MC:
Organic Control, MG: Organic soil with Glucose, MCe: Organic Soil with Cellulose.
Tab. 1: Q10 values for each sample. OC: Organic Control, OG: Organic soil with Glucose, Oce:
Organic Soil with Cellulose. MC: Organic Control, MG: Organic soil with Glucose, MCe: Organic
Soil with Cellulose
Soil Q10
OC 1,51
OG 1,69
Oce 1,67
MC 1,68
MG 1,52
Mce 1,21
c
abc
8
If the confidence intervals of the samples don’t overlap they are statistical different from each other.
This means, that the difference in the Q10 values are a result of the added substrate and are not
coincidental. As you can see, the Q10 values of the control of organic soil are significantly different
from the organic soil with the added substrates cellulose and glucose, whereas the Q10 values of these
two samples don’t differ. The Q10 of the control from the mineral soil and the sample with glucose
don’t differ from the Q10 values of all organic soil types. The Q10 value of the mineral soil with
cellulose is significantly different from the Q10 value of the organic soil with Cellulose and the mineral
soil with Cellulose is significantly different from the control of the mineral soil. However the mineral
soil with Glucose and with Cellulose are from the same distribution.
These results are in contradiction to the metabolic theory. Furthermore, the Q10 values range from
1.21 in the mineral soil with cellulose to 1.69 in the organic soil with glucose added. These values
are far below the expected Q10 value of 2.4.
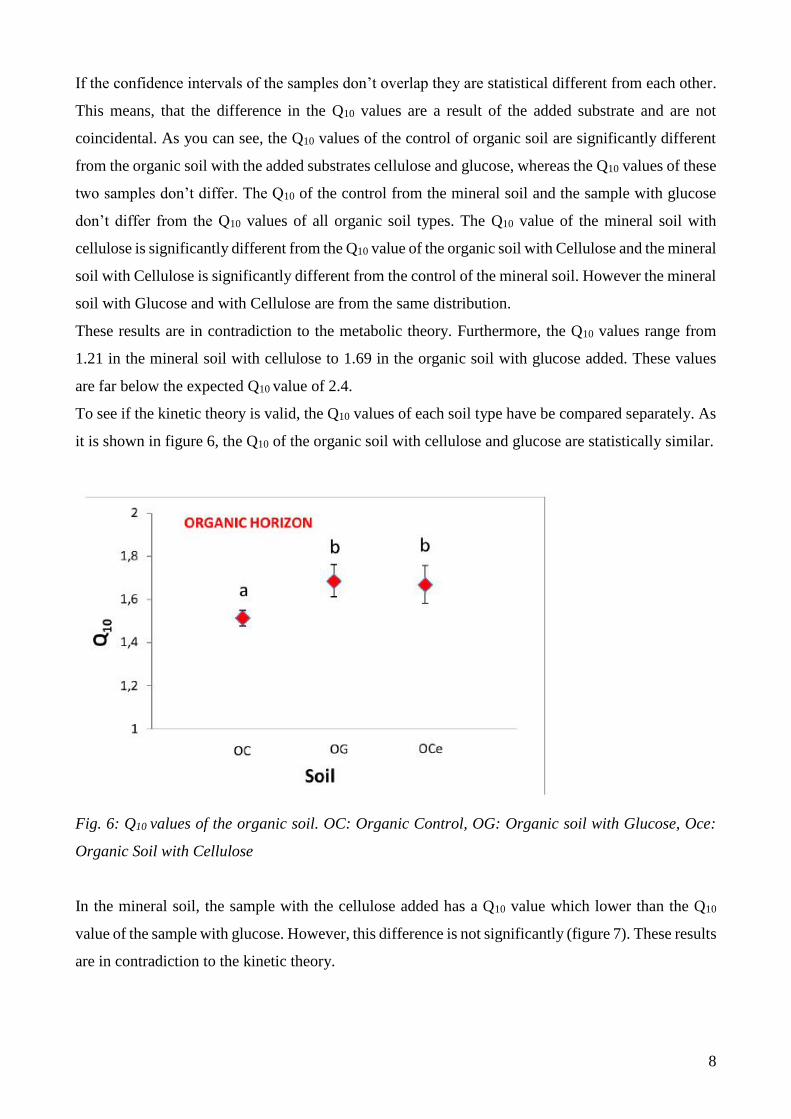
To see if the kinetic theory is valid, the Q10 values of each soil type have be compared separately. As
it is shown in figure 6, the Q10 of the organic soil with cellulose and glucose are statistically similar.
Fig. 6: Q10 values of the organic soil. OC: Organic Control, OG: Organic soil with Glucose, Oce:
Organic Soil with Cellulose
In the mineral soil, the sample with the cellulose added has a Q10 value which lower than the Q10
value of the sample with glucose. However, this difference is not significantly (figure 7). These results
are in contradiction to the kinetic theory.

9
Fig. 7: Q10 values of the mineral soil. MC: Organic Control, MG: Organic soil with Glucose, MCe:
Organic Soil with Cellulose
MC MG MCe

10
4. Discussion
4.1 Comparison with Gershenson et al. (2009)
The results were compared with the
conclusions of Gershenson et al. (2009).
These results of paper Effect of substrate
availability on the temperature sensitivity
of soil organic matter decomposition were
the main motivation for our experiment.
Gershenson et al. (2009) added a labile
carbon to the soil samples (glucose) and as
a consequence found a higher temperature
sensitivity of the soil respiration rate. The
highest temperature sensitivity was
induced by the addition of glucose to the
mineral horizon in comparison with the
organic horizon where the difference of Q10
between control and soil with glucose was
lower (Fig. 8). These findings are in opposite
with the kinetic theory which says more
complex the carbon is the higher is temperature sensitivity.
When we compare our data with these results we can see the same trend in the case of the organic
horizon (Fig. 6) but the opposite influence of the glucose for the mineral horizon.
The absolute values of the Q10 in Gershenson et al. (2009) vary between 1.6 and 2.3. This is also not
consistent with our findings of much lower values (Q10 = 1.2 – 1.68). This means that in our case the
differences between the respiration rates for the single temperatures were much lower than in the
paper from Gershenson et al. (2009).
We can conclude that our experiment does not fit with the kinetic theory and neither with the
Gershenson et al. (2009) and therefore we suggest that these experiments are probably much more
complicated and require more repetition and measurements to reveal the real factors influencing the
temperature sensitivity of the soil respiration rate.
Fig 8: The experiment of Gershenson et al. (2009) -
addition of the glucose to the mineral and organic soil
horizon.

11
4.2 Potential problems
What could be the reasons for our different results and which factors should be taken into account?
First of all, the soil microorganisms always need some time to adapt for the new conditions which
could take even few days. In contrary to that we added the glucose and did not wait to reach some
equilibrium and measured the samples after 24 h. This might have caused our indefinite results
because the microorganisms did not have enough time to react.
Secondly, we added two substrates with different complexity. Glucose is very easily decomposable
and the microbes usually need only hours to use it but in the case of cellulose they need much longer
time comprising days, weeks or months. This also does not fit to the measurement after only 24 h.
In the mineral horizon we can see the opposite trend in the Q10 values than we were expecting. This
means that after addition of a substrate the difference of respiration rate between temperatures was
lower than in the control. This could be caused by the reasons mentioned above but we also suggest
that the microorganisms did not have enough nutrients to take the available carbon.
Last but not least we should also take into account that we may be made a mistake. Because of the
time pressure we had only one replicate for every combination of soil type and temperature therefore
we are not able to exclude that.

12
5. Bibliography
- Batjes, N.H, 1996, Total carbon and nitrogen in the soils of the world. Soil Science, 47, pp151-163
- Davidson E.A, & Janssens I.A, 2006, Temperature sensitivity of soil carbon decomposition and
feedbacks to climate change, 440, pp165-173
- Gershenson A., Bader N, Cheng W, 2009, Effects of substrate availability on the temperature
sensitivity of soil organic matter decomposition
- Gillooly J.F, Brown J.H, West G.B, Savage V.M, Charnov E.L, 2001, Effects of size and
temperature on metabolic rate, Science, 293, pp2248-2251
- Parkinson D, Coleman D.C, 1991, Microbial communities activity and biomass, Agriculture -
Ecosystem and Environment, 34, p3-33
- Schlesinger W.H, & Andrews J.A, 2000, Soil respiration and the global carbon cycle, Biochemistry,
48, pp7-20
- Shimel DS, 1995, Terrestrial ecosystems and the carbon cycle, Global change biology, 1, pp77-91
- Wardle D.A, Yeates G.W, Barker G.W & Bonner K.I, 2006, The influence of plant litter diversity
on decomposer abundance and diversity, Soil Biology & Biochemistry, 38, p1052-1062
Related Documents