Temperature Measurement by Leon Dean Submitted to Dr. C. Grant Willson ChE 253M Department of Chemical Engineering The University of Texas at Austin Fall 2011

Welcome message from author
This document is posted to help you gain knowledge. Please leave a comment to let me know what you think about it! Share it to your friends and learn new things together.
Transcript

Temperature Measurement
by
Leon Dean
Submitted to
Dr. C. Grant Willson
ChE 253M Department of Chemical Engineering
The University of Texas at Austin
Fall 2011

2
Temperature Measurement
Abstract The purpose of this lab was to compare the precision and accuracy of different temperature measuring devices and to use those temperature measuring devices to calculate the values of several material properties of aluminum. Several different thermometers were used to measure temperature values of a hotplate, aluminum blocks of various shapes, and a few different water baths. A comparison of thermometer precision showed that of the two thermocouples embedded in the hotplate, the T-type thermocouple was more accurate than the K-type thermocouple. Both thermocouples were more precise than the infrared thermometer (pyrometer) or the resistance thermometer (thermistor) used in the experiment. The accuracy of two external thermocouples, as well as a mercury liquid-in-glass thermometer, was investigated by calibration against a platinum resistance thermometer. The platinum resistance thermometer had been pre-calibrated by the National Institute of Standards and Technology. The liquid-in-glass thermometer was the most accurate of these devices. The experimental heat capacity of aluminum was found to be 813.56 J kg-1 K-1 as a result of three trials of a calorimetry experiment in which a hot aluminum block was equilibrated with a room temperature water bath. In a separate convective heat transfer experiment with a different aluminum block, the heat transfer coefficient was calculated to be 10.32 W m-2 K-1. The experimenters also calculated the Biot number and the instantaneous energy losses due to convection and radiation for the aluminum block cooling in air.

3
Contents
Introduction 4 Methods 4 Sample Calculations 7 Results 9 Conclusions and Recommendations 21 Appendix: Raw Data 22 References 23 List of Tables
Table 1: Statistical values for the sets of thermocouple measurements 9 Table 2: Two-sample F-Test for Variances 12 Table 3: Standard deviations for three thermometers at four set points 12 Table 4: Sample means for three thermometers at four set points 13 Table 5: Mean and standard of ice bath temperature measurements 13 Table 6: Coefficients for linear fit of K-Type thermocouple vs. PRT 15 Table 7: Coefficients for linear fit of T-Type thermocouple vs. PRT 15 Table 8: Coefficients for linear fit of LIGT vs. PRT 15
List of Figures Figure 1: A simple representation of a thermocouple 4 Figure 2: Plot of temperature vs. time for the thermocouples 9 Figure 3: Lag plot of temperature for the K-type thermocouple 10 Figure 4: Lag plot of temperature for the T-type thermocouple 10 Figure 5: Histogram and normal quantile plot for K-type thermocouple 11 Figure 6: Histogram and normal quantile plot for T-type thermocouple 11 Figure 7: Calibration curve of K-Type thermocouple vs. PRT standard 14 Figure 8: Calibration curve of T-Type thermocouple vs. PRT standard 14 Figure 9: Calibration curve of LIGT vs. PRT standard 15 Figure 10: Overlay plot of the average temperature difference of each thermometer to the standard over the full range of temperatures. 16 Figure 11: Residual plots for the K-Type thermocouple vs. PRT 17 Figure 12: Residual plots for the T-Type thermocouple vs. PRT 17 Figure 13: Residual plots for the LIGT vs. PRT 18 Figure 14: Linear fit and residual plot of Equation (4) 19 Figure 15: Temperature vs. time curves based on experimental values and theoretical values calculated from the heat transfer coefficient. 20

4
Temperature Measurement
Introduction
The purpose of this lab was to compare the precision and accuracy of different temperature measuring devices and to use those temperature measuring devices to calculate the values of several material properties of aluminum. Eight different thermometers were used in the experiment. Data from five of the thermometers were collected digitally via software, and data from the other three thermometers were collected manually or by copying a digital readout.
Three of the thermometers were evaluated for accuracy against a platinum resistance thermometer (PRT). The PRT used was calibrated by the National Institute of Standards and Technology (NIST), so it is perfectly accurate to defined standards (Rawlings and Willson, 2011). The experimenters performed statistical tests to determine the accuracy of the other three thermometers. Precision was also compared between several of the different thermometers.
Thermocouples, which are some of the more accurate and precise instruments, were used in a calorimetry experiment to determine the specific heat capacity of aluminum and then in a convection experiment to determine the heat transfer coefficient of aluminum. The heat transfer coefficient was determined by fitting a line to a semi-logarithmic plot of temperature versus time. Obtained experimental values were compared to published literature values.
Methods
The experimental apparatus for this lab consisted of several water baths set different temperatures, two different aluminum blocks, which were submerged in the water baths, and a variable temperature hotplate. The experimenters used six different devices to measure temperature: a K-type thermocouple, a T-type thermocouple, a platinum resistance thermometer (PRT), a thermistor, an Extech pyrometer, and a mercury liquid-in-glass thermometer (LIGT), Thermocouples measure temperature at the junction of two different metals. A voltage difference forms between the two metals. This voltage is known as the Seebeck voltage (see Fig. 1). K-type thermocouples have chromel and alumel wires. T-type thermocouples have copper and constantan wires (Rawlings and Willson, 2011).
Figure 1. A simple representation of a thermocouple.
5
The Seebeck voltage is proportional to the temperature difference between the heated junction and a reference junction based on the following equation:
(1)
Both the PRT and the thermistor operate on the principle that resistance is dependent on temperature. The resistance of platinum increases linearly with temperature. The correlation between resistance and temperature is very steady over a wide range of temperatures. For this reason, the experimenters used a NIST standard PRT as the calibration instrument for this lab. The thermistor is made of semiconducting material, the resistance of which is inversely proportional to temperature. Thermistors are sensitive to small changes in temperature, but are not as useful over wide ranges of temperature (Rawlings and Willson, 2011). Pyrometers, or infrared thermometers, measure temperatures based on the amount of infrared radiation emitted by an object. Temperature can be calculated by integrating Planck’s Law. However, this calculation is valid only for blackbody radiators, which are objects that do not reflect or transmit incident radiation. In nature, there is no such thing as a blackbody radiator. The radiation produced by objects that are not blackbody radiators also depends on the emissivity of the object. The total energy flux for a non-blackbody radiator is given by:
(2) where ε is the emissivity of the material. Liquid-in-glass thermometers are simple instruments consisting of a liquid in a glass tube. As the temperature of the liquid increases, it expands up the tube past marks calibrated to certain temperatures. The lab consisted of six total parts in three overarching sections. The first section investigated thermometer precision, the second section investigated thermometer accuracy, and the third section determined material constants related to temperature for a piece of aluminum.
The first section of the lab included three parts. In the first part, the experimenters set a hotplate embedded with K-type and T-type thermocouples to 70ºC. Software recorded the thermocouple temperature measurements at regular intervals. In the second part, the experimenters set the hotplate to 85 ºC. The K-type thermocouple, a surface thermistor, and a pyrometer made several temperature measurements at regular intervals. The experimenters repeated these measurements at 65ºC, 45ºC, and 35ºC. The emissivity of aluminum was determined at 85ºC by changing its value until the pyrometer read the expected temperature. This emissivity value was then held constant for the rest of the experiment. In the third part, external K-type and T-type thermocouples measured the temperature of an ice water bath at regular intervals. The experimenters placed the thermocouple probes into four-inch holes under the surface of the ice bath. The second section of the lab investigated the accuracy of three thermometers versus a NIST calibrated platinum resistance thermometer. Calibration curves were made for the external K-type thermocouple, the external T-type thermocouple, and the mercury liquid-in-glass thermometer from measurements in water baths set at 0ºC, 23ºC, 45ºC, and 80ºC.

6
The third section of the lab included two parts. First, the experimenters heated a piece of aluminum to 80ºC in a water bath. Then the piece of aluminum was lowered with a string into 200 mL of water in an insulated Dewar flask, a deviation from the procedure by Rawlings and Willson (2011). After the aluminum and water reached equilibrium, the K-type thermocouple measured the equilibrium temperature. From this temperature, the mass of aluminum, the mass of water, the heat capacity of water, and the initial temperatures, the heat capacity of aluminum were determined by using the following equation:
(3)
In the second part, another piece of aluminum, made from the same material but in
the shape of a block, was then heated to 85ºC in a water bath. The block contained a built-in thermocouple, which measured the temperature of the block over time as it cooled in air via convection. From this data, the heat transfer coefficient of aluminum can be determined by fitting the line:
(4)
where the time constant τ is the inverse opposite of the slope. From the value of the time constant, the heat transfer coefficient h and the Biot number Bi can be determined by using the following equations:
(5) (6) where A = surface area, V = volume, and ρ = density, k = thermal conductivity. The Biot number is the ratio of the internal conduction of an object to external convection outside the object. For Bi < 0.1, the lumped heat capacity model is applicable, in which internal conduction is ignored and the temperature profile of the object is assumed to be constant (Rawlings and Willson, 2011). The instantaneous heat loss of the aluminum block due to convection (QC) and radiation (QR) can also be calculated using the following equations:
(7)
(8)

7
Sample Calculations Linear Regression and Confidence Limits for the LIGT calibration curve [deleted]

8
[deleted]

9
Results
The first part of the lab compared the precisions of the embedded K-type and T-type thermocouples. The T-type thermocouple was embedded in the hotplate itself, while the K-type thermocouple was attached to the surface of the aluminum block on top of the hotplate. Because there was not a perfect adiabatic seal between the hotplate and the aluminum block, some heat escaped from the system at this boundary. Therefore, the mean temperature of the T-type thermocouple was higher than the mean temperature of the K-type thermocouple (see Fig. 2).
Figure 2. Plot of temperature vs. time for the K-type and T-type thermocouples. The visual data in Fig. 2 suggesting that the mean temperature of the T-type
thermometer is higher than that of the K-type thermometer is confirmed by the statistical data in Table 1. The lower 95% confidence limit on the mean for the T-type thermocouple was greater than the upper 95% confidence limit on the mean for the K-type thermocouple.
Table 1. Statistical values for the sets of thermocouple measurements. K-Type T-Type Mean 68.6517 69.9180 Standard Deviation 0.0641 0.0574 Confidence Level(95.0%) 0.0239 0.0214 Lower Confidence Limit 68.6277 69.8966 Upper Confidence Limit 68.6756 69.9394
68.4
68.6
68.8
69
69.2
69.4
69.6
69.8
70
70.2
0 20 40 60 80 100 120 140 160
Time (s)
Tem
pera
ture
(deg
C)
T-Type
K-Type
10
68.45
68.5
68.55
68.6
68.65
68.7
68.75
68.8
68.45 68.5 68.55 68.6 68.65 68.7 68.75 68.8
T(n-1)
T(n)
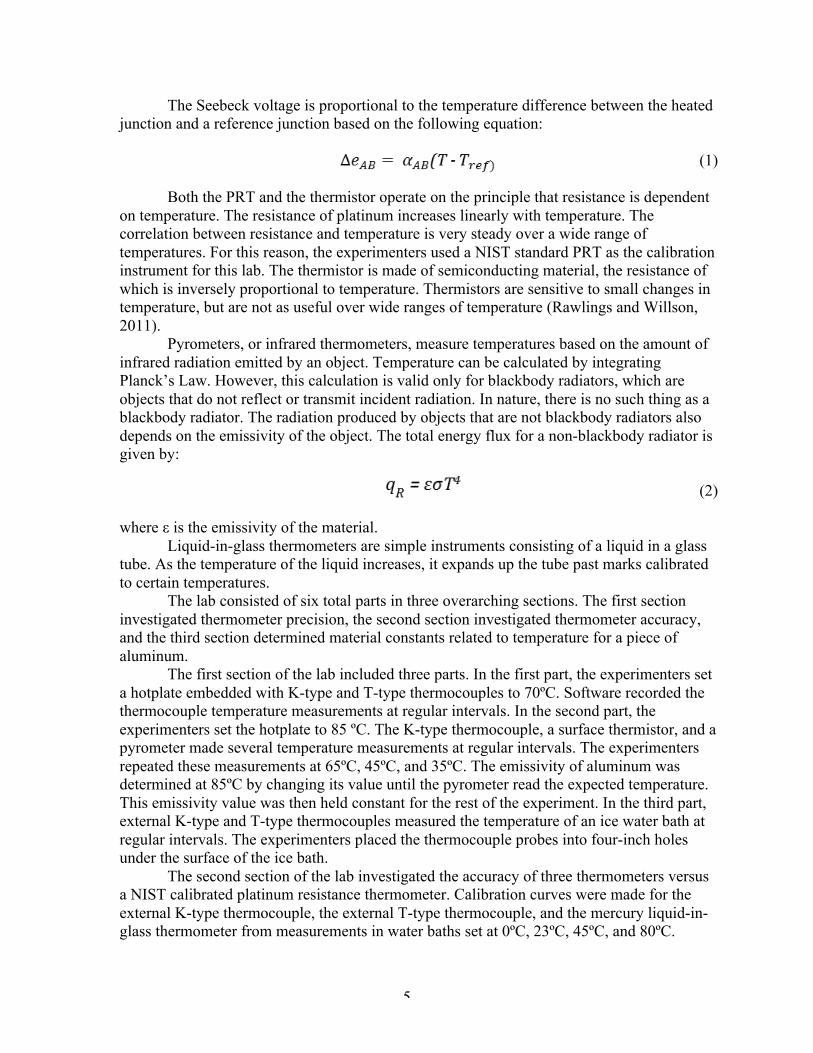
The data in the temperature vs. time plot (Fig. 2) appears randomly spread about the mean, but the lag plots for both the K-type and T-type thermocouples showed slightly positive correlation (see Fig. 3 and Fig. 4). This correlation can be attributed to random drift above and below the mean temperature, since the 5 second time interval between measurements was not large enough to make two measurements independent of one another. Figure 3. Lag plot of temperature for the K-type thermocouple.
Figure 4. Lag plot of temperature for the T-type thermocouple.
69.8
69.85
69.9
69.95
70
70.05
70.1
69.8 69.85 69.9 69.95 70 70.05 70.1
T(n-1)
T(n)

11
Figs. 5 and 6 show histograms and normal quantile plots for both thermocouples. The histogram for the T-type thermocouple (Fig. 6) appears to be skewed to the left, but a more rigorous inspection of that data using the normal quantile plot shows that the data are approximately normally distributed. The data obtained from the K-type thermocouple are also approximately normally distributed because they fit within the confidence curves on the normal quantile plot (Fig. 5).
Figure 5. Histogram (left) and normal quantile plot for the K-type thermocouple.
Figure 6. Histogram (left) and normal quantile plot for the T-type thermocouple.

12
The standard deviation of the measurements from the K-type thermocouple was greater than the standard deviation of the measurements from the T-type thermocouple (see Table 1). Standard deviation is the square root of variance. A two-sample F-test for variances resulted in a p-value of 0.28, which is higher than the α-value of 0.05 (see Table 2). This means that there is statistical significance to the difference in standard deviations. Therefore, it can be concluded that the T-type thermocouple is more precise than the K-type thermocouple. However, nothing can be concluded about the relative accuracies of the two thermocouples. Table 2. Two-sample F-Test for Variances
K-Type T-Type Mean 68.652 69.918 Variance 0.004104 0.003299 Df 29 29 F 1.2439 P(F<=f) one-tail 0.2803
The second part of the lab involved the comparison of the precision of three different thermometers: the K-type thermocouple used in the first part of the lab, a thermistor mounted on the surface of the hotplate, and a pyrometer. For this part of the lab, the hotplate was set at four different temperatures: 85°C, 65°C, 45°C, and 35°C. At 85°C, setting the emissivity to 0.72 gave the most accurate temperature readout on the pyrometer. This emissivity value was used for the rest of the measurements made by the pyrometer. The thermistor gave outputs in terms of ohms. These values were converted to temperatures using the “Thermistor Resistance vs. Temperature” chart for Model No. 44007. Experimental temperature values were linearly interpolated from values given in the chart using the equation:
(9) where T1, T2, R1, and R2 are values given on the chart which bracket the output Rexp.
Five temperature measurements were made by each thermometer at each of the four temperature set points. Table 3 gives the standard deviations of these measurements and Table 4 gives their means. At all four temperature set points, the standard deviation was smallest for the K-type thermocouple and largest for the pyrometer. These results show that the most precise of the three thermometers is the K-type thermocouple and the least precise is the pyrometer.
Table 3. Standard deviations for three thermometers at four set points.
Set Point (°C) K-Type (°C) Pyrometer (°C) Thermistor (°C) 85 0.0619 0.5788 0.4868 65 0.0277 0.4930 0.1278 45 0.0283 0.2510 0.2008 35 0.0635 0.2702 0.0871
Nothing can be concluded about the accuracy of each thermometer because there is no standard with which to compare. However, the difference between the mean temperature
13
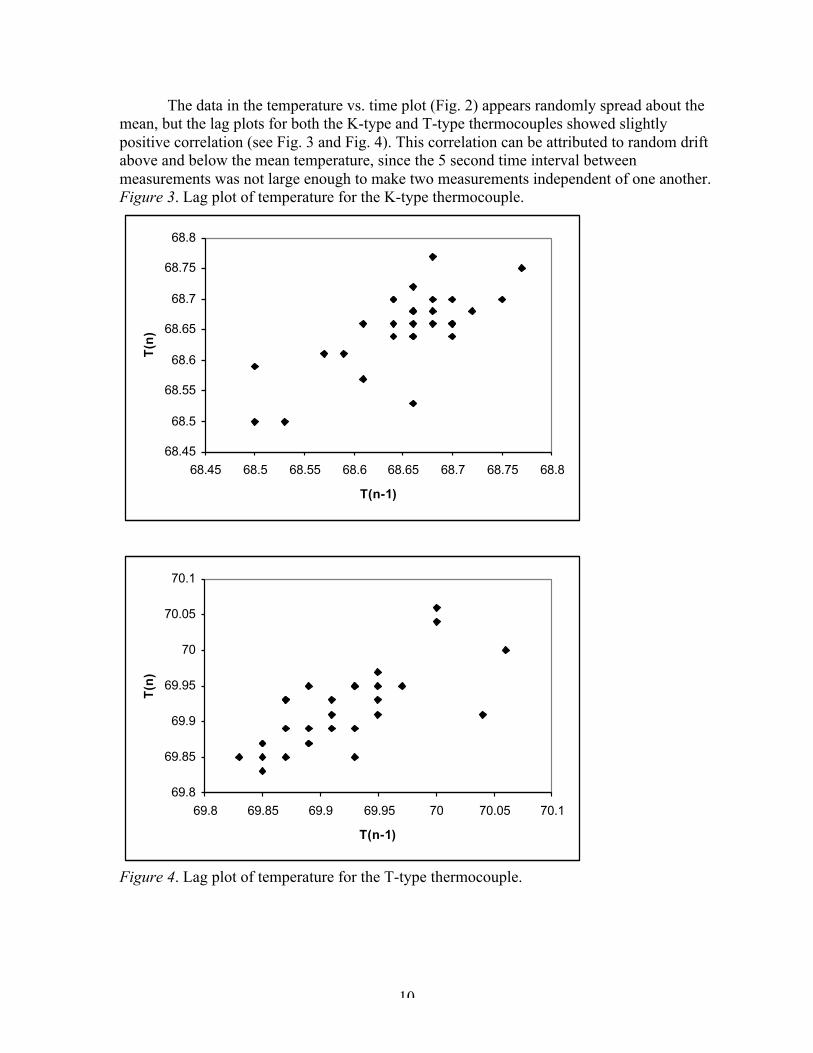
given by the thermistor and the other two thermometers at the higher temperature set points is noticeable (see Table 4). This difference could be due to a poor thermal seal between the thermistor sensor and the hotplate, or to the fact that the thermistor sensor has a larger surface area from which to lose heat than the thermocouple. Both of these reasons would explain why the thermistor is less consistent with other thermometers at high temperatures. Table 4. Sample means for three thermometers at four set points.
Set Point (°C) K-Type (°C) Pyrometer (°C) Thermistor (°C) 85 83.47 85.5 69.45 65 63.87 63.46 54.41 45 44.33 41.74 39.42 35 34.62 31.24 31.75
The third part of the lab compared the precision of two external thermocouples, once
again a K-type and a T-type thermocouple. Unlike the thermocouples used in the first two parts of the lab, these thermocouples measure temperature via probes. THe probes were inserted approximately four inches beneath the surface of an ice water bath. THe temperature of an ice water bath can be assumed quite reliably to be 0ºC. The K-type thermocouple had a smaller standard deviation over thirty measurements than the T-type thermocouple (see Table 5). This result was the opposite of the result obtained for the embedded thermocouples used in part one. Because the difference between the standard deviations was so small, however, it is difficult to make a definite conclusion about the relative precision of the two thermometers without a more rigorous statistical test. The data from this lab report will be combined with the data from several other lab groups to determine reproducibility of results at different times and with different techniques. The depth of the thermocouple probes under the surface of the water is one possible factor that could affect reproducibility between groups. Collection of dust or other particles on the thermocouple probes could also affect the temperature measurements given by the thermocouples. Table 5. Mean and standard of ice bath temperature measurements. K-Type (°C) T-Type (°C) Mean -0.1423 0.0126 Std. Deviation 0.0165 0.0208
The fourth part of the lab was the calibration of the two external thermocouples and the mercury liquid-in-glass thermometer (LIGT) against the NIST standard PRT. Four measurements were made by each thermometer in four different water baths. THese measurements were then averaged. Figs. 7, 8, and 9 show the calibration curves for each of the three thermometers versus the PRT. Tables 6, 7, and 8 show the values for the linear fits of the curves with slope, intercept, and uncertainty in the form of standard error and 95% confidence limits.

14
Figure 7. Calibration curve of K-Type thermocouple versus PRT standard with linear fit.
Figure 8. Calibration curve of T-Type thermocouple versus PRT standard with linear fit.

15
Figure 9. Calibration curve of LIGT versus PRT standard with linear fit. Table 6. Coefficients and uncertainties for linear fit of K-Type thermocouple vs. PRT. Estimate Std Error Lower 95% Upper 95% Intercept 0.2401 0.1894 -0.5747 1.0550 Slope 1.0050 0.0040 0.9878 1.0222
Table 7. Coefficients and uncertainties for linear fit of T-Type thermocouple vs. PRT. Estimate Std Error Lower 95% Upper 95% Intercept -0.0575 0.2932 -1.3189 1.2039 Slope 1.0064 0.0062 0.9798 1.0331
Table 8. Coefficients and uncertainties for linear fit of LIGT vs. PRT. Estimate Std Error Lower 95% Upper 95% Intercept -0.1326 0.3395 -1.5934 1.3282 Slope 1.0060 0.0072 0.9751 1.0369
The uncertainty values of standard error and 95% confidence limits in Tables 6, 7, and 8 allow for a comparison of the precision of the thermometers over a range of temperatures. The K-type thermocouple had the smallest standard error and 95% confidence interval for both the slope and intercept, indicating that it was the most precise of the three. The LIGT had the largest standard error and 95% confidence interval for both the slope and intercept, indicating that it was the least precise. However, some of the imprecision of the LIGT can be attributed to its lack of resolution. THe temperature measurements of the LIGT were made by a human eye discerning the level of the mercury on a gradient of tenths of a

16
degree Celsius. THe temperature measurements of the thermocouple were made by computers which produced results with resolution to hundredths of a degree Celsius. Meanwhile, the actual estimates of intercept and slope in tables 6, 7, and 8 allow a comparison of the accuracy of the three thermometers. The intercept of the calibration curve for a perfectly calibrated instrument would be zero and its slope would be one. Therefore, deviation of calibration intercepts from zero and calibration slopes from one indicate inaccuracy. Based on intercept values, the most accurate thermometer was the T-type thermocouple and the least accurate was the K-type thermocouple. However, based on slope values, the exact opposite is true. This conflicting result could indicate that different thermometers are more accurate over different ranges of temperature. The overlay plot (see Fig. 10) shows that the LIGT was actually the most accurate thermometer between 45 and 80 degrees Celsius.
Figure 10. Overlay plot of the average temperature difference of each thermometer to the standard over the full range of temperatures. Figs. 11, 12, and 13 show the residual plots for each of the thermometers as well as normal quantile plots of the residuals. There is no apparent pattern to the residuals of any of the thermometers. The normal quantile plots show that the residuals do not follow the normal distribution very well. Residuals that are not normally distributed may show that an extra factor is not being considered or that a different fit besides a line is more appropriate. Neither of these scenarios are likely for a calibration curve, so it is expected that the residuals would be normally distributed. However, because there are only four points on each of the plots for this experiment, it is difficult to make any definite conclusions about normality.
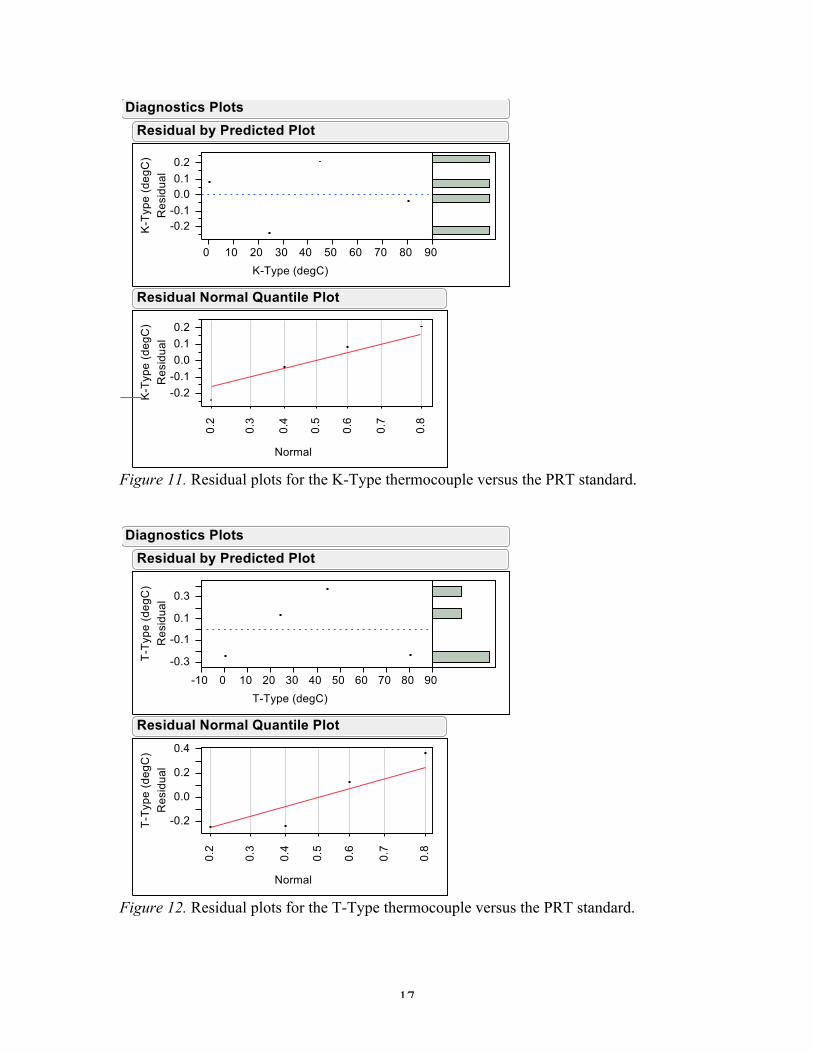
17
Figure 11. Residual plots for the K-Type thermocouple versus the PRT standard.
Figure 12. Residual plots for the T-Type thermocouple versus the PRT standard.
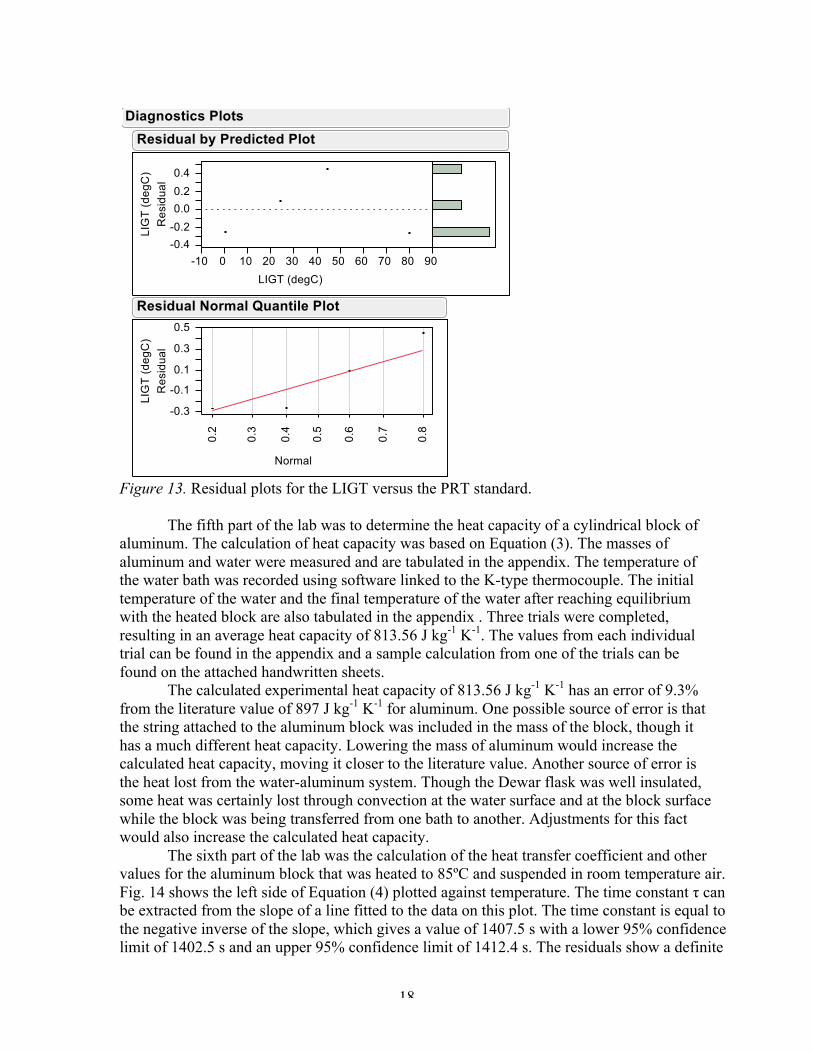
18
Figure 13. Residual plots for the LIGT versus the PRT standard. The fifth part of the lab was to determine the heat capacity of a cylindrical block of aluminum. The calculation of heat capacity was based on Equation (3). The masses of aluminum and water were measured and are tabulated in the appendix. The temperature of the water bath was recorded using software linked to the K-type thermocouple. The initial temperature of the water and the final temperature of the water after reaching equilibrium with the heated block are also tabulated in the appendix . Three trials were completed, resulting in an average heat capacity of 813.56 J kg-1 K-1. The values from each individual trial can be found in the appendix and a sample calculation from one of the trials can be found on the attached handwritten sheets. The calculated experimental heat capacity of 813.56 J kg-1 K-1 has an error of 9.3% from the literature value of 897 J kg-1 K-1 for aluminum. One possible source of error is that the string attached to the aluminum block was included in the mass of the block, though it has a much different heat capacity. Lowering the mass of aluminum would increase the calculated heat capacity, moving it closer to the literature value. Another source of error is the heat lost from the water-aluminum system. Though the Dewar flask was well insulated, some heat was certainly lost through convection at the water surface and at the block surface while the block was being transferred from one bath to another. Adjustments for this fact would also increase the calculated heat capacity. The sixth part of the lab was the calculation of the heat transfer coefficient and other values for the aluminum block that was heated to 85ºC and suspended in room temperature air. Fig. 14 shows the left side of Equation (4) plotted against temperature. The time constant τ can be extracted from the slope of a line fitted to the data on this plot. The time constant is equal to the negative inverse of the slope, which gives a value of 1407.5 s with a lower 95% confidence limit of 1402.5 s and an upper 95% confidence limit of 1412.4 s. The residuals show a definite

19
concave up pattern, which may indicate that another regression would fit better than a line, but it would also be more difficult to extract the time constant from another regression. There are a few outliers in the residual plot from early time values.
Figure 14. Linear fit and residual plot of Equation (4).

20
The temperature versus time data used to calculate the time constant can be found is plotted in Fig. 15 as the experimental line. The dimensions and mass of the aluminum plate, which can be used to calculate volume and density, can also be found in the appendix. The heat transfer coefficient h is equal to a ratio of density times heat capacity times volume over time constant times area, as shown by Equation (5). The same heat capacity calculated in part five is used in this equation. The calculated value for the heat transfer coefficient was 10.32 W/m2-K. This calculation can be found on the attached sample calculation sheets. The lower 95% confidence limit for the heat transfer coefficient is 10.26 and the upper 95% confidence limit for the heat transfer coefficient is 10.38, based on the propagation of the uncertainty of the heat capacity and the time constant. Fig. 15 shows the graphs of the experimental temperature values over time, along with the theoretical temperature curves based on the calculated heat transfer coefficient and its lower and upper 95% confidence limits.
Figure 15. Temperature vs. time curves based on experimental values and theoretical values calculated from the heat transfer coefficient. Using Equation (6) and a thermal conductivity of 237 W m−1 K−1, Bi = 2.903e-04. This number is sufficiently less than 0.1 to justify using the lumped parameter analysis. The instantaneous power lost by the plate at the start of cooling by convection (QC) and by radiation (QR) can be calculated from equations (7) and (8) using an emissivity value of 0.1. The values are QC = -13.04 W and QR = -0.391 W, where negative values indicate a loss of energy. The values show that the effect of radiation is small compared to convection.
35
40
45
50
55
60
65
70
75
80
85
0 200 400 600 800 1000 1200 1400 1600 1800 2000
Time (s)
Tem
pera
ture
(deg
c)
ExperimentalTheoretical (upper)Theoretical (mid)Theoretical (lower)

21
However, the radiation loss is significant enough to be a possible explanation for deviations from the experimental curve to the theoretical curves given in Fig. 15. Conclusions/Recommendations This report investigated the precision and accuracy of several different temperature measuring instruments and experimentally derived the values of several different temperature related properties for aluminum. Two of the thermometers compared were thermocouples embedded into a hotplate-aluminum block system. One was a T-type thermocouple embedded in the hotplate itself, and the other was a K-type thermocouple embedded in the aluminum block set on top of the hotplate. The T-type thermocouple had higher mean temperature measurements and was more precise than the K-type thermocouple. The measurements from both thermocouples showed slow, random drift above and below the mean. Another comparison made was between the precision of the K-type thermocouple, a pyrometer, and a thermistor. The comparison was made at four different temperatures between 0ºC and 80ºC, and the results showed that the most precise thermometer was the thermocouple and the least precise was the pyrometer. A third set of thermometers compared were an external T-type thermocouple probe and an external K-type thermocouple probe. This time, the K-type thermocouple was more precise than the T-type thermocouple. The external K-type and T-type thermocouples were also calibrated against a NIST standard platinum resistance thermometer (PRT), along with a mercury liquid-in-glass thermometer (LIGT). All three showed good accuracy in relation to the PRT, but it was difficult to distinguish the most accurate thermometer except at the higher temperatures between 45ºC and 80ºC, at which the LIGT was the most accurate. The rest of the lab involved several experiments with solid pieces of aluminum. The first calculated property was heat capacity, which was found to be 813.56 J kg-1 K-1 as a result of three trials of equilibrating a heated aluminum block with a water bath. This value was slightly lower than the literature value of 897 J kg-1 K-1. The next experiment was the cooling of a suspended aluminum block by convection in air. From this experiment, the experimenters calculated the heat transfer coefficient h, Biot number Bi, and the instantaneous power lost to convection (QC) and radiation (QR). The calculated values were h = 10.32 W/m2-K, Bi = 2.903e-04, QC = -13.04 W and QR = -0.391 W. The values of QC and QR show that energy loss due to convection is much higher than energy loss due to radiation for the aluminum block in the air.

22
Appendix [deleted]

23
References
Rawlings, Brandon and Willson, C. Grant. (2011). Temperature Measurement. Lab Handout ChE 253M, The University of Texas at Austin.
Related Documents