energies Article Temperature Distribution of HBC Fuses with Asymmetric Electric Current Ratios Through Fuselinks Adrian Plesca Faculty of Electrical Engineering, Gheorghe Asachi Technical University of Iasi, Blvd. Dimitrie Mangeron, 21–23, Iasi 700050, Romania; [email protected]; Tel.: +40-232-278683 Received: 27 June 2018; Accepted: 26 July 2018; Published: 31 July 2018 Abstract: In many industrial applications high breaking capacity (HBC) fuses are used to protect electrical installations against overcurrents, especially in the power distribution network. At high rated current, HBC fuses have more parallel fuselinks mounted inside. The technological and mounting processes of the fuselinks inside the fuse results in an asymmetrical current distribution through the parallel fuselinks. In this article a model of a high breaking capacity fuse using two parallel fuselinks is proposed. The influence of electric current, cross-section of the notches, distance between notches and current imbalance through fuselinks on the maximum temperature rise of both fuselinks, has been investigated. Also, a 3D thermal model for the same HBC fuse has been developed. The temperature spread into the fuse and its elements has been obtained. In order to prove the validity of the mathematical and 3D model different tests have been considered. The experimental, simulation and computed results give similar values and it results that this model can also be used for fuses with many parallel fuselinks and it permits the design of new fuse elements with optimal thermal distribution. Keywords: HBC fuse; temperature analysis; modelling and simulation; asymmetry; electric current; fuselinks 1. Introduction The fuse, as simple overcurrent protection device, is widely used in a range of voltages from 12 V to as high as 66 kV. Being connected in series with the protected equipment, the fuse detects and isolates the faulted equipment from the network. In its simplest form, it consists of a piece of metal wire connected between two terminals on a suitable support; and at its most complex as a cartridge fuselink mounted in a carrier and fuse base. Modern cartridge fuselinks contain fusible elements mounted in rigid housings of insulating material. The housings are filled with suitable exothermal and arc-quenching powders, such as silica, and they are sealed by metal endcaps which carry the conducting tags or end connections. The metal parts, other than the fusible elements, are invariably of copper, brass, steel or composites and they must be capable of operating under the exacting thermal, mechanical and electrical conditions which may arise in service. A fuse has to operate for up to 20 years with the same electrical performances, supporting the usual load currents and transient overloads [1]. For this, the fuse has to be thermally and chemically compatible with the environment, but being capable to interrupt the circuit when exposed to overcurrents. This interruption is assured by melting of an element, followed by an arching phenomenon with high energy release, depending on the circuit parameters and characteristics. Successful fault interruption implies that the arcing is wholly contained within the fuselink and the level at which this can be achieved is termed the breaking or rupturing capacity of the fuselink. Energies 2018, 11, 1990; doi:10.3390/en11081990 www.mdpi.com/journal/energies

Welcome message from author
This document is posted to help you gain knowledge. Please leave a comment to let me know what you think about it! Share it to your friends and learn new things together.
Transcript

energies
Article
Temperature Distribution of HBC Fuses withAsymmetric Electric Current RatiosThrough Fuselinks
Adrian Plesca
Faculty of Electrical Engineering, Gheorghe Asachi Technical University of Iasi, Blvd. Dimitrie Mangeron, 21–23,Iasi 700050, Romania; [email protected]; Tel.: +40-232-278683
Received: 27 June 2018; Accepted: 26 July 2018; Published: 31 July 2018�����������������
Abstract: In many industrial applications high breaking capacity (HBC) fuses are used to protectelectrical installations against overcurrents, especially in the power distribution network. At highrated current, HBC fuses have more parallel fuselinks mounted inside. The technological andmounting processes of the fuselinks inside the fuse results in an asymmetrical current distributionthrough the parallel fuselinks. In this article a model of a high breaking capacity fuse using twoparallel fuselinks is proposed. The influence of electric current, cross-section of the notches, distancebetween notches and current imbalance through fuselinks on the maximum temperature rise ofboth fuselinks, has been investigated. Also, a 3D thermal model for the same HBC fuse has beendeveloped. The temperature spread into the fuse and its elements has been obtained. In order to provethe validity of the mathematical and 3D model different tests have been considered. The experimental,simulation and computed results give similar values and it results that this model can also be usedfor fuses with many parallel fuselinks and it permits the design of new fuse elements with optimalthermal distribution.
Keywords: HBC fuse; temperature analysis; modelling and simulation; asymmetry; electriccurrent; fuselinks
1. Introduction
The fuse, as simple overcurrent protection device, is widely used in a range of voltages from12 V to as high as 66 kV. Being connected in series with the protected equipment, the fuse detects andisolates the faulted equipment from the network. In its simplest form, it consists of a piece of metalwire connected between two terminals on a suitable support; and at its most complex as a cartridgefuselink mounted in a carrier and fuse base. Modern cartridge fuselinks contain fusible elementsmounted in rigid housings of insulating material. The housings are filled with suitable exothermaland arc-quenching powders, such as silica, and they are sealed by metal endcaps which carry theconducting tags or end connections. The metal parts, other than the fusible elements, are invariably ofcopper, brass, steel or composites and they must be capable of operating under the exacting thermal,mechanical and electrical conditions which may arise in service.
A fuse has to operate for up to 20 years with the same electrical performances, supportingthe usual load currents and transient overloads [1]. For this, the fuse has to be thermally andchemically compatible with the environment, but being capable to interrupt the circuit when exposedto overcurrents. This interruption is assured by melting of an element, followed by an archingphenomenon with high energy release, depending on the circuit parameters and characteristics.
Successful fault interruption implies that the arcing is wholly contained within the fuselink andthe level at which this can be achieved is termed the breaking or rupturing capacity of the fuselink.
Energies 2018, 11, 1990; doi:10.3390/en11081990 www.mdpi.com/journal/energies

Energies 2018, 11, 1990 2 of 18
The operating time of a fuselink varies inversely with the level of an overcurrent and discrimination isobtained in networks by choosing fuses with the necessary time-current characteristics and currentratings. The time-current characteristic is determined by the design of the fuse itself, in particular butnot exclusively, the fuse material and the physical geometry of the fuselink(s). In practice, the fusecurrent characteristic is chosen to ensure adequate discrimination with other fuses and/or overcurrentrelaying devices around the network.
In previous works, a one-dimensional model describing the gas flux and the heat distributionin high breaking capacity (HBC) fuses is presented in [2]. It used a flow model joined with a porousmedium model considering the heat transfer over hot gas and cold silica sand. Also, in [3] a model tosimulate the flow of a compressible fluid in porous media considering a microscopic thermal modelto estimate the local thermal process of the solid phase is described. A mathematical model of thefuselink heating, including solid-liquid-vapour phase transitions used to estimate the pre-arcing timein HBC fuses is presented in [4]. The model estimates the enthalpy formulation for the heat equationwith a source term representing the Joule effect jointed with the Laplace equation for the potential andthe Ohm’s law.
The physico-chemical processes during the operation of fuselinks under fault currents are verycomplex. In [5], some methods to measure the current and voltage arc using analog/digital convertersare presented and the observed phenomena investigated. Multiple arcing and a short-durationlowering of the arc voltage have been explained.
The adiabatic assumption usually applied in modelling is considered in [6]. The influence of thepre-arcing step on the arcing step is analysed via the Joule integral, the energy released in the fuse andthe mass and length of the fulgurite.
Manufacturers of HBC fuses need more accurate models of fuse behaviour during the arc timeperiod of breaking the main electric circuit. The models will be obtained if the understanding of fuse arcphenomena will be improved. Therefore, in [7] some experimental tests such as calorimetry, analysisof fuselink fulgurite, electron spectroscopy for chemical analysis, and determination of produced gashave been performed. The conclusions were that no chemical change takes place during fuse arcing.
A methodology that expresses the thermal process in high voltage current-limiting fuses forcurrents until the rated value is presented in [8]. Thus, it solves the transient heating aspects of the fuseto achieve the values of the released power and the heat transfer coefficient, according to the steadystate conditions. An empirical model to study the current-limiting fuses utilised in distribution systemapplications is presented in [9]. The different phases of fuse operation are modelled using EMTPsoftware. Although the model has limits, it is simple and allows an easy utilisation for a nonexpert.
The effect of the M-effect metal setting over the overload current pre-arcing time for DCcurrent-limiting fuse is described in [10]. Experimental results have outlined that the M-effect hasinfluence if the overload current is about two times of the rated current.
When function in current-limiting mode, current-limiting fuses can reduce the heat and pressurehazards related on arc events because they limit the current in the first one-quarter cycle. The possibilityto estimate the arc current and incident energy for equipment using current-limiting fuses and applyingNEC Section 240.67 by general arc models utilisation is presented in [11].
Temperature distribution on the fuselinks with different type of cross-section fuse elements ispresented in [12]. Some mathematical models are proposed in the case of fuselinks with variablecross-sections. Results of numerical calculations of fuse element heating in transient and steady state,performed with FLUX 2D software are reported in [13]. The calculations considered the heating of theentire fuse element. A research related to NV melting fuse is presented in [14]. The calculation wasbased on the 3D finite element analysis that was performed with the software Vector Fields Opera.Analyses have been carried out for a different melting fuse current and different shape of perforationof melting fuselink. Understanding the thermal behaviour of a fuse is important in order to optimizethe design and to choose the correct fuse rating for each application. A model for a fuse based on theThermal Network Methodology was developed in [15], including terminals, electrical connections,
Energies 2018, 11, 1990 3 of 18
and a fuse canister. In this case, the thermal behavior of a HBC fuse is dependent just on the designof the fusing element, the material parameters, and the environment conditions. The pre-arcing timeestimation for fuselinks operated in industrial protection circuits in case of heavy faults currents,is described in [16]. An enthalpy method to solve heat-transfer equation with two phase changeswas described. The mathematical model joints thermal and electrical equations based on the energyconservation principle and the Ohm’s law, respectively.
Standardised fuse classes are presented in [17] based on the IEC 60269 and IEC 60282 technicalstandards. The mistake in selecting of the suitable class is the most usual error and the resultsare faults in the protected equipment up to a severe fuse blast. Usual cases of wrong selectionare discussed, highlighting the problems resulting from this erroneous selection and also the risks.Thus, to avoid errors in selection a profound knowledge of the use methodology of HBC fuses isnecessary. The distribution of the temperature in the fuse under usual operating conditions wasstudied in [18] and also large experiments with different fuse element types at various thermal stressvalues have been realised. The result of the environmental temperature rising inside a fuse-box,because of the Joule losses, over the current rating of the fuses is studied in [19], in connexion with theampacity of the overhead conductors. The increasing temperature into the fuse box has been estimatedin compliance to the IEC 60890 standard with amendment in order to deal with external installation ofthe switchboard, that is the heat increase due to solar irradiance.
A numerical analysis of the transient temperature rise of the fuse elements in current-limiting fusesfor protecting semiconductor devices is described in [20]. The transient temperature rise was obtainedby using 3-D finite element method combining the analysis of current distribution in the fuse with theheat analysis of the fuse. The thermal analysis of a medium voltage fuse by the finite element methodis described in [21] where the model has been designed and simulated under various conditions ofambient temperature with the Cosmos software tool. In [22,23], the effect of the current harmonics(with different THD) on the fuse thermal operating conditions, was studied using the software ANSYS.A mathematical model of the fuse time-current characteristic is presented in [24]. The authors usedthe Least Square Method and the Residual Sum of Squares as a comparative parameter. Thus, it ispossible to identify models with better adjustment in global scope considering the different nominalcurrent ratings, speed ratios and manufacturers. Also, the calculation of the fuse melting point byinrush energy has been described in [25].
Fuses in parallel may be an alternative to single-type fuses for use in power distribution networksor for semiconductor protection. A conclusion of the work presented in [26] is that parallel connectionof fuses is generally well accepted by the customers in a lot of worldwide markets but use of UL-fusesconnected in parallel has special requirements. A novel unsymmetrical faults analysis method withhybrid compensation for microgrid distribution systems is proposed in [27–29]. The method employsthe actual three-phase models to handle unsymmetrical faults. The new method can be used to solvethe various types of single or simultaneous unsymmetrical faults. Power electronic converters are veryreliable equipment and are widely used in many activities including industries, services and evenresidential. However, there is a non-negligible risk of failure of a semiconductor acting to commutatein a leg. In that case, the semiconductor will short-circuit and all the available source energy willpass through the leg in question. There is then a very high risk of the semi-conductor exploding,with occurrence of an electric arc inside the converter and even outside. A more detail aspects related tothe protection of these converters under high di/dt’s, using dedicated fuselinks, are presented in [30].A proposed modification to IEEE Std. 1584 arc flash incident energy calculations is presented in [31]which would account for the impact of environmental temperature variation on fuse performancewithout detailed fuse performance modeling.
The purpose of this work is to analyze the temperature distribution over the fuselinks in the caseof an asymmetric ratio of the electric current through fuselinks. The analysis will be performed duringsteady-state operating conditions of the HBC fuse. The thermal model takes into consideration thethermal overlapping effect of all notches of the fuselink. Also, it includes the temperature variation

Energies 2018, 11, 1990 4 of 18
of the electrical resistivity of the fuselink material. First, it will obtain a mathematical model of thetemperature distribution in the case of the HBC fuse with two parallel fuselinks. Then, the theoreticalresults will be compared with simulated results of a three dimensional thermal model of the sameHBC fuse. Finally, experimental tests will be realised in order to validate the proposed model of theHBC fuse.
2. Mathematical Model
In order to obtain the thermal mathematical model, the flowchart from Figure 1 has beenconsidered. It starts with the power balance equation in steady-state conditions. Then, taking intoaccount the electrical (ρ0, j, αR) and thermal (λ, k) parameters of the fuse, and the geometry (lp, S) ofthe fuselink it will obtain the differential equation of the analuzed thermal phenomena. Together withthe limit conditions it can be obtained the solutions for temperature rise distribution ϑ and maximumtemperature rise ϑM. Taking into account the assymetrical current distribution through the fuselinks,finaly, it provides the maximum temperature rise for different fuselinks.
Figure 1. Fllowchart of the mathematical model.
In the case of HBC fuses, the notches of the fuselink have a very small cross-section and thetemperatures in these small areas are higher than the other parts of the fuselink. Actually, the notchesare local thermal sources along the fuselink. Therefore, the initial fuselink can be transformed intoa series of small fuselinks placed in front junctions where there are identically thermal sources,as presented in Figure 2.

Energies 2018, 11, 1990 5 of 18
Figure 2. Fuselink structure with additional power loss.
In every contact junction there is the same power loss P0x and along the small fuselinks thereis the axial heat flux of Px = P0x/2. The small fuselinks are actually conductors with the constantcross-sections and in this case, the power balance in steady-state conditions can be considered as [12,32]:
λ∂2θ(x)
∂x2 + ρ(θ)j2 −klp
S·[θ(x)− θa] = 0 (1)
The first part of the relation is the thermal flux due to the temperature gradient from the conductor,the second part is the Joule power loss inside the conductor and the third part represents the thermalflux released by the lateral surface of the conductor. The electrical resistivity is estimated by a linearevolution with the temperature:
ρ = ρ0[1 + αR(θ − θa)] (2)
and, considering:ϑ(x) = θ(x)− θa (3)
it results:∂2ϑ(x)
∂x2 −(
lpkλS− αRρ0 j2
λ
)ϑ(x) +
ρ0 j2
λ= 0 (4)
or:∂2ϑ(x)
∂x2 − a21ϑ(x) + b2
1 = 0 (5)
The differential equation has the general solution as:
ϑ(x) = A1ea1·x + B1e−a1·x + ϑs (6)
and has the limit condition:
x → ∞; ϑ(x) = ϑs =b2
1a2
1=
ρ0 I2
Slpk− αRρ0 I2 (7)
From Equation (7) it follows that the integration constant A1 has to be equal to zero, and thus thesolution results as:
ϑ(x) = B1e−a1·x + ϑs (8)
The particular solution ϑs refers to the steady-state heat of the conductor due to the Joule effectof the electric current with no external thermal source. The expression is valuable for any sectionof the fuselink, Figure 2: x ≤ 0; 0 ≤ x ≤ x0; x0 ≤ x ≤ 2x0; 2x0 ≤ x ≤ 3x0; 3x0 ≤ x ≤ 4x0 andx ≥ 4x0. Because there are five additional thermal sources in the points 0, x0, 2x0, 3x0 and 4x0, Figure 2,the study considers the sum of the thermal effects of the additional thermal sources. The temperature
Energies 2018, 11, 1990 6 of 18
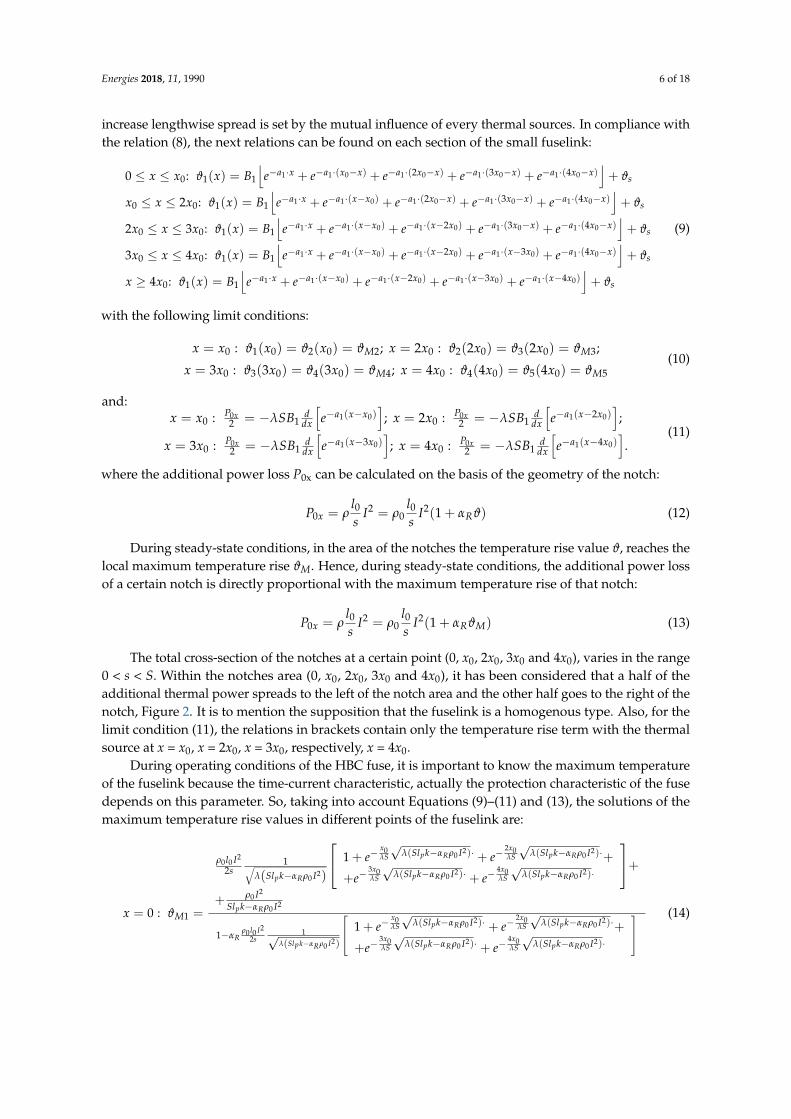
increase lengthwise spread is set by the mutual influence of every thermal sources. In compliance withthe relation (8), the next relations can be found on each section of the small fuselink:
0 ≤ x ≤ x0: ϑ1(x) = B1
⌊e−a1·x + e−a1·(x0−x) + e−a1·(2x0−x) + e−a1·(3x0−x) + e−a1·(4x0−x)
⌋+ ϑs
x0 ≤ x ≤ 2x0: ϑ1(x) = B1
⌊e−a1·x + e−a1·(x−x0) + e−a1·(2x0−x) + e−a1·(3x0−x) + e−a1·(4x0−x)
⌋+ ϑs
2x0 ≤ x ≤ 3x0: ϑ1(x) = B1
⌊e−a1·x + e−a1·(x−x0) + e−a1·(x−2x0) + e−a1·(3x0−x) + e−a1·(4x0−x)
⌋+ ϑs
3x0 ≤ x ≤ 4x0: ϑ1(x) = B1
⌊e−a1·x + e−a1·(x−x0) + e−a1·(x−2x0) + e−a1·(x−3x0) + e−a1·(4x0−x)
⌋+ ϑs
x ≥ 4x0: ϑ1(x) = B1
⌊e−a1·x + e−a1·(x−x0) + e−a1·(x−2x0) + e−a1·(x−3x0) + e−a1·(x−4x0)
⌋+ ϑs
(9)
with the following limit conditions:
x = x0 : ϑ1(x0) = ϑ2(x0) = ϑM2; x = 2x0 : ϑ2(2x0) = ϑ3(2x0) = ϑM3;
x = 3x0 : ϑ3(3x0) = ϑ4(3x0) = ϑM4; x = 4x0 : ϑ4(4x0) = ϑ5(4x0) = ϑM5(10)
and:x = x0 : P0x
2 = −λSB1d
dx
[e−a1(x−x0)
]; x = 2x0 : P0x
2 = −λSB1d
dx
[e−a1(x−2x0)
];
x = 3x0 : P0x2 = −λSB1
ddx
[e−a1(x−3x0)
]; x = 4x0 : P0x
2 = −λSB1d
dx
[e−a1(x−4x0)
].
(11)
where the additional power loss P0x can be calculated on the basis of the geometry of the notch:
P0x = ρl0s
I2 = ρ0l0s
I2(1 + αRϑ) (12)
During steady-state conditions, in the area of the notches the temperature rise value ϑ, reaches thelocal maximum temperature rise ϑM. Hence, during steady-state conditions, the additional power lossof a certain notch is directly proportional with the maximum temperature rise of that notch:
P0x = ρl0s
I2 = ρ0l0s
I2(1 + αRϑM) (13)
The total cross-section of the notches at a certain point (0, x0, 2x0, 3x0 and 4x0), varies in the range0 < s < S. Within the notches area (0, x0, 2x0, 3x0 and 4x0), it has been considered that a half of theadditional thermal power spreads to the left of the notch area and the other half goes to the right of thenotch, Figure 2. It is to mention the supposition that the fuselink is a homogenous type. Also, for thelimit condition (11), the relations in brackets contain only the temperature rise term with the thermalsource at x = x0, x = 2x0, x = 3x0, respectively, x = 4x0.
During operating conditions of the HBC fuse, it is important to know the maximum temperatureof the fuselink because the time-current characteristic, actually the protection characteristic of the fusedepends on this parameter. So, taking into account Equations (9)–(11) and (13), the solutions of themaximum temperature rise values in different points of the fuselink are:
x = 0 : ϑM1 =
ρ0l0 I2
2s1√
λ(Slpk−αRρ0 I2)
1 + e−x0λS
√λ(Slpk−αRρ0 I2)· + e−
2x0λS
√λ(Slpk−αRρ0 I2)·+
+e−3x0λS
√λ(Slpk−αRρ0 I2)· + e−
4x0λS
√λ(Slpk−αRρ0 I2)·
++ ρ0 I2
Slpk−αRρ0 I2
1−αRρ0 l0 I2
2s1√
λ(Slpk−αRρ0 I2)
1 + e−x0λS
√λ(Slpk−αRρ0 I2)· + e−
2x0λS
√λ(Slpk−αRρ0 I2)·+
+e−3x0λS
√λ(Slpk−αRρ0 I2)· + e−
4x0λS
√λ(Slpk−αRρ0 I2)·
(14)
Energies 2018, 11, 1990 7 of 18
x = x0 : ϑM2 =
ρ0l0 I2
2s1√
λ(Slpk−αRρ0 I2)
1 + 2e−
x0λS
√λ(Slpk−αRρ0 I2)·+
+e−2x0λS
√λ(Slpk−αRρ0 I2)·+
+e−3x0λS
√λ(Slpk−αRρ0 I2)·
++ ρ0 I2
Slpk−αRρ0 I2
1− αRρ0l0 I2
2s1√
λ(Slpk−αRρ0 I2)
1 + 2e−
x0λS
√λ(Slpk−αRρ0 I2)·+
+e−2x0λS
√λ(Slpk−αRρ0 I2)·+
+e−3x0λS
√λ(Slpk−αRρ0 I2)·
(15)
x = 2x0 : ϑM3 =
ρ0l0 I2
2s1√
λ(Slpk−αRρ0 I2)
[1 + 2e−
x0λS
√λ(Slpk−αRρ0 I2)·+
+2e−2x0λS
√λ(Slpk−αRρ0 I2)·
]+
+ ρ0 I2
Slpk−αRρ0 I2
1− αRρ0l0 I2
2s1√
λ(Slpk−αRρ0 I2)
[1 + 2e−
x0λS
√λ(Slpk−αRρ0 I2)·+
+2e−2x0λS
√λ(Slpk−αRρ0 I2)·
] (16)
x = 3x0 : ϑM4 =
ρ0l0 I2
2s1√
λ(Slpk−αRρ0 I2)
1 + 2e−
x0λS
√λ(Slpk−αRρ0 I2)·+
+e−2x0λS
√λ(Slpk−αRρ0 I2)·+
+e−3x0λS
√λ(Slpk−αRρ0 I2)·
++ ρ0 I2
Slpk−αRρ0 I2
1− αRρ0l0 I2
2s1√
λ(Slpk−αRρ0 I2)
1 + 2e−
x0λS
√λ(Slpk−αRρ0 I2)·+
+e−2x0λS
√λ(Slpk−αRρ0 I2)·+
+e−3x0λS
√λ(Slpk−αRρ0 I2)·
(17)
x = 4x0 : ϑM5 =
ρ0l0 I2
2s1√
λ(Slpk−αRρ0 I2)
1 + e−x0λS
√λ(Slpk−αRρ0 I2)· + e−
2x0λS
√λ(Slpk−αRρ0 I2)·+
+e−3x0λS
√λ(Slpk−αRρ0 I2)· + e−
4x0λS
√λ(Slpk−αRρ0 I2)·
++ ρ0 I2
Slpk−αRρ0 I2
1−αRρ0 l0 I2
2s1√
λ(Slpk−αRρ0 I2)
1 + e−x0λS
√λ(Slpk−αRρ0 I2)· + e−
2x0λS
√λ(Slpk−αRρ0 I2)·+
+e−3x0λS
√λ(Slpk−αRρ0 I2)· + e−
4x0λS
√λ(Slpk−αRρ0 I2)·
(18)
From the above equations it is to notice that the maximum of the temperature rise is according tothe ϑM3 expression; hence, ϑM3 > ϑM2 = ϑM4 > ϑM1 = ϑM5.
The mounting mode of the fuselinks inside the fuse gives various values for the dimensions(in length and thickness) of the fuse elements. This results in diverse electrical resistance scenarios ofthe fuselinks with consequences in an asymmetrical current distribution through the fuselinks whenthe fuse has mounted in parallel many fuse elements. In the case of the fuse with two parallel fuselinks,the current which flows through the fuse elements, has two different values I1 and I2. The sum of thesetwo currents is: I = I1 + I2, and the ratio between them is: I2 = αI1, where 0 < α < 1. It results:
I1 =1
α + 1I; I2 =
α
α + 1I (19)

Energies 2018, 11, 1990 8 of 18
According to the previous Equation (19), it will compute the maximum temperature rise valuesfor both fuselinks in the condition of an asymmetric ratio of the electric current through these fuseelements. Therefore, the formula will be:
ϑmax1 =
ρ0l02s
(I
α+1
)2 1√λ[Slpk−αRρ0( I
α+1 )2] 1 + 2e−
x0λS
√λ[Slpk−αRρ0(
Iα+1 )
2]·+
+2e−2x0λS
√λ[Slpk−αRρ0(
Iα+1 )
2]·
++ ρ0 I2
Slpk(α+1)2−αRρ0 I2
1− αRρ0l02s
(I
α+1
)2 1√λ[Slpk−αRρ0( I
α+1 )2] 1 + 2e−
x0λS
√λ[Slpk−αRρ0(
Iα+1 )
2]·+
+2e−2x0λS
√λ[Slpk−αRρ0(
Iα+1 )
2]·
(20)
and:
ϑmax2 =
ρ0l02s
(αI
α+1
)2 1√λ[Slpk−αRρ0( αI
α+1 )2] 1 + 2e−
x0λS
√λ[Slpk−αRρ0(
αIα+1 )
2]·+
+2e−2x0λS
√λ[Slpk−αRρ0(
αIα+1 )
2]·
++ ρ0(αI)2
Slpk(α+1)2−αRρ0(αI)2
1− αRρ0l02s
(αI
α+1
)2 1√λ[Slpk−αRρ0( αI
α+1 )2] 1 + 2e−
x0λS
√λ[Slpk−αRρ0(
αIα+1 )
2]·+
+2e−2x0λS
√λ[Slpk−αRρ0(
αIα+1 )
2]·
(21)
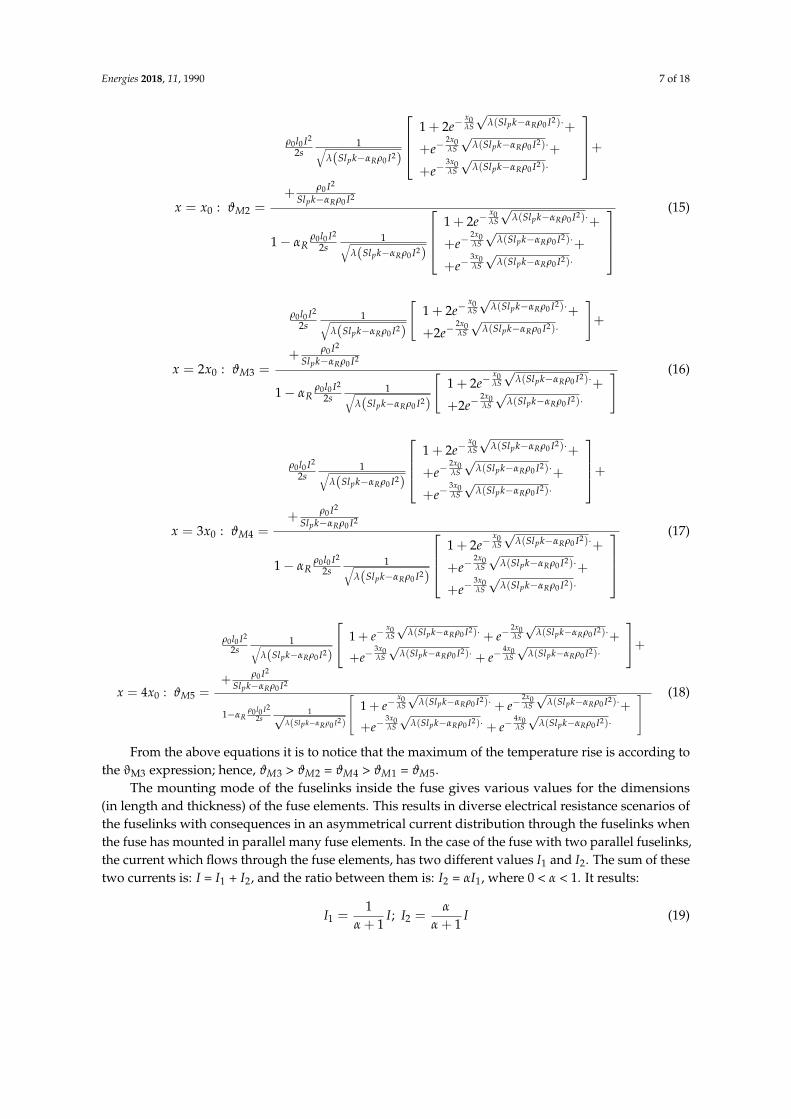
In the case of the fuse with more parallel fuselinks, the sum of currents is: I = I1 + I2 . . . + In,and the ratio between them is: I2 = α1I1, I3 = α2I1 . . . In = αn−1I1, where 0 < α1, α2 . . . αn−1 < 1 and theindex “n” means the number of the parallel fuselinks. This results in:
I1 =1
1∑
i=n−1αi + 1
I; I2 =α1
1∑
i=n−1αi + 1
I . . . In =αn−1
1∑
i=n−1αi + 1
I (22)
Hence, the maximum temperature rise of all the fuselinks will have the expressions:
ϑmax1 =
ρ0l02s
I1∑
i=n−1αi+1
2
1√√√√√√√λ
Slpk−αRρ0
I1∑
i=n−1αi+1
2
1 + 2e
− x0λS
√√√√λ[Slpk−αRρ0(I
1∑
i=n−1αi+1
)2]·
+
+2e
− 2x0λS
√√√√λ[Slpk−αRρ0(I
1∑
i=n−1αi+1
)2]·
+
+ ρ0 I2
Slpk
(1∑
i=n−1αi+1
)2
−αRρ0 I2
1−αRρ0 l0
2s
I1∑
i=n−1αi+1
2
1√√√√√√√√√λ
Slpk−αRρ0
I1∑
i=n−1αi+1
2
1 + 2e
− x0λS
√√√√λ[Slpk−αRρ0(I
1∑
i=n−1αi+1
)2]·
+
+2e
− 2x0λS
√√√√λ[Slpk−αRρ0(I
1∑
i=n−1αi+1
)2]·
(23)
Energies 2018, 11, 1990 9 of 18
ϑmax2 =
ρ0l02s
α1 I1∑
i=n−1αi+1
2
1√√√√√√√λ
Slpk−αRρ0
α1 I1∑
i=n−1αi+1
2
1 + 2e
− x0λS
√√√√√λ[Slpk−αRρ0(α1 I
1∑
i=n−1αi+1
)2]·
+
+2e
− 2x0λS
√√√√√λ[Slpk−αRρ0(α1 I
1∑
i=n−1αi+1
)2]·
+
+ ρ0(α1 I)2
Slpk
(1∑
i=n−1αi+1
)2
−αRρ0(α1 I)2
1−αRρ0 l0
2s
α1 I1∑
i=n−1αi+1
2
1√√√√√√√√√λ
Slpk−αRρ0
α1 I1∑
i=n−1αi+1
2
1 + 2e
− x0λS
√√√√√λ[Slpk−αRρ0(α1 I
1∑
i=n−1αi+1
)2]·
+
+2e
− 2x0λS
√√√√√λ[Slpk−αRρ0(α1 I
1∑
i=n−1αi+1
)2]·
(24)
ϑmaxn =
ρ0l02s
αn−1 I1∑
i=n−1αi+1
2
1√√√√√√√λ
Slpk−αRρ0
αn−1 I1∑
i=n−1αi+1
2
1 + 2e
− x0λS
√√√√√λ[Slpk−αRρ0(αn−1 I1∑
i=n−1αi+1
)2]·
+
+2e
− 2x0λS
√√√√√λ[Slpk−αRρ0(αn−1 I1∑
i=n−1αi+1
)2]·
+
+ ρ0(αn−1 I)2
Slpk
(1∑
i=n−1αi+1
)2
−αRρ0(αn−1 I)2
1−αRρ0 l0
2s
αn−1 I1∑
i=n−1αi+1
2
1√√√√√√√√√λ
Slpk−αRρ0
αn−1 I1∑
i=n−1αi+1
2
1 + 2e
− x0λS
√√√√√λ[Slpk−αRρ0(αn−1 I1∑
i=n−1αi+1
)2]·
+
+2e
− 2x0λS
√√√√√λ[Slpk−αRρ0(αn−1 I1∑
i=n−1αi+1
)2]·
(25)
3. Three-Dimensional Thermal Model
Using the software package Pro-ENGINEER, a 3D model for a HBC fuse has been developed.The analyzed HBC fuse was a gG type, size 2, having a 160 A rated current, a 550 V rated voltage,a 12.8 W rated power losses and a 120 kA rated breaking capacity. The 3D model considered all thecomponent of a HBC fuse, that is: screws, ceramic body, silica sand, inner and outer cap, alloy M-effectattached on fuselinks and knife contacts, as presented in Figure 3.
All thermal simulations were realised with the 3D finite elements Pro-MECHANICA software.In Table 1 there are presented the material properties of the components, corresponding to Figure 3.The heat load has been considered for both fuselink elements in conjunction with the consideredasymmetry coefficient. These elements have a uniform spatial distribution. For the mesh of the 3Dmodel tetrahedron solids element types has been used with the next admissible angle limits (degrees):maximum face: 175; minimum face: 5, maximum edge: 175; minimum edge: 5. The maximum aspectratio is 30 and the maximum edge turn (degrees) is 95. Also, for the tolerance of the geometry wereused the next values: minimum edge length: 0.0001; minimum surface dimension: 0.0001; minimumcusp angle: 0.86; merge tolerance: 0.0001. In order to solve the thermal steady-state simulation, it wasused the single pass adaptive convergence method.

Energies 2018, 11, 1990 10 of 18
Figure 3. Thermal model of the HBC fuse (1—inner cap; 2—silica sand; 3—ceramic body; 4—fuse link;5—outer cap; 6—alloy M-effect; 7—knife contact; 8—screws).
Table 1. Materials and parameters at 20 ◦C corresponding to the components in Figure 3.
MaterialParameter
γ (kg/m3) c (J/kg◦C) λ (W/m◦C)
Ceramic/Steatite C221 (3) 2700 900 2.6Copper (4) 8900 385 385
Iron FE40 (8) 7190 420.27 52.028Brass (7) 8550 386 115
Aluminium (5) 2700 890 220Alloy SnCu1 (6) 7310 217 67
Insulation material/pressed carton (1) 1400 0.099 0.063Silica sand (2) 830 1201 1
For the analyzed HBC fuse has been considered the next dimensions: the length of the ceramicbody: 61 mm, square cross-section: 50 mm × 50 mm, total length including the knife contacts:150 mm. The fuse link dimensions are: 55 mm in length, about 10mm width and 0.2 mm thickness.The environment temperature was about 25 ◦C. Experimental tests give the values for the convectioncoefficient on the ceramic body as 15.3 W/m2◦C. For the metal parts of the fuse, the convectioncoefficient was of 19.5 W/m2◦C. Convection condition was having into attention like boundarycondition for the outer boundaries such as knife contacts, outer caps, screws, and ceramic body and ithas been applied on surfaces with a uniform spatial variation and a bulk temperature of 25 ◦C.
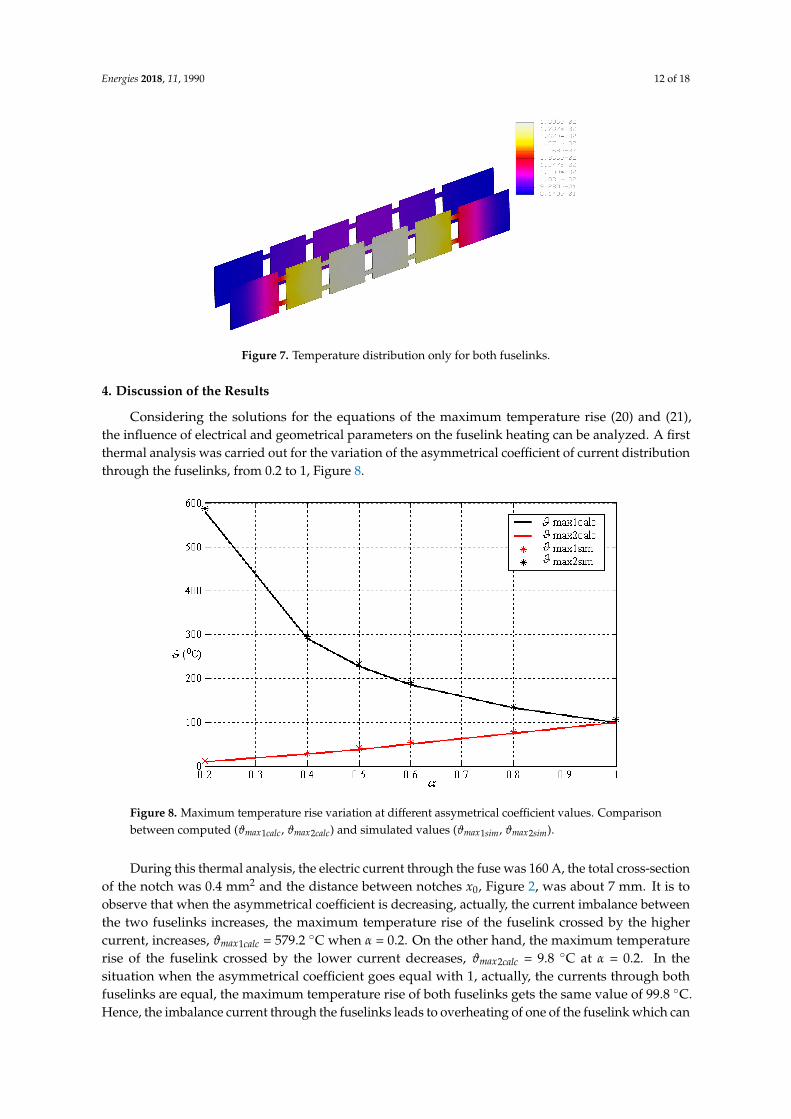
Further, steady state thermal simulations have been realised. Figure 4 represents the spread of thetemperature into the fuse by the most thermally loaded fuselink. Figure 5 presents the spread of thetemperature through the least thermally loaded fuse element. In Figure 6 is depicted the distributionof the temperature on the fuse at a half cross-section of it. From the figure it results higher valuesof the temperatures on the right side of the fuse cross-section which match to the most thermallyloaded fuselink. Figure 7 depicts only the fuse elements for a better representation of the fuselinkstemperature dispense.

Energies 2018, 11, 1990 11 of 18
Figure 4. Temperature release through the most loaded fuselink, for 180 A current and asymmetrycoefficient of 0.8.
Figure 5. Temperature release through the least loaded fuselink, for 180 A current and asymmetrycoefficient of 0.8.
Figure 6. Temperature release through the fuse at 50% cross-section.
Energies 2018, 11, 1990 12 of 18
Figure 7. Temperature distribution only for both fuselinks.
4. Discussion of the Results
Considering the solutions for the equations of the maximum temperature rise (20) and (21),the influence of electrical and geometrical parameters on the fuselink heating can be analyzed. A firstthermal analysis was carried out for the variation of the asymmetrical coefficient of current distributionthrough the fuselinks, from 0.2 to 1, Figure 8.
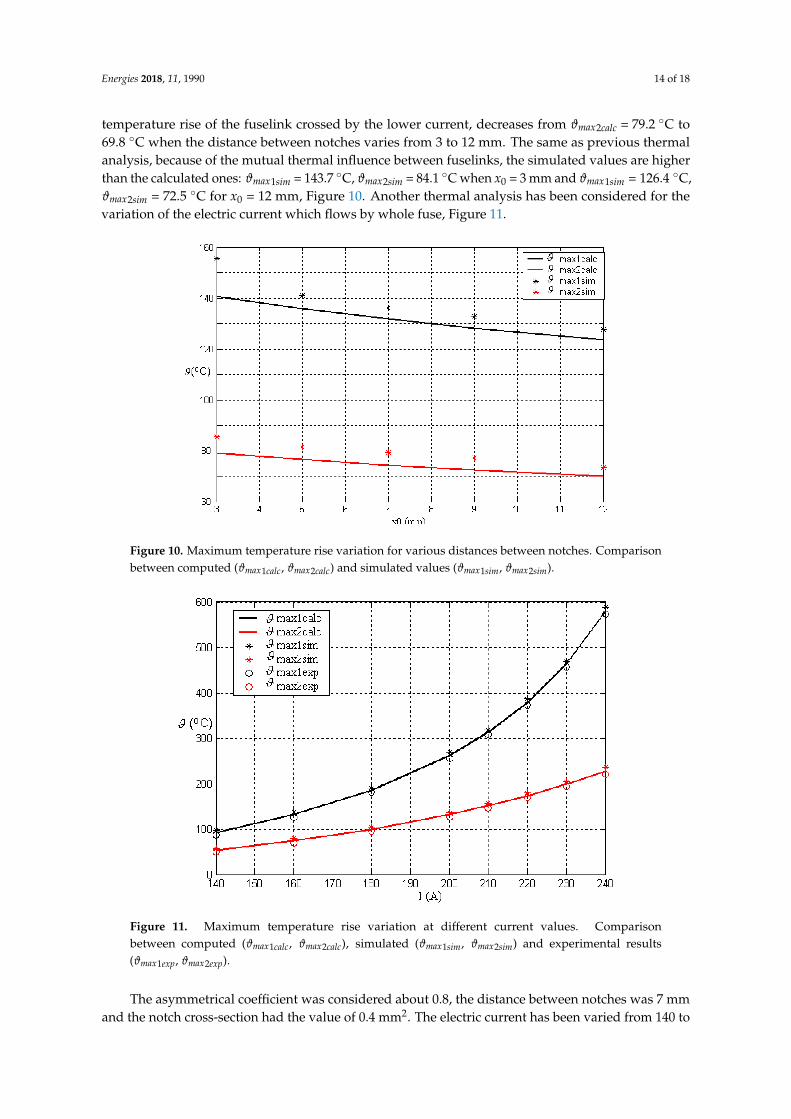
Figure 8. Maximum temperature rise variation at different assymetrical coefficient values. Comparisonbetween computed (ϑmax1calc, ϑmax2calc) and simulated values (ϑmax1sim, ϑmax2sim).
During this thermal analysis, the electric current through the fuse was 160 A, the total cross-sectionof the notch was 0.4 mm2 and the distance between notches x0, Figure 2, was about 7 mm. It is toobserve that when the asymmetrical coefficient is decreasing, actually, the current imbalance betweenthe two fuselinks increases, the maximum temperature rise of the fuselink crossed by the highercurrent, increases, ϑmax1calc = 579.2 ◦C when α = 0.2. On the other hand, the maximum temperaturerise of the fuselink crossed by the lower current decreases, ϑmax2calc = 9.8 ◦C at α = 0.2. In thesituation when the asymmetrical coefficient goes equal with 1, actually, the currents through bothfuselinks are equal, the maximum temperature rise of both fuselinks gets the same value of 99.8 ◦C.Hence, the imbalance current through the fuselinks leads to overheating of one of the fuselink which can

Energies 2018, 11, 1990 13 of 18
reach the melting temperature of the fuselink material during small overloads and finally, this fuselinkwill be broken. Therefore, the time-current characteristic of HBC fuse will work inappropriately atleast in the overload area.
The simulation values of maximum temperature rise are higher than the computed ones, Figure 8,ϑmax1sim = 584.3 ◦C, ϑmax2sim = 11.8 ◦C when α = 0.2 and ϑmax1sim = ϑmax2sim = 102.8 ◦C for α = 1.This is explained by the fact that thermal simulations takes into account the mutual thermal influencesbetween fuselinks.
The next thermal analysis was carried out for the variation of the notch cross-section from 0.2 mm2
to 1.6 mm2, Figure 9. In this case, the constant parameters are the distance between notches, 7 mm,the asymmetrical coefficient α = 0.8 and the electric current with the value of 160 A. The variationof the notch cross-section means the variation of the additional power loss which leads to variationof the maximum temperature rise of the fuselink. It can be noticed, Figure 9, a decreasing of themaximum temperature rise for both fuselinks when the notch cross-section increases. The explanationis that additional power loss depends inversely proportional by the notch cross-section, and finally,the maximum temperature rise of the fuselink has the same variation. The maximum temperaturerise of the most leaded fuselink, decreases from ϑmax1calc = 201.1 ◦C to 95 ◦C and the maximumtemperature rise of the least loaded fuselink, decreases from ϑmax2calc = 106.7 ◦C to 54.3 ◦C when thenotch cross-section goes from 0.2 to 1.6 mm2.
Figure 9. Maximum temperature rise variation for various notch cross-section values. Comparisonbetween computed (ϑmax1calc, ϑmax2calc) and simulated values (ϑmax1sim, ϑmax2sim).
The simulated values are close to the computed ones, Figure 9, ϑmax1sim = 204.7 ◦C,ϑmax2sim = 109.2 ◦C when s = 0.2 mm2 and ϑmax1sim = 98.1 ◦C, ϑmax2sim = 56.2 ◦C for s = 1.6 mm2.Anyway, it is to observe that the simulated results are slightly higher than the calculated ones becauseof the same mutual thermal influences between fuselinks. A third thermal analysis was carried out forthe variation of the distance between notches, Figure 10.
For this analysis, the electric current was 160 A, the asymmetrical coefficient α = 0.8 and the notchcross-section was about 0.4 mm2. A decrease of the maximum temperature rise when the distancebetween notches increases is observed for both fuselinks. This is explained by the fact that the smallerthe distance between notches, the greater the thermal influence of the additional power losses becauseof the notches on the maximum temperature rise. The maximum temperature rise of the fuselinkcrossed by the higher current, decreases from ϑmax1calc = 140.8 ◦C to 123.5 ◦C and the maximum
Energies 2018, 11, 1990 14 of 18
temperature rise of the fuselink crossed by the lower current, decreases from ϑmax2calc = 79.2 ◦C to69.8 ◦C when the distance between notches varies from 3 to 12 mm. The same as previous thermalanalysis, because of the mutual thermal influence between fuselinks, the simulated values are higherthan the calculated ones: ϑmax1sim = 143.7 ◦C, ϑmax2sim = 84.1 ◦C when x0 = 3 mm and ϑmax1sim = 126.4 ◦C,ϑmax2sim = 72.5 ◦C for x0 = 12 mm, Figure 10. Another thermal analysis has been considered for thevariation of the electric current which flows by whole fuse, Figure 11.
Figure 10. Maximum temperature rise variation for various distances between notches. Comparisonbetween computed (ϑmax1calc, ϑmax2calc) and simulated values (ϑmax1sim, ϑmax2sim).
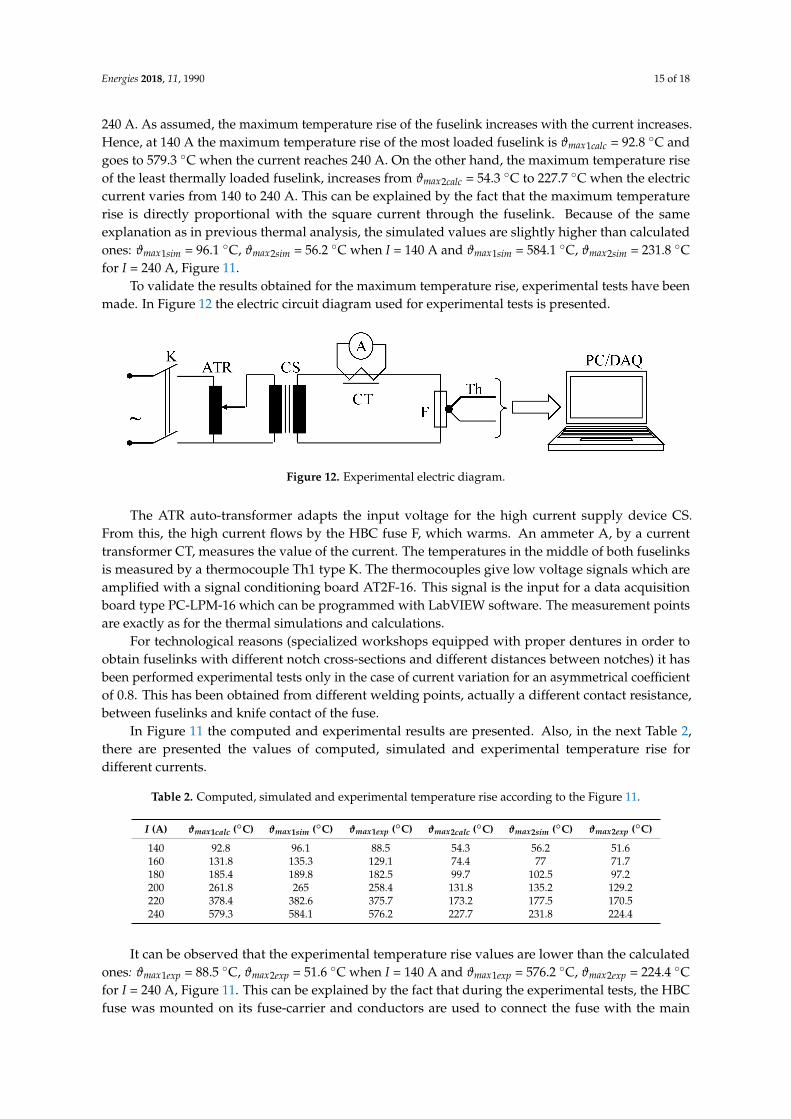
Figure 11. Maximum temperature rise variation at different current values. Comparisonbetween computed (ϑmax1calc, ϑmax2calc), simulated (ϑmax1sim, ϑmax2sim) and experimental results(ϑmax1exp, ϑmax2exp).
The asymmetrical coefficient was considered about 0.8, the distance between notches was 7 mmand the notch cross-section had the value of 0.4 mm2. The electric current has been varied from 140 to
Energies 2018, 11, 1990 15 of 18
240 A. As assumed, the maximum temperature rise of the fuselink increases with the current increases.Hence, at 140 A the maximum temperature rise of the most loaded fuselink is ϑmax1calc = 92.8 ◦C andgoes to 579.3 ◦C when the current reaches 240 A. On the other hand, the maximum temperature riseof the least thermally loaded fuselink, increases from ϑmax2calc = 54.3 ◦C to 227.7 ◦C when the electriccurrent varies from 140 to 240 A. This can be explained by the fact that the maximum temperaturerise is directly proportional with the square current through the fuselink. Because of the sameexplanation as in previous thermal analysis, the simulated values are slightly higher than calculatedones: ϑmax1sim = 96.1 ◦C, ϑmax2sim = 56.2 ◦C when I = 140 A and ϑmax1sim = 584.1 ◦C, ϑmax2sim = 231.8 ◦Cfor I = 240 A, Figure 11.
To validate the results obtained for the maximum temperature rise, experimental tests have beenmade. In Figure 12 the electric circuit diagram used for experimental tests is presented.
Figure 12. Experimental electric diagram.
The ATR auto-transformer adapts the input voltage for the high current supply device CS.From this, the high current flows by the HBC fuse F, which warms. An ammeter A, by a currenttransformer CT, measures the value of the current. The temperatures in the middle of both fuselinksis measured by a thermocouple Th1 type K. The thermocouples give low voltage signals which areamplified with a signal conditioning board AT2F-16. This signal is the input for a data acquisitionboard type PC-LPM-16 which can be programmed with LabVIEW software. The measurement pointsare exactly as for the thermal simulations and calculations.
For technological reasons (specialized workshops equipped with proper dentures in order toobtain fuselinks with different notch cross-sections and different distances between notches) it hasbeen performed experimental tests only in the case of current variation for an asymmetrical coefficientof 0.8. This has been obtained from different welding points, actually a different contact resistance,between fuselinks and knife contact of the fuse.
In Figure 11 the computed and experimental results are presented. Also, in the next Table 2,there are presented the values of computed, simulated and experimental temperature rise fordifferent currents.
Table 2. Computed, simulated and experimental temperature rise according to the Figure 11.
I (A) ϑmax1calc (◦C) ϑmax1sim (◦C) ϑmax1exp (◦C) ϑmax2calc (◦C) ϑmax2sim (◦C) ϑmax2exp (◦C)
140 92.8 96.1 88.5 54.3 56.2 51.6160 131.8 135.3 129.1 74.4 77 71.7180 185.4 189.8 182.5 99.7 102.5 97.2200 261.8 265 258.4 131.8 135.2 129.2220 378.4 382.6 375.7 173.2 177.5 170.5240 579.3 584.1 576.2 227.7 231.8 224.4
It can be observed that the experimental temperature rise values are lower than the calculatedones: ϑmax1exp = 88.5 ◦C, ϑmax2exp = 51.6 ◦C when I = 140 A and ϑmax1exp = 576.2 ◦C, ϑmax2exp = 224.4 ◦Cfor I = 240 A, Figure 11. This can be explained by the fact that during the experimental tests, the HBCfuse was mounted on its fuse-carrier and conductors are used to connect the fuse with the main

Energies 2018, 11, 1990 16 of 18
electric circuit. Due to their volume and thermal capacity, these elements act as heat sinks for thefuselinks, with consequences in significant heat dissipation rate. Moreover, the dissimilarity betweenthe temperature from the experimental tests and those resulted from the mathematical model are dueto different factors, such as: simplifications of the thermal model, errors during the measurement,and mounting test conditions. However, there is less than 3.5 ◦C difference between the experimentaland computed results.
The proposed mathematical model can be used only in the case of steady-state conditions.During transient conditions, the thermal model has to consider the time-variation of the temperature,or temperature rise. In this situation, the effects of fault currents upon the fuse operation canbe analyzed. Also, in the case of fuselinks with different notch shapes or variable cross-section,the mathematical model has to be changed. This analysis would be considered for further research inthe HBC fuse field.
5. Conclusions
High breaking capacity fuses are widely used to protect electrical installations and especiallypower distribution systems against overcurrents. Depending on its rated current, the fuse includesmore than one single fuse element. For manufacturing reasons, during fuse operating conditions,there is the possibility that an asymmetrical current distribution between fuselinks appears, which maylead to an improper functioning of the HBC fuse.
This article describes a mathematical model capable of analyzing the maximum temperature riseof a HBC fuse with two parallel mounted fuselinks. The thermal model permits the estimation of themaximum temperature rise of both fuselinks with the current change, the cross-section variation ofthe notches, the variation of the distance between the notches and for the variation of the imbalancecurrent through the fuselinks. The mathematical model can be used for a HBC fuse with “n” parallelmounted fuselinks. The mathematical expressions to compute the maximum temperature rise for allparallel fuselinks have been obtained. Also, a three dimensional thermal model for the same HBCfuse has been achieved. The thermal simulated values of the maximum temperature rise of bothfuselinks are close to the computed ones. The maximum difference between these values is about 5 ◦C.The 3D thermal model of the HBC fuse can be used as a design tool for the power systems protection,in particular for low voltage power supply.
In order to validate the presented mathematical model and the 3D thermal model, experimentaltests have been made. There are close values between computed, experimental and simulated resultsin the case of current variation through the HBC fuse. The maximum difference between computedand experimental results is about 3.5 ◦C.
The mathematical model permits one to design new types of fuselink having a suitable thermaldistribution with the opportunity to obtain new solutions for a better connection between fuses andthe devices to be protected.
Author Contributions: The whole article has been performed only by the author.
Funding: This research received no external funding.
Acknowledgments: The author had not received any funds for covering the costs to publish in open access.
Conflicts of Interest: The author declares no conflict of interest.
Nomenclature
I electric current through the fuse;P0x additional power loss because of notches;x0 distance between notches;s total notch cross-section;l0 length of the notch;

Energies 2018, 11, 1990 17 of 18
S fuselink cross-section;lp perimeter of the fuselink cross-section;j current density;ρ electrical resistivity;ρ0 initial electrical resistivity;λ thermal conductivity;k thermal transfer coefficient;θ temperature;θa ambient temperature;αR coefficient of electrical resistivity variation with temperature;α asymmetrical coefficient;γ density;c specific heat;a2
1 by definition a21 =
lpkλS −
αRρ0 j2
λ ;b2
1 by definition b21 =
ρ0 j2
λ .
References
1. Wright, A.; Newbery, P.G. Electric Fuses; IEE: London, UK, 2004; ISBN-13: 9780863413995.2. Rochette, D.; Clain, S. Mathematical model and simulation of gas flow through a porous medium in high
breaking capacity fuses. Int. J. Heat Fluid Flow 2004, 25, 115–126. [CrossRef]3. Rochette, D.; Clain, S. Local heat transfer of compressible fluid in porous media: Application to the HBC
fuse. Int. J. Heat Fluid Flow 2005, 26, 322–333. [CrossRef]4. Rochette, D.; Bussiere, W.; Touzani, R.; Memiaghe, S.; Velleaud, G.; André, P. Modelling of the pre-arcing
period in HBC fuses including solid-liquid-vapour phase changes of the fuse element. In Proceedings ofthe 2007 8th International Conference on Electric Fuses and their Applications, Clermont-Ferrand, France,10–12 September 2007; pp. 87–93.
5. Psomopoulos, C.S.; Karagiannopoulos, C.G. Measurement of fusible elements during current interruptionand interpretation of related phenomena. Measurement 2002, 32, 15–22. [CrossRef]
6. Bussiere, W.; Rochette, D.; Velleaud, G.; Latchimy, T.; Gelet, J.L.; Gentils, F.; Perez-Quesada, J.C.; Rambaud, T.;Andre, P. Experimental study of HBC fuses working at short and medium pre-arcing times. J. Phys. DAppl. Phys. 2008, 41, 195210. [CrossRef]
7. Barrow, D.R.; Howe, A.F.; Cook, N. The chemistry of electric fuse arcing. IEE Proc. Sci. Meas. Technol. 1991,138, 83–88. [CrossRef]
8. Torres, E.; Mazón, A.J.; Fernández, E.; Zamora, I.; Pérez, J.C. Thermal performance of back-up current-limitingfuses. Electr. Power Syst. Res. 2010, 80, 1469–1476. [CrossRef]
9. Petit, A.; St-Jean, G.; Fecteau, G. Empirical model of a current-limiting fuse using EMTP. IEEE Trans.Power Deliv. 1989, 4, 335–341. [CrossRef]
10. Huang, X.; Li, S.; Liu, Z.; Geng, Y.; Wang, J. The influence of M-effect metal arrangment on the overloadcurrent pre-arcing time of DC current-limiting fuses. In Proceedings of the 2017 4th International Conferenceon Electric Power Equipment-Switching Technology (ICEPE-ST), Xi’an, China, 22–25 October 2017;pp. 523–526.
11. Gammon, T.; Saporita, V. Current-Limiting Fuses: New NFPA 70-2017 Section 240.67, Arc Modeling, and anAssessment Based on the IEEE 1584-2002. IEEE Trans. Ind. Appl. 2017, 53, 608–614. [CrossRef]
12. Chiriac, G. Thermal analysis of fuses with variable cross-section fuselinks. Electr. Power Syst. Res. 2012, 92,73–80. [CrossRef]
13. Jakubiuk, K.; Wiesław, A. Heating of fuse-elements in transient and steady-state. In Proceedings of theSeven International Conference on Clean, Efficient & Safe Urban Transport ICEFA’03, Gdansk, Poland,8–10 September 2003; pp. 181–187.
14. Hamler, A.; Gril, S.; Cukovic, J.P. Thermal analysis and temperature calculation for the NV melting fuse.In Proceedings of the 9th International Conference on Electric Fuses and their Applications, Maribor, Slovenia,12–14 September 2011; pp. 219–224.

Energies 2018, 11, 1990 18 of 18
15. Hoffmann, G.; Kaltenborn, U. Thermal modelling of high voltage H.R.C. fuses and simulation of trippingcharacteristic. In Proceedings of the 7th International Conference on Electric Fuses and their Applications,Gdansk, Poland, 8–10 September 2003; pp. 174–180.
16. Memiaghe, S.; Bussière, W.; Rochette, D. Numerical method for pre-arcing times: Application in HBC fuseswith heavy fault-currents. In Proceedings of the 8th International Conference on Electric Fuses and theirApplications, Clermont-Ferrand, France, 10–12 September 2007; pp. 127–132.
17. Gómez, J.C.; Tourn, D.H.; Nesci, S.; Sanchez, L.; Rovere, H. Why the operation failure of high breakingcapacity fuses is so frequent? CIRED-Open Access Proc. J. 2017, 1, 1545–1549. [CrossRef]
18. Kühnel, C.; Schlegel, S.; Großmann, S. Investigations on the long-term behavior and switching function offuse-elements for NH-fuse-links (gG) at higher thermal stress. In Proceedings of the 2017 6th InternationalYouth Conference on Energy (IYCE), Budapest, Hungary, 21–24 June 2017; pp. 1–8.
19. Halevidis, C.D.; Mouzakitis, P.I.; Polykrati, A.D.; Bourkas, P.D. The effect of the fuse enclosure temperaturerise on low voltage overhead conductor protection. In Proceedings of the MedPower 2014 Conference,Athens, Greece, 2–5 November 2014.
20. Kawase, Y.; Miyatake, T.; Ito, S. Heat analysis of a fuse for semiconductor devices protection using 3-D finiteelement method. IEEE Trans. Magn. 2000, 36, 1377–1380. [CrossRef]
21. Torres, E.; Fernandez, E.; Mazon, A.J.; Zamora, I.; Perez, J.C. Thermal analysis of medium voltage fusesusing the finite element method. In Proceedings of the 2005 IEEE Russia Power Tech, St. Petersburg, Russia,27–30 June 2005; pp. 1–5.
22. Farahani, H.F.; Asadi, M.; Kazemi, A. Analysis of thermal behavior of power system fuse using finite elementmethod. In Proceedings of the 2010 4th International Power Engineering and Optimization Conference(PEOCO), Shah Alam, Malaysia, 23–24 June 2010.
23. Han, R.; Wang, T.; Wang, Q.; Zheng, Y.; Dong, L. Analysis for fusing time of fuse under effect of harmonicsbased on FE method. In Proceedings of the 2016 International Conference on Electricity Distribution (CICED),Xi’an, China, 10–13 August 2016; pp. 1–5.
24. Costa, G.B.; Marchesan, A.C.; Morais, A.P.; Cardoso, G.; Gallas, M. Curve fitting analysis of time-currentcharacteristic of expulsion fuse links. In Proceedings of the 2017 IEEE International Conference onEnvironment and Electrical Engineering and 2017 IEEE Industrial and Commercial Power Systems Europe(EEEIC/I&CPS Europe), Milan, Italy, 6–9 June 2017.
25. Demir, M.; Kahramanoglu, G.; Yildiz, A.B. Calculating of fuse melting point for power electronics circuits byinrush energy and determination of the eligibility. In Proceedings of the 2016 18th European Conferenceon Power Electronics and Applications (EPE’16 ECCE Europe), Karlsruhe, Germany, 5–9 September 2016;pp. 1–6.
26. Seefeld, V. Parallel connection of fuses. In Proceedings of the 10th International Conference on Electric Fusesand their Applications, Dresden, Germany, 14–16 September 2015.
27. Ou, T.C. A novel unsymmetrical faults analysis for microgrid distribution systems. Int. J. Electr. Power 2012,43, 1017–1024. [CrossRef]
28. Ou, T.C. Ground fault current analysis with a direct building algorithm for microgrid distribution. Int. J.Electr. Power 2013, 43, 867–875. [CrossRef]
29. Lin, W.M.; Ou, T.C. Unbalanced distribution network fault analysis with hybrid compensation. IET Gener.Transm. Dis. 2011, 5, 92–100. [CrossRef]
30. Gelet, J.L. Characterization of fuses for applications under high di/dt’s. In Proceedings of the 10thInternational Conference on Electric Fuses and their Applications, Dresden, Germany, 14–16 September 2015.
31. Clark, S.W. Fuse thermal stability impacts on arc flash mitigation. In Proceedings of the 2015 IEEE/IAS 51stIndustrial & Commercial Power Systems Technical Conference (I&CPS), Calgary, AB, Canada, 5–8 May 2015;pp. 1–3.
32. Low-Voltage Fuses—Part 6: Supplementary Requirements for Fuse-Links for the Protection of SolarPhotovoltaic Energy Systems. Available online: https://infostore.saiglobal.com/preview/is/en/2011/i.s.en60269-6-2011.pdf?sku=1467015 (accessed on 30 July 2018).
© 2018 by the author. Licensee MDPI, Basel, Switzerland. This article is an open accessarticle distributed under the terms and conditions of the Creative Commons Attribution(CC BY) license (http://creativecommons.org/licenses/by/4.0/).
Related Documents