Temperature-dependent thermal properties of a paraffin phase change material embedded with herringbone style graphite nanofibers Ronald J. Warzoha, Rebecca M. Weigand, Amy S. Fleischer ⇑ Department of Mechanical Engineering, Villanova University, Villanova, PA 19085, United States highlights The thermal properties of a PCM with nanofibers are determined. The solid-phase thermal conductivity scales exponentially with volume fraction. The liquid-phase thermal conductivity is only enhanced beyond a critical percolation threshold. The nanoscale interface resistance depends on the nanoparticle’s dimensionality. The thermal diffusivity and volumetric heat capacity of the nanoenhanced PCMs are found. article info Article history: Received 10 January 2014 Received in revised form 19 February 2014 Accepted 31 March 2014 Available online xxxx Keywords: Thermal conductivity Thermal diffusivity Herringbone graphite nanofiber Phase change material Thermal energy storage Thermal boundary resistance abstract In many studies, carbon nanoparticles with high values of thermal conductivity (10–3000 W/m K) have been embedded into phase change thermal energy storage materials (PCMs) in order to enhance their bulk thermal properties. While a great deal of work to date has focused on determining the effect of these nanoparticles on a PCM’s solid phase thermal properties, little is known about their effect on its liquid phase thermal properties. Thus, in this study, the effect of implanting randomly oriented herringbone style graphite nanofibers (HGNF, average diameter = 100 nm, average length = 20 lm) on the bulk thermal properties of an organic paraffin PCM (IGI 1230A, T melt = 329.15 K) in both the solid and liquid phase is quantified. The bulk thermal conductivity, volumetric heat capacity and thermal diffusivity of HGNF/PCM nanocomposites are obtained as a function of temperature and HGNF volume loading level. It is found that the property enhancement varies significantly depending on the material phase. In order to explain the difference between solid and liquid phase thermal properties, heat flow at the nanoparti- cle–PCM and nanoparticle–nanoparticle interfaces is examined as a function of HGNF loading level and temperature. To do this, the solid and liquid phase thermal boundary resistances (TBRs) between the nanoparticles and the surrounding PCM and/or between contacting nanoparticles are found. Results sug- gest that the TBR at the HGNF–PCM interface is nearly double the TBR across the HGNF–HGNF interface in both solid and liquid phases. However, both the HGNF–PCM and HGNF–HGNF TBRs are at least an order of magnitude lower when the PCM is in its solid phase versus when the PCM is in its liquid phase. Finally, the effect of nanofiber concentration on the PCM’s latent heat of fusion and melt temperature is investi- gated in order to determine the applicability of the HGNF/PCM nanocomposite in a wide variety of energy systems. Ó 2014 Elsevier Ltd. All rights reserved. 1. Introduction The solid–liquid phase transition is of great interest to the sci- entific community for its association with thermal energy storage. A phase change material (PCM) stores thermal energy through the loosening or breaking apart of molecular or atomic bond structures when energy is transferred into the material. The stored heat can be discharged into a heat exchanger or the environment at a later time as the material recrystallizes. The amount of thermal energy that can be stored during this process is referred to as the latent heat of fusion and is an intrinsic material property. Organic PCMs (like paraffin) are known to possess a high value of latent heat of fusion (>200 kJ/kg) [1]. These materials are therefore considered to be excellent candidates for passively cooling electronics [2,3], storing solar-thermal energy [4–6] and for thermal comfort control http://dx.doi.org/10.1016/j.apenergy.2014.03.091 0306-2619/Ó 2014 Elsevier Ltd. All rights reserved. ⇑ Corresponding author. Tel.: +1 6105194996. E-mail address: amy.fl[email protected] (A.S. Fleischer). Applied Energy xxx (2014) xxx–xxx Contents lists available at ScienceDirect Applied Energy journal homepage: www.elsevier.com/locate/apenergy Please cite this article in press as: Warzoha RJ et al. Temperature-dependent thermal properties of a paraffin phase change material embedded with her- ringbone style graphite nanofibers. Appl Energy (2014), http://dx.doi.org/10.1016/j.apenergy.2014.03.091

Welcome message from author
This document is posted to help you gain knowledge. Please leave a comment to let me know what you think about it! Share it to your friends and learn new things together.
Transcript
Applied Energy xxx (2014) xxx–xxx
Contents lists available at ScienceDirect
Applied Energy
journal homepage: www.elsevier .com/locate /apenergy
Temperature-dependent thermal properties of a paraffin phase changematerial embedded with herringbone style graphite nanofibers
http://dx.doi.org/10.1016/j.apenergy.2014.03.0910306-2619/� 2014 Elsevier Ltd. All rights reserved.
⇑ Corresponding author. Tel.: +1 6105194996.E-mail address: [email protected] (A.S. Fleischer).
Please cite this article in press as: Warzoha RJ et al. Temperature-dependent thermal properties of a paraffin phase change material embedded wiringbone style graphite nanofibers. Appl Energy (2014), http://dx.doi.org/10.1016/j.apenergy.2014.03.091
Ronald J. Warzoha, Rebecca M. Weigand, Amy S. Fleischer ⇑Department of Mechanical Engineering, Villanova University, Villanova, PA 19085, United States
h i g h l i g h t s
� The thermal properties of a PCM with nanofibers are determined.� The solid-phase thermal conductivity scales exponentially with volume fraction.� The liquid-phase thermal conductivity is only enhanced beyond a critical percolation threshold.� The nanoscale interface resistance depends on the nanoparticle’s dimensionality.� The thermal diffusivity and volumetric heat capacity of the nanoenhanced PCMs are found.
a r t i c l e i n f o
Article history:Received 10 January 2014Received in revised form 19 February 2014Accepted 31 March 2014Available online xxxx
Keywords:Thermal conductivityThermal diffusivityHerringbone graphite nanofiberPhase change materialThermal energy storageThermal boundary resistance
a b s t r a c t
In many studies, carbon nanoparticles with high values of thermal conductivity (10–3000 W/m K) havebeen embedded into phase change thermal energy storage materials (PCMs) in order to enhance theirbulk thermal properties. While a great deal of work to date has focused on determining the effect of thesenanoparticles on a PCM’s solid phase thermal properties, little is known about their effect on its liquidphase thermal properties. Thus, in this study, the effect of implanting randomly oriented herringbonestyle graphite nanofibers (HGNF, average diameter = 100 nm, average length = 20 lm) on the bulkthermal properties of an organic paraffin PCM (IGI 1230A, Tmelt = 329.15 K) in both the solid and liquidphase is quantified. The bulk thermal conductivity, volumetric heat capacity and thermal diffusivity ofHGNF/PCM nanocomposites are obtained as a function of temperature and HGNF volume loading level.It is found that the property enhancement varies significantly depending on the material phase. In orderto explain the difference between solid and liquid phase thermal properties, heat flow at the nanoparti-cle–PCM and nanoparticle–nanoparticle interfaces is examined as a function of HGNF loading level andtemperature. To do this, the solid and liquid phase thermal boundary resistances (TBRs) between thenanoparticles and the surrounding PCM and/or between contacting nanoparticles are found. Results sug-gest that the TBR at the HGNF–PCM interface is nearly double the TBR across the HGNF–HGNF interface inboth solid and liquid phases. However, both the HGNF–PCM and HGNF–HGNF TBRs are at least an orderof magnitude lower when the PCM is in its solid phase versus when the PCM is in its liquid phase. Finally,the effect of nanofiber concentration on the PCM’s latent heat of fusion and melt temperature is investi-gated in order to determine the applicability of the HGNF/PCM nanocomposite in a wide variety of energysystems.
� 2014 Elsevier Ltd. All rights reserved.
1. Introduction
The solid–liquid phase transition is of great interest to the sci-entific community for its association with thermal energy storage.A phase change material (PCM) stores thermal energy through theloosening or breaking apart of molecular or atomic bond structures
when energy is transferred into the material. The stored heat canbe discharged into a heat exchanger or the environment at a latertime as the material recrystallizes. The amount of thermal energythat can be stored during this process is referred to as the latentheat of fusion and is an intrinsic material property. Organic PCMs(like paraffin) are known to possess a high value of latent heat offusion (>200 kJ/kg) [1]. These materials are therefore consideredto be excellent candidates for passively cooling electronics [2,3],storing solar-thermal energy [4–6] and for thermal comfort control
th her-

2 R.J. Warzoha et al. / Applied Energy xxx (2014) xxx–xxx
when incorporated into building materials [7,8]. More recently,PCMs have been used as the primary component in passive heatswitch applications [9].
The use of organic PCMs for the aforementioned applicationsfaces several major impediments, however. The greatest of thesehas been identified as their low thermal conductivities [10]. Thethermal conductivity of most organic phase change materials issignificantly less than 1 W/m K. When excessive heat loads areapplied to these PCMs, the low thermal conductivity of the liquidcauses it to superheat in close proximity to the heat source, whilemost of the PCM remains in its solid phase. As a result, only sys-tems with short transient heat loads or those with a low appliedheat flux are currently suitable for thermal management or ther-mal energy storage using organic paraffin PCMs [11,12]. In orderto increase the utility of these PCMs, their thermal properties mustbe improved.
Enhancing the thermal conductivity of phase change materialscan be accomplished in a variety of ways. In many early works,PCMs were simply embedded into heat sinks in order to increasethe penetration of heat into the material [13–15]. However, thehigh density of the heat sink coupled with manufacturing limita-tions results in low compatibility with most state-of-the-artenergy and electronics applications. Foams have also been identi-fied as possible candidates for thermal conductivity enhancementof PCMs due to their high thermal conductivities (�180 W/m Kfor graphite [16]) and low densities [17–19]. One disadvantage offoams, however, is that they suppress natural convection duringthe phase transition. As a result, thermal charging rates (or melttimes) are substantially increased within the PCM. Moreover, it isdifficult to completely saturate most foams with an organic PCMwithout first displacing the air that is trapped between individualfoam ligaments [19]. Finally, foam volumes also have manufactur-ing limitations and thus constrain applicability.
Recently, there has been strong interest in incorporating nano-particles into organic phase change materials in order to enhancetheir thermal properties due to their high surface area-to-volumeratios and high thermal conductivities. Sanusi et al. [20] embeddedthree different types of graphite nanofibers (GNF) into a paraffinPCM (IGI 1230A, Tmelt = 329.15 K) in order to analyze their effecton discharge times. The authors found that a 61% reduction in dis-charge time could be accomplished using a weight fraction of 10%Herringbone graphite nanofibers (HGNF). This reduction in dis-charge time makes the PCM a more attractive candidate forapplications where heat is exchanged between materials, such assolar-thermal energy systems [21].
Several other works have found that nanoparticles enhance thethermal conductivity of PCMs, as reviewed by Fan and Khodadadi[10]. However, few of these studies describe the effect of nanopar-ticles on both the solid and liquid phase thermal properties of thePCM, which are equally important during melting and solidifica-tion processes. Even fewer studies report the thermal diffusivityin either material phase, making it difficult to determine the trueenhancement of the PCM caused by the nanoparticles given thetransient nature with which this material is used. Similarly, verylittle data exist concerning the nature of the physics that governthermal transport between different types of nanoparticles and asurrounding organic PCM.
In this study, the nanoscale thermophysics governing the ther-mal conductivity enhancements of PCM nanocomposites are deter-mined using a combination of experimental and analyticaltechniques. The primary focus of this work is to examine nanoscaleinterfacial thermophysics within the context of solid versus liquidbulk thermal properties. Here, the liquid thermal conductivity is acritically important parameter to consider during the PCM’ssolidification process. Consequently, in this paper we examine theheat flow physics at the nanoscale in order to help explain the
Please cite this article in press as: Warzoha RJ et al. Temperature-dependent thringbone style graphite nanofibers. Appl Energy (2014), http://dx.doi.org/10.10
differences in the thermal properties of the solid-phase PCMenhancements versus the liquid-phase PCM enhancements at dif-ferent volume fractions. It is found that there are large discrepan-cies between heat flow across nanoparticle interfaces in the PCMsolid and liquid phases, which result in extreme differencesbetween the solid and liquid phase bulk thermophysical propertiesof the HGNF/PCM nanocomposites. These findings are related to theinterfacial thermal resistance at the junction between other typesof carbon-based nanoparticles and PCMs. Ultimately, the dimen-sionality of the nanoparticle is found to have a significant effecton thermal transport between the PCM and the nanoparticle(s)embedded within it. Additionally, the effect of the HGNF inclusionson the bulk latent heat of fusion and melt temperature is deter-mined experimentally. The resulting insights allow for a betterunderstanding of the mechanisms that govern heat flow withinPCM nanocomposites and will allow for better design of thesematerials for state-of-the-art energy and electronics applications.
2. Analytical methods
The thermal characterization of nanostructures in nanofluids[22–24] and solid composites [25–27] has produced severalvaluable physical models that can be used to calculate their bulkthermal conductivities. These studies have also identified nano-scale phenomena that govern thermal transport within nanofluidsand nanocomposites. Additional studies have experimentallydetermined the bulk thermal conductivity of paraffin PCMs withnanoinclusions [28–31]. Together, these studies [22–31] showvarying degrees of influence of the nanoinclusions on bulk, roomtemperature thermal conductivity, and much attention has beenplaced on determining the physical mechanism(s) that governthese discrepancies.
Several physical models have been developed in order to deter-mine the magnitude of the impact of nanoinclusions on the ther-mal conductivity of composite materials. The vast majority ofthese models are based on effective medium approximations. Thesimplest models assume that either: (1) all inclusions (nanoparti-cles) are connected and fully percolate throughout the mediumor (2) all inclusions (nanoparticles) are separated and homoge-nously distributed within the medium. Models 1 and 2 are repre-sented by the first two equations in Table 1.
In each equation in Table 1, kc represents the effective thermalconductivity of the composite (W/m K), kp is the nanoparticle ther-mal conductivity (W/m K), km is the thermal conductivity of thepure PCM (W/m K), up is the volume fraction of nanoparticleswithin the PCM, um is the volume fraction of PCM in the composite,a is the aspect ratio of the nanoparticle (ratio of length to diameter)and ucrit is the percolation threshold for the HGNF. The models inthe lower part of Table 1 (Eqs. (3), (4), (5) and (6)) were proposedby Nan et al. [33] (Eqs. (3) and (4)), Foygel et al. [34] (Eq. (5)) andWemhoff [35] (Eq. (6)) and include the effect of nanoparticle orien-tation, the geometry of the nanoparticles and the nanoparticle–matrix and/or nanoparticle-nanoparticle thermal boundary resis-tance on the effective thermal conductivity of nanocompositematerials. In Eqs. (3) and (4), the parameters b, L and e representgeometrical conditions of the nanoparticle inclusions (definitionsof these parameters can be found in Nan et al. [33]). In Eq. (5), r0
is a preexponential factor that depends on the thermal conductiv-ity and morphology of the nanoparticles and t(a) is a conductivityexponent that is dependent on the aspect ratio of the nanoparticle.The criteria used for calculating both r0 and t(a) can be found inFoygel et al. [34]. Finally, the parameters hc, kpe and n in Eq. (6) rep-resent the nanoparticle–nanoparticle thermal contact resistance,the nanoparticle network effective thermal conductivity and a geo-metric constant that represents the nanoparticle network mor-phology, respectively. The function g(kpe) is defined by Eq. (7).
ermal properties of a paraffin phase change material embedded with her-16/j.apenergy.2014.03.091
Table 1Modified effective medium theory models for thermal conductivity of composites with nanostructures.
Name Model Equation Number References
Parallel model (Upper bound) kc ¼ kp �up þ km �um 1 Han and Fina [32]
Series model (Lower bound) kc ¼1
umkmþ up
kp
2 Han and Fina [32]
Spheres kc ¼ km �kpð1þ 2bÞ þ 2km þ 2upðkpð1� bÞ � kmÞkpð1þ 2bÞ þ 2km �upðkpð1� bÞ � kmÞ
3 Nan et al. [33]
Completely disoriented ellipsoidal particles kc ¼ km �3þup½2e11ð1� L11Þ þ e33ð1� L33Þ�
3�up½2e11L11 þ e33L33�4 Nan et al. [33]
Percolating ellipsoidal particles kc ¼ r0ðup �ucritðaÞÞtðaÞ
5 Foygel et al. [34]
Percolating ellipsoidal particles ke ¼u1:5
p � gðkpeÞ � nðaÞ � D2 �up � ð 1
hcÞ þ nðaÞ � D � ð 1
kpÞ
6 Wemhoff [35]
R.J. Warzoha et al. / Applied Energy xxx (2014) xxx–xxx 3
gðkpeÞ ¼1� km
kpe� ð1� aÞ
1� kmkc� ð1� aÞ
" #3=2�ð1�aÞ
ð7Þ
In the study presented here, the Nan et al. model [33] (Eq. (4)) isused to extrapolate the thermal boundary resistance (TBR)between a matrix material and an isolated nanoparticle, whilethe Foygel et al. model [34] (Eq. (5)) is used to determine the ther-mal boundary resistance at nanoparticle junctions. The Foygel et al.model [34] (Eq. (5)) is most often used in studies that calculate theTBR at nanoparticle–nanoparticle junctions and is therefore pres-ently the standard physical model that is used as a basis for com-paring the TBR at different nanoparticle–nanoparticle junctionsbetween studies. While the model developed by Wemhoff [35]more accurately captures the nanoscale physics associated withheat flow at the nanoparticle–nanoparticle interface, it cannot beused here as the model assumes that there exists a uniform spatialand orientational distribution of straight nanoparticles within thehost matrix. As is later shown in the SEM imaging analyses we per-formed, this assumption is violated and leads to a breakdown inthe theory. Thus, only the models developed by Nan et al. [33]and Foygel et al. [34] are used to extract the thermal boundaryresistance in this study.
The thermal boundary resistance across nanoparticle interfacesis a well-known phenomenon and can have a marked effect on thebulk thermal conductivity of a nanocomposite material [36,37].However, the physical mechanisms that govern heat flow at theseinterfaces are still not well understood, though they have beenattributed to discrepancies in the interface chemistry [38] andatomic ordering at nanoparticle interfaces [39,40]. Additional stud-ies [41] have found that other nanoscale effects, such as Brownianmotion, are negligible when compared to the thermal boundaryresistance at nanoparticle interfaces, particularly in higher viscos-ity fluids. Therefore, in this study the TBR is considered to be thedominant mechanism that affects heat flow across nanoparticleinterfaces.
Please cite this article in press as: Warzoha RJ et al. Temperature-dependent thringbone style graphite nanofibers. Appl Energy (2014), http://dx.doi.org/10.10
3. Materials synthesis and characterization
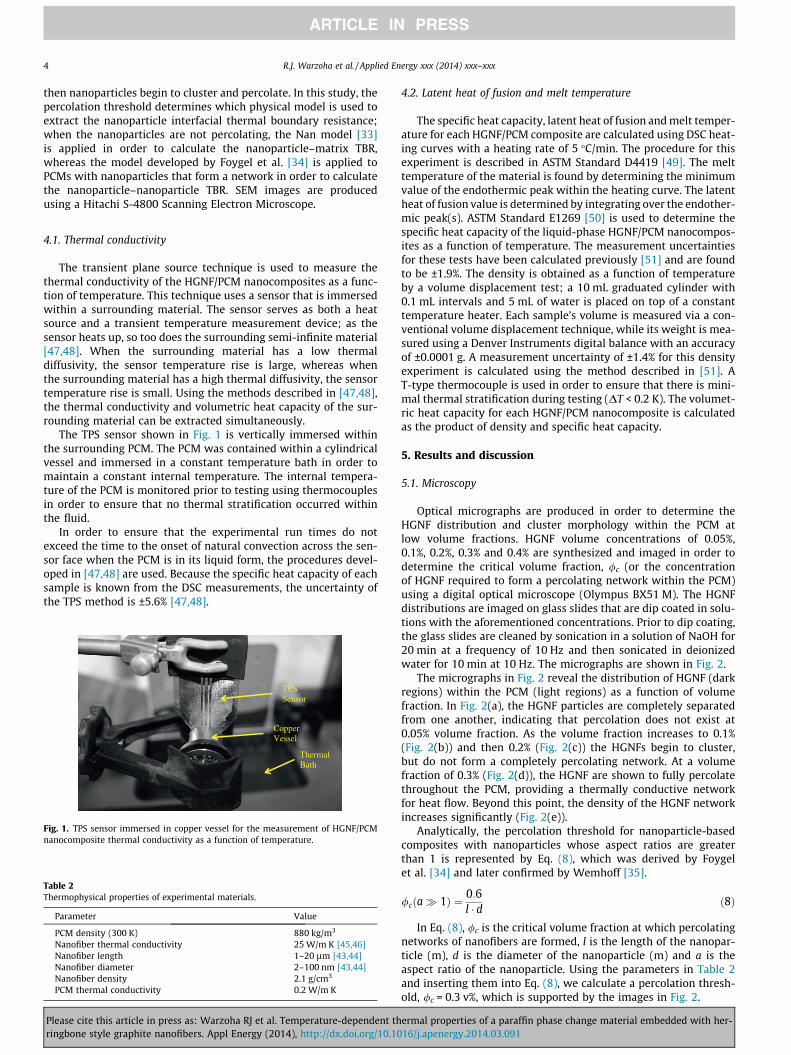
The nanocomposite PCMs used in this study were preparedusing a two-step method as described in Chintakrinda et al. [42].The herringbone graphite nanofibers were prepared in house; theprocedure for HGNF preparation is also described in Chintakrindaet al. [42]. In order to disperse the nanoparticles within the PCM,it was melted to a temperature of 353 K using a constant temper-ature hot plate. A sonicator was then used to disperse the nanopar-ticles within the PCM, which was set at 32 Hz and left to run for2 h. The nanoenhanced PCM was then poured into a cylindricalcopper vessel (see Fig. 1) and allowed to solidify. NanocompositePCMs with 0.05%, 0.1%, 0.2%, 0.3%, 0.4%, 2.8%, 5.8%, 8.5% and11.4% volume fraction of HGNF were prepared.
The thermophysical properties of all of the pertinent materialsused in this study are listed in Table 2. The nanofiber diameterand length listed in Table 2 were obtained in previous studies[43,44].
In order to solve for TBR, the physical properties for thematerials of interest in this study (i.e. the values in Table 2) aresubstituted into the physical models (Eqs. (4) and (5)) in Table 1.
4. Experimental methods
Two separate experiments are used to obtain the thermophysi-cal properties of the nanoenhanced PCMs. The first uses the tran-sient plane source (TPS) technique to determine the thermalconductivity of the HGNF/PCM nanocomposites. In the second setof experiments, the volumetric heat capacity, latent heat of fusionand melt temperatures of the HGNF/PCM nanocomposite aredetermined using a Differential Scanning Calorimeter (DSC, TAQ200). Finally, density is measured using a simple volume dis-placement technique and is applied in the calculation of the tem-perature-dependent thermal diffusivity. Optical and SEM imagingstudies are conducted in order to qualitatively determine when
ermal properties of a paraffin phase change material embedded with her-16/j.apenergy.2014.03.091
4 R.J. Warzoha et al. / Applied Energy xxx (2014) xxx–xxx
then nanoparticles begin to cluster and percolate. In this study, thepercolation threshold determines which physical model is used toextract the nanoparticle interfacial thermal boundary resistance;when the nanoparticles are not percolating, the Nan model [33]is applied in order to calculate the nanoparticle–matrix TBR,whereas the model developed by Foygel et al. [34] is applied toPCMs with nanoparticles that form a network in order to calculatethe nanoparticle–nanoparticle TBR. SEM images are producedusing a Hitachi S-4800 Scanning Electron Microscope.
4.1. Thermal conductivity
The transient plane source technique is used to measure thethermal conductivity of the HGNF/PCM nanocomposites as a func-tion of temperature. This technique uses a sensor that is immersedwithin a surrounding material. The sensor serves as both a heatsource and a transient temperature measurement device; as thesensor heats up, so too does the surrounding semi-infinite material[47,48]. When the surrounding material has a low thermaldiffusivity, the sensor temperature rise is large, whereas whenthe surrounding material has a high thermal diffusivity, the sensortemperature rise is small. Using the methods described in [47,48],the thermal conductivity and volumetric heat capacity of the sur-rounding material can be extracted simultaneously.
The TPS sensor shown in Fig. 1 is vertically immersed withinthe surrounding PCM. The PCM was contained within a cylindricalvessel and immersed in a constant temperature bath in order tomaintain a constant internal temperature. The internal tempera-ture of the PCM is monitored prior to testing using thermocouplesin order to ensure that no thermal stratification occurred withinthe fluid.
In order to ensure that the experimental run times do notexceed the time to the onset of natural convection across the sen-sor face when the PCM is in its liquid form, the procedures devel-oped in [47,48] are used. Because the specific heat capacity of eachsample is known from the DSC measurements, the uncertainty ofthe TPS method is ±5.6% [47,48].
Table 2Thermophysical properties of experimental materials.
Parameter Value
PCM density (300 K) 880 kg/m3
Nanofiber thermal conductivity 25 W/m K [45,46]Nanofiber length 1–20 lm [43,44]Nanofiber diameter 2–100 nm [43,44]Nanofiber density 2.1 g/cm3
PCM thermal conductivity 0.2 W/m K
TPSSensor
Copper Vessel
Thermal Bath
Fig. 1. TPS sensor immersed in copper vessel for the measurement of HGNF/PCMnanocomposite thermal conductivity as a function of temperature.
Please cite this article in press as: Warzoha RJ et al. Temperature-dependent thringbone style graphite nanofibers. Appl Energy (2014), http://dx.doi.org/10.10
4.2. Latent heat of fusion and melt temperature
The specific heat capacity, latent heat of fusion and melt temper-ature for each HGNF/PCM composite are calculated using DSC heat-ing curves with a heating rate of 5 �C/min. The procedure for thisexperiment is described in ASTM Standard D4419 [49]. The melttemperature of the material is found by determining the minimumvalue of the endothermic peak within the heating curve. The latentheat of fusion value is determined by integrating over the endother-mic peak(s). ASTM Standard E1269 [50] is used to determine thespecific heat capacity of the liquid-phase HGNF/PCM nanocompos-ites as a function of temperature. The measurement uncertaintiesfor these tests have been calculated previously [51] and are foundto be ±1.9%. The density is obtained as a function of temperatureby a volume displacement test; a 10 mL graduated cylinder with0.1 mL intervals and 5 mL of water is placed on top of a constanttemperature heater. Each sample’s volume is measured via a con-ventional volume displacement technique, while its weight is mea-sured using a Denver Instruments digital balance with an accuracyof ±0.0001 g. A measurement uncertainty of ±1.4% for this densityexperiment is calculated using the method described in [51]. AT-type thermocouple is used in order to ensure that there is mini-mal thermal stratification during testing (DT < 0.2 K). The volumet-ric heat capacity for each HGNF/PCM nanocomposite is calculatedas the product of density and specific heat capacity.
5. Results and discussion
5.1. Microscopy
Optical micrographs are produced in order to determine theHGNF distribution and cluster morphology within the PCM atlow volume fractions. HGNF volume concentrations of 0.05%,0.1%, 0.2%, 0.3% and 0.4% are synthesized and imaged in order todetermine the critical volume fraction, /c (or the concentrationof HGNF required to form a percolating network within the PCM)using a digital optical microscope (Olympus BX51 M). The HGNFdistributions are imaged on glass slides that are dip coated in solu-tions with the aforementioned concentrations. Prior to dip coating,the glass slides are cleaned by sonication in a solution of NaOH for20 min at a frequency of 10 Hz and then sonicated in deionizedwater for 10 min at 10 Hz. The micrographs are shown in Fig. 2.
The micrographs in Fig. 2 reveal the distribution of HGNF (darkregions) within the PCM (light regions) as a function of volumefraction. In Fig. 2(a), the HGNF particles are completely separatedfrom one another, indicating that percolation does not exist at0.05% volume fraction. As the volume fraction increases to 0.1%(Fig. 2(b)) and then 0.2% (Fig. 2(c)) the HGNFs begin to cluster,but do not form a completely percolating network. At a volumefraction of 0.3% (Fig. 2(d)), the HGNF are shown to fully percolatethroughout the PCM, providing a thermally conductive networkfor heat flow. Beyond this point, the density of the HGNF networkincreases significantly (Fig. 2(e)).
Analytically, the percolation threshold for nanoparticle-basedcomposites with nanoparticles whose aspect ratios are greaterthan 1 is represented by Eq. (8), which was derived by Foygelet al. [34] and later confirmed by Wemhoff [35].
/cða� 1Þ ¼ 0:6l � d ð8Þ
In Eq. (8), /c is the critical volume fraction at which percolatingnetworks of nanofibers are formed, l is the length of the nanopar-ticle (m), d is the diameter of the nanoparticle (m) and a is theaspect ratio of the nanoparticle. Using the parameters in Table 2and inserting them into Eq. (8), we calculate a percolation thresh-old, /c = 0.3 v%, which is supported by the images in Fig. 2.
ermal properties of a paraffin phase change material embedded with her-16/j.apenergy.2014.03.091
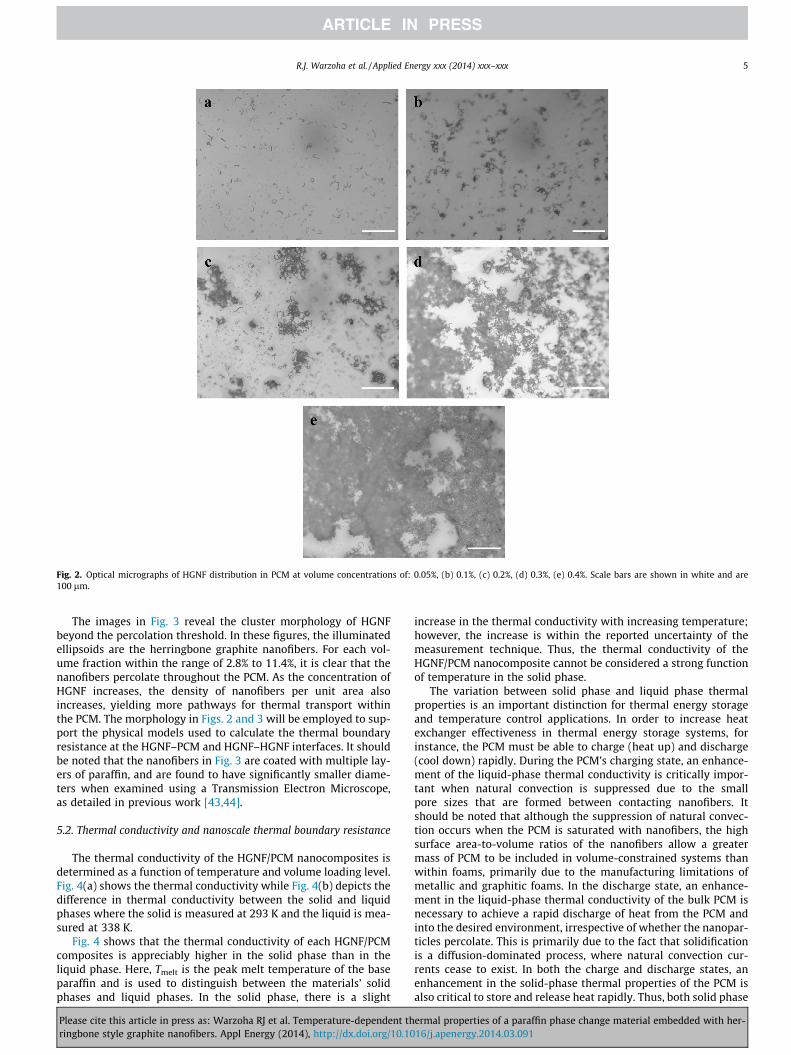
Fig. 2. Optical micrographs of HGNF distribution in PCM at volume concentrations of: 0.05%, (b) 0.1%, (c) 0.2%, (d) 0.3%, (e) 0.4%. Scale bars are shown in white and are100 lm.
R.J. Warzoha et al. / Applied Energy xxx (2014) xxx–xxx 5
The images in Fig. 3 reveal the cluster morphology of HGNFbeyond the percolation threshold. In these figures, the illuminatedellipsoids are the herringbone graphite nanofibers. For each vol-ume fraction within the range of 2.8% to 11.4%, it is clear that thenanofibers percolate throughout the PCM. As the concentration ofHGNF increases, the density of nanofibers per unit area alsoincreases, yielding more pathways for thermal transport withinthe PCM. The morphology in Figs. 2 and 3 will be employed to sup-port the physical models used to calculate the thermal boundaryresistance at the HGNF–PCM and HGNF–HGNF interfaces. It shouldbe noted that the nanofibers in Fig. 3 are coated with multiple lay-ers of paraffin, and are found to have significantly smaller diame-ters when examined using a Transmission Electron Microscope,as detailed in previous work [43,44].
5.2. Thermal conductivity and nanoscale thermal boundary resistance
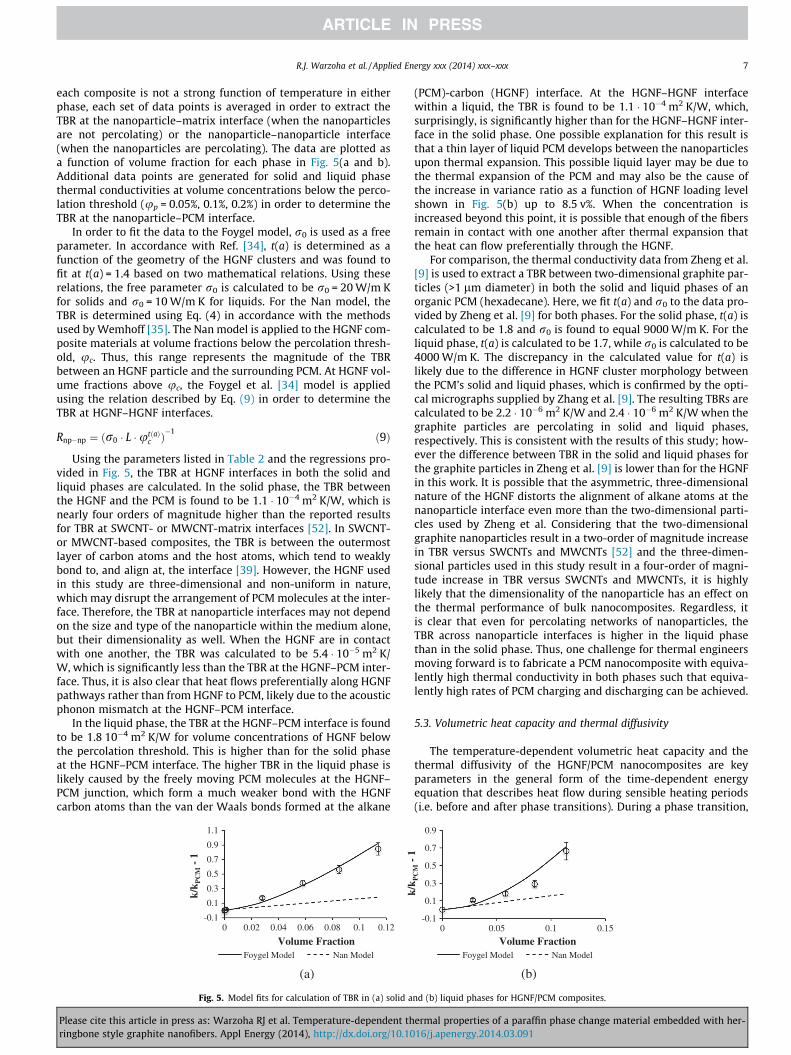
The thermal conductivity of the HGNF/PCM nanocomposites isdetermined as a function of temperature and volume loading level.Fig. 4(a) shows the thermal conductivity while Fig. 4(b) depicts thedifference in thermal conductivity between the solid and liquidphases where the solid is measured at 293 K and the liquid is mea-sured at 338 K.
Fig. 4 shows that the thermal conductivity of each HGNF/PCMcomposites is appreciably higher in the solid phase than in theliquid phase. Here, Tmelt is the peak melt temperature of the baseparaffin and is used to distinguish between the materials’ solidphases and liquid phases. In the solid phase, there is a slight
Please cite this article in press as: Warzoha RJ et al. Temperature-dependent thringbone style graphite nanofibers. Appl Energy (2014), http://dx.doi.org/10.10
increase in the thermal conductivity with increasing temperature;however, the increase is within the reported uncertainty of themeasurement technique. Thus, the thermal conductivity of theHGNF/PCM nanocomposite cannot be considered a strong functionof temperature in the solid phase.
The variation between solid phase and liquid phase thermalproperties is an important distinction for thermal energy storageand temperature control applications. In order to increase heatexchanger effectiveness in thermal energy storage systems, forinstance, the PCM must be able to charge (heat up) and discharge(cool down) rapidly. During the PCM’s charging state, an enhance-ment of the liquid-phase thermal conductivity is critically impor-tant when natural convection is suppressed due to the smallpore sizes that are formed between contacting nanofibers. Itshould be noted that although the suppression of natural convec-tion occurs when the PCM is saturated with nanofibers, the highsurface area-to-volume ratios of the nanofibers allow a greatermass of PCM to be included in volume-constrained systems thanwithin foams, primarily due to the manufacturing limitations ofmetallic and graphitic foams. In the discharge state, an enhance-ment in the liquid-phase thermal conductivity of the bulk PCM isnecessary to achieve a rapid discharge of heat from the PCM andinto the desired environment, irrespective of whether the nanopar-ticles percolate. This is primarily due to the fact that solidificationis a diffusion-dominated process, where natural convection cur-rents cease to exist. In both the charge and discharge states, anenhancement in the solid-phase thermal properties of the PCM isalso critical to store and release heat rapidly. Thus, both solid phase
ermal properties of a paraffin phase change material embedded with her-16/j.apenergy.2014.03.091
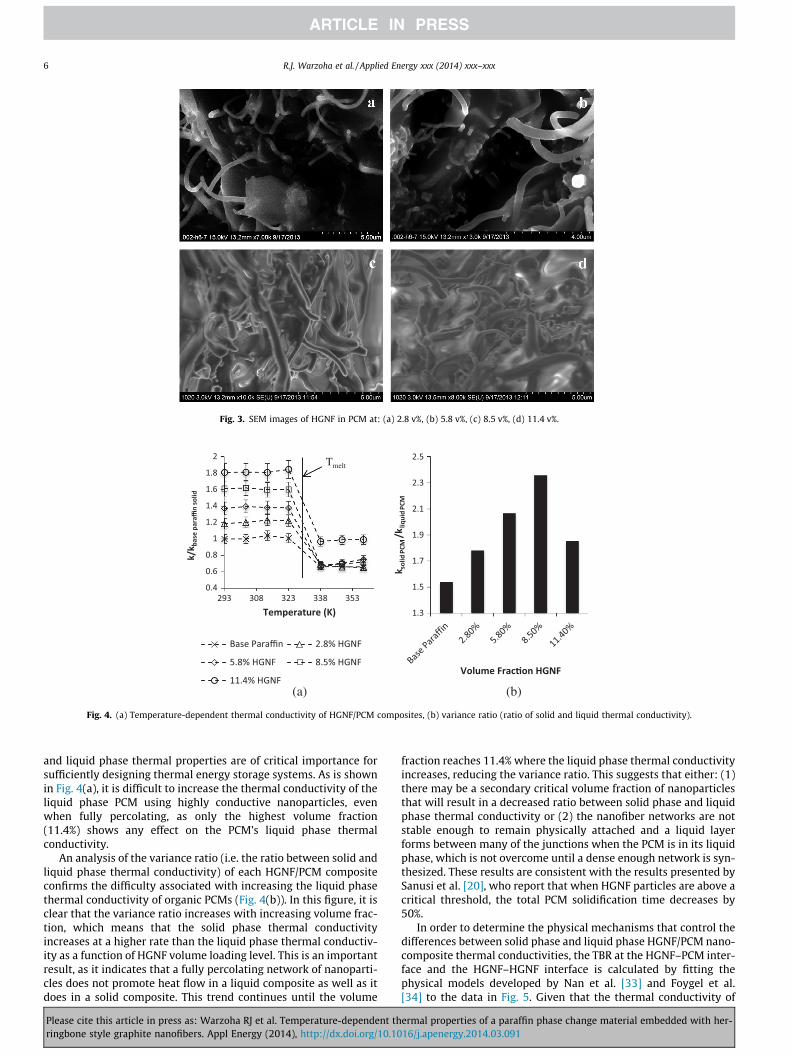
Fig. 3. SEM images of HGNF in PCM at: (a) 2.8 v%, (b) 5.8 v%, (c) 8.5 v%, (d) 11.4 v%.
Fig. 4. (a) Temperature-dependent thermal conductivity of HGNF/PCM composites, (b) variance ratio (ratio of solid and liquid thermal conductivity).
6 R.J. Warzoha et al. / Applied Energy xxx (2014) xxx–xxx
and liquid phase thermal properties are of critical importance forsufficiently designing thermal energy storage systems. As is shownin Fig. 4(a), it is difficult to increase the thermal conductivity of theliquid phase PCM using highly conductive nanoparticles, evenwhen fully percolating, as only the highest volume fraction(11.4%) shows any effect on the PCM’s liquid phase thermalconductivity.
An analysis of the variance ratio (i.e. the ratio between solid andliquid phase thermal conductivity) of each HGNF/PCM compositeconfirms the difficulty associated with increasing the liquid phasethermal conductivity of organic PCMs (Fig. 4(b)). In this figure, it isclear that the variance ratio increases with increasing volume frac-tion, which means that the solid phase thermal conductivityincreases at a higher rate than the liquid phase thermal conductiv-ity as a function of HGNF volume loading level. This is an importantresult, as it indicates that a fully percolating network of nanoparti-cles does not promote heat flow in a liquid composite as well as itdoes in a solid composite. This trend continues until the volume
Please cite this article in press as: Warzoha RJ et al. Temperature-dependent thringbone style graphite nanofibers. Appl Energy (2014), http://dx.doi.org/10.10
fraction reaches 11.4% where the liquid phase thermal conductivityincreases, reducing the variance ratio. This suggests that either: (1)there may be a secondary critical volume fraction of nanoparticlesthat will result in a decreased ratio between solid phase and liquidphase thermal conductivity or (2) the nanofiber networks are notstable enough to remain physically attached and a liquid layerforms between many of the junctions when the PCM is in its liquidphase, which is not overcome until a dense enough network is syn-thesized. These results are consistent with the results presented bySanusi et al. [20], who report that when HGNF particles are above acritical threshold, the total PCM solidification time decreases by50%.
In order to determine the physical mechanisms that control thedifferences between solid phase and liquid phase HGNF/PCM nano-composite thermal conductivities, the TBR at the HGNF–PCM inter-face and the HGNF–HGNF interface is calculated by fitting thephysical models developed by Nan et al. [33] and Foygel et al.[34] to the data in Fig. 5. Given that the thermal conductivity of
ermal properties of a paraffin phase change material embedded with her-16/j.apenergy.2014.03.091
R.J. Warzoha et al. / Applied Energy xxx (2014) xxx–xxx 7
each composite is not a strong function of temperature in eitherphase, each set of data points is averaged in order to extract theTBR at the nanoparticle–matrix interface (when the nanoparticlesare not percolating) or the nanoparticle–nanoparticle interface(when the nanoparticles are percolating). The data are plotted asa function of volume fraction for each phase in Fig. 5(a and b).Additional data points are generated for solid and liquid phasethermal conductivities at volume concentrations below the perco-lation threshold (up = 0.05%, 0.1%, 0.2%) in order to determine theTBR at the nanoparticle–PCM interface.
In order to fit the data to the Foygel model, r0 is used as a freeparameter. In accordance with Ref. [34], t(a) is determined as afunction of the geometry of the HGNF clusters and was found tofit at t(a) = 1.4 based on two mathematical relations. Using theserelations, the free parameter r0 is calculated to be r0 = 20 W/m Kfor solids and r0 = 10 W/m K for liquids. For the Nan model, theTBR is determined using Eq. (4) in accordance with the methodsused by Wemhoff [35]. The Nan model is applied to the HGNF com-posite materials at volume fractions below the percolation thresh-old, uc. Thus, this range represents the magnitude of the TBRbetween an HGNF particle and the surrounding PCM. At HGNF vol-ume fractions above uc, the Foygel et al. [34] model is appliedusing the relation described by Eq. (9) in order to determine theTBR at HGNF–HGNF interfaces.
Rnp�np ¼ ðr0 � L �utðaÞc Þ
�1 ð9Þ
Using the parameters listed in Table 2 and the regressions pro-vided in Fig. 5, the TBR at HGNF interfaces in both the solid andliquid phases are calculated. In the solid phase, the TBR betweenthe HGNF and the PCM is found to be 1.1 � 10�4 m2 K/W, which isnearly four orders of magnitude higher than the reported resultsfor TBR at SWCNT- or MWCNT-matrix interfaces [52]. In SWCNT-or MWCNT-based composites, the TBR is between the outermostlayer of carbon atoms and the host atoms, which tend to weaklybond to, and align at, the interface [39]. However, the HGNF usedin this study are three-dimensional and non-uniform in nature,which may disrupt the arrangement of PCM molecules at the inter-face. Therefore, the TBR at nanoparticle interfaces may not dependon the size and type of the nanoparticle within the medium alone,but their dimensionality as well. When the HGNF are in contactwith one another, the TBR was calculated to be 5.4 � 10�5 m2 K/W, which is significantly less than the TBR at the HGNF–PCM inter-face. Thus, it is also clear that heat flows preferentially along HGNFpathways rather than from HGNF to PCM, likely due to the acousticphonon mismatch at the HGNF–PCM interface.
In the liquid phase, the TBR at the HGNF–PCM interface is foundto be 1.8 10�4 m2 K/W for volume concentrations of HGNF belowthe percolation threshold. This is higher than for the solid phaseat the HGNF–PCM interface. The higher TBR in the liquid phase islikely caused by the freely moving PCM molecules at the HGNF–PCM junction, which form a much weaker bond with the HGNFcarbon atoms than the van der Waals bonds formed at the alkane
(a)
-0.1
0.1
0.3
0.5
0.7
0.9
1.1
0 0.02 0.04 0.06 0.08 0.1 0.12
k/k P
CM
- 1
Volume FractionFoygel Model Nan Model
Fig. 5. Model fits for calculation of TBR in (a) solid a
Please cite this article in press as: Warzoha RJ et al. Temperature-dependent thringbone style graphite nanofibers. Appl Energy (2014), http://dx.doi.org/10.10
(PCM)-carbon (HGNF) interface. At the HGNF–HGNF interfacewithin a liquid, the TBR is found to be 1.1 � 10�4 m2 K/W, which,surprisingly, is significantly higher than for the HGNF–HGNF inter-face in the solid phase. One possible explanation for this result isthat a thin layer of liquid PCM develops between the nanoparticlesupon thermal expansion. This possible liquid layer may be due tothe thermal expansion of the PCM and may also be the cause ofthe increase in variance ratio as a function of HGNF loading levelshown in Fig. 5(b) up to 8.5 v%. When the concentration isincreased beyond this point, it is possible that enough of the fibersremain in contact with one another after thermal expansion thatthe heat can flow preferentially through the HGNF.
For comparison, the thermal conductivity data from Zheng et al.[9] is used to extract a TBR between two-dimensional graphite par-ticles (>1 lm diameter) in both the solid and liquid phases of anorganic PCM (hexadecane). Here, we fit t(a) and r0 to the data pro-vided by Zheng et al. [9] for both phases. For the solid phase, t(a) iscalculated to be 1.8 and r0 is found to equal 9000 W/m K. For theliquid phase, t(a) is calculated to be 1.7, while r0 is calculated to be4000 W/m K. The discrepancy in the calculated value for t(a) islikely due to the difference in HGNF cluster morphology betweenthe PCM’s solid and liquid phases, which is confirmed by the opti-cal micrographs supplied by Zhang et al. [9]. The resulting TBRs arecalculated to be 2.2 � 10�6 m2 K/W and 2.4 � 10�6 m2 K/W when thegraphite particles are percolating in solid and liquid phases,respectively. This is consistent with the results of this study; how-ever the difference between TBR in the solid and liquid phases forthe graphite particles in Zheng et al. [9] is lower than for the HGNFin this work. It is possible that the asymmetric, three-dimensionalnature of the HGNF distorts the alignment of alkane atoms at thenanoparticle interface even more than the two-dimensional parti-cles used by Zheng et al. Considering that the two-dimensionalgraphite nanoparticles result in a two-order of magnitude increasein TBR versus SWCNTs and MWCNTs [52] and the three-dimen-sional particles used in this study result in a four-order of magni-tude increase in TBR versus SWCNTs and MWCNTs, it is highlylikely that the dimensionality of the nanoparticle has an effect onthe thermal performance of bulk nanocomposites. Regardless, itis clear that even for percolating networks of nanoparticles, theTBR across nanoparticle interfaces is higher in the liquid phasethan in the solid phase. Thus, one challenge for thermal engineersmoving forward is to fabricate a PCM nanocomposite with equiva-lently high thermal conductivity in both phases such that equiva-lently high rates of PCM charging and discharging can be achieved.
5.3. Volumetric heat capacity and thermal diffusivity
The temperature-dependent volumetric heat capacity and thethermal diffusivity of the HGNF/PCM nanocomposites are keyparameters in the general form of the time-dependent energyequation that describes heat flow during sensible heating periods(i.e. before and after phase transitions). During a phase transition,
(b)
-0.1
0.1
0.3
0.5
0.7
0.9
0 0.05 0.1 0.15
k/k P
CM
- 1
Volume FractionFoygel Model Nan Model
nd (b) liquid phases for HGNF/PCM composites.
ermal properties of a paraffin phase change material embedded with her-16/j.apenergy.2014.03.091
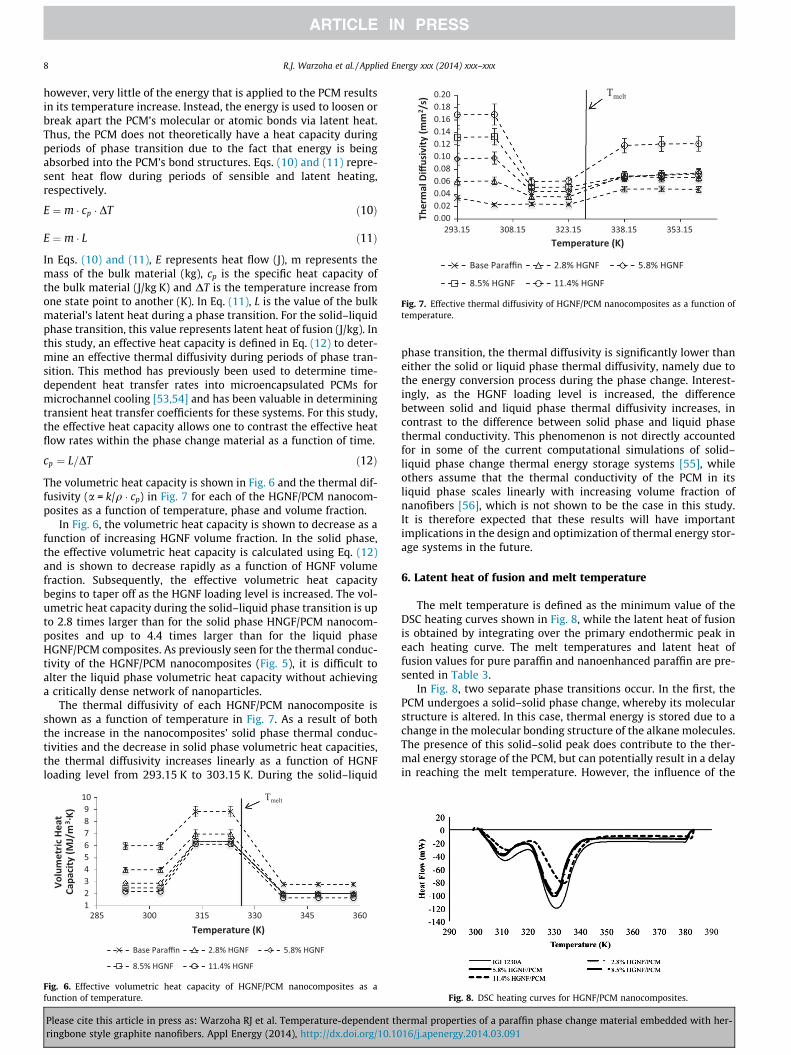
Fig. 7. Effective thermal diffusivity of HGNF/PCM nanocomposites as a function oftemperature.
8 R.J. Warzoha et al. / Applied Energy xxx (2014) xxx–xxx
however, very little of the energy that is applied to the PCM resultsin its temperature increase. Instead, the energy is used to loosen orbreak apart the PCM’s molecular or atomic bonds via latent heat.Thus, the PCM does not theoretically have a heat capacity duringperiods of phase transition due to the fact that energy is beingabsorbed into the PCM’s bond structures. Eqs. (10) and (11) repre-sent heat flow during periods of sensible and latent heating,respectively.
E ¼ m � cp � DT ð10Þ
E ¼ m � L ð11Þ
In Eqs. (10) and (11), E represents heat flow (J), m represents themass of the bulk material (kg), cp is the specific heat capacity ofthe bulk material (J/kg K) and DT is the temperature increase fromone state point to another (K). In Eq. (11), L is the value of the bulkmaterial’s latent heat during a phase transition. For the solid–liquidphase transition, this value represents latent heat of fusion (J/kg). Inthis study, an effective heat capacity is defined in Eq. (12) to deter-mine an effective thermal diffusivity during periods of phase tran-sition. This method has previously been used to determine time-dependent heat transfer rates into microencapsulated PCMs formicrochannel cooling [53,54] and has been valuable in determiningtransient heat transfer coefficients for these systems. For this study,the effective heat capacity allows one to contrast the effective heatflow rates within the phase change material as a function of time.
cp ¼ L=DT ð12Þ
The volumetric heat capacity is shown in Fig. 6 and the thermal dif-fusivity (a = k/q � cp) in Fig. 7 for each of the HGNF/PCM nanocom-posites as a function of temperature, phase and volume fraction.
In Fig. 6, the volumetric heat capacity is shown to decrease as afunction of increasing HGNF volume fraction. In the solid phase,the effective volumetric heat capacity is calculated using Eq. (12)and is shown to decrease rapidly as a function of HGNF volumefraction. Subsequently, the effective volumetric heat capacitybegins to taper off as the HGNF loading level is increased. The vol-umetric heat capacity during the solid–liquid phase transition is upto 2.8 times larger than for the solid phase HNGF/PCM nanocom-posites and up to 4.4 times larger than for the liquid phaseHGNF/PCM composites. As previously seen for the thermal conduc-tivity of the HGNF/PCM nanocomposites (Fig. 5), it is difficult toalter the liquid phase volumetric heat capacity without achievinga critically dense network of nanoparticles.
The thermal diffusivity of each HGNF/PCM nanocomposite isshown as a function of temperature in Fig. 7. As a result of boththe increase in the nanocomposites’ solid phase thermal conduc-tivities and the decrease in solid phase volumetric heat capacities,the thermal diffusivity increases linearly as a function of HGNFloading level from 293.15 K to 303.15 K. During the solid–liquid
Fig. 6. Effective volumetric heat capacity of HGNF/PCM nanocomposites as afunction of temperature.
Please cite this article in press as: Warzoha RJ et al. Temperature-dependent thringbone style graphite nanofibers. Appl Energy (2014), http://dx.doi.org/10.10
phase transition, the thermal diffusivity is significantly lower thaneither the solid or liquid phase thermal diffusivity, namely due tothe energy conversion process during the phase change. Interest-ingly, as the HGNF loading level is increased, the differencebetween solid and liquid phase thermal diffusivity increases, incontrast to the difference between solid phase and liquid phasethermal conductivity. This phenomenon is not directly accountedfor in some of the current computational simulations of solid–liquid phase change thermal energy storage systems [55], whileothers assume that the thermal conductivity of the PCM in itsliquid phase scales linearly with increasing volume fraction ofnanofibers [56], which is not shown to be the case in this study.It is therefore expected that these results will have importantimplications in the design and optimization of thermal energy stor-age systems in the future.
6. Latent heat of fusion and melt temperature
The melt temperature is defined as the minimum value of theDSC heating curves shown in Fig. 8, while the latent heat of fusionis obtained by integrating over the primary endothermic peak ineach heating curve. The melt temperatures and latent heat offusion values for pure paraffin and nanoenhanced paraffin are pre-sented in Table 3.
In Fig. 8, two separate phase transitions occur. In the first, thePCM undergoes a solid–solid phase change, whereby its molecularstructure is altered. In this case, thermal energy is stored due to achange in the molecular bonding structure of the alkane molecules.The presence of this solid–solid peak does contribute to the ther-mal energy storage of the PCM, but can potentially result in a delayin reaching the melt temperature. However, the influence of the
Fig. 8. DSC heating curves for HGNF/PCM nanocomposites.
ermal properties of a paraffin phase change material embedded with her-16/j.apenergy.2014.03.091
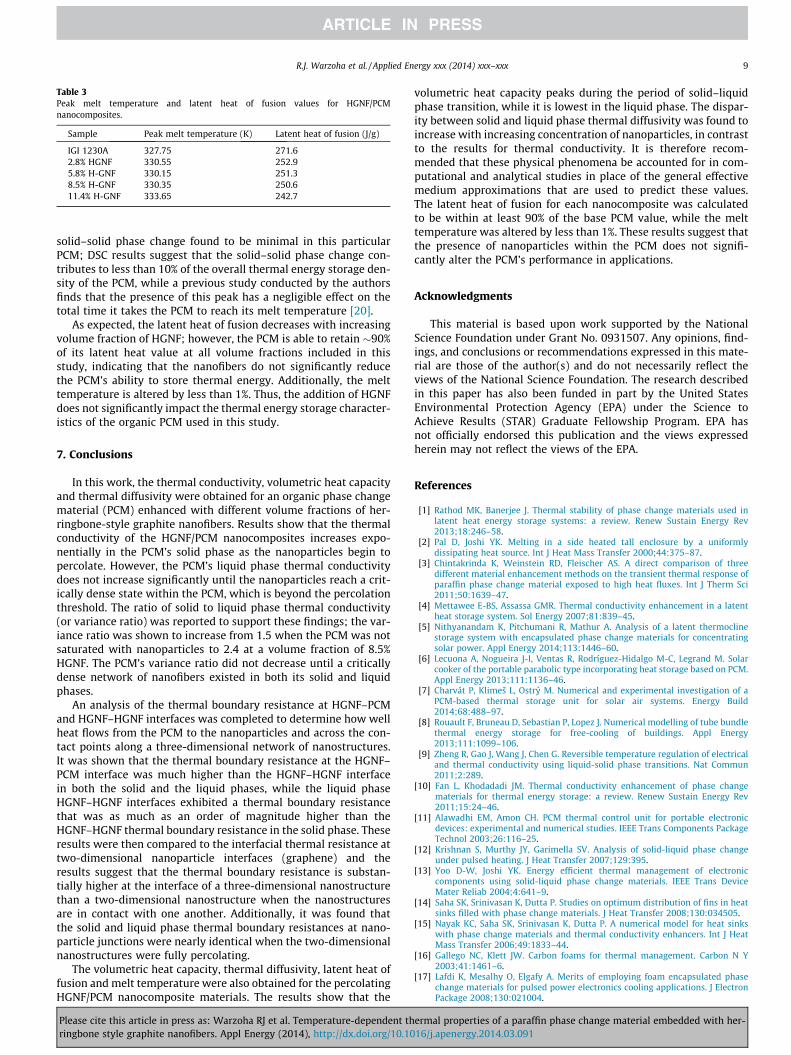
Table 3Peak melt temperature and latent heat of fusion values for HGNF/PCMnanocomposites.
Sample Peak melt temperature (K) Latent heat of fusion (J/g)
IGI 1230A 327.75 271.62.8% HGNF 330.55 252.95.8% H-GNF 330.15 251.38.5% H-GNF 330.35 250.611.4% H-GNF 333.65 242.7
R.J. Warzoha et al. / Applied Energy xxx (2014) xxx–xxx 9
solid–solid phase change found to be minimal in this particularPCM; DSC results suggest that the solid–solid phase change con-tributes to less than 10% of the overall thermal energy storage den-sity of the PCM, while a previous study conducted by the authorsfinds that the presence of this peak has a negligible effect on thetotal time it takes the PCM to reach its melt temperature [20].
As expected, the latent heat of fusion decreases with increasingvolume fraction of HGNF; however, the PCM is able to retain �90%of its latent heat value at all volume fractions included in thisstudy, indicating that the nanofibers do not significantly reducethe PCM’s ability to store thermal energy. Additionally, the melttemperature is altered by less than 1%. Thus, the addition of HGNFdoes not significantly impact the thermal energy storage character-istics of the organic PCM used in this study.
7. Conclusions
In this work, the thermal conductivity, volumetric heat capacityand thermal diffusivity were obtained for an organic phase changematerial (PCM) enhanced with different volume fractions of her-ringbone-style graphite nanofibers. Results show that the thermalconductivity of the HGNF/PCM nanocomposites increases expo-nentially in the PCM’s solid phase as the nanoparticles begin topercolate. However, the PCM’s liquid phase thermal conductivitydoes not increase significantly until the nanoparticles reach a crit-ically dense state within the PCM, which is beyond the percolationthreshold. The ratio of solid to liquid phase thermal conductivity(or variance ratio) was reported to support these findings; the var-iance ratio was shown to increase from 1.5 when the PCM was notsaturated with nanoparticles to 2.4 at a volume fraction of 8.5%HGNF. The PCM’s variance ratio did not decrease until a criticallydense network of nanofibers existed in both its solid and liquidphases.
An analysis of the thermal boundary resistance at HGNF–PCMand HGNF–HGNF interfaces was completed to determine how wellheat flows from the PCM to the nanoparticles and across the con-tact points along a three-dimensional network of nanostructures.It was shown that the thermal boundary resistance at the HGNF–PCM interface was much higher than the HGNF–HGNF interfacein both the solid and the liquid phases, while the liquid phaseHGNF–HGNF interfaces exhibited a thermal boundary resistancethat was as much as an order of magnitude higher than theHGNF–HGNF thermal boundary resistance in the solid phase. Theseresults were then compared to the interfacial thermal resistance attwo-dimensional nanoparticle interfaces (graphene) and theresults suggest that the thermal boundary resistance is substan-tially higher at the interface of a three-dimensional nanostructurethan a two-dimensional nanostructure when the nanostructuresare in contact with one another. Additionally, it was found thatthe solid and liquid phase thermal boundary resistances at nano-particle junctions were nearly identical when the two-dimensionalnanostructures were fully percolating.
The volumetric heat capacity, thermal diffusivity, latent heat offusion and melt temperature were also obtained for the percolatingHGNF/PCM nanocomposite materials. The results show that the
Please cite this article in press as: Warzoha RJ et al. Temperature-dependent thringbone style graphite nanofibers. Appl Energy (2014), http://dx.doi.org/10.10
volumetric heat capacity peaks during the period of solid–liquidphase transition, while it is lowest in the liquid phase. The dispar-ity between solid and liquid phase thermal diffusivity was found toincrease with increasing concentration of nanoparticles, in contrastto the results for thermal conductivity. It is therefore recom-mended that these physical phenomena be accounted for in com-putational and analytical studies in place of the general effectivemedium approximations that are used to predict these values.The latent heat of fusion for each nanocomposite was calculatedto be within at least 90% of the base PCM value, while the melttemperature was altered by less than 1%. These results suggest thatthe presence of nanoparticles within the PCM does not signifi-cantly alter the PCM’s performance in applications.
Acknowledgments
This material is based upon work supported by the NationalScience Foundation under Grant No. 0931507. Any opinions, find-ings, and conclusions or recommendations expressed in this mate-rial are those of the author(s) and do not necessarily reflect theviews of the National Science Foundation. The research describedin this paper has also been funded in part by the United StatesEnvironmental Protection Agency (EPA) under the Science toAchieve Results (STAR) Graduate Fellowship Program. EPA hasnot officially endorsed this publication and the views expressedherein may not reflect the views of the EPA.
References
[1] Rathod MK, Banerjee J. Thermal stability of phase change materials used inlatent heat energy storage systems: a review. Renew Sustain Energy Rev2013;18:246–58.
[2] Pal D, Joshi YK. Melting in a side heated tall enclosure by a uniformlydissipating heat source. Int J Heat Mass Transfer 2000;44:375–87.
[3] Chintakrinda K, Weinstein RD, Fleischer AS. A direct comparison of threedifferent material enhancement methods on the transient thermal response ofparaffin phase change material exposed to high heat fluxes. Int J Therm Sci2011;50:1639–47.
[4] Mettawee E-BS, Assassa GMR. Thermal conductivity enhancement in a latentheat storage system. Sol Energy 2007;81:839–45.
[5] Nithyanandam K, Pitchumani R, Mathur A. Analysis of a latent thermoclinestorage system with encapsulated phase change materials for concentratingsolar power. Appl Energy 2014;113:1446–60.
[6] Lecuona A, Nogueira J-I, Ventas R, Rodríguez-Hidalgo M-C, Legrand M. Solarcooker of the portable parabolic type incorporating heat storage based on PCM.Appl Energy 2013;111:1136–46.
[7] Charvát P, Klimeš L, Ostry M. Numerical and experimental investigation of aPCM-based thermal storage unit for solar air systems. Energy Build2014;68:488–97.
[8] Rouault F, Bruneau D, Sebastian P, Lopez J. Numerical modelling of tube bundlethermal energy storage for free-cooling of buildings. Appl Energy2013;111:1099–106.
[9] Zheng R, Gao J, Wang J, Chen G. Reversible temperature regulation of electricaland thermal conductivity using liquid-solid phase transitions. Nat Commun2011;2:289.
[10] Fan L, Khodadadi JM. Thermal conductivity enhancement of phase changematerials for thermal energy storage: a review. Renew Sustain Energy Rev2011;15:24–46.
[11] Alawadhi EM, Amon CH. PCM thermal control unit for portable electronicdevices: experimental and numerical studies. IEEE Trans Components PackageTechnol 2003;26:116–25.
[12] Krishnan S, Murthy JY, Garimella SV. Analysis of solid-liquid phase changeunder pulsed heating. J Heat Transfer 2007;129:395.
[13] Yoo D-W, Joshi YK. Energy efficient thermal management of electroniccomponents using solid-liquid phase change materials. IEEE Trans DeviceMater Reliab 2004;4:641–9.
[14] Saha SK, Srinivasan K, Dutta P. Studies on optimum distribution of fins in heatsinks filled with phase change materials. J Heat Transfer 2008;130:034505.
[15] Nayak KC, Saha SK, Srinivasan K, Dutta P. A numerical model for heat sinkswith phase change materials and thermal conductivity enhancers. Int J HeatMass Transfer 2006;49:1833–44.
[16] Gallego NC, Klett JW. Carbon foams for thermal management. Carbon N Y2003;41:1461–6.
[17] Lafdi K, Mesalhy O, Elgafy A. Merits of employing foam encapsulated phasechange materials for pulsed power electronics cooling applications. J ElectronPackage 2008;130:021004.
ermal properties of a paraffin phase change material embedded with her-16/j.apenergy.2014.03.091
10 R.J. Warzoha et al. / Applied Energy xxx (2014) xxx–xxx
[18] Siahpush A, O’Brien J, Crepeau J. Phase change heat transfer enhancementusing copper porous foam. J Heat Transfer 2008;130:082301.
[19] Warzoha R, Sanusi O, McManus B, Fleischer AS. Development of methods tofully saturate carbon foam with paraffin wax phase change material for energystorage. J Sol Energy Eng 2012;135:021006.
[20] Sanusi O, Warzoha R, Fleischer AS. Energy storage and solidification of paraffinphase change material embedded with graphite nanofibers. Int J Heat MassTransfer 2011;54:4429–36.
[21] Salunkhe PB, Shembekar PS. A review on effect of phase change materialencapsulation on the thermal performance of a system. Renew Sustain EnergyRev 2012;16:5603–16.
[22] Gao JW, Zheng RT, Ohtani H, Zhu DS, Chen G. Experimental investigation ofheat conduction mechanisms in nanofluids. Clue on clustering. Nano Lett2009;9:4128–32.
[23] Keblinski P, Phillpot S, Choi SU, Eastman J. Mechanisms of heat flow insuspensions of nano-sized particles (nanofluids). Int J Heat Mass Transfer2002;45:855–63.
[24] Fan J, Wang L. Review of heat conduction in nanofluids. J Heat Transfer2011;133:040801.
[25] Zhou T, Wang X, Mingyuan GU, Liu X. Study of the thermal conductionmechanism of nano-SiC/DGEBA/EMI-2,4 composites. Polymer (Guildf)2008;49:4666–72.
[26] Pradhan NR, Duan H, Liang J, Iannacchione GS. The specific heat and effectivethermal conductivity of composites containing single-wall and multi-wallcarbon nanotubes. Nanotechnology 2009;20:245705.
[27] Chai Guangyu, Chen Quanfang. Characterization study of the thermalconductivity of carbon nanotube copper nanocomposites. J Compos Mater2010;44:2863–73.
[28] Fukai J, Hamada Y, Morozumi Y, Miyatake O. Effect of carbon-fiber brushes onconductive heat transfer in phase change materials. Int J Heat Mass Transfer2002;45:4781–92.
[29] Yavari F, Fard HR, Pashayi K, Rafiee MA, Zamiri A, Yu Z, et al. Enhanced thermalconductivity in a nanostructured phase change composite due to lowconcentration graphene additives. J Phys Chem C 2011;115:8753–8.
[30] Pincemin S, Py X, Olives R, Christ M, Oettinger O. Elaboration of conductivethermal storage composites made of phase change materials and graphite forsolar plant. J Sol Energy Eng 2008;130:011005.
[31] Zeng JL, Cao Z, Yang DW, Sun LX, Zhang L. Thermal conductivity enhancementof Ag nanowires on an organic phase change material. J Therm Anal Calorim2009;101:385–9.
[32] Han Z, Fina A. Thermal conductivity of carbon nanotubes and their polymernanocomposites: a review. Prog Polym Sci 2011;36:914–44.
[33] Nan C-W, Birringer R, Clarke DR, Gleiter H. Effective thermal conductivity ofparticulate composites with interfacial thermal resistance. J Appl Phys1997;81:6692.
[34] Foygel M, Morris R, Anez D, French S, Sobolev V. Theoretical andcomputational studies of carbon nanotube composites and suspensions:electrical and thermal conductivity. Phys Rev B 2005;71:104201.
[35] Wemhoff AP. Thermal conductivity predictions of composites containingpercolated networks of uniform cylindrical inclusions. Int J Heat Mass Transfer2013;62:255–62.
[36] Yang J, Yang Y, Waltermire SW, Wu X, Zhang H, Gutu T, et al. Enhanced andswitchable nanoscale thermal conduction due to van der Waals interfaces. NatNanotechnol 2011;7:91–5.
[37] Prasher R. Acoustic mismatch model for thermal contact resistance of van derWaals contacts. Appl Phys Lett 2009;94:041905.
[38] Xu Z, Buehler MJ. Nanoengineering heat transfer performance at carbonnanotube interfaces. ACS Nano 2009;3:2767–75.
Please cite this article in press as: Warzoha RJ et al. Temperature-dependent thringbone style graphite nanofibers. Appl Energy (2014), http://dx.doi.org/10.10
[39] Babaei H, Keblinski P, Khodadadi JM. Thermal conductivity enhancement ofparaffins by increasing the alignment of molecules through adding CNT/graphene. Int J Heat Mass Transfer 2013;58:209–16.
[40] Babaei H, Keblinski P, Khodadadi JM. Improvement in thermal conductivity ofparaffin by adding high aspect-ratio carbon-based nano-fillers. Phys Lett A2013;377:1358–61.
[41] Babaei H, Keblinski P, Khodadadi JM. A proof for insignificant effect ofBrownian motion-induced micro-convection on thermal conductivity ofnanofluids by utilizing molecular dynamics simulations. J Appl Phys2013;113:084302.
[42] Chintakrinda K, Warzoha RJ, Weinstein RD, Fleischer AS. Quantification of theimpact of embedded graphite nanofibers on the transient thermal response ofparaffin phase change material exposed to high heat fluxes. J Heat Transfer2012;134:071901.
[43] Bessel CA, Laubernds K, Rodriguez NM, Baker RTK. Graphite nanofibers as anelectrode for fuel cell applications. J Phys Chem B 2001;105:1115–8.
[44] Rodriguez NM. A review of catalytically grown carbon nanofibers. J Mater Res2011;8:3233–50.
[45] Yu C, Saha S, Zhou J, Shi L, Cassell AM, Cruden BA, et al. Thermal contactresistance and thermal conductivity of a carbon nanofiber. J Heat Transfer2006;128:234.
[46] Khadem MH, Wemhoff AP. Thermal conductivity predictions of herringbonegraphite nanofibers using molecular dynamics simulations. J Chem Phys2013;138:084708.
[47] Warzoha RJ, Fleischer AS. Determining the thermal conductivity of liquidsusing the transient hot disk method. Part I: Establishing transient thermal-fluid constraints. Int J Heat Mass Transf 2014;71:779–89.
[48] Warzoha RJ, Fleischer AS. Determining the thermal conductivity of liquidsusing the transient hot disk method. Part II: Establishing an accurate andrepeatable experimental methodology. Int J Heat Mass Transfer2014;71:790–807.
[49] ASTM D4419-90(2010) Standard Test Method for Measurement of TransitionTemperatures of Petroleum Waxes by Differential Scanning Calorimetry (DSC).West Conshohocken, PA: 2010.
[50] ASTM E1269-11 Standard Test Method for Determining Specific Heat Capacityby Differential Scanning Calorimetry. West Conshohocken, PA: 2011.
[51] Warzoha RJ, Weigand R, Rao A, Fleischer AS. Experimental characterization ofthe thermal diffusivity of paraffin phase change material embedded withherringbone style graphite nanofibers. ASME Summer Heat Transf. Conf., RioGrande, PR: 2012. p. 307–15.
[52] Buongiorno J, Venerus DC, Prabhat N, Mckrell T, Townsend J, Christianson R,et al. A benchmark study on the thermal conductivity of nanofluids. J ApplPhys 2009;106:094312.
[53] Sabbah R, Farid MM, Al-Hallaj S. Micro-channel heat sink with slurry of waterwith micro-encapsulated phase change material: 3D-numerical study. ApplTherm Eng 2009;29:445–54.
[54] Kuravi S, Kota KM, Du J, Chow LC. Numerical investigation of flow and heattransfer performance of nano-encapsulated phase change material slurry inmicrochannels. J Heat Transfer 2009;131:062901.
[55] Seyf HR, Zhou Z, Ma HB, Zhang Y. Three dimensional numerical study of heat-transfer enhancement by nano-encapsulated phase change material slurry inmicrotube heat sinks with tangential impingement. Int J Heat Mass Transfer2013;56:561–73.
[56] Dhaidan NS, Khodadadi JM, Al-Hattab TA, Al-Mashat SM. Experimental andnumerical investigation of melting of NePCM inside an annular containerunder a constant heat flux including the effect of eccentricity. Int J Heat MassTransfer 2013;67:455–68.
ermal properties of a paraffin phase change material embedded with her-16/j.apenergy.2014.03.091
Related Documents