Temperature-dependent otolith growth in Norwegian spring-spawning herring (Clupea harengus L.) larvae Arild Folkvord, Arne Johannessen & Erlend Moksness Folkvord A, Johannessen A, Moksness E. 2004. Temperature-dependent otolith growth in Norwegian spring-spawning herring (Clupea harengus L.) larvae. Sarsia 89:297–310. SARSIA Norwegian spring-spawning herring larvae (Clupea harengus L.) were reared at different temperature combinations in the laboratory, and marked twice with a fluorescent dye, alizarin complexone, to estimate otolith growth and increment deposition rate. A daily increment deposition rate was confirmed in the sagittae of larvae reared at 12 °C from day 16 (first marking age), while the apparent rate of increment formation of larvae reared at 4 °C was clearly less than one per day. A reduction in rearing temperature from 12 to 8 °C between days 16 and 30 (second marking age), significantly affected sagitta growth during the inter-mark period compared with those reared at 12 °C throughout. Similar somatic growth rates were observed in both groups temporarily reared at 8 °C between markings (about 6% day 1 ), but the otolith growth rate was more than four times higher in the group originating from 12 °C compared with the one originating from 4 °C. The body size versus otolith size relationship was temperature dependent, and larvae originating from different temperature regimes could be distin- guished based on the differences in otolith growth pattern, but not based on differences in body size alone. The temperature-dependent otolith growth in herring larvae is expected to be of major impor- tance for the observed differences in otolith microstructure patterns of herring stocks from different environments and regions in the field. However, this may be difficult to document in situations when larvae have low otolith growth and clear increment patterns are not present. Arild Folkvord* & Arne Johannessen, Department of Biology, University of Bergen, NO-5020 Bergen, Norway. E-mail: [email protected]; [email protected] Erlend Moksness, Institute of Marine Research, Flødevigen Marine Research Station, NO-4817 His, Norway. E-mail: [email protected] *Corresponding author Keywords: Otolith microstructure; growth pattern; increment deposition rate; validation; back- calculation; herring; larvae. INTRODUCTION Otolith microstructure analysis is a powerful technique that can provide information about previous growth history and age in marine fish larvae (Folkvord & Mosegaard 2002; Mosegaard & al. 2002). The observed differences in otolith growth pattern can be used to characterize and identify offspring from different stocks (Moksness & Fossum 1991), and subunits within a stock (Stenevik & al. 1996). There is a need, however, to identify which factors are involved in generating stock differences in otolith microstructure. Knowledge about the growth of the otoliths at different and varying temperatures is likely to be important to enable accurate and precise predictions in this respect (Hoff and Fuiman 1995). Temperature is a key abiotic factor affecting growth in fishes (Brett 1979; Houde 1989; Jobling 1995), and systematic differences in ambient temper- ature are encountered between locations throughout the season. During the first year of life, herring (Clupea harengus L.) larvae occupying the upper 20 m of the water column along the Norwegian coast may experi- ence a range in the ambient temperature of up to 10 °C (Midttun 1975). Depending on their hatching location, Norwegian spring-spawning herring larvae can experi- ence an increase in ambient temperature of less than 0.5 °C up to 5 °C during the first 2 months from hatching as they drift northwards along the Norwegian coast (Midttun 1975; Stenevik & al. 1996). Ambient temperature has therefore been suggested to be a potential factor responsible for some of the observed differences in otolith microstructure in larval herring populations from different geographical areas along the Norwegian coast (Stenevik & al. 1996). When constructing growth trajectories of larvae from different locations it is important to keep in mind that back-calculation of previous size and growth rests on assumptions on the relationship between otolith size and DOI 10.1080/00364820410002532 # 2004 Taylor & Francis Published in collaboration with the University of Bergen and the Institute of Marine Research, Norway

Welcome message from author
This document is posted to help you gain knowledge. Please leave a comment to let me know what you think about it! Share it to your friends and learn new things together.
Transcript

Temperature-dependent otolith growth in Norwegian spring-spawning herring(Clupea harengus L.) larvae
Arild Folkvord, Arne Johannessen & Erlend Moksness
Folkvord A, Johannessen A, Moksness E. 2004. Temperature-dependent otolith growth in Norwegianspring-spawning herring (Clupea harengusL.) larvae.Sarsia89:297–310.
SARSIA
Norwegian spring-spawning herring larvae (Clupea harengusL.) were reared at different temperaturecombinations in the laboratory, and marked twice with a fluorescent dye, alizarin complexone, toestimate otolith growth and increment deposition rate. A daily increment deposition rate was confirmedin the sagittae of larvae reared at 12°C from day 16 (first marking age), while the apparent rate ofincrement formation of larvae reared at 4°C was clearly less than one per day. A reduction in rearingtemperature from 12 to 8°C between days 16 and 30 (second marking age), significantly affectedsagitta growth during the inter-mark period compared with those reared at 12°C throughout. Similarsomatic growth rates were observed in both groups temporarily reared at 8°C between markings (about6% day�1), but the otolith growth rate was more than four times higher in the group originating from12°C compared with the one originating from 4°C. The body size versus otolith size relationship wastemperature dependent, and larvae originating from different temperature regimes could be distin-guished based on the differences in otolith growth pattern, but not based on differences in body sizealone. The temperature-dependent otolith growth in herring larvae is expected to be of major impor-tance for the observed differences in otolith microstructure patterns of herring stocks from differentenvironments and regions in the field. However, this may be difficult to document in situations whenlarvae have low otolith growth and clear increment patterns are not present.
Arild Folkvord* & Arne Johannessen, Department of Biology, University of Bergen, NO-5020 Bergen,Norway.E-mail: [email protected]; [email protected] Moksness, Institute of Marine Research, Flødevigen Marine Research Station, NO-4817 His,Norway. E-mail: [email protected]*Corresponding author
Keywords: Otolith microstructure; growth pattern; increment deposition rate; validation; back-calculation; herring; larvae.
INTRODUCTION
Otolith microstructure analysis is a powerful techniquethat can provide information about previous growthhistory and age in marine fish larvae (Folkvord &Mosegaard 2002; Mosegaard & al. 2002). The observeddifferences in otolith growth pattern can be used tocharacterize and identify offspring from different stocks(Moksness & Fossum 1991), and subunits within a stock(Stenevik & al. 1996). There is a need, however, toidentify which factors are involved in generating stockdifferences in otolith microstructure. Knowledge aboutthe growth of the otoliths at different and varyingtemperatures is likely to be important to enable accurateand precise predictions in this respect (Hoff and Fuiman1995). Temperature is a key abiotic factor affectinggrowth in fishes (Brett 1979; Houde 1989; Jobling1995), and systematic differences in ambient temper-ature are encountered between locations throughout the
season. During the first year of life, herring (ClupeaharengusL.) larvae occupying the upper 20 m of thewater column along the Norwegian coast may experi-ence a range in the ambient temperature of up to 10°C(Midttun 1975). Depending on their hatching location,Norwegian spring-spawning herring larvae can experi-ence an increase in ambient temperature of less than0.5°C up to 5°C during the first 2 months fromhatching as they drift northwards along the Norwegiancoast (Midttun 1975; Stenevik & al. 1996). Ambienttemperature has therefore been suggested to be apotential factor responsible for some of the observeddifferences in otolith microstructure in larval herringpopulations from different geographical areas along theNorwegian coast (Stenevik & al. 1996).
When constructing growth trajectories of larvae fromdifferent locations it is important to keep in mind thatback-calculation of previous size and growth rests onassumptions on the relationship between otolith size and
DOI 10.1080/00364820410002532� 2004 Taylor & Francis
Published in collaboration with the University of Bergen and the Institute of Marine Research, Norway

somatic size (Francis 1990; Hare and Cowen 1995). Asthis relationship may be dependent on previous environ-mental history, the back-calculated sizes may possiblybe biased if common relationships are used on fishoriginating from areas with different temperature re-gimes. Specifically, some of the problems in back-calculation of larval size may arise from high variabil-ity in the fish size versus otolith size relationship (asdefined in Hare & Cowen 1995) due to variableenvironmental background. Growth rate-related effectswith otoliths growing proportionally more relative tosoma at higher temperatures have also been shown tooccur in several species (Secor and Dean 1992; Hareand Cowen 1995), and this may also complicate thecomparison of larval growth from different regions.
A better understanding of how temperature affectsboth otolith and somatic growth and increment deposi-tion rate is therefore essential for back-calculationof previous fish size and somatic growth rate, and forage estimation. Data on temperature-dependent otolithgrowth in herring larvae are scarce, and the lack of anestablished temperature–otolith growth relationship canlimit the potential use of otolith microstructure analysisin this species. In the present study we determined theeffect of different and changing temperatures on otolithgrowth and increment deposition rate in larval herringusing a controlled laboratory experimental design.
MATERIAL AND METHODS
Norwegian spring-spawning herring caught 31 March1995 off southwestern Norway, 59°13�N 05°08�E, wereused as parental fish in the study. Eggs from twofemales and sperm from three males were stripped onthe day of capture onto plastic sheets and incubated inthe laboratory at 8.1°C�0.2 (standard deviation). Boththe female fish were 12 years of age, 35.5 and 38.0 cmin length, and were repeat spawners. The egg diameteraveraged 1.65 mm, and incubation survival was around90% (Høie & al. 1999). Two days after hatching (50%hatching defined as day 0), on 18 April, 400 larvae weretransferred to each of four 500 l green fibreglass rearingtanks, two tanks at 4°C and two at 12°C water tempera-ture. The herring larvae in the rearing tanks were keptwithin a cage, 0.75�0.75�0.5 m, made of 335�mplankton mesh inside the respective rearing tanks. Theywere fed live natural zooplankton (mainly rotifers andnauplii) in excess (as described in Folkvord & al. 2000).The light intensities during incubation and in the tanksfluctuated according to the seasonal and daily cycle inBergen (60°N) and the salinity averaged 33.4 ppt duringthe experiment. The rearing temperature was maintainedat respective levels until day 16, when the temperature
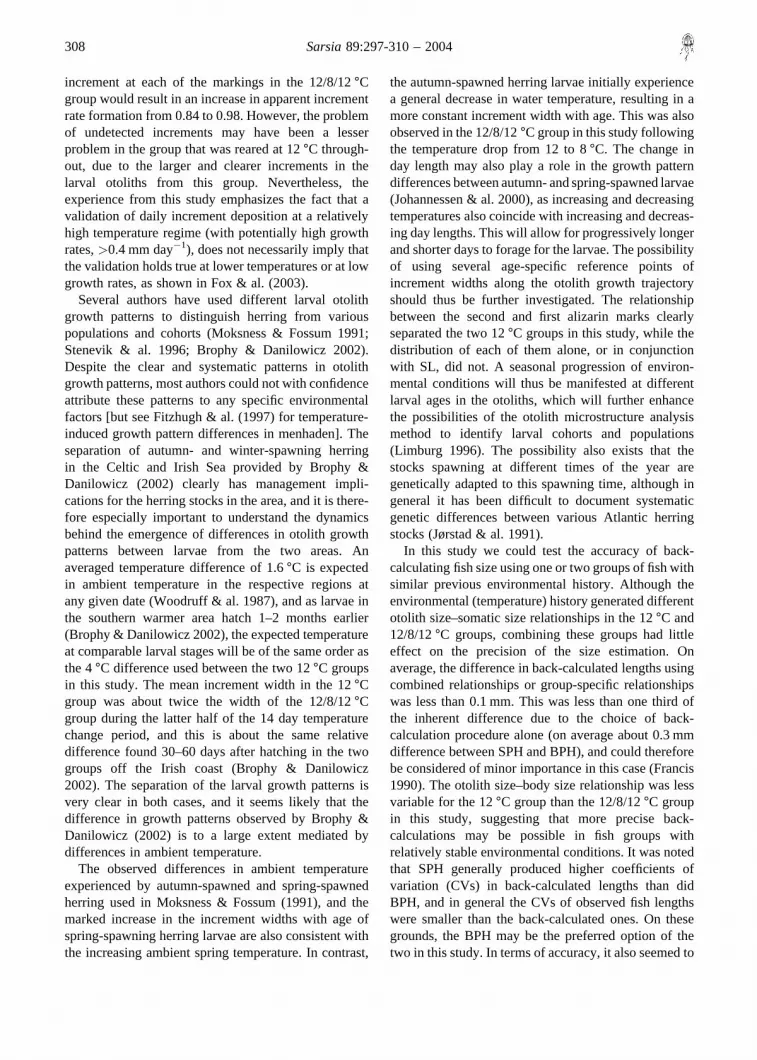
in two tanks (one of the replicates at each original rear-ing temperature) was shifted to 8°C (Fig. 1). From thispoint the tanks with the same initial rearing temper-atures were no longer true replicates (Hurlbert 1984).After reducing the water volume in all tanks to 100 l,the larvae were subject to an alizarin complexone(Sigma Chemical Co.) immersion marking (50 mg l�1
for 12 h) on day 16, immediately prior to the tempera-ture change. The alizarin in the tanks was removedby repeatedly filling the tanks up with sea water andsiphoning water out again from outside the cage untilthe water in the tank was transparent. Following asecond alizarin marking on day 30, the temperaturewas shifted back to the original temperature in twogroups (hereafter called the 4/8/4°C and 12/8/12°Cgroups) and reared an additional 7 days. The groupsmaintained at their original temperature are in the fol-lowing referred to as the 4°C group and the 12°Cgroup. The two alizarin markings were carried out fromaround midnight to noon the following day, after whichthe tank volume was refilled to 500 l.
Larval sampling in the rearing tanks was carried outaround midnight once a week to ensure a similar dailyfeeding period of all the larvae, and to reduce problemsof avoidance. The light had been off for at least 1 h priorto sampling, and the larvae were sampled using a flash-light and a 1 l ladle, with no apparent avoidance takingplace. Twelve or more larvae were generally sampledper tank, except on day 23 when about six larvae weresampled per tank. The temperature in the tanks wasmonitored daily, and the tanks were also inspected dailyto detect and remove any dead larvae. The 4°C groupwas terminated on day 30 by sampling the relativelyfew larvae that were left; the remaining three groupswere terminated on day 37. Sampled larvae were stagedaccording to Doyle (1977), standard length (SL)measured alive to the nearest 0.1 mm under a dissecting
Fig. 1. Temperature (°C) in larval rearing tanks. Arrowsindicate time of alizarin marking.
298 Sarsia89:297-310 – 2004

microscope, and subsequently stored individually invials with 96% alcohol before otolith extraction. Afterotolith extraction the dry weight of the larvae wererecorded to the nearest microgram on a Sartorious M3Pmicrobalance after prior drying at 60°C for 24 h.
Both sagittae were extracted and mounted in clearnail varnish on glass slides with the convex side of thesagitta facing up. The sagittae were read along the long-est possible radius to the nearest 0.1�m from the coreto the outer edge of the otolith under a light microscopeat 1000� magnification (Andersen & Moksness 1988).The radial distance from the core to the alizarin markswas measured to the nearest 0.1�m using a calibratedZeiss Axioscope fluorescence microscope equippedwith a Sony DXC-930P video camera. The otolithincrements were counted and numbered from the firstcheck (hatch check) towards the outer edge of theotolith. When counting the otolith increments, the firstdistinct marked increment from the core was assignedas the first alizarin increment, measured from D-zone toD-zone as defined in Secor & al. (1995), while the firstincrement in a possible second and separate mark wastermed the second alizarin increment. The number ofincrements between markings was estimated withineach otolith as the increment number of the secondalizarin increment minus the increment number of thefirst alizarin increment. Increment width-at-age of indi-vidual otoliths was estimated by assigning the outerincrement to the day of sampling, the penultimate in-crement to the previous day and so on. When analysingindividual otolith growth trajectories, one sagitta (leftor right) was randomly selected from each larvae tomaintain original increment data structure, otherwiseincrement counts and otolith radii data were averagedwhen readings from both otoliths were available(Folkvord & al. 1997). In total, 335 live larvae weresampled and their length measured in the experiment,and of these 322 larvae were subject to otolith extrac-tion and analysis. To test for possible size-selectivemortality following the second alizarin marking, anadditional sample of 48 dead larvae from the 12/8/12°Cgroup from day 31 was measured and compared withthose sampled alive in the tank some hours earlier.
Average daily length growth rates (mm day�1) werecalculated as (SL2 – SL1)/(t2 – t1) where SL2 and SL1are SL measures at corresponding times t2 and t1,respectively. Average daily weight and otolith increases(% day�1) were calculated as 100*(eG – 1), where G isthe instantaneous rate of increase (ln X2 – ln X1)/(t2 – t1),where Xi is dry weight or sagitta radius at time i.Variables were log transformed prior to statistical analy-sis when needed to obtain linearity and homogenousvariances, and tests were considered significant at
probability levels below 0.05 (Sokal & Rohlf 1981).Nested ANOVA was used on the size-at-age data at day16 before the replicates were used as separate treat-ments. Back-calculation of fish lengths was carried outusing the scale proportional hypothesis (SPH) and bodyproportional hypothesis (BPH) procedures (Francis1990). Both procedures were used to obtain informationon the inherent variability in back-calculated lengthscaused by the choice of back-calculation procedure.The back-calculated lengths corresponding to the timeof marking were compared with the observed lengths atthe time of marking. The amount of age-independentvariability in the fish size versus otolith size relation-ships, and the growth rate effects on the otolith sizeversus fish size relationships, were estimated for the12°C groups by the procedures described in Hare &Cowen (1995). Briefly, a high correlation of the bodysize-on-age residuals and otolith size-on-age residualsis indicative of a low age-independent variability, i.e.most of the variability in the body size-on-age residualsis explained by the otolith size-on-age residuals.Furthermore, a positive correlation between the age-on-body size residuals and otolith size-on-body sizeresiduals is indicative of a growth effect, where slowergrowing individuals have larger otoliths at a given bodysize. A preliminary evaluation of several body size andotolith size relationships was carried out, and the oneswith the highest correlations were subject to furtheranalysis. A casewise deletion procedure was used formissing values during these age-independent andgrowth effect analyses, resulting in a total of 174 casesavailable for analysis.
RESULTS
SOMATIC GROWTH AND SURVIVAL
Larval growth was clearly temperature dependent (Fig.2a, b). The group reared at 12°C grew around 0.4 mmday�1 compared with 0.15 mm day�1 in the 4°C group.The daily weight increase was around 13% day�1 forthe 12°C groups and 3% day�1 for the 4°C groupsfrom day 9 to day 16 with a corresponding difference insize-at-age (nested ANOVAs, p� 0.001). No signifi-cant differences were observed in size-at-age betweenthe replicates at day 16 (nested ANOVAs, p� 0.8).Both groups subsequently reared at 8°C had similaraverage weight growth rates of around 6% day�1
between the markings (days 16 to 30, Table 1, Fig.2b), whereas the remaining 4°C group continued togrow at a rate of 3% day�1. The growth rate of the 12°Cgroup declined to 8.5% day�1 between the markingsand to 6.5% day�1 the last week of the experiment. The
Folkvord & al. – Temperature-dependent otolith growth 299

survival (including sampling) varied from 18% in the4 °C groups to 27% in the 12°C groups during theexperiment. A marked increase in mortality took placefollowing the markings, most likely due to mechanicalstress in connection with the water replenishingprocedure removing the immersion solution in the tanks.
About 160 larvae, or 40% of the original population,died within a day of the second marking in the 12/8/12°C group, and in total over half (363) of the 693 deadlarvae recovered from tanks were from the 3 daysfollowing the markings.
OTOLITH GROWTH
A pronounced temperature-dependent sagitta growthwas observed in the experiment (nested ANOVA,p� 0.001, Fig. 2c). No significant sagitta growth wasobserved in the 4°C group (linear regression, p� 0.1),whereas the sagitta radius in the 12°C group grewexponentially at a rate of 5.5% day�1, resulting, onaverage, in an estimated daily increment width from day9 to day 37 of 2.2�m. The corresponding averageestimated daily increment widths of the 12/8/12°C and4/8/4°C groups were 1.3 and 0.13�m during the sameperiod (Fig. 2c).
Fig. 2. Size-at-age (a) standard length (SL; mm), (b) dry weight (DW; mg) and (c) sagitta radius (�m) of herring larvae reared atdifferent temperature regimes (note log scale in the two latter). Vertical lines indicate time of alizarin marking. Whiskers represent2 standard errors.
Table 1. Ratios of growth rates from different groups duringthe inter-mark period (days 16–30). Standard length (SL)growth is in mm day�1; dry weight (DW) and sagitta radiusgrowth are in % day�1. The temperature (°C) in the respectivegroups during the period is indicated in bold.
GroupsRatio ofSL growth
Ratio ofDW growth
Ratio ofotolith growth
4/8/4°Cversus4 °C
1.75 1.92 2.43
4/8/4 °Cversus 12/8/12°C
0.98 1.02 0.23
12/8/12°Cversus12 °C
0.76 0.65 0.61
300 Sarsia89:297-310 – 2004

The otolith growth pattern revealed an increasingincrement width in the 12°C group during the initial3 weeks of the experiment with average incrementwidths on a given day exceeding 3.2�m (Fig. 3).The increment widths were markedly lower in the 12/8/12°C group following the temperature drop comparedwith the 12°C group, and remained between 1 and 2�mbetween the markings. A decline in incrementwidths was also observed following the second markingin the 12°C group (Fig. 3).
ALIZARIN MARKING AND INCREMENT DEPOSITION RATE
Marking success differed between groups and averaged87% in the 4°C groups and 98% in the 12°C groupswhen readings from both sagittae of each specimenwere combined (�2 test, p� 0.003). Marking successwas not significantly associated with faster growinglarvae, but eight of 12 missing alizarin marks occurredamong larvae that were smaller than average withinrespective groups (sign test, p� 0.3).
The radius of the first alizarin mark correspondingto the otolith size at day 16 averaged 13.8 and24.5�m in the groups reared initially at 4°C and12°C (nested ANOVA, p� 0.001), and did not differbetween groups reared at similar temperatures (nestedANOVA, p � 0.7). The alizarin markings also con-firmed the effect of changing the temperature on otolithgrowth (Fig. 4), with higher inter-mark distances inthe 12°C group larvae than in the 12/8/12°C grouplarvae.
The number of increments between the doublealizarin marks was in accordance with a daily incrementdeposition rate of 1.0 day�1 in the 12°C group (t-test,�0.2, Power�1 for increment deposition rate of 1.07
or 0.93, equivalent to one increment too many or toofew during the 14 day inter-mark period), while in the12/8/12°C group the daily increment deposition ratewas significantly less than 1 (0.84, t-test, p� 0.001).The larvae sampled at day 30 had a similar incrementdeposition rate between days 16 and 30 as the larvaesampled on day 37 (two-way ANOVA, p� 0.4). In both4 °C groups the apparent daily increment depositionrate was clearly below 1, and in the 4/8/4°C groupit averaged 0.25 between the markings (t-test,p� 0.001). The apparent increment deposition ratefrom hatching to the first alizarin mark was below 1 inall groups (two-way ANOVA, p� 0.001), between 0.6and 0.7 in the 12°C groups and below 0.1 in the 4°Cgroups.
SOMATIC VERSUS OTOLITH GROWTH
Growth in length responded differently than otolithgrowth to imposed temperature changes during theexperiment. The average SL at day 30 in the 12/8/12°Cgroup was 6% lower than in the 12°C group, 20.8 versus22.2 mm, respectively (Fig. 2a, t-test, p� 0.001), whilethe otolith radius was 28% smaller, 41.5 versus 58.0�m,respectively (Fig. 2c, t-test, p� 0.001). In the 4°Cgroups, both the average SL and otolith radius wereabout 10% higher at day 30 in the 4/8/4°C group thanin the 4°C group, 16.2 versus 14.7 mm and 14.5 versus13.2�m, respectively (Fig. 2a, c, t-tests, p� 0.02). Atday 30, there was more than a 43% overlap in SL anda 26% overlap in otolith size distributions betweentreatments reared initially at similar temperatures (4versus 4/8/4°C and 12 versus 12/8/12°C, calculatedfrom Kolmogorov-Smirnov, D). SL and otolith radiialone did not discriminate larvae from different groupswhich had had the same initial temperature conditions.In contrast, for larvae initially reared at 4 and 12°C, SLand otolith radius distributions were distinct on day 16.
A clear distinction could be made between larvaefrom the 12°C group and the 12/8/12°C group basedon the ratio of otolith radius at second marking versusotolith radius at first marking (i.e. otolith size beforeand after temperature change, Fig. 5a, b). The ratio ofthe outer alizarin mark to the inner alizarin markwas consistently higher in the 12°C group than in the12/8/12°C group at any given size of the first alizarinmark. Such a distinction was not possible based on theratio of length at capture over otolith size at the firstmarking (Fig. 5c, d). No clear distinction could be madeamong the larvae initially reared at 4°C, as most of thelarvae in the 4°C groups exhibited minimal otolithgrowth between the first and second markings (Fig. 5a).Only about half of the larvae from the 4/8/4°C group
Fig. 3. Sagitta increment widths versus age in herring larvaefrom the two 12°C groups sampled at day 37. Vertical linesindicate time of alizarin marking. Boxes represent standarderror and whiskers represent standard deviation.
Folkvord & al. – Temperature-dependent otolith growth 301
at day 37 had more than one distinct alizarin mark(Fig. 5b, d).
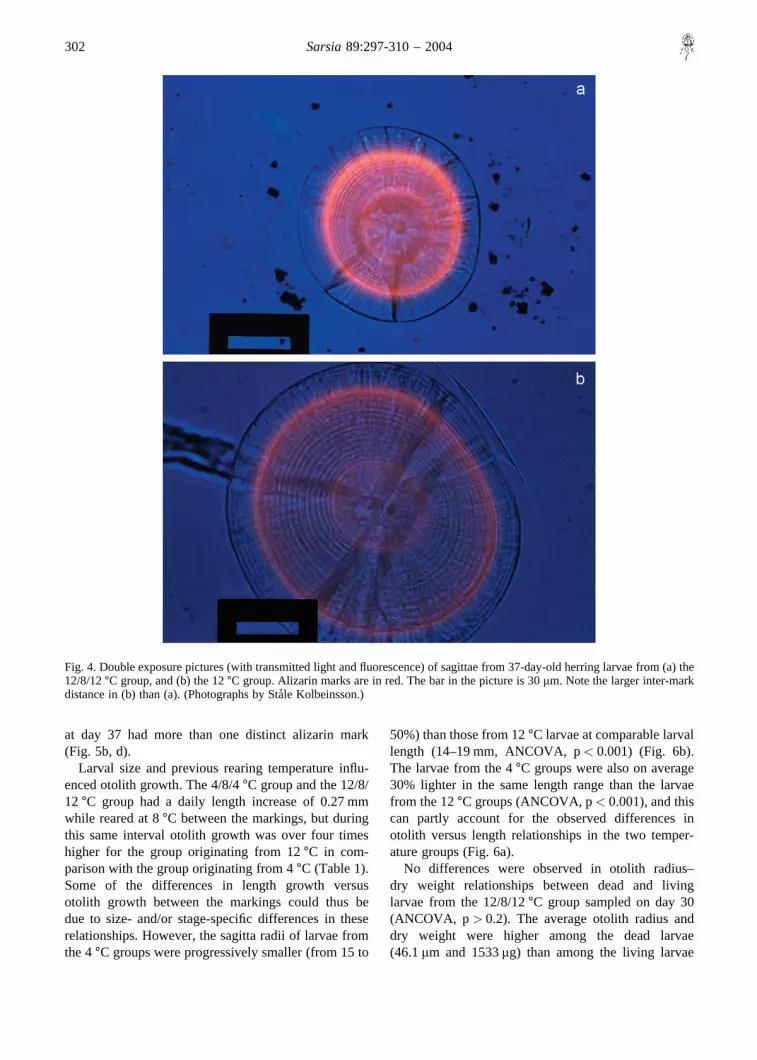
Larval size and previous rearing temperature influ-enced otolith growth. The 4/8/4°C group and the 12/8/12°C group had a daily length increase of 0.27 mmwhile reared at 8°C between the markings, but duringthis same interval otolith growth was over four timeshigher for the group originating from 12°C in com-parison with the group originating from 4°C (Table 1).Some of the differences in length growth versusotolith growth between the markings could thus bedue to size- and/or stage-specific differences in theserelationships. However, the sagitta radii of larvae fromthe 4°C groups were progressively smaller (from 15 to
50%) than those from 12°C larvae at comparable larvallength (14–19 mm, ANCOVA, p� 0.001) (Fig. 6b).The larvae from the 4°C groups were also on average30% lighter in the same length range than the larvaefrom the 12°C groups (ANCOVA, p� 0.001), and thiscan partly account for the observed differences inotolith versus length relationships in the two temper-ature groups (Fig. 6a).
No differences were observed in otolith radius–dry weight relationships between dead and livinglarvae from the 12/8/12°C group sampled on day 30(ANCOVA, p� 0.2). The average otolith radius anddry weight were higher among the dead larvae(46.1�m and 1533�g) than among the living larvae
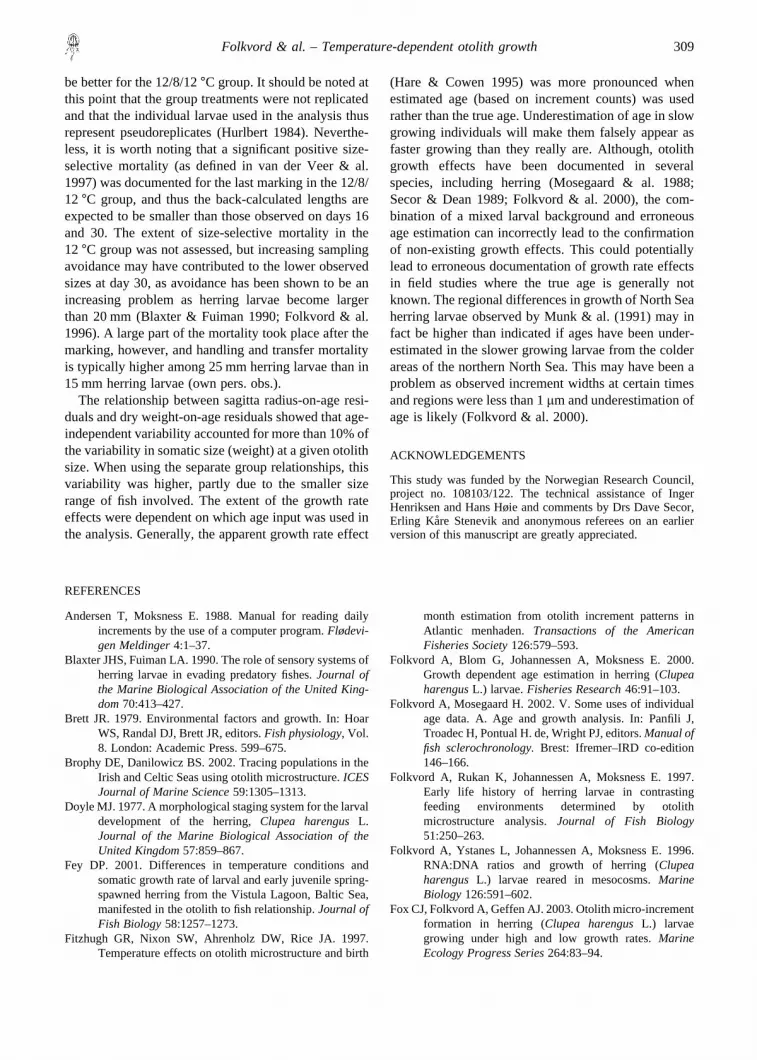
Fig. 4. Double exposure pictures (with transmitted light and fluorescence) of sagittae from 37-day-old herring larvae from (a) the12/8/12°C group, and (b) the 12°C group. Alizarin marks are in red. The bar in the picture is 30�m. Note the larger inter-markdistance in (b) than (a). (Photographs by Sta˚le Kolbeinsson.)
302 Sarsia89:297-310 – 2004

(41.5�m and 1363�g) (t-tests, p� 0.01), indicatingthat larger larvae had suffered higher mortality thansmaller larvae in connection with the second alizarintreatment.
BACK-CALCULATION OF SOMATIC GROWTH
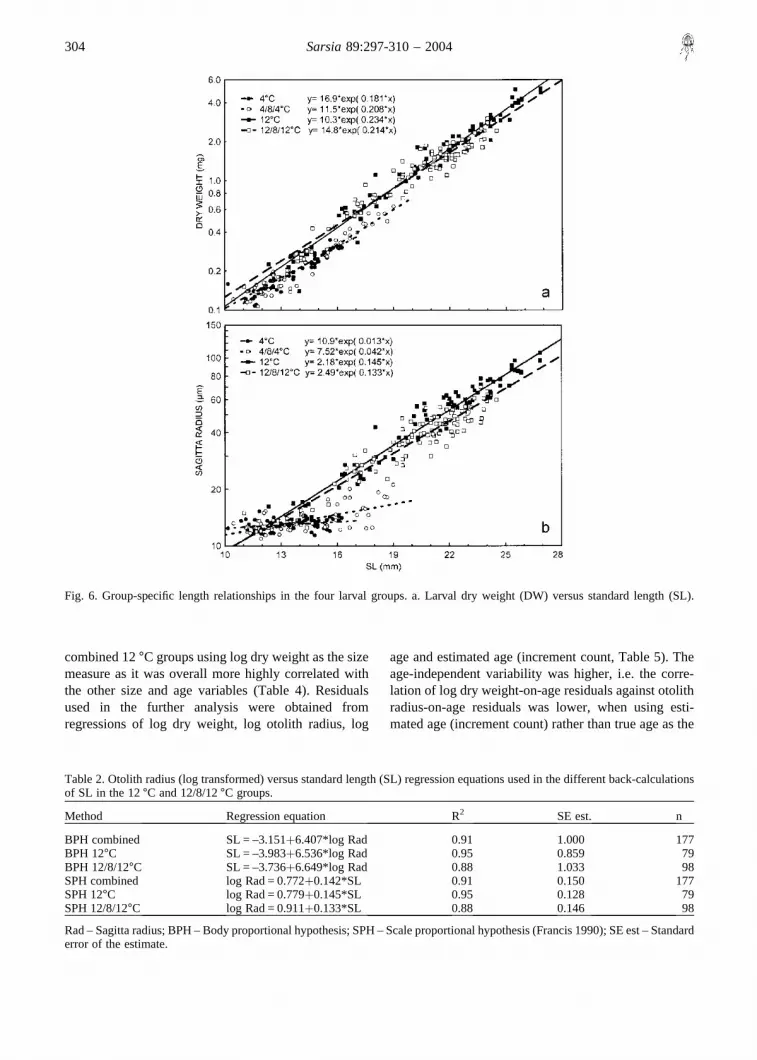
Fish length was generally linearly related to log sagittaradius (Fig. 6b). Regressions of length on radius andvice versa were estimated as inputs for back-calculationsof previous SL based on the BPH and SPH, usingseparate relationships for each group and using thecombined data for both the 12°C groups (Table 2). Theproportion of explained variance in the regressionsaveraged 0.91 for both the SPH and BPH proceduresusing the combined data sets, while the proportion ofexplained variance ranged between 0.88 and 0.95 whenusing group-specific relationships. The slopes of thegroup-specific regressions were not significantly dif-ferent under either procedure (ANCOVA, p� 0.05),but the 12°C group had larger otoliths-at-length (andsmaller lengths-at-radius) than the 12/8/12°C group(ANCOVA, p� 0.001).
Back-calculations of fish lengths were only carriedout in the 12°C and 12/8/12°C groups due to the narrowsize range available in the 4°C groups. The lengths wereback-calculated to days 16 and 30 corresponding to themarking periods, and the otolith size at the time ofmarking was used as input in the analyses. None of theaverage back-calculated fish lengths differed from theaverage observed fish lengths on days 16 or 30 (t-tests,p� 0.05, Table 3). However, the variance of the back-calculated fish lengths was about four times higher thanthe variance of the observed fish lengths on day 16(F-tests, p� 0.03). Part of this difference in variancecan be due to inherent differences in the samples oflarvae. The radius of the first alizarin mark in the olderlarvae showed 2.5 times higher variability than theotolith radius of larvae from day 16 (F-test, p� 0.01).The average otolith size-at-age was not different (t-test,p� 0.6).
AGE INDEPENDENCE AND GROWTH EFFECTS
The age-independent variability in the somatic sizeand otolith size relationship was investigated in the
Fig. 5. Group-dependent plots of ratios versus sagitta radius at first alizarin marking (AZ1). Data in panels (a) and (c) are fromlarvae sampled on day 30, while the data in panels (b) and (d) are from larvae sampled on day 37. a. Sagitta radius (Rad):AZ1.b. Sagitta radius at second marking (AZ2):AZ1. c. Standard length (SL):AZ1. d. SL:AZ1. All sagitta radii are log transformed.Ellipses (90% confidence) are included to indicate the degree of overlap between groups.
Folkvord & al. – Temperature-dependent otolith growth 303
combined 12°C groups using log dry weight as the sizemeasure as it was overall more highly correlated withthe other size and age variables (Table 4). Residualsused in the further analysis were obtained fromregressions of log dry weight, log otolith radius, log
age and estimated age (increment count, Table 5). Theage-independent variability was higher, i.e. the corre-lation of log dry weight-on-age residuals against otolithradius-on-age residuals was lower, when using esti-mated age (increment count) rather than true age as the
Fig. 6. Group-specific length relationships in the four larval groups. a. Larval dry weight (DW) versus standard length (SL).
Table 2. Otolith radius (log transformed) versus standard length (SL) regression equations used in the different back-calculationsof SL in the 12°C and 12/8/12°C groups.
Method Regression equation R2 SE est. n
BPH combined SL = –3.151�6.407*log Rad 0.91 1.000 177BPH 12°C SL = –3.983�6.536*log Rad 0.95 0.859 79BPH 12/8/12°C SL = –3.736�6.649*log Rad 0.88 1.033 98SPH combined log Rad = 0.772�0.142*SL 0.91 0.150 177SPH 12°C log Rad = 0.779�0.145*SL 0.95 0.128 79SPH 12/8/12°C log Rad = 0.911�0.133*SL 0.88 0.146 98
Rad – Sagitta radius; BPH – Body proportional hypothesis; SPH – Scale proportional hypothesis (Francis 1990); SE est – Standarderror of the estimate.
304 Sarsia89:297-310 – 2004

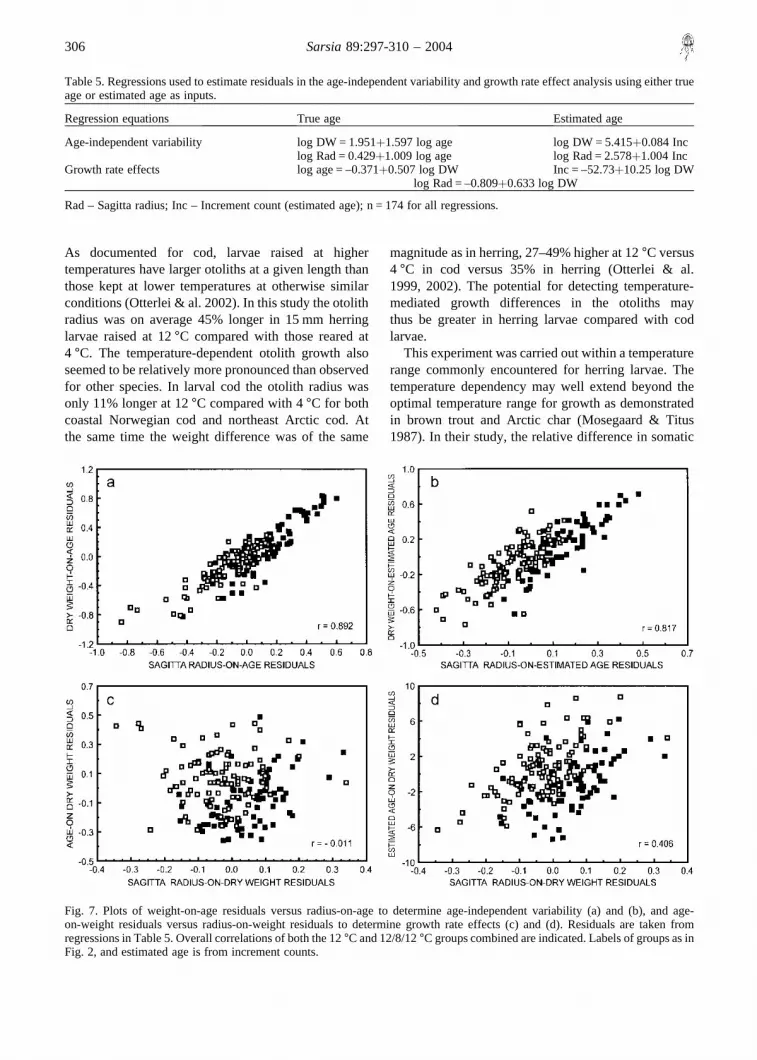
input in the analyses (Fig. 7a, b). A significant growthrate effect (slower growing fish having larger otolithsat a given size) was observed when using estimated agein the analysis (r = 0.41, p� 0.001, Fig. 7d), while nogrowth rate effect was evident when true age was used(r = –0.011, p� 0.8, Fig. 7c).
When analysing the 12°C groups separately thesame pattern was generally apparent as in the combinedanalysis. Age-independent variability was similar withcorrelations ranging between 0.75 and 0.86 (p� 0.001).As in the case of the combined analysis, an apparentgrowth rate effect was present in both 12°C groupswhen using increment counts, but the effect was morepronounced (r ranging from 0.55 to 0.87, p� 0.001, inthe 12°C and 12/8/12°C groups, respectively). Agrowth rate effect was also present in the 12°C groupwhen using true age as the input in the analysis
(r = 0.48, p� 0.001), while no such effect was foundin the 12/8/12°C group (r = –0.04, p� 0.7).
DISCUSSION
A marked temperature-dependent otolith growth wasobserved in herring larvae. The average otolith size of30-day-old herring larvae raised at 4°C was smallerthan otoliths from 9-day-old larvae from the 12°Cgroups. Otolith growth has also been verified to increasewith temperature in other species such as char, reddrum, menhaden, and cod (Mosegaard & al. 1988; Hoff& Fuiman 1995; Fitzhugh & al. 1997; Otterlei & al.2002). In addition, and equally important in the contextof reconstructing previous larval growth histories, theotolith growth is shown to be more affected by elevatedtemperature than somatic growth in length or weight.
Table 4. Correlations of size and age variables used as inputs in preliminary age-independent variability analysis and growth rateeffect analyses (Hare & Cowen 1995). Data from the 12°C and 12/8/12°C groups are combined.
Age Log age Inc Log inc SL Log SL DW Log DW Rad
Log age 0.982Inc 0.895 0.891Log inc 0.876 0.918 0.941SL 0.873 0.879 0.912 0.886Log SL 0.882 0.901 0.913 0.911 0.994DW 0.727 0.690 0.805 0.698 0.881 0.840Log DW 0.888 0.899 0.928 0.911 0.976 0.974 0.897Rad 0.786 0.760 0.876 0.784 0.910 0.880 0.964 0.929Log Rad 0.871 0.877 0.939 0.910 0.954 0.949 0.887 0.976 0.959
Inc – Increment count (estimated age); Rad – Sagitta radius.All correlations are highly significant, p� 0.001, n = 174 in all cases.Correlations in bold represent the variable combinations that were used in the final analysis of age-independent variability andgrowth rate effects.
Table 3. Observed and back-calculated standard lengths (SL) of the 12°C and 12/8/12°C groups at days 16 and 30.
12°C 12/8/12°C Both
Mean SD CV Diff. n Mean SD CV Diff. n Mean SD CV Diff. n
Observed day 16 17.23 0.77 4.5 14 17.07 0.78 4.6 14 17.15 0.77 4.5 28BPH combined* 17.05 1.62 9.5 �1.0 52 17.43 1.37 7.9 2.1 69 17.27 1.49 8.6 0.7 121BPH separate* 16.85 1.64 9.7�2.2 52 17.35 1.37 7.9 1.6 69SPH combined* 16.52 1.69 10.2�4.1 52 17.09 1.42 8.3 0.1 69 16.85 1.56 9.3�1.7 121SPH separate* 16.54 1.69 10.2�4.0 52 16.88 1.46 8.6 �1.1 69
Observed day 30 22.23 1.74 7.8 27 20.89 1.38 6.6 42 21.41 1.66 7.8 69BPH combined† 23.13 1.82 7.9 4.0 23 20.82 1.35 6.5�0.3 22 22.00 1.98 9.0 2.8 45BPH separate† 23.09 1.82 7.9 3.9 23 20.79 1.36 6.5�0.5 22SPH combined† 23.04 1.83 7.9 3.6 23 20.68 1.38 6.7�1.0 22 21.88 2.00 9.1 2.2 45SPH separate† 23.04 1.83 7.9 3.6 23 20.58 1.40 6.8�1.5 22*Samples from days 23–37; †Samples from day 37.SD – Standard deviation; CV – Coefficient of variation; Diff. – Percentage deviation of estimated SL from observed average SL;BPH – Body proportional hypothesis; SPH – Scale proportional hypothesis (Francis 1990).Back-calculated lengths are calculated based on both combined and separate length versus otolith size relationships.
Folkvord & al. – Temperature-dependent otolith growth 305
As documented for cod, larvae raised at highertemperatures have larger otoliths at a given length thanthose kept at lower temperatures at otherwise similarconditions (Otterlei & al. 2002). In this study the otolithradius was on average 45% longer in 15 mm herringlarvae raised at 12°C compared with those reared at4 °C. The temperature-dependent otolith growth alsoseemed to be relatively more pronounced than observedfor other species. In larval cod the otolith radius wasonly 11% longer at 12°C compared with 4°C for bothcoastal Norwegian cod and northeast Arctic cod. Atthe same time the weight difference was of the same
magnitude as in herring, 27–49% higher at 12°C versus4 °C in cod versus 35% in herring (Otterlei & al.1999, 2002). The potential for detecting temperature-mediated growth differences in the otoliths maythus be greater in herring larvae compared with codlarvae.
This experiment was carried out within a temperaturerange commonly encountered for herring larvae. Thetemperature dependency may well extend beyond theoptimal temperature range for growth as demonstratedin brown trout and Arctic char (Mosegaard & Titus1987). In their study, the relative difference in somatic
Fig. 7. Plots of weight-on-age residuals versus radius-on-age to determine age-independent variability (a) and (b), and age-on-weight residuals versus radius-on-weight residuals to determine growth rate effects (c) and (d). Residuals are taken fromregressions in Table 5. Overall correlations of both the 12°C and 12/8/12°C groups combined are indicated. Labels of groups as inFig. 2, and estimated age is from increment counts.
Table 5. Regressions used to estimate residuals in the age-independent variability and growth rate effect analysis using either trueage or estimated age as inputs.
Regression equations True age Estimated age
Age-independent variability log DW = 1.951�1.597 log age log DW = 5.415�0.084 Inclog Rad = 0.429�1.009 log age log Rad = 2.578�1.004 Inc
Growth rate effects log age = –0.371�0.507 log DW Inc = –52.73�10.25 log DWlog Rad = –0.809�0.633 log DW
Rad – Sagitta radius; Inc – Increment count (estimated age); n = 174 for all regressions.
306 Sarsia89:297-310 – 2004

and otolith temperature-dependent growth responseincreased as temperatures approached the upper limitsupporting positive somatic growth. This was hypothe-sized to be due to ever-increasing metabolic cost athigher temperatures, which has been proposed to bemore directly related to otolith growth than somaticgrowth itself (Wright 1991). Comparing the otolith sizeat fish length from this study and Folkvord & al. (2000)with those found in field-caught herring growing ateven higher temperatures (Fey 2001), it is clear that theotolith growth is noticeably more temperature depen-dent than somatic growth. At larval lengths over 20 mm,the average otolith radius of herring growing above16°C was more than twice as large compared withthose in the 12°C group from this study (Fey 2001).
Other studies have shown that food availability andsomatic growth rate also affect otolith growth and theotolith size–somatic size relationship (Mosegaard & al.1988; Secor & Dean 1989). In their study on food level-dependent growth in larval herring, Folkvord & al.(2000) found clear differences in somatic and otolithgrowth response following periods of food restrictionand re-feeding. The overall durations of the intermittentmanipulations, which was 2 weeks as in this study,provided sufficient differences in growth patterns toallow discrimination between the populations. The ap-parent differences in the otolith size versus somatic sizerelationship were less apparent, however, than thosegenerated in this study. The group-specific slopes of theSL versus otolith radii relationships found between thevarious food level treatments at 8°C (Folkvord & al.2000) were all within the range observed in the 4°C and12°C groups in this study. Thus, a range in food levelssupporting near minimal maintenance growth and nearmaximum growth rates at a given temperature did notaffect the otolith versus somatic size relationship to thesame extent as a temperature treatment with a range of8 °C (4–12°C). Although both food availability andtemperature undoubtedly have the potential to influencethe growth pattern of herring larvae (Munk & al. 1991),the ambient temperature conditions experienced byherring larvae seem to be especially important indetermining the otolith growth pattern. To what extentthis is a characteristic of fish species in boreal systemscompared with species in warmer waters is not clear atpresent.
The growth in SL, weight and otolith radius maychange with age and development (Folkvord & al.2000), but so may also the relative magnitude betweenthe growth measures. An indication of a relatively slowinitial otolith growth compared with length or weightgrowth can be seen in Fig. 2 and when comparing theotolith growth of the two groups reared at 8°C during
the inter-marking period. Although the somatic growthwas similar, the 4/8/4°C group with the smallest larvaehad only a quarter of the otolith growth rate of the largerlarvae from the 12/8/12°C group (Table 1). Becauseotolith growth can be relatively higher than somaticgrowth during subsequent parts of the larval period(positive allometric), the otolith increment width mayincrease with increasing larval size without anyincrease in somatic growth rate having taken place(Munk & al. 1991). When comparing similar-sizedlarvae, otolith growth appeared more responsive thandry weight growth and SL growth to changes intemperature. In the 12/8/12°C group the SL, dry weightand otolith growth rates relative to the 12°C groupgrowth rates during the inter-mark period ranged from0.61 to 0.76 (Table 1). These ratios correspond to acuteQ10 values of 2.0 and 2.9 for SL and dry weight growthand 3.4 for otolith growth during the change from 12 to8 °C. This is in contrast to the results obtained whensubjecting herring larvae reared at constant temper-atures to changes in food availability. In this case,otolith growth was generally slower to reflect reduc-tions in food availability than growth in length or dryweight (Folkvord & al. 2000).
As shown in previous studies, apparent otolithincrement deposition was seriously impaired duringlow larval growth (Geffen 1982; Folkvord & al. 2000;Fox & al. 2003). At 4°C, where no significant otolithgrowth was observed, the average length increase wasas low as 0.15 mm day�1, but still highly significant.Obtaining accurate age information on herring larvaemay be difficult if the larvae have spent some part oftheir time at temperatures not supporting noticeableotolith growth. Due to the size-dependent otolithgrowth described above, this may in particular be aproblem with poor growth conditions shortly after firstfeeding. In this experiment, the use of double alizarinmarkings provided a means of obtaining measures ofabsolute otolith growth between the markings regard-less of increment deposition rate. The alizarin markingsimposed a significant stress on the larvae, however, asmanifested in the increased mortality and subsequentreduction in otolith and somatic growth rate. Still, adaily increment deposition rate of 1 was confirmed forlarvae reared continuously at 12°C, which is inaccordance with previous validation studies with fastgrowing herring larvae carried out at temperaturesincreasing from around 7 to 15°C (Moksness 1992).Although the 12/8/12°C group had an average apparentincrement rate formation of less than 1 (0.84), this mayin part be attributed to stress check formation due toa temperature change at time of marking which couldmask two increments as one (see Fig. 4a). A loss of one
Folkvord & al. – Temperature-dependent otolith growth 307
increment at each of the markings in the 12/8/12°Cgroup would result in an increase in apparent incrementrate formation from 0.84 to 0.98. However, the problemof undetected increments may have been a lesserproblem in the group that was reared at 12°C through-out, due to the larger and clearer increments in thelarval otoliths from this group. Nevertheless, theexperience from this study emphasizes the fact that avalidation of daily increment deposition at a relativelyhigh temperature regime (with potentially high growthrates,�0.4 mm day�1), does not necessarily imply thatthe validation holds true at lower temperatures or at lowgrowth rates, as shown in Fox & al. (2003).
Several authors have used different larval otolithgrowth patterns to distinguish herring from variouspopulations and cohorts (Moksness & Fossum 1991;Stenevik & al. 1996; Brophy & Danilowicz 2002).Despite the clear and systematic patterns in otolithgrowth patterns, most authors could not with confidenceattribute these patterns to any specific environmentalfactors [but see Fitzhugh & al. (1997) for temperature-induced growth pattern differences in menhaden]. Theseparation of autumn- and winter-spawning herringin the Celtic and Irish Sea provided by Brophy &Danilowicz (2002) clearly has management impli-cations for the herring stocks in the area, and it is there-fore especially important to understand the dynamicsbehind the emergence of differences in otolith growthpatterns between larvae from the two areas. Anaveraged temperature difference of 1.6°C is expectedin ambient temperature in the respective regions atany given date (Woodruff & al. 1987), and as larvae inthe southern warmer area hatch 1–2 months earlier(Brophy & Danilowicz 2002), the expected temperatureat comparable larval stages will be of the same order asthe 4°C difference used between the two 12°C groupsin this study. The mean increment width in the 12°Cgroup was about twice the width of the 12/8/12°Cgroup during the latter half of the 14 day temperaturechange period, and this is about the same relativedifference found 30–60 days after hatching in the twogroups off the Irish coast (Brophy & Danilowicz2002). The separation of the larval growth patterns isvery clear in both cases, and it seems likely that thedifference in growth patterns observed by Brophy &Danilowicz (2002) is to a large extent mediated bydifferences in ambient temperature.
The observed differences in ambient temperatureexperienced by autumn-spawned and spring-spawnedherring used in Moksness & Fossum (1991), and themarked increase in the increment widths with age ofspring-spawning herring larvae are also consistent withthe increasing ambient spring temperature. In contrast,
the autumn-spawned herring larvae initially experiencea general decrease in water temperature, resulting in amore constant increment width with age. This was alsoobserved in the 12/8/12°C group in this study followingthe temperature drop from 12 to 8°C. The change inday length may also play a role in the growth patterndifferences between autumn- and spring-spawned larvae(Johannessen & al. 2000), as increasing and decreasingtemperatures also coincide with increasing and decreas-ing day lengths. This will allow for progressively longerand shorter days to forage for the larvae. The possibilityof using several age-specific reference points ofincrement widths along the otolith growth trajectoryshould thus be further investigated. The relationshipbetween the second and first alizarin marks clearlyseparated the two 12°C groups in this study, while thedistribution of each of them alone, or in conjunctionwith SL, did not. A seasonal progression of environ-mental conditions will thus be manifested at differentlarval ages in the otoliths, which will further enhancethe possibilities of the otolith microstructure analysismethod to identify larval cohorts and populations(Limburg 1996). The possibility also exists that thestocks spawning at different times of the year aregenetically adapted to this spawning time, although ingeneral it has been difficult to document systematicgenetic differences between various Atlantic herringstocks (Jørstad & al. 1991).
In this study we could test the accuracy of back-calculating fish size using one or two groups of fish withsimilar previous environmental history. Although theenvironmental (temperature) history generated differentotolith size–somatic size relationships in the 12°C and12/8/12°C groups, combining these groups had littleeffect on the precision of the size estimation. Onaverage, the difference in back-calculated lengths usingcombined relationships or group-specific relationshipswas less than 0.1 mm. This was less than one third ofthe inherent difference due to the choice of back-calculation procedure alone (on average about 0.3 mmdifference between SPH and BPH), and could thereforebe considered of minor importance in this case (Francis1990). The otolith size–body size relationship was lessvariable for the 12°C group than the 12/8/12°C groupin this study, suggesting that more precise back-calculations may be possible in fish groups withrelatively stable environmental conditions. It was notedthat SPH generally produced higher coefficients ofvariation (CVs) in back-calculated lengths than didBPH, and in general the CVs of observed fish lengthswere smaller than the back-calculated ones. On thesegrounds, the BPH may be the preferred option of thetwo in this study. In terms of accuracy, it also seemed to
308 Sarsia89:297-310 – 2004
be better for the 12/8/12°C group. It should be noted atthis point that the group treatments were not replicatedand that the individual larvae used in the analysis thusrepresent pseudoreplicates (Hurlbert 1984). Neverthe-less, it is worth noting that a significant positive size-selective mortality (as defined in van der Veer & al.1997) was documented for the last marking in the 12/8/12°C group, and thus the back-calculated lengths areexpected to be smaller than those observed on days 16and 30. The extent of size-selective mortality in the12°C group was not assessed, but increasing samplingavoidance may have contributed to the lower observedsizes at day 30, as avoidance has been shown to be anincreasing problem as herring larvae become largerthan 20 mm (Blaxter & Fuiman 1990; Folkvord & al.1996). A large part of the mortality took place after themarking, however, and handling and transfer mortalityis typically higher among 25 mm herring larvae than in15 mm herring larvae (own pers. obs.).
The relationship between sagitta radius-on-age resi-duals and dry weight-on-age residuals showed that age-independent variability accounted for more than 10% ofthe variability in somatic size (weight) at a given otolithsize. When using the separate group relationships, thisvariability was higher, partly due to the smaller sizerange of fish involved. The extent of the growth rateeffects were dependent on which age input was used inthe analysis. Generally, the apparent growth rate effect
(Hare & Cowen 1995) was more pronounced whenestimated age (based on increment counts) was usedrather than the true age. Underestimation of age in slowgrowing individuals will make them falsely appear asfaster growing than they really are. Although, otolithgrowth effects have been documented in severalspecies, including herring (Mosegaard & al. 1988;Secor & Dean 1989; Folkvord & al. 2000), the com-bination of a mixed larval background and erroneousage estimation can incorrectly lead to the confirmationof non-existing growth effects. This could potentiallylead to erroneous documentation of growth rate effectsin field studies where the true age is generally notknown. The regional differences in growth of North Seaherring larvae observed by Munk & al. (1991) may infact be higher than indicated if ages have been under-estimated in the slower growing larvae from the colderareas of the northern North Sea. This may have been aproblem as observed increment widths at certain timesand regions were less than 1�m and underestimation ofage is likely (Folkvord & al. 2000).
ACKNOWLEDGEMENTS
This study was funded by the Norwegian Research Council,project no. 108103/122. The technical assistance of IngerHenriksen and Hans Høie and comments by Drs Dave Secor,Erling Kare Stenevik and anonymous referees on an earlierversion of this manuscript are greatly appreciated.
REFERENCES
Andersen T, Moksness E. 1988. Manual for reading dailyincrements by the use of a computer program.Flødevi-gen Meldinger4:1–37.
Blaxter JHS, Fuiman LA. 1990. The role of sensory systems ofherring larvae in evading predatory fishes.Journal ofthe Marine Biological Association of the United King-dom70:413–427.
Brett JR. 1979. Environmental factors and growth. In: HoarWS, Randal DJ, Brett JR, editors.Fish physiology, Vol.8. London: Academic Press. 599–675.
Brophy DE, Danilowicz BS. 2002. Tracing populations in theIrish and Celtic Seas using otolith microstructure.ICESJournal of Marine Science59:1305–1313.
Doyle MJ. 1977. A morphological staging system for the larvaldevelopment of the herring,Clupea harengusL.Journal of the Marine Biological Association of theUnited Kingdom57:859–867.
Fey DP. 2001. Differences in temperature conditions andsomatic growth rate of larval and early juvenile spring-spawned herring from the Vistula Lagoon, Baltic Sea,manifested in the otolith to fish relationship.Journal ofFish Biology58:1257–1273.
Fitzhugh GR, Nixon SW, Ahrenholz DW, Rice JA. 1997.Temperature effects on otolith microstructure and birth
month estimation from otolith increment patterns inAtlantic menhaden.Transactions of the AmericanFisheries Society126:579–593.
Folkvord A, Blom G, Johannessen A, Moksness E. 2000.Growth dependent age estimation in herring (ClupeaharengusL.) larvae.Fisheries Research46:91–103.
Folkvord A, Mosegaard H. 2002. V. Some uses of individualage data. A. Age and growth analysis. In: Panfili J,Troadec H, Pontual H. de, Wright PJ, editors.Manual offish sclerochronology.Brest: Ifremer–IRD co-edition146–166.
Folkvord A, Rukan K, Johannessen A, Moksness E. 1997.Early life history of herring larvae in contrastingfeeding environments determined by otolithmicrostructure analysis.Journal of Fish Biology51:250–263.
Folkvord A, Ystanes L, Johannessen A, Moksness E. 1996.RNA:DNA ratios and growth of herring (Clupeaharengus L.) larvae reared in mesocosms.MarineBiology126:591–602.
Fox CJ, Folkvord A, Geffen AJ. 2003. Otolith micro-incrementformation in herring (Clupea harengusL.) larvaegrowing under high and low growth rates.MarineEcology Progress Series264:83–94.
Folkvord & al. – Temperature-dependent otolith growth 309
Francis RICC. 1990. Back-calculation of fish length: a criticalreview.Journal of Fish Biology36:883–902.
Geffen AJ. 1982. Otolith ring deposition in relation to growthrate in herring (Clupea harengus) and turbot(Scophthalmus maximus) larvae. Marine Biology71:317–326.
Hare JA, Cowen RK. 1995. Effect of age, growth rate, andontogeny on the otolith size–fish size relationship inbluefish,Pomatomus saltatrix, and the implications forback-calculation of size in fish early life history stages.Canadian Journal of Fisheries and Aquatic Sciences52:1909–1922.
Hoff GR, Fuiman LA. 1995. Environmentally inducedvariation in elemental composition of red drum (Sciae-nops ocellatus) otoliths. Bulletin of Marine Science56:578–591.
Houde ED. 1989. Comparative growth, mortality, and ener-getics of marine fish larvae: temperature and latitudinaleffects.Fishery Bulletin U.S.87:471–495.
Hurlbert SH. 1984. Pseudoreplication and the design ofecological field experiments.Ecological Monographs54:187–211.
Høie H, Folkvord A, Johannessen A. 1999. Maternal, paternaland temperature effects on otolith size of young herring(Clupea harengusL.) larvae.Journal of ExperimentalMarine Biology and Ecology234:167–184.
Jobling M. 1995.Environmental biology of fishes. London:Chapman & Hall.
Johannessen A, Blom G, Folkvord A. 2000. Differences inotolith and somatic growth between spring and autumnspawned herring (Clupea harengusL.) larvae. Sarsia85:461–466.
Jørstad KE, King DPF, Nævdal G. 1991. Population structureof Atlantic herring, Clupea harengus L.Journal of FishBiology 39:43–52.
Limburg KE. 1996. Growth and migration of 0-year Americanshad (Alosa sapidissima) in the Hudson River estuary:otolith microstructural analysis.Canadian Journal ofFisheries and Aquatic Sciences53:220–238.
Midttun L. 1975. Observation series on surface temperatureand salinity in Norwegian coastal waters 1936–1970.Fisken og Havet Serie B1–51.
Moksness E. 1992. Validation of daily increments in the otolithmicrostructure of Norwegian spring spawning herring(Clupea harengusL.). ICES Journal of Marine Science49:231–235.
Moksness E, Fossum P. 1991. Distinguishing spring- andautumn-spawned herring larvae (Clupea harengusL.)by otolith microstructure.ICES Journal of MarineScience48:61–66.
Mosegaard H, Folkvord A, Wright PJ. 2002. V. Some uses ofindividual age data. B. Ecological applications. In:Panfili J, Troadec H, Pontual H. de, Wright PJ, editors.Manual of fish sclerochronology.Brest: Ifremer–IRDco-edition. 167–178.
Mosegaard H, Svedang H, Taberman K. 1988. Uncoupling ofsomatic and otolith growth rates in Arctic char (Salve-linus alpinus) as an effect of differences in temperatureresponse.Canadian Journal of Fisheries and AquaticSciences45:1514–1524.
Mosegaard H, Titus R. 1987. Daily growth rates of otolithsin yolk sac fry of two salmonid species at five differenttemperatures.Proceedings of the V Congress inEuropean Ichthyology, Stockholm.221–227.
Munk P, Heath M, Skaarup B. 1991. Regional and seasonaldifferences in growth of larval North Sea herring(Clupea harengusL.) estimated by otolith microstruc-ture analysis.Continental Shelf Research11:641–654.
Otterlei E, Folkvord A, Nyhammer G. 2002. Temperaturedependent otolith growth of larval and early juvenilecod (Gadus morhua).ICES Journal of Marine Science59:851–860.
Otterlei E, Nyhammer G, Folkvord A, Stefansson SO. 1999.Temperature and size dependent growth of larval andjuvenile cod (Gadus morhuaL.) – a comparative studybetween Norwegian coastal cod and Northeast Arcticcod. Canadian Journal of Fisheries and AquaticSciences56:2099–2111.
Secor DH, Dean JM. 1989. Somatic growth effects on theotolith–fish size relationship in young pond-rearedstriped bass,Morone saxatilis. Canadian Journal ofFisheries and Aquatic Sciences46:113–121.
Secor DH, Dean JM. 1992. Comparison of otolith-based back-calculation methods to determine individual growthhistories of larval striped bass,Morone saxatilis.Canadian Journal of Fisheries and Aquatic Sciences49:1439–1454.
Secor DH, Dean JM, Campana SE, editors. 1995.Recentdevelopments in fish otolith research. Columbia, SouthCarolina: University of South Carolina Press.
Sokal RR, Rohlf FJ. 1981.Biometry. San Francisco: W.H.Freeman and Co.
Stenevik EK, Fossum P, Johannessen A, Folkvord A. 1996.Identification of larvae of Norwegian spring spawningherring from spawning grounds off south-western Nor-way applying otolith microstructure analysis.Sarsia80:285–292.
van der Veer HW, Ellis T, Miller JM, Pihl L, Rijnsdorp AD.1997. Size selective predation on North Sea flatfish andpossible implications for recruitment. In: Chambers RC,Trippel EA, editors.Early life history and recruitmentin fish populations, Vol. 10. Fish and Fisheries Series,21. London: Chapman & Hall. 279–303.
Woodruff SD, Slutz RJ, Jenne RL, Steurer PM. 1987. Acomprehensive ocean–atmosphere data set.Bulletin ofAmerican Meteorological Society68:1239–1250.
Wright PJ. 1991. The influence of metabolic rate on otolithincrement width in Atlantic salmon parr,Salmo salarL.Journal of Fish Biology38:929–933.
Accepted 22 April 2004 – Printed 1 October 2004Editorial responsibility: Aril Slotte
310 Sarsia89:297-310 – 2004
Related Documents


![Een eeuw zeevisserij in BelgiëFebruari 2011 - 1 - Een eeuw zeevisserij in België... Haring [Clupea harengus] 1943 blijft in het geheugen van de Belgische visserij gegrift als hét](https://static.cupdf.com/doc/110x72/6115d174dbbf8a0dd37600d8/een-eeuw-zeevisserij-in-belgi-februari-2011-1-een-eeuw-zeevisserij-in-belgi.jpg)