Temperature dependence of transport spin polarization in NdNi 5 measured using Point Contact Andreev reflection Sourin Mukhopadhyay and Pratap Raychaudhuri a Department of Condensed Matter Physics and Materials Science, Tata Institute of Fundamental Research, Homi Bhabha Rd, Colaba, Mumbai 400005, India. and Devang A Joshi and C V Tomy Department of Physics, Indian Institute of Technology, Bombay, Powai, Mumbai 400076, Maharashtra, India We report a study in which Point contact Andreev reflection (PCAR) spectroscopy using superconducting Nb tip has been carried out on NdNi 5 , a ferromagnet with a Curie temperature of T C ~7.7K. The measurements were performed over a temperature range of 2-9K which spans across the ferromagnetic transition temperature. From an analysis of the spectra, we show that (i) the temperature dependence of the extracted value of transport spin polarization closely follows the temperature dependence of the spontaneous magnetization; (ii) the superconducting quasiparticle lifetime shows a large decrease close to the Curie temperature of the ferromagnet. We attribute the latter to the presence of strong ferromagnetic spin fluctuations in the ferromagnet close to the ferromagnetic transition temperature. 72.00.00, 73.23.Ad, 72.80.Ga, 74.80.Fp, 75.50.-y a electronic mail: [email protected]

Welcome message from author
This document is posted to help you gain knowledge. Please leave a comment to let me know what you think about it! Share it to your friends and learn new things together.
Transcript
Temperature dependence of transport spin polarization in NdNi5 measured using Point Contact Andreev reflection
Sourin Mukhopadhyay and Pratap Raychaudhuria
Department of Condensed Matter Physics and Materials Science, Tata Institute of
Fundamental Research, Homi Bhabha Rd, Colaba, Mumbai 400005, India.
and
Devang A Joshi and C V Tomy
Department of Physics, Indian Institute of Technology, Bombay, Powai, Mumbai
400076, Maharashtra, India
We report a study in which Point contact Andreev reflection (PCAR) spectroscopy using
superconducting Nb tip has been carried out on NdNi5, a ferromagnet with a Curie
temperature of TC~7.7K. The measurements were performed over a temperature range of
2-9K which spans across the ferromagnetic transition temperature. From an analysis of
the spectra, we show that (i) the temperature dependence of the extracted value of
transport spin polarization closely follows the temperature dependence of the
spontaneous magnetization; (ii) the superconducting quasiparticle lifetime shows a large
decrease close to the Curie temperature of the ferromagnet. We attribute the latter to the
presence of strong ferromagnetic spin fluctuations in the ferromagnet close to the
ferromagnetic transition temperature.
72.00.00, 73.23.Ad, 72.80.Ga, 74.80.Fp, 75.50.-y
aelectronic mail: [email protected]
Introduction
With the emergence of “spintronics” 1 the ability to manipulate electronic spin as well the
charge in a solid has gained particular significance. Central to the progress of this field is
the identification of novel ferromagnetic materials with large degree of spin polarization
which can be used as spin source in novel electronic devices, which will use both the
charge and spin of the electrons. In this context experimental determination of the spin
polarization (defined as ( )( ) ,
)(
)(
FF
FF
ENEN
ENENP
↓↑
↓↑
+−
= where ( )FEN↑ and )( FEN↓ are the spin
up and spin down density of states at Fermi level) in ferromagnets has gained particular
significance. Conventionally, two techniques have been widely used for the
determination of spin polarization in ferromagnetic materials. The first one, pioneered by
Meservey and Tedrow2 involves spin dependent tunneling from a ferromagnet to a
superconductor when the superconducting density of states is Zeeman split by the
application of a magnetic field. This technique involves the tedious process of fabricating
a tunnel junction and the need to apply a large perturbing magnetic field of several Telsa.
The second one, spin resolved photoemission3, relies on the measurement of spin of
electrons that emerge from the surface of a ferromagnet close to the Fermi level.
However, since the electrons measured in photoemission experiments emerge from a
depth of few angstroms to few tens of angstroms from the surface this technique is
extremely surface sensitive. More recently, a third technique, namely, Point Contact
Andreev Reflection (PCAR) spectroscopy4 has emerged as arguably one of the most
popular probes5,6,7,8,9,10,11,12 for the measurement of transport spin polarization in
ferromagnetic materials. This technique relies on the fact that the process of Andreev
reflection13, through which an electron incident on a normal metal/superconductor (N/S)
interface with energy less than the superconducting energy gap (∆) gets reflected back as
a hole in the opposite spin band of the metal, is strongly suppressed when the normal
metal electrode is a ferromagnet. The transport spin polarization is thus determined from
the analysis the conductance (G(V)) versus voltage (V) characteristics of a ballistic or
diffusive point contact established between a superconducting tip and the ferromagnet.
This technique has several advantages: It is simple to implement, does not require
fabrication of tunnel junctions and can be used for a wide variety of materials; it also
does not require the application of a magnetic field.
One obvious limitation of the PCAR technique is that the temperature range of
measurement is limited by the superconducting transition temperature of the
superconducting tip. The determination of spin polarization of ferromagnets is thus
typically carried out at temperatures which are two orders of magnitude lower than the
ferromagnetic transition temperature (TC) of most ferromagnets. Since much of the
practical interest is in the value of spin polarization close to room temperature, the bulk
spin polarization at elevated temperature is often estimated based on the assumption,
)()( TMTP s∝ , namely, that the spin polarization of the electrons close the Fermi level is
proportional to the spontaneous magnetization ( )(TM s ) of the ferromagnet14,15,16,17.
Though the spin polarization as a function of temperature has been measured using spin
polarized photoemission for a few ferromagnets,18,19 this simple relation has so far
remained experimentally unverified even for relatively simple ferromagnets20. The
experimental verification of this relation is important for two reasons. First, Ms is a bulk
property that depends on the total number difference of the up and down spin electrons,
whereas P is only sensitive to the electrons close to Fermi level; this intuitive relation is
thus based on a simplistic picture which is strictly valid only for free electron like
parabolic bands. Second, both PCAR and Meservey-Tedrow technique measure the spin
polarization in the transport current21 (Pt) rather than the spin polarization in the density
of states, which depends on a weighted average of the density of states and Fermi
velocity of the two spin bands. The transport spin polarization is given
by21( ) ( )( ) ( )
FS
n
kFS
n
k
FS
n
kFS
n
k
tvkNvkN
vkNvkNP
↓↓↑↑
↓↓↑↑
+
−=
)()(
)()(, where n=1 for a ballistic point contact, and
n=2 for diffusive point contact. It has been shown the spin polarization measured from
Meservey-Tedrow technique is identical to the diffusive point contact. It is not obvious
that the temperature dependence of the spin polarization extracted from these techniques
should follow Ms. However, since this relation forms the basis of much of the
experimental studies related to spin transport in a variety of spintronic materials it is
important to investigate if it holds good it in a typical ferromagnet.
In this paper, we report the PCAR studies carried out on NdNi5, a ferromagnet22,23,24 with
a TC~7.7K. Like most RNi5 (R=rare-earth) compounds, the moment primarily reside on
the Nd sites inducing a small moment on the Ni sites. The low TC of this material enables
us to extract the transport spin polarization (Pt) all the way up to TC by carrying out the
measurements using a finely cut superconducting Nb tip (superconducting transition
temperature, Tc=9.2K). The central result of this paper is that the temperature dependence
of Pt, in NdNi5 closely follows the temperature dependence of Ms, validating the
relation )()( TMTP s∝ . In addition, we observe a decrease of the superconducting
quasiparticle lifetime close to the ferromagnetic transition temperature. We attribute this
effect to the large spin fluctuation in the NdNi5 close to the critical temperature. This
hypothesis is further supported by PCAR measurements on 3 other systems: (i) The
ferromagnetic metal, Fe, for which the TC much higher than the temperature range of
measurements and therefore the effect of spin fluctuations are unimportant; and (ii) the
non-ferromagnetic metals25 YbFe4Sb12 and CaFe4Sb12 where detailed magnetic studies
show the evidence of large ferromagnetic spin fluctuations at low temperatures.
Experimental Details
Polycrystalline sample NdNi5 was prepared by repeated arc melting of the stoichiometric
amounts of the constituent elements on water cooled copper hearth in a purified argon
atmosphere. The button was flipped and re-melted several times to ensure the
homogeneity. Titanium button was used as an oxygen getter. The total weight loss during
the arc melting was less than 0.5% and hence the alloy compositions were assumed to
remain unchanged from the original stoichiometric ratios. Room temperature powder X-
ray diffraction pattern of the sample was obtained using Panalytical X-ray diffractometer
equipped with Cu-K radiation. In order to obtain the lattice parameters of the compound
and confirm its homogeneity to the accuracy of the X-ray pattern, a Rietveld refinement
using the FullProf program of the obtained XRD pattern was done. The resistivity (ρ) and
magnetization (M) of the sample was measured in the temperature range 3K-300K using
a home made resistivity setup and Quantum Design SQUID magnetometer respectively.
PCAR measurements were performed in the temperature range 2.4K to 9K in a
continuous flow He4 cryostat. The sample was polished to a mirror finish and loaded
immediately for experiment to avoid surface degradation. A mechanically cut sharp Nb
tip was brought in contact with the sample at low temperatures using a differential screw
arrangement and the conductance versus voltage characteristics of the contact was
measured using a 4-probe current modulation technique. Typical contact resistance in
these measurements ranged between 10-20Ω.
Results and Discussion
Figure 1 shows the Rietveld refinement of the X-ray pattern of NdNi5 which forms in a
CaCu5 type hexagonal structure with a space group P6/mmm. The excellent agreement
with the experimental diffraction pattern (deduced from the near zero difference plot)
confirms that the material is single phase. The obtained lattice parameters, a = 4.953 Å
and c = 3.967 Å are in agreement with the published reports22.
The magnetization versus temperature of the NdNi5 sample (shown in Figure 2(a))
measured at 500 Oe reveals a sharp ferromagnetic transition with TC~7.7K. The
resistivity (inset Figure 2(a)) also shows a pronounced anomaly at the same temperature.
Figure 2(b) shows the isothermal M-H curves recorded at various temperatures. The M-H
curve does not saturate up to 2.5T due to the large magnetocrystalline anisotropy in this
material. At low temperatures, Ms was estimated by linearly extrapolating the high field
slope of the M-H curve. The value of Ms at 2K (~1.68µB/f.u.), is much lower than the
expected saturation moment of 3.28µB for the free Nd3+ ion. This is due to crystal field
splitting of the 4f energy levels in Nd as has been shown in numerous previous
studies26,27. Above 6.6K the high field M-H curve was no longer linear. In this
temperature range Ms was estimated from the Arott plots (M2 vs. H/M) shown in Figure
2(c).
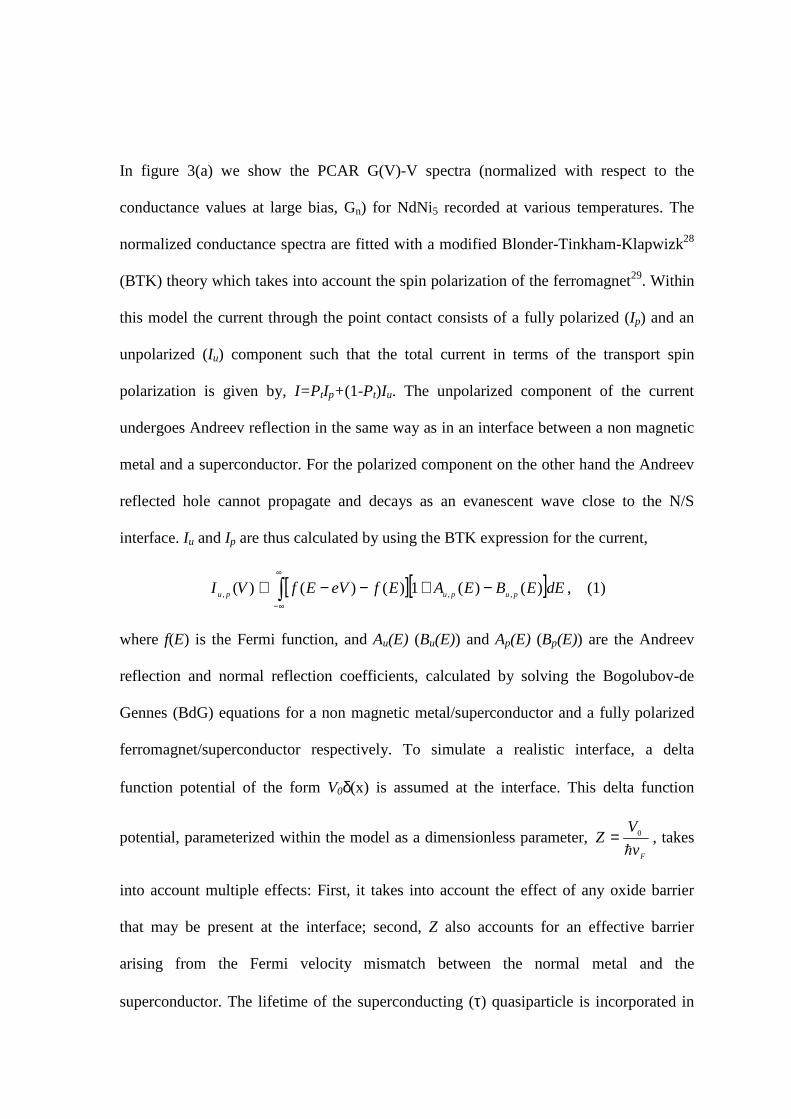
In figure 3(a) we show the PCAR G(V)-V spectra (normalized with respect to the
conductance values at large bias, Gn) for NdNi5 recorded at various temperatures. The
normalized conductance spectra are fitted with a modified Blonder-Tinkham-Klapwizk28
(BTK) theory which takes into account the spin polarization of the ferromagnet29. Within
this model the current through the point contact consists of a fully polarized (Ip) and an
unpolarized (Iu) component such that the total current in terms of the transport spin
polarization is given by, I=PtIp+(1-Pt)Iu. The unpolarized component of the current
undergoes Andreev reflection in the same way as in an interface between a non magnetic
metal and a superconductor. For the polarized component on the other hand the Andreev
reflected hole cannot propagate and decays as an evanescent wave close to the N/S
interface. Iu and Ip are thus calculated by using the BTK expression for the current,
[ ][ ]dEEBEAEfeVEfVI pupupu )()(1)()()( ,,, −+−−∝ ∞
∞−
, (1)
where f(E) is the Fermi function, and Au(E) (Bu(E)) and Ap(E) (Bp(E)) are the Andreev
reflection and normal reflection coefficients, calculated by solving the Bogolubov-de
Gennes (BdG) equations for a non magnetic metal/superconductor and a fully polarized
ferromagnet/superconductor respectively. To simulate a realistic interface, a delta
function potential of the form V0δ(x) is assumed at the interface. This delta function
potential, parameterized within the model as a dimensionless parameter, Fv
VZ
0= , takes
into account multiple effects: First, it takes into account the effect of any oxide barrier
that may be present at the interface; second, Z also accounts for an effective barrier
arising from the Fermi velocity mismatch between the normal metal and the
superconductor. The lifetime of the superconducting (τ) quasiparticle is incorporated in
this model by including a broadening parameter30 Γ (τ= ) while solving the BdG
equations. We have thus four fitting parameters: Pt, ∆, Γ and Z. In order to reduce the
number of free parameters we restrict ∆ to within 5% of its BCS value for Nb at all
temperatures. The resulting fit of the spectra at various temperatures is shown through
solid lines in Figure 3(a).
Figure 3(b) shows the extracted values of Pt of NdNi5 as a function of temperature.
While, in the absence of a detailed estimate of the elastic and inelastic mean free paths,
we cannot ascertain whether the contacts are in the ballistic or diffusive limit, the latter is
more likely since our sample has a relatively small residual resistivity ratio; i.e.
( )( ) 59.33
300 =K
K
ρρ
. In the same graph we also show the temperature variation of Ms. It can
be easily seen that the temperature variation of the two quantities is similar. To further
illustrate this point in the inset we plot Pt as a function of Ms. Barring temperatures very
close to TC where we see a small deviation the points fall on a straight line with zero
intercept corroborating the relation, )()( TMTP s∝ .
We now focus our attention on the temperature dependence of the other quantities,
namely, ∆, Γ and Z. The temperature variation of these three quantities extracted from the
fits in Fig.3 (a) is shown in Figure 3(c). We would like to note that all the spectra could
be fitted very well with the constraint on ∆ stated earlier, with ∆(T=0)=1.45meV. For
temperatures in the range 2.4K to 4K the spectra can be fitted without incorporating any
broadening parameter (Γ=0). Above 4K, Γ gradually increases and reaches a maximum
value of Γ=0.65meV at 8K which coincides with the TC of NdNi5. Above 8K, Γ decreases
reaching a value of Γ=0.16meV at 9K. The barrier parameter, Z, on the other hand
remains constant in the range 2.4K to 4K with a value of Z=0.27. Above 4K, Z increases
monotonically up to 8K and tends to saturate to a value of Z=0.635.
Before discussing the implications of these results we would first like to comment on the
reliability of the fits of the PCAR spectra, particularly at elevated temperatures. With
increasing temperature, PCAR spectra get gradually thermally smeared. At temperatures
greater than 8K the most dominant feature of the spectra, namely, the two peaks in the
conductance spectra associated with the superconducting energy gap gets smeared into
one broad peak. Since the saturation in the value of Z happens in this temperature range,
the fit of the spectra for T>8K need careful attention. To cross-check the reliability of our
fits in Figure 4 we show two fits of the same spectra taken at 8.5K: One fit with the
parameters shown in Figure 3(b)-(c) (solid line) and the second one (dashed line) where Z
is deliberately reduced and Γ is adjusted to obtain the best possible fit. Though the
parameters can be adjusted to reproduce the peak value in the normalized G(V) vs. V
curves in both cases the latter does not reproduce the width of the curve close to zero bias
(inset Figure 4). Nevertheless above 7.5K the uncertainty in the value of Z and
Γ significantly increases as shown in figure 3(c).
We now come to the significance of the temperature variation of Γ and Z. First we focus
on the temperature dependence of Γ. The increase in Γ, which peaks close to the critical
point of the ferromagnet signifies a corresponding decrease in quasiparticle lifetime at the
same temperature. It is known that ferromagnetic spin fluctuation in an s-wave
superconductor increases the singlet state repulsion31. Since ferromagnetic spin
fluctuation in NdNi5 is maximum at temperatures close to TC, it would be natural to
attribute the decrease in the superconducting quasiparticle lifetime to the proximity of the
superconductor to strong ferromagnetic spin fluctuation. We would however like to note
that, a self consistent solution of this problem should however also take into account the
corresponding decrease in ∆. At present we do not have a self consistent model to
incorporate this effect into our analysis. The temperature variation of Z on the other hand
is more complex to understand. It has been pointed out by several authors that in the
analysis of a ferromagnet/superconductor interface, Z implicitly incorporates much more
physics than a simple potential barrier at the interface. For a non-magnetic
metal/superconductor interface, Z is given by,32
r
rZZ i 4
)1( 2−+= , where r is ratio of the
Fermi velocity in the normal metal and the superconductor. The first term (Zi) arises from
a physical barrier arising from imperfect interface and oxide barrier and the second term
incorporates the effect of Fermi velocity mismatch between the normal metal and the
superconductor. In the case where the normal metal is a ferromagnet with different Fermi
velocity of the up and down spin band, the derivation of the second term is not
straightforward. In this case it is expected that the second term in Z would incorporate
the effect of an average potential barrier experienced by the Fermi velocity mismatch
between up and down spin electrons and the superconductor. As the temperature of the
ferromagnet is raised towards the ferromagnetic transition, the Fermi velocities of the up
(vF↑) and down (vF↓) spin bands gradually change due the reduction in exchange splitting
and eventually become equal at TC. The gradual change in Z from 4K to 8K and the
leveling off to a constant value above 8K suggests that this evolution in vF↑ and vF↓ is
reflected in the temperature dependence of Z. It is also expected that the ferromagnetic
spin fluctuations will have additional effects on Z. This issue is currently beyond the
scope of our paper ad needs to be explored theoretically.
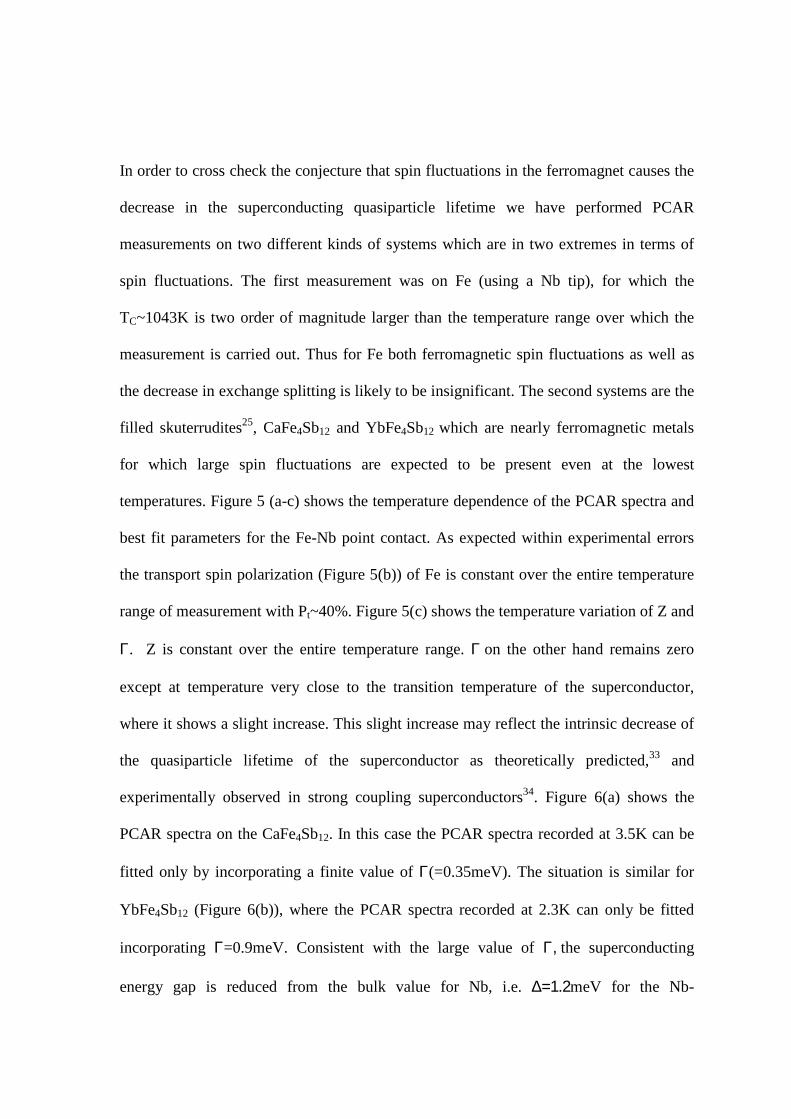
In order to cross check the conjecture that spin fluctuations in the ferromagnet causes the
decrease in the superconducting quasiparticle lifetime we have performed PCAR
measurements on two different kinds of systems which are in two extremes in terms of
spin fluctuations. The first measurement was on Fe (using a Nb tip), for which the
TC~1043K is two order of magnitude larger than the temperature range over which the
measurement is carried out. Thus for Fe both ferromagnetic spin fluctuations as well as
the decrease in exchange splitting is likely to be insignificant. The second systems are the
filled skuterrudites25, CaFe4Sb12 and YbFe4Sb12 which are nearly ferromagnetic metals
for which large spin fluctuations are expected to be present even at the lowest
temperatures. Figure 5 (a-c) shows the temperature dependence of the PCAR spectra and
best fit parameters for the Fe-Nb point contact. As expected within experimental errors
the transport spin polarization (Figure 5(b)) of Fe is constant over the entire temperature
range of measurement with Pt~40%. Figure 5(c) shows the temperature variation of Z and
Γ. Z is constant over the entire temperature range. Γ on the other hand remains zero
except at temperature very close to the transition temperature of the superconductor,
where it shows a slight increase. This slight increase may reflect the intrinsic decrease of
the quasiparticle lifetime of the superconductor as theoretically predicted,33 and
experimentally observed in strong coupling superconductors34. Figure 6(a) shows the
PCAR spectra on the CaFe4Sb12. In this case the PCAR spectra recorded at 3.5K can be
fitted only by incorporating a finite value of Γ(=0.35meV). The situation is similar for
YbFe4Sb12 (Figure 6(b)), where the PCAR spectra recorded at 2.3K can only be fitted
incorporating Γ=0.9meV. Consistent with the large value of Γ, the superconducting
energy gap is reduced from the bulk value for Nb, i.e. ∆=1.2meV for the Nb-
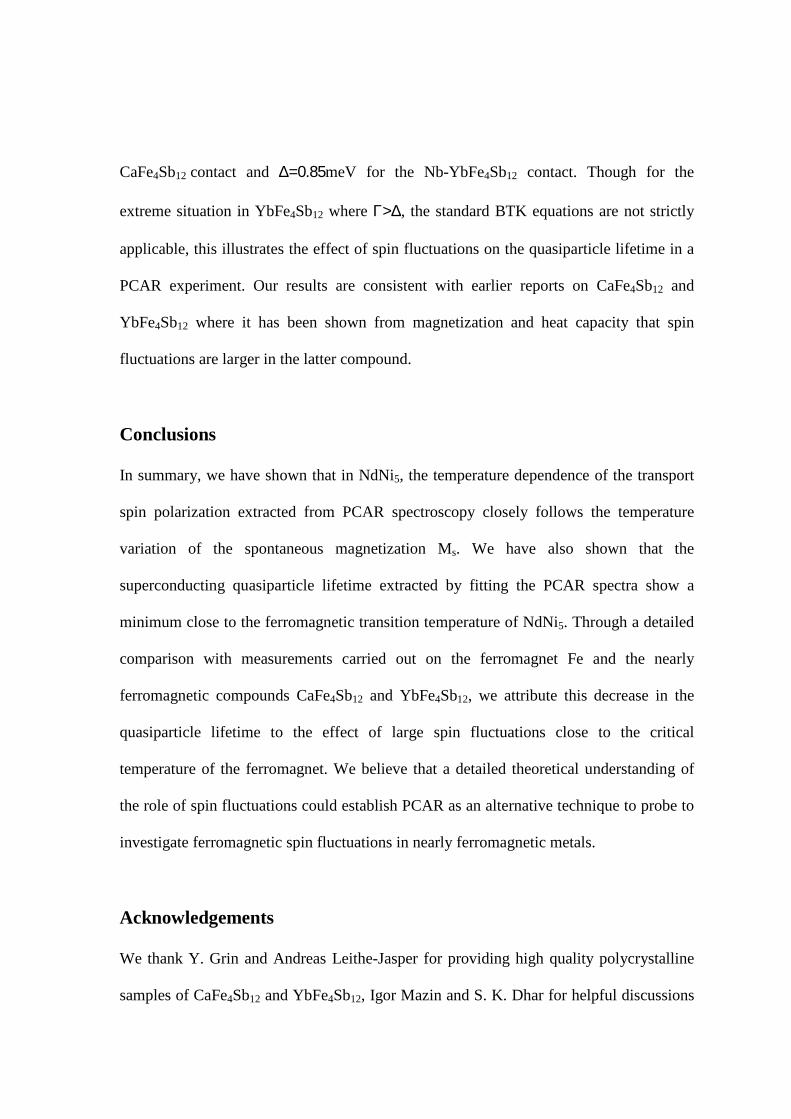
CaFe4Sb12 contact and ∆=0.85meV for the Nb-YbFe4Sb12 contact. Though for the
extreme situation in YbFe4Sb12 where Γ>∆, the standard BTK equations are not strictly
applicable, this illustrates the effect of spin fluctuations on the quasiparticle lifetime in a
PCAR experiment. Our results are consistent with earlier reports on CaFe4Sb12 and
YbFe4Sb12 where it has been shown from magnetization and heat capacity that spin
fluctuations are larger in the latter compound.
Conclusions
In summary, we have shown that in NdNi5, the temperature dependence of the transport
spin polarization extracted from PCAR spectroscopy closely follows the temperature
variation of the spontaneous magnetization Ms. We have also shown that the
superconducting quasiparticle lifetime extracted by fitting the PCAR spectra show a
minimum close to the ferromagnetic transition temperature of NdNi5. Through a detailed
comparison with measurements carried out on the ferromagnet Fe and the nearly
ferromagnetic compounds CaFe4Sb12 and YbFe4Sb12, we attribute this decrease in the
quasiparticle lifetime to the effect of large spin fluctuations close to the critical
temperature of the ferromagnet. We believe that a detailed theoretical understanding of
the role of spin fluctuations could establish PCAR as an alternative technique to probe to
investigate ferromagnetic spin fluctuations in nearly ferromagnetic metals.
Acknowledgements
We thank Y. Grin and Andreas Leithe-Jasper for providing high quality polycrystalline
samples of CaFe4Sb12 and YbFe4Sb12, Igor Mazin and S. K. Dhar for helpful discussions

and John Jesudasan, Vivas Bagwe and Subhash Pai for technical help. SM would like to
thank the TIFR Endowment Fund for partial financial support.
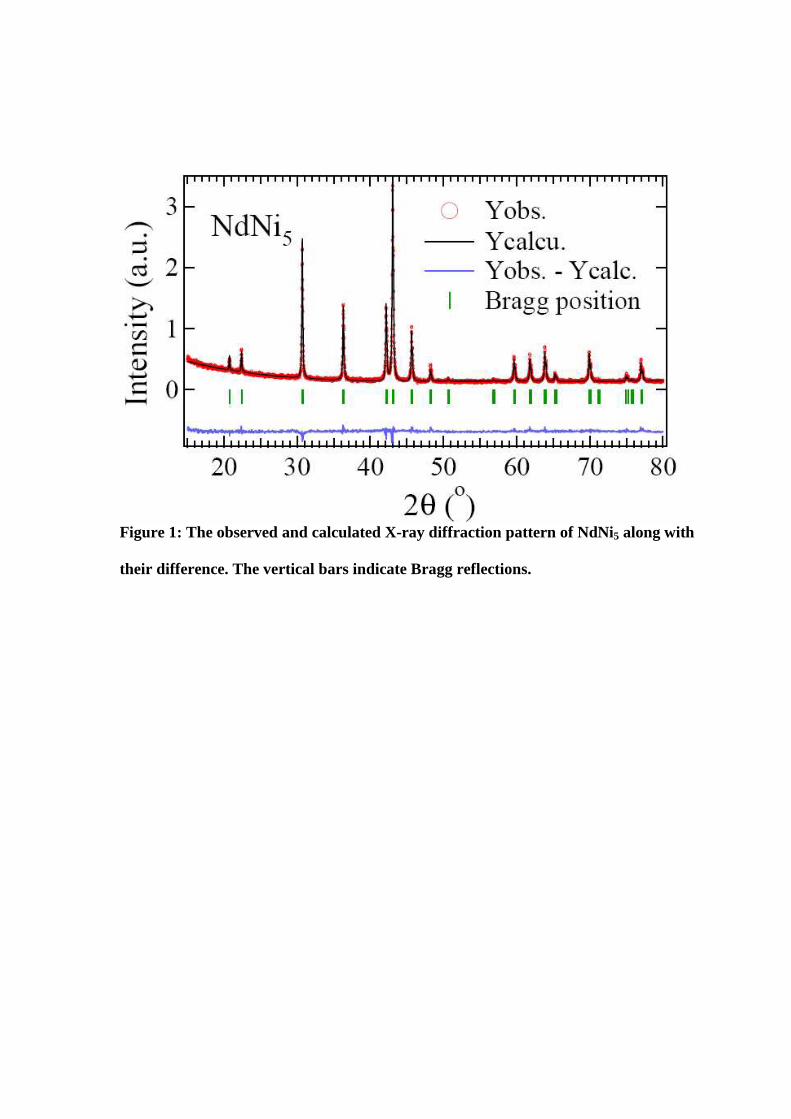
Figure 1: The observed and calculated X-ray diffraction pattern of NdNi5 along with
their difference. The vertical bars indicate Bragg reflections.
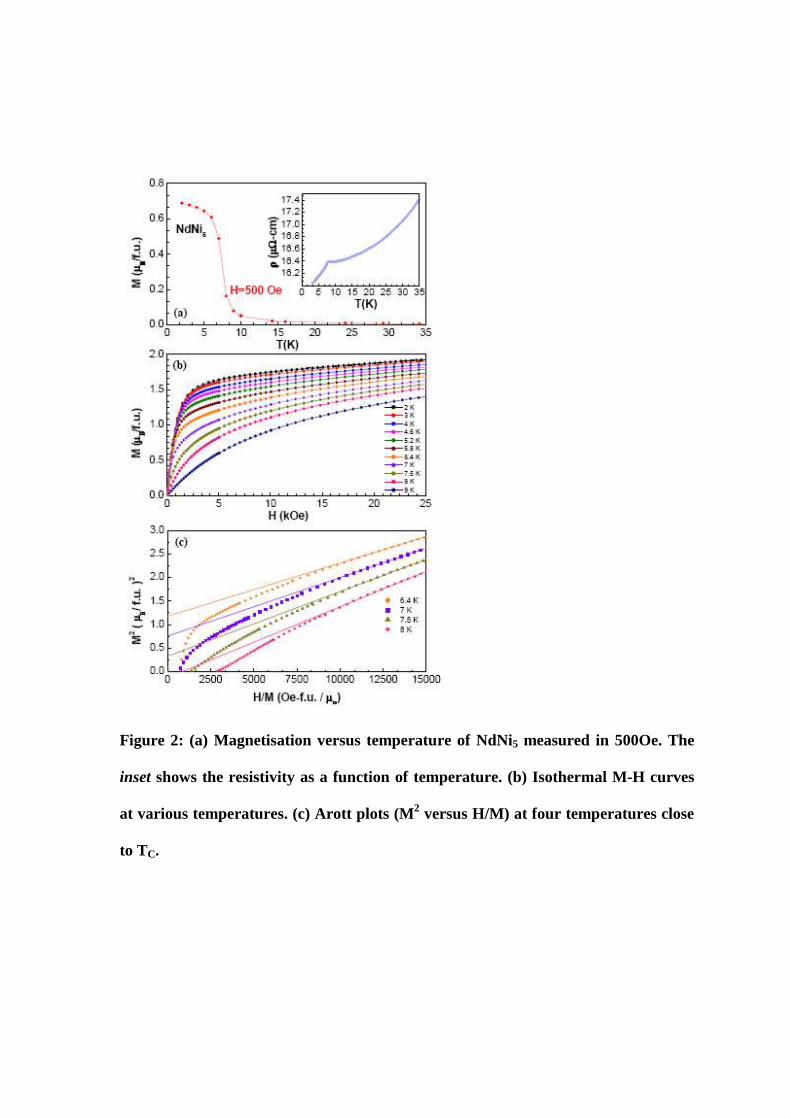
Figure 2: (a) Magnetisation versus temperature of NdNi5 measured in 500Oe. The
inset shows the resistivity as a function of temperature. (b) Isothermal M-H curves
at various temperatures. (c) Arott plots (M2 versus H/M) at four temperatures close
to TC.
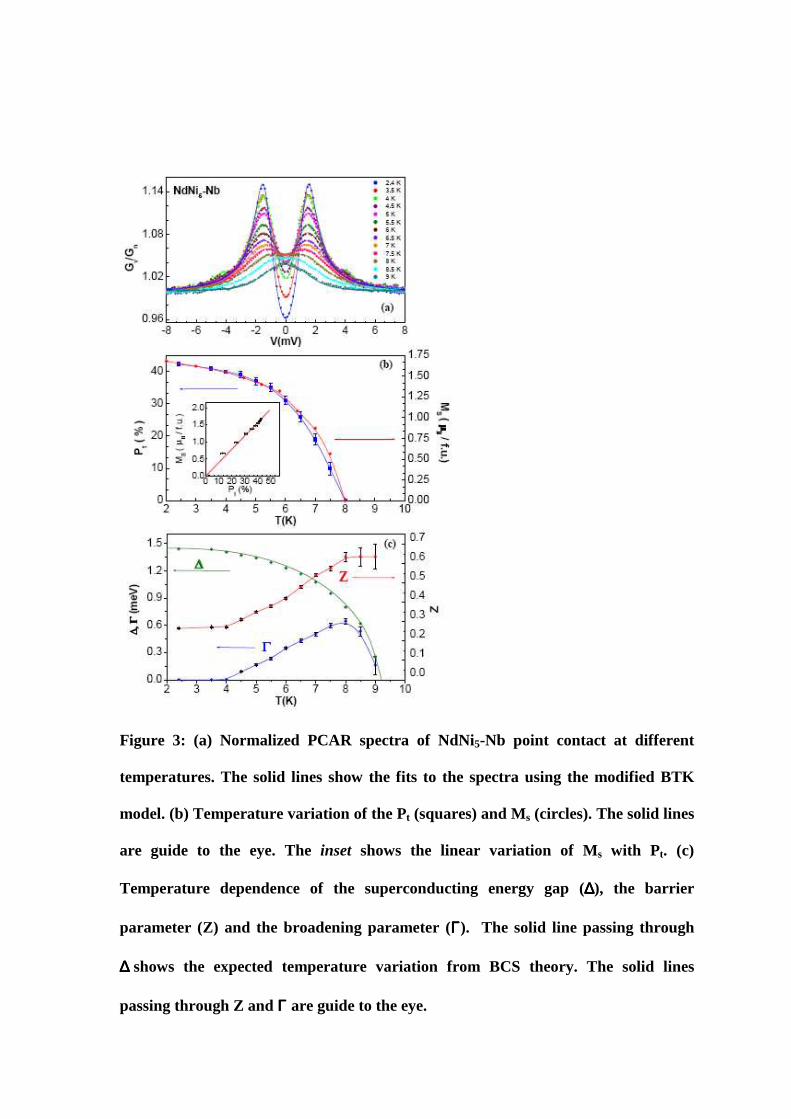
Figure 3: (a) Normalized PCAR spectra of NdNi5-Nb point contact at different
temperatures. The solid lines show the fits to the spectra using the modified BTK
model. (b) Temperature variation of the Pt (squares) and Ms (circles). The solid lines
are guide to the eye. The inset shows the linear variation of Ms with Pt. (c)
Temperature dependence of the superconducting energy gap (∆∆∆∆), the barrier
parameter (Z) and the broadening parameter (ΓΓΓΓ). The solid line passing through
∆ ∆ ∆ ∆ shows the expected temperature variation from BCS theory. The solid lines
passing through Z and Γ Γ Γ Γ are guide to the eye.
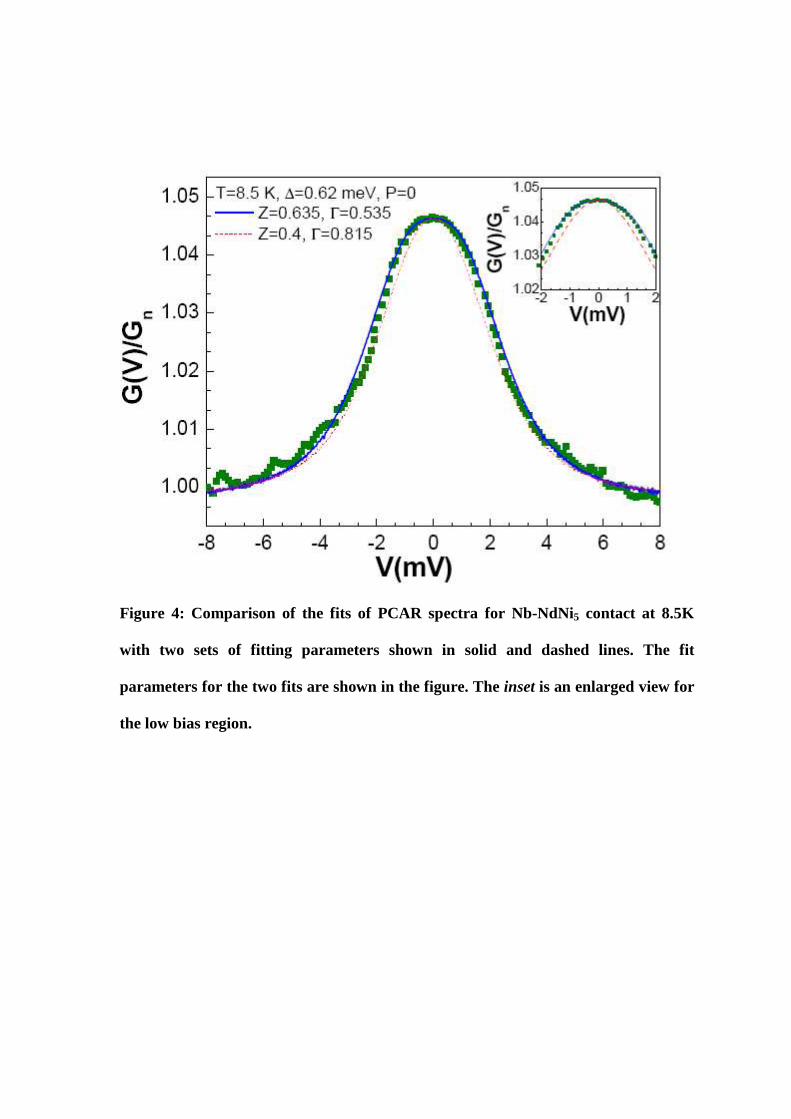
Figure 4: Comparison of the fits of PCAR spectra for Nb-NdNi5 contact at 8.5K
with two sets of fitting parameters shown in solid and dashed lines. The fit
parameters for the two fits are shown in the figure. The inset is an enlarged view for
the low bias region.
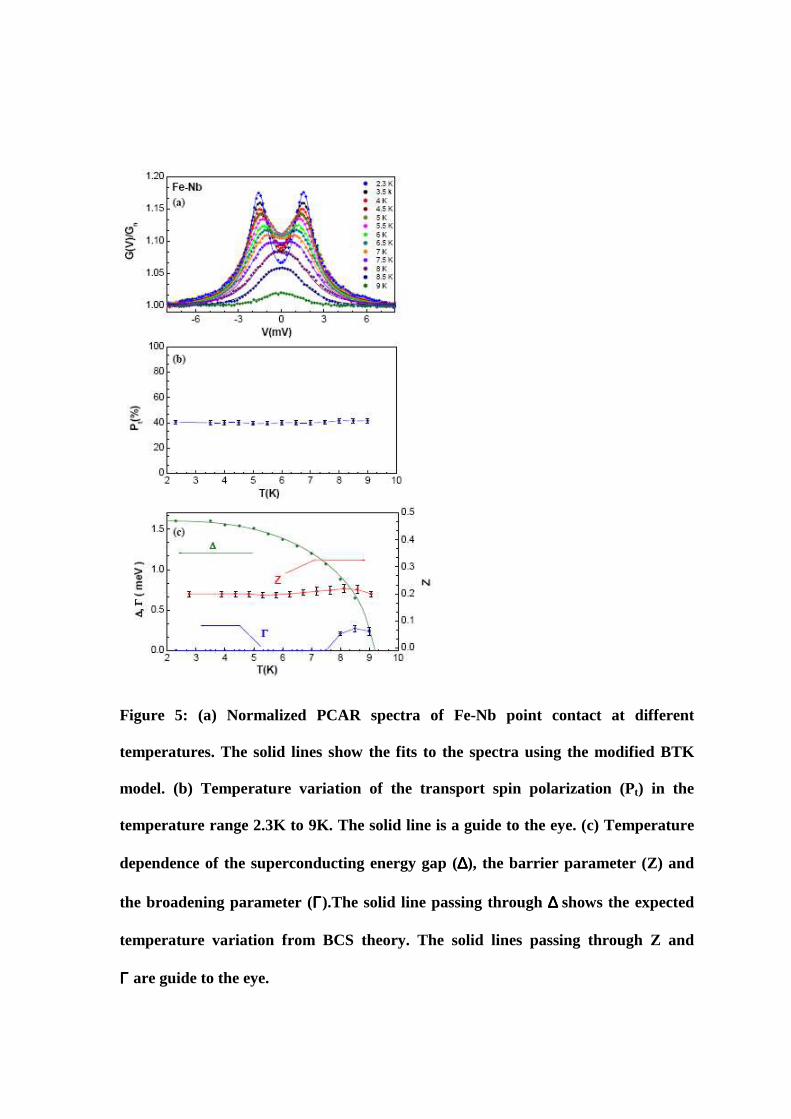
Figure 5: (a) Normalized PCAR spectra of Fe-Nb point contact at different
temperatures. The solid lines show the fits to the spectra using the modified BTK
model. (b) Temperature variation of the transport spin polarization (Pt) in the
temperature range 2.3K to 9K. The solid line is a guide to the eye. (c) Temperature
dependence of the superconducting energy gap (∆∆∆∆), the barrier parameter (Z) and
the broadening parameter (ΓΓΓΓ).The solid line passing through ∆ ∆ ∆ ∆ shows the expected
temperature variation from BCS theory. The solid lines passing through Z and
Γ Γ Γ Γ are guide to the eye.
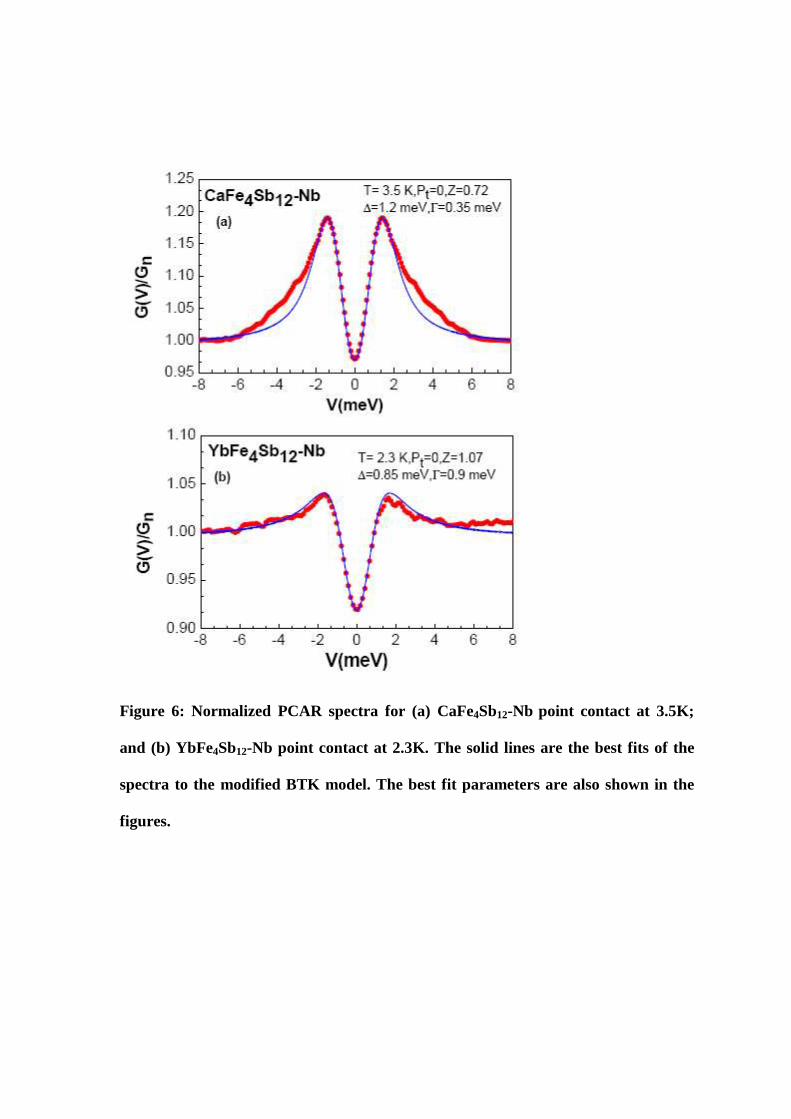
Figure 6: Normalized PCAR spectra for (a) CaFe4Sb12-Nb point contact at 3.5K;
and (b) YbFe4Sb12-Nb point contact at 2.3K. The solid lines are the best fits of the
spectra to the modified BTK model. The best fit parameters are also shown in the
figures.
1 Igor Zutic, Jaroslav Fabian, and S Das Sarma, Rev. Mod. Phys. 76, 323 (2004).
2 R Meservey and P M Tedrow, Phys. Rep. 238, 173 (1994); R Meservey and P M
Tedrow, Phys. Rev. Lett. 26, 192 (1971).
3 Peter D Johnson, Rep. Prog. Phys. 60, 1217 (1997).
4 R J Soulen, Jr, J M Byers, M S Osofsky, B Nadgorny, T Ambrose, S F Cheng, P R
Broussard, C T Tanaka, J Nowak, J S Moodera, A Barry, and J M D Coey, Science 282,
85 (1998); S K Upadhyay, A Palanisami, R N Louie, and R A Buhrman, Phys. Rev. Lett.
81, 3247 (1998).
5 Y Ji, G J Strijkers, F Y Yang, C L Chien, J M Byers, A Anguelouch, G Xiao, and A
Gupta, Phys. Rev. Lett. 86, 5585 (2001).
6 J M Valentine and C L Chien, J. Appl. Phys. 99, 08P902 (2006).
7 L Wang, K Umemoto, R M Wentzcovitch, T Y Chen, C L Chien, J G Checkelsky, J C
Eckert, E D Dahlberg, and C Leighton, Phys. Rev. Lett. 94, 056602 (2005).
8 S K Clowes, Y Miyoshi, Y Bugoslavsky, W R Branford, C Grigorescu, S A Manea, O
Monnereau, and L F Cohen, Phys. Rev. B 69, 214425 (2004).
9 R Panguluri, G Tsoi, B Nadgorny, S H Chun, N Samarth, and I I Mazin, Phys. Rev. B
68, 201307(R) (2003).
10 B Nadgorny, I I Mazin, M Osofsky, R J Soulen, Jr, P Broussard, R M Stroud, D J
Singh, V G Harris, A Arsenov, and Ya Mukovskii, Phys. Rev. B 63, 184433 (2001).
11 B Nadgorny, R J Soulen, Jr, M S Osofsky, I I Mazin, G Laprade, R J M van de
Veerdonk, A A Smits, S F Cheng, E F Skelton, and S B Qadri, Phys. Rev. B 61, R3788
(2000).
12 S Singh, G Sheet, P Raychaudhuri, and S K Dhar, Appl. Phys. Lett. 88, 022506
(2006); G Sheet, H Rosner, S Wirth, A Leithe-Jasper, W Schnelle, U Burkhardt, J A
Mydosh, P Raychaudhuri, and Y Grin, Phys. Rev. B 72, 180407(R) (2005); P
Raychaudhuri, A P Mackenzie, J W Reiner, and M R Beasley, Phys. Rev. B 67,
020411(R) (2003).
13 A F Andreev, Sov. Phys. JETP 19, 1228 (1964).
14 A H Davis, J M MacLaren, and P LeClair, J. Appl. Phys. 89, 7567 (2001).
15 Li-Ping Zhou, Sheng Ju, and Zhen-Ya Li, J. Appl. Phys. 95, 8041 (2004).
16 P Raychaudhuri, K Sheshadri, P Taneja, S Bandyopadhyay, P Ayyub, A K Nigam, R
Pinto, Sujeet Chaudhary, and S B Roy, Phys. Rev. B 59, 13919 (1999).
17 Sheng Ju and Zhen-Ya Li, J. Appl. Phys. 92, 5281 (2002).
18 K Maiti, M C Malagoli, A Dallmeyer, and C Carbone, Phys. Rev. Lett. 88, 167205
(2002).
19 J.-H. Park, E Vescovo, H.-J Kim, C Kwon, R Ramesh, and T Venkatesan, Phys. Rev.
Lett. 81, 1953 (1998).
20 V Garcia, M Bibes, A Barthelemy, M Bowen, E Jacquet, J.-P Contour, and A Fert,
Phys. Rev. B 69, 052403 (2004);
21 I I Mazin, Phys. Rev. Lett. 83, 1427 (1999).
22 K H J Buschow, Rep. Prog. Phys. 40, 1179 (1977).
23 V. M. T. S. Barthem, D Gignoux, A Nait-Saada, D Schmitt , and A Y Takeuchi, J.
Magn. Magn. Mater. 80, 142 (1989).
24 P J von Ranke, M A Mota, D F Grangeia, A M Carvalho, F C G Gandra, A A Coelho,
A Caldas, N A de Oliveira, and S Gama, Phys. Rev. B 70, 134428 (2004).
25 W Schnelle, A Leithe-Jasper, M Schmidt, H Rosner, H Borrmann, U Burkhardt, J A
Mydosh, and Y Grin, Phys. Rev. B 72, 020402(R) (2005).
26 M Reiffers, T Salonová, D Gignoux, and D Schmitt, Europhys. Lett. 45, 520 (1999).
27 N Marzouk, R S Craig, and W E Wallace, J. Phys. Chem. Solids 34, 15 (1973).
28 G E Blonder, M Tinkham, and T M Klapwijk, Phys. Rev. B 25, 4515 (1982).
29 I I Mazin, A A Golubov, and B Nadgorny, J. Appl. Phys. 89, 7576 (2001).
30 A Pleceník, M Grajcar, S Benacka, P Seidel, and A Pfuch, Phys. Rev. B 49, 10016
(1994).
31 N F Berk and J R Schrieffer, Phys. Rev. Lett. 17, 433 (1966).
32 G E Blonder and M Tinkham, Phys. Rev. B 27, 112 (1983).
33 S B Kaplan, C C Chi, D N Langenberg, J J Chang, S Jafarey, and D J Scalapino,
Phys. Rev. B 14, 4854 (1976).
34 R C Dynes, V Narayanamurti, and J P Garno, Phys. Rev. Lett. 41, 1509 (1978).
Related Documents