Temperature dependence of magnetic hysteresis Yongjae Yu and Lisa Tauxe Geosciences Research Division, Scripps Institution of Oceanography, 9500 Gilman Drive, Department 0220, La Jolla, California 92093-0220, USA ([email protected]; [email protected]) Bruce M. Moskowitz Institute for Rock Magnetism, University of Minnesota, 310 Pillsbury Drive SE, Minneapolis, Minnesota 55455, USA ([email protected]) [1] Hysteresis measurements have become a routine procedure in characterizing the magnetic remanence carriers of rocks. In this study we have investigated the temperature dependence of magnetic hysteresis in order to better recognize the dominant anisotropy and changes of domain state at various temperatures. Hysteresis properties have been measured at a series of temperatures between 20 K and 873 K for synthetic magnetites and natural (titano)magnetite-bearing samples. For synthetic samples and gabbros, shape anisotropy dominates most temperature ranges, while magnetocrystalline anisotropy controls hysteresis properties below 120 K. Titanomagnetite-bearing oceanic basalts show quite different behavior with much higher coercivity, resulting from prominent magnetostrictive anisotropy. While many factors such as composition, field treatment, grain shape and size, and stress affect hysteresis properties at various temperature ranges, a dominant anisotropy was better recognized when remanence ratio was plotted against coercivity. Components: 8845 words, 15 figures, 2 tables. Keywords: coercivity; day plot; hysteresis; magnetite; remanence ratio. Index Terms: 1518 Geomagnetism and Paleomagnetism: Magnetic fabrics and anisotropy; 1540 Geomagnetism and Paleomagnetism: Rock and mineral magnetism; 1599 Geomagnetism and Paleomagnetism: General or miscellaneous. Received 23 December 2003; Revised 5 April 2004; Accepted 30 April 2004; Published 19 June 2004. Yu, Y., L. Tauxe, and B. M. Moskowitz (2004), Temperature dependence of magnetic hysteresis, Geochem. Geophys. Geosyst., 5, Q06H11, doi:10.1029/2003GC000685. ———————————— Theme: Geomagnetic Field Behavior Over the Past 5 Myr 1. Introduction [2] In environmental magnetism and paleomagne- tism, measuring magnetic hysteresis has become a routine process in characterizing remanence car- riers of rocks. In general, values of M s (saturation magnetization), M r (saturation remanence), and B c (coercivity) are determined from hysteresis loops after appropriate nonferrimagnetic slope correction. On the other hand, values of B cr (coercivity of remanence) are obtained from back-field measure- ments. In practice, these parameters or their ratios provide useful information on the domain states and, by implication, the average grain size of the remanence carriers. [3] Knowledge of the temperature dependence of hysteresis properties is useful in deciphering G 3 G 3 Geochemistry Geophysics Geosystems Published by AGU and the Geochemical Society AN ELECTRONIC JOURNAL OF THE EARTH SCIENCES Geochemistry Geophysics Geosystems Article Volume 5, Number 6 19 June 2004 Q06H11, doi:10.1029/2003GC000685 ISSN: 1525-2027 Copyright 2004 by the American Geophysical Union 1 of 24

Welcome message from author
This document is posted to help you gain knowledge. Please leave a comment to let me know what you think about it! Share it to your friends and learn new things together.
Transcript

Temperature dependence of magnetic hysteresis
Yongjae Yu and Lisa TauxeGeosciences Research Division, Scripps Institution of Oceanography, 9500 Gilman Drive, Department 0220, La Jolla,California 92093-0220, USA ([email protected]; [email protected])
Bruce M. MoskowitzInstitute for Rock Magnetism, University of Minnesota, 310 Pillsbury Drive SE, Minneapolis, Minnesota 55455, USA([email protected])
[1] Hysteresis measurements have become a routine procedure in characterizing the magnetic remanence
carriers of rocks. In this study we have investigated the temperature dependence of magnetic hysteresis in
order to better recognize the dominant anisotropy and changes of domain state at various temperatures.
Hysteresis properties have been measured at a series of temperatures between 20 K and 873 K for synthetic
magnetites and natural (titano)magnetite-bearing samples. For synthetic samples and gabbros, shape
anisotropy dominates most temperature ranges, while magnetocrystalline anisotropy controls hysteresis
properties below 120 K. Titanomagnetite-bearing oceanic basalts show quite different behavior with much
higher coercivity, resulting from prominent magnetostrictive anisotropy. While many factors such as
composition, field treatment, grain shape and size, and stress affect hysteresis properties at various
temperature ranges, a dominant anisotropy was better recognized when remanence ratio was plotted
against coercivity.
Components: 8845 words, 15 figures, 2 tables.
Keywords: coercivity; day plot; hysteresis; magnetite; remanence ratio.
Index Terms: 1518 Geomagnetism and Paleomagnetism: Magnetic fabrics and anisotropy; 1540 Geomagnetism and
Paleomagnetism: Rock and mineral magnetism; 1599 Geomagnetism and Paleomagnetism: General or miscellaneous.
Received 23 December 2003; Revised 5 April 2004; Accepted 30 April 2004; Published 19 June 2004.
Yu, Y., L. Tauxe, and B. M. Moskowitz (2004), Temperature dependence of magnetic hysteresis, Geochem. Geophys.
Geosyst., 5, Q06H11, doi:10.1029/2003GC000685.
————————————
Theme: Geomagnetic Field Behavior Over the Past 5 Myr
1. Introduction
[2] In environmental magnetism and paleomagne-
tism, measuring magnetic hysteresis has become a
routine process in characterizing remanence car-
riers of rocks. In general, values of Ms (saturation
magnetization), Mr (saturation remanence), and Bc
(coercivity) are determined from hysteresis loops
after appropriate nonferrimagnetic slope correction.
On the other hand, values of Bcr (coercivity of
remanence) are obtained from back-field measure-
ments. In practice, these parameters or their ratios
provide useful information on the domain states
and, by implication, the average grain size of the
remanence carriers.
[3] Knowledge of the temperature dependence
of hysteresis properties is useful in deciphering
G3G3GeochemistryGeophysics
Geosystems
Published by AGU and the Geochemical Society
AN ELECTRONIC JOURNAL OF THE EARTH SCIENCES
GeochemistryGeophysics
Geosystems
Article
Volume 5, Number 6
19 June 2004
Q06H11, doi:10.1029/2003GC000685
ISSN: 1525-2027
Copyright 2004 by the American Geophysical Union 1 of 24

dominant anisotropy. In addition, changes of
domains structures at high/low temperatures can
be recognized and interpreted. Although the low-
temperature hysteresis properties of titanomagne-
tites have been extensively studied [Tucker, 1981;
Schmidbauer and Schembera, 1987; Argyle and
Dunlop, 1990; Hodych, 1990; Schmidbauer and
Keller, 1996; Moskowitz et al., 1997; Hodych et
al., 1998; Muxworthy, 1999; Ozdemir, 2000;
Kosterov, 2001, 2002; Smirnov and Tarduno,
2002; Ozdemir et al., 2002], the high-temperature
hysteresis properties of (titano)magnetites have
been relatively less studied [Levi and Merrill,
1978; Ozdemir and O’Reilly, 1981, 1982; Hartstra,
1982a, 1982b; Beske-Diehl and Soroka, 1984;
Dunlop, 1987;Heider et al., 1987; Bina and Prevot,
1989; Argyle and Dunlop, 1990; Schmidbauer and
Keller, 1994; Keller and Schmidbauer, 1999].
[4] In most previous studies, a systematic low- and
high-temperature hysteresis has not been mea-
sured. In this study we will investigate the temper-
ature dependence of hysteresis properties on well-
documented (titano)magnetites. The present study
was intended to report hysteresis measurements
made on the same magnetites at temperatures rang-
ing from low (20–30 K) to above the Curie tem-
perature (853 K) of magnetites. These data provide
valuable constraints on what the dominant anisot-
ropies at various temperatures for each sample are.
2. Samples and Experiments
[5] Seven synthetic powders were studied whose
mean grain sizes range from single domain (SD;
65 nm) to small multidomain (MD; 16.9 mm). A
brief summary of sample properties is presented in
Table 1 (see Yu et al. [2002] for detailed sample
description). For each grain size, three sets of
powders were prepared. The first set of powders is
0.5% by volume dispersions ofmagnetite in amatrix
of CaF2. These were vacuum sealed in quartz
capsules of 3 cm and annealed for 3 hours at 973 K
to stabilize the magnetic properties. After annealing,
samples were slowly cooled from 973 K because
rapid quenching may result in higher thermal
stresses. The quartz capsules were unsealed just
prior to hysteresis measurements. The second set
of powders is 0.5% by volume dispersions of
unannealed magnetite in a matrix of CaF2. The third
set consists of undispersed, pure magnetite powders.
[6] Natural samples were also studied: CG (Cor-
dova Gabbro, Ontario, Canada [Yu and Dunlop,
2002]); KM (Kometsuka basalts, Mt. Aso, Japan
[Yu, 1998]); MORB 1–7 (zero-age mid-oceanic
ridge basalts, East Pacific Rise [Gee and Kent,
1999]); SBG (submarine basaltic glass, ODP 807C
[Pick and Tauxe, 1993]); and TG-A and TG-B
(Tudor Gabbro, Ontario, Canada [Yu and Dunlop,
2001]) (Table 2). On the basis of previous studies,
we selected individual chips whose sister chips
yielded hysteresis ratios falling in various regions
in the Day plot [Day et al., 1977], spanning the
range from single domain, pseudo single domain
(PSD), multidomain, and superparamagnetic (SP).
In particular, MORB 1–7 represents subsamples
spaced every 5 mm with respect to the outer chilled
margin of a single pillow lava with MORB 1
representing a subsample nearest the chilled mar-
gin. We anticipate SP/SD behavior for MORB 1
and 2 and SD/PSD behavior for MORB 3–7 [see
Gee and Kent, 1999, Figure 5].
Table 1. Synthetic Samplesa
Powder d, mm q (Axial Ratio) n
4000 0.065 1.48 8845099 0.21 1.44 1300
Mapico 0.24 1.29 5325000 0.34 1.65 1262112978 0.44 1.33 10223006 1.06 1.62 1471112982 16.9 1.61 1618
aPowders 4000, 5000, 112978, 3006, and 112982 are from the
Wright Company. Powders 5099 and Mapico are the products of Pfizerand Mapico Companies. d is the estimated grain size, q is the averageaxial ratio, and n is the number of grains counted. Size distribution wasdetermined by counting individual grains from at least six differentSEM photos per powder. See Yu et al. [2002] for details.
Table 2. Natural Samplesa
Sample References TUB, �C
Basaltic Glass 1 300–520Cordova Gabbro 2 550–580Kometsuka Basalt 3 500–560
MORBs 4 160–360Tudor Gabbro 5 580
aTUB is the maximum unblocking temperatures from the thermal
demagnetization of sister specimens. References: 1, Pick and Tauxe[1993]; 2, Yu and Dunlop [2002]; 3, Yu [1998]; 4, Gee and Kent[1999]; 5, Yu and Dunlop [2001].
GeochemistryGeophysicsGeosystems G3G3
yu et al.: magnetic hysteresis 10.1029/2003GC000685
2 of 24

[7] As a sample selection process, room tempera-
ture hysteresis was measured for at least eight chips
per sample or per powder by using the alternating
gradient force magnetometer (AGFM) at Scripps.
For selected chips we have determined the temper-
ature dependence of hysteresis using low- and
high-temperature vibrating sample magnetometers
(VSMs). In addition, one set of low-temperature
hysteresis loops was measured using a Quantum
Design MPMS-2 SQUID magnetometer system.
All the temperature-dependent measurements were
carried out at the Institution for Rock Magnetism,
University of Minnesota.
[8] Hysteresis loops were measured in the peak
field of 1 T in field increments of 10 mT. The
signal averaging time was usually set to 200 ms,
but 1 s was used for weak samples. Hysteresis was
measured at various temperatures from 20 K to
873 K. These temperature ranges include the
Verwey transition Tv (119–121 K), room temper-
ature T0 (298 K), and the Curie point Tc (853 K)
of magnetite. In order to maintain thermal equilib-
rium, temperature was varied with a rate of 1�C per
6 s. Below T0, temperature intervals were 20 K,
whereas above T0 the temperature interval was
40 K. For a few samples of special interest, finer
temperature intervals were used.
[9] In most samples, hysteresis loops were not
entirely saturated, particularly at very low temper-
atures (<100 K). In this temperature range a
different nonferrimagnetic slope correction was
required. Among various correction techniques,
we followed an approach suggested by Kosterov
[2002]. Average values of Ms were estimated for
the interval of m0H = 0.75–0.95 T, where Ms varied
1–6%. Note that we used a saturation field of
m0H = 1 T. Despite this correction, underestimation
of Ms is unavoidable, resulting in overestimation of
squareness, as evidenced in some natural samples
whose Mr/Ms was higher than 0.5.
[10] For natural samples the same chips were
used for both low- and high-temperature mea-
surements. For these chips, low-temperature hys-
teresis was measured first, before subjecting them
to any high-temperature treatment. For synthetic
samples, different chips (but from the same
batch) were used for low- and high-temperature
runs.
[11] Synthetic samples and natural gabbros show
little sign of alteration during the high-temperature
experiments. We checked their reproducibility by
monitoring hysteresis during heating and cooling
cycles. None of these samples show more than 5%
discrepancy of their hysteresis parameters at a
given temperature. In particular, temperature de-
pendence of hysteresis for gabbros was monitored
through triple heating-cooling cycles from T0 to Tc,
yielding virtually indistinguishable outcomes. This
high thermal stability was anticipated because their
remanence carriers are elongated magnetites en-
capsuled within silicates [Yu and Dunlop, 2001,
2002]. However, basaltic samples show signs of
alteration during heat treatment. We usually mea-
sured the temperature dependence of hysteresis for
three chips of each natural sample. For basaltic
samples the best hysteresis results from the chip
that showed minimal alteration are presented.
[12] To compare our results with those in the
literature, Bcr was also measured. However, be-
cause it involves additional measurements separate
from the hysteresis loop measurement, Bcr was
obtained only for selected samples. All the hyster-
esis results are listed in Table A11 (low-temperature
results) and Table A2 (high-temperature results).
3. Results
3.1. Hysteresis Loops
[13] For convenience, all the measured loops or
estimated parameters will be compared to those at
room temperature. Representative examples of
hysteresis loops are presented in Figure 1. Al-
though the full hysteresis loop was measured, only
the trimmed portion of the descending loops for
�0.1 < m0H < 0.5 T is shown for clarity (Figure 1).
[14] For synthetic samples we used different chips
for low- and high-temperature measurements
(Figures 1a and 1b). For these samples, magneti-
zation is nearly saturated by 0.1 T as the temper-
1Auxiliary material is available at ftp://ftp.agu.org/apend/gc/2003GC000685.
GeochemistryGeophysicsGeosystems G3G3
yu et al.: magnetic hysteresis 10.1029/2003GC000685yu et al.: magnetic hysteresis 10.1029/2003GC000685
3 of 24

ature increases above T0. After passing Tc (853 K),
the loops become paramagnetic. For 240 nm mag-
netite, loops measured at 100 K and 140 K are
virtually indistinguishable despite the intervening
Verwey transition (Figure 1a). In contrast, loops for
16.9 mm magnetite at 100 K and at 140 K approach
saturation at slightly different rates (Figure 1b).
[15] Natural samples show a quite different behav-
ior. Most noticeably, the paramagnetic contribution
of the matrix is dominant for SBG and MORB
samples (Figures 1c and 1d), producing nearly
linear M-m0H behavior at low temperatures. In
addition, for MORB samples this type of behavior
extends throughout the entire temperature range of
600 K (Figure 1d).
3.2. High-Temperature Hysteresis:Synthetic Samples
[16] Typical temperature dependences of the hys-
teresis parameters (Ms, Mr, and Bc) are compared
Figure 1. Descending branches of hysteresis loops determined at various temperatures. For convenience, only thetrimmed portion, �0.1 < m0H < 0.5 T, is illustrated: (a) 240 nm magnetite, (b) 16.9 mm magnetite, (c) SBG (submarineoceanic basaltic glass), and (d) MORB-3 (mid-ocean ridge basalt, East Pacific Rise).
GeochemistryGeophysicsGeosystems G3G3
yu et al.: magnetic hysteresis 10.1029/2003GC000685
4 of 24
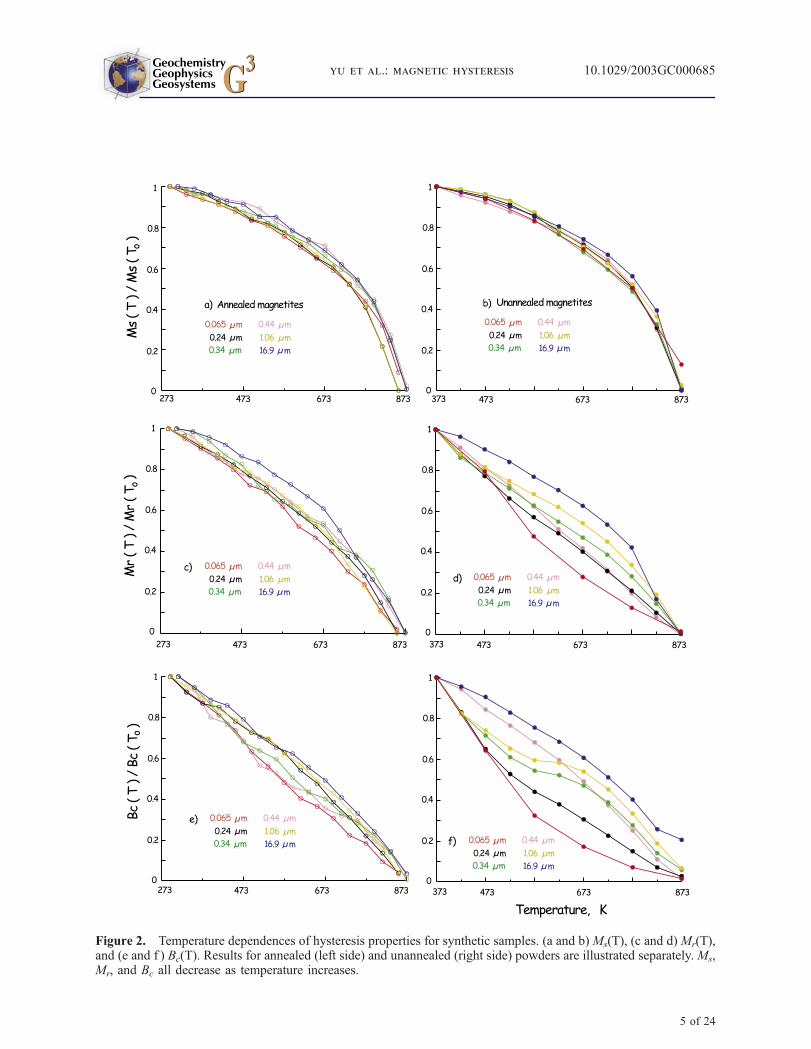
Figure 2. Temperature dependences of hysteresis properties for synthetic samples. (a and b) Ms(T), (c and d) Mr(T),and (e and f ) Bc(T). Results for annealed (left side) and unannealed (right side) powders are illustrated separately. Ms,Mr, and Bc all decrease as temperature increases.
GeochemistryGeophysicsGeosystems G3G3
yu et al.: magnetic hysteresis 10.1029/2003GC000685
5 of 24

for all the synthetic powders used in this study
(Figure 2). As expected, annealed (open symbols)
and unannealed (solid symbols) powders show
similar temperature dependence of Ms (Figures 2a
and 2b). Mr and Bc all decay more rapidly with
temperature than Ms (Figures 2c–2f). We also
observed that Mr decreases slightly less rapidly
than Bc in most samples. These observations agree
with those of Dunlop [1987] but are different from
those of Levi and Merrill [1978].
[17] Regardless of grain size, annealed samples
show a monotonic decay of Ms, Mr, and Bc
(Figure 2, left side). On the other hand, for unan-
nealed samples, finer grains show temperature
intervals of much more rapid decay of Mr and Bc
(Figure 2, right side).
[18] The squareness (=Mr/Ms) is a well-known
indicator of domain structure. The temperature
dependence of squareness is illustrated, showing
that smaller grains possess higher remanence over
the entire temperature range (Figure 3a). In a given
grain size, the annealed set maintains lower square-
ness than the unannealed set except for the SD
sample at high temperatures (Figure 3a). Bcr was
monitored only for the annealed magnetites. Tem-
perature dependence of Bcr is similar to that of Bc
(Figure 3b). In a Day diagram, hysteresis ratios
appear to migrate toward what is known as the MD
region as temperature increases (Figure 3c).
[19] We summarize our results in the squareness-
coercivity (SC) plot [Tauxe et al., 2002]. In an SC
plot, annealed and unannealed powders follow
slightly different paths (Figures 4a and 4b). Unan-
nealed magnetites sweep out broader regions be-
cause their initial squareness and coercivity at T0were larger owing to the effect of stress. In addi-
tion, most annealed samples show an inflection
near 813–833 K (Figure 4), below which square-
ness rapidly decreases toward the (super)paramag-
netic origin (zero remanence and zero coercivity).
3.3. High-Temperature Hysteresis:Natural Samples
[20] We plot the high-temperature hysteresis
parameters for natural samples in Figure 5. As
temperature increases, all the hysteresis parameters
Figure 3. (a) Examples of measured temperaturedependence of squareness. Except for 65 nm magnetiteat high temperatures, unannealed magnetite showshigher squareness. (b) Measured temperature depen-dence of Bcr for annealed powders. (c) A Day diagramfor annealed magnetites. Plus signs are the roomtemperature measurements.
GeochemistryGeophysicsGeosystems G3G3
yu et al.: magnetic hysteresis 10.1029/2003GC000685
6 of 24

decrease. Bc decays the most rapidly, followed by
Bcr and Mr, while Ms decays the least rapidly
(Figure 5). These trends are similar to those ob-
served in the synthetic magnetite samples. In
particular, basaltic samples show fairly rapid decay
for all their hysteresis parameters (Figures 5b, 5d,
5f, and 5h). In these samples, Ms decays almost
linearly with temperatures, while Bc, Bcr, and Mr
decay somewhat quasi-exponentially.
[21] Despite the distinctly different temperature de-
pendences between magnetite- and titanomagnetite-
bearing samples (Figure 5), they are quite similar
to each other in SC plots (Figures 6a and 6b)
and in Day diagrams (Figures 6c and 6d). In
general, results for MORBs reach slightly smaller
squareness than those for magnetite-bearing
samples and spread toward much higher coerciv-
ities (Figure 6b).
3.4. Low-Temperature Hysteresis:Synthetic Samples
3.4.1. Effect of Annealing, Field Cooling,and Volume Concentration
[22] It has been well documented that hysteresis
properties are dependent on many factors, such as
composition, field cooling, grain shape and size,
initial demagnetization states, stress, and volume
concentration. We used synthetic samples to inves-
tigate these effects. For 0.24 mm, 1.06 mm, and
16.9 mm magnetites, three sets (annealed 0.5%,
unannealed 0.5%, unannealed bulk) of magnetites
were subjected to temperature dependence of hys-
teresis under two different conditions, zero field
cooled (ZFC) and field cooled (FC) in a large field
of 1 T [Moskowitz et al., 1993]. As each sample is
cooled down to the next temperature interval, a 1 T
field was applied for the FC state. For the ZFC
state, the stray field was no more than 1 mT(J. Marvin, personal communication, 2003). Over-
all, for each grain size, six different data sets were
obtained (Figure 7).
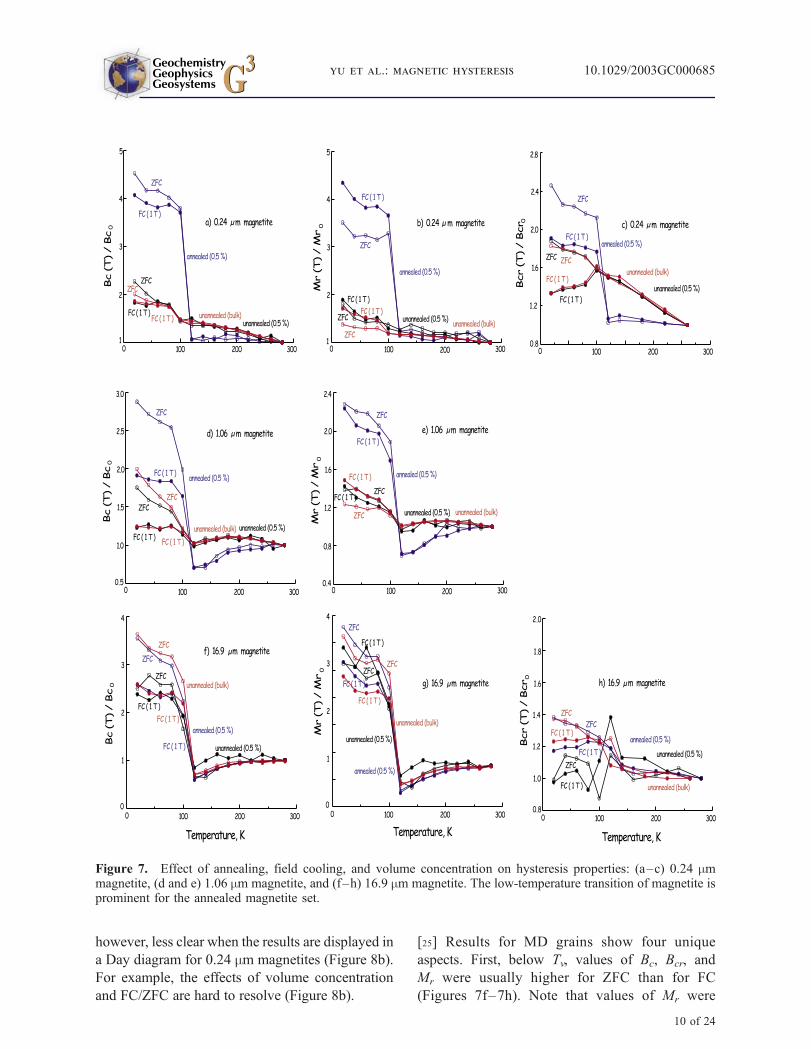
[23] For PSD samples, as temperature decreases,
annealed powders show a drastic increase in their
Bc, Bcr, and Mr below Tv (Figures 7a–7e). How-
ever, unannealed powders show rather small
increases in Bc and Mr. Furthermore, their increases
occur over a broad temperature range, compared to
the sharp increase near Tv for annealed samples.
Regardless of the annealing condition and volume
concentration, there is also an interesting trend that
increases in Bc are prominent in ZFC, while
increases in Mr are prominent in FC for submicron
magnetites (Figure 7). Bcr steadily increases as
temperature decreases to Tv and then Bc decreases
in further cooling (Figure 7c). The drastic increase
of Bcr below Tv for SD/PSD samples diminishes for
MD samples (Figure 7h).
Figure 4. Hysteresis results for synthetic magnetites in SC plots (a) for annealed magnetites and (b) for unannealedmagnetites. As the temperature increases, squareness and coercivity migrate toward the (super)paramagnetic origin ofzero remanence and zero coercivity.
GeochemistryGeophysicsGeosystems G3G3
yu et al.: magnetic hysteresis 10.1029/2003GC000685
7 of 24

Figure 5. Temperature dependences of hysteresis properties for natural samples. (a and b) Ms(T), (c and d) Mr(T),(e and f ) Bc(T), and (g and h) Bcr(T). Results for annealed (Figures 5a, 5c, 5e, and 5g) and unannealed (Figures 5b,5d, 5f, and 5h) powders are illustrated separately. Compared to the results for gabbros and volcanics, hysteresisparameters for oceanic basalts decay rapidly.
GeochemistryGeophysicsGeosystems G3G3
yu et al.: magnetic hysteresis 10.1029/2003GC000685
8 of 24

[24] In SC plots the effect of annealing, ZFC/FC,
and volume concentration on PSD magnetites is
clearly demonstrated (Figures 8a and 8c). The effect
of annealing reduces stress, giving rise to smaller
squareness. In particular, results for 0.24 mm and
1.06 mm are surprising (Figures 8a and 8c). Values
of squareness at T0 for the annealed samples lie in
the lower limit of PSD values (squareness equals
0.05), while those for unannealed powders lie at
0.23–0.38. In these powders, values of Bc for an-
nealed and unannealed samples at 30 K are different
by about a factor of 2. The absence of an applied
field during cooling through the Verwey transition
causes much higher coercivity but less remanence,
resulting in a different migration path with a steeper
route for FC (Figures 8a and 8c). Compared to other
factors, the effect of volume concentration makes
the least distinction for 0.24 mm and 1.06 mm(Figures 8a and 8c). Bulk unannealed powders show
higher squareness with slightly larger Bc than 0.5%
unannealed magnetites. The reported effects of
annealing [Lowrie and Kent, 1969; Dankers and
Sugiura, 1981] and volume concentration [Dankers
and Sugiura, 1981; Dankers, 1981; Schmidbauer
and Keller, 1994] at T0 are in good agreement with
our observations. All of these observations are,
Figure 6. Hysteresis results for natural gabbros and volcanics: (a) an SC plot, (b) a Day diagram, (c) an SC plot, and(d) a Day diagram for oceanic basalts. Plus signs are the room temperature measurements. Note that oceanic basalts(Figures 6c and 6d) spread toward higher coercivities than magnetite-bearing samples (Figures 6a and 6b).
GeochemistryGeophysicsGeosystems G3G3
yu et al.: magnetic hysteresis 10.1029/2003GC000685
9 of 24
however, less clear when the results are displayed in
a Day diagram for 0.24 mm magnetites (Figure 8b).
For example, the effects of volume concentration
and FC/ZFC are hard to resolve (Figure 8b).
[25] Results for MD grains show four unique
aspects. First, below Tv, values of Bc, Bcr, and
Mr were usually higher for ZFC than for FC
(Figures 7f–7h). Note that values of Mr were
Figure 7. Effect of annealing, field cooling, and volume concentration on hysteresis properties: (a–c) 0.24 mmmagnetite, (d and e) 1.06 mm magnetite, and (f–h) 16.9 mm magnetite. The low-temperature transition of magnetite isprominent for the annealed magnetite set.
GeochemistryGeophysicsGeosystems G3G3
yu et al.: magnetic hysteresis 10.1029/2003GC000685
10 of 24

Figure 8. The SC plots for (a) 0.24 mm, (c) 1.06 mm, and (d) 16.9 mm magnetites. The Day diagrams for (b) 0.24 mmand (e) 16.9 mm magnetites.
GeochemistryGeophysicsGeosystems G3G3
yu et al.: magnetic hysteresis 10.1029/2003GC000685
11 of 24
higher for submicron magnetites in FC condition
(Figures 7b and 7e). Second, in an SC plot,
results for unannealed 0.5% magnetite lie above
those for unannealed bulk powders, implying that a
higher volume concentration actually decreases
their MD remanence (Figure 8d). This trend is
exactly the opposite of that for PSD samples.
Third, the existence of an applied field during
cooling controls the temperature dependence of
hysteresis the most (Figure 8d). Fourth, as temper-
ature decreases, hysteresis parameters migrate
along a prograde-retrograde path (Figures 8d and
8e). They evolve toward a more MD-like region
(lower squareness and coercivity) to 120 K and
then migrate back up toward higher squareness
and coercivity below 120 K.
3.4.2. Temperature Dependence ofHysteresis Properties
[26] Temperature dependence of three hysteresis
parameters (Bc, Bcr, and Mr) is plotted in Figure 9.
All of the parameters were normalized to those
measured at T0. As temperature decreases, Bc and
Mr decrease slightly with minima near Tv for
1.06 mm and 16.9 mm magnetites, beyond which
both parameters abruptly jump to higher values.
However, submicron magnetites do not show a
steady decrease from T0 to 120 K. After the jumps
near 120 K, Bc, Bcr, and Mr steadily increase as
temperature decreases further. The magnitude of
the jumps near Tv shows no obvious grain size
dependence for all parameters (Figure 9). For all
annealed magnetites, jumps were higher for ZFC
states than for FC states for Bc (Figures 9a and 9b),
but exactly the opposite trend is observed for Mr
(Figures 9c and 9d). Temperature dependence of
Ms is not presented because Ms remained relatively
constant with only a slight increase at very low
temperatures. As a result, the temperature depen-
dence of Mr/Ms is mainly controlled by variation of
Mr (Figure 10).
[27] For the four selected powders (0.065 mm,
0.24 mm, 0.44 mm, and 16.9 mm), Bcr measurements
were carried out as well (Figures 9e and 9f ).
In traditional Day plots, hysteresis parameters
migrate toward higher values of squareness and
lower values for Bcr/Bc as temperature decreases
(Figures 10c and 10d). In a given grain size,
hysteresis results make no clear distinction between
ZFC versus FC except that values of FC reach
slightly higher squareness owing to the easy axis
bias during field cooling (Figures 10c and 10d).
[28] Much more rock magnetic information can be
deduced from SC plots (Figures 10a and 10b),
which reveal two intriguing trends. First, the evo-
lution of Bc shows a grain size dependence. An
MD grain covers <10 mT, while SD-PSD powders
span up to 30–60 mT. It is somewhat surprising
that this simple grain size dependence holds for
both ZFC and FC states (Figures 10a and 10b).
Second, for SD/PSD samples the hysteresis results
above Tv are very similar between FC and ZFC
states, but they diverge below Tv (Figure 10b).
Below Tv, ZFC data form a concave-down shape
(quadratic), while FC follows a concave-up shape
(parabolic). At a given temperature, FC data
achieve a higher remanence with a lower Bc than
ZFC (Figures 10a and 10b).
3.5. Low-Temperature Hysteresis:Natural Samples
[29] Temperature dependence of Bc, Bcr, andMr for
natural samples behaves quite differently than the
synthetic samples (Figure 11). Magnetite-bearing
gabbros show an increase of Bc and Mr below
110 K (Figures 11a, 11c, and 11e). However, the
jumps near 110 K are less prominent than those for
annealed synthetic samples and occur over a broad
temperature range. For Cordova Gabbro (CG), the
results for ZFC and FC are virtually identical,
indicating that exposure to applied fields during
cooling makes no impact (Figures 11a and 11c).
[30] Results from submarine basaltic glass (SBG)
and MORBs are different. First of all, as temper-
ature decreases, the hysteresis parameters continu-
ously increase over the entire temperature range
without showing any sudden jumps (Figures 11b,
11d, and 11f ). Second, some samples show 20 to
80 times increase of Bc (Figure 11b). Thermal
blocking of SP grains into SD states would explain
this large increase.
[31] We measured Bcr for SBG, five MORBs, and
TG-A. In Day plots, two distinct trends are shown
GeochemistryGeophysicsGeosystems G3G3
yu et al.: magnetic hysteresis 10.1029/2003GC000685
12 of 24

Figure 9. Temperature dependences of hysteresis properties for annealed synthetic samples: (a and b) Bc(T), (c andd) Mr(T), and (e and f ) Bcr(T). Results for zero field cooled (Figures 9a, 9c, and 9e) and field cooled (Figures 9b, 9d,and 9f ) are illustrated separately. The 0.24 mm magnetite shows the largest increase of hysteresis properties below120 K.
GeochemistryGeophysicsGeosystems G3G3
yu et al.: magnetic hysteresis 10.1029/2003GC000685
13 of 24

(Figures 12b and 12d). The results for TG-
A fall along the typical PSD-MD trend, while
those for MORBs follow the trend of SP+SD
mixture. Such a difference was anticipated be-
cause natural samples used in this study have
different grain sizes as well as different compo-
sition. These trends are also visible in SC plots
(Figures 12a and 12c). Results from CG have
maximum coercivity of 70 mT at 30 K. On the
other hand, results for SBG and MORBs follow a
different path with surprisingly high coercivity. In
MORB samples a Bc of 100 mT is quite common
Figure 10. Hysteresis results for synthetic annealed samples: (a) an SC plot for ZFC, (b) an SC plot for FC,(c) a Day diagram for ZFC, and (d) a Day diagram for FC. Note that zero-field-cooled and field-cooled data setsfollow different paths on SC plots, which is hardly recognizable in conventional Day plots.
GeochemistryGeophysicsGeosystems G3G3
yu et al.: magnetic hysteresis 10.1029/2003GC000685
14 of 24

Figure 11. Temperature dependences of hysteresis properties for natural samples: (a and b) Bc(T), (c and d) Mr(T),and (e and f ) Bcr(T). Results for gabbros (Figures 11a, 11c, and 11e) and oceanic basalts (Figures 11b, 11d, and 11f )are illustrated separately. Because of gigantic scale difference, results for MORBs are illustrated as insets.
GeochemistryGeophysicsGeosystems G3G3
yu et al.: magnetic hysteresis 10.1029/2003GC000685
15 of 24
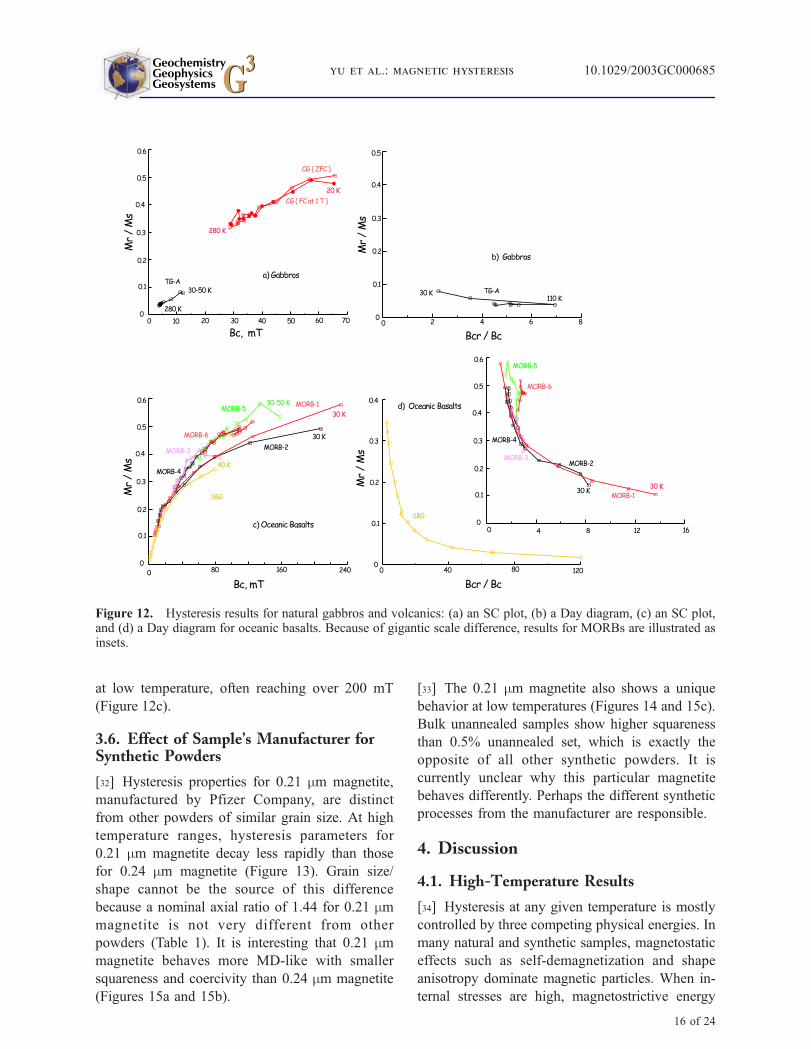
at low temperature, often reaching over 200 mT
(Figure 12c).
3.6. Effect of Sample’s Manufacturer forSynthetic Powders
[32] Hysteresis properties for 0.21 mm magnetite,
manufactured by Pfizer Company, are distinct
from other powders of similar grain size. At high
temperature ranges, hysteresis parameters for
0.21 mm magnetite decay less rapidly than those
for 0.24 mm magnetite (Figure 13). Grain size/
shape cannot be the source of this difference
because a nominal axial ratio of 1.44 for 0.21 mmmagnetite is not very different from other
powders (Table 1). It is interesting that 0.21 mmmagnetite behaves more MD-like with smaller
squareness and coercivity than 0.24 mm magnetite
(Figures 15a and 15b).
[33] The 0.21 mm magnetite also shows a unique
behavior at low temperatures (Figures 14 and 15c).
Bulk unannealed samples show higher squareness
than 0.5% unannealed set, which is exactly the
opposite of all other synthetic powders. It is
currently unclear why this particular magnetite
behaves differently. Perhaps the different synthetic
processes from the manufacturer are responsible.
4. Discussion
4.1. High-Temperature Results
[34] Hysteresis at any given temperature is mostly
controlled by three competing physical energies. In
many natural and synthetic samples, magnetostatic
effects such as self-demagnetization and shape
anisotropy dominate magnetic particles. When in-
ternal stresses are high, magnetostrictive energy
Figure 12. Hysteresis results for natural gabbros and volcanics: (a) an SC plot, (b) a Day diagram, (c) an SC plot,and (d) a Day diagram for oceanic basalts. Because of gigantic scale difference, results for MORBs are illustrated asinsets.
GeochemistryGeophysicsGeosystems G3G3
yu et al.: magnetic hysteresis 10.1029/2003GC000685
16 of 24

can be important. Magnetostriction is the variation
in the dimensions of a magnetic grain under the
influence of the applied field. Magnetocrystalline
anisotropy is the least important factor at higher
temperatures for (titano)magnetite because of its
rapid decay with temperature. Magnetocrystalline
energy is the difference between two magnetic
energies acquired along the easy and hard axes of
the crystal. In general, we anticipate that shape
anisotropy would dominate for synthetic samples
because all the samples have axial ratios greater
than 1.3 (Table 1).
[35] The dominant anisotropy at higher temper-
atures has been recognized by estimating a power
law dependence of Bc with Ms [see Dunlop, 1987,
and references therein]. For dominant magneto-
crystalline and magnetoelastic anisotropy, Bc varies
as l/Ms and K/Ms [Fletcher and O’Reilly, 1974;
Moskowitz, 1993], where l is the magnetoelastic
constant and K is the magnetocrystalline constant.
On the other hand, Bc follows the trend of Ms(T)
for dominating shape anisotropy. For example, land K vary as Ms(T) to the power of 2.5 and 8–9
for magnetites [Klapel and Shive, 1974; Moskowitz
et al., 1993]. In Fe2.4Ti0.6O4, l and K decrease as
Ms3 (T) and Ms
6 (T) [Moskowitz et al., 1993; Sahu
and Moskowitz, 1995].
[36] The temperature dependence of Bc and Mr
shows interesting trends for unannealed magnetites
(Figures 2d and 2f ). Unannealed samples show a
Figure 13. Comparison of temperature dependences of hysteresis for 0.21 mm (Pfizer Company) and 0.24 mm(Mapico Company) magnetites: (a) Ms(T), (b) Mr(T), (c) Bc(T), and (d) Bcr(T). Two magnetites behave quitedifferently, strongly suggesting that the consistency in sample preparation is as important as physical properties ofmagnetites.
GeochemistryGeophysicsGeosystems G3G3
yu et al.: magnetic hysteresis 10.1029/2003GC000685
17 of 24

pronounced grain size dependence. As grain size
decreases, Bc and Mr decay more rapidly. For
annealed magnetites, Bc = Ms1.8 � Ms
2.2, indicating
that the shape anisotropy as well as the effect of
thermal fluctuation [Dunlop, 1977] are important
factors controlling Bc. The increasing contribution
of stress is responsible for the higher power de-
pendence of unannealed magnetites. In particular,
Bc of unannealed SD magnetite shows significantly
higher power dependence of Ms, Bc = Ms5.4.
[37] In SC plots, hysteresis parameters of annealed
and unannealed samples migrate along different
paths as temperature increases (Figure 4). First, at a
given temperature, annealed samples show lower
squareness and coercivity than the unannealed set,
resulting from their reduced stress, with the excep-
tion of 0.44 mm magnetite. Second, annealed sam-
ples exhibit an inflection near 813–833 K, below
which squareness decreases less rapidly than unan-
nealed powders (Figure 4).
[38] Following a flattened path on an SC diagram
is anticipated for shape-anisotropy-dominated sam-
ples. For PSD samples, values of Mr/Ms can be
approximated by Mr = Hc/N, where N is a self-
demagnetizing factor. When shape anisotropy
dominates, Hc and Ms vary with temperature with
the same power. By combining these two relations,
we get a nearly constant squareness for the entire
range of Bc. This simple approximation holds most
of the temperature range for annealed magnetites,
where magnetostrictive contribution is minimal
(Figure 4a). The final dive into the origin above
813–833 K can be attributed as an increasing
contribution of thermal fluctuation, rendering
formerly stable remanence transforming into SP
(Figures 4a and 4b).
[39] Results for natural samples clearly demonstrate
that hysteresis properties of magnetite-carrying
samples have quite different temperature depend-
ences than those for titanomagnetite-bearing sam-
ples (Figure 5). All of the hysteresis parameters
decay rapidly for MORBs. It is interesting that
Bc, Mr, and Ms for TG-A (Mr/Ms = 0.10 at T0)
decay less rapidly than those for TG-B (Mr/Ms =
0.51 at T0). Rapidly decaying hysteresis param-
eters for finer grains were also observed for
unannealed synthetic samples (Figures 2b, 2d,
and 2f ). This observation should be taken into
account in future rock magnetic theories and
micromagnetic modeling.
[40] Temperature dependence of Ms for MORBs
indicates that samples are oxidizing as we increase
temperatures (Figure 5b). Despite this limitation, in
SC plots, results for titanomagnetite-bearing
MORBs form the trends of slightly smaller rema-
nence with much higher coercivity than those for
Figure 14. Effect of annealing, field cooled, and volume concentration on hysteresis properties of 0.21 mmmagnetites: (a) Bc(T) and (b) Mr(T).
GeochemistryGeophysicsGeosystems G3G3
yu et al.: magnetic hysteresis 10.1029/2003GC000685
18 of 24
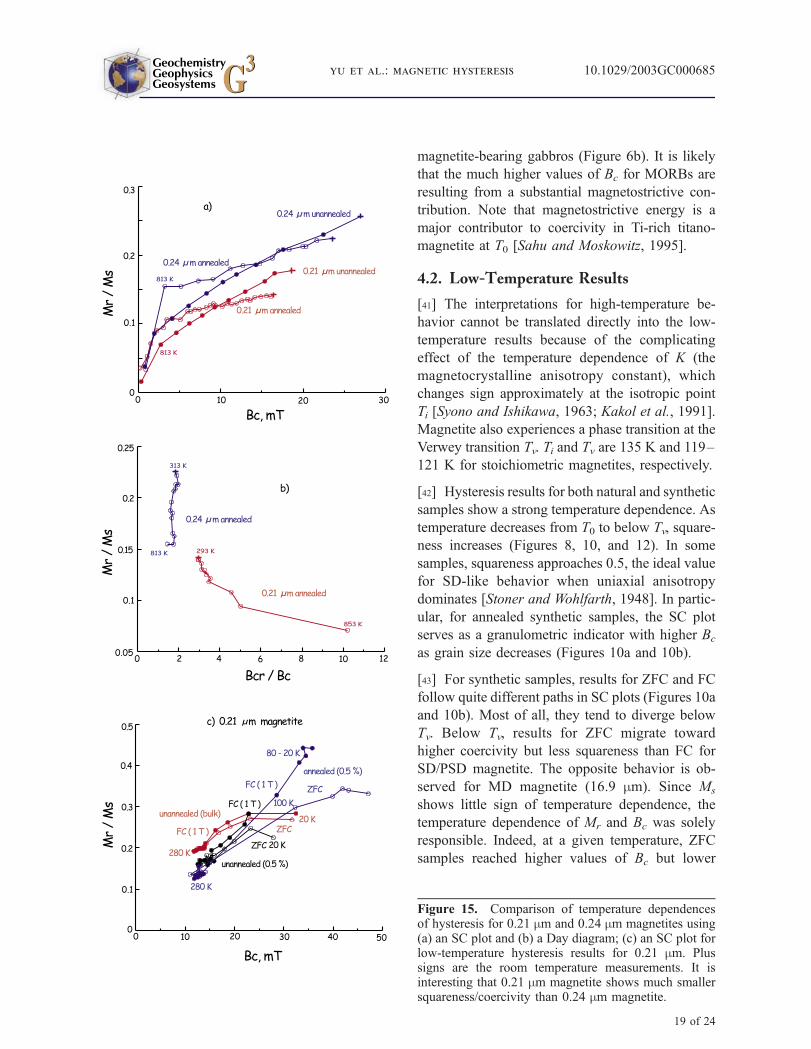
magnetite-bearing gabbros (Figure 6b). It is likely
that the much higher values of Bc for MORBs are
resulting from a substantial magnetostrictive con-
tribution. Note that magnetostrictive energy is a
major contributor to coercivity in Ti-rich titano-
magnetite at T0 [Sahu and Moskowitz, 1995].
4.2. Low-Temperature Results
[41] The interpretations for high-temperature be-
havior cannot be translated directly into the low-
temperature results because of the complicating
effect of the temperature dependence of K (the
magnetocrystalline anisotropy constant), which
changes sign approximately at the isotropic point
Ti [Syono and Ishikawa, 1963; Kakol et al., 1991].
Magnetite also experiences a phase transition at the
Verwey transition Tv. Ti and Tv are 135 K and 119–
121 K for stoichiometric magnetites, respectively.
[42] Hysteresis results for both natural and synthetic
samples show a strong temperature dependence. As
temperature decreases from T0 to below Tv, square-
ness increases (Figures 8, 10, and 12). In some
samples, squareness approaches 0.5, the ideal value
for SD-like behavior when uniaxial anisotropy
dominates [Stoner and Wohlfarth, 1948]. In partic-
ular, for annealed synthetic samples, the SC plot
serves as a granulometric indicator with higher Bc
as grain size decreases (Figures 10a and 10b).
[43] For synthetic samples, results for ZFC and FC
follow quite different paths in SC plots (Figures 10a
and 10b). Most of all, they tend to diverge below
Tv. Below Tv, results for ZFC migrate toward
higher coercivity but less squareness than FC for
SD/PSD magnetite. The opposite behavior is ob-
served for MD magnetite (16.9 mm). Since Ms
shows little sign of temperature dependence, the
temperature dependence of Mr and Bc was solely
responsible. Indeed, at a given temperature, ZFC
samples reached higher values of Bc but lower
Figure 15. Comparison of temperature dependencesof hysteresis for 0.21 mm and 0.24 mm magnetites using(a) an SC plot and (b) a Day diagram; (c) an SC plot forlow-temperature hysteresis results for 0.21 mm. Plussigns are the room temperature measurements. It isinteresting that 0.21 mm magnetite shows much smallersquareness/coercivity than 0.24 mm magnetite.
GeochemistryGeophysicsGeosystems G3G3
yu et al.: magnetic hysteresis 10.1029/2003GC000685
19 of 24

values of Mr than FC (1 T) (Figure 9). These trends
are universal for all SD/PSD grains for both
annealed and unannealed samples (Figures 7–10).
A similar FC/ZFC dependence was reported for
synthetic PSD magnetites [Kosterov, 2001, 2002;
Smirnov and Tarduno, 2002].
[44] Below Tv, the only physical difference be-
tween ZFC and FC is the easy axis bias in the
FC state. On cooling through Tv, one of the cube
edges of the high-temperature cubic phase becomes
the monoclinic c axis, which is also the new
magnetic easy axis. When an applied field is
present during cooling through Tv, the field restricts
the c axis to the one of the three cube edges closest
to the direction of the applied field. As a result of
the restricted choice, the FC sample achieves
higher remanence. However, its soft Bc is difficult
to explain. One explanation is the existence of
ordered monoclinic twins, rendering domain walls
less likely to move [e.g., Kosterov, 2002]. But then,
this would make Bc harder.
[45] Existence of a monoclinic twin phase is also
unclear. Recent advances in imaging techniques
based on magnetic force microscopy [Moloni et al.,
1996], synchrotron radiation X-ray maps [Medrano
et al., 1999], or Bragg diffraction [Baruchel et al.,
2001] generally confirm the existence of a mono-
clinic phase. However, these imaging results were
obtained from millimeter-sized magnetites, limiting
their generalization on submicron magnetites [see
also Kosterov, 2002]. In fact, the smallest size of
magnetite where the formation of twin domains has
been cited is above 5 mm [Medrano et al., 1999].
Detection of monoclinic twin domains for sub-
micron magnetite is a necessary step in solving
this puzzle.
[46] It is anticipated that annealing reduces stress,
giving rise to much lower squareness and Bc at T0.
Results follow the prediction over the entire
temperature range studied (Figures 7 and 8).
Increasing the volume concentration leads to
stronger interaction, resulting in an increase in
squareness as well as Bc (Figures 7 and 8).
However, this trend is reversed for 16.9 mmmagnetites (Figure 8d), indicating that interaction
is less important for MD. Another surprise is the
existence of a dichotomy between ZFC and FC
regardless of annealing condition or volume con-
centration (Figure 8).
[47] The 16.9 mm magnetite is quite unique in four
respects, two of which have already been discussed
but are summarized briefly. First, it shows higher
values of Bc andMr for ZFC to below Tv (Figures 7f
and 7g). Second, the increase of volume concen-
tration decreased squareness and Bc (Figures 8d
and 8e). Third, a small dip at Tv is visible for all
16.9 mm magnetite, regardless of their annealed
states and volume concentration (Figures 7f and
7g), suggesting that annealing was ineffective in
eliminating stress. Note also that the increase of Bc
and Mr for 16.9 mm at below Tv was not as
significant as those for PSD samples. Fourth, both
in SC plots and in Day diagrams, hysteresis param-
eters migrate toward the MD region (lower rema-
nence and coercivity) at first and then migrate in
the opposite direction (Figures 8d and 8e). A
steady decrease of Bc and Mr while maintaining
equal Ms at 300–160 K causes apparent migrations
toward MD state.
[48] What is the dominant anisotropy at low tem-
peratures? On the basis of the axial ratios (i.e.,
greater than 1.3) for synthetic samples, a dominant
shape anisotropy was expected over other com-
peting anisotropies. Because shape anisotropy is
mainly dependent on Ms, which is almost temper-
ature independent at low temperatures, shape an-
isotropy would be hardly temperature dependent.
Both Bc and Mr were indeed nearly constant for
submicron magnetites from T0 to 120 K, indicat-
ing a dominant shape anisotropy (Figure 9). How-
ever, Bc and Mr decreased on cooling from T0 to
120 K for 1.06 mm and 16.9 mm, reaching a
minimum at 120 K, following a sudden jump
below 120 K.
[49] All of our synthetic PSD magnetites show
drastic increases of Bc and Mr below Tv (Figures 7
and 9). Two observations are particularly interest-
ing. First, Bc and Mr show a drastic jump near Tvnot near Ti, where values of cubic K change sign
and become zero. Second, values of Bc remained
almost constant near Ti even though K1 approaches
zero. Among possible sources of anisotropy ener-
GeochemistryGeophysicsGeosystems G3G3
yu et al.: magnetic hysteresis 10.1029/2003GC000685
20 of 24

gies, temperature dependence of the cubic and
monoclinic magnetocrystalline anisotropy con-
stants [Syono and Ishikawa, 1963; Abe et al.,
1976; Kakol et al., 1991] fits our results the best
in terms of the magnitude of jumps for Bc and Mr.
The magnetocrystalline anisotropy becomes much
larger than the shape anisotropy only at Tv, despite
the fact that K1 (cubic) becomes zero at Ti. For the
temperature intervals between Tv and Ti, shape
anisotropy is still dominating. Note that tempera-
ture dependence of the cubic and monoclinic
magnetocrystalline constants shows a drastic jump
on cooling through Tv [e.g., see Abe et al., 1976].
Overall, for PSD samples, shape anisotropy con-
trols the hysteresis properties in the cubic phase
(above Ti). As the temperature decreases, this cubic
phase first experiences a substantial change at Ti,
but at Tv the large increase in magnetocrystalline
anisotropy becomes the controlling factor.
[50] Unfortunately, this interpretation works only
for magnetite-bearing samples. Hysteresis results
for MORBs lack a low-temperature Verwey tran-
sition but show continuous increases of Bc, Bcr, and
Mr as temperature decreases (Figure 11). In these
samples a strong thermal dependence of magneto-
strictive energy is responsible for their different
behavior [Moskowitz et al., 1998; Kosterov, 2002].
In addition, quenching from SP to SD is another
likely source that changes their magnetic properties
drastically (Figure 11).
[51] Results for CG offer another mystery in our
understanding of hysteresis behavior. Contrary to
synthetic samples, there is no difference between
ZFC and FC in Bc and Mr (Figures 11a and 11c).
At first glance it is likely that a high aspect ratio of
magnetites in CG [Yu and Dunlop, 2002] is re-
sponsible for this interesting behavior. However,
this is at odds with the recent theoretical modeling
[Carter-Stiglitz et al., 2002], which shows a rem-
anence transition at Tv even for an infinitely
elongated grain. An alternative solution would be
a compositional difference since even small
amounts of nonstoichiometry or minor cations
would suppress Tv while hardly affecting Tc. In-
tensive microprobing on CG magnetites detected
combined minor elements (Si and Mg) of no more
than 2% [Yu and Dunlop, 2002], which might help
to suppress the Verwey transition and explain the
remanence results (Figure 11).
4.3. SC Plots Versus Day Diagrams
[52] Following Day et al. [1977], it is now com-
mon to plot the remanence ratio or squareness
(Mr/Ms) versus the coercivity ratio (Bcr/Bc). In
some cases the Day plot has diagnosed different
domain states such as MD, PSD, SD, SP, or
mixtures of them [Day et al., 1977; Gee and Kent,
1995, 1999; Tauxe et al., 1996; Dunlop, 2002a,
2002b; Fabian, 2003; Lanci and Kent, 2003]. In
spite of these successes, there still exist data
sets that are beyond the scope of conventional
interpretation (e.g., Figure 4) [Tauxe et al.,
2002]. This ambiguity results mostly from the
fact that hysteresis properties are controlled by
many competing factors, such as composition,
grain size, grain shape, and stress.
[53] To overcome this uncertainty and to better
display hysteresis properties, especially when
there is more than an order of magnitude variation
on the values of Bc or Bcr in a given data set,
other plotting schemes were developed by replac-
ing Bcr/Bc with either Bc or Bcr, namely, a
squareness-coercivity (SC) plot or a squareness-
remanence coercivity (SRC) plot [Kent and Gee,
1996]. By using an SC plot [Kent and Gee, 1996;
Dunlop et al., 1997; Xu et al., 1998; Tauxe and
Love, 2003] or SRC plot [Kent and Gee, 1996;
Carlut and Kent, 2002], complicated hysteresis
properties were better explained. A combined
version of the SC and SRC plots was three-
dimensionally drawn by plotting squareness
versus Bc versus Bcr [Borradaile and Lagroix,
2000a, 2000b; Borradaile and Hamilton, 2003;
Lagroix and Borradaile, 2000].
[54] The SC plot earned rigorous scientific mean-
ing when physical rationale was provided [Tauxe et
al., 2002]. The SC plot is advantageous over the
Day plot in two senses. First, the SC plot can
clearly diagnose not only grain size but also
dominant anisotropy. Second, the SC plot is easier
to obtain because Bcr determination is not needed.
Note that determination of Bcr from the hysteresis
loop directly rather than from a separate back-field
GeochemistryGeophysicsGeosystems G3G3
yu et al.: magnetic hysteresis 10.1029/2003GC000685
21 of 24

experiment is often ambiguous and has yielded
different outcomes depending on the experimental
procedures [von Dobeneck, 1996; Fabian and von
Dobeneck, 1997].
[55] It is surprising that an SC plot without Bcr
measurements offers much more information than
a Day diagram (Figures 4, 6, 8, 10, 12, and 15).
This is particularly noticeable when hysteresis
results were compiled for all grain sizes of syn-
thetic samples (Figures 4 and 10). A clear dichot-
omy between ZFC and FC results disappears on a
Day diagram (Figures 10c and 10d). A difference
between titatomagnetite- and magnetite-bearing
samples is better resolved in an SC plot (Figure 4).
The effects of volume concentration and FC/ZFC are
also better recognized in SC plots (Figure 8). Why is
the Day plot disadvantaged? It is because Bc and Bcr
share a similar temperature dependence. When their
ratios are used, the Day plot masks important rock
magnetic information.
5. Conclusions
[56] Magnetic hysteresis has been used as a
primary indicator of domain state in magnetic
samples. Temperature dependence of magnetic
hysteresis has been investigated to better constrain
the dominant anisotropy and changes of domain
state at various temperatures. For the magnetite-
bearing samples used in this study, hysteresis
properties were mainly controlled by shape anisot-
ropy in most temperature ranges. However, other
competing anisotropies contributed at two different
temperature ranges. At temperature intervals below
120 K, magnetocrystalline anisotropies are mostly
responsible for the significant increase of Bc and
Mr. A strong magnetostrictive anisotropy is respon-
sible for quite different hysteretic behavior of
titanomagnetite-bearing samples.
Acknowledgments
[57] Jeff S. Gee generously donated a large collection of
MORBs for use in this study. We thank Mike Jackson, Jim
Marvin, and Peat Solheid of the Institution for Rock Magnet-
ism (IRM) for their help with the measurements. Funding for
the IRM is provided by the Keck Foundation, the National
Science Foundation, Earth Sciences Division, and the Univer-
sity of Minnesota. Dennis Kent and two anonymous referees
provided helpful reviews. This research was supported by NSF
grant EAR0229498 to L. Tauxe and N. Bertram.
References
Abe, K., Y. Miyamoto, and S. Chikazumi (1976), Magneto-
crystalline anisotropy of low-temperature phase of magnet-
ite, J. Phys. Soc. Jpn., 41(6), 1894–1902.
Argyle, K., and D. J. Dunlop (1990), Low-temperature and
high-temperature hysteresis of small multidomain magnetites
(215–540 nm), J. Geophys. Res., 95, 7083–7096.
Baruchel, J., E. Boller, J. I. Espeso, H. Klein, C. Medrano,
J. Nogues, E. Pernot, and M. Schlenker (2001), Bragg-
diffraction imaging of magnetic crystals with third-generation
synchrotron radiation, J. Magn. Magn. Mater., 233, 38–47.
Beske-Diehl, S., and W. L. Soroka (1984), Magnetic properties
of variably oxidized pillow basalts, Geophys. Res. Lett., 11,
217–220.
Bina, M. M., and M. Prevot (1989), Thermomagnetic investi-
gations of titanomagnetite in submarine basalts: Evidence for
differential maghemitization, Phys. Earth Planet. Inter., 54,
169–179.
Borradaile, G. J., and T. Hamilton (2003), Limestones distin-
guished by magnetic hysteresis in three-dimensional projec-
tions, Geophys. Res. Lett., 30, 1973, doi:10.1029/
2003GL017892.
Borradaile, G. J., and F. Lagroix (2000a), Magnetic fabric
interpretation com plicated by inclusions in mafic silicates,
Tectonophysics, 325, 217–225.
Borradaile, G. J., and F. Lagroix (2000b), Tectonics of the
Circum-Troodos sedimentary cover of Cyprus, from rock
magnetic and structural observations, J. Struct. Geol., 22,
453–469.
Carlut, J., and D. V. Kent (2002), Grain size dependent pa-
leointensity results from very recent mid-oceanic ridge ba-
salts, J. Geophys. Res., 107(B3), 2049, doi:10.1029/
2001JB000439.
Carter-Stiglitz, B., M. Jackson, and B. M. Moskowitz (2002),
Low-temperature remanence in stable single domain magnet-
ite, Geophys. Res. Lett., 29(7), 1129, doi:10.1029/
2001GL014197.
Dankers, P. (1981), Relationship between median destructive
field and remanent coercive force for dispersed natural mag-
netite, titanomagnetite, and hematite, Geophys. J. R. Astron.
Soc, 64, 447–461.
Dankers, P., and N. Sugiura (1981), The effects of annealing and
concentration on the hysteresis properties of magnetite around
the psd-md transition, Earth Planet. Sci. Lett., 56, 422–428.
Day, R., M. Fuller, and V. A. Schmidt (1977), Hysteresis prop-
erties of titanomagnetites: Grain size and composition depen-
dence, Phys. Earth Planet. Inter., 13, 260–267.
Dunlop, D. J. (1977), The coercive force spectrum of magnet-
ite at high temperatures: Evidence for thermal activation
below the blocking temperature, Geophys. J. R. Astron.
Soc., 51, 121–147.
Dunlop, D. J. (1987), Temperature dependence of hysteresis in
0.04–0.22 mm magnetites and implications for domain struc-
ture, Phys. Earth Planet. Sci., 46, 100–119.
GeochemistryGeophysicsGeosystems G3G3
yu et al.: magnetic hysteresis 10.1029/2003GC000685
22 of 24
Dunlop, D. J. (2002a), Theory and application of the Day
plot: 1. Theoretical curves and tests using titanomag-
netite data, J. Geophys. Res., 107(B3), 2056,
doi:10.1029/2001JB000486.
Dunlop, D. J. (2002b), Theory and application of the Day
plot: 2. Application to data for rocks, sediments, and soils,
J. Geophys. Res., 107(B3), 2057, doi:10.1029/
2001JB000487.
Dunlop, D. J., P. W. Schmidt, O. Ozdemir, and D. A. Clark
(1997), Paleomagnetism and paleothermometry of the Syd-
ney Basin: 1. Thermoviscous and chemical overprinting of
the Milton Monzonite, J. Geophys. Res., 102, 27,271–
27,283.
Fabian, K. (2003), Some additional parameters to estimate
domain state from isothermal remanent magnetization, Earth
Planet. Sci. Lett., 213, 337–345.
Fabian, K., and T. von Dobeneck (1997), Isothermal magneti-
zations of samples with stable Preisach function: A survey of
hysteresis, remanence, and rock magnetic parameters,
J. Geophys. Res., 102, 17,659–17,677.
Fletcher, E. J., and W. O’Reilly (1974), Contribution of Fe2+
ions to the magnetocrystalline anisotropy constant K1 of
Fe3 � xTixO4, 0 < x < 0.1, J. Phys. C Solid State. Phys.,
7, 171–178.
Gee, J. S., and D. V. Kent (1995), Magnetic hysteresis in
young mid-ocean ridge basalts: Dominant cubic anisotropy?,
Geophys. Res. Lett., 22, 551–554.
Gee, J. S., and D. V. Kent (1999), Calibration of magnetic
granulometric trend in oceanic basalts, Earth Planet. Sci.
Lett., 170, 377–390.
Hartstra, R. L. (1982a), A comparative study of the ARM and
Irs of some natural magnetites of MD and PSD grain size,
Geophys. J. R. Astron. Soc., 71, 497–518.
Hartstra, R. L. (1982b), Grain-size dependence of initial sus-
ceptibility and saturation magnetization-related parameters
of four natural magnetites in the PSD-MD range, Geophys.
J. R. Astron. Soc., 71, 477–495.
Heider, F. L., D. J. Dunlop, and N. Sugiura (1987), Magnetic
properties of hydrothermally recrystalized magnetite crystals,
Science, 236, 1287–1290.
Hodych, J. P. (1990), Magnetic hysteresis as a function of
low temperature in rocks: Evidence for internal stress
control of remanence in multidomain and pseudo-single-
domain magnetites, Phys. Earth Planet. Inter., 64, 21–
36.
Hodych, J. P., R. I. Mackay, and G. M. English (1998), Low-
temperature demagnetization of saturation remanence in
magnetite-bearing dolerites of high coercivity, Geophys.
J. Int., 132, 401–411.
Kakol, Z., J. Sabol, and J. M. Honig (1991), Magnetic anisot-
ropy of titanomagnetites Fe3 � xTixO4, 0 < x < 0.55, Phys.
Rev. B, 44, 2198–2204.
Keller, R., and E. Schmidbauer (1999), Magnetic hysteresis
properties and rotational hysteresis losses of synthetic
stress-controlled titanomagnetite particles: 1. Magnetic hys-
teresis properties, Geophys. J. Int., 138, 319–333.
Kent, D. V., and J. S. Gee (1996), Magnetic alteration of zero-
age oceanic basalt, Geology, 24, 703–706.
Klapel, G. D., and P. N. Shive (1974), High-temperature mag-
netostriction of magnetite, J. Geophys. Res., 79, 2629–2633.
Kosterov, A. (2001), Magnetic hysteresis of pseudo-single-
domain and multidomain magnetite below the Verway
transition, Earth Planet. Sci. Lett., 186, 245–253.
Kosterov, A. (2002), Low-temperature magnetic hysteresis of
partially oxidized magnetite, Geophys. J. Int., 149, 796–804.
Lagroix, F., and G. J. Borradaile (2000), Magnetic character-
ization using a 3-D hysteresis projection, illustrated with a
study of limestone, Geophys. J. Int., 141, 213–226.
Lanci, L., and D. V. Kent (2003), Introduction of thermal
activation in forward modeling of hysteresis loops for single-
domain magnetic particles and implications for the interpre-
tation of the Day diagram, J. Geophys. Res., 108(B3), 2142,
doi:10.1029/2001JB000944.
Levi, S., and R. T. Merrill (1978), Properties of single-domain,
pseudo-single-domain, and multidomain magnetite, J. Geo-
phys. Res., 83, 309–323.
Lowrie, W., and D. V. Kent (1969), Effect of annealing on
coercive force and remanent magnetization in magnetite,
J. Geophys. Res., 74, 2698–2710.
Medrano, C., M. Schlenker, J. Baruchel, J. Espeso, and
Y. Miyamoto (1999), Domains in the low-temperature phase
of magnetite from synchrotoron radiation x-ray topographs,
Phys. Rev. B, 59, 1185–1195.
Moloni, K., B. M. Moskowitz, and E. D. Dahlberg (1996),
Domain structures in single crystal magnetite below the Ver-
wey transition as observed with a low-temperature magnetitc
force microscope, Geophys. Res. Lett., 23, 2851–2854.
Moskowitz, B. M. (1993), High-temperature magnetostriction
of magnetite and titanomagnetites, J. Geophys. Res., 98,
18,011–18,026.
Moskowitz, B. M., R. B. Frankel, and D. A. Bazylinski (1993),
Rock magnetic criteria for the detection of biogenic magnet-
ite, Earth Planet. Sci. Lett., 120, 288–300.
Moskowitz, B. M., R. B. Frankel, S. A. Walton, D. P. E.
Dickson, K. K. W. Wong, T. Douglas, and S. Mann
(1997), Determination of the preexponential frequency factor
for superparamagnetic maghemite particles in magnetoferri-
tin, J. Geophys. Res., 102, 22,671–22,680.
Moskowitz, B. M., M. Jackson, and C. Kissel (1998), Low-
temperature magnetic behavior ot titanomagnetites, Earth
Planet. Sci. Lett., 157, 141–149.
Muxworthy, A. R. (1999), Low-temperature susceptibility and
hysteresis of magnetite, Earth Planet. Sci. Lett., 169, 51–58.
Ozdemir, O. (2000), Coercive force of single crystals of mag-
netite at low-temperatures, Geophys. J. Int., 141, 351–356.
Ozdemir, O., and W. O’Reilly (1981), High-temperature hys-
teresis and other magnetic properties of synthetic monodo-
main titanomagnetites, Phys. Earth Planet. Inter., 25, 406–
418.
Ozdemir, O., and W. O’Reilly (1982), Magnetic hysteresis
properties of synthetic monodomain titanomagnetites, Earth
Planet. Sci. Lett., 57, 437–447.
Ozdemir, O., D. J. Dunlop, and B. M. Moskowitz (2002),
Changes in remanence, coercivity, and domain state at low
temperature in magnetite, Earth Planet. Sci. Lett., 194, 343–
358.
GeochemistryGeophysicsGeosystems G3G3
yu et al.: magnetic hysteresis 10.1029/2003GC000685
23 of 24

Pick, T., and L. Tauxe (1993), Geomagnetic paleointensities
during the Cretaceous normal super chron measured using
submarine basaltic glass, Nature, 366, 238–242.
Sahu, S., and B. M. Moskowitz (1995), Thermal dependence
of magnetocrystalline anisotropy and magnetostriction con-
stants of single crystal Fe2.4Ti0.6O4, Geophys. Res. Lett., 22,
449–452.
Schmidbauer, E., and R. Keller (1994), Magnetic properties
and rotational hysteresis of a basalt with homogeneous Ti-
rich titanomagnetite grains 10–20 mm in diameter, Geophys.
J. Int., 119, 880–892.
Schmidbauer, E., and R. Keller (1996), Magnetic properties
and rotational hysteresis of magnetite and maghemite particle
250 nm in diameter, J. Magn. Magn. Mater., 152, 99–108.
Schmidbauer, E., and N. Schembera (1987), Magnetic hyster-
esis properties and anhysteretic remanent magentization of
spherical magnetite particle in the grain range 60–160 nm,
Phys. Earth Planet. Inter., 46, 77–83.
Smirnov, A. V., and J. A. Tarduno (2002), Magnetic field
control of the low-temperature magnetic properties of stoi-
chiometric and cation-deficient magnetite, Earth Planet. Sci.
Lett., 194, 359–368.
Stoner, E. C., and E. P. Wohlfarth (1948), A mechanism of
magnetic hysteresis in heterogeneous alloys, Philos. Trans.
R. Soc. London, Ser. A, 240, 599–642.
Syono, Y., and Y. Ishikawa (1963), Magnetocrystalline anisot-
ropy of xFe2TiO4 � (1 � x) Fe3O4, J. Phys. Soc. Jpn., 18,
1230–1231.
Tauxe, L., and J. Love (2003), Paleointensity in Hawaiian
Scientific Drilling Project Hole (HSDP2): Results from sub-
marine basaltic glass, Geochem. Geophys. Geosyst., 4(2),
8702, doi:10.1029/2001GC000276.
Tauxe, L., A. T. Mullender, and T. Pick (1996), Pot-bellies,
wasp-waists and superparamagnetism in magnetic hysteresis,
J. Geophys. Res., 101, 571–583.
Tauxe, L., H. N. Bertram, and C. Seberino (2002), Physical
interpretation of hysteresis loops: Micromagnetic modeling
of fine particle magnetite, Geochem. Geophys. Geosyst.,
3(10), 1055, doi:10.1029/2001GC000241.
Tucker, P. (1981), Low-temperature magnetic hysteresis prop-
erties of multidomain single-crystal titanomagnetites, Earth
Planet. Sci. Lett., 54, 167–172.
von Dobeneck, T. (1996), A systematic analysis of natural
remanent magnetic mineral assemblages based on modeling
hysteresis loops with coercivity-related hyperbolic basis
function, Geophys. J. Int., 124, 675–694.
Xu, W., R. van-der Voo, and D. R. Peacor (1998), Electron
microscopic and rockmagnetic study of remagnetized Lead-
ville carbonates, central Colorado, Tectonophysics, 196,
333–362.
Yu, J., D. J. Dunlop, and O. Ozdemir (2002), Partial anhys-
teretic remanent magnetization in magnetite: 1. Additivity,
J. Geophys. Res., 107(B10), 2244, doi:10.1029/
2001JB001249.
Yu, Y. (1998), Rock magnetic and paleomagnetic experi-
ments on hemoilmenites and titanomagnetites in some vol-
canic rocks from Japan, M.Sc., Univ. of Toronto, Toronto,
Canada.
Yu, Y., and D. J. Dunlop (2001), Paleointensity determination
on the late precambrian Tudor Gabbro, Ontario, J. Geophys.
Res., 106, 26,331–26,344.
Yu, Y., and D. J. Dunlop (2002), Multivectorial paleointensity
determination from the Cordova Gabbro, southern Ontario,
Earth Planet. Sci. Lett., 203, 983–998.
GeochemistryGeophysicsGeosystems G3G3
yu et al.: magnetic hysteresis 10.1029/2003GC000685
24 of 24
Related Documents


![Journal of Magnetism and Magnetic Materialsproperties of magnetic materials such as saturation magnetization, maximum hysteresis loss and size of magnetic particles [15]. The interaction](https://static.cupdf.com/doc/110x72/5fc5d2daa363a479b153d412/journal-of-magnetism-and-magnetic-materials-properties-of-magnetic-materials-such.jpg)