Temperature and density dependence of the light and heavy water ultraviolet absorption edge Timothy W. Marin a Chemistry Department, Benedictine University, Lisle, Illinois 60532 Kenji Takahashi Division of Material Science, Graduate School of Natural Science and Technology, Kanazawa University, Kanazawa 920-1192, Japan David M. Bartels b Notre Dame Radiation Laboratory, Notre Dame, Indiana 46556 Received 12 May 2006; accepted 27 July 2006; published online 14 September 2006 Characteristics of the ultraviolet absorption band edge of high-pressure light and heavy water are reported over the temperature range of 25-400 ° C, extending into the supercritical regime. A gradual redshift in the absorption band edge of 0.6 eV is observed with increasing temperature. This shift cannot be explained by vibrational hot band growth or changes in the degree of Rayleigh scattering with increasing temperature, and is ascribed to a shift of the electronic transition energy. The density dependence for the absorption edge in 400 ° C supercritical water was also examined, and showed a suprising 0.1 eV blueshift over a factor of 3.5 decrease in density. This shift may be due to a narrowing of the absorption spectrum with decreasing density. It is proposed that the previously reported “red tail” of the water absorption extending into the near ultraviolet and visible could be attributed to preresonant Rayleigh scattering, and that the true onset of liquid water absorption is approximately 5.8 eV at 25 ° C. © 2006 American Institute of Physics. DOI: 10.1063/1.2338521 I. INTRODUCTION Decades of effort have been invested in understanding the optical absorption of water. The optical properties and electronic absorption spectrum of liquid water have been studied over a wide range of photon energies, from about 4 -600 eV. 1–10 Bernas et al. have reviewed much of this literature. 8,11 The featureless first continuum X ˜ → A ˜ peak in the gas phase absorption spectrum, with maximum at 7.4 eV, is ascribed to promotion of a nonbonding valence electron to a dissociative excited state which is an admixture of anti- bonding sigma and 3s Rydberg orbitals. 12–16 In the liquid phase, this peak is notably broadened and shifted to the blue, with an absorption maximum of 8.3 eV. One of the main goals of the current study is to investigate the nature of this blueshift in highly compressible supercritical water SCW where the water density can be continuously tuned from va- por to high density fluid. In spite of the 0.9 eV blueshift, the low-energy side of the liquid water spectrum extends to even longer wave- lengths than the gas-phase threshold, with an apparent ab- sorption onset of about 6 eV. Quickenden and Irvin have provided the most accurate spectrum to date in this photon energy region and report an even longer low-energy, low- intensity tail that extends out to below 4 eV. 6 This feature has been interpreted in several ways. An empirical rule first proposed by Urbach dictates that the absorptivity near the absorption band threshold should be an exponential function of photon energy for any disordered medium. 17 The Urbach rule was first applied to the absorption edge for liquid water by Onaka and Takahashi, 18 and later by Williams et al. 19 In these studies, extrapolation of the main absorption band via the Urbach rule gives an absorption threshold just below 6 eV, suggesting that perhaps the low-energy tail later ob- served by Quickenden and Irvin may not be part of the water absorption. 6 Original arguments by Quickenden and Irvin suggested the possibility that this absorption is due to a low- lying energy level of liquid water, breakdown of the Urbach rule, or presence of an impurity in the water sample. Consid- ering the great lengths which the authors went to in sample purification, the presence of an impurity is highly unlikely. No evidence has been provided in recent years to suggest the presence of a low-lying state. The observed absorption is only moderately greater than the calculated contribution from Rayleigh scattering, and the authors’ original calcula- tion for scattering contributions did not include possible resonance Rayleigh effects, which could greatly enhance the degree of scattering. Below it will be shown that this reso- nance contribution is the most likely explanation for the ob- servation of this low-energy tail. Previous examinations of the temperature dependence of the absorption band from room temperature up to 80 ° C have indicated a redshift of the absorption onset with in- creasing temperature for both light and heavy water. 1,2,20 This was explained as a lessening in the extent of hydrogen bonding due to increasing orientational disorder in the a Electronic mail: [email protected] b Author to whom correspondence should be addressed. Fax: 574 631- 8068. Electronic mail: [email protected] THE JOURNAL OF CHEMICAL PHYSICS 125, 104314 2006 0021-9606/2006/12510/104314/11/$23.00 © 2006 American Institute of Physics 125, 104314-1 Downloaded 05 Oct 2006 to 129.74.11.24. Redistribution subject to AIP license or copyright, see http://jcp.aip.org/jcp/copyright.jsp

Welcome message from author
This document is posted to help you gain knowledge. Please leave a comment to let me know what you think about it! Share it to your friends and learn new things together.
Transcript
Temperature and density dependence of the light and heavy waterultraviolet absorption edge
Timothy W. Marina!
Chemistry Department, Benedictine University, Lisle, Illinois 60532
Kenji TakahashiDivision of Material Science, Graduate School of Natural Science and Technology, Kanazawa University,Kanazawa 920-1192, Japan
David M. Bartelsb!
Notre Dame Radiation Laboratory, Notre Dame, Indiana 46556
!Received 12 May 2006; accepted 27 July 2006; published online 14 September 2006"
Characteristics of the ultraviolet absorption band edge of high-pressure light and heavy water arereported over the temperature range of 25-400 °C, extending into the supercritical regime. Agradual redshift in the absorption band edge of #0.6 eV is observed with increasing temperature.This shift cannot be explained by vibrational hot band growth or changes in the degree of Rayleighscattering with increasing temperature, and is ascribed to a shift of the electronic transition energy.The density dependence for the absorption edge in 400 °C supercritical water was also examined,and showed a suprising #0.1 eV blueshift over a factor of 3.5 decrease in density. This shift maybe due to a narrowing of the absorption spectrum with decreasing density. It is proposed that thepreviously reported “red tail” of the water absorption extending into the near ultraviolet and visiblecould be attributed to preresonant Rayleigh scattering, and that the true onset of liquid waterabsorption is approximately 5.8 eV at 25 °C. © 2006 American Institute of Physics.$DOI: 10.1063/1.2338521%
I. INTRODUCTION
Decades of effort have been invested in understandingthe optical absorption of water. The optical properties andelectronic absorption spectrum of liquid water have beenstudied over a wide range of photon energies, from about 4-600 eV.1–10 Bernas et al. have reviewed much of thisliterature.8,11 The featureless first continuum X! A peak inthe gas phase absorption spectrum, with maximum at 7.4 eV,is ascribed to promotion of a nonbonding valence electron toa dissociative excited state which is an admixture of anti-bonding sigma and 3s Rydberg orbitals.12–16 In the liquidphase, this peak is notably broadened and shifted to the blue,with an absorption maximum of 8.3 eV. One of the maingoals of the current study is to investigate the nature of thisblueshift in highly compressible supercritical water !SCW"where the water density can be continuously tuned from va-por to high density fluid.
In spite of the 0.9 eV blueshift, the low-energy side ofthe liquid water spectrum extends to even longer wave-lengths than the gas-phase threshold, with an apparent ab-sorption onset of about 6 eV. Quickenden and Irvin haveprovided the most accurate spectrum to date in this photonenergy region and report an even longer low-energy, low-intensity tail that extends out to below 4 eV.6 This featurehas been interpreted in several ways. An empirical rule first
proposed by Urbach dictates that the absorptivity near theabsorption band threshold should be an exponential functionof photon energy for any disordered medium.17 The Urbachrule was first applied to the absorption edge for liquid waterby Onaka and Takahashi,18 and later by Williams et al.19 Inthese studies, extrapolation of the main absorption band viathe Urbach rule gives an absorption threshold just below6 eV, suggesting that perhaps the low-energy tail later ob-served by Quickenden and Irvin may not be part of the waterabsorption.6 Original arguments by Quickenden and Irvinsuggested the possibility that this absorption is due to a low-lying energy level of liquid water, breakdown of the Urbachrule, or presence of an impurity in the water sample. Consid-ering the great lengths which the authors went to in samplepurification, the presence of an impurity is highly unlikely.No evidence has been provided in recent years to suggest thepresence of a low-lying state. The observed absorption isonly moderately greater than the calculated contributionfrom Rayleigh scattering, and the authors’ original calcula-tion for scattering contributions did not include possibleresonance Rayleigh effects, which could greatly enhance thedegree of scattering. Below it will be shown that this reso-nance contribution is the most likely explanation for the ob-servation of this low-energy tail.
Previous examinations of the temperature dependence ofthe absorption band from room temperature up to 80 °Chave indicated a redshift of the absorption onset with in-creasing temperature for both light and heavy water. 1,2,20
This was explained as a lessening in the extent of hydrogenbonding due to increasing orientational disorder in the
a"Electronic mail: [email protected]"Author to whom correspondence should be addressed. Fax: !574" 631-
8068. Electronic mail: [email protected]
THE JOURNAL OF CHEMICAL PHYSICS 125, 104314 !2006"
0021-9606/2006/125"10!/104314/11/$23.00 © 2006 American Institute of Physics125, 104314-1
Downloaded 05 Oct 2006 to 129.74.11.24. Redistribution subject to AIP license or copyright, see http://jcp.aip.org/jcp/copyright.jsp
water.19 It remained a question whether this temperature shiftwould continue at higher temperatures and whether changeswould occur in the absorption upon reaching the water criti-cal point !374 °C, 220 bar for H2O; 371 °C, 217 bar forD2O". Since supercritical water is highly compressible, it ispossible to tune the water density to examine the changebetween liquidlike and gaslike behavior, i.e., one expects thespectrum to redshift with decreasing density as it becomesmore gaslike. In the experiments presented here, measure-ments of the H2O and D2O ultraviolet absorption edge havebeen extended up to a temperature of 400 °C in incrementsof 25 °C, predominantly along a 250 bar isobar and over thewavelength range of 190-350 nm, illustrating that the red-shift does continue with increasing temperature. We presentarguments supporting the conclusion that this is a true shiftin the water electronic transition energy, and that it cannot beexplained by growth of vibrational hot bands or a scatteringartifact. We have further explored the density dependence ofthe spectrum near and above the critical temperature, discov-ering a slight blueshift of the absorption edge with decreas-ing density which is probably due to a narrowing of thespectrum.
II. EXPERIMENT
The experimental setup is a flow system attached to atwo-path optical cell that sits directly inside a Cary-14 scan-ning spectrophotometer. The cell is capable of withstandingtemperatures and pressures up to 400 °C and 300 bar. Theoriginal intention of a two-path cell was to acquire spectrausing two different path lengths but with the same opticalmaterials along each path. The spectrum obtained with theshorter path could then be subtracted from the longer pathspectrum, i.e., the short path spectrum is used as a base linespectrum at each temperature and pressure condition. Sincethe majority of window reflections and scattering at inter-faces should be nearly identical on each path, these shouldlargely subtract out, leaving only the spectrum of the sampleinside. The cell was mounted on a translation stage inside thespectrophotometer to facilitate switching between opticalpaths. Unfortunately this technique gave irreproducible re-sults, most likely due to optically mismatched windows andslight geometry changes of the sample cell upon translation.Therefore, the cell was left in a fixed position, and onlyspectra using the 4 mm path length were acquired. The25 °C spectrum was used as an effective base line and wassubtracted from the spectra acquired at every other tempera-ture to give “difference” spectra. This corrected for the spec-trophotometer wavelength response and the majority of thewindow absorptions/reflections, which were observed to onlychange ±10!2 m optical diameter !O.D." over the entire tem-perature range of 25-400 °C. The previously reported roomtemperature absorption spectrum6 was then added back intothe difference spectra. A spectrum of the water sample wascollected daily at 25 °C to establish a proper base line.
It is conceivable that corrosion reactions could occur athigh temperatures between the water and metal sample cell.Thus, after cycling a water sample from 25 °C up to hightemperature and back again to 25 °C, a second absorption
spectrum was acquired at 25 °C and compared to the origi-nal. No change in the water spectrum was ever noted aftertemperature cycling, indicating that impurity concentrationslikely remained at a minimum even at high temperatures.
All spectra were acquired with a Cary-14 scanning spec-trophotometer equipped with updated electronics and soft-ware provided by OLIS, Inc., covering a wavelength rangeof 190-350 nm in 1 nm increments. !190 nm is the shortwavelength limit of the instrument." Spectra were obtainedfrom 25 up to 400 °C in increments of 25 °C. The experi-mental pressure was 250 bar for these measurements, exceptfor at 400 °C, where it was 300 bar. Temperature and pres-sure accuracies were ±0.2 °C and ±0.2 bar, respectively. Thedensity dependence of the spectra was also examined nearthe critical temperature !Tc=374 and 371 °C for H2O andD2O, respectively" at 360, 380, and 400 °C. A factor of 3.5–5.0 density change was examined at each of these tempera-tures by acquiring spectra at six to eight different pressures.Five scans of each spectrum were acquired at each tempera-ture and pressure condition and then averaged. Tables I andII indicate the exact water pressure, temperature, and densityconditions used for the measurements presented in the fig-ures below, where the densities are obtained from Wagnerand Kruse for H2O,21 and from Hill et al. for D2O.22 Thespectrophotometer was continuously purged with dry nitro-gen gas to prevent the buildup of ozone, which absorbs at255 nm and interferes in our wavelength range of interest.23
A diagram of the experimental setup is shown in Fig. 1.Except for the sample cell, the flow system is entirely con-structed of 316 stainless steel tubing and fittings. Beforeflowing water through the system, a vacuum pump at thesystem outlet is used to remove the air from the system,preventing air bubbles from being trapped in the sample cell.A high-pressure piston pump !model B, Eldex Laboratories,Inc., rated to 5000 psi" is then used to fill the sample cell andpurge the degassed water through the entire system for sev-eral minutes. Finally, the exit valve is closed and the system
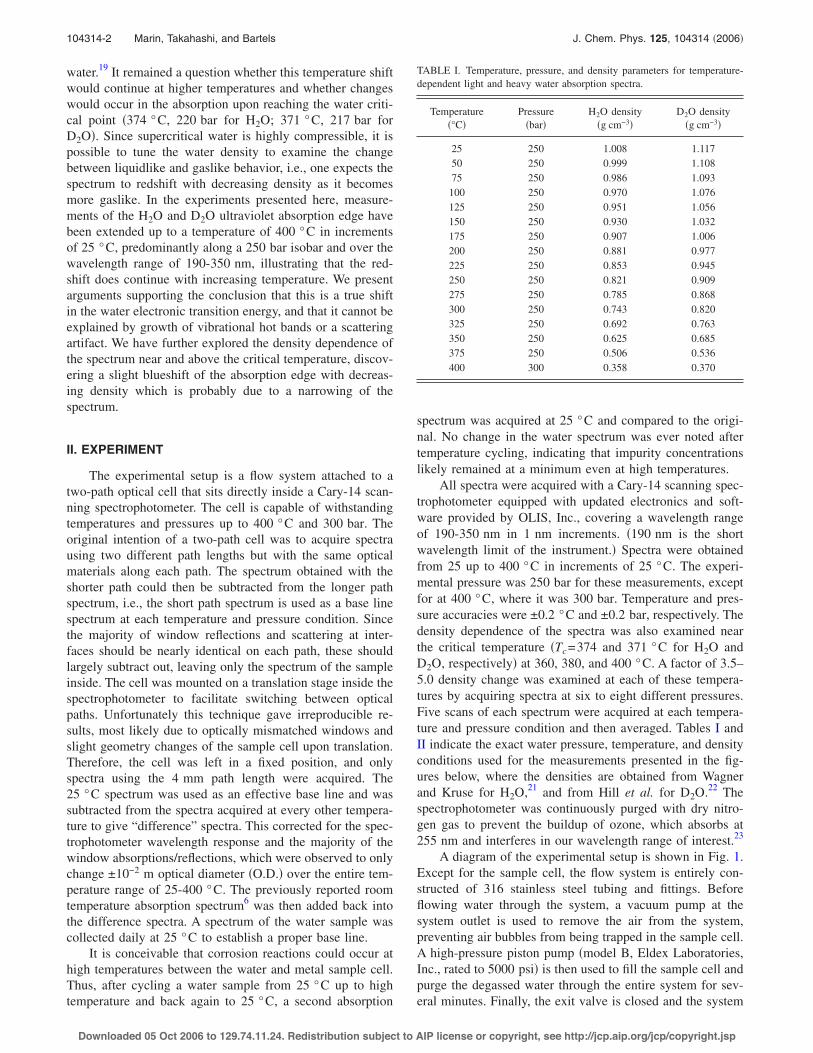
TABLE I. Temperature, pressure, and density parameters for temperature-dependent light and heavy water absorption spectra.
Temperature!°C"
Pressure!bar"
H2O density!g cm!3"
D2O density!g cm!3"
25 250 1.008 1.11750 250 0.999 1.10875 250 0.986 1.093
100 250 0.970 1.076125 250 0.951 1.056150 250 0.930 1.032175 250 0.907 1.006200 250 0.881 0.977225 250 0.853 0.945250 250 0.821 0.909275 250 0.785 0.868300 250 0.743 0.820325 250 0.692 0.763350 250 0.625 0.685375 250 0.506 0.536400 300 0.358 0.370
104314-2 Marin, Takahashi, and Bartels J. Chem. Phys. 125, 104314 "2006!
Downloaded 05 Oct 2006 to 129.74.11.24. Redistribution subject to AIP license or copyright, see http://jcp.aip.org/jcp/copyright.jsp
is pressurized as the pump continues to operate. A pressuretransducer !model PX02K1-7.5KGV, Omega Engineering,Inc." continuously monitors the system pressure to ±0.2 bar,and the pump is stopped when the pressure is near the de-sired experimental pressure.
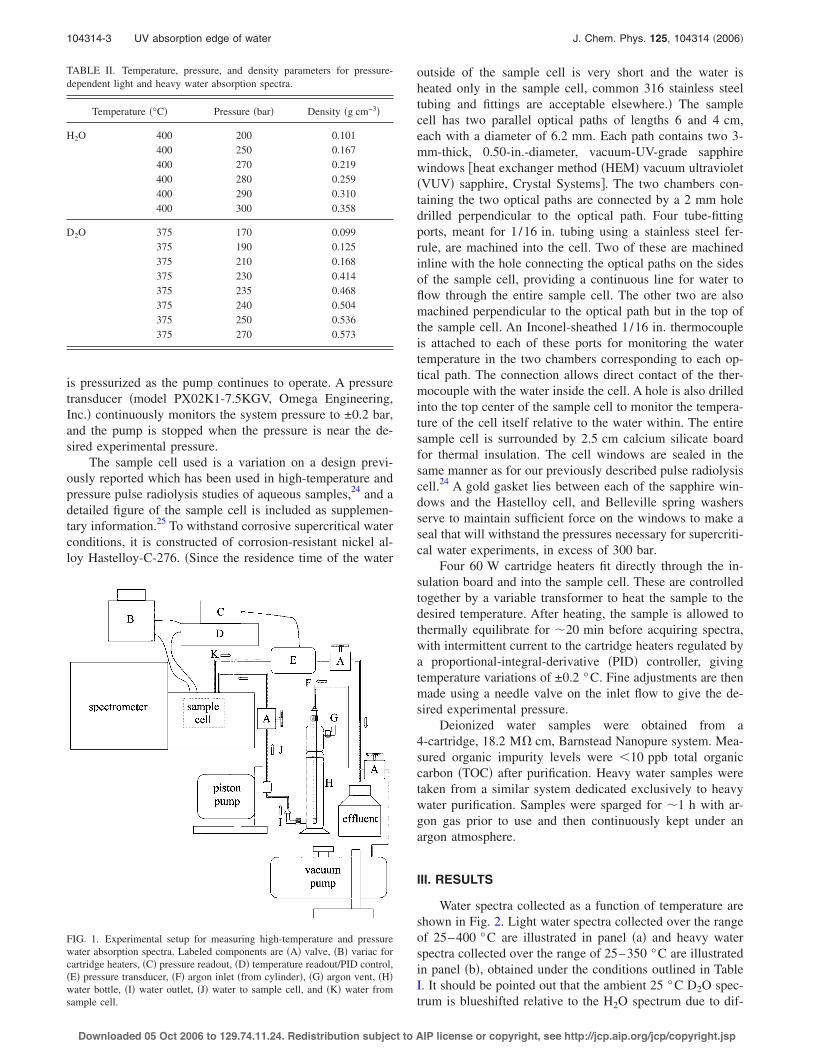
The sample cell used is a variation on a design previ-ously reported which has been used in high-temperature andpressure pulse radiolysis studies of aqueous samples,24 and adetailed figure of the sample cell is included as supplemen-tary information.25 To withstand corrosive supercritical waterconditions, it is constructed of corrosion-resistant nickel al-loy Hastelloy-C-276. !Since the residence time of the water
outside of the sample cell is very short and the water isheated only in the sample cell, common 316 stainless steeltubing and fittings are acceptable elsewhere." The samplecell has two parallel optical paths of lengths 6 and 4 cm,each with a diameter of 6.2 mm. Each path contains two 3-mm-thick, 0.50-in.-diameter, vacuum-UV-grade sapphirewindows $heat exchanger method !HEM" vacuum ultraviolet!VUV" sapphire, Crystal Systems%. The two chambers con-taining the two optical paths are connected by a 2 mm holedrilled perpendicular to the optical path. Four tube-fittingports, meant for 1 /16 in. tubing using a stainless steel fer-rule, are machined into the cell. Two of these are machinedinline with the hole connecting the optical paths on the sidesof the sample cell, providing a continuous line for water toflow through the entire sample cell. The other two are alsomachined perpendicular to the optical path but in the top ofthe sample cell. An Inconel-sheathed 1/16 in. thermocoupleis attached to each of these ports for monitoring the watertemperature in the two chambers corresponding to each op-tical path. The connection allows direct contact of the ther-mocouple with the water inside the cell. A hole is also drilledinto the top center of the sample cell to monitor the tempera-ture of the cell itself relative to the water within. The entiresample cell is surrounded by 2.5 cm calcium silicate boardfor thermal insulation. The cell windows are sealed in thesame manner as for our previously described pulse radiolysiscell.24 A gold gasket lies between each of the sapphire win-dows and the Hastelloy cell, and Belleville spring washersserve to maintain sufficient force on the windows to make aseal that will withstand the pressures necessary for supercriti-cal water experiments, in excess of 300 bar.
Four 60 W cartridge heaters fit directly through the in-sulation board and into the sample cell. These are controlledtogether by a variable transformer to heat the sample to thedesired temperature. After heating, the sample is allowed tothermally equilibrate for #20 min before acquiring spectra,with intermittent current to the cartridge heaters regulated bya proportional-integral-derivative !PID" controller, givingtemperature variations of ±0.2 °C. Fine adjustments are thenmade using a needle valve on the inlet flow to give the de-sired experimental pressure.
Deionized water samples were obtained from a4-cartridge, 18.2 M! cm, Barnstead Nanopure system. Mea-sured organic impurity levels were "10 ppb total organiccarbon !TOC" after purification. Heavy water samples weretaken from a similar system dedicated exclusively to heavywater purification. Samples were sparged for #1 h with ar-gon gas prior to use and then continuously kept under anargon atmosphere.
III. RESULTS
Water spectra collected as a function of temperature areshown in Fig. 2. Light water spectra collected over the rangeof 25–400 °C are illustrated in panel !a" and heavy waterspectra collected over the range of 25–350 °C are illustratedin panel !b", obtained under the conditions outlined in TableI. It should be pointed out that the ambient 25 °C D2O spec-trum is blueshifted relative to the H2O spectrum due to dif-
TABLE II. Temperature, pressure, and density parameters for pressure-dependent light and heavy water absorption spectra.
Temperature !°C" Pressure !bar" Density !g cm!3"
H2O 400 200 0.101400 250 0.167400 270 0.219400 280 0.259400 290 0.310400 300 0.358
D2O 375 170 0.099375 190 0.125375 210 0.168375 230 0.414375 235 0.468375 240 0.504375 250 0.536375 270 0.573
FIG. 1. Experimental setup for measuring high-temperature and pressurewater absorption spectra. Labeled components are !A" valve, !B" variac forcartridge heaters, !C" pressure readout, !D" temperature readout/PID control,!E" pressure transducer, !F" argon inlet !from cylinder", !G" argon vent, !H"water bottle, !I" water outlet, !J" water to sample cell, and !K" water fromsample cell.
104314-3 UV absorption edge of water J. Chem. Phys. 125, 104314 "2006!
Downloaded 05 Oct 2006 to 129.74.11.24. Redistribution subject to AIP license or copyright, see http://jcp.aip.org/jcp/copyright.jsp
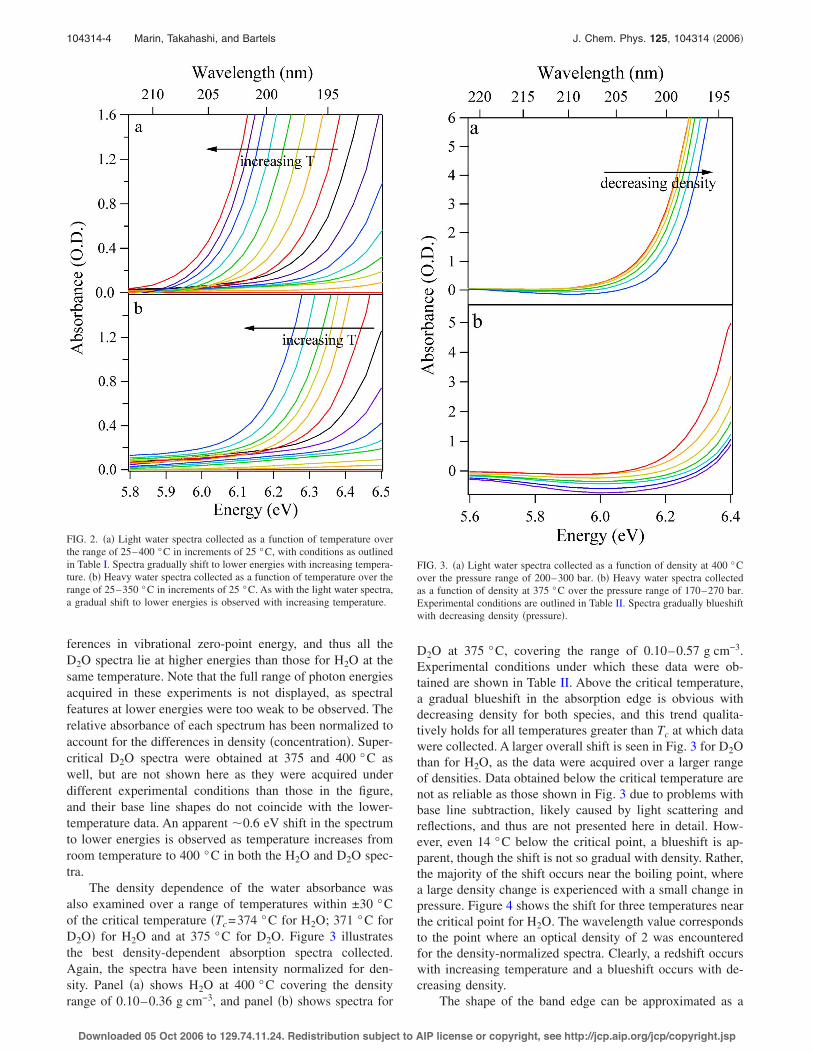
ferences in vibrational zero-point energy, and thus all theD2O spectra lie at higher energies than those for H2O at thesame temperature. Note that the full range of photon energiesacquired in these experiments is not displayed, as spectralfeatures at lower energies were too weak to be observed. Therelative absorbance of each spectrum has been normalized toaccount for the differences in density !concentration". Super-critical D2O spectra were obtained at 375 and 400 °C aswell, but are not shown here as they were acquired underdifferent experimental conditions than those in the figure,and their base line shapes do not coincide with the lower-temperature data. An apparent #0.6 eV shift in the spectrumto lower energies is observed as temperature increases fromroom temperature to 400 °C in both the H2O and D2O spec-tra.
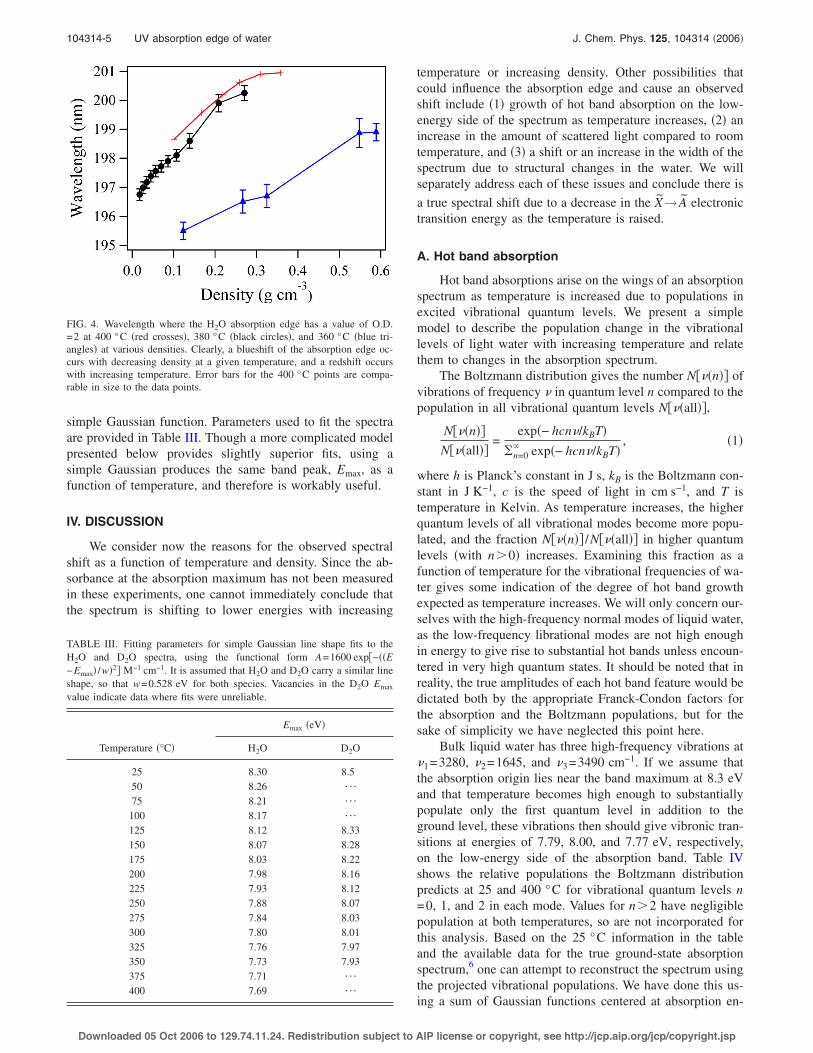
The density dependence of the water absorbance wasalso examined over a range of temperatures within ±30 °Cof the critical temperature !Tc=374 °C for H2O; 371 °C forD2O" for H2O and at 375 °C for D2O. Figure 3 illustratesthe best density-dependent absorption spectra collected.Again, the spectra have been intensity normalized for den-sity. Panel !a" shows H2O at 400 °C covering the densityrange of 0.10–0.36 g cm!3, and panel !b" shows spectra for
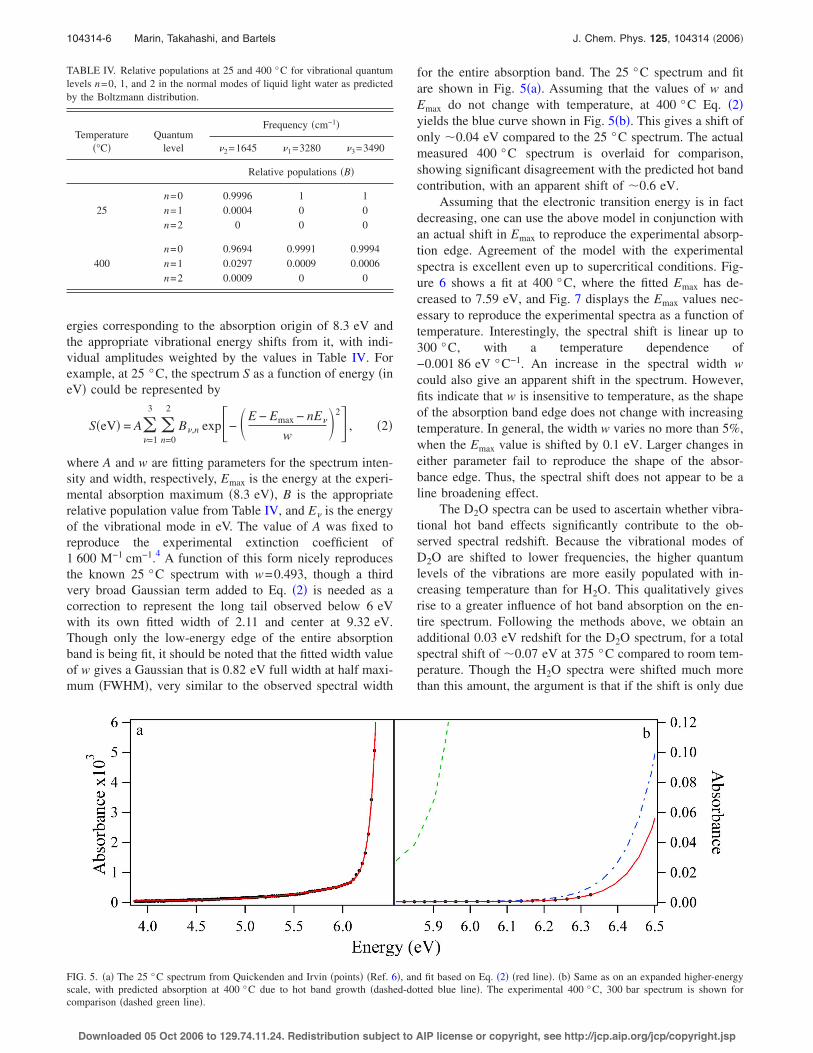
D2O at 375 °C, covering the range of 0.10–0.57 g cm!3.Experimental conditions under which these data were ob-tained are shown in Table II. Above the critical temperature,a gradual blueshift in the absorption edge is obvious withdecreasing density for both species, and this trend qualita-tively holds for all temperatures greater than Tc at which datawere collected. A larger overall shift is seen in Fig. 3 for D2Othan for H2O, as the data were acquired over a larger rangeof densities. Data obtained below the critical temperature arenot as reliable as those shown in Fig. 3 due to problems withbase line subtraction, likely caused by light scattering andreflections, and thus are not presented here in detail. How-ever, even 14 °C below the critical point, a blueshift is ap-parent, though the shift is not so gradual with density. Rather,the majority of the shift occurs near the boiling point, wherea large density change is experienced with a small change inpressure. Figure 4 shows the shift for three temperatures nearthe critical point for H2O. The wavelength value correspondsto the point where an optical density of 2 was encounteredfor the density-normalized spectra. Clearly, a redshift occurswith increasing temperature and a blueshift occurs with de-creasing density.
The shape of the band edge can be approximated as a
FIG. 2. !a" Light water spectra collected as a function of temperature overthe range of 25–400 °C in increments of 25 °C, with conditions as outlinedin Table I. Spectra gradually shift to lower energies with increasing tempera-ture. !b" Heavy water spectra collected as a function of temperature over therange of 25–350 °C in increments of 25 °C. As with the light water spectra,a gradual shift to lower energies is observed with increasing temperature.
FIG. 3. !a" Light water spectra collected as a function of density at 400 °Cover the pressure range of 200–300 bar. !b" Heavy water spectra collectedas a function of density at 375 °C over the pressure range of 170–270 bar.Experimental conditions are outlined in Table II. Spectra gradually blueshiftwith decreasing density !pressure".
104314-4 Marin, Takahashi, and Bartels J. Chem. Phys. 125, 104314 "2006!
Downloaded 05 Oct 2006 to 129.74.11.24. Redistribution subject to AIP license or copyright, see http://jcp.aip.org/jcp/copyright.jsp
simple Gaussian function. Parameters used to fit the spectraare provided in Table III. Though a more complicated modelpresented below provides slightly superior fits, using asimple Gaussian produces the same band peak, Emax, as afunction of temperature, and therefore is workably useful.
IV. DISCUSSION
We consider now the reasons for the observed spectralshift as a function of temperature and density. Since the ab-sorbance at the absorption maximum has not been measuredin these experiments, one cannot immediately conclude thatthe spectrum is shifting to lower energies with increasing
temperature or increasing density. Other possibilities thatcould influence the absorption edge and cause an observedshift include !1" growth of hot band absorption on the low-energy side of the spectrum as temperature increases, !2" anincrease in the amount of scattered light compared to roomtemperature, and !3" a shift or an increase in the width of thespectrum due to structural changes in the water. We willseparately address each of these issues and conclude there isa true spectral shift due to a decrease in the X! A electronictransition energy as the temperature is raised.
A. Hot band absorption
Hot band absorptions arise on the wings of an absorptionspectrum as temperature is increased due to populations inexcited vibrational quantum levels. We present a simplemodel to describe the population change in the vibrationallevels of light water with increasing temperature and relatethem to changes in the absorption spectrum.
The Boltzmann distribution gives the number N$#!n"% ofvibrations of frequency # in quantum level n compared to thepopulation in all vibrational quantum levels N$#!all"%,
N$#!n"%N$#!all"%
=exp!! hcn#/kBT"
&n=0$ exp!! hcn#/kBT"
, !1"
where h is Planck’s constant in J s, kB is the Boltzmann con-stant in J K!1, c is the speed of light in cm s!1, and T istemperature in Kelvin. As temperature increases, the higherquantum levels of all vibrational modes become more popu-lated, and the fraction N$#!n"% /N$#!all"% in higher quantumlevels !with n%0" increases. Examining this fraction as afunction of temperature for the vibrational frequencies of wa-ter gives some indication of the degree of hot band growthexpected as temperature increases. We will only concern our-selves with the high-frequency normal modes of liquid water,as the low-frequency librational modes are not high enoughin energy to give rise to substantial hot bands unless encoun-tered in very high quantum states. It should be noted that inreality, the true amplitudes of each hot band feature would bedictated both by the appropriate Franck-Condon factors forthe absorption and the Boltzmann populations, but for thesake of simplicity we have neglected this point here.
Bulk liquid water has three high-frequency vibrations at#1=3280, #2=1645, and #3=3490 cm!1. If we assume thatthe absorption origin lies near the band maximum at 8.3 eVand that temperature becomes high enough to substantiallypopulate only the first quantum level in addition to theground level, these vibrations then should give vibronic tran-sitions at energies of 7.79, 8.00, and 7.77 eV, respectively,on the low-energy side of the absorption band. Table IVshows the relative populations the Boltzmann distributionpredicts at 25 and 400 °C for vibrational quantum levels n=0, 1, and 2 in each mode. Values for n%2 have negligiblepopulation at both temperatures, so are not incorporated forthis analysis. Based on the 25 °C information in the tableand the available data for the true ground-state absorptionspectrum,6 one can attempt to reconstruct the spectrum usingthe projected vibrational populations. We have done this us-ing a sum of Gaussian functions centered at absorption en-
FIG. 4. Wavelength where the H2O absorption edge has a value of O.D.=2 at 400 °C !red crosses", 380 °C !black circles", and 360 °C !blue tri-angles" at various densities. Clearly, a blueshift of the absorption edge oc-curs with decreasing density at a given temperature, and a redshift occurswith increasing temperature. Error bars for the 400 °C points are compa-rable in size to the data points.
TABLE III. Fitting parameters for simple Gaussian line shape fits to theH2O and D2O spectra, using the functional form A=1600 exp$!!!E!Emax" /w"2% M!1 cm!1. It is assumed that H2O and D2O carry a similar lineshape, so that w=0.528 eV for both species. Vacancies in the D2O Emax
value indicate data where fits were unreliable.
Temperature !°C"
Emax !eV"
H2O D2O
25 8.30 8.550 8.26 ¯75 8.21 ¯
100 8.17 ¯125 8.12 8.33150 8.07 8.28175 8.03 8.22200 7.98 8.16225 7.93 8.12250 7.88 8.07275 7.84 8.03300 7.80 8.01325 7.76 7.97350 7.73 7.93375 7.71 ¯400 7.69 ¯
104314-5 UV absorption edge of water J. Chem. Phys. 125, 104314 "2006!
Downloaded 05 Oct 2006 to 129.74.11.24. Redistribution subject to AIP license or copyright, see http://jcp.aip.org/jcp/copyright.jsp
ergies corresponding to the absorption origin of 8.3 eV andthe appropriate vibrational energy shifts from it, with indi-vidual amplitudes weighted by the values in Table IV. Forexample, at 25 °C, the spectrum S as a function of energy !ineV" could be represented by
S!eV" = A&#=1
3
&n=0
2
B#,n exp'! (E ! Emax ! nE#
w)2* , !2"
where A and w are fitting parameters for the spectrum inten-sity and width, respectively, Emax is the energy at the experi-mental absorption maximum !8.3 eV", B is the appropriaterelative population value from Table IV, and E# is the energyof the vibrational mode in eV. The value of A was fixed toreproduce the experimental extinction coefficient of1 600 M!1 cm!1.4 A function of this form nicely reproducesthe known 25 °C spectrum with w=0.493, though a thirdvery broad Gaussian term added to Eq. !2" is needed as acorrection to represent the long tail observed below 6 eVwith its own fitted width of 2.11 and center at 9.32 eV.Though only the low-energy edge of the entire absorptionband is being fit, it should be noted that the fitted width valueof w gives a Gaussian that is 0.82 eV full width at half maxi-mum !FWHM", very similar to the observed spectral width
for the entire absorption band. The 25 °C spectrum and fitare shown in Fig. 5!a". Assuming that the values of w andEmax do not change with temperature, at 400 °C Eq. !2"yields the blue curve shown in Fig. 5!b". This gives a shift ofonly #0.04 eV compared to the 25 °C spectrum. The actualmeasured 400 °C spectrum is overlaid for comparison,showing significant disagreement with the predicted hot bandcontribution, with an apparent shift of #0.6 eV.
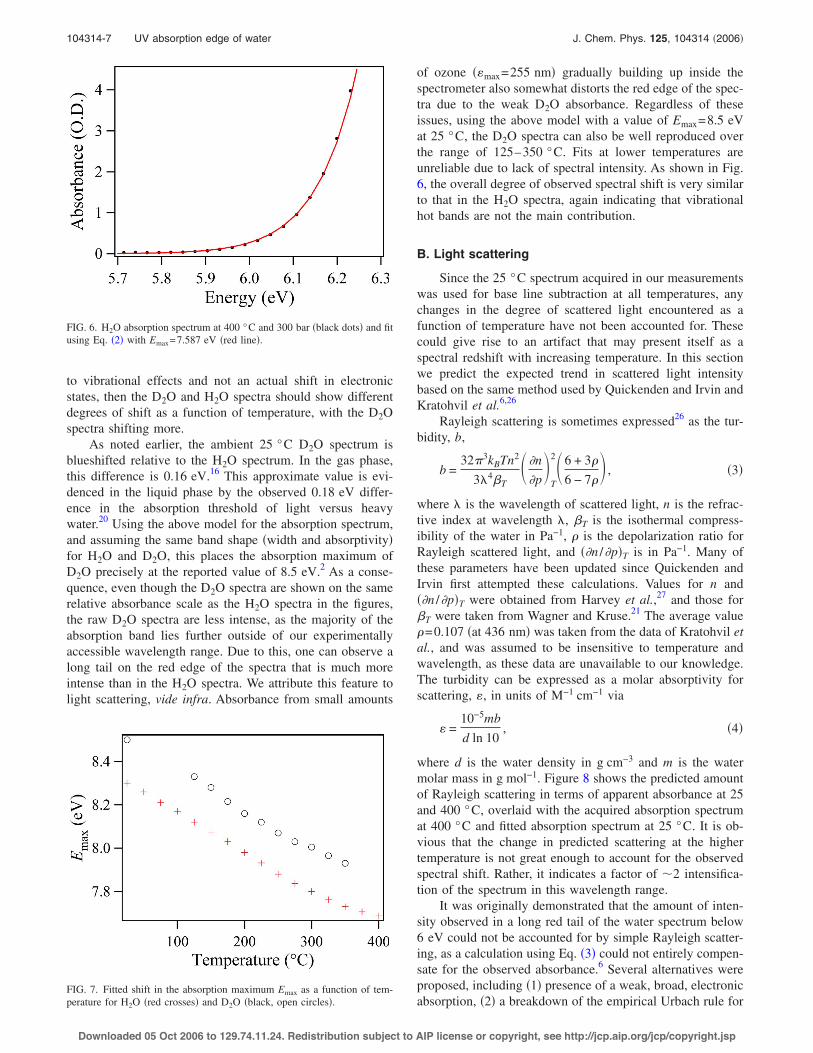
Assuming that the electronic transition energy is in factdecreasing, one can use the above model in conjunction withan actual shift in Emax to reproduce the experimental absorp-tion edge. Agreement of the model with the experimentalspectra is excellent even up to supercritical conditions. Fig-ure 6 shows a fit at 400 °C, where the fitted Emax has de-creased to 7.59 eV, and Fig. 7 displays the Emax values nec-essary to reproduce the experimental spectra as a function oftemperature. Interestingly, the spectral shift is linear up to300 °C, with a temperature dependence of!0.001 86 eV °C!1. An increase in the spectral width wcould also give an apparent shift in the spectrum. However,fits indicate that w is insensitive to temperature, as the shapeof the absorption band edge does not change with increasingtemperature. In general, the width w varies no more than 5%,when the Emax value is shifted by 0.1 eV. Larger changes ineither parameter fail to reproduce the shape of the absor-bance edge. Thus, the spectral shift does not appear to be aline broadening effect.
The D2O spectra can be used to ascertain whether vibra-tional hot band effects significantly contribute to the ob-served spectral redshift. Because the vibrational modes ofD2O are shifted to lower frequencies, the higher quantumlevels of the vibrations are more easily populated with in-creasing temperature than for H2O. This qualitatively givesrise to a greater influence of hot band absorption on the en-tire spectrum. Following the methods above, we obtain anadditional 0.03 eV redshift for the D2O spectrum, for a totalspectral shift of #0.07 eV at 375 °C compared to room tem-perature. Though the H2O spectra were shifted much morethan this amount, the argument is that if the shift is only due
TABLE IV. Relative populations at 25 and 400 °C for vibrational quantumlevels n=0, 1, and 2 in the normal modes of liquid light water as predictedby the Boltzmann distribution.
Temperature!°C"
Quantumlevel
Frequency !cm!1"
#2=1645 #1=3280 #3=3490
Relative populations !B"
n=0 0.9996 1 125 n=1 0.0004 0 0
n=2 0 0 0
n=0 0.9694 0.9991 0.9994400 n=1 0.0297 0.0009 0.0006
n=2 0.0009 0 0
FIG. 5. !a" The 25 °C spectrum from Quickenden and Irvin !points" !Ref. 6", and fit based on Eq. !2" !red line". !b" Same as on an expanded higher-energyscale, with predicted absorption at 400 °C due to hot band growth !dashed-dotted blue line". The experimental 400 °C, 300 bar spectrum is shown forcomparison !dashed green line".
104314-6 Marin, Takahashi, and Bartels J. Chem. Phys. 125, 104314 "2006!
Downloaded 05 Oct 2006 to 129.74.11.24. Redistribution subject to AIP license or copyright, see http://jcp.aip.org/jcp/copyright.jsp
to vibrational effects and not an actual shift in electronicstates, then the D2O and H2O spectra should show differentdegrees of shift as a function of temperature, with the D2Ospectra shifting more.
As noted earlier, the ambient 25 °C D2O spectrum isblueshifted relative to the H2O spectrum. In the gas phase,this difference is 0.16 eV.16 This approximate value is evi-denced in the liquid phase by the observed 0.18 eV differ-ence in the absorption threshold of light versus heavywater.20 Using the above model for the absorption spectrum,and assuming the same band shape !width and absorptivity"for H2O and D2O, this places the absorption maximum ofD2O precisely at the reported value of 8.5 eV.2 As a conse-quence, even though the D2O spectra are shown on the samerelative absorbance scale as the H2O spectra in the figures,the raw D2O spectra are less intense, as the majority of theabsorption band lies further outside of our experimentallyaccessible wavelength range. Due to this, one can observe along tail on the red edge of the spectra that is much moreintense than in the H2O spectra. We attribute this feature tolight scattering, vide infra. Absorbance from small amounts
of ozone !&max=255 nm" gradually building up inside thespectrometer also somewhat distorts the red edge of the spec-tra due to the weak D2O absorbance. Regardless of theseissues, using the above model with a value of Emax=8.5 eVat 25 °C, the D2O spectra can also be well reproduced overthe range of 125–350 °C. Fits at lower temperatures areunreliable due to lack of spectral intensity. As shown in Fig.6, the overall degree of observed spectral shift is very similarto that in the H2O spectra, again indicating that vibrationalhot bands are not the main contribution.
B. Light scattering
Since the 25 °C spectrum acquired in our measurementswas used for base line subtraction at all temperatures, anychanges in the degree of scattered light encountered as afunction of temperature have not been accounted for. Thesecould give rise to an artifact that may present itself as aspectral redshift with increasing temperature. In this sectionwe predict the expected trend in scattered light intensitybased on the same method used by Quickenden and Irvin andKratohvil et al.6,26
Rayleigh scattering is sometimes expressed26 as the tur-bidity, b,
b =32'3kBTn2
3(4)T( #n
#p)
T
2(6 + 3*
6 ! 7*) , !3"
where ( is the wavelength of scattered light, n is the refrac-tive index at wavelength (, )T is the isothermal compress-ibility of the water in Pa!1, * is the depolarization ratio forRayleigh scattered light, and !#n /#p"T is in Pa!1. Many ofthese parameters have been updated since Quickenden andIrvin first attempted these calculations. Values for n and!#n /#p"T were obtained from Harvey et al.,27 and those for)T were taken from Wagner and Kruse.21 The average value*=0.107 !at 436 nm" was taken from the data of Kratohvil etal., and was assumed to be insensitive to temperature andwavelength, as these data are unavailable to our knowledge.The turbidity can be expressed as a molar absorptivity forscattering, &, in units of M!1 cm!1 via
& =10!5mb
d ln 10, !4"
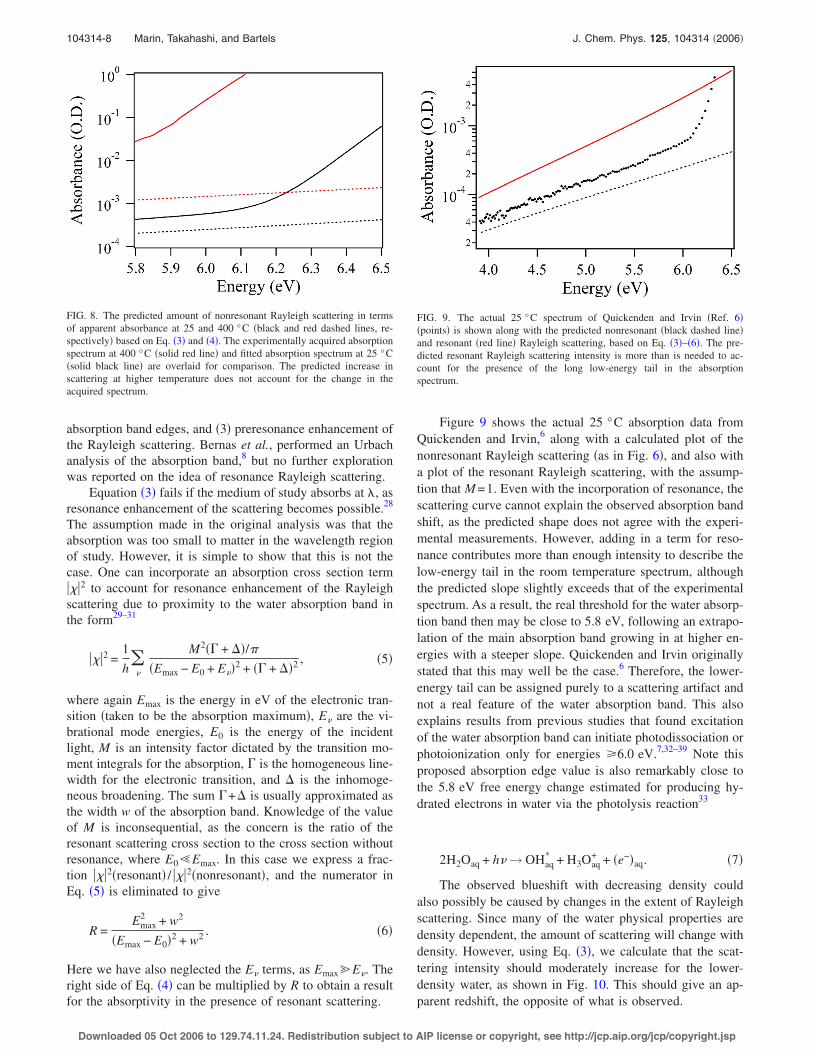
where d is the water density in g cm!3 and m is the watermolar mass in g mol!1. Figure 8 shows the predicted amountof Rayleigh scattering in terms of apparent absorbance at 25and 400 °C, overlaid with the acquired absorption spectrumat 400 °C and fitted absorption spectrum at 25 °C. It is ob-vious that the change in predicted scattering at the highertemperature is not great enough to account for the observedspectral shift. Rather, it indicates a factor of #2 intensifica-tion of the spectrum in this wavelength range.
It was originally demonstrated that the amount of inten-sity observed in a long red tail of the water spectrum below6 eV could not be accounted for by simple Rayleigh scatter-ing, as a calculation using Eq. !3" could not entirely compen-sate for the observed absorbance.6 Several alternatives wereproposed, including !1" presence of a weak, broad, electronicabsorption, !2" a breakdown of the empirical Urbach rule for
FIG. 6. H2O absorption spectrum at 400 °C and 300 bar !black dots" and fitusing Eq. !2" with Emax=7.587 eV !red line".
FIG. 7. Fitted shift in the absorption maximum Emax as a function of tem-perature for H2O !red crosses" and D2O !black, open circles".
104314-7 UV absorption edge of water J. Chem. Phys. 125, 104314 "2006!
Downloaded 05 Oct 2006 to 129.74.11.24. Redistribution subject to AIP license or copyright, see http://jcp.aip.org/jcp/copyright.jsp
absorption band edges, and !3" preresonance enhancement ofthe Rayleigh scattering. Bernas et al., performed an Urbachanalysis of the absorption band,8 but no further explorationwas reported on the idea of resonance Rayleigh scattering.
Equation !3" fails if the medium of study absorbs at (, asresonance enhancement of the scattering becomes possible.28
The assumption made in the original analysis was that theabsorption was too small to matter in the wavelength regionof study. However, it is simple to show that this is not thecase. One can incorporate an absorption cross section term+++2 to account for resonance enhancement of the Rayleighscattering due to proximity to the water absorption band inthe form29–31
+++2 =1h&
#
M2!, + -"/'!Emax ! E0 + E#"2 + !, + -"2 , !5"
where again Emax is the energy in eV of the electronic tran-sition !taken to be the absorption maximum", E# are the vi-brational mode energies, E0 is the energy of the incidentlight, M is an intensity factor dictated by the transition mo-ment integrals for the absorption, , is the homogeneous line-width for the electronic transition, and - is the inhomoge-neous broadening. The sum ,+- is usually approximated asthe width w of the absorption band. Knowledge of the valueof M is inconsequential, as the concern is the ratio of theresonant scattering cross section to the cross section withoutresonance, where E0.Emax. In this case we express a frac-tion +++2!resonant" / +++2!nonresonant", and the numerator inEq. !5" is eliminated to give
R =Emax
2 + w2
!Emax ! E0"2 + w2 . !6"
Here we have also neglected the E# terms, as Emax/E#. Theright side of Eq. !4" can be multiplied by R to obtain a resultfor the absorptivity in the presence of resonant scattering.
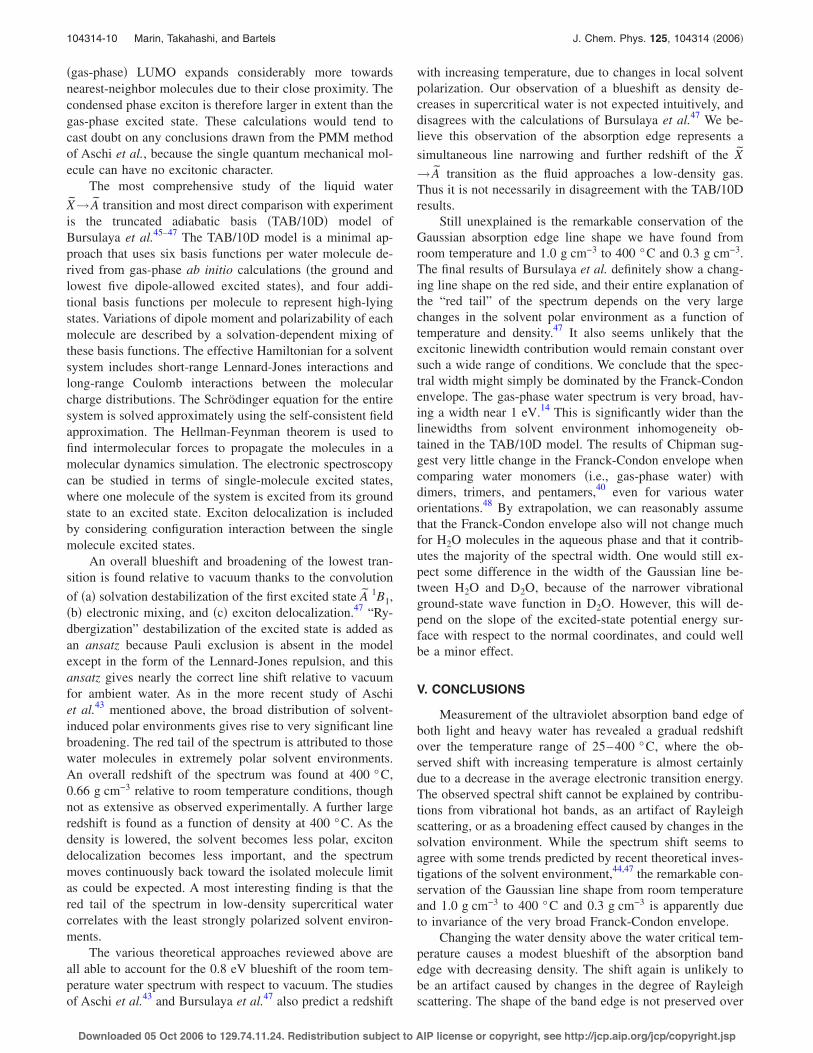
Figure 9 shows the actual 25 °C absorption data fromQuickenden and Irvin,6 along with a calculated plot of thenonresonant Rayleigh scattering !as in Fig. 6", and also witha plot of the resonant Rayleigh scattering, with the assump-tion that M =1. Even with the incorporation of resonance, thescattering curve cannot explain the observed absorption bandshift, as the predicted shape does not agree with the experi-mental measurements. However, adding in a term for reso-nance contributes more than enough intensity to describe thelow-energy tail in the room temperature spectrum, althoughthe predicted slope slightly exceeds that of the experimentalspectrum. As a result, the real threshold for the water absorp-tion band then may be close to 5.8 eV, following an extrapo-lation of the main absorption band growing in at higher en-ergies with a steeper slope. Quickenden and Irvin originallystated that this may well be the case.6 Therefore, the lower-energy tail can be assigned purely to a scattering artifact andnot a real feature of the water absorption band. This alsoexplains results from previous studies that found excitationof the water absorption band can initiate photodissociation orphotoionization only for energies 06.0 eV.7,32–39 Note thisproposed absorption edge value is also remarkably close tothe 5.8 eV free energy change estimated for producing hy-drated electrons in water via the photolysis reaction33
2H2Oaq + h# ! OHaq* + H3Oaq
+ + !e!"aq. !7"
The observed blueshift with decreasing density couldalso possibly be caused by changes in the extent of Rayleighscattering. Since many of the water physical properties aredensity dependent, the amount of scattering will change withdensity. However, using Eq. !3", we calculate that the scat-tering intensity should moderately increase for the lower-density water, as shown in Fig. 10. This should give an ap-parent redshift, the opposite of what is observed.
FIG. 8. The predicted amount of nonresonant Rayleigh scattering in termsof apparent absorbance at 25 and 400 °C !black and red dashed lines, re-spectively" based on Eq. !3" and !4". The experimentally acquired absorptionspectrum at 400 °C !solid red line" and fitted absorption spectrum at 25 °C!solid black line" are overlaid for comparison. The predicted increase inscattering at higher temperature does not account for the change in theacquired spectrum.
FIG. 9. The actual 25 °C spectrum of Quickenden and Irvin !Ref. 6"!points" is shown along with the predicted nonresonant !black dashed line"and resonant !red line" Rayleigh scattering, based on Eq. !3"–!6". The pre-dicted resonant Rayleigh scattering intensity is more than is needed to ac-count for the presence of the long low-energy tail in the absorptionspectrum.
104314-8 Marin, Takahashi, and Bartels J. Chem. Phys. 125, 104314 "2006!
Downloaded 05 Oct 2006 to 129.74.11.24. Redistribution subject to AIP license or copyright, see http://jcp.aip.org/jcp/copyright.jsp

C. Water structural changes
Having eliminated hot bands and Rayleigh scattering asserious possibilities, it seems that temperature dependence ofthe absorption band edge can be almost entirely ascribed to ashift of the lowest X! A electronic transition. The experi-mental evidence suggests that the temperature shift is due toa true shift of the band origin. Inhomogeneous line broaden-ing caused by changes in local solvation environments canprovide broadening and spectral shift of the absorption bandedge, but not in the absorption origin !maximum" as deducedhere.
The multiple supercritical water spectra we have ob-tained can be used to clearly separate density effects fromtemperature effects. The light water spectra in Fig. 3!a" areactually seen to blueshift by #0.1 eV with a decrease indensity. A similar trend was qualitatively observed at both360 and 380 °C !see Fig. 4", and is also evident in the D2Ospectra. Based on these results, we infer that density changescannot account for the redshift observed at lower tempera-tures. The density range covered at 400 °C in the light waterspectra !a factor of 3.6" far exceeds that between 25 and350 °C !a factor of 1.6", yet a much larger spectral shift wasexperimentally observed with the temperature change, and inthe opposite direction. This is quite surprising behavior, es-pecially in the supercritical regime, where one might conjec-ture that decreasing density should give more gaslike behav-ior, with an absorption spectrum that lies at lower energythan the liquid phase.
The degree of spectral shift observed between room tem-perature and the critical regime is remarkably large, and can-not be assigned to line broadening. As mentioned above, theabsorption band edge shape does not change with tempera-ture, as would be expected from a broadening effect. How-ever, this is not true for the lowest-density supercritical spec-tra at 400 °C. While the absorption edge shapes at0.358 g cm!3 !300 bar" and at 0.310 g cm!3 !290 bar" aresimilar to all lower temperature conditions, at densities be-low 0.30 g cm!3, the absorption edge takes on a steeper
slope. Thus, the small blueshift observed with decreasingdensity appears to be a decrease in the spectrum width ratherthan a shift of the entire absorption band.
A number of relatively recent theory papers shed light onthe nature of the X! A transition in water and ice. High levelab initio calculations of simple water clusters are able torecover most of the condensed phase blueshift in excitationof a water pentamer or even a trimer.40,41 Christiansen et al.41
make note of the “pushing effect” of water oxygens aboveand below the plane of the central molecule in the pentamer.A similar but less severe blueshift is evident for watertrapped in rare gas matrices.42 Moreover, the water dipolemoment is opposite in the ground state and the first excitedstate, making the excited state solvation unfavorable. It isclear that even a qualitatively correct treatment of the waterexcited state!s" requires inclusion of the extended medium.The calculations of Chipman40 on the pentamer are instruc-tive in showing that the first excited surface has dramaticallychanged relative to the monomer, being weakly bound ratherthan purely dissociative in the O–H stretch.
Aschi et al. have calculated the spectrum of the X! Atransition for a !quantum mechanical" water molecule in-cluded in a classical molecular dynamics simulation of theliquid.43 The spirit of their perturbed matrix method !PMM"calculation is in line with most quantum mechanical/molecular mechanical methods, using point charges of theclassical single point charge water molecules to represent theperturbing electric field. The quantum complete active spaceself-consistent field calculations using a 6-311++G!3df ,2pd" basis set with the perturbed potential and thestatistical averaging gave reasonably good agreement withthe room temperature !300 K" spectrum. Additional spectracalculated for 1 g cm!3 density at 500 and 800 K wereshifted to the red and broadened. As the authors note, thistemperature effect on the spectrum must be entirely ascribedto the electric field fluctuations of the solvent, though nodetailed analysis was presented. The apparent success of thecalculation in producing both the 300 K spectrum and a red-shift with temperature is very surprising given the relativesimplicity of the perturbation field. A direct comparison withour data is not possible because density was not also changedas in the experiment.
A more rigorous approach to the condensed phase spec-trum has been taken by Hahn et al.,44 who calculated thespectrum of hexagonal ice !ice-Ih" using density-functionaltheory within the density functional theory !DFT" general-ized gradient approximation !GGA". These investigationshave particularly illustrated the relative insensitivity of thewater highest occupied molecular orbital !HOMO" and highsensitivity of the lowest unoccupied molecular orbital!LUMO" to optical excitation, where the HOMO nearly re-tains its original geometry, but the LUMO becomes highlydelocalized. The energy of the lowest water absorption isassigned to three components: !1" the energy gap betweenthe ground and excited states, !2" the electron correlationenergy, which blueshifts the absorption band, and !3" theexciton binding energy, which redshifts the absorption band.Upon condensation of the water molecules, the already large
FIG. 10. Predicted nonresonant Rayleigh scattering at 400 °C for densitiesof 0.358 !solid black line" and 0.101 !dashed red line" g cm!3, as predictedusing Eq. !4". The apparent increase in Rayleigh scattering for lower densi-ties should give an apparent redshift, the opposite of what is observed.
104314-9 UV absorption edge of water J. Chem. Phys. 125, 104314 "2006!
Downloaded 05 Oct 2006 to 129.74.11.24. Redistribution subject to AIP license or copyright, see http://jcp.aip.org/jcp/copyright.jsp
!gas-phase" LUMO expands considerably more towardsnearest-neighbor molecules due to their close proximity. Thecondensed phase exciton is therefore larger in extent than thegas-phase excited state. These calculations would tend tocast doubt on any conclusions drawn from the PMM methodof Aschi et al., because the single quantum mechanical mol-ecule can have no excitonic character.
The most comprehensive study of the liquid waterX! A transition and most direct comparison with experimentis the truncated adiabatic basis !TAB/10D" model ofBursulaya et al.45–47 The TAB/10D model is a minimal ap-proach that uses six basis functions per water molecule de-rived from gas-phase ab initio calculations !the ground andlowest five dipole-allowed excited states", and four addi-tional basis functions per molecule to represent high-lyingstates. Variations of dipole moment and polarizability of eachmolecule are described by a solvation-dependent mixing ofthese basis functions. The effective Hamiltonian for a solventsystem includes short-range Lennard-Jones interactions andlong-range Coulomb interactions between the molecularcharge distributions. The Schrödinger equation for the entiresystem is solved approximately using the self-consistent fieldapproximation. The Hellman-Feynman theorem is used tofind intermolecular forces to propagate the molecules in amolecular dynamics simulation. The electronic spectroscopycan be studied in terms of single-molecule excited states,where one molecule of the system is excited from its groundstate to an excited state. Exciton delocalization is includedby considering configuration interaction between the singlemolecule excited states.
An overall blueshift and broadening of the lowest tran-sition is found relative to vacuum thanks to the convolutionof !a" solvation destabilization of the first excited state A 1B1,!b" electronic mixing, and !c" exciton delocalization.47 “Ry-dbergization” destabilization of the excited state is added asan ansatz because Pauli exclusion is absent in the modelexcept in the form of the Lennard-Jones repulsion, and thisansatz gives nearly the correct line shift relative to vacuumfor ambient water. As in the more recent study of Aschiet al.43 mentioned above, the broad distribution of solvent-induced polar environments gives rise to very significant linebroadening. The red tail of the spectrum is attributed to thosewater molecules in extremely polar solvent environments.An overall redshift of the spectrum was found at 400 °C,0.66 g cm!3 relative to room temperature conditions, thoughnot as extensive as observed experimentally. A further largeredshift is found as a function of density at 400 °C. As thedensity is lowered, the solvent becomes less polar, excitondelocalization becomes less important, and the spectrummoves continuously back toward the isolated molecule limitas could be expected. A most interesting finding is that thered tail of the spectrum in low-density supercritical watercorrelates with the least strongly polarized solvent environ-ments.
The various theoretical approaches reviewed above areall able to account for the 0.8 eV blueshift of the room tem-perature water spectrum with respect to vacuum. The studiesof Aschi et al.43 and Bursulaya et al.47 also predict a redshift
with increasing temperature, due to changes in local solventpolarization. Our observation of a blueshift as density de-creases in supercritical water is not expected intuitively, anddisagrees with the calculations of Bursulaya et al.47 We be-lieve this observation of the absorption edge represents asimultaneous line narrowing and further redshift of the X! A transition as the fluid approaches a low-density gas.Thus it is not necessarily in disagreement with the TAB/10Dresults.
Still unexplained is the remarkable conservation of theGaussian absorption edge line shape we have found fromroom temperature and 1.0 g cm!3 to 400 °C and 0.3 g cm!3.The final results of Bursulaya et al. definitely show a chang-ing line shape on the red side, and their entire explanation ofthe “red tail” of the spectrum depends on the very largechanges in the solvent polar environment as a function oftemperature and density.47 It also seems unlikely that theexcitonic linewidth contribution would remain constant oversuch a wide range of conditions. We conclude that the spec-tral width might simply be dominated by the Franck-Condonenvelope. The gas-phase water spectrum is very broad, hav-ing a width near 1 eV.14 This is significantly wider than thelinewidths from solvent environment inhomogeneity ob-tained in the TAB/10D model. The results of Chipman sug-gest very little change in the Franck-Condon envelope whencomparing water monomers !i.e., gas-phase water" withdimers, trimers, and pentamers,40 even for various waterorientations.48 By extrapolation, we can reasonably assumethat the Franck-Condon envelope also will not change muchfor H2O molecules in the aqueous phase and that it contrib-utes the majority of the spectral width. One would still ex-pect some difference in the width of the Gaussian line be-tween H2O and D2O, because of the narrower vibrationalground-state wave function in D2O. However, this will de-pend on the slope of the excited-state potential energy sur-face with respect to the normal coordinates, and could wellbe a minor effect.
V. CONCLUSIONS
Measurement of the ultraviolet absorption band edge ofboth light and heavy water has revealed a gradual redshiftover the temperature range of 25–400 °C, where the ob-served shift with increasing temperature is almost certainlydue to a decrease in the average electronic transition energy.The observed spectral shift cannot be explained by contribu-tions from vibrational hot bands, as an artifact of Rayleighscattering, or as a broadening effect caused by changes in thesolvation environment. While the spectrum shift seems toagree with some trends predicted by recent theoretical inves-tigations of the solvent environment,44,47 the remarkable con-servation of the Gaussian line shape from room temperatureand 1.0 g cm!3 to 400 °C and 0.3 g cm!3 is apparently dueto invariance of the very broad Franck-Condon envelope.
Changing the water density above the water critical tem-perature causes a modest blueshift of the absorption bandedge with decreasing density. The shift again is unlikely tobe an artifact caused by changes in the degree of Rayleighscattering. The shape of the band edge is not preserved over
104314-10 Marin, Takahashi, and Bartels J. Chem. Phys. 125, 104314 "2006!
Downloaded 05 Oct 2006 to 129.74.11.24. Redistribution subject to AIP license or copyright, see http://jcp.aip.org/jcp/copyright.jsp

the measured range of densities. We believe this small blue-shift of the edge results from a simultaneous line narrowingand redshift of the maximum as the density decreases to-wards the gas phase.
The low-energy 4.0–6.0 eV tail in the absorption bandof light water has been reinvestigated to determine its origin.The previously observed weak absorption in this region6 canbe explained as an artifact of resonance Rayleigh scatteringdue to its proximity to the true water absorption band. Theonset of the water absorption band is probably near 5.8 eV atroom temperature, a value that is in agreement with photo-ionization threshold experiments.7,32–39
ACKNOWLEDGMENTS
The authors express gratitude to Drs. Daniel M. Chip-man, G. N. R. Tripathi, and Ian Carmichael at the Universityof Notre Dame Radiation Laboratory for constructive discus-sions on the material herein. Work performed at ArgonneNational Laboratory, Argonne, Illinois 60439, under the aus-pices of the Office of Science, Division of Chemical Science,US-DOE under Contract No. W-31-109-ENG-38. The NotreDame Radiation Laboratory is supported by the Office ofBasic Energy Sciences at the United States Department ofEnergy. This is Document No. NDRL-4664 from the NotreDame Radiation Laboratory.
1 M. Halmann and I. Platzner, J. Phys. Chem. 70, 580 !1966".2 R. E. Verrall and W. A. Senior, J. Chem. Phys. 50, 2746 !1969".3 L. R. Painter, R. D. Birkhoff, and E. T. Arakawa, J. Chem. Phys. 51, 243!1969".
4 G. D. Kerr, R. N. Hamm, M. W. Williams, R. D. Birkhoff, and L. R.Painter, Phys. Rev. A 5, 2523 !1972".
5 J. M. Heller, R. N. Hamm, R. D. Birkhoff, and L. R. Painter, J. Chem.Phys. 60, 3483 !1974".
6 T. I. Quickenden and J. A. Irvin, J. Chem. Phys. 72, 4416 !1980".7 T. Goulet, A. Bernas, C. Ferradini, and J.-P. Jay-Gerin, Chem. Phys. Lett.
170, 492 !1990".8 A. Bernas, C. Ferradini, and J. P. Jay-Gerin, Chem. Phys. 222, 151!1997".
9 H. Hayashi, N. Watanabe, Y. Udagawa, and C. C. Kao, J. Chem. Phys.108, 823 !1998".
10 H. Hayashi, N. Watanabe, Y. Udagawa, and C. C. Kao, Proc. Natl. Acad.Sci. U.S.A. 97, 6264 !2000".
11 A. Bernas, C. Ferradini, and J. P. Jay-Gerin, J. Photochem. Photobiol., A117, 171 !1998".
12 P. Gürtler, V. Saile, and E. E. Koch, Chem. Phys. Lett. 51, 386 !1977".13 O. Dutuit, A. Tabche-Fouhaile, I. Nenner, H. Frohlich, and P. M. Guyon,
J. Chem. Phys. 83, 584 !1985".14 W. F. Chan, G. Cooper, and C. E. Brion, Chem. Phys. 178, 387 !1993".
15 G. Herzberg, Electronic Spectra and Electronic Structure of PolyatomicMolecules !Van Nostrand Reinhold, New York, 1966".
16 B.-M. Cheng, E. P. Chew, C.-P. Liu, M. Bahou, Y.-P. Lee, Y. L. Yung, andM. F. Gerstell, Geophys. Res. Lett. 26, 3657 !1999".
17 F. Urbach, Phys. Rev. 92, 1324 !1953".18 R. Onaka and T. Takahashi, J. Phys. Soc. Jpn. 24, 548 !1968".19 F. Williams, S. P. Varma, and S. Hillenius, J. Chem. Phys. 64, 1549
!1976".20 M. F. Fox and E. Hayon, J. Phys. Chem. 76, 2703 !1972".21 W. Wagner and A. Kruse, Properties of Water and Steam !Springer, Ber-
lin, 1998".22 P. G. Hill, R. D. C. MacMillan, and V. Lee, Report No. AECL-7531,
Atomic Energy of Canada Limited !AECL", 1981.23 M. Griggs, J. Chem. Phys. 49, 857 !1968".24 K. Takahashi, J. A. Cline, D. M. Bartels, and C. D. Jonah, Rev. Sci.
Instrum. 71, 3345 !2000".25 See EPAPS Document No. E-JCPSA6-125-012634 for a schematic of the
two-path sample cell used in these experiments. This document can bereached via a direct link in the online article’s HTML reference section orvia the EPAPS homepage !http://www.aip.org/pubservs/epaps.html".
26 J. P. Kratohvil, M. Kerker, and L. E. Oppenheimer, J. Chem. Phys. 43,914 !1965".
27 A. H. Harvey, J. S. Gallagher, and J. M. H. Levelt Sengers, J. Phys.Chem. Ref. Data 27, 761 !1998".
28 G. A. Miller, J. Phys. Chem. 82, 616 !1978".29 S. G. Stanton and R. Pecora, J. Chem. Phys. 75, 5615 !1981".30 A. P. Penner and W. Siebrand, Chem. Phys. Lett. 39, 11 !1976".31 R. A. Desiderio and B. S. Hudson, Chem. Phys. Lett. 61, 445 !1979".32 U. Sokolov and G. Stein, J. Chem. Phys. 44, 3329 !1966".33 J. W. Boyle, J. A. Ghormley, C. J. Hochanadel, and J. F. Riley, J. Phys.
Chem. 73, 2886 !1969".34 M. Anbar, G. A. St. John, H. R. Gloria, and R. F. Reinisch, in Water
Structure at the Water-Polymer Interface, edited by H. H. G. Jellinek!Plenum, New York, 1972", p. 85.
35 D. N. Nikogosyan and D. A. Angelov, Chem. Phys. Lett. 77, 208 !1981".36 D. N. Nikogosyan, A. A. Oraevsky, and V. I. Rupasov, Chem. Phys. 77,
131 !1983".37 M. U. Sander, K. Luther, and J. Troe, Ber. Bunsenges. Phys. Chem. 97,
953 !1993".38 A. Iwata, N. Nakashima, Y. Izawa, and C. Yamanaka, Chem. Lett. 1993,
1939.39 D. M. Bartels and R. A. Crowell, J. Phys. Chem. A 104, 3349 !2000".40 D. M. Chipman, J. Chem. Phys. 122, 044111 !2005".41 O. Christiansen, T. M. Nymand, and K. V. Mikkelsen, J. Chem. Phys.
113, 8101 !2000".42 M. Chergui, N. Schwentner, and V. Stepanenko, Chem. Phys. 187, 153
!1994".43 M. Aschi, M. D’Abramo, C. Di Teodoro, A. Di Nola, and A. Amadei,
Phys. Chem. Chem. Phys. 6, 53 !2005".44 P. H. Hahn, W. G. Schmidt, K. Seino, M. Preuss, F. Bechstedt, and J.
Bernholc, Phys. Rev. Lett. 94, 037404 !2005".45 B. D. Bursulaya and H. J. Kim, J. Chem. Phys. 109, 4911 !1998".46 B. D. Bursulaya and H. J. Kim, J. Chem. Phys. 110, 9646 !1999".47 B. D. Bursulaya, J. Jeon, C. N. Yang, and H. J. Kim, J. Phys. Chem. A
104, 45 !2000".48 D. M. Chipman, J. Chem. Phys. 124, 044305 !2006".
104314-11 UV absorption edge of water J. Chem. Phys. 125, 104314 "2006!
Downloaded 05 Oct 2006 to 129.74.11.24. Redistribution subject to AIP license or copyright, see http://jcp.aip.org/jcp/copyright.jsp
Related Documents