ADVANCES IN ATMOSPHERIC SCIENCES, VOL. 24, NO. 4, 2007, 655–663 Teleconnections of Inter-Annual Streamflow Fluctuation in Slovakia with Arctic Oscillation, North Atlantic Oscillation, Southern Oscillation, and Quasi-Biennial Oscillation Phenomena Pavla PEKAROVA 1 and Jan PEKAR * 2 1 Institute of Hydrology, Slovak Academy of Sciences, Racianska 75, 831 02 Bratislava 3, Slovak Republic 2 Department of Applied Mathematics and Statistics, Faculty of Mathematics, Physics and Informatics, Comenius University Bratislava, Mlynska dolina, 842 48 Bratislava, Slovak Republic (Received 9 January 2006; revised 1 December 2006) ABSTRACT The aim of the paper is to analyze a possible teleconnection of Quasi-Biennial Oscillation (QBO), South- ern Oscillation (SO), North Atlantic Oscillation (NAO), and Arctic Oscillation (AO) phenomena with long- term streamflow fluctuation of the Bela River (1895–2004) and Cierny Hron River (1931–2004) (central Slovakia). Homogeneity, long-term trends, as well as inter-annual dry and wet cycles were analyzed for the entire 1895–2004 time series of the Bela River and for the 1931–2004 time series of the Cierny Hron River. Inter-annual fluctuation of the wet and dry periods was identified using spectral analysis. The most signifi- cant period is that of 3.6 years. Other significant periods are those of 2.35 years, 13.5 years, and 21 years. Since these periods were found in other rivers of the world, as well as in SO, NAO, and AO phenomena, they can be considered as relating to the general regularity of the Earth. Key words: inter-annual discharge fluctuation, spectral analysis, teleconnection, Quasi-Biennial Oscilla- tion, Southern Oscillation, North Atlantic Oscillation, Arctic Oscillation DOI: 10.1007/s00376-007-0655-z 1. Introduction While analyzing the impact of climate change on hydrological regime changes of rivers, it is necessary to evaluate changes of hydrological characteristics of the basins that are uninfluenced by human activity. Dams and artificial reservoirs dramatically change the natural flow regime. Next, the analyzed time series must be as long as possible, and homogeneous. The time series of average annual discharge measured in the mountainous basins of the Vah and Hron Rivers in Central Slovakia satisfy these conditions. The aim of the study is to analyze a possible teleconnection of Quasi-Biennial Oscillation (QBO), Southern Oscillation (SO), North Atlantic Oscillation (NAO), and Arctic Oscillation (AO) phenomena with long-term streamflow fluctuation in two uninfluenced mountainous basins in Slovakia (Central Europe): (1) the Bela River (Podbanske, Vah River basin, 1895– 2004); and (2) the Cierny Hron River (Hronec, Hron River basin 1931–2004). In recent years, many scientists have studied the relationships between atmospheric phenomena (such as AO, SO and NAO) and some hydroclimatic charac- teristics (such as total precipitation, air temperature, discharge, snow and ice cover, flood risk, sea level se- ries, coral oxygen isotope records, dendrochronological series etc). For example, Jevrejeva and Moore (2001) and Jevrejeva et al. (2003) studied the variability in time series of ice conditions in the Baltic Sea within the context of NAO and AO winter indices using the sin- gular spectrum analysis (SSA) and wavelet approach. According to these authors, cross-wavelet power for the time series indicates that the times of largest vari- ance in ice conditions are in excellent agreement with significant power in the AO at 2.2-3.5-, 5.7-7.8-, and 12–20-yr periods. Similar patterns are also seen with the Southern Oscillation index (SOI) and the Ni˜ no-3 * Corresponding author: Jan PEKAR, [email protected]

Welcome message from author
This document is posted to help you gain knowledge. Please leave a comment to let me know what you think about it! Share it to your friends and learn new things together.
Transcript

ADVANCES IN ATMOSPHERIC SCIENCES, VOL. 24, NO. 4, 2007, 655–663
Teleconnections of Inter-Annual Streamflow Fluctuation in Slovakia
with Arctic Oscillation, North Atlantic Oscillation, Southern
Oscillation, and Quasi-Biennial Oscillation Phenomena
Pavla PEKAROVA1 and Jan PEKAR∗2
1Institute of Hydrology, Slovak Academy of Sciences, Racianska 75, 831 02 Bratislava 3, Slovak Republic
2Department of Applied Mathematics and Statistics, Faculty of Mathematics, Physics and Informatics, Comenius
University Bratislava, Mlynska dolina, 842 48 Bratislava, Slovak Republic
(Received 9 January 2006; revised 1 December 2006)
ABSTRACT
The aim of the paper is to analyze a possible teleconnection of Quasi-Biennial Oscillation (QBO), South-ern Oscillation (SO), North Atlantic Oscillation (NAO), and Arctic Oscillation (AO) phenomena with long-term streamflow fluctuation of the Bela River (1895–2004) and Cierny Hron River (1931–2004) (centralSlovakia). Homogeneity, long-term trends, as well as inter-annual dry and wet cycles were analyzed for theentire 1895–2004 time series of the Bela River and for the 1931–2004 time series of the Cierny Hron River.Inter-annual fluctuation of the wet and dry periods was identified using spectral analysis. The most signifi-cant period is that of 3.6 years. Other significant periods are those of 2.35 years, 13.5 years, and 21 years.Since these periods were found in other rivers of the world, as well as in SO, NAO, and AO phenomena,they can be considered as relating to the general regularity of the Earth.
Key words: inter-annual discharge fluctuation, spectral analysis, teleconnection, Quasi-Biennial Oscilla-tion, Southern Oscillation, North Atlantic Oscillation, Arctic Oscillation
DOI: 10.1007/s00376-007-0655-z
1. Introduction
While analyzing the impact of climate change onhydrological regime changes of rivers, it is necessaryto evaluate changes of hydrological characteristics ofthe basins that are uninfluenced by human activity.Dams and artificial reservoirs dramatically change thenatural flow regime. Next, the analyzed time seriesmust be as long as possible, and homogeneous. Thetime series of average annual discharge measured inthe mountainous basins of the Vah and Hron Rivers inCentral Slovakia satisfy these conditions.
The aim of the study is to analyze a possibleteleconnection of Quasi-Biennial Oscillation (QBO),Southern Oscillation (SO), North Atlantic Oscillation(NAO), and Arctic Oscillation (AO) phenomena withlong-term streamflow fluctuation in two uninfluencedmountainous basins in Slovakia (Central Europe): (1)the Bela River (Podbanske, Vah River basin, 1895–
2004); and (2) the Cierny Hron River (Hronec, HronRiver basin 1931–2004).
In recent years, many scientists have studied therelationships between atmospheric phenomena (suchas AO, SO and NAO) and some hydroclimatic charac-teristics (such as total precipitation, air temperature,discharge, snow and ice cover, flood risk, sea level se-ries, coral oxygen isotope records, dendrochronologicalseries etc). For example, Jevrejeva and Moore (2001)and Jevrejeva et al. (2003) studied the variability intime series of ice conditions in the Baltic Sea within thecontext of NAO and AO winter indices using the sin-gular spectrum analysis (SSA) and wavelet approach.According to these authors, cross-wavelet power forthe time series indicates that the times of largest vari-ance in ice conditions are in excellent agreement withsignificant power in the AO at 2.2−3.5-, 5.7−7.8-, and12–20-yr periods. Similar patterns are also seen withthe Southern Oscillation index (SOI) and the Nino-3
∗Corresponding author: Jan PEKAR, [email protected]
656 INTER-ANNUAL STREAMFLOW FLUCTUATION IN SLOVAKIA AND SOME GLOBAL PHENOMENA VOL. 24
Danube VahHron Bela: PodbanskeC.Hron: Hronec100 kmFig. 1. Locations of the Bela River (Vah basin) and theCierny Hron River (Hron basin), central Slovakia.
sea surface temperature series. Wavelet coherenceshows in-phase linkages between the 2.2−7.8- and12−20-yr period signals in both tropical and Arctic at-mospheric circulation, and also with ice conditions inthe Baltic Sea. Anctil and Coulibaly (2003) describedthe local inter-annual variability in southern Quebecstreamflow based on wavelet analysis, and identifiedplausible climatic teleconnections that could explainthese local variations. The span of available observa-tions (1938–2000) allowed depicting the variance forperiods of up to around 12 years. The most strikingfeature, in the 2–3-yr band, in the 3–6-yr band, andthe 6–12-yr band (dominated by white noise and notconsidered any further) was a net distinction betweenthe timing of the inter-annual variability in local west-ern and eastern streamflows, which may be linked tothe local climatology. Turkes and Erlat (2003) andUvo (2003) studied teleconnection of NAO variabilitywith precipitation variability in Turkey, and in North-ern Europe, respectively. Felis et al. (2000) studieda 245-yr coral oxygen isotope record from the north-ern Red Sea in bimonthly resolution. A close to 70-yr oscillation of probably North Atlantic origin dom-inates the coral time series. Inter-annual to inter-decadal variability was correlated with instrumentalindices of the NAO, the El Nino-Southern Oscillation(ENSO), and North Pacific climate variability. Theresults suggested that these modes have consistentlycontributed to Middle East climate variability since atleast 1750, predominantly at a period of close to 5.7years. Yang et al. (2000) investigated the ENSO tele-connection with annual precipitation series (TibetianPlateau, China) from 1690 to 1987 (nearly 300 years).
The results showed that negative precipitation anoma-lies are significantly associated with El Nino years.Tardif et al. (2003) studied variations in periodicitiesof the radial growth response of black ash exposed toyearly spring flooding in relation to hydrological fluc-tuations at Lake Duparquet in northwestern Quebec.They detected approximate 3.5-, 3.75- and 7.5-yr peri-odicities in all the dendrochronological series. Accord-ing to the authors, the 3.75- and 7.5-yr components areharmonics of a 15-yr periodicity. Youn (2005) quan-tified major periodicities in surface air temperaturevariations over the Korean Penisula. Using spectralanalysis it was found that the most dominant patterncentered at 2.3 years.
2. Data description
In our analyses we used the annual average dis-charge time series from two mountainous basins in theCarpathian region of Slovakia, namely from the BelaRiver basin and the Cierny Hron River basin. The for-mer, as a part of the upper Vah River basin, is locatedinland—about 600 km from the Baltic Sea, 850 kmfrom the Atlantic Ocean, and 700 km from the Adri-atic Sea (see Fig. 1). The basin lies within the mostprecipitated region of Slovakia; average annual totalprecipitation in the basin is 1473 mm. The long-termaverage specific runoff of the Bela River at Podbanskeis 37 dm3 s−1 km−2.
The Cierny Hron River lies in the upper Hron Riverbasin and is a left-hand tributary of the Hron River.The distance of the basin from both the Baltic Sea andthe Adriatic Sea is approximately the same −650 km.The basic hydrological characteristics of both consid-ered basins are given in Table 1. Even though theCierny Hron River basin is twice as large as the BelaRiver basin, the average annual discharge of the CiernyHron River is lower than that of the Bela River due toits lower specific runoff (Skoda et al., 2005; Pekarovaand Szolgay, 2005).
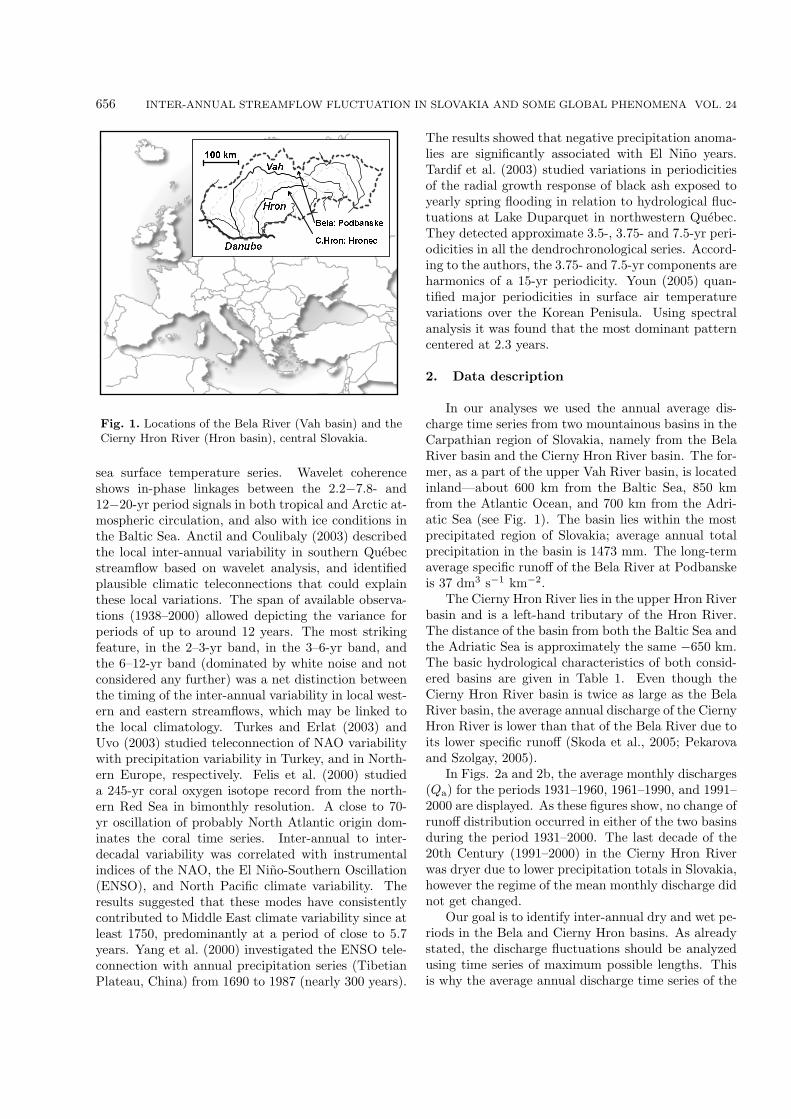
In Figs. 2a and 2b, the average monthly discharges(Qa) for the periods 1931–1960, 1961–1990, and 1991–2000 are displayed. As these figures show, no change ofrunoff distribution occurred in either of the two basinsduring the period 1931–2000. The last decade of the20th Century (1991–2000) in the Cierny Hron Riverwas dryer due to lower precipitation totals in Slovakia,however the regime of the mean monthly discharge didnot get changed.
Our goal is to identify inter-annual dry and wet pe-riods in the Bela and Cierny Hron basins. As alreadystated, the discharge fluctuations should be analyzedusing time series of maximum possible lengths. Thisis why the average annual discharge time series of the
NO. 4 PEKAROVA AND PEKAR 657
Table 1. Basic hydrological characteristics of the selected basins.
River Station Area (km2) Lmax Lmin Period Qa qa cs cv r1 r2 r6
Bela Podbanske 93.5 2494 922 1895–2003 3.50 37.3 0.18 0.20 0.06 −0.19 −0.32C. Hron Hronec 239.0 1338 480 1931–2003 2.94 12.3 0.32 0.32 0.25 0.04 −0.08
Lmax and Lmin, maximum and minimum altitude (m a.s.l.); Qa, average annual discharge (m3 s−1); qa, mean annual specific yield
(dm3 s−1 km−2); cs, coefficient of asymmetry; cv, coefficient of variation; r1, r2, and r6, auto correlation coefficients of lags (−1,−2
and −6 years, respectively).
0246810 I III V VII IX XIQm (m3 s-1 ) 1885-19301931-19601961-19901991-2000Bela: Podbanske(a) 02468 I III V VII IX XIQm (m3 s-1 ) 1931-19601961-19901991-2000C. Hron: Hronec(b) Fig. 2. Average monthly discharge (Qm) for the periods 1931–1960, 1961–1990 and 1991–2000: (a) BelaRiver (including an historical data reconstruction for the period 1885–1930); (b) Cierny Hron River.
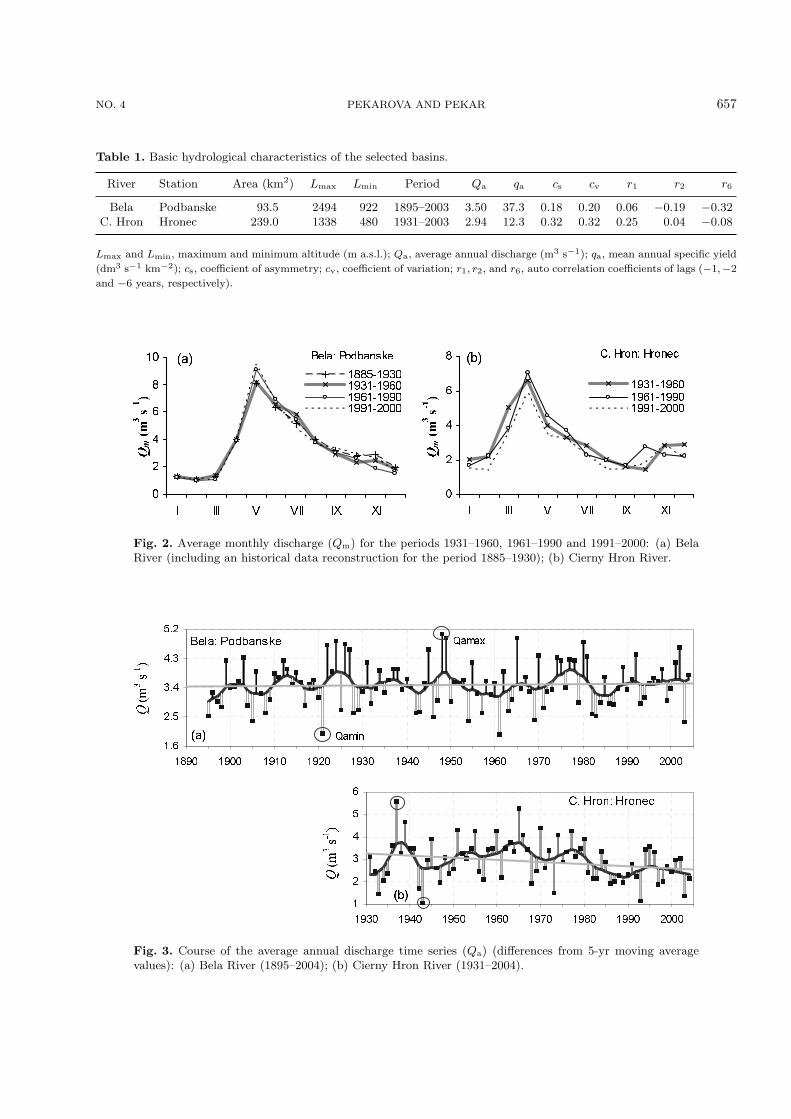
1.62.53.44.35.21890 1900 1910 1920 1930 1940 1950 1960 1970 1980 1990 2000Q (m3 s-1) Bela: Podbanske Qamin Qamax(a) 1234561930 1940 1950 1960 1970 1980 1990 2000Q (m3 s-1) C. Hron: Hronec(b) Q (m3 s-1 )
Q (m3 s-1 ) Fig. 3. Course of the average annual discharge time series (Qa) (differences from 5-yr moving averagevalues): (a) Bela River (1895–2004); (b) Cierny Hron River (1931–2004).
658 INTER-ANNUAL STREAMFLOW FLUCTUATION IN SLOVAKIA AND SOME GLOBAL PHENOMENA VOL. 24 -0.4-0.3-0.2-0.100.10.20.30.4 0 10 20 30 40 50Lag (yr)Autocorrelation coeff. 95%95%Bela, 1895-2004
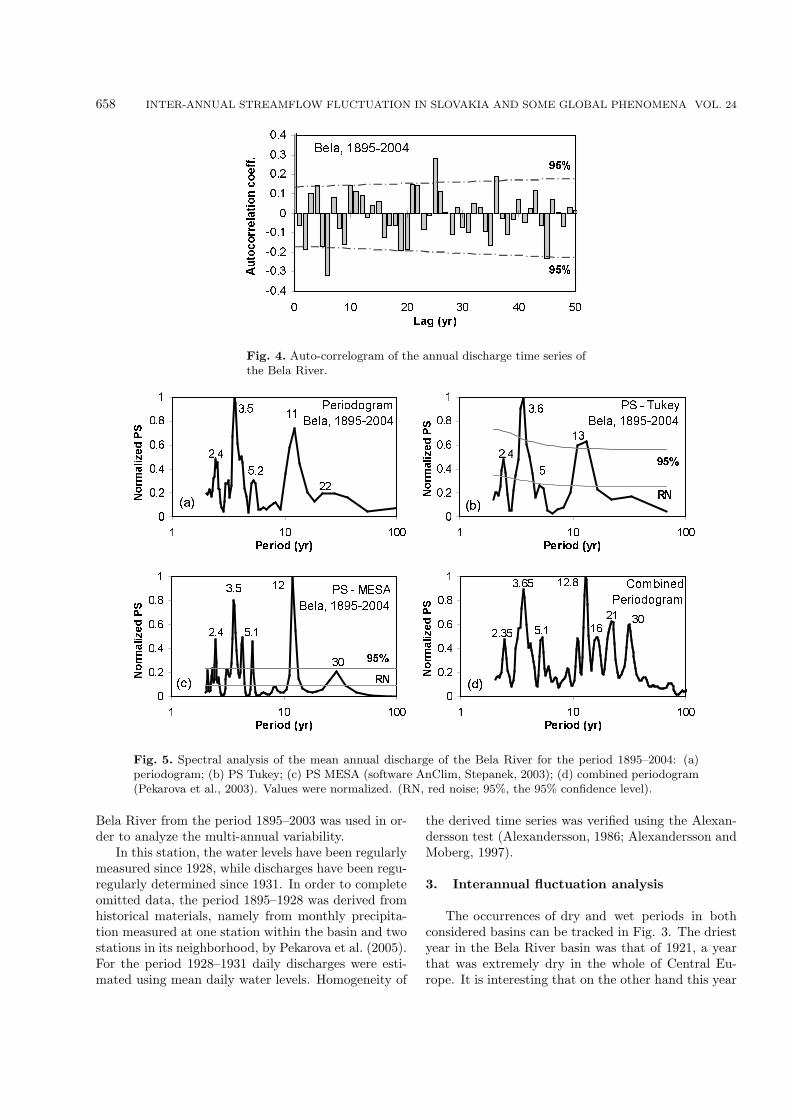
Fig. 4. Auto-correlogram of the annual discharge time series ofthe Bela River.
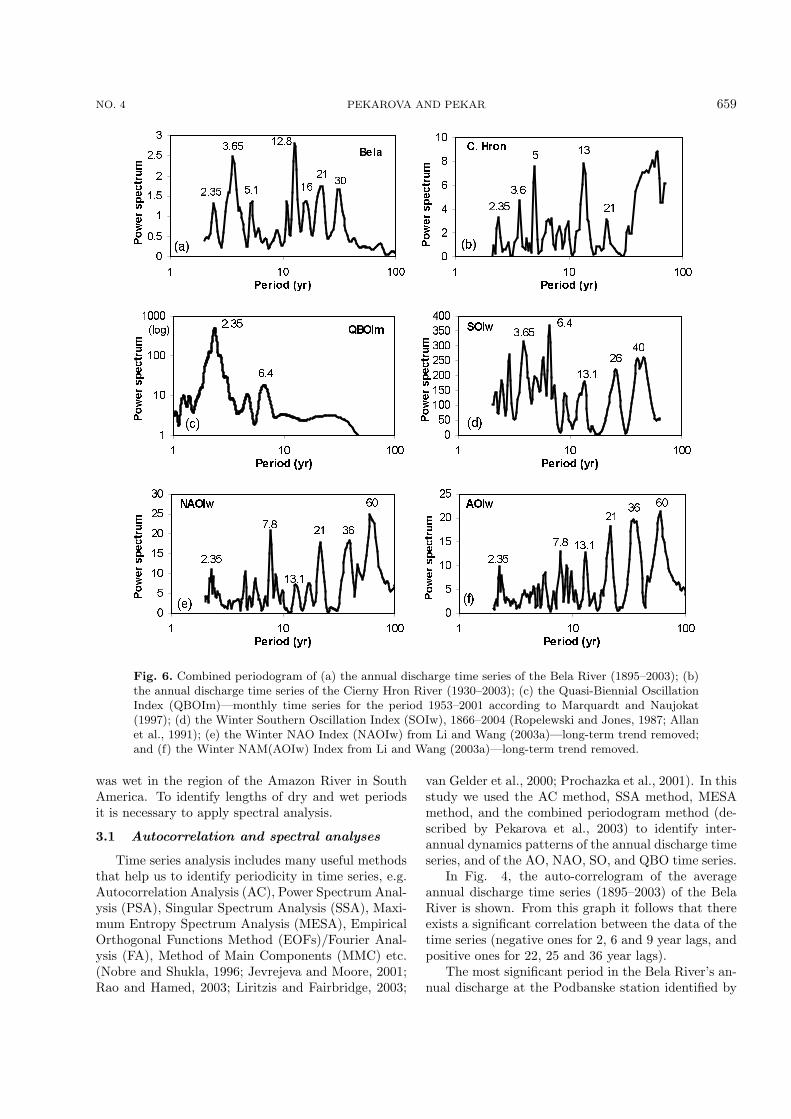
00.20.40.60.81 1 10 100Period (yr)Normalized PS 3.55.2 11 222.4(a) PeriodogramBela, 1895-2004 00.20.40.60.81 1 10 100Period (yr)Normalized PS 3.65 132.4(b) PS - TukeyBela, 1895-200495%RN 00.20.40.60.81 1 10 100Period (yr)Normalized PS 3.5 5.1 122.4(c) PS - MESABela, 1895-200495%RN30 00.20.40.60.81 1 10 100Period (yr)Normalized PS 3.655.1 12.8 212.35(d) 30CombinedPeriodogram16 Fig. 5. Spectral analysis of the mean annual discharge of the Bela River for the period 1895–2004: (a)periodogram; (b) PS Tukey; (c) PS MESA (software AnClim, Stepanek, 2003); (d) combined periodogram(Pekarova et al., 2003). Values were normalized. (RN, red noise; 95%, the 95% confidence level).
Bela River from the period 1895–2003 was used in or-der to analyze the multi-annual variability.
In this station, the water levels have been regularlymeasured since 1928, while discharges have been regu-regularly determined since 1931. In order to completeomitted data, the period 1895–1928 was derived fromhistorical materials, namely from monthly precipita-tion measured at one station within the basin and twostations in its neighborhood, by Pekarova et al. (2005).For the period 1928–1931 daily discharges were esti-mated using mean daily water levels. Homogeneity of
the derived time series was verified using the Alexan-dersson test (Alexandersson, 1986; Alexandersson andMoberg, 1997).
3. Interannual fluctuation analysis
The occurrences of dry and wet periods in bothconsidered basins can be tracked in Fig. 3. The driestyear in the Bela River basin was that of 1921, a yearthat was extremely dry in the whole of Central Eu-rope. It is interesting that on the other hand this year
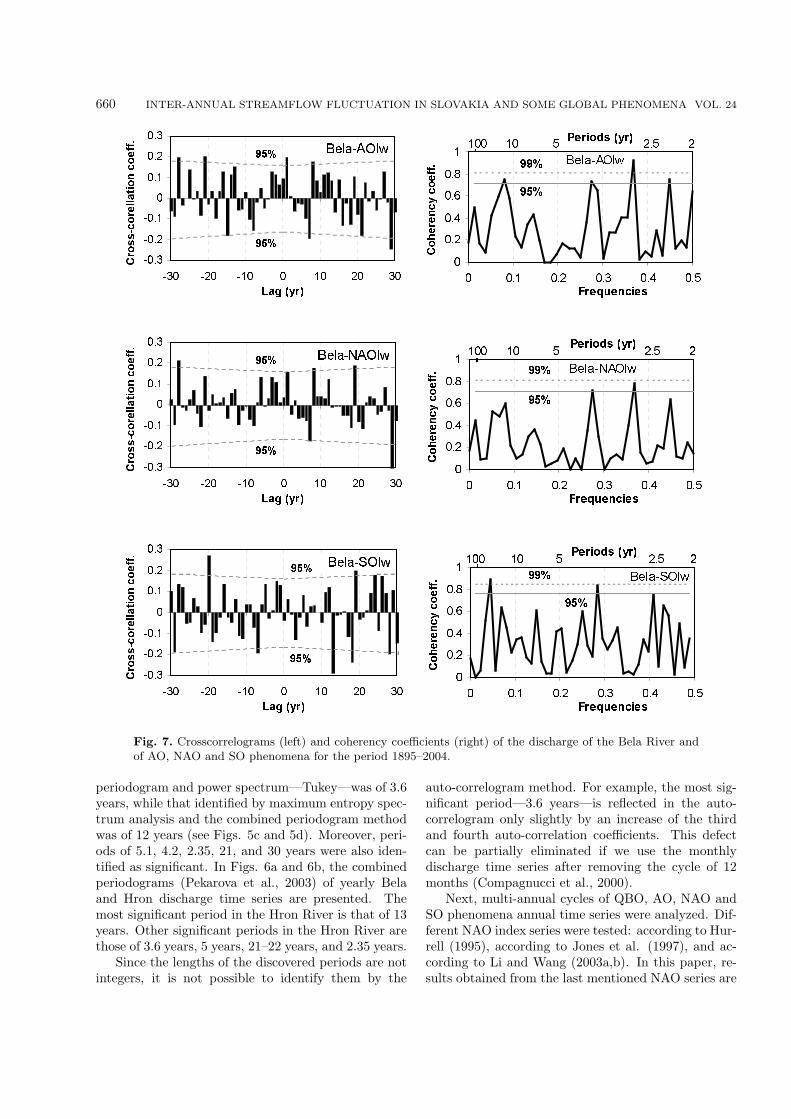
NO. 4 PEKAROVA AND PEKAR 65900.511.522.53 1 10 100Period (yr)Power spectrum 3.655.1 12.8 212.35(a) 3016 Bela 0246810 1 10 100Period (yr)Power spectrum 3.6 5 132.35(b)C. Hron 21 1101001000 1 10 100Period (yr)Power spectrum 2.35 6.4(c) QBOIm(log) 050100150200250300350400 1 10 100Period (yr)Power spectrum 3.65 6.4 13.1 26 40(d)SOIw 051015202530 1 10 100Period (yr)Power spectrum 2.35 7.8 13.1 21 36 60(e)NAOIw 0510152025 1 10 100Period (yr)Power spectrum 2.35 7.8 13.1 21 36 60(f)AOIw Fig. 6. Combined periodogram of (a) the annual discharge time series of the Bela River (1895–2003); (b)the annual discharge time series of the Cierny Hron River (1930–2003); (c) the Quasi-Biennial OscillationIndex (QBOIm)—monthly time series for the period 1953–2001 according to Marquardt and Naujokat(1997); (d) the Winter Southern Oscillation Index (SOIw), 1866–2004 (Ropelewski and Jones, 1987; Allanet al., 1991); (e) the Winter NAO Index (NAOIw) from Li and Wang (2003a)—long-term trend removed;and (f) the Winter NAM(AOIw) Index from Li and Wang (2003a)—long-term trend removed.
was wet in the region of the Amazon River in SouthAmerica. To identify lengths of dry and wet periodsit is necessary to apply spectral analysis.
3.1 Autocorrelation and spectral analyses
Time series analysis includes many useful methodsthat help us to identify periodicity in time series, e.g.Autocorrelation Analysis (AC), Power Spectrum Anal-ysis (PSA), Singular Spectrum Analysis (SSA), Maxi-mum Entropy Spectrum Analysis (MESA), EmpiricalOrthogonal Functions Method (EOFs)/Fourier Anal-ysis (FA), Method of Main Components (MMC) etc.(Nobre and Shukla, 1996; Jevrejeva and Moore, 2001;Rao and Hamed, 2003; Liritzis and Fairbridge, 2003;
van Gelder et al., 2000; Prochazka et al., 2001). In thisstudy we used the AC method, SSA method, MESAmethod, and the combined periodogram method (de-scribed by Pekarova et al., 2003) to identify inter-annual dynamics patterns of the annual discharge timeseries, and of the AO, NAO, SO, and QBO time series.
In Fig. 4, the auto-correlogram of the averageannual discharge time series (1895–2003) of the BelaRiver is shown. From this graph it follows that thereexists a significant correlation between the data of thetime series (negative ones for 2, 6 and 9 year lags, andpositive ones for 22, 25 and 36 year lags).
The most significant period in the Bela River’s an-nual discharge at the Podbanske station identified by
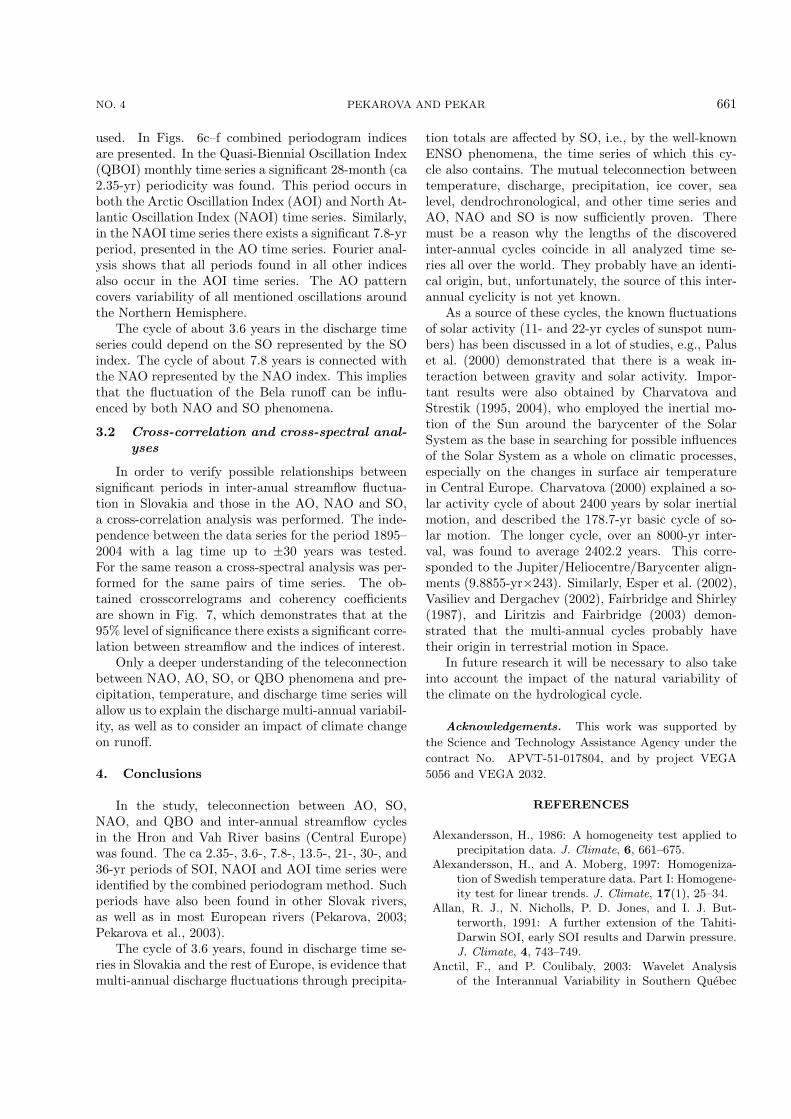
660 INTER-ANNUAL STREAMFLOW FLUCTUATION IN SLOVAKIA AND SOME GLOBAL PHENOMENA VOL. 24-0.3-0.2-0.100.10.20.3-30 -20 -10 0 10 20 30Lag (yr)Cross-corellation coeff. Bela-AOIw95%95% 00.20.40.60.81 0 0.1 0.2 0.3 0.4 0.5FrequenciesCoherency coeff. Bela-AOIw95%99%10 5 2.5Periods (yr) 2'100 -0.3-0.2-0.100.10.20.3-30 -20 -10 0 10 20 30Lag (yr)Cross-corellation coeff. Bela-NAOIw95%95% 00.20.40.60.81 0 0.1 0.2 0.3 0.4 0.5FrequenciesCoherency coeff. Bela-NAOIw95%99%10 5 2.5Periods (yr) 2'100 -0.3-0.2-0.100.10.20.3-30 -20 -10 0 10 20 30Lag (yr)Cross-corellation coeff. Bela-SOIw95%95% 00.20.40.60.81 0 0.1 0.2 0.3 0.4 0.5FrequenciesCoherency coeff. Bela-SOIw95%99%10 5 2.5Periods (yr) 2'100 Fig. 7. Crosscorrelograms (left) and coherency coefficients (right) of the discharge of the Bela River andof AO, NAO and SO phenomena for the period 1895–2004.
periodogram and power spectrum—Tukey—was of 3.6years, while that identified by maximum entropy spec-trum analysis and the combined periodogram methodwas of 12 years (see Figs. 5c and 5d). Moreover, peri-ods of 5.1, 4.2, 2.35, 21, and 30 years were also iden-tified as significant. In Figs. 6a and 6b, the combinedperiodograms (Pekarova et al., 2003) of yearly Belaand Hron discharge time series are presented. Themost significant period in the Hron River is that of 13years. Other significant periods in the Hron River arethose of 3.6 years, 5 years, 21–22 years, and 2.35 years.
Since the lengths of the discovered periods are notintegers, it is not possible to identify them by the
auto-correlogram method. For example, the most sig-nificant period—3.6 years—is reflected in the auto-correlogram only slightly by an increase of the thirdand fourth auto-correlation coefficients. This defectcan be partially eliminated if we use the monthlydischarge time series after removing the cycle of 12months (Compagnucci et al., 2000).
Next, multi-annual cycles of QBO, AO, NAO andSO phenomena annual time series were analyzed. Dif-ferent NAO index series were tested: according to Hur-rell (1995), according to Jones et al. (1997), and ac-cording to Li and Wang (2003a,b). In this paper, re-sults obtained from the last mentioned NAO series are
NO. 4 PEKAROVA AND PEKAR 661
used. In Figs. 6c–f combined periodogram indicesare presented. In the Quasi-Biennial Oscillation Index(QBOI) monthly time series a significant 28-month (ca2.35-yr) periodicity was found. This period occurs inboth the Arctic Oscillation Index (AOI) and North At-lantic Oscillation Index (NAOI) time series. Similarly,in the NAOI time series there exists a significant 7.8-yrperiod, presented in the AO time series. Fourier anal-ysis shows that all periods found in all other indicesalso occur in the AOI time series. The AO patterncovers variability of all mentioned oscillations aroundthe Northern Hemisphere.
The cycle of about 3.6 years in the discharge timeseries could depend on the SO represented by the SOindex. The cycle of about 7.8 years is connected withthe NAO represented by the NAO index. This impliesthat the fluctuation of the Bela runoff can be influ-enced by both NAO and SO phenomena.
3.2 Cross-correlation and cross-spectral anal-yses
In order to verify possible relationships betweensignificant periods in inter-anual streamflow fluctua-tion in Slovakia and those in the AO, NAO and SO,a cross-correlation analysis was performed. The inde-pendence between the data series for the period 1895–2004 with a lag time up to ±30 years was tested.For the same reason a cross-spectral analysis was per-formed for the same pairs of time series. The ob-tained crosscorrelograms and coherency coefficientsare shown in Fig. 7, which demonstrates that at the95% level of significance there exists a significant corre-lation between streamflow and the indices of interest.
Only a deeper understanding of the teleconnectionbetween NAO, AO, SO, or QBO phenomena and pre-cipitation, temperature, and discharge time series willallow us to explain the discharge multi-annual variabil-ity, as well as to consider an impact of climate changeon runoff.
4. Conclusions
In the study, teleconnection between AO, SO,NAO, and QBO and inter-annual streamflow cyclesin the Hron and Vah River basins (Central Europe)was found. The ca 2.35-, 3.6-, 7.8-, 13.5-, 21-, 30-, and36-yr periods of SOI, NAOI and AOI time series wereidentified by the combined periodogram method. Suchperiods have also been found in other Slovak rivers,as well as in most European rivers (Pekarova, 2003;Pekarova et al., 2003).
The cycle of 3.6 years, found in discharge time se-ries in Slovakia and the rest of Europe, is evidence thatmulti-annual discharge fluctuations through precipita-
tion totals are affected by SO, i.e., by the well-knownENSO phenomena, the time series of which this cy-cle also contains. The mutual teleconnection betweentemperature, discharge, precipitation, ice cover, sealevel, dendrochronological, and other time series andAO, NAO and SO is now sufficiently proven. Theremust be a reason why the lengths of the discoveredinter-annual cycles coincide in all analyzed time se-ries all over the world. They probably have an identi-cal origin, but, unfortunately, the source of this inter-annual cyclicity is not yet known.
As a source of these cycles, the known fluctuationsof solar activity (11- and 22-yr cycles of sunspot num-bers) has been discussed in a lot of studies, e.g., Paluset al. (2000) demonstrated that there is a weak in-teraction between gravity and solar activity. Impor-tant results were also obtained by Charvatova andStrestik (1995, 2004), who employed the inertial mo-tion of the Sun around the barycenter of the SolarSystem as the base in searching for possible influencesof the Solar System as a whole on climatic processes,especially on the changes in surface air temperaturein Central Europe. Charvatova (2000) explained a so-lar activity cycle of about 2400 years by solar inertialmotion, and described the 178.7-yr basic cycle of so-lar motion. The longer cycle, over an 8000-yr inter-val, was found to average 2402.2 years. This corre-sponded to the Jupiter/Heliocentre/Barycenter align-ments (9.8855-yr×243). Similarly, Esper et al. (2002),Vasiliev and Dergachev (2002), Fairbridge and Shirley(1987), and Liritzis and Fairbridge (2003) demon-strated that the multi-annual cycles probably havetheir origin in terrestrial motion in Space.
In future research it will be necessary to also takeinto account the impact of the natural variability ofthe climate on the hydrological cycle.
Acknowledgements. This work was supported by
the Science and Technology Assistance Agency under the
contract No. APVT-51-017804, and by project VEGA
5056 and VEGA 2032.
REFERENCES
Alexandersson, H., 1986: A homogeneity test applied toprecipitation data. J. Climate, 6, 661–675.
Alexandersson, H., and A. Moberg, 1997: Homogeniza-tion of Swedish temperature data. Part I: Homogene-ity test for linear trends. J. Climate, 17(1), 25–34.
Allan, R. J., N. Nicholls, P. D. Jones, and I. J. But-terworth, 1991: A further extension of the Tahiti-Darwin SOI, early SOI results and Darwin pressure.J. Climate, 4, 743–749.
Anctil, F., and P. Coulibaly, 2003: Wavelet Analysisof the Interannual Variability in Southern Quebec
662 INTER-ANNUAL STREAMFLOW FLUCTUATION IN SLOVAKIA AND SOME GLOBAL PHENOMENA VOL. 24
Streamflow. J. Climate, 17(1), 163–173.Charvatova, I., 2000: Can origin of the 2400-year cycle
of solar activity be caused by solar inertial motion?Annales Geophysicae - Series A: Upper Atmosphereand Space Sciences, 18(4), 399–405.
Charvatova, I., and J. Strestik, 1995: Long-term changesof the surface air-temperature in relation to solar in-ertial motion. Climatic Change, 29(3), 333–352.
Charvatova, I., and J. Strestik, 2004: Periodocities be-tween 6 and 16 years in surface air temperature inpossible relation to solar inertial motion. Journal At-mospheric and Solar Terrestrial Physics, 66, 219–227.
Compagnucci, R., S. A. Blanco, M. A. Figliola, and P.M. Jacovkis, 2000: Variability in subtropical AndeanArgentinean Atuel river; a wavelet approach. Envi-ronmetrics, 11(3), 2 51–269.
Esper, J., E. R. Cook, and F. H. Schweingruber, 2002:Low-frequency signals in long tree-ring chronologiesfor recostructing past temperature variability. Sci-ence, 295, 2250–2253.
Fairbridge, R. V., and J. H. Shirley, 1987: Prolonged min-ima and the 179-yr cycle of the solar inertial motion.Solar Physics, 110, 191–220.
Felis, T., J. Patzold, Y. Loya, M. Fine, A. H. Nawar, andG. Wefer, 2000: A coral oxygen isotope record fromthe northern Red Sea documenting NAO, ENSO,and North Pacific teleconnections on Middle East cli-mate variability since the year 1750. Paleoceanogra-phy, 15(6), 679–694.
Hurrell, J. W., 1995: Decadal trends in the North AtlanticOscillation regional temperatures and precipitation.Science, 269, 676–679.
Jevrejeva, S., and J. C. Moore, 2001: Singular SpectrumAnalysis of Baltic Sea ice conditions and large-scaleatmospheric patterns since 1708. Geophys. Res. Lett.,28(23), 4503–4506.
Jevrejeva, S., J. C. Moore, and A. Grinsted, 2003: Influ-ence of the arctic oscillation and El Nino-SouthernOscillation (ENSO) on ice conditions in the BalticSea: The wavelet approach. J. Geophys. Res., 108,D21, Articel No. 4677.
Jones, P. D., T. Jonsson, and D. Wheeler, 1997: Exten-sion to the North Atlantic Oscillation using early in-strumental pressure observations from Gibraltar andSouth-West Iceland. International Journal of Clima-tology, 17, 1433–1450.
Li, J., and J. Wang, 2003a: A new North Atlantic Os-cillation index and its variability. Adv. Atmos. Sci.,20(5), 661–676.
Li, J., and J. Wang, 2003b: A modified zonal index andits physical sense. Geophys. Res. Lett., 30(12), 1632,doi:10.1029/2003GL017441.
Liritzis, I., and R. Fairbridge, 2003: Remarks on as-trochronology and time series analysis of Lake Sakevarved sediments. Journal of the Balkan GeophysicalSociety, 6(3), 165–172.
Marquardt, C., and B. Naujokat, 1997: An update ofthe equatorial QBO and its variability. Proceedings
of the 1st SPARC General Assembly, StratosphericProcesses and their Role in Climate (SPARC), Mel-bourne Australia, WMO/TD-No. 814(1), 87–90.
Nobre, P., and J. Shukla, 1996: Variations of sea surfacetemperature, wind stress, and rainfall over the trop-ical Atlantic and South America. J. Climate, 9(10),2464–2479.
Palus, M., J. Kurths, U. Schwarz, D. Novotna, and I.Charvatova, 2000: Is the solar activity cycle synchro-nized with the solar inertial motion? InternationalJournal of Bifurcation and Chaos, 10(11), 2519–2526.
Pekarova, P., 2003: Dynamics of Runoff Fluctuation ofthe World and Slovak Rivers. VEDA, Bratislava,222pp. (in Slovak)
Pekarova, P., and J. Szolgay, 2005: Assessment of climatechange impact on selected components of the hydro-sphere and biosphere in Hron and Vah River basins.VEDA, Bratislava, 496pp. (in Slovak)
Pekarova, P., P. Miklanek, and J. Pekar, 2003: Spatialand temporal runoff oscillation analysis of the mainrivers of the world during the 19th-20th centuries. J.Hydrol., 274, 62–79.
Pekarova, P., J. Pekar, and J. Pacl, 2005: Time vari-ability of annual discharge in the Bela mountainouscatchment during 1901-2000. Hydrological days 2005:Hydrology for integrated management of water re-sources, CD ROM, Bratislava, SHMI, CTU, STU,13pp.
Prochazka, M., M. Deyl, and O. Novicky, 2001: Tech-nology for detecting trends and changes in timeseries of hydrological and meteorological variables.Change and Trend Problem Analysis–CTPA, CDROM, CHMI, WMO, Praha, 25pp.
Rao, R. A., and K. Hamed, 2003: Multi-taper methodof analysis of periodicities in hydrological data. J.Hydrol., 279, 125–143.
Ropelewski, C. F., and P. D. Jones, 1987: An extension ofthe Tahiti-Darwin Southern Oscillation Index. Mon.Wea. Rev., 115, 2161–2165.
Skoda, P., O. Majercakova, and Z. Danacova, 2005: As-sessment of climate change impact on selected com-ponents of the hydrosphere and biosphere in Hronand Vah River basins. Hydrologic and Climatic Con-ditions of Basins, P. Pekarova and J. Szolgay, Eds.,VEDA, Bratislava, 17–49.
Stepanek, P., cited 2003: AnClim-software for time se-ries analysis. [Available online from http://www.sci.muni.cz/ pest/AnClim.html.]
Tardif, J., P. Dutilleul, and Y. Bergeron, 2003: Varia-tions in periodicities of the ring width of black ash(Fraxinus nigra Marsh.) in relation to flooding andecological site factors at Lake Duparquet in North-western Quebec. Biological Rhythm Research, 29(1),1–29.
Turkes, M., and E. Erlat, 2003: Precipitation changes andvariability in Turkey linked to the North Atlantic os-cillation during the period 1930–2000. InternationalJournal of Climatology, 23(14), 1771–1796.

NO. 4 PEKAROVA AND PEKAR 663
Uvo, C. B., 2003: Analysis and regionalization of North-ern European winter precipitation based on its rela-tionship with the North Atlantic oscillation. Interna-tional Journal of Climatology, 23(10), 1185–1194.
van Gelder, P., V. A. Kuzmin, and P. J. Visser, 2000:Analysis and statistical forecasting of trends in riverdischarge under uncertain climate changes. Proceed-ings of the International Symposium on Flood De-fence, Frank Toensmann and Mafred Koch., Eds.Volume 1, D13–D22.
Vasiliev, S. S, and V. A. Dergachev, 2002: The 2400-yearcycle in atmospheric radiocarbon concentration: bis-pectrum of C-14 data over the last 8000 years. An-nales Geophysicae, 20(1), 115–120.
Yang, M., T. Yao, Y. He, and L. G. Thompson, 2000:ENSO events recorded in the Guliya ice core. Cli-matic Change, 47, 401–409.
Youn, Y. H., 2005: The climate variabilities of air tem-perature around the Korean Penisula. Adv. Atmos.Sci., 22(4), 575–584.
Related Documents