T ELECOMMUNICATIONS I NDUSTRY REVENUES 2000 Jim Lande Kenneth Lynch Industry Analysis Division Common Carrier Bureau January 2002 This report is available for reference in the FCC's Reference Information Center, Courtyard Level, 445 12th Street S.W., Washington, D.C. 20554. Copies may be purchased by calling Qualex International, Portals II, 445 12th Street S.W., Room CY-B402, Washington, D.C. 20554, telephone 202-863-2893, facsimile 202-863-2898, or via e-mail at [email protected]. The report can also be from the FCC-State Link Internet site www.fcc.gov/ccb/stats.

Welcome message from author
This document is posted to help you gain knowledge. Please leave a comment to let me know what you think about it! Share it to your friends and learn new things together.
Transcript
TELECOMMUNICATIONS INDUSTRY REVENUES2000
Jim LandeKenneth Lynch
Industry Analysis DivisionCommon Carrier Bureau
January 2002
This report is available for reference in the FCC's Reference Information Center, Courtyard Level, 44512th Street S.W., Washington, D.C. 20554. Copies may be purchased by calling Qualex International,Portals II, 445 12th Street S.W., Room CY-B402, Washington, D.C. 20554, telephone 202-863-2893,facsimile 202-863-2898, or via e-mail at [email protected]. The report can also be from the FCC-StateLink Internet site www.fcc.gov/ccb/stats.

Telecommunications Industry Revenues
This report provides an overview of U.S. telecommunications industry revenues andcontributions to the universal service support mechanisms. Most of the data for 2000 are taken fromApril 1, 2001 filings of annual Telecommunications Reporting Worksheets (FCC Form 499-A). Revenue data collected on these worksheets are utilized in the Commission’s administration of theuniversal service fund (USF), Telecommunications Relay Service (TRS), North American NumberingPlan (NANP) and local number portability (LNP) programs. Form 499-A data are also used tocalculate common carrier regulatory fees. Data presented for 2001 are taken from May 1, August 1,and November 1, 2001 filings of quarterly Telecommunications Reporting Worksheets (FCC Form499-Q).
For 2000, the industry reported $293 billion in telecommunications service revenues — an increaseof 9% over 1999’s $269 billion. Other notable statistics include:
§ Revenues for wireless industry grew more than 28% during 2000, from $48 billion to $62 billion.
§ Revenues for competitive local telephone companies increased to $10.9 billion, up 68% over 1999,and accounted for about 9% of the $121 billion of local service revenues.
§ Total toll service revenues increased only slightly during 2000 — from $108.2 billion to $109.6billion. This small change reflects a $3.2 billion decrease in switched toll revenues and a $3 billionincrease in revenues from long distance private line service..
FCC Form 499-A Filing Requirement
Virtually all providers of telecommunications must file FCC Form 499-A each year.1 Telecommunications Reporting Worksheets are not filed directly with the FCC but rather with theUniversal Service Administrative Company (USAC), which serves as the data collection agent. Theannual worksheets were due April 1, 2001, but some providers filed late or updated their filing after thatdate. Information from filings received after October 1, 2001 and from filings that were incomplete hasbeen excluded from year 2000 data.
1 There are certain exceptions. Providers that offer telecommunications for a fee exclusively on a non-common carrierbasis are not required to file if their total annual contribution to universal service would be less than $10,000.Government entities that purchase telecommunications services in bulk on their own behalf, public safety and localgovernment entities licensed under Subpart B of Part 90 of the Commission’s rules, entities providing interstatetelecommunications exclusively to government or public safety entities, broadcasters and various non-profit entitiesare not required to file. Finally, systems integrators that derive less than 5% of their systems integration revenuesfrom the resale of telecommunications and entities that provide services only to themselves or to commonly ownedaffiliates need not file.
2
FCC Form 499-A asks each filer to report total, interstate and international revenues in twobroad categories: those billed to Universal Service contributors for resale (carrier's carrier revenues);and, those billed to de minimis telecommunications providers and end users (end-user revenues).2 Filers must provide further breakdowns of local, wireless, and toll services. The form also asks eachfiler to choose the communications business that best describes its operations:3
• Competitive Access Provider (CAP) or Competitive Local Exchange Carrier (CLEC)• Cellular, Personal Communications Service (PCS) and Specialized Mobile Radio
(SMR) Wireless Telephony Service Provider• Incumbent Local Exchange Carrier (ILEC)• Interexchange Carrier (IXC)• Local Reseller• Operator Service Provider (OSP)• Other Local Service Provider• Other Mobile Service Provider• Other Toll Service Provider• Paging and Messaging Service Provider• Payphone Provider• Private Service Provider• Prepaid Calling Card Provider• Satellite Service Provider• Shared-Tenant Service Provider• Specialized Mobile Radio - Dispatch• Toll Reseller• Wireless Data Service Provider
Filers are instructed to report amounts actually billed to customers. This means that filers shouldreport revenues net of discounts, but without making adjustments to reflect uncollectible revenues orinternational settlement payments or receipts. Most filers should be able to report revenues in thismanner using information contained in their corporate books of account. Some service providers,however, have no business or regulatory requirements to record intrastate or international revenuesseparately from interstate revenues, or to use the detailed revenue categories contained in theworksheets. Many wireless providers therefore use the interim safe harbor percentages to estimate theinterstate portion of their revenues.4
2 Telecommunications providers are considered de minimis and thus are not required to contribute to universalservice (or file Form 499-Q) if their annual contributions to universal service would be less than $10,000. Foruniversal service purposes, any underlying service providers treat de minimis firms as end users.
3 The detailed definitions of the filer categories are contained in section III.A of the Instructions to theTelecommunications Reporting Worksheet, FCC Form 499-A available at www.fcc.gov/Forms/Form499-A/499a.pdf.
4 See the Instructions to the Telecommunications Reporting Worksheet, FCC Form 499-A section III.C.3. available atwww.fcc.gov/Forms/Form499-A/499a.pdf

3
Form 499-A filings sometimes contain mistakes. Initial examination of the data occasionallyreveals carrier types, revenue amounts and/or revenues reported in service categories inconsistent withthe known operations of the filer. Some corrections have been made based on supplemental filerinformation. Nonetheless, disaggregated data are likely to be less accurate than industry totals.
Statistical Tables
Table 1 shows the major components of telecommunications revenues for 2000. This tablewas created by simply aggregating the revenues in the major classifications designated on Form 499-A.
Tables 2 and 3 provide a look at annual industry revenues over time. Generally, Form 499-Arevenue data can be tabulated in two distinct ways: by type of service provided and by type ofbusiness. Table 2 categorizes revenues by type of service and shows, for example, that carriersreported $62.0 billion in wireless service revenues for 2000. This total includes wireless servicerevenues from some carriers that are not identified as wireless carriers. In contrast, Table 3 shows thatwireless service providers reported total revenues of $63.3 billion, including some revenues for fixedlocal and toll services.
Revenue data shown for 1992 through 1996 were derived from information filed on TRSworksheets. Revenue data for 1997 and 1998 were derived by combining TRS worksheet andUniversal Service worksheet data. 1999 revenue data come from Form 499-A, which replaced boththe TRS and Universal Service worksheets. Because of reporting changes, data for 1997 through 2000are not entirely consistent with data for prior years. For example, special access revenues wereincluded with other access revenues prior to 1997 but have been included with local private lineservices since then. Similarly, through 1996, filers reported as other local and mobile revenuessubstantial amounts of customer premises equipment, billing and collection, and other types of revenuesthat are excluded from contributions to universal service. These revenues are now reported as non-telecommunications revenues. Both tables contain estimates of non-telecommunications revenues thathad been reported in prior years. Based on staff estimates, the 1996 telecommunications revenuesreported on TRS Worksheets would have been $10.5 billion lower if revenues had been reported usingcurrent instructions.
Some inconsistencies exist in the 1997 - 2000 period. For example, filers were required in1997 to include inside wiring maintenance revenues as part of local exchange revenues. In 1998, filerswere instructed to report these revenues as non-telecommunications service revenues. The localexchange service revenue data in Table 2 would show a greater increase from 1997 to 1998 if the samereporting instructions had been used for each year.
Note also that each year, many filers erroneously report substantial amounts of switched tollrevenues as other long distance revenues. The data are examined and some revenues are reclassifiedbased on staff research. Even so, the other long distance category of Table 2 probably continues tocontain some switched toll revenues, perhaps significant amounts in some years.

4
Table 4 illustrates how data from the Form 499-A are used to develop funding bases for theuniversal service fund (USF), North American Numbering Plan (NANP), Local Number Portability(LNP), and Telecommunications Relay Service (TRS) contribution mechanisms. Each of the fourprograms is supported by a slightly different group of telecommunications providers under slightlydifferent rules. As noted above, providers are considered de minimis for USF purposes if their annualcontribution is expected to be less than $10,000. While such providers are thus not required to fileForm 499-Q, de minimis status does not exempt service providers from filing Form 499-A becausecontributions to TRS, NANP and LNP are required regardless of the expected annual amount. Notealso that NANP, LNP, and TRS each draw contributions from a larger pool of providers than doesuniversal service. Specifically, all telecommunications carriers in the United States must contribute tomeet the costs of NANP (47 C.F.R. §52.17), and all telecommunications carriers that provide servicein areas covered by the regional LNP database must contribute to meet the costs of LNP (47 C.F.R.§52.32). Thus, only those providers that are not carriers are not required to contribute. Cost recoveryfor TRS is slightly different. Every carrier providing interstate services must contribute to the TRS Fund(47 C.F.R. §64.604(c)(5)(iii)(A)). In this case, providers that are not carriers, and carriers that do notprovide interstate services are not required to contribute. See Figure 3 of the Instructions to theTelecommunications Reporting Worksheet, FCC Form 499-A, which can be found on the FCC’sweb site at www.fcc.gov/Forms/Form499-A/499a.pdf..
Revenue data for individual filers are not available to the public. However, Tables 5 through 8present detailed industry roll-ups by type of revenue and type of filer. Table 5 provides a detailedbreakout of revenues for each of the Form 499-A revenue categories used to report services providedto other filers for resale. Table 6 displays similar detail for each of the revenue categories used toreport telecommunications service provided to end users. Table 7 combines data from Tables 5 and 6with data on non-telecommunications revenues to develop total industry revenues. Table 8 providesmore aggregated revenue information by type of filers. The revenue categories presented in Tables 5through 7 are explained in the Form 499-A filing instructions.
Table 9 presents an estimate of average revenue per conversation minute. Based on themethodology in Table 9, FCC staff estimated that end users were billed an average of 12 cents for eachminute of interstate and international toll calling made during 2000. The average price for each interstatedomestic conversation minute was estimated at 9 cents. These estimates and year-over-year changes inthese estimates should be treated with great caution for a number of reasons. For instance, terminatingaccess minutes are used as a proxy for billed conversation minutes. In certain cases, the two measurestrack each other closely. Subscriber toll-free calls that terminate on dedicated access lines and someother classes of calls generate access minutes that are billed as terminating minutes only. Some calls,however, generate originating access minutes only or bypass ILEC switched facilities on both ends andtherefore generate no access minutes. Some subscriber toll-free calls, on the other hand, do notterminate on dedicated access lines and therefore may generate two terminating access minutes perconversation minute. Further still, some providers of Internet Protocol (IP) telephony are able toterminate calls on ILEC networks without paying traditional interstate access charges. Given availabledata, little can be done to counteract these shortfalls.

5
The methodology presented in Table 9 mitigates some problems associated with usingterminating access minutes as a proxy for conversation minutes. For example, some conversationminutes do not result in ILEC access minutes because they terminate on the facilities of competitive localexchange carriers. These carriers do not report access minutes. Table 9 presents conservativeestimates of these minutes based on competing local exchange carrier shares of local service revenues. These amounts are used to adjust terminating access minutes.
Moreover, the methodology presented in Table 9 adjusts terminating access minute totals tobetter reflect international traffic. International settlement minutes are reported based on the billingstatus of calls rather than where the calls actually originate. Thus, some U.S. billed calls actuallyoriginate in foreign points and vice versa. However, most U.S. billed calls originate in the United Statesand generate originating but not terminating access minutes. So that terminating access minutes betterrepresent conversation minutes, these minutes are added to the reported totals for terminating accessminutes. Similarly, foreign billed minutes, which usually generate terminating access, are removed fromthe terminating access minute total.
One category of U.S. billed calls merits special treatment. Country-direct and country-beyond calls are placed from foreign points, directly with U.S. carriers. Country-direct calls generallyoriginate overseas and terminate in the United States. Such calls are billed by U.S. carriers, generatesettlement payments to foreign carriers, and are reported in Section 43.61 traffic data reports as U.S.billed calls. Country-beyond calls are similar, but both originate and terminate at foreign points. Country-direct calls result in terminating access minutes. Country-beyond calls generally don’t. Unfortunately, Section 43.61 data do not separate country-direct from country-beyond calls. This isnot a problem for allocating originating access minutes between interstate and international calls, sinceneither type of call results in appreciable originating access minutes. In estimating interstate terminatingaccess minutes, however, we chose to subtract country-direct and country-beyond minutes. Thismeans that the number of total interstate terminating minutes, which is used to represent interstateconversation minutes, is biased downward. We did not include country-direct or country-beyondminutes with international conversation minutes because country-beyond revenues are reportedseparately as international-to-international service revenues on Form 499-A and are thereforesubtracted when calculating international revenue per minute. Country-direct revenues, however,remain in the revenue base but the corresponding minutes have been removed from the estimate ofinternational conversation minutes. This bias may be offset by the fact that many international-to-international calls generate U.S. billed settlement minutes and are counted as conversation minutes.
End-user switched toll revenue data also are problematic. Through 1996, the figures shown arebased on TRS gross revenue data. In order to translate reported gross revenues to end-user revenues,80% of revenues reported by toll resellers were netted from the total. A second problem is that in someyears, filers classified substantial amounts of switched service revenues as (non-switched) other toll. While significant effort has been devoted to identifying and reclassifying these amounts, the other tollcategory shows a $1.3 billion drop from 1997 to 1998, which suggests that the 1997 figure may stillcontain significant amounts of misreported switched service revenues.
6
Starting in 1998, many toll carriers used fixed monthly charges to recover account maintenance,ILEC presubscribed interexchange carrier charges (PICCs) and both federal and state universal servicecontributions. Some toll carriers reported some of these surcharges as local service tariffed PICCcharges. An attempt was made to identify these amounts and include them with switched toll revenues. Some filers bill customers percentage surcharges to recover universal service contributions. While filersmust separately identify the universal service surcharges on their universal service worksheets, it is notpossible to identify a precise amount that is attributable to interstate toll service. The Table 9adjustments to reflect both PICC and universal service costs and end-user charges should be taken asapproximate.
Table 9 also shows a number of assumptions that were made in order to separate internationalrevenue data from interstate revenue data. Filers did not separately report end-user revenues forinternational services for years before 1999. For 1999 and 2000, it appears that many Form 499-Afilings understate international revenues and overstate interstate revenues. This could happen if, forexample, a filer split revenues between interstate and international service based on a ratio of interstateto international minutes, rather than on actual billings. This would not reduce contribution requirementsfor the filer but does make the breakout shown in Table 9 somewhat suspect. Based on staff analysis ofthe Form 499-A data, a simple methodology is used to convert Section 43.61 international trafficrevenue data into estimates of international end-user revenues for message telephone service. The samemethodology is used in all years.
While the FCC does collect detailed international traffic data, there is no clean match betweencategories of minutes actually reported and the international service end-user revenue data presented inTable 9. The amounts of international-to-international revenues are estimated for 1996 and earlier. Also, an increasing amount of international traffic is being carried on resold private lines and via othernew arrangements. It seems likely that much of this traffic is not being properly reported in traffic datareports. For these reasons, the breakout between interstate revenues per-minute and internationalrevenues per-minute is likely to be significantly less accurate than the combined estimate.
Table 10 presents information on access and universal service costs as a component of tollpricing. The table uses the data on minutes developed in Table 9 and therefore has the attendantuncertainties. The analysis also uses international settlement payment data which, while relatively good,include settlements associated with international-to-international traffic. The analysis does not accountfor special access payments from toll carriers to local exchange carriers. In some cases, toll carriersrecover the cost of these services through charges that are reported as switched toll revenues and aretherefore reflected in per-minute revenue estimates.
7
FCC Form 499-A asks filers to identify the share of their carrier’s carrier and end-usertelecommunications revenues attributable to different regions of the country. Table 11 shows total end-user telecommunications revenues by region for local, toll and wireless filers.
Tables 12 through 14 present data from quarterly filings of FCC Form 499-Q for the firstthree quarters of 2001. Each of these tables displays one quarter of data in a manner analogous toTable 8. FCC Form 499-Q is far less detailed than Form 499-A. Since Form 499-Q filings do notinclude a business type, filers were categorized based on the business type selected on their Form 499-A filings. The quarterly form asks filers to identify revenues as carrier’s carrier, contribution base end-user, or non-telecommunications and to indicate the interstate and international shares of each category. Unlike Form 499-A, the quarterly form does not require filers to attach revenues to the provision ofspecific types of services. Also, international-to-international revenues are included with non-telecommunications revenues rather than with end-user revenues. For presentation purposes, individualfiler revenues were allocated between fixed local, mobile, and toll using the more detailed informationcollected on the 2000 Form 499-A.
The universal service, Telecommunications Relay Service, North American Numbering PlanAdministration and local number portability rules prohibit the fund administrators from releasingcompany-specific information contained in Form 499-A and Form 499-Q worksheets. Revenue datafor individual filers are not available to the public.
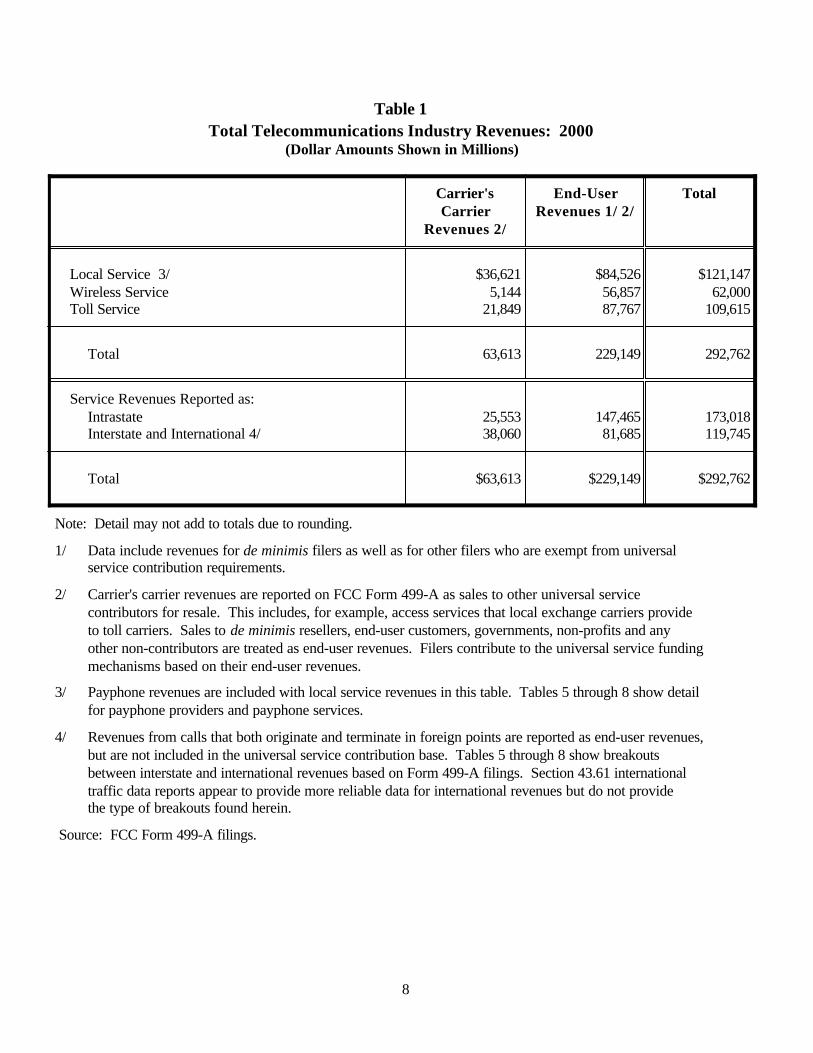
Table 1Total Telecommunications Industry Revenues: 2000
(Dollar Amounts Shown in Millions)
Carrier's End-User TotalCarrier Revenues 1/ 2/
Revenues 2/
Local Service 3/ $36,621 $84,526 $121,147Wireless Service 5,144 56,857 62,000Toll Service 21,849 87,767 109,615
Total 63,613 229,149 292,762
Service Revenues Reported as:Intrastate 25,553 147,465 173,018Interstate and International 4/ 38,060 81,685 119,745
Total $63,613 $229,149 $292,762
Note: Detail may not add to totals due to rounding.
1/ Data include revenues for de minimis filers as well as for other filers who are exempt from universal service contribution requirements.
2/ Carrier's carrier revenues are reported on FCC Form 499-A as sales to other universal service contributors for resale. This includes, for example, access services that local exchange carriers provide to toll carriers. Sales to de minimis resellers, end-user customers, governments, non-profits and any other non-contributors are treated as end-user revenues. Filers contribute to the universal service funding mechanisms based on their end-user revenues.
3/ Payphone revenues are included with local service revenues in this table. Tables 5 through 8 show detail for payphone providers and payphone services.
4/ Revenues from calls that both originate and terminate in foreign points are reported as end-user revenues, but are not included in the universal service contribution base. Tables 5 through 8 show breakouts between interstate and international revenues based on Form 499-A filings. Section 43.61 international traffic data reports appear to provide more reliable data for international revenues but do not provide the type of breakouts found herein.
Source: FCC Form 499-A filings.
8
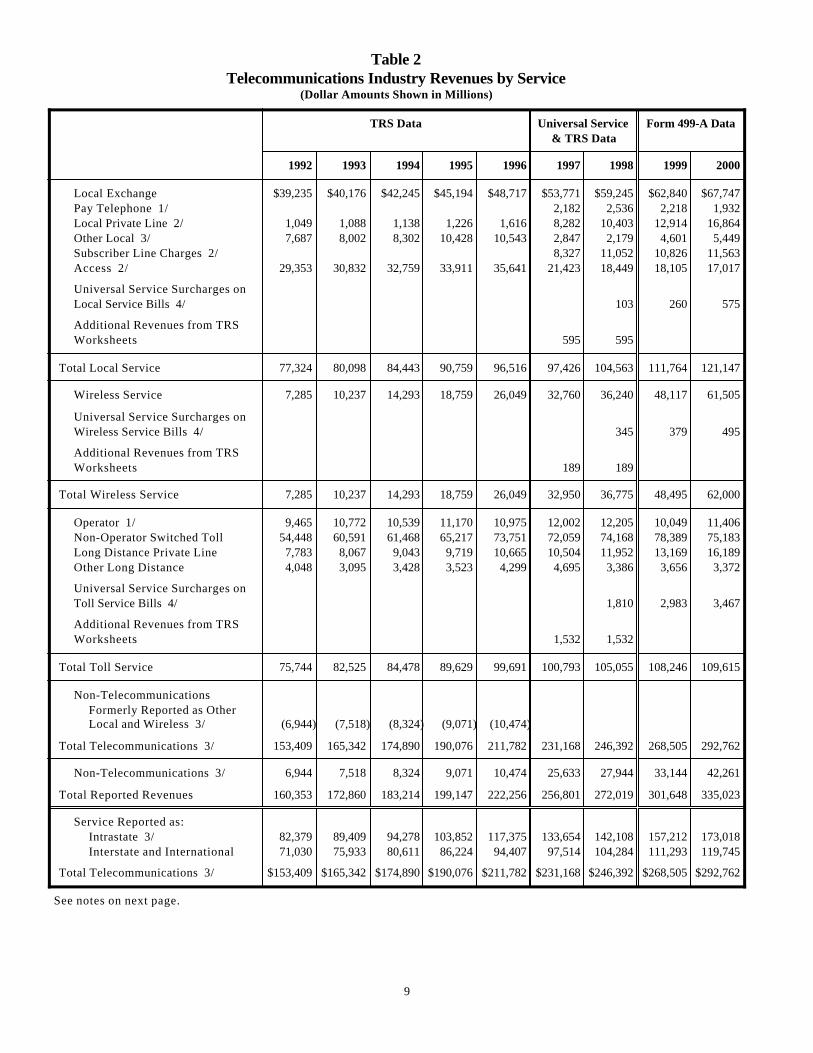
Table 2Telecommunications Industry Revenues by Service
(Dollar Amounts Shown in Millions)
TRS Data Universal Service Form 499-A Data& TRS Data
1992 1993 1994 1995 1996 1997 1998 1999 2000
Local Exchange $39,235 $40,176 $42,245 $45,194 $48,717 $53,771 $59,245 $62,840 $67,747Pay Telephone 1/ 2,182 2,536 2,218 1,932Local Private Line 2/ 1,049 1,088 1,138 1,226 1,616 8,282 10,403 12,914 16,864Other Local 3/ 7,687 8,002 8,302 10,428 10,543 2,847 2,179 4,601 5,449Subscriber Line Charges 2/ 8,327 11,052 10,826 11,563Access 2/ 29,353 30,832 32,759 33,911 35,641 21,423 18,449 18,105 17,017
Universal Service Surcharges onLocal Service Bills 4/ 103 260 575
Additional Revenues from TRSWorksheets 595 595
Total Local Service 77,324 80,098 84,443 90,759 96,516 97,426 104,563 111,764 121,147
Wireless Service 7,285 10,237 14,293 18,759 26,049 32,760 36,240 48,117 61,505
Universal Service Surcharges onWireless Service Bills 4/ 345 379 495
Additional Revenues from TRSWorksheets 189 189
Total Wireless Service 7,285 10,237 14,293 18,759 26,049 32,950 36,775 48,495 62,000
Operator 1/ 9,465 10,772 10,539 11,170 10,975 12,002 12,205 10,049 11,406Non-Operator Switched Toll 54,448 60,591 61,468 65,217 73,751 72,059 74,168 78,389 75,183Long Distance Private Line 7,783 8,067 9,043 9,719 10,665 10,504 11,952 13,169 16,189Other Long Distance 4,048 3,095 3,428 3,523 4,299 4,695 3,386 3,656 3,372
Universal Service Surcharges onToll Service Bills 4/ 1,810 2,983 3,467
Additional Revenues from TRSWorksheets 1,532 1,532
Total Toll Service 75,744 82,525 84,478 89,629 99,691 100,793 105,055 108,246 109,615
Non-Telecommunications Formerly Reported as OtherLocal and Wireless 3/ (6,944) (7,518) (8,324) (9,071) (10,474)
Total Telecommunications 3/ 153,409 165,342 174,890 190,076 211,782 231,168 246,392 268,505 292,762
Non-Telecommunications 3/ 6,944 7,518 8,324 9,071 10,474 25,633 27,944 33,144 42,261
Total Reported Revenues 160,353 172,860 183,214 199,147 222,256 256,801 272,019 301,648 335,023
Service Reported as:Intrastate 3/ 82,379 89,409 94,278 103,852 117,375 133,654 142,108 157,212 173,018Interstate and International 71,030 75,933 80,611 86,224 94,407 97,514 104,284 111,293 119,745
Total Telecommunications 3/ $153,409 $165,342 $174,890 $190,076 $211,782 $231,168 $246,392 $268,505 $292,762
See notes on next page.
9
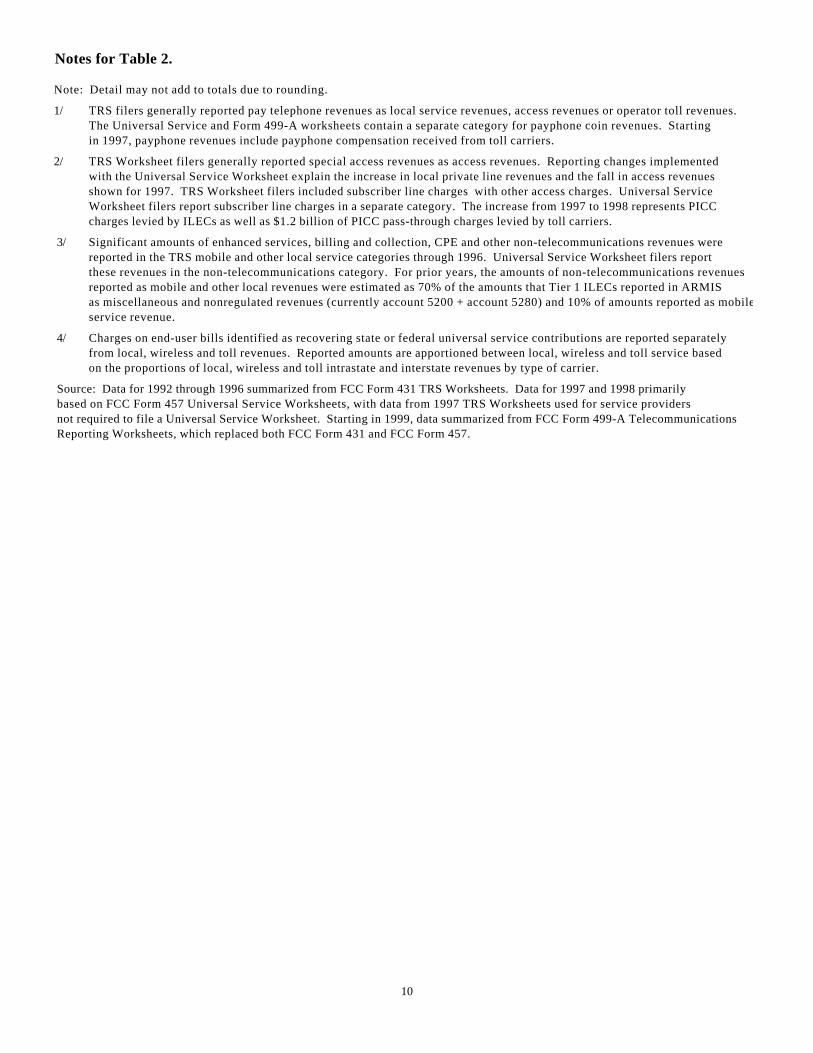
Notes for Table 2.
Note: Detail may not add to totals due to rounding.
1/ TRS filers generally reported pay telephone revenues as local service revenues, access revenues or operator toll revenues. The Universal Service and Form 499-A worksheets contain a separate category for payphone coin revenues. Starting in 1997, payphone revenues include payphone compensation received from toll carriers.
2/ TRS Worksheet filers generally reported special access revenues as access revenues. Reporting changes implemented with the Universal Service Worksheet explain the increase in local private line revenues and the fall in access revenuesshown for 1997. TRS Worksheet filers included subscriber line charges with other access charges. Universal Service Worksheet filers report subscriber line charges in a separate category. The increase from 1997 to 1998 represents PICC charges levied by ILECs as well as $1.2 billion of PICC pass-through charges levied by toll carriers.
3/ Significant amounts of enhanced services, billing and collection, CPE and other non-telecommunications revenues were reported in the TRS mobile and other local service categories through 1996. Universal Service Worksheet filers report these revenues in the non-telecommunications category. For prior years, the amounts of non-telecommunications revenues reported as mobile and other local revenues were estimated as 70% of the amounts that Tier 1 ILECs reported in ARMIS as miscellaneous and nonregulated revenues (currently account 5200 + account 5280) and 10% of amounts reported as mobile service revenue.
4/ Charges on end-user bills identified as recovering state or federal universal service contributions are reported separately from local, wireless and toll revenues. Reported amounts are apportioned between local, wireless and toll service based on the proportions of local, wireless and toll intrastate and interstate revenues by type of carrier.
Source: Data for 1992 through 1996 summarized from FCC Form 431 TRS Worksheets. Data for 1997 and 1998 primarily based on FCC Form 457 Universal Service Worksheets, with data from 1997 TRS Worksheets used for service providers not required to file a Universal Service Worksheet. Starting in 1999, data summarized from FCC Form 499-A Telecommunications Reporting Worksheets, which replaced both FCC Form 431 and FCC Form 457.
10

Table 3Telecommunications Revenues Reported by Type of Carrier
(Dollar Amounts Shown in Millions)
TRS Worksheet Data Universal Service Form 499-A & TRS Data Data
Service Provider Category 1/ 1992 1993 1994 1995 1996 1997 1998 1999 2000
Incumbent Local Exchange Carriers 2/ $91,584 $95,228 $98,431 $102,820 $107,905 $105,154 $108,234 $112,216 $116,158
Competitive Access Providers (CAPs) and Competitive Local Exchange Carriers (CLECs) 69 191 281 623 1,011 1,919 3,348 5,652 9,814Local Resellers 206 410 511 879Other Local Exchange Carriers 157 36 171 11Private Carriers 112 147 87 39Shared-Tenant Service Providers 87 93 87 202
Competitors of ILECs 69 191 281 623 1,011 2,481 4,034 6,508 10,945
Fixed Local Service Providers 91,835 95,595 99,011 103,792 109,273 107,634 112,268 118,725 127,103
Payphone Providers 183 175 300 349 357 933 1,101 1,213 972
Wireless Telephony Including Cellular, 6,718 9,215 13,259 17,208 23,778 29,944 33,139 46,513 59,823 Personal Communications Service (PCS) and SMR Telephony Carriers 2/Paging & Messaging Service 2/ 2,861 3,161 3,232 3,102Specialized Mobile Radio (SMR) 186 191 Dispatch Wireless Data Service Providers 63 36Other Mobile Service Providers 670 964 938 1,419 2,121 225 731 159 128
Wireless Service Providers 7,387 10,179 14,197 18,627 25,900 33,030 37,032 50,152 63,280
Interexchange Carriers (IXCs) 57,341 61,118 66,381 70,938 79,057 79,080 83,443 87,570 87,311Operator Service Providers (OSPs) 558 695 536 500 461 603 590 337 635Prepaid Calling Card Providers 16 238 519 888 866 727Satellite Service Providers 1,011 475 280 336Toll Resellers 1,293 1,869 2,840 4,220 6,564 8,010 9,885 9,211 10,641Other Toll Carriers 2,186 711 709 773 577 348 710 150 1,758
Toll Service Providers 61,378 64,393 70,466 76,447 86,896 89,570 95,992 98,414 101,407
Non-Telecommunications Revenues in Prior Year Data 2/ (6,944) (7,518) (8,324) (9,071) (10,474)
Other Adjustments 3/ (248) 2,693 (461) 280 187 0 0 0 0
Total Telecommunications Revenues $153,409 $165,342 $174,890 $190,076 $211,782 $231,168 $246,392 $268,505 $292,762
1/ Filers are asked to select for themselves a service provider category that best describes their operations. The choices have changed over the years. For example, most satellite service providers identified themselves as other toll carriers in their 1997 Form 431TRS worksheets because there was no separate category for satellite service providers.
2/ Significant amounts of enhanced service, billing and collection, CPE and other non-telecommunications revenues were reported on TRS worksheets by incumbent local exchange carriers (ILECs) and wireless carriers through 1996. Universal Service Worksheet filers report these revenues in the non-telecommunications category. For prior years, the amounts of non-telecommunications revenues reported as mobile and other local revenues were estimated as 70% of the amounts that Tier 1 ILECs reported in ARMIS as miscellaneous and nonregulated revenues (currently account 5200 + account 5280) and 10% of amounts reported as mobile service revenues.
3/ Other adjustments include some amounts withheld to preserve confidentiality and revisions made after the initial publication of the data.
Source: Data compiled from FCC Form 431, FCC Form 457 and FCC Form 499-A filings.
11
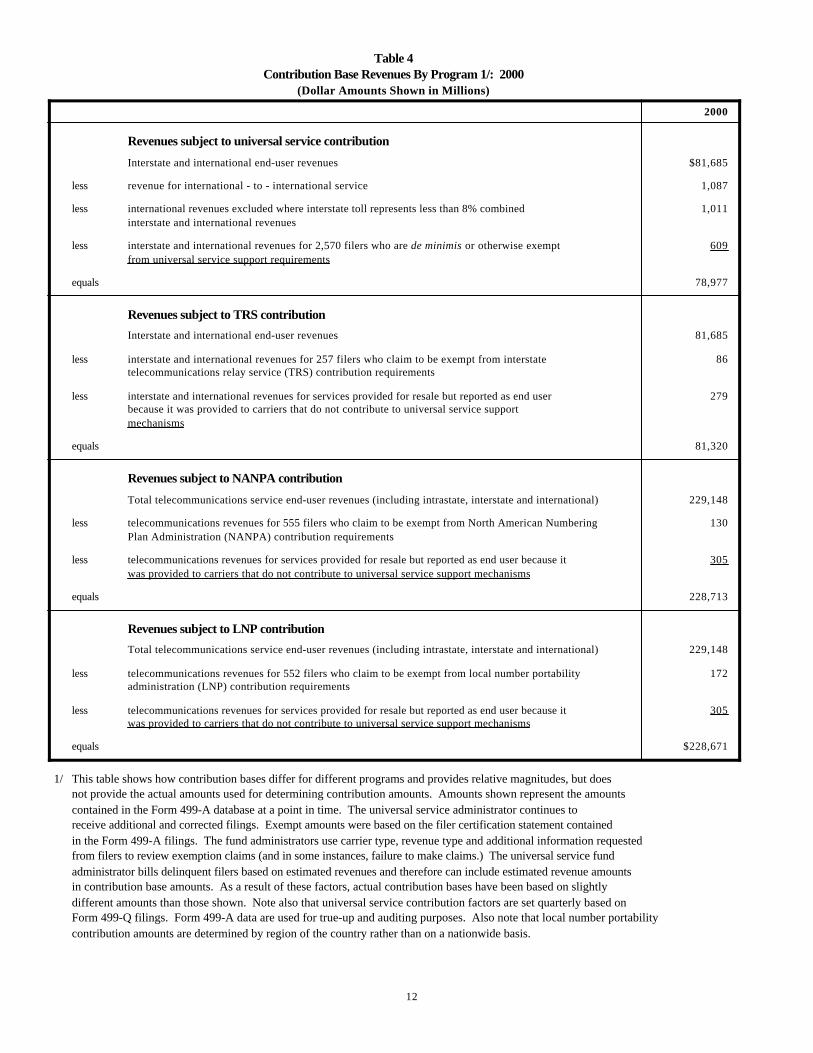
Table 4Contribution Base Revenues By Program 1/: 2000
(Dollar Amounts Shown in Millions)
2000
Revenues subject to universal service contribution
Interstate and international end-user revenues $81,685
less revenue for international - to - international service 1,087
less international revenues excluded where interstate toll represents less than 8% combined 1,011interstate and international revenues
less interstate and international revenues for 2,570 filers who are de minimis or otherwise exempt 609from universal service support requirements
equals 78,977
Revenues subject to TRS contribution
Interstate and international end-user revenues 81,685
less interstate and international revenues for 257 filers who claim to be exempt from interstate 86telecommunications relay service (TRS) contribution requirements
less interstate and international revenues for services provided for resale but reported as end user 279because it was provided to carriers that do not contribute to universal service support mechanisms
equals 81,320
Revenues subject to NANPA contribution
Total telecommunications service end-user revenues (including intrastate, interstate and international) 229,148
less telecommunications revenues for 555 filers who claim to be exempt from North American Numbering 130Plan Administration (NANPA) contribution requirements
less telecommunications revenues for services provided for resale but reported as end user because it 305was provided to carriers that do not contribute to universal service support mechanisms
equals 228,713
Revenues subject to LNP contribution
Total telecommunications service end-user revenues (including intrastate, interstate and international) 229,148
less telecommunications revenues for 552 filers who claim to be exempt from local number portability 172administration (LNP) contribution requirements
less telecommunications revenues for services provided for resale but reported as end user because it 305was provided to carriers that do not contribute to universal service support mechanisms
equals $228,671
1/ This table shows how contribution bases differ for different programs and provides relative magnitudes, but doesnot provide the actual amounts used for determining contribution amounts. Amounts shown represent the amounts contained in the Form 499-A database at a point in time. The universal service administrator continues to receive additional and corrected filings. Exempt amounts were based on the filer certification statement contained in the Form 499-A filings. The fund administrators use carrier type, revenue type and additional information requested from filers to review exemption claims (and in some instances, failure to make claims.) The universal service fund administrator bills delinquent filers based on estimated revenues and therefore can include estimated revenue amounts in contribution base amounts. As a result of these factors, actual contribution bases have been based on slightly different amounts than those shown. Note also that universal service contribution factors are set quarterly based onForm 499-Q filings. Form 499-A data are used for true-up and auditing purposes. Also note that local number portabilitycontribution amounts are determined by region of the country rather than on a nationwide basis.
12
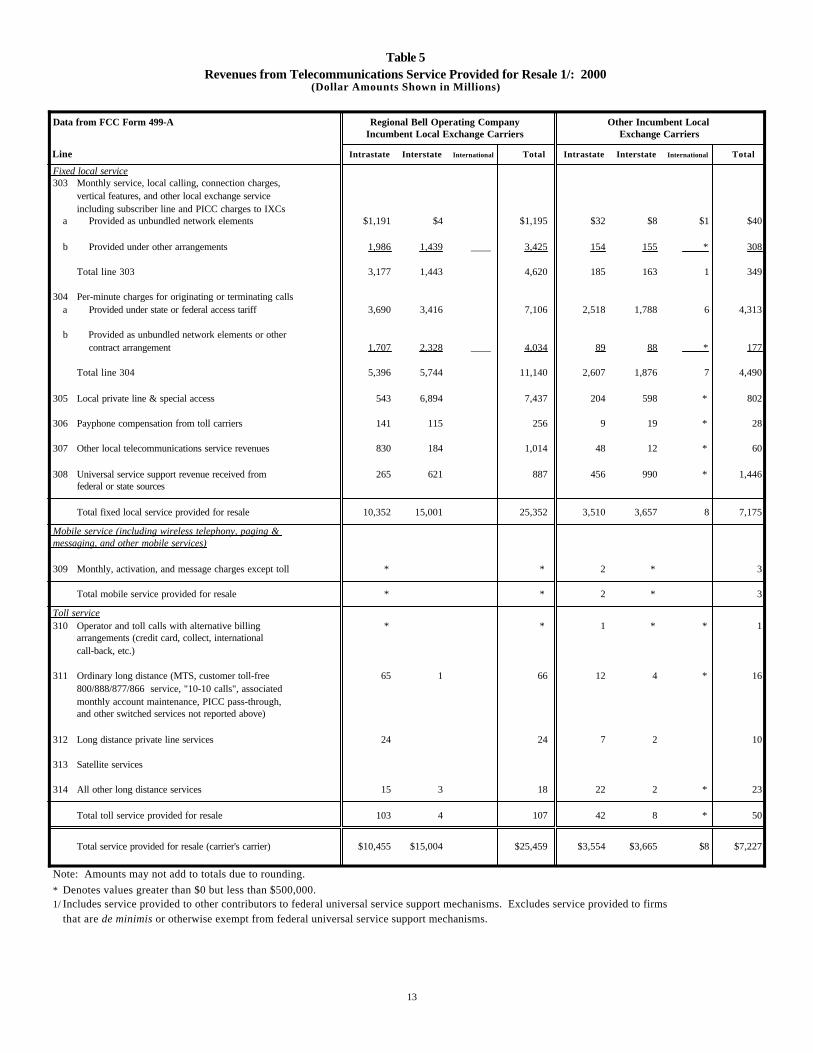
Table 5Revenues from Telecommunications Service Provided for Resale 1/: 2000
(Dollar Amounts Shown in Millions)
Data from FCC Form 499-A Regional Bell Operating Company Other Incumbent Local Incumbent Local Exchange Carriers Exchange Carriers
Line Intrastate Interstate International Total Intrastate Interstate International Total
Fixed local service 303 Monthly service, local calling, connection charges,
vertical features, and other local exchange service including subscriber line and PICC charges to IXCs
a Provided as unbundled network elements $1,191 $4 $1,195 $32 $8 $1 $40
b Provided under other arrangements 1,986 1,439 ____ 3,425 154 155 * 308
Total line 303 3,177 1,443 4,620 185 163 1 349
304 Per-minute charges for originating or terminating calls a Provided under state or federal access tariff 3,690 3,416 7,106 2,518 1,788 6 4,313
b Provided as unbundled network elements or other
contract arrangement 1,707 2,328 ____ 4,034 89 88 * 177
Total line 304 5,396 5,744 11,140 2,607 1,876 7 4,490
305 Local private line & special access 543 6,894 7,437 204 598 * 802
306 Payphone compensation from toll carriers 141 115 256 9 19 * 28
307 Other local telecommunications service revenues 830 184 1,014 48 12 * 60
308 Universal service support revenue received from 265 621 887 456 990 * 1,446federal or state sources
Total fixed local service provided for resale 10,352 15,001 25,352 3,510 3,657 8 7,175
Mobile service (including wireless telephony, paging & messaging, and other mobile services)
309 Monthly, activation, and message charges except toll * * 2 * 3
Total mobile service provided for resale * * 2 * 3
Toll service 310 Operator and toll calls with alternative billing * * 1 * * 1
arrangements (credit card, collect, international call-back, etc.)
311 Ordinary long distance (MTS, customer toll-free 65 1 66 12 4 * 16
800/888/877/866 service, "10-10 calls", associated monthly account maintenance, PICC pass-through, and other switched services not reported above)
312 Long distance private line services 24 24 7 2 10
313 Satellite services
314 All other long distance services 15 3 18 22 2 * 23
Total toll service provided for resale 103 4 107 42 8 * 50
Total service provided for resale (carrier's carrier) $10,455 $15,004 $25,459 $3,554 $3,665 $8 $7,227
Note: Amounts may not add to totals due to rounding.
* Denotes values greater than $0 but less than $500,000. 1/ Includes service provided to other contributors to federal universal service support mechanisms. Excludes service provided to firms
that are de minimis or otherwise exempt from federal universal service support mechanisms.
13
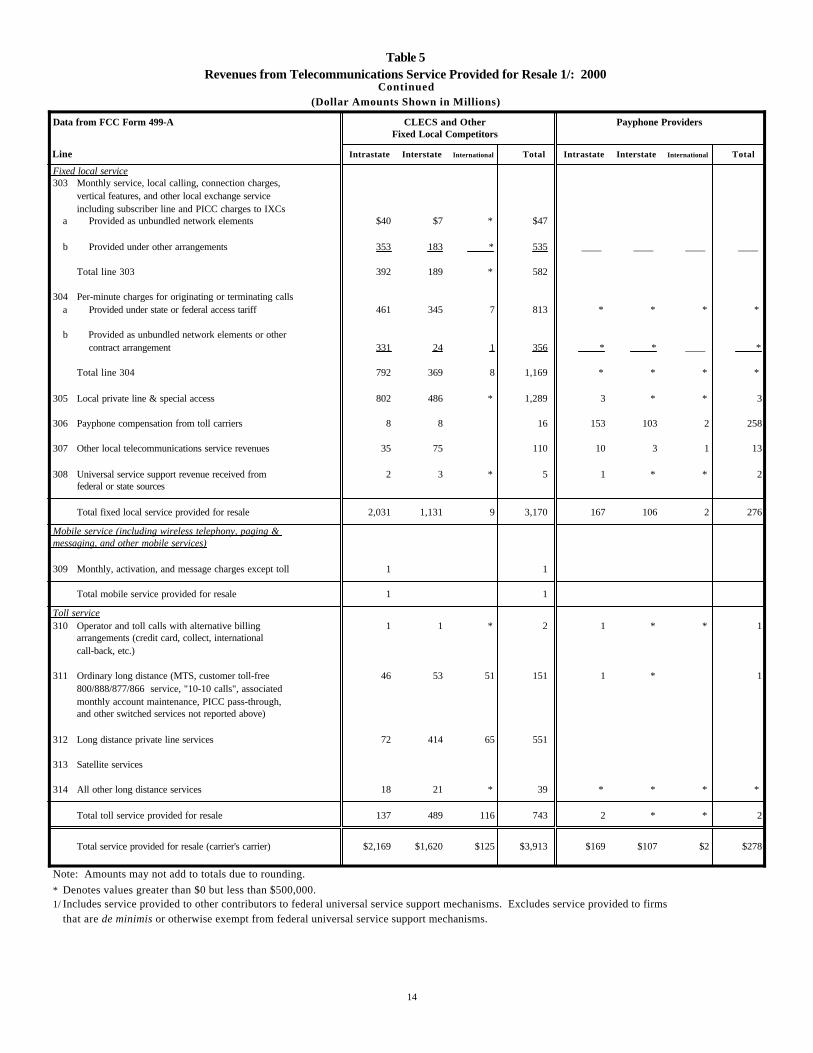
Table 5Revenues from Telecommunications Service Provided for Resale 1/: 2000
Continued(Dollar Amounts Shown in Millions)
Data from FCC Form 499-A CLECS and Other Payphone ProvidersFixed Local Competitors
Line Intrastate Interstate International Total Intrastate Interstate International Total
Fixed local service 303 Monthly service, local calling, connection charges,
vertical features, and other local exchange service including subscriber line and PICC charges to IXCs
a Provided as unbundled network elements $40 $7 * $47
b Provided under other arrangements 353 183 * 535 ____ ____ ____ ____
Total line 303 392 189 * 582
304 Per-minute charges for originating or terminating calls a Provided under state or federal access tariff 461 345 7 813 * * * *
b Provided as unbundled network elements or other
contract arrangement 331 24 1 356 * * ____ *
Total line 304 792 369 8 1,169 * * * *
305 Local private line & special access 802 486 * 1,289 3 * * 3
306 Payphone compensation from toll carriers 8 8 16 153 103 2 258
307 Other local telecommunications service revenues 35 75 110 10 3 1 13
308 Universal service support revenue received from 2 3 * 5 1 * * 2federal or state sources
Total fixed local service provided for resale 2,031 1,131 9 3,170 167 106 2 276
Mobile service (including wireless telephony, paging & messaging, and other mobile services)
309 Monthly, activation, and message charges except toll 1 1
Total mobile service provided for resale 1 1
Toll service 310 Operator and toll calls with alternative billing 1 1 * 2 1 * * 1
arrangements (credit card, collect, international call-back, etc.)
311 Ordinary long distance (MTS, customer toll-free 46 53 51 151 1 * 1
800/888/877/866 service, "10-10 calls", associated monthly account maintenance, PICC pass-through, and other switched services not reported above)
312 Long distance private line services 72 414 65 551
313 Satellite services
314 All other long distance services 18 21 * 39 * * * *
Total toll service provided for resale 137 489 116 743 2 * * 2
Total service provided for resale (carrier's carrier) $2,169 $1,620 $125 $3,913 $169 $107 $2 $278
Note: Amounts may not add to totals due to rounding.
* Denotes values greater than $0 but less than $500,000. 1/ Includes service provided to other contributors to federal universal service support mechanisms. Excludes service provided to firms
that are de minimis or otherwise exempt from federal universal service support mechanisms.
14
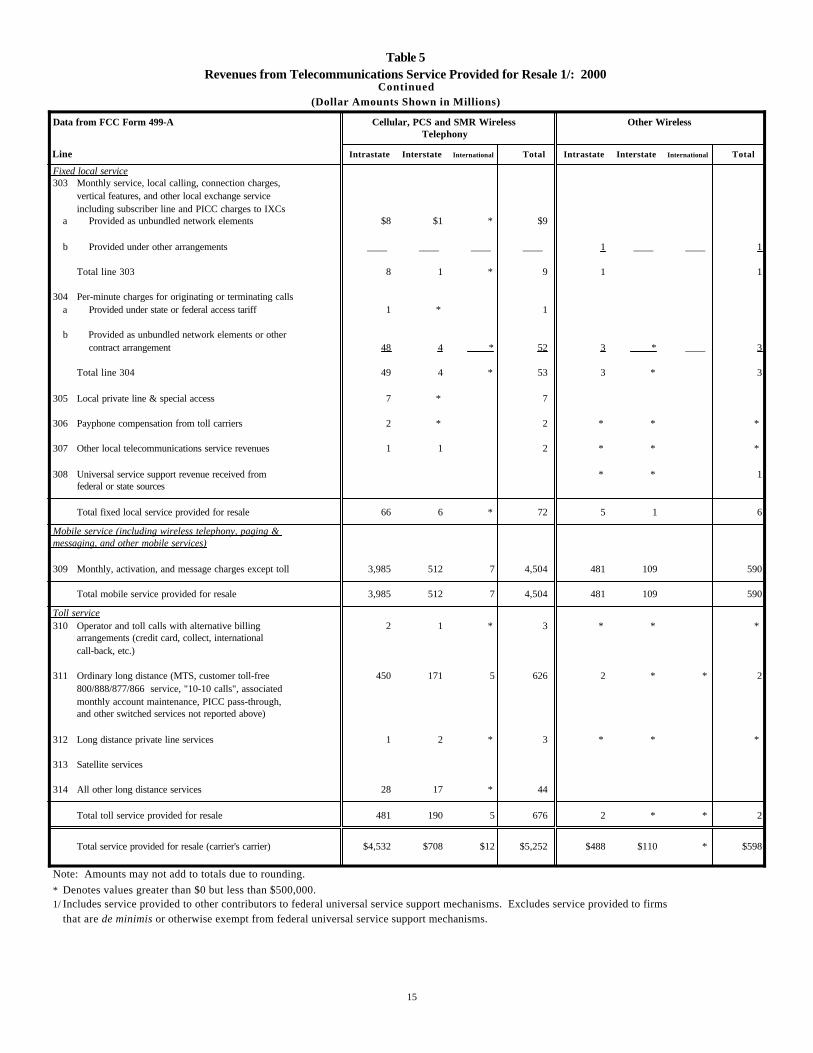
Table 5Revenues from Telecommunications Service Provided for Resale 1/: 2000
Continued(Dollar Amounts Shown in Millions)
Data from FCC Form 499-A Cellular, PCS and SMR Wireless Other WirelessTelephony
Line Intrastate Interstate International Total Intrastate Interstate International Total
Fixed local service 303 Monthly service, local calling, connection charges,
vertical features, and other local exchange service including subscriber line and PICC charges to IXCs
a Provided as unbundled network elements $8 $1 * $9
b Provided under other arrangements ____ ____ ____ ____ 1 ____ ____ 1
Total line 303 8 1 * 9 1 1
304 Per-minute charges for originating or terminating calls a Provided under state or federal access tariff 1 * 1
b Provided as unbundled network elements or other
contract arrangement 48 4 * 52 3 * ____ 3
Total line 304 49 4 * 53 3 * 3
305 Local private line & special access 7 * 7
306 Payphone compensation from toll carriers 2 * 2 * * *
307 Other local telecommunications service revenues 1 1 2 * * *
308 Universal service support revenue received from * * 1federal or state sources
Total fixed local service provided for resale 66 6 * 72 5 1 6
Mobile service (including wireless telephony, paging & messaging, and other mobile services)
309 Monthly, activation, and message charges except toll 3,985 512 7 4,504 481 109 590
Total mobile service provided for resale 3,985 512 7 4,504 481 109 590
Toll service 310 Operator and toll calls with alternative billing 2 1 * 3 * * *
arrangements (credit card, collect, international call-back, etc.)
311 Ordinary long distance (MTS, customer toll-free 450 171 5 626 2 * * 2
800/888/877/866 service, "10-10 calls", associated monthly account maintenance, PICC pass-through, and other switched services not reported above)
312 Long distance private line services 1 2 * 3 * * *
313 Satellite services
314 All other long distance services 28 17 * 44
Total toll service provided for resale 481 190 5 676 2 * * 2
Total service provided for resale (carrier's carrier) $4,532 $708 $12 $5,252 $488 $110 * $598
Note: Amounts may not add to totals due to rounding.
* Denotes values greater than $0 but less than $500,000. 1/ Includes service provided to other contributors to federal universal service support mechanisms. Excludes service provided to firms
that are de minimis or otherwise exempt from federal universal service support mechanisms.
15
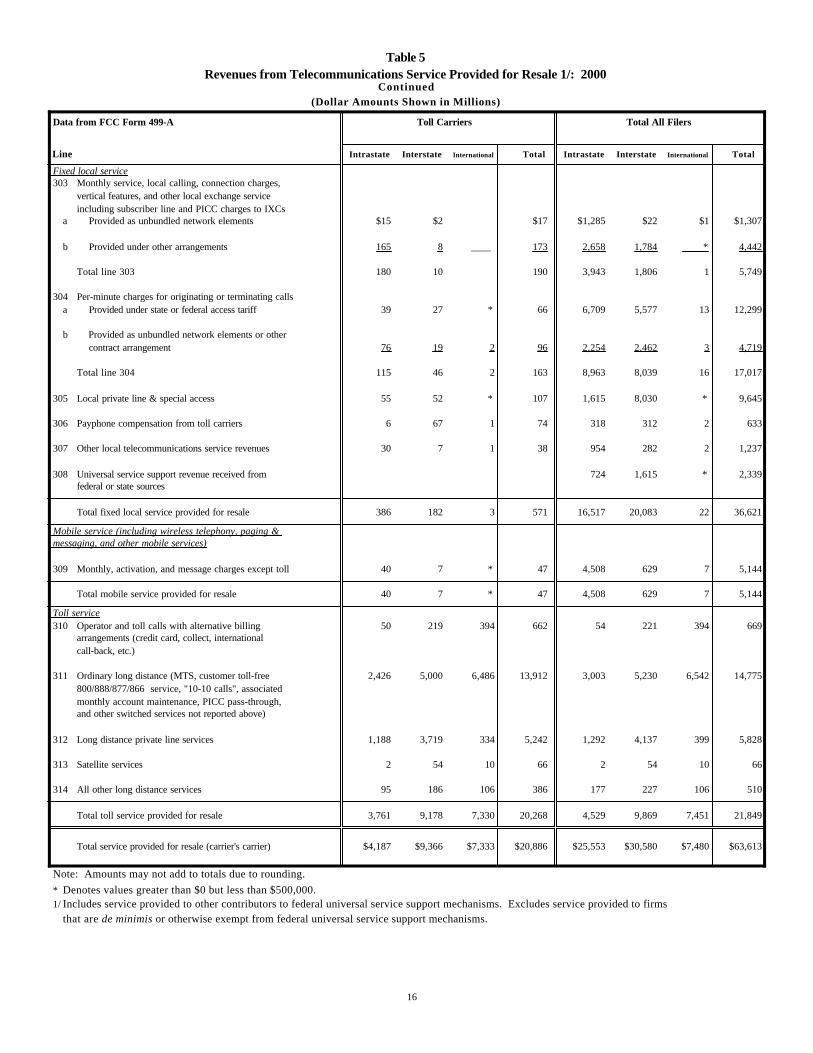
Table 5Revenues from Telecommunications Service Provided for Resale 1/: 2000
Continued(Dollar Amounts Shown in Millions)
Data from FCC Form 499-A Toll Carriers Total All Filers
Line Intrastate Interstate International Total Intrastate Interstate International Total
Fixed local service 303 Monthly service, local calling, connection charges,
vertical features, and other local exchange service including subscriber line and PICC charges to IXCs
a Provided as unbundled network elements $15 $2 $17 $1,285 $22 $1 $1,307
b Provided under other arrangements 165 8 ____ 173 2,658 1,784 * 4,442
Total line 303 180 10 190 3,943 1,806 1 5,749
304 Per-minute charges for originating or terminating calls a Provided under state or federal access tariff 39 27 * 66 6,709 5,577 13 12,299
b Provided as unbundled network elements or other
contract arrangement 76 19 2 96 2,254 2,462 3 4,719
Total line 304 115 46 2 163 8,963 8,039 16 17,017
305 Local private line & special access 55 52 * 107 1,615 8,030 * 9,645
306 Payphone compensation from toll carriers 6 67 1 74 318 312 2 633
307 Other local telecommunications service revenues 30 7 1 38 954 282 2 1,237
308 Universal service support revenue received from 724 1,615 * 2,339federal or state sources
Total fixed local service provided for resale 386 182 3 571 16,517 20,083 22 36,621
Mobile service (including wireless telephony, paging & messaging, and other mobile services)
309 Monthly, activation, and message charges except toll 40 7 * 47 4,508 629 7 5,144
Total mobile service provided for resale 40 7 * 47 4,508 629 7 5,144
Toll service 310 Operator and toll calls with alternative billing 50 219 394 662 54 221 394 669
arrangements (credit card, collect, international call-back, etc.)
311 Ordinary long distance (MTS, customer toll-free 2,426 5,000 6,486 13,912 3,003 5,230 6,542 14,775
800/888/877/866 service, "10-10 calls", associated monthly account maintenance, PICC pass-through, and other switched services not reported above)
312 Long distance private line services 1,188 3,719 334 5,242 1,292 4,137 399 5,828
313 Satellite services 2 54 10 66 2 54 10 66
314 All other long distance services 95 186 106 386 177 227 106 510
Total toll service provided for resale 3,761 9,178 7,330 20,268 4,529 9,869 7,451 21,849
Total service provided for resale (carrier's carrier) $4,187 $9,366 $7,333 $20,886 $25,553 $30,580 $7,480 $63,613
Note: Amounts may not add to totals due to rounding.
* Denotes values greater than $0 but less than $500,000. 1/ Includes service provided to other contributors to federal universal service support mechanisms. Excludes service provided to firms
that are de minimis or otherwise exempt from federal universal service support mechanisms.
16
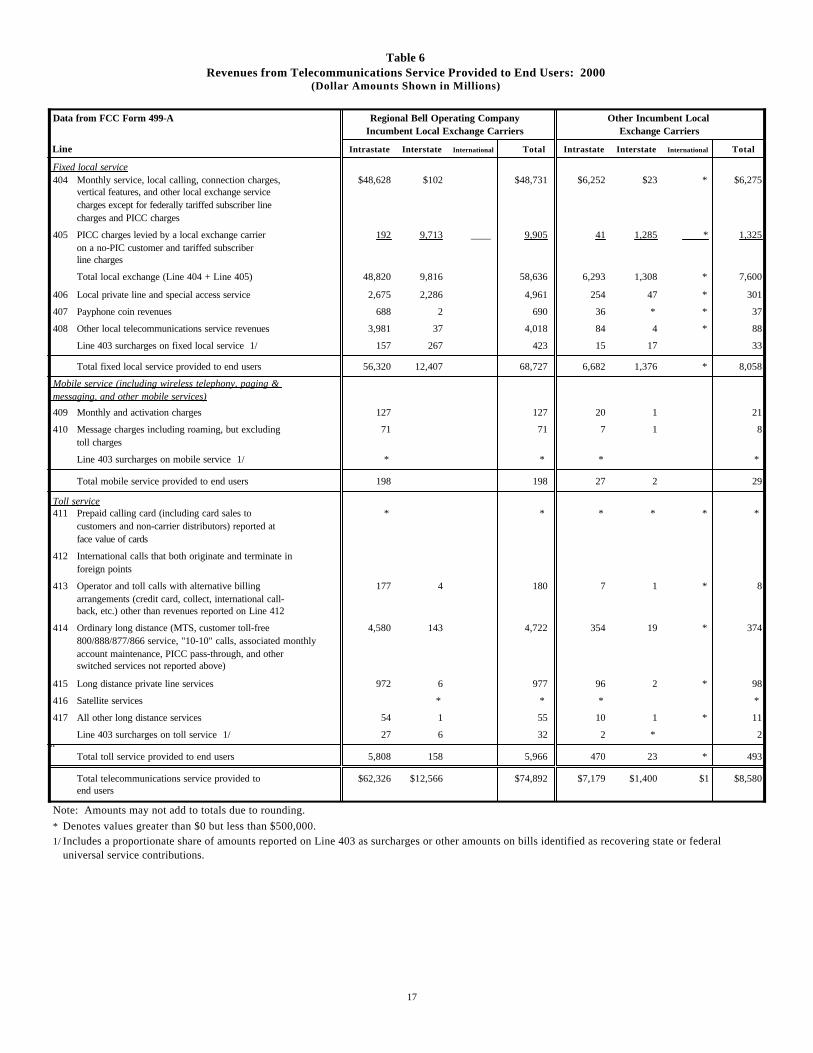
Table 6Revenues from Telecommunications Service Provided to End Users: 2000
(Dollar Amounts Shown in Millions)
Data from FCC Form 499-A Regional Bell Operating Company Other Incumbent Local Incumbent Local Exchange Carriers Exchange Carriers
Line Intrastate Interstate International Total Intrastate Interstate International Total
Fixed local service 404 Monthly service, local calling, connection charges, $48,628 $102 $48,731 $6,252 $23 * $6,275
vertical features, and other local exchange service charges except for federally tariffed subscriber line charges and PICC charges
405 PICC charges levied by a local exchange carrier 192 9,713 ____ 9,905 41 1,285 * 1,325on a no-PIC customer and tariffed subscriber line charges Total local exchange (Line 404 + Line 405) 48,820 9,816 58,636 6,293 1,308 * 7,600
406 Local private line and special access service 2,675 2,286 4,961 254 47 * 301 407 Payphone coin revenues 688 2 690 36 * * 37 408 Other local telecommunications service revenues 3,981 37 4,018 84 4 * 88
Line 403 surcharges on fixed local service 1/ 157 267 423 15 17 33 Total fixed local service provided to end users 56,320 12,407 68,727 6,682 1,376 * 8,058
Mobile service (including wireless telephony, paging & messaging, and other mobile services) 409 Monthly and activation charges 127 127 20 1 21 410 Message charges including roaming, but excluding 71 71 7 1 8
toll charges Line 403 surcharges on mobile service 1/ * * * * Total mobile service provided to end users 198 198 27 2 29
Toll service 411 Prepaid calling card (including card sales to * * * * * *
customers and non-carrier distributors) reported at face value of cards
412 International calls that both originate and terminate in foreign points
413 Operator and toll calls with alternative billing 177 4 180 7 1 * 8arrangements (credit card, collect, international call- back, etc.) other than revenues reported on Line 412
414 Ordinary long distance (MTS, customer toll-free 4,580 143 4,722 354 19 * 374800/888/877/866 service, "10-10" calls, associated monthly account maintenance, PICC pass-through, and other switched services not reported above)
415 Long distance private line services 972 6 977 96 2 * 98 416 Satellite services * * * * 417 All other long distance services 54 1 55 10 1 * 11
Line 403 surcharges on toll service 1/ 27 6 32 2 * 2 h Total toll service provided to end users 5,808 158 5,966 470 23 * 493 Total telecommunications service provided to $62,326 $12,566 $74,892 $7,179 $1,400 $1 $8,580end users
Note: Amounts may not add to totals due to rounding.
* Denotes values greater than $0 but less than $500,000. 1/ Includes a proportionate share of amounts reported on Line 403 as surcharges or other amounts on bills identified as recovering state or federal
universal service contributions.
17
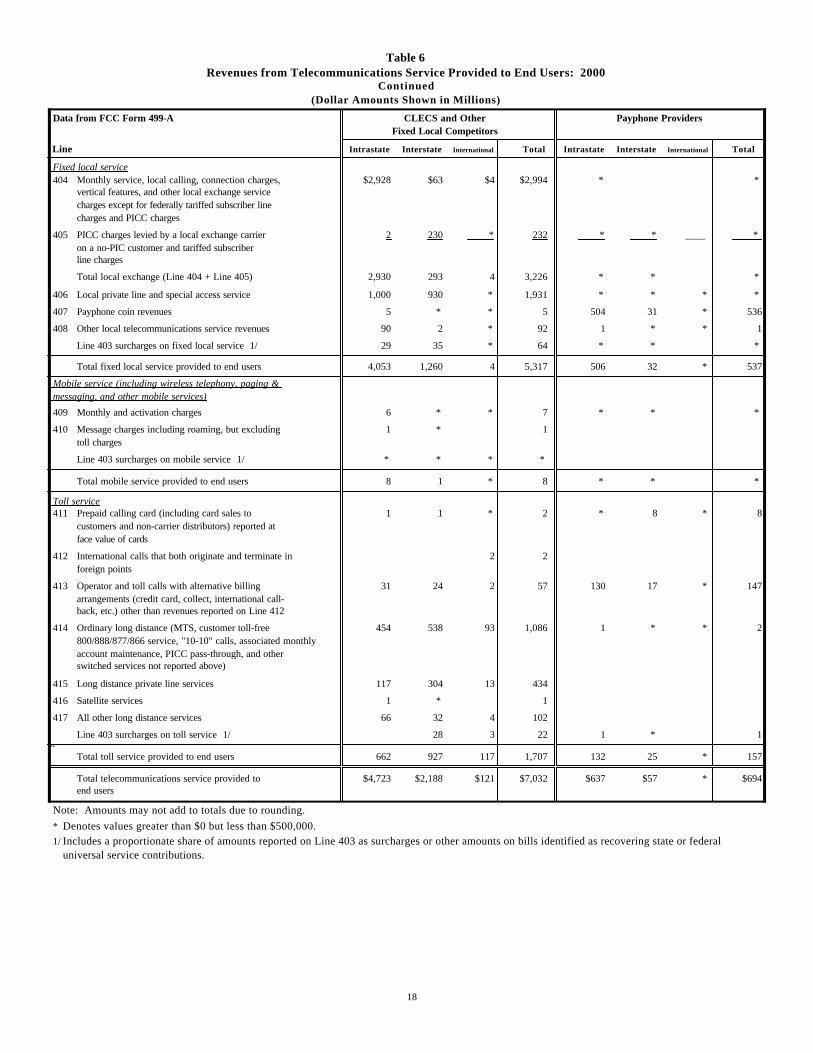
Table 6Revenues from Telecommunications Service Provided to End Users: 2000
Continued(Dollar Amounts Shown in Millions)
Data from FCC Form 499-A CLECS and Other Payphone ProvidersFixed Local Competitors
Line Intrastate Interstate International Total Intrastate Interstate International Total
Fixed local service 404 Monthly service, local calling, connection charges, $2,928 $63 $4 $2,994 * *
vertical features, and other local exchange service charges except for federally tariffed subscriber line charges and PICC charges
405 PICC charges levied by a local exchange carrier 2 230 * 232 * * ____ * on a no-PIC customer and tariffed subscriber line charges Total local exchange (Line 404 + Line 405) 2,930 293 4 3,226 * * *
406 Local private line and special access service 1,000 930 * 1,931 * * * * 407 Payphone coin revenues 5 * * 5 504 31 * 536 408 Other local telecommunications service revenues 90 2 * 92 1 * * 1
Line 403 surcharges on fixed local service 1/ 29 35 * 64 * * * Total fixed local service provided to end users 4,053 1,260 4 5,317 506 32 * 537
Mobile service (including wireless telephony, paging & messaging, and other mobile services) 409 Monthly and activation charges 6 * * 7 * * * 410 Message charges including roaming, but excluding 1 * 1
toll charges Line 403 surcharges on mobile service 1/ * * * * Total mobile service provided to end users 8 1 * 8 * * *
Toll service 411 Prepaid calling card (including card sales to 1 1 * 2 * 8 * 8
customers and non-carrier distributors) reported at face value of cards
412 International calls that both originate and terminate in 2 2 foreign points
413 Operator and toll calls with alternative billing 31 24 2 57 130 17 * 147arrangements (credit card, collect, international call- back, etc.) other than revenues reported on Line 412
414 Ordinary long distance (MTS, customer toll-free 454 538 93 1,086 1 * * 2800/888/877/866 service, "10-10" calls, associated monthly account maintenance, PICC pass-through, and other switched services not reported above)
415 Long distance private line services 117 304 13 434 416 Satellite services 1 * 1 417 All other long distance services 66 32 4 102
Line 403 surcharges on toll service 1/ 28 3 22 1 * 1 h Total toll service provided to end users 662 927 117 1,707 132 25 * 157 Total telecommunications service provided to $4,723 $2,188 $121 $7,032 $637 $57 * $694end users
Note: Amounts may not add to totals due to rounding.
* Denotes values greater than $0 but less than $500,000. 1/ Includes a proportionate share of amounts reported on Line 403 as surcharges or other amounts on bills identified as recovering state or federal
universal service contributions.
18
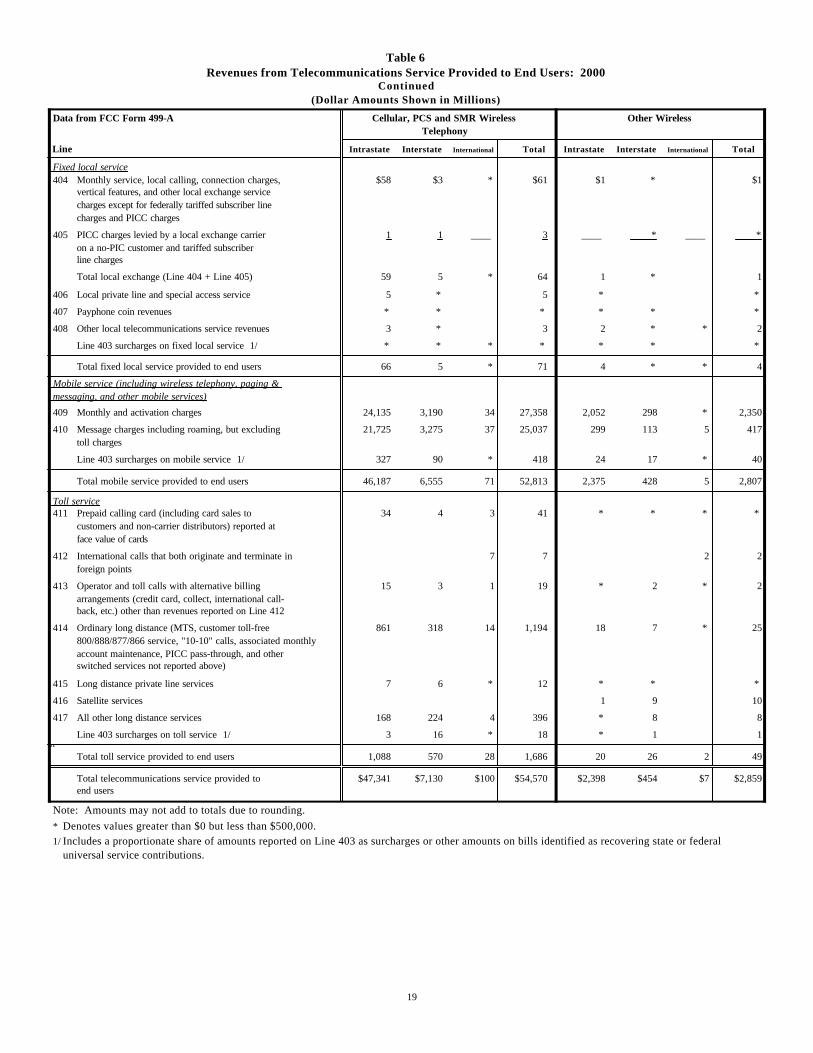
Table 6Revenues from Telecommunications Service Provided to End Users: 2000
Continued(Dollar Amounts Shown in Millions)
Data from FCC Form 499-A Cellular, PCS and SMR Wireless Other WirelessTelephony
Line Intrastate Interstate International Total Intrastate Interstate International Total
Fixed local service 404 Monthly service, local calling, connection charges, $58 $3 * $61 $1 * $1
vertical features, and other local exchange service charges except for federally tariffed subscriber line charges and PICC charges
405 PICC charges levied by a local exchange carrier 1 1 ____ 3 ____ * ____ *on a no-PIC customer and tariffed subscriber line charges Total local exchange (Line 404 + Line 405) 59 5 * 64 1 * 1
406 Local private line and special access service 5 * 5 * * 407 Payphone coin revenues * * * * * * 408 Other local telecommunications service revenues 3 * 3 2 * * 2
Line 403 surcharges on fixed local service 1/ * * * * * * * Total fixed local service provided to end users 66 5 * 71 4 * * 4
Mobile service (including wireless telephony, paging & messaging, and other mobile services) 409 Monthly and activation charges 24,135 3,190 34 27,358 2,052 298 * 2,350 410 Message charges including roaming, but excluding 21,725 3,275 37 25,037 299 113 5 417
toll charges Line 403 surcharges on mobile service 1/ 327 90 * 418 24 17 * 40 Total mobile service provided to end users 46,187 6,555 71 52,813 2,375 428 5 2,807
Toll service 411 Prepaid calling card (including card sales to 34 4 3 41 * * * *
customers and non-carrier distributors) reported at face value of cards
412 International calls that both originate and terminate in 7 7 2 2foreign points
413 Operator and toll calls with alternative billing 15 3 1 19 * 2 * 2arrangements (credit card, collect, international call- back, etc.) other than revenues reported on Line 412
414 Ordinary long distance (MTS, customer toll-free 861 318 14 1,194 18 7 * 25800/888/877/866 service, "10-10" calls, associated monthly account maintenance, PICC pass-through, and other switched services not reported above)
415 Long distance private line services 7 6 * 12 * * * 416 Satellite services 1 9 10 417 All other long distance services 168 224 4 396 * 8 8
Line 403 surcharges on toll service 1/ 3 16 * 18 * 1 1 h Total toll service provided to end users 1,088 570 28 1,686 20 26 2 49 Total telecommunications service provided to $47,341 $7,130 $100 $54,570 $2,398 $454 $7 $2,859end users
Note: Amounts may not add to totals due to rounding.
* Denotes values greater than $0 but less than $500,000. 1/ Includes a proportionate share of amounts reported on Line 403 as surcharges or other amounts on bills identified as recovering state or federal
universal service contributions.
19
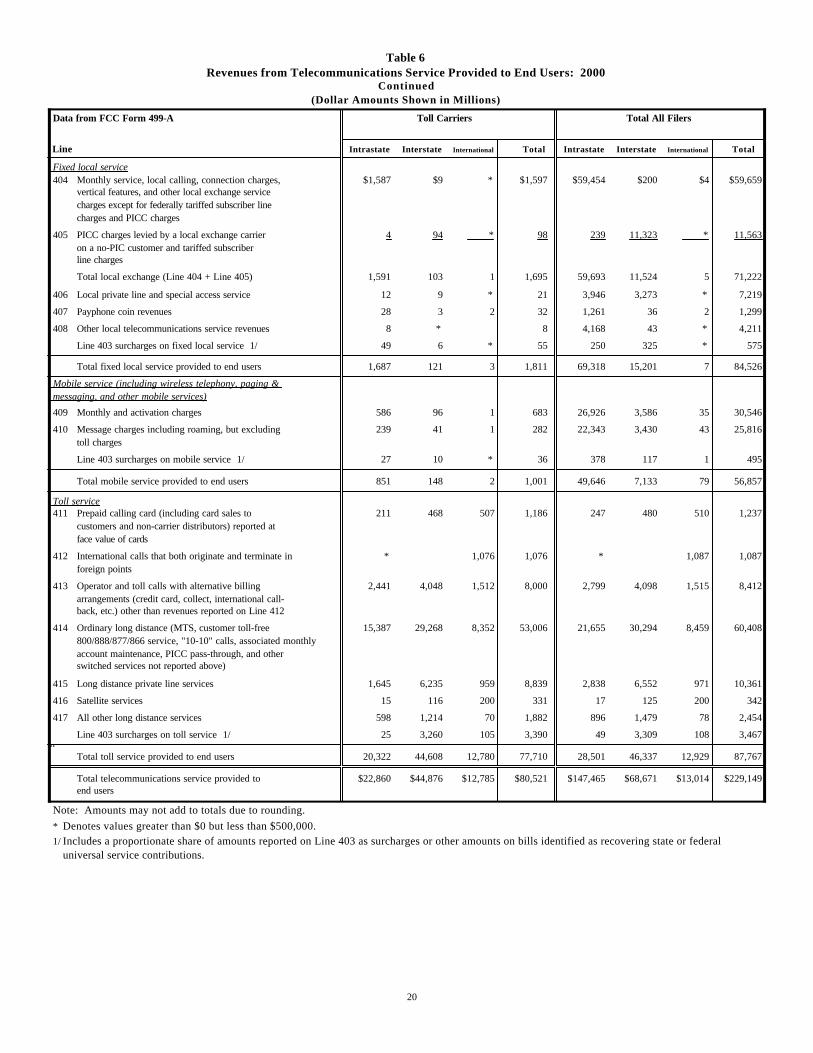
Table 6Revenues from Telecommunications Service Provided to End Users: 2000
Continued(Dollar Amounts Shown in Millions)
Data from FCC Form 499-A Toll Carriers Total All Filers
Line Intrastate Interstate International Total Intrastate Interstate International Total
Fixed local service 404 Monthly service, local calling, connection charges, $1,587 $9 * $1,597 $59,454 $200 $4 $59,659
vertical features, and other local exchange service charges except for federally tariffed subscriber line charges and PICC charges
405 PICC charges levied by a local exchange carrier 4 94 * 98 239 11,323 * 11,563on a no-PIC customer and tariffed subscriber line charges Total local exchange (Line 404 + Line 405) 1,591 103 1 1,695 59,693 11,524 5 71,222
406 Local private line and special access service 12 9 * 21 3,946 3,273 * 7,219 407 Payphone coin revenues 28 3 2 32 1,261 36 2 1,299 408 Other local telecommunications service revenues 8 * 8 4,168 43 * 4,211
Line 403 surcharges on fixed local service 1/ 49 6 * 55 250 325 * 575 Total fixed local service provided to end users 1,687 121 3 1,811 69,318 15,201 7 84,526
Mobile service (including wireless telephony, paging & messaging, and other mobile services) 409 Monthly and activation charges 586 96 1 683 26,926 3,586 35 30,546 410 Message charges including roaming, but excluding 239 41 1 282 22,343 3,430 43 25,816
toll charges Line 403 surcharges on mobile service 1/ 27 10 * 36 378 117 1 495 Total mobile service provided to end users 851 148 2 1,001 49,646 7,133 79 56,857
Toll service 411 Prepaid calling card (including card sales to 211 468 507 1,186 247 480 510 1,237
customers and non-carrier distributors) reported at face value of cards
412 International calls that both originate and terminate in * 1,076 1,076 * 1,087 1,087foreign points
413 Operator and toll calls with alternative billing 2,441 4,048 1,512 8,000 2,799 4,098 1,515 8,412arrangements (credit card, collect, international call- back, etc.) other than revenues reported on Line 412
414 Ordinary long distance (MTS, customer toll-free 15,387 29,268 8,352 53,006 21,655 30,294 8,459 60,408800/888/877/866 service, "10-10" calls, associated monthly account maintenance, PICC pass-through, and other switched services not reported above)
415 Long distance private line services 1,645 6,235 959 8,839 2,838 6,552 971 10,361 416 Satellite services 15 116 200 331 17 125 200 342 417 All other long distance services 598 1,214 70 1,882 896 1,479 78 2,454
Line 403 surcharges on toll service 1/ 25 3,260 105 3,390 49 3,309 108 3,467 h Total toll service provided to end users 20,322 44,608 12,780 77,710 28,501 46,337 12,929 87,767 Total telecommunications service provided to $22,860 $44,876 $12,785 $80,521 $147,465 $68,671 $13,014 $229,149end users
Note: Amounts may not add to totals due to rounding.
* Denotes values greater than $0 but less than $500,000. 1/ Includes a proportionate share of amounts reported on Line 403 as surcharges or other amounts on bills identified as recovering state or federal
universal service contributions.
20

Table 7Total Revenues: 2000
(Dollar Amounts Shown in Millions)
Data from FCC Form 499-A Regional Bell Operating Company Other Incumbent Local Incumbent Local Exchange Carriers Exchange Carriers
Line Intrastate Interstate International Total Intrastate Interstate International Total
Fixed local service other than payphone $65,843 $27,291 $93,135 $10,147 $5,014 $8 $15,168[Lines 303, 304, 305, 307, 308, 404, 405, 406, 408, and a portion of 403 1/]
Payphone 829 117 945 46 19 * 65[Lines 306 and 407]
Mobile service 198 198 30 2 32[Lines 309, 409, 410, and a portion of 403 1/]
Toll service 5,911 162 6,073 511 31 1 543[Lines 310, 311, 312, 313, 314, 411, 412, 413, 414, 415, 416, 417, and a portion of 403 1/]
Total telecommunications service revenues 72,781 27,570 100,351 10,733 5,066 8 15,807
Total telecommunications service provided for resale 10,455 15,004 25,459 3,554 3,665 8 7,227(from Table 1.5)
Total telecommunications service provided to 62,326 12,566 ____ 74,892 7,179 1,400 1 8,580end users (from Table 1.6)
Total telecommunications service revenues 72,781 27,570 100,351 10,733 5,066 8 15,807
418 Enhanced services, inside wiring maintenance, billing - - - - - - - - - 10,419 - - - - - - - - - 2,633
and collection, customer premises equipment, published directory, dark fiber, Internet access, cable TV program transmission, and non-telecommunications service revenues
419 Gross billed revenues from all sources - - - - - - - - - $110,770 - - - - - - - - - $18,440
Note: Amounts may not add to totals due to rounding.
* Denotes values greater than $0 but less than $500,000. 1/ Includes a proportionate share of amounts reported on line 403 as surcharges or other amounts on bills identified as recovering state or federal
universal service contributions.
21
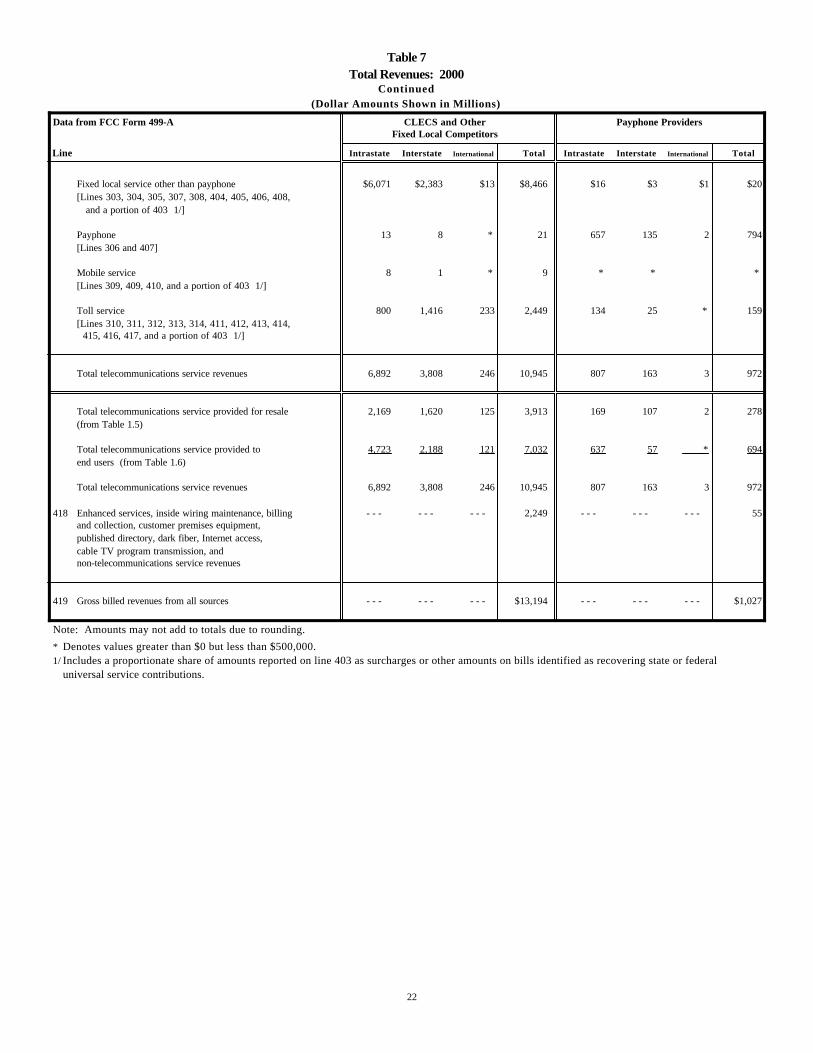
Table 7Total Revenues: 2000
Continued(Dollar Amounts Shown in Millions)
Data from FCC Form 499-A CLECS and Other Payphone ProvidersFixed Local Competitors
Line Intrastate Interstate International Total Intrastate Interstate International Total
Fixed local service other than payphone $6,071 $2,383 $13 $8,466 $16 $3 $1 $20[Lines 303, 304, 305, 307, 308, 404, 405, 406, 408, and a portion of 403 1/]
Payphone 13 8 * 21 657 135 2 794[Lines 306 and 407]
Mobile service 8 1 * 9 * * * [Lines 309, 409, 410, and a portion of 403 1/]
Toll service 800 1,416 233 2,449 134 25 * 159[Lines 310, 311, 312, 313, 314, 411, 412, 413, 414, 415, 416, 417, and a portion of 403 1/]
Total telecommunications service revenues 6,892 3,808 246 10,945 807 163 3 972
Total telecommunications service provided for resale 2,169 1,620 125 3,913 169 107 2 278(from Table 1.5)
Total telecommunications service provided to 4,723 2,188 121 7,032 637 57 * 694end users (from Table 1.6)
Total telecommunications service revenues 6,892 3,808 246 10,945 807 163 3 972
418 Enhanced services, inside wiring maintenance, billing - - - - - - - - - 2,249 - - - - - - - - - 55
and collection, customer premises equipment, published directory, dark fiber, Internet access, cable TV program transmission, and non-telecommunications service revenues
419 Gross billed revenues from all sources - - - - - - - - - $13,194 - - - - - - - - - $1,027
Note: Amounts may not add to totals due to rounding.
* Denotes values greater than $0 but less than $500,000. 1/ Includes a proportionate share of amounts reported on line 403 as surcharges or other amounts on bills identified as recovering state or federal
universal service contributions.
22

Table 7Total Revenues: 2000
Continued(Dollar Amounts Shown in Millions)
Data from FCC Form 499-A Cellular, PCS and SMR Wireless Other WirelessTelephony
Line Intrastate Interstate International Total Intrastate Interstate International Total
Fixed local service other than payphone $131 $10 * $141 $8 $1 * $9[Lines 303, 304, 305, 307, 308, 404, 405, 406, 408, and a portion of 403 1/]
Payphone 2 * 2 * * * [Lines 306 and 407]
Mobile service 50,171 7,067 78 57,317 2,855 537 5 3,397[Lines 309, 409, 410, and a portion of 403 1/]
Toll service 1,569 760 33 2,362 22 27 2 51[Lines 310, 311, 312, 313, 314, 411, 412, 413, 414, 415, 416, 417, and a portion of 403 1/]
Total telecommunications service revenues 51,873 7,838 112 59,823 2,886 565 7 3,457
Total telecommunications service provided for resale 4,532 708 12 5,252 488 110 * 598(from Table 1.5)
Total telecommunications service provided to 47,341 7,130 100 54,570 2,398 454 7 2,859end users (from Table 1.6)
Total telecommunications service revenues 51,873 7,838 112 59,823 2,886 565 7 3,457
418 Enhanced services, inside wiring maintenance, billing - - - - - - - - - 9,876 - - - - - - - - - 1,300
and collection, customer premises equipment, published directory, dark fiber, Internet access, cable TV program transmission, and non-telecommunications service revenues
419 Gross billed revenues from all sources - - - - - - - - - $69,698 - - - - - - - - - $4,757
Note: Amounts may not add to totals due to rounding.
* Denotes values greater than $0 but less than $500,000. 1/ Includes a proportionate share of amounts reported on line 403 as surcharges or other amounts on bills identified as recovering state or federal
universal service contributions.
23

Table 7Total Revenues: 2000
Continued(Dollar Amounts Shown in Millions)q
Data from FCC Form 499-A Toll Carriers Total All Filers
Line Intrastate Interstate International Total Intrastate Interstate International Total
Fixed local service other than payphone $2,040 $233 $4 $2,276 $84,255 $34,935 $25 $119,215[Lines 303, 304, 305, 307, 308, 404, 405, 406, 408, and a portion of 403 1/]
Payphone 34 69 2 105 1,580 348 4 1,932[Lines 306 and 407]
Mobile service 891 155 2 1,048 54,153 7,761 86 62,000[Lines 309, 409, 410, and a portion of 403 1/]
Toll service 24,083 53,786 20,110 97,978 33,030 56,207 20,379 109,615[Lines 310, 311, 312, 313, 314, 411, 412, 413, 414, 415, 416, 417, and a portion of 403 1/]
Total telecommunications service revenues 27,047 54,243 20,118 101,407 173,018 99,251 20,494 292,762
Total telecommunications service provided for resale 4,187 9,366 7,333 20,886 25,553 30,582 7,480 63,615(from Table 1.5)
Total telecommunications service provided to 22,860 44,875 12,785 80,520 147,465 68,671 13,014 229,149end users (from Table 1.6)
Total telecommunications service revenues 27,047 54,243 20,118 101,407 173,018 99,251 20,494 292,762
418 Enhanced services, inside wiring maintenance, billing - - - - - - - - - 15,730 - - - - - - - - - 42,261
and collection, customer premises equipment, published directory, dark fiber, Internet access, cable TV program transmission, and non-telecommunications service revenues
419 Gross billed revenues from all sources - - - - - - - - - $117,137 - - - - - - - - - $335,023
Note: Amounts may not add to totals due to rounding.
* Denotes values greater than $0 but less than $500,000. 1/ Includes a proportionate share of amounts reported on line 403 as surcharges or other amounts on bills identified as recovering state or federal
universal service contributions.
24

Table 8Revenues by Type of Carrier: 2000(Dollar Amounts Shown in Millions)
Data from FCC Form 499-A Telecommunications Services Telecommunications ServicesProvided for Resale 1/ Provided to End Users 1/
Fixed Mobile Toll Total Fixed Mobile Toll TotalLocal Local
Regional Bell Operating Companies $25,352 * $107 $25,459 $68,727 $198 $5,966 $74,892
Other Incumbent Local Exchange Carriers (ILECs) 7,175 3 50 7,227 8,058 29 493 8,580
Total ILECs 32,527 3 157 32,686 76,786 227 6,459 83,472
Competitive Access Providers (CAPs) and Competitive 2,895 1 692 3,587 4,679 5 1,543 6,228 Local Exchange Carriers (CLECs)
Local Resellers 94 47 140 607 * 132 739
Private Service Providers * 4 4 * 6 7
Shared-Tenant Service Providers 1 * 1 22 * 16 38
Other Local Service Providers 181 181 9 3 9 21
Total Local Competitors 3,170 1 743 3,913 5,317 8 1,707 7,032
Fixed Local Service Providers 35,697 3 899 36,599 82,103 235 8,166 90,504
Payphone Service Providers 276 2 278 537 * 157 694
Wireless Telephony Including Cellular, Personal 72 4,504 676 5,252 71 52,813 1,686 54,570 Communications Service (PCS) and SMR Telephony Carriers
Paging & Messaging Service Providers 5 582 2 590 2 2,490 20 2,513
Specialized Mobile Radio (SMR) Dispatch * * * * * 190 1 191
Wireless Data and Other Mobile Service Providers 8 8 1 127 27 156
Wireless Service Providers 78 5,094 679 5,850 75 55,620 1,735 57,430
Interexchange Carriers (IXCs) 488 * 16,353 16,842 1,379 647 68,443 70,469
Operator Service Providers (OSPs) * 10 10 6 * 619 625
Prepaid Calling Card Providers 3 28 31 * * 696 696
Satellite Service Providers * 64 64 5 4 264 272
Toll Resellers 57 46 2,677 2,780 412 345 7,103 7,861
Other Toll Carriers 22 * 1,137 1,159 8 6 585 599
Toll Service Providers 571 47 20,268 20,886 1,811 1,001 77,710 80,521
All Filers $36,621 $5,144 $21,848 $63,613 $84,526 $56,857 $87,767 $229,149
Note: Amounts may not add to totals due to rounding.
* Denotes values greater than $0 but less than $500,000.
1/ Telecommunications service provided for resale consists of services provided to other contributors to federal universal service support mechanisms for resale. Revenues from services provided to firms that are de minimis under or exempt from federal universal service support mechanisms are reported as end-user service.
1
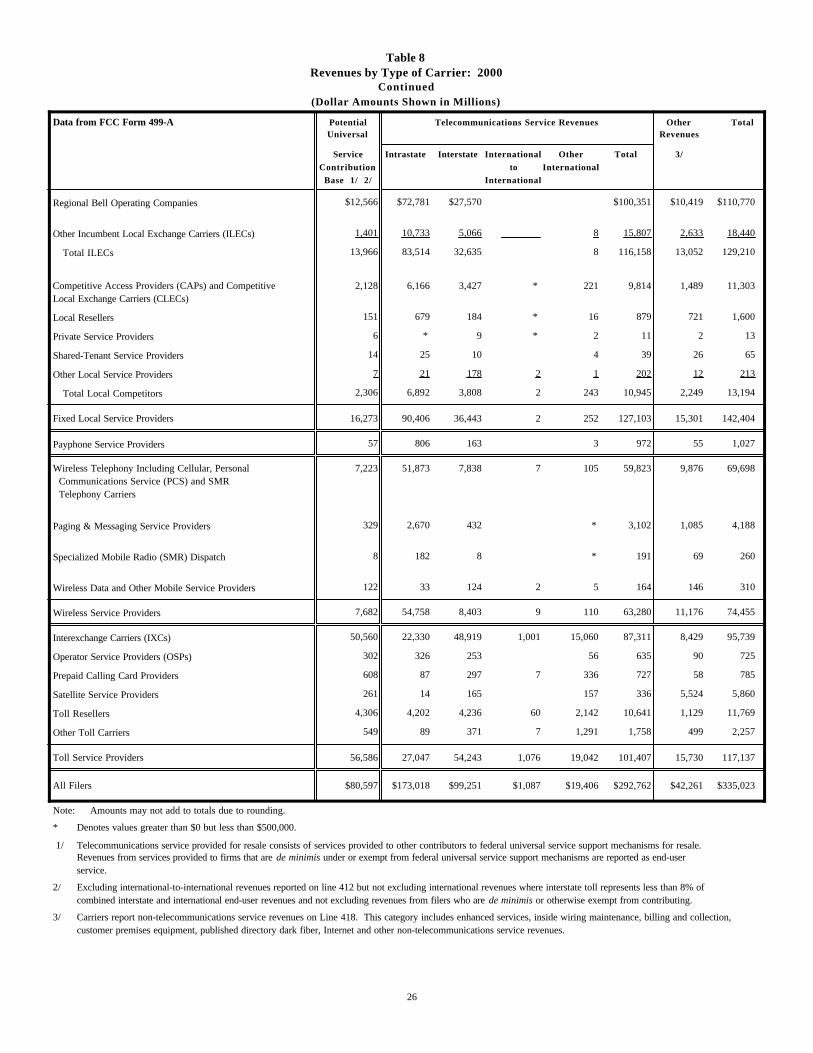
Table 8Revenues by Type of Carrier: 2000
Continued(Dollar Amounts Shown in Millions)
Data from FCC Form 499-A Potential Telecommunications Service Revenues Other TotalUniversal Revenues
Service Intrastate Interstate International Other Total 3/
Contribution to International
Base 1/ 2/ International
Regional Bell Operating Companies $12,566 $72,781 $27,570 $100,351 $10,419 $110,770
Other Incumbent Local Exchange Carriers (ILECs) 1,401 10,733 5,066 8 15,807 2,633 18,440
Total ILECs 13,966 83,514 32,635 8 116,158 13,052 129,210
Competitive Access Providers (CAPs) and Competitive 2,128 6,166 3,427 * 221 9,814 1,489 11,303 Local Exchange Carriers (CLECs)
Local Resellers 151 679 184 * 16 879 721 1,600
Private Service Providers 6 * 9 * 2 11 2 13
Shared-Tenant Service Providers 14 25 10 4 39 26 65
Other Local Service Providers 7 21 178 2 1 202 12 213
Total Local Competitors 2,306 6,892 3,808 2 243 10,945 2,249 13,194
Fixed Local Service Providers 16,273 90,406 36,443 2 252 127,103 15,301 142,404
Payphone Service Providers 57 806 163 3 972 55 1,027
Wireless Telephony Including Cellular, Personal 7,223 51,873 7,838 7 105 59,823 9,876 69,698 Communications Service (PCS) and SMR Telephony Carriers
Paging & Messaging Service Providers 329 2,670 432 * 3,102 1,085 4,188
Specialized Mobile Radio (SMR) Dispatch 8 182 8 * 191 69 260
Wireless Data and Other Mobile Service Providers 122 33 124 2 5 164 146 310
Wireless Service Providers 7,682 54,758 8,403 9 110 63,280 11,176 74,455
Interexchange Carriers (IXCs) 50,560 22,330 48,919 1,001 15,060 87,311 8,429 95,739
Operator Service Providers (OSPs) 302 326 253 56 635 90 725
Prepaid Calling Card Providers 608 87 297 7 336 727 58 785
Satellite Service Providers 261 14 165 157 336 5,524 5,860
Toll Resellers 4,306 4,202 4,236 60 2,142 10,641 1,129 11,769
Other Toll Carriers 549 89 371 7 1,291 1,758 499 2,257
Toll Service Providers 56,586 27,047 54,243 1,076 19,042 101,407 15,730 117,137
All Filers $80,597 $173,018 $99,251 $1,087 $19,406 $292,762 $42,261 $335,023
Note: Amounts may not add to totals due to rounding.
* Denotes values greater than $0 but less than $500,000.
1/ Telecommunications service provided for resale consists of services provided to other contributors to federal universal service support mechanisms for resale. Revenues from services provided to firms that are de minimis under or exempt from federal universal service support mechanisms are reported as end-user service.
2/ Excluding international-to-international revenues reported on line 412 but not excluding international revenues where interstate toll represents less than 8% of combined interstate and international end-user revenues and not excluding revenues from filers who are de minimis or otherwise exempt from contributing.
3/ Carriers report non-telecommunications service revenues on Line 418. This category includes enhanced services, inside wiring maintenance, billing and collection, customer premises equipment, published directory dark fiber, Internet and other non-telecommunications service revenues.
26
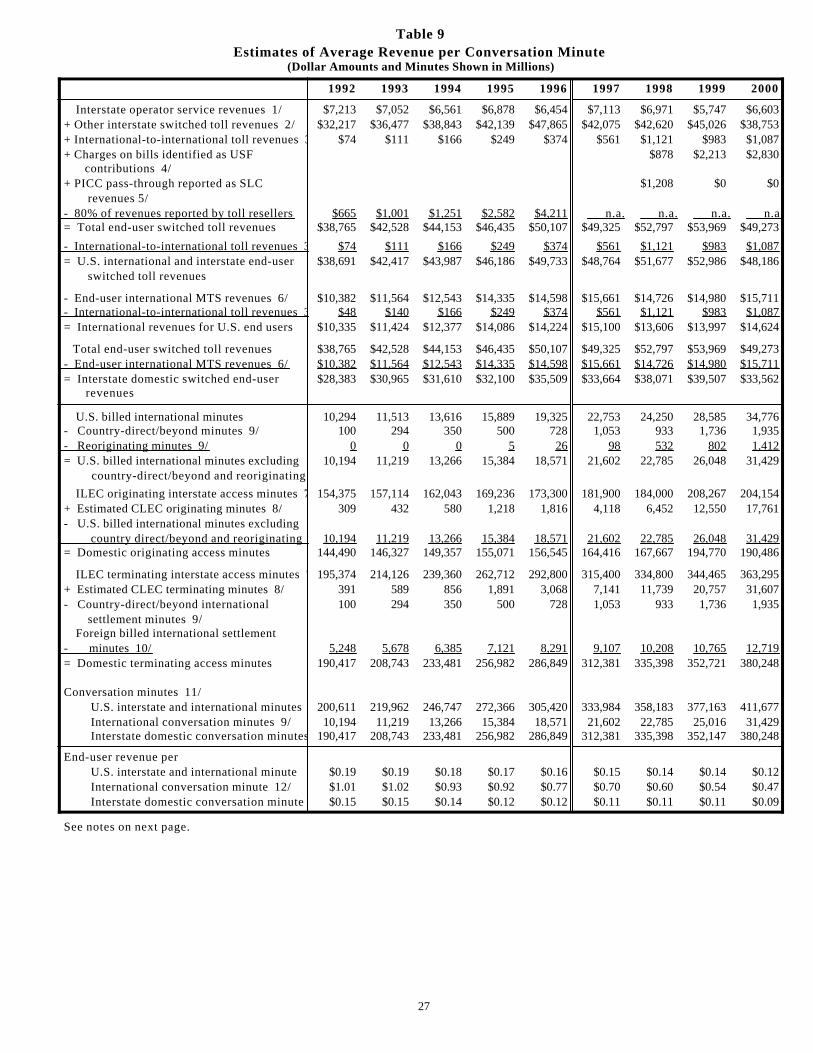
Table 9Estimates of Average Revenue per Conversation Minute
(Dollar Amounts and Minutes Shown in Millions)
1992 1993 1994 1995 1996 1997 1998 1999 2000
Interstate operator service revenues 1/ $7,213 $7,052 $6,561 $6,878 $6,454 $7,113 $6,971 $5,747 $6,603 + Other interstate switched toll revenues 2/ $32,217 $36,477 $38,843 $42,139 $47,865 $42,075 $42,620 $45,026 $38,753 + International-to-international toll revenues 3/ $74 $111 $166 $249 $374 $561 $1,121 $983 $1,087 + Charges on bills identified as USF $878 $2,213 $2,830 contributions 4/ + PICC pass-through reported as SLC $1,208 $0 $0 revenues 5/ - 80% of revenues reported by toll resellers $665 $1,001 $1,251 $2,582 $4,211 n.a. n.a. n.a. n.a. = Total end-user switched toll revenues $38,765 $42,528 $44,153 $46,435 $50,107 $49,325 $52,797 $53,969 $49,273
- International-to-international toll revenues 3/ $74 $111 $166 $249 $374 $561 $1,121 $983 $1,087 = U.S. international and interstate end-user $38,691 $42,417 $43,987 $46,186 $49,733 $48,764 $51,677 $52,986 $48,186 switched toll revenues
- End-user international MTS revenues 6/ $10,382 $11,564 $12,543 $14,335 $14,598 $15,661 $14,726 $14,980 $15,711 - International-to-international toll revenues 3/ $48 $140 $166 $249 $374 $561 $1,121 $983 $1,087 = International revenues for U.S. end users $10,335 $11,424 $12,377 $14,086 $14,224 $15,100 $13,606 $13,997 $14,624
Total end-user switched toll revenues $38,765 $42,528 $44,153 $46,435 $50,107 $49,325 $52,797 $53,969 $49,273 - End-user international MTS revenues 6/ $10,382 $11,564 $12,543 $14,335 $14,598 $15,661 $14,726 $14,980 $15,711 = Interstate domestic switched end-user $28,383 $30,965 $31,610 $32,100 $35,509 $33,664 $38,071 $39,507 $33,562 revenues
U.S. billed international minutes 10,294 11,513 13,616 15,889 19,325 22,753 24,250 28,585 34,776 - Country-direct/beyond minutes 9/ 100 294 350 500 728 1,053 933 1,736 1,935 - Reoriginating minutes 9/ 0 0 0 5 26 98 532 802 1,412 = U.S. billed international minutes excluding 10,194 11,219 13,266 15,384 18,571 21,602 22,785 26,048 31,429 country-direct/beyond and reoriginating
ILEC originating interstate access minutes 7/ 154,375 157,114 162,043 169,236 173,300 181,900 184,000 208,267 204,154 + Estimated CLEC originating minutes 8/ 309 432 580 1,218 1,816 4,118 6,452 12,550 17,761 - U.S. billed international minutes excluding country direct/beyond and reoriginating 9/ 10,194 11,219 13,266 15,384 18,571 21,602 22,785 26,048 31,429 = Domestic originating access minutes 144,490 146,327 149,357 155,071 156,545 164,416 167,667 194,770 190,486
ILEC terminating interstate access minutes 7/195,374 214,126 239,360 262,712 292,800 315,400 334,800 344,465 363,295 + Estimated CLEC terminating minutes 8/ 391 589 856 1,891 3,068 7,141 11,739 20,757 31,607 - Country-direct/beyond international 100 294 350 500 728 1,053 933 1,736 1,935 settlement minutes 9/ Foreign billed international settlement - minutes 10/ 5,248 5,678 6,385 7,121 8,291 9,107 10,208 10,765 12,719 = Domestic terminating access minutes 190,417 208,743 233,481 256,982 286,849 312,381 335,398 352,721 380,248
Conversation minutes 11/ U.S. interstate and international minutes 200,611 219,962 246,747 272,366 305,420 333,984 358,183 377,163 411,677 International conversation minutes 9/ 10,194 11,219 13,266 15,384 18,571 21,602 22,785 25,016 31,429 Interstate domestic conversation minutes 190,417 208,743 233,481 256,982 286,849 312,381 335,398 352,147 380,248
End-user revenue per U.S. interstate and international minute $0.19 $0.19 $0.18 $0.17 $0.16 $0.15 $0.14 $0.14 $0.12 International conversation minute 12/ $1.01 $1.02 $0.93 $0.92 $0.77 $0.70 $0.60 $0.54 $0.47 Interstate domestic conversation minute $0.15 $0.15 $0.14 $0.12 $0.12 $0.11 $0.11 $0.11 $0.09
See notes on next page.
27

Notes for Table 9.
Note: Some data for prior years have been revised.
1/ Starting in 1997, interstate operator service revenues are interstate and international prepaid calling card revenues (currently Table 6, Line 411) plus revenues from interstate and international operator and toll calls with alternative billing arrangements (currently Table 6, Line 413).
2/ Starting in 1997, other interstate switched toll revenues are equal to revenues from interstate and international ordinary long distance and other switched toll services (currently Table 6, Line 414).
3/ Starting in 1997, amounts shown are revenues from international calls that both originate and terminate at foreign points (currently Table 6, Line 412). International-to-international revenues were not reported separately prior to 1997. Amounts for 1992 through 1996 were estimated using a 50% growth rate. Most international-to-international services are provided to foreign customers. Some international-to-international services, such as call-back service, generate both originating and terminating access minutes.
4/ Carriers only report aggregate universal service surchage revenues. Such revenues are allocated across services based on the share of contribution base revenues generated by each service.
5/ PICC charges were introduced in 1998. The reporting instructions for 1998 data were not clear and many toll carriers reported PICC pass-through charges as local revenues rather than as toll revenues. Carrier-by-carrier information was used to identify misclassified amounts to ensure that the amount of toll revenues for 1998 was accurate..
6/ Table 2 of Trends in the U.S. International Telecommunications Industry contains estimates of international end-user revenues. A preliminary figure is used for year 2000. Note that these figures differ significantly from data contained in Table 6 herein. Table 3 in the U.S. International Telecommunications Industry contains data for country-direct/beyond and reoriginated minutes.
7/ Based on National Exchange Carrier Association (NECA) filings. Beginning in 1999, ILECs total interstate access minutes (Monitoring Report, Table 8.1) are allocated between originating and terminating based on the originating and terminating shares of carrier common line (CCL) minutes of use reported by carriers subject to price-cap regulation and all local exchange carriers in the NECA pool (see Trends in Telephone Service, Table 1.4).
8/ CLEC access minutes are estimated based on the local service competitors share of the local services market. Data taken from theLocal Telephone Competition report. The 1992 percentage is based on trend derived from following year data. The 2000 percentage is preliminary.
1992 1993 1994 1995 1996 1997 1998 1999 2000Local service competitors share of localrevenues 0.2% 0.3% 0.4% 0.7% 1.0% 2.3% 3.5% 5.8% 8.7%
9/ World total MTS minutes billed in the United States from Section 43.61 International Telecommunications Data.Includes data for all U.S. points, all settlement arrangements and all U.S. carriers. Billing types covered are 1, 11, and 21. (See that report for an explanation of billing types.) Starting in 1995, carriers separately reported country-direct/beyond minutes. Most country-direct traffic generates terminating access minutes and generally represents billed end-user revenues from U.S. customers. Country-beyond minutes generally do not result in access minutes and generate revenues that are reported as international-to-international. Some other international-to-international traffic, however, results in access minutes and ordinary U.S. billed minutes of traffic. In the absence of better assumptions, and recognizing the offsetting bias for call-back minutes, the country-beyond/direct minutes are treated as terminating access minutes but are not included as international conversation minutes.
10/ World total MTS minutes originating or terminating in the United States but billed in foreign countries are from Section 43.61 International Telecommunications Data. Includes data for all U.S. points, all settlement arrangments and all U.S. carriers. Billing types covered are 2, 12, and 22. Foreign billed minutes of international traffic generate terminating access minutes.
11/ International conversation minutes are estimated as U.S. billed international traffic minutes excluding country-direct/beyond and reoriginating minutes. Domestic conversation minutes are estimated as domestic terminating access minutes.
12/ International revenue per-minute amounts published herein differ from estimates published in Trends in the U.S. InternationalTelecommunications Industry, Table 2, because the latter estimates include revenues and billed minutes associated with calls that originate and terminate at foreign points.
28
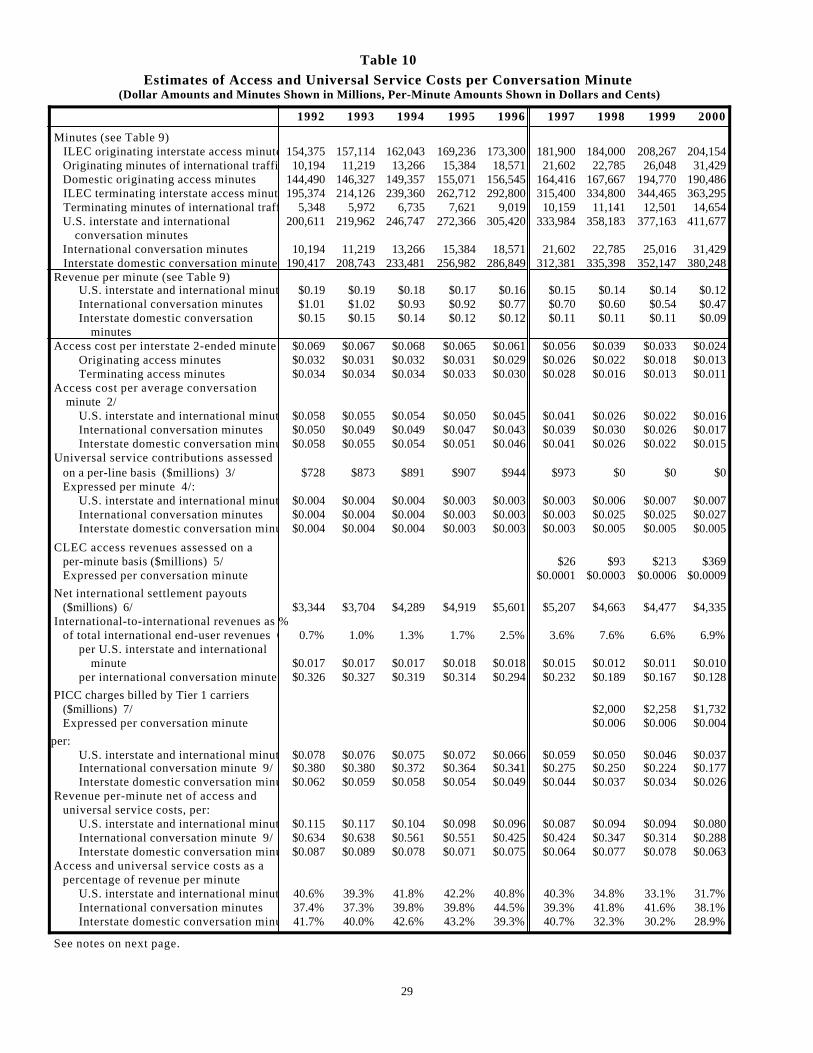
Table 10
Estimates of Access and Universal Service Costs per Conversation Minute(Dollar Amounts and Minutes Shown in Millions, Per-Minute Amounts Shown in Dollars and Cents)
1992 1993 1994 1995 1996 1997 1998 1999 2000
Minutes (see Table 9) ILEC originating interstate access minutes 154,375 157,114 162,043 169,236 173,300 181,900 184,000 208,267 204,154 Originating minutes of international traffic 10,194 11,219 13,266 15,384 18,571 21,602 22,785 26,048 31,429 Domestic originating access minutes 144,490 146,327 149,357 155,071 156,545 164,416 167,667 194,770 190,486 ILEC terminating interstate access minutes 195,374 214,126 239,360 262,712 292,800 315,400 334,800 344,465 363,295 Terminating minutes of international traffic 5,348 5,972 6,735 7,621 9,019 10,159 11,141 12,501 14,654 U.S. interstate and international 200,611 219,962 246,747 272,366 305,420 333,984 358,183 377,163 411,677 conversation minutes International conversation minutes 10,194 11,219 13,266 15,384 18,571 21,602 22,785 25,016 31,429 Interstate domestic conversation minutes 190,417 208,743 233,481 256,982 286,849 312,381 335,398 352,147 380,248 Revenue per minute (see Table 9)
U.S. interstate and international minutes $0.19 $0.19 $0.18 $0.17 $0.16 $0.15 $0.14 $0.14 $0.12International conversation minutes $1.01 $1.02 $0.93 $0.92 $0.77 $0.70 $0.60 $0.54 $0.47Interstate domestic conversation $0.15 $0.15 $0.14 $0.12 $0.12 $0.11 $0.11 $0.11 $0.09 minutes
Access cost per interstate 2-ended minute 1/ $0.069 $0.067 $0.068 $0.065 $0.061 $0.056 $0.039 $0.033 $0.024Originating access minutes $0.032 $0.031 $0.032 $0.031 $0.029 $0.026 $0.022 $0.018 $0.013Terminating access minutes $0.034 $0.034 $0.034 $0.033 $0.030 $0.028 $0.016 $0.013 $0.011
Access cost per average conversation minute 2/
U.S. interstate and international minutes $0.058 $0.055 $0.054 $0.050 $0.045 $0.041 $0.026 $0.022 $0.016International conversation minutes $0.050 $0.049 $0.049 $0.047 $0.043 $0.039 $0.030 $0.026 $0.017Interstate domestic conversation minutes$0.058 $0.055 $0.054 $0.051 $0.046 $0.041 $0.026 $0.022 $0.015
Universal service contributions assessed on a per-line basis ($millions) 3/ $728 $873 $891 $907 $944 $973 $0 $0 $0 Expressed per minute 4/:
U.S. interstate and international minutes $0.004 $0.004 $0.004 $0.003 $0.003 $0.003 $0.006 $0.007 $0.007International conversation minutes $0.004 $0.004 $0.004 $0.003 $0.003 $0.003 $0.025 $0.025 $0.027Interstate domestic conversation minutes$0.004 $0.004 $0.004 $0.003 $0.003 $0.003 $0.005 $0.005 $0.005
CLEC access revenues assessed on a per-minute basis ($millions) 5/ $26 $93 $213 $369 Expressed per conversation minute $0.0001 $0.0003 $0.0006 $0.0009
Net international settlement payouts ($millions) 6/ $3,344 $3,704 $4,289 $4,919 $5,601 $5,207 $4,663 $4,477 $4,335 International-to-international revenues as % of total international end-user revenues 6/ 0.7% 1.0% 1.3% 1.7% 2.5% 3.6% 7.6% 6.6% 6.9%
per U.S. interstate and international minute $0.017 $0.017 $0.017 $0.018 $0.018 $0.015 $0.012 $0.011 $0.010per international conversation minute $0.326 $0.327 $0.319 $0.314 $0.294 $0.232 $0.189 $0.167 $0.128
PICC charges billed by Tier 1 carriers ($millions) 7/ $2,000 $2,258 $1,732 Expressed per conversation minute $0.006 $0.006 $0.004
per:U.S. interstate and international minute $0.078 $0.076 $0.075 $0.072 $0.066 $0.059 $0.050 $0.046 $0.037International conversation minute 9/ $0.380 $0.380 $0.372 $0.364 $0.341 $0.275 $0.250 $0.224 $0.177Interstate domestic conversation minute$0.062 $0.059 $0.058 $0.054 $0.049 $0.044 $0.037 $0.034 $0.026
Revenue per-minute net of access and universal service costs, per:
U.S. interstate and international minute $0.115 $0.117 $0.104 $0.098 $0.096 $0.087 $0.094 $0.094 $0.080International conversation minute 9/ $0.634 $0.638 $0.561 $0.551 $0.425 $0.424 $0.347 $0.314 $0.288Interstate domestic conversation minute$0.087 $0.089 $0.078 $0.071 $0.075 $0.064 $0.077 $0.078 $0.063
Access and universal service costs as a percentage of revenue per minute
U.S. interstate and international minutes 40.6% 39.3% 41.8% 42.2% 40.8% 40.3% 34.8% 33.1% 31.7%International conversation minutes 37.4% 37.3% 39.8% 39.8% 44.5% 39.3% 41.8% 41.6% 38.1%Interstate domestic conversation minutes41.7% 40.0% 42.6% 43.2% 39.3% 40.7% 32.3% 30.2% 28.9%
See notes on next page.
29

Notes for Table 10.
Note: Some data for prior years have been revised. Some 2000 international data are preliminary. See text for other caveats.
1/ Originating and terminating per-minute charges are derived from data in Table 1.2 of Trends in Telephone Service. Charges for the year are calculated as charges for the first and second half of each year, weighted by the actual access minutes for the respective halves.
2/ Access cost per average conversation minute is calculated as the total cost of originating and terminating access (based on ILEC but notCLEC access minutes and costs per minute shown in the table) divided by conversation minutes. For example, for international minutes, originating access minutes equals the U.S. billed international minutes excluding country-direct/beyond minutes and hubbing minutes. Similarly, terminating access minutes equal the number of foreign billed minutes plus country-direct/beyond minutes. Ideally, country-direct minutes would be treated differently from country-beyond minutes, but Section 43.61 international traffic data reports do not contain that breakout. For simplicity, all CLEC minutes are treated as domestic access minutes.
3/ Source: National Exchange Carrier Association (NECA). Toll carriers were assessed based on the number of presubscribed lines.
4/ Through 1997, universal service charges per minute were calculated as the assessments based on lines divided by all U.S.conversation minutes. Starting with 1998, the amounts are estimated as the approximate contribution rate for interstate and international calls times the average per-minute charges.
5/ Interstate access per-minute revenues reported on FCC Form 457 and FCC Form 499-A by carriers other than ILECs.
6/ Section 43.61 International Telecommunications Data. Totals exclude settlement payouts for hubbing service. Netinternational settlement payouts have been reduced by the ratio of international-to-international service revenues to total international end-user revenues, reflecting the assumption that these revenues cause a proportionate share of net settlement payouts.
7/ Since 1998, Tier 1 incumbent local exchange carriers were allowed to recover a portion of interstate expenses through presubscribed interexchange carrier charges (PICCs) on access lines. Where the access line was presubscribed, the PICCwas levied on the interexchange carrier (IXC) and the associated revenues were reported as carrier's carrier revenues.The PICC charges shown in the table are based on Tier 1 carrier charges as well as line count information from Tariff Review Plans and from Statistics of Communications Common Carriers. Where consumers did not have a pre-subscribedIXC, however, the LEC billed the PICC charge to the customer rather than the IXC. We estimated that 97% of ILEC PICC revenues were collected from IXCs.
8/ Includes tariffed per-minute access charges, net international settlement payouts, universal service contributions and PICC charges but excludes the cost of dedicated access lines.
9/ The net cost of settling international traffic consists of the settlement payouts for U.S. billed traffic less the settlement receipts for foreign billed traffic. The minutes of foreign billed traffic are not included as international conversation minutes becauseU.S. carriers do not bill U.S. customers for this traffic. U.S. carriers incur terminating access charges for these minutes and international transmission costs. The terminating access costs are included in the cost per-minute estimates. Trends in the U.S. International. Telecommunications Industry shows end-user revenue per minute handled, as compared to end-user revenueper U.S. billed conversation minute shown herein.
30

Table 11End-User Telecommunications Service Revenues
by Region of the Country: 2000(Dollar Amounts Shown in Millions)
By Type of Filer
Fixed Local Toll Wireless All Filers Percentand including of
Payphone Satellite Total
Southeast: $19,223 $14,803 $11,851 $45,877 20.0 % Alabama, Florida, Georgia, Kentucky, Louisiana, Mississippi, North Carolina, Puerto Rico,
South Carolina, Tennessee, and U.S. Virgin Islands
Western: 10,596 10,445 6,594 27,635 12.1 Alaska, Arizona, Colorado, Idaho, Iowa, Minnesota, Montana, Nebraska, New Mexico, North Dakota,
Oregon, South Dakota, Utah, Washington, and Wyoming
West Coast: 11,046 11,956 9,783 32,785 14.3 California, Hawaii, Nevada, American Samoa, Guam, Northern Mariana Islands, and Wake Island
Mid-Atlantic: 11,895 11,032 6,262 29,189 12.7 Delaware, District of Columbia, Maryland, New Jersey, Pennsylvania, Virginia, and West Virginia
Mid-West: 14,039 10,256 8,747 33,043 14.4 Illinois, Indiana, Michigan, Ohio, and Wisconsin
Northeast: 11,967 9,851 6,284 28,101 12.3 Connecticut, Maine, Massachusetts, New Hampshire,
New York, Rhode Island, and Vermont
Southwest: 11,348 11,032 7,503 29,883 13.0 Arkansas, Kansas, Missouri, Oklahoma, and Texas
Filers that did not idenify revenues by region 1/ 1,084 1,146 406 2,636 1.2
Total $91,198 $80,520 $57,430 $229,148 100 %
1/ Filers that are exempt from contributing to local number portability administration are not required to provide a breakout by region of the country.
31

Table 12Carrier Telecommunications Revenues with Estimated Breakdowns by Type of Service:
First Quarter 2001(Dollar Amounts Shown in Millions)
Data from FCC Form 499-Q Telecommunications Service Telecommunications ServiceProvided for Resale 1/ Provided to End Users 1/
UniversalFixed Mobile Toll Total Fixed Mobile Toll 2/ Total ServiceLocal Revenues Local Revenues Contribution
Base 3/
Regional Bell Operating Companies $6,652 * $28 $6,680 $17,050 $49 $1,480 $18,579 $3,373
Other Incumbent Local Exchange Carriers (ILECs) 1,879 1 13 1,893 2,130 8 130 2,268 400
Total ILECs 8,531 1 41 8,573 19,180 57 1,610 20,847 3,773
Competitive Access Providers (CAPs) and 786 * 188 974 1,295 1 427 1,723 482 Competitive Local Exchange Carriers (CLECs)
Local Resellers 45 23 68 194 * 42 237 42
Private Service Providers * 6 6 * 2 2 2
Shared-Tenant Service Providers * * * 6 * 5 11 3
Other Local Service Providers 45 ___ ___ 45 10 3 8 21 2
Total Local Competitors 877 * 217 1,094 1,506 5 483 1,994 532
Fixed Local Service Providers 9,409 1 258 9,667 20,685 61 2,094 22,841 4,304
Payphone Service Providers 65 1 65 115 * 34 149 10
Wireless Telephony Including Cellular, Personal 18 1,090 164 1,272 18 13,555 431 14,005 1,875 Communications Service (PCS) and SMR Telephony Carriers
Paging & Messaging Service Providers 1 155 1 157 * 502 4 507 68
Specialized Mobile Radio (SMR) Dispatch * * * * * 49 * 49 2
Wireless Data and Other Mobile Service Providers 2 2 * 28 6 34 25
Wireless Service Providers 19 1,247 164 1,430 19 14,134 441 14,594 1,970
Interexchange Carriers (IXCs) 102 * 3,413 3,515 342 160 16,716 17,218 12,258
Operator Service Providers (OSPs) * 6 7 1 * 130 131 59
Prepaid Calling Card Providers 1 7 8 * * 32 32 25
Satellite Service Providers * 23 23 1 1 60 62 32
Toll Resellers 15 12 702 730 93 78 1,586 1,756 964
Other Toll Carriers 6 * 291 296 3 2 218 223 152
Toll Service Providers 123 12 4,441 4,577 440 241 18,741 19,422 13,490
All Filers $9,616 $1,260 $4,864 $15,740 $21,260 $14,436 $21,309 $57,005 $19,775
Note: Amounts may not add to totals due to rounding.
* Denotes values greater than $0 but less than $500,000.
1/ Telecommunications service provided for resale consists of services provided to other contributors to federal universal service support mechanisms. Service provided to firms that do not contribute directly to federal universal service support mechanisms are reported asend-user service.
2/ Unlike Table 8, toll revenues shown in Table 12 exclude revenues from calls that both originate and terminate at foreign points.
3/ The total varies from the amount used for calculating the universal service contribution factor for the third quarter of 2001 because data were extracted from the Form 499-Q data base at different points in time and may include amounts for filers that are not required to contribute.
32
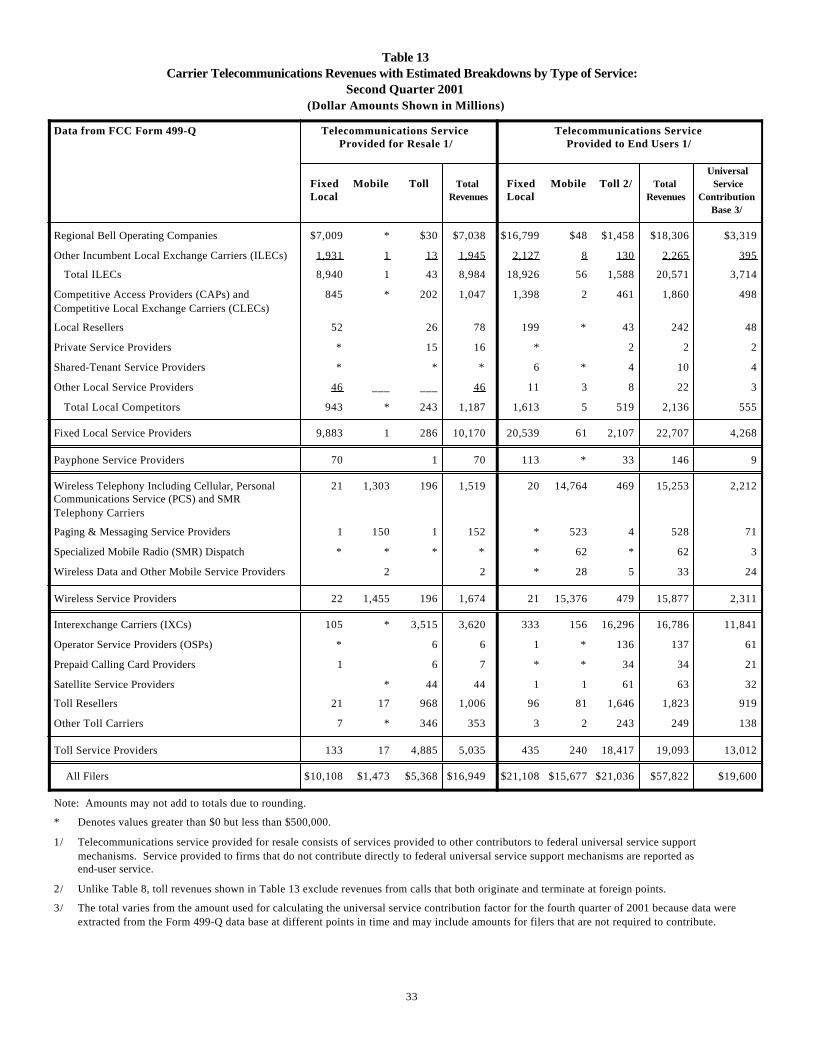
Table 13Carrier Telecommunications Revenues with Estimated Breakdowns by Type of Service:
Second Quarter 2001(Dollar Amounts Shown in Millions)
Data from FCC Form 499-Q Telecommunications Service Telecommunications ServiceProvided for Resale 1/ Provided to End Users 1/
UniversalFixed Mobile Toll Total Fixed Mobile Toll 2/ Total ServiceLocal Revenues Local Revenues Contribution
Base 3/
Base 3/ Regional Bell Operating Companies $7,009 * $30 $7,038 $16,799 $48 $1,458 $18,306 $3,319
Other Incumbent Local Exchange Carriers (ILECs) 1,931 1 13 1,945 2,127 8 130 2,265 395
Total ILECs 8,940 1 43 8,984 18,926 56 1,588 20,571 3,714
Competitive Access Providers (CAPs) and 845 * 202 1,047 1,398 2 461 1,860 498 Competitive Local Exchange Carriers (CLECs)
Local Resellers 52 26 78 199 * 43 242 48
Private Service Providers * 15 16 * 2 2 2
Shared-Tenant Service Providers * * * 6 * 4 10 4
Other Local Service Providers 46 ___ ___ 46 11 3 8 22 3
Total Local Competitors 943 * 243 1,187 1,613 5 519 2,136 555
Fixed Local Service Providers 9,883 1 286 10,170 20,539 61 2,107 22,707 4,268
Payphone Service Providers 70 1 70 113 * 33 146 9
Wireless Telephony Including Cellular, Personal 21 1,303 196 1,519 20 14,764 469 15,253 2,212 Communications Service (PCS) and SMR Telephony Carriers
Paging & Messaging Service Providers 1 150 1 152 * 523 4 528 71
Specialized Mobile Radio (SMR) Dispatch * * * * * 62 * 62 3
Wireless Data and Other Mobile Service Providers 2 2 * 28 5 33 24
Wireless Service Providers 22 1,455 196 1,674 21 15,376 479 15,877 2,311
Interexchange Carriers (IXCs) 105 * 3,515 3,620 333 156 16,296 16,786 11,841
Operator Service Providers (OSPs) * 6 6 1 * 136 137 61
Prepaid Calling Card Providers 1 6 7 * * 34 34 21
Satellite Service Providers * 44 44 1 1 61 63 32
Toll Resellers 21 17 968 1,006 96 81 1,646 1,823 919
Other Toll Carriers 7 * 346 353 3 2 243 249 138
Toll Service Providers 133 17 4,885 5,035 435 240 18,417 19,093 13,012
All Filers $10,108 $1,473 $5,368 $16,949 $21,108 $15,677 $21,036 $57,822 $19,600
Note: Amounts may not add to totals due to rounding.
* Denotes values greater than $0 but less than $500,000.
1/ Telecommunications service provided for resale consists of services provided to other contributors to federal universal service support mechanisms. Service provided to firms that do not contribute directly to federal universal service support mechanisms are reported asend-user service.
2/ Unlike Table 8, toll revenues shown in Table 13 exclude revenues from calls that both originate and terminate at foreign points.
3/ The total varies from the amount used for calculating the universal service contribution factor for the fourth quarter of 2001 because data were extracted from the Form 499-Q data base at different points in time and may include amounts for filers that are not required to contribute.
33

Table 14Carrier Telecommunications Revenues with Estimated Breakdowns by Type of Service:
Third Quarter 2001(Dollar Amounts Shown in Millions)
Data from FCC Form 499-Q Telecommunications Service Telecommunications ServiceProvided for Resale 1/ Provided to End Users 1/
UniversalFixed Mobile Toll Total Fixed Mobile Toll 2/ Total ServiceLocal Revenues Local Revenues Contribution
Base 3/
Base 3/ Regional Bell Operating Companies $6,478 * $27 $6,505 $16,454 $47 $1,428 $17,929 $3,429
Other Incumbent Local Exchange Carriers (ILECs) 2,100 1 15 2,115 2,615 10 160 2,784 470
Total ILECs 8,578 1 42 8,621 19,068 57 1,588 20,713 3,900
Competitive Access Providers (CAPs) and 602 * 144 746 1,307 1 431 1,740 520 Competitive Local Exchange Carriers (CLECs)
Local Resellers 64 32 96 169 * 37 206 46
Private Service Providers * 45 45 1 33 35 26
Shared-Tenant Service Providers * * * 4 * 3 8 3
Other Local Service Providers 50 ___ ___ 50 15 4 12 31 7
Total Local Competitors 716 * 221 937 1,497 6 516 2,019 602
Fixed Local Service Providers 9,294 1 263 9,558 20,565 63 2,104 22,732 4,502
Payphone Service Providers 70 1 70 165 * 48 213 35
Wireless Telephony Including Cellular, Personal 24 1,484 223 1,730 23 16,352 534 17,359 2,541 Communications Service (PCS) and SMR Telephony Carriers
Paging & Messaging Service Providers 1 128 1 130 1 1,014 8 1,023 129
Specialized Mobile Radio (SMR) Dispatch * * * * * 46 * 47 3
Wireless Data and Other Mobile Service Providers 4 4 1 65 13 78 29
Wireless Service Providers 25 1,616 223 1,865 24 17,477 555 18,057 2,703
Interexchange Carriers (IXCs) 111 * 3,733 3,845 321 151 15,716 16,189 11,450
Operator Service Providers (OSPs) * 13 13 1 * 53 53 24
Prepaid Calling Card Providers 1 7 7 * * 27 27 13
Satellite Service Providers * 34 35 1 1 53 54 16
Toll Resellers 13 10 594 617 115 96 1,962 2,173 1,141
Other Toll Carriers 2 * 114 116 4 3 307 314 117
Toll Service Providers 127 10 4,495 4,633 442 251 18,118 18,811 12,663
All Filers $9,516 $1,627 $4,982 $16,126 $21,197 $17,790 $20,826 $59,813 $20,001
Note: Amounts may not add to totals due to rounding.
* Denotes values greater than $0 but less than $500,000.
1/ Telecommunications service provided for resale consists of services provided to other contributors to federal universal service support mechanisms. Service provided to firms that do not contribute directly to federal universal service support mechanisms are reported asend-user service.
2/ Unlike Table 8, toll revenues shown in Table 14 exclude revenues from calls that both originate and terminate at foreign points.
3/ The total varies from the amount used for calculating the universal service contribution factor for the first quarter of 2002 because data were extracted from the Form 499-Q data base at different points in time and may include amounts for filers that are not required to contribute.
34

Customer Response
Publication: Telecommunications Industry Revenues: 2000
You can help us provide the best possible information to the public by completing this form andreturning it to the Industry Analysis Division of the FCC's Common Carrier Bureau.1. Please check the category that best describes you:
____ press____ current telecommunications carrier____ potential telecommunications carrier____ business customer evaluating vendors/service options____ consultant, law firm, lobbyist____ other business customer____ academic/student____ residential customer____ FCC employee____ other federal government employee____ state or local government employee____ Other (please specify)
2. Please rate the report: Excellent Good Satisfactory Poor No opinionData accuracy (_) (_) (_) (_) (_)Data presentation (_) (_) (_) (_) (_)Timeliness of data (_) (_) (_) (_) (_)Completeness of data (_) (_) (_) (_) (_)Text clarity (_) (_) (_) (_) (_)Completeness of text (_) (_) (_) (_) (_)
3. Overall, how do you Excellent Good Satisfactory Poor No opinionrate this report? (_) (_) (_) (_) (_)
4. How can this report be improved?
5. May we contact you to discuss possible improvements?
Name:Telephone #:
Questions? Contact Jim Lande or Ken Lynch at 202-418-0940or email [email protected], [email protected]
Fax this response to Or Mail this response to
202-418-0520 FCC/IADWashington, D.C. 20554
Related Documents