Telecommunication & ICT Sector Performance Indicators A Handbook for National Regulatory Authorities Compiled by The Pacific ICT Regulatory Resource Center (pacificIRRC) and

Welcome message from author
This document is posted to help you gain knowledge. Please leave a comment to let me know what you think about it! Share it to your friends and learn new things together.
Transcript

Telecommunication & ICT
Sector Performance Indicators
A Handbook for
National Regulatory Authorities
Compiled by
The Pacific ICT Regulatory Resource Center (pacificIRRC)
and

2
Introduction
Over the past two decades telecommunications have grown to be of paramount importance, both at a national and international level. Having identified this phenomenon, local governments are increasingly enacting legislation and policies that would further facilitate the adoption of emerging technologies. Most nations have opted to change their telecom sectors to more liberalized or deregulated market structures, in order to survive the pace of globalization that is being driven by new ICT technologies. Due to this rapid move towards a more integrated Information Society, the availability of internationally competitive telecommunication services is vital. Importance of Standardized Data As the telecommunication sector is now considered a key component of economic growth, there is immense value in the data collected on different telecom indicators. Standardized data highlights ICT development and access both in a national and regional context. Time comparisons of country data provide insights into the effects of regulatory actions and market changes on a nation’s ICT growth. Specific data, such as an operator’s market share based on its subscriber base, can be used to formulate policy or to determine regulation. As such, comparable, standardized data on a series of ICT indicators is of utmost importance to regulators, policy makers and operators in any country. Definitions by International Organizations Many countries, especially those that are members of the International Telecommunications Union (ITU) regularly collect and report (often to the ITU) data against a number of ICT indicators. However, proper data comparisons are made difficult at times, due to the dearth of commonly accepted standards and definitions for each indicator. Having recognized the need for comparable data, the ITU is continuously engaged in establishing standards and definitions for each indicator. The ITU though, is not the only international organization that collects, reports, uses and disseminates indicator data. While the ITU’s focus is predominantly telecommunication indicators, the ongoing interest in ICT for development has led to an increased demand for a broader range of ICT indicators. Therefore, a number of organizations (ITU, OECD, UNCTAD, UNESCO Institute for Statistics, UN ICT Task Force, the World Bank, and UNESCAP among others) have formed the Partnership for Measuring ICT for Development, and are undertaking an on-going initiative to develop a series of ICT indicators, while simultaneously preparing standardized definitions for these indicators. The Basis for the Handbook Based on earlier work by LIRNEasia, this draft handbook is the result of the recognition that regional policy development and regional comparisons amongst the pacficIRRC countries can only be undertaken, if standardized and comparable indicators are available at a regional level. While standardization at an international level is difficult, a regional attempt, especially amongst similar countries could facilitate the effort. Moreover, a regional agreement may even be necessary in cases where a global definition is not applicable to a particular region. This draft is intended as a working document that will be improved via regional discussion amongst National Regulatory Authorities, National Statistical Organizations and Operators in the pacificIRRC countries. The handbook provides a basic list of indicators that regulatory agencies should strive to collect and disseminate. Definitions are included to assist telecommunications analysts, as well as the

3
growing number of non-specialists interested in telecommunications. Guidelines are also provided for those responsible for collecting and disseminating data on ICT indicators. The objectives of this handbook are as follows:
- To identify a minimal set of indicators necessary for inter and intra country comparison in pacificIRRC countries.
- To define as clearly as possible each indicator (and where differences exist across countries to identify the differences), thereby establishing a reliable dataset that would be compiled on an annual basis.
The indicators in this document are classified into five groups, for ease of presentation and discussion. They are as follows:
- Connectivity - Industry structure and industry impact - Price and affordability - Revenue - Quality of Service
The selected indicators in the groups listed above broadly cover the telecom sector. However, there are many more indicators that are available. The ITU itself collects data against a long list of indicators. Other organizations attempt to define many others. The intention of this publication is not to present every possible indicator that can be collected, but to provide a minimal set of indicators that are useful for countries under the purview of pacificIRRC. Moreover, in the fast evolving field of ICT, the basic set of indicators (and their definitions) needs to be regularly revisited and revised in order to keep up with changes in technology. All attempts are made to not develop new definitions, and add to the confusion that already exists globally on definitions. Wherever possible, the ITU or Partnership definitions are used. However, some existing definitions have significant problems that inhibit inter or intra country comparisons. These issues are discussed, so that data collectors and data users can be aware of potential hazards. General principles in indicator data collection and reporting Listed below are a basic set of guidelines that need to be followed when reporting indicator data. These rules should be adhered to when publishing data in order to facilitate the process of cross-country comparisons.
- All indicators should be provided in US dollars (USD). In the event that dollar values are unavailable, the local currency should be converted to USD. The conversion rate and date should be clearly presented in the footnotes for future clarification.
- Units should always be indicated (e.g. millions/billions). - Time period should be stated. It is recommended that the indicators listed in this
handbook are collected on a quarterly basis. If that is not possible, in the first instance the data can be reported on an annual basis. When reporting on an annual basis, the “Year” should be defined – i.e. whether it is a colander year (Jan – Dec) or the specific Financial Year (which varies from country to country: e.g. July – June or April-Mar)
- Data authority should be specified. Often more than one organization will collect/estimate and report data against the same indicators. When the data reported by two organizations do not tally, it is important to use the figure provided by the National Statistical Organization. However, the figure given by the alternative organization should be stated in a footnote drawing attention to the difference between the two.

4
- For more comprehensive comparisons to be made the indicators listed in this manual should be converted from US $ to be reflective of Purchasing Power Parity (PPP). Reporting the figures in PPP will make them more realistic that total US $ numbers as they represent the local cost of a basket of goods that can be compared at an international level. This means that the indicator will need to be converted using the PPP adjusted exchange rate. PPP needs to be calculated on an annual basis and the methodology can be found at : http://www.povertyfrontiers.org/ev_en.php?ID=1081_201&ID2=DO_TOPIC. Also the IMF reports the PPP adjusted exchange rates. The latest figures can be found at http://www.imf.org/external/pubs/ft/weo/2011/01/weodata/index.aspx
Demand Side Data vs. Supply Side This handbook is a guide for regulators who are in a position to collect data from suppliers of telecom services. However, to measure the state of the information society, a host of other indicators on usage and access to telecom and ICT services are needed. Data on these indicators can only be obtained by national statistical organizations (NSO) through household or business surveys. These indicators and methodologies are not covered in this manual.
5
Table of Contents 1 Connectivity Indicators 08 1.1 Number of fixed lines 08 1.2 Number of fixed wireline phones 09 1.3 Number of fixed wireless phones 10 1.4 Total fixed line subscribers per 100 inhabitants 11 1.5 Number of mobile SIM cards 12 1.6 Number of mobile SIM cards – prepaid 13 1.7 Number of mobile SIM cards – postpaid 14 1.8 Total mobile subscribers per 100 inhabitants 15 1.9 Number of telephone connections per 100 inhabitants 16 1.9.1 Number of urban telephone connections per 100 inhabitants 16 1.9.2 Number of rural telephone connections per 100 inhabitants 16 1.10 Total number of Internet connections 17 1.11 Number of broadband Internet connections 18 1.12 Broadband Internet connection charge 19 1.13 Backbone map for a country 20 1.14 Mobile coverage map per operator 21 1.15 Base station map per operator 22 2 Industry Structure and Industry Impact 23 2.1 Total annual investment in the telecom sector 23 2.2 Foreign Direct Investment into the sector 25 2.3 Total tax paid by the sector 26 2.4 Total employment in the telecom sector 27 2.5 Market share 28 2.6 Market concentration 29 3 Price and Affordability 30 3.1 Leased line and Broadband pricing 30 3.1.1 Domestic Private Leased Circuit 32
3.1.1.1 2km link 33 3.1.2.2 100km link 33
3.1.2 International Private Leased Circuit 34 3.1.3 Price of a business broadband connection of 2Mbps 35 3.1.4 Price of a business broadband connection of 256kbps 36 3.1.5 Price of a residential broadband offering of 256kbps 37 3.2 Fixed and Mobile pricing 38 3.2.1 Taxes for fixed line phone subscriptions 40 3.2.2 Taxes for mobile line subscriptions 41 3.2.3 Lowest price of a fixed phone handset 42 3.2.4 Lowest price of a mobile phone handset 43 3.2.5 Tax as a percentage of total mobile service cost (TMSC) 44 3.2.6 Monthly rental charges for a fixed phone line 45 3.2.7 Monthly rental charges for a mobile phone 46 3.2.8 Price of a mobile prepaid connection 47 3.2.9 Price of a mobile postpaid connection 48 3.2.10 Price of a 1-minute fixed phone local call 49 3.2.11 Price of a 1-minute fixed phone national call 50 3.2.12 Price of a 1-minute fixed phone international call 51 3.2.13 Price of a 1-minute on-net call (within subscriber network) 52 3.2.14 Price of a 1-minute off-net call (outside of subscriber network) 53
6
3.2.15 Price of a 1-minute peak time call 54 3.2.16 Price of a 1-minute off-peak time call 55 3.2 17 Number of voice minutes 56 3.2.18 Price of a SMS 57 3.3 Utilization 58 3.3.1 MOU made by one subscriber to local (fixed) numbers 58 3.3.2 MOU to national (fixed) numbers 59 3.3.3 MOU to on-net numbers (within the subscriber’s network) 60 3.3.4 MOU to off-net numbers (outside the subscriber’s network) 61 3.3.5 International MOU for fixed traffic – outgoing 62 3.3.6 International MOU for fixed traffic – incoming 63 3.3.7 International MOU for mobile traffic – outgoing 64 3.3.8 International MOU for mobile traffic – incoming 65 4 Revenue 66 4.1 Average Revenue per User (ARPU) 66 4.2 Fixed (wireline and wireless) ARPU per operator 67 4.3 Fixed (wireline and wireless) ARPU for industry 68 4.4 Mobile prepaid ARPU per operator 69 4.5 Mobile postpaid ARPU per operator 70 4.6 Mobile prepaid ARPU for industry (weighted by revenue) 71 4.7 Mobile postpaid ARPU for industry (weighted by revenue) 72 4.8 Mobile data revenue 73 4.9 Roaming revenue earned per SIM 74 4.10 Industry revenue 75 4.11 Industry revenue as a % of GDP 76 4.12 EBITDA margin per operator 77 5 Quality of Service Indicators 77
5.1 Telephony indicators 78 5.1.1 Waiting list for main fixed lines 78 5.1.2 Faults per 100 main (fixed lines) per year 79 5.1.3 Percentage of telephone faults cleared by the next working day 80 5.1.4 Call drop rates 81 5.1.5 Percentage of connections with good voice clarity 82 5.1.6 Call success rate 83 5.2 Broadband indicators 84 5.2.1 Broadband download speed (kbps/Mbps) 84 5.2.2 Broadband upload speed (kbps/Mbps) 85 5.2.3 RTT (milli-second)- Round Trip Delay 86 5.2.4 Jitter (milli-second) 87 5.2.5 Packet- Loss (as a percentage) 88 5.2.6 Broadband availability (as a percentage %) 89
6 General Definitions 6.1 Total Population of a country 90 6.2 Number of households in a country 90 6.3 GDP 91 6.4 Gross National Income 91 6.5 Total urban population as a % of urban population 92 6.6 Number of urban households as a percentage of rural households 92

7
6.7 Average number of people per household 92 6.8 EBITDA 93

8
1. CONNECTIVITY INDICATORS 1.1 Number of Fixed Lines Definition Number of fixed phone lines = Number of fixed wireline phone lines + Number of fixed wireless phone lines. UN Partnership Definition A fixed line is a telephone line connecting a customer’s terminal equipment (e.g. telephone set, facsimile machine) to the public switched telephone network (PSTN), and which has a dedicated port on a telephone exchange. ITU Definition A fixed line is a telephone line connecting the subscriber's terminal equipment to the public switched network and which has a dedicated port in the telephone exchange equipment. This term is synonymous with the term main station or Direct Exchange Line (DEL) that is commonly used in telecommunication documents. It may not be the same as an access line or a subscriber. The number of ISDN channels should be included. Fixed wireless subscribers should also be included. If fixed wireless subscribers are not included, specify so in a note. Comments Installed v Subscribed Lines Under normal circumstances subscribed lines (i.e. lines in use) should be reported. However, in some instances installed capacity differs from the number of lines in use. For example, the Philippines and Thailand have higher numbers of installed lines than the number of subscribed lines (due to unused installed lines lying under condominiums). In such situations countries could report both numbers. Lines or Subscribers Data on the number of fixed lines refers to the number of active lines, and not the number of subscribers. The distinction is important since one subscriber may have multiple lines and thereby skew figures for data on fixed lines per 100 people. However, in a regional context, it could be argued whether differentiation between subscribers and lines is at present necessary. Counting Fixed Wireless (Often CDMA) as a Fixed Phone Fixed wireless phones often offer limited mobility (e.g. within a particular region of a country) or even full mobility (works anywhere within the country). As such the argument can be made to count fixed wireless as part of total mobile. For example, the Telecom Regulatory Authority of India (TRAI) at one point used to count fixed wireless as part of the mobile phone segment. The ITU however counts the fixed wireless component as being part of the fixed phone segment. Due to the discrepancy in the indicator’s definition, the data reported by the two agencies will be significantly different. In any case, when reporting this indicator (Number of Fixed Lines) it is important to state (in a footnote at least) whether or not fixed wireless is included. This could prevent confusion and enable cross-country comparisons. Ideally, the number of fixed wireless phones should be specified in the footnote as well, for ease of calculation.
9
1.2 Number of Fixed Wireline Phones Definition The number of phones in use that are fixed to a specific location and can support fixed wireline services. These telecom services should be provided using either a line made of copper or fiber.1 Comments Phones and Subscribers Should Tally This does not prove to be very useful, as this indicator should match the one that counts the number of fixed line subscribers present in the market. More Phones than Subscriber Lines The data required for this indicator should be available with the fixed operators. Often the phones for fixed lines are provided by the operator of the fixed line service. However, in some cases offices and homes may have more than one phone supported by a single line. For accurate data a household survey maybe needed.

10
1.3 Number of Fixed Wireless Phones Definition The number of phones in use that are restricted to a particular area and can support point-to-point signal transmissions that occur through the air over a terrestrial microwave platform rather than through copper or fiber cables.2 Comments Categorizing Fixed Wireless (Often CDMA) Under Fixed v Mobile As CDMA technology is embraced across the region its classification becomes vital. At present there is no consensus on whether CDMA falls into the fixed or the mobile category. For example CDMA is considered a fixed line in Sri Lanka, while in India, as of March 2006, it is counted under mobile. To avoid any confusion it is best that data on the number of fixed lines includes a footnote indicating if fixed wireless is included or not. This indicator allows us to measure the growth in the number of phones, and thereby estimate the demand for fixed wireless technologies.
11
1.4 Total Fixed Lines per 100 Inhabitants Definition UN Partnership Definition This is calculated by dividing the number of fixed telephone lines by the population and multiplying by 100.
The Total Fixed Lines per 100 Inhabitants = No of fixed lines Population Comments “Active” Only Differentiating between all fixed line subscribers and active fixed line subscribers (those that have used the service at least once over a specified period) is necessary in order to avoid over or undercounting the subscriber base. Defining the term “active” first requires agreement on the time period during which a fixed line has been used. Initial inquiries from regional operators indicate that they have the capability to count lines that have been used within a given period of time. It is therefore suggested, that fixed lines that have been used in the past 3 months be considered when calculating this indicator. Further discussion is required to ensure that the collection of such detailed data does not pose undue costs on the operator, since the gathering of such comprehensive information could prove to be prohibitive in terms of cost. In the absence of an accepted time-limit or types of services that define the term “active”, it is suggested that the data be footnoted to provide as much clarity as possible (e.g. a footnote might state “all fixed lines that have been used in the past 12 months to make or receive a call are reported”).
X 100
12
1.5 Number of Mobile SIM Cards Definition Number of mobile SIMs = Number of mobile SIMs prepaid + Number of mobile SIMs postpaid UN Partnership Definition Users of portable telephones subscribing to an automatic public mobile telephone service using cellular technology, which provides access to the PSTN. Users of both postpaid subscriptions and prepaid accounts are included. ITU Definition Refers to the use of portable telephones subscribing to a public mobile telephone service and provides access to Public Switched Telephone Network (PSTN) using cellular technology. This can include analogue and digital cellular systems. This should also include subscribers to IMT-2000 (Third Generation, 3G). Subscribers to public mobile data services or radio paging services should not be included. If this service has a name, please indicate in a note, as well as the year the service commenced operation. Comments Subscribers (Users) v SIMs It is increasingly clear that data can be collected (at best) on the number of active SIM cards. Counting the number of mobile subscribers (users) is almost impossible as even users at the bottom of the pyramid own multiple SIM cards. “Active” Only Differentiating between all SIM card subscribers (i.e. counting all SIM cards ever issued by an operator) and active subscribers (those who have used a service at least once over a specified period) is necessary in order to avoid over or undercounting the subscriber base. Defining the term “active” first requires agreement on the time period during which a SIM card has been used. Initial inquiries from regional operators indicate that they have the capability to count SIMs that have been used within a given period of time. It is therefore suggested, that SIMs that have been used in the past 3 months be considered when computing this indicator. However, defining the term “active” also requires agreement on the type of services – are SIMs that use any service within the defined time period counted as active, or is it only SIMs that use a fee-paying service within the defined period that count as active. While this question may not have significance in CPP (Calling Party Pays) regimes, it may be important in RPP (Receiving Party Pays) countries or for certain types of plans (e.g. “life-time SIM” cards issued by certain operators). Clearly however, further discussion is required to ensure that the collection of such detailed data does not pose undue expenses on the operator since gathering such comprehensive information could prove to be prohibitive in terms of cost. In the absence of an accepted time-limit or types of services that define the term “active”, it is suggested that the data be footnoted to give as much clarity as possible (e.g. footnote might say “all SIMs that have been used in the past 12 months to make or receive a call or SMS are reported”),
13
1.6 Number of Mobile SIM Cards – Prepaid Definition ITU Definition The total number of mobile cellular subscribers using prepaid (also known as “pay as you go”) cards. These are subscribers that rather than paying a fixed monthly subscription fee, choose to purchase blocks of usage time. Only active prepaid subscribers that have used the system within a reasonable period of time should be included. This period (e.g., 3 months) should be indicated in a note. Comments Focus on Active This definition emphasizes the need to collect data only on active prepaid subscribers, and therefore circumvents the issue regarding inactive SIM card users. As already noted, problems arise when defining an “active” SIM card. Debates exist with regard to whether the definition should include any SIM that has been used within a defined period, or any SIM that has used a fee-paying service in the defined period.

14
1.7 Number of Mobile SIM Cards – Postpaid Definition The total number of mobile cellular subscribers who have entered a binding contract with an operator for the provision of a particular service based on a fixed monthly or annual subscription fee.

15
1.8 Total Mobile Subscribers per 100 Inhabitants Definitions UN Partnership Definition This is obtained by dividing the number of mobile cellular subscribers by the population and multiplying by 100. Mobile SIMs per 100 inhabitants = Total number of Mobile SIMs in use Total population Comments Variations in Mobile Density Values Multiple data sources in a single country tend to provide differing values on the number of mobiles per 100. This data discrepancy is often a result of the use of varying population figures. For example in Pakistan the population figure listed by the Pakistan Telecom Authority (PTA) in 2005 was 151.6 million, while the World Bank listed a higher figure of 155.8 million. Although this 2.7% difference may seem negligible, it can have a significant impact when calculating the number of phones per 100. NRA’s (or other parties reporting data on this indicator) should therefore state exact annual population figures (or at least include the source of the population data) in order to facilitate accurate reporting.
X 100

16
1.9 The Number of Telephone Connections per 100 Inhabitants 1.9.1 The Number of Urban Telephone Connections per 100 Inhabitants Definition The number of telephone connections available for every 100 inhabitants living within an urban area. The number of urban telephone connections per 100 inhabitants = Total number of connections (fixed and mobile) within the urban area Total number of inhabitants within the urban area 1.9.2 The Number of Rural Telephone Connections per 100 Inhabitants Definition The number of telephone connections available for every 100 inhabitants living within a rural area. The number of rural telephone connections per 100 inhabitants = Total number of connections (fixed and mobile) within the rural area Total number of inhabitants within the rural area Comments Importance of Indicator Data on the number of telephone connections per 100 people provides a very good representation of telephone penetration in a country, and is therefore a useful indicator for multi-country comparisons. Subscriber Focus This indicator places a higher emphasis on the number of subscribers in a country, rather than the number of actual users. Differentiating between active subscribers (those who have used a service at least once over a specified period) and idle ones is useful in order to avoid over or undercounting the subscriber base. Accuracy of the subscriber base is essential to obtaining realistic figures for this indicator. However, the definition of an active subscriber is unclear. Sections 1.1, 1.4 and 1.5 discuss active subscribers in greater detail.
X 100
X 100
17
1.10 Total Number of Internet Connections Definition This is the total number of Internet connections in use within the country and is the sum of all the Internet connections issued by each operator. This indicator is not technology specific and would include all Internet connections such as dial-up, ADSL and wireless. Comments Information Societies The concept of creating a global information society is now of paramount importance. As people are empowered with the necessary knowledge, they are able to engage better in debates pertaining to social, economic, political and academic issues amongst others. Better access to the Internet enables and facilitates this process.

18
1.11 Number of Broadband Internet Connections Definition This is the total number of broadband connections in operation within the entire country. This would be the sum of all broadband connections provided by all the operators. A broadband connection is a high-speed Internet connection using DSL, cable, wireless, fiber optic or satellite means of transmitting data with connection speeds in excess of 256 kilobits per second. Comments Not specific This data does not indicate the type of technology used to provide the broadband service. However, this indicator can be used to calculate the percentage of broadband connections within the total number of Internet connections.

19
1.12 Broadband Internet Connection Charge Definition ITU definition The initial, one- time charge for a new broadband internet connection. Refundable deposits should not be counted. A note should indicate whether taxes are included or not. Comments Definition Unclear The ITU definition proves to be inadequate as there are many crucial areas that are not addressed. The definition does not specify the speed of a broadband connection. ITU states that a broadband connection is an always-on facility that offers speeds over 256kbps. Also merely stating if taxes are included or not will not be useful. A footnote should indicate the additional cost due to tax. Bundled Offerings Some broadband offerings may not have a connection charge as the charge will be bundled into the monthly rental or the modem charges. This will make comparisons difficult.
20
1.13 Backbone Map for a Country Definition This is a visual representation of the backbone layout installed within a country at the present time. The map should indicate the percentage of towns (or villages) covered. = Number of towns/ villages covered Total number of towns/ villages Comments Usefulness of Map This map is useful when making comparisons over different time spans, as it details the progress with regard to backbone rollouts. This indicator is also pertinent in the determination of broadband penetration. The map provides a visual image of a country’s present ICT position and what needs to be accomplished in the future – thereby making target setting easier.
X 100

21
1.14 Mobile Coverage Map per Operator Definition This is a visual map of each operator’s network coverage, denoting the areas in which the operator is represented. The operator should also indicate the area covered as a percentage of total area. = Area covered per square meter Total geographical area of the country Comments Importance of Map The map provides a graphic representation of the extent to which operators are expanding their coverage. This is especially pertinent in solving the urban/rural divide. However, it is necessary to be mindful that while coverage extends to different areas, the signal present should also be strong enough for the proper execution of a voice call. The map makes the setting of targets easier for both government and for operators.
X 100
22
1.15 Base Station Map per Operator Definition This is a visual map of the base stations owned and/or used by each operator. Comments Importance of the Map The map may cause confusion in countries where operators choose to share base station facilities. However, the map is useful as it highlights the expansion of infrastructure over time.
23
2. INDUSTRY STRUCTURE AND INDUSTRY IMPACT
2.1 Total Annual Investment in the Telecom Sector Definition ITU Definition Total Sector Investment is also referred to as annual capital expenditure. This is the gross annual investment in telecom (including fixed, mobile and other services) for acquiring property and network. The term investment means the expenditure associated with acquiring the ownership of property (including intellectual and non-tangible property such as computer software) and plant. This includes expenditure on initial installations and on additions to existing installations where the usage is expected to be over an extended period of time. Note that this applies to telecom services that are available to the public, and excludes investment in telecom software or equipment for private use. Comments Actual Funds vs. Promised Funds Data on the total investment into the sector should comprise only of the actual investment received and not promised figures. Often the amount that is promised as investment maybe more or less than the actual amount that is received. Company and Industry Level Data This indicator is to be reported by each company providing telecom services in a country. The sum of investment figures from each firm are to be added up to obtain the industry investment number. Investments in Telecom Services Only Data should only consist of funds that go into increasing network quality or coverage. Other forms of investments should not be counted. Foreign and Local Investments Investment originating within the country and from outside of the country should be included. Total Investment = Foreign Direct Investment + local investment Reporting Incremental Investment (Not Cumulative) Investment into the telecom sector should be reported as an incremental investment for a particular year, and not as a cumulative investment over a period of years. Cumulative figures can be easily calculated by anyone, once they have the incremental investment data. Importance of Investment Information

24
The telecom sector’s long term growth is directly driven by investments in the sector. Therefore, investment information is a good indicator of the perception of financial attractiveness and the long term potential of a country’s telecom sector. Declining investment over time can indicate to the government/regulator if they need to intervene to improve investment prospects.

25
2.2 Foreign Direct Investment into the Telecom Sector Definition ITU Definition Annual investment in telecom coming from foreign sources also referred to as Foreign Direct Investment (FDI). Comments What to Include in FDI FDI that is counted as investment into the telecom sector should relate to investments in physical infrastructure, such as investments in property, equipment and networks. It does not refer to (and should not include) monies injected from a foreign firm that acquires a lasting management interest in a firm or enterprise (because such funds do not go toward improving network coverage or costs or telecommunication services through other means). Reporting Incremental Investment (Not Cumulative) FDI should be reported as incremental investment for the year in consideration, and not as a cumulative investment. Company and Industry Level Data The FDI received from each company providing telecom services should be obtained. The sum of FDI obtained by the companies should be reported as the total FDI to the sector. Importance of FDI to the telecom sector FDI plays a key role in improving the telecom services in a country. This makes it a crucial indicator in measuring the success of the telecom sector. FDI is now recognized as being vital for the development of the sector and the national economy as a whole.. Policy makers, regulators, investors and other interested parties will therefore need FDI figures to be disaggregated from total investment, to study the trends and patterns of investment into the sector.
26
2.3 Total Tax Paid by the Sector Definition This should entail all monies that have been paid by operators for taxes levied for the previous financial year. This can be calculated by obtaining the tax revenue remitted to the State by the telecom operators. This data should be available in Central Bank reports. Comments Tax Components The definition of tax includes corporate income tax, sales tax and levies such as service tax, license fees, and spectrum taxes. These components could also be reported separately by firms wherever possible. Many countries have very different tax regimes. Component-wise reporting enables more meaningful comparisons. Importance of Tax Information The total tax collected indicates the sector’s contribution towards government revenues, and therefore the importance of the sector vis-à-vis the total economy. Tax data also flags areas that are being excessively taxed. However, in order to do so the various tax components would have to be calculated separately. Company Level and Industry (Sector) Level Data The total tax paid by each company providing telecom services should be obtained. The sum of the total tax reported by each company would be the total tax paid by the telecom sector. Reporting in a Useful Format Tax data is most useful if it is stated as a percentage of total government revenue, or as a percentage of total industry revenue. Therefore, along with the absolute figure for tax paid for the year, it is almost always useful to report at least one of the above mentioned percentages. Problems Associated with Accounting Structures Cross-country comparisons are made difficult as various countries have different financial years, with some ending in December while others in May/June. Most countries have varying tax regimes making country comparisons difficult, unless a breakdown of the various tax components are given.

27
2.4 Total Employment in the Telecom Sector Definition The total number of people, both direct and indirect, who are employed in the telecom sector. UN Partnership Definition Total business workforce represents all persons engaged in domestic production in the business sector. In a national accounts framework, employment can be measured in terms of headcounts, jobs, full-time equivalents or hours worked. Currently, total headcounts or jobs are used for most countries. ITU Definition Total Full-Time Staff (Direct Employees) Total full-time staff employed by telecommunication network operators in the country for the provision of public telecommunication services, including mobile services. Part-time staff should be expressed in terms of the full-time staff equivalent. Comments Estimating Indirect Employees While data on direct employees is reasonably easy to collate, indirect employment is much more difficult to measure. Indirect employment includes (full-time equivalents) of employment created to provide telecommunication related services. This would consist of retailers selling prepaid mobile cards, companies involved in the installation of telecom towers and so on. Data on indirect employment could be estimated, but in such instances the assumptions on which the information is based should be specified. Some resellers of telecom services may not be registered as doing so, but will provide services from his/her residential line. Invariably this indicator will always be reported below the real level.
28
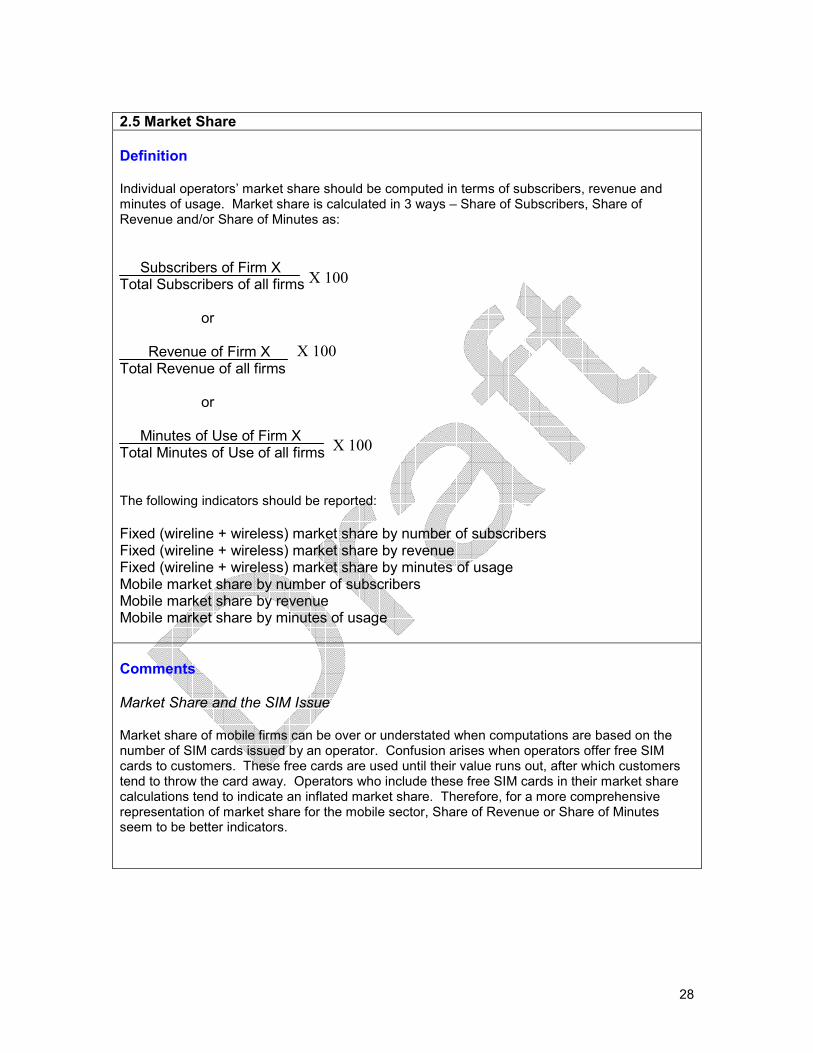
2.5 Market Share Definition Individual operators’ market share should be computed in terms of subscribers, revenue and minutes of usage. Market share is calculated in 3 ways – Share of Subscribers, Share of Revenue and/or Share of Minutes as: Subscribers of Firm X Total Subscribers of all firms or Revenue of Firm X Total Revenue of all firms or Minutes of Use of Firm X Total Minutes of Use of all firms The following indicators should be reported: Fixed (wireline + wireless) market share by number of subscribers Fixed (wireline + wireless) market share by revenue Fixed (wireline + wireless) market share by minutes of usage Mobile market share by number of subscribers Mobile market share by revenue Mobile market share by minutes of usage Comments Market Share and the SIM Issue Market share of mobile firms can be over or understated when computations are based on the number of SIM cards issued by an operator. Confusion arises when operators offer free SIM cards to customers. These free cards are used until their value runs out, after which customers tend to throw the card away. Operators who include these free SIM cards in their market share calculations tend to indicate an inflated market share. Therefore, for a more comprehensive representation of market share for the mobile sector, Share of Revenue or Share of Minutes seem to be better indicators.
X 100
X 100
X 100
29
2.6 Market Concentration Definition Market concentration for fixed and mobile markets is calculated using the Herfindahl Herschman Index (HHI). The HHI is calculated as follows: HHI = (M1)
2 + (M2)2 + (M3)
2 + …..+ (Mn)2 where Mn is the market share of a firm. As
noted earlier, Mn can be calculated for subscribers (or SIMs), minutes or revenue. The following indicators should be reported: HHI for fixed markets using market share by number of subscribers HHI for fixed markets using market share by revenue HHI for fixed markets using market share by minutes of use HHI for mobile markets using market share by number of subscribers HHI for mobile markets using market share by revenue HHI for mobile markets using market share by minutes of use Comments The HHI The HHI is a widely accepted tool for measuring market concentration. It takes into account the relative size and distribution of all firms instead of just the top four or five firms in a market. It approaches zero when a market consists of a large number of firms of relatively equal size. HHI Ranges A market in which the HHI is between 1000 and 1800 is considered to be moderately concentrated. If the HHI is in excess of 1800 points it is then considered to be concentrated. Flagging Anti-trust Concerns In the United States, transactions that increase the HHI by more than 100 points in concentrated markets raise anti-trust concerns, under the Horizontal Merger Guideline issued by the US Department of Justice and the Federal Trade Commission.

30
3. PRICE AND AFFORDABILITY INDICATORS 3.1 LEASED LINE and BROADBAND PRICING The increasing internationalization of business activity has led to rising demand for leased lines and reliable broadband services. Business Process Outsourcing (BPO), for example, has been a significant contributor to leased line subscriber growth. The global BPO industry as of 2006 is estimated at US$120–150 billion, of which offshore BPO constitutes approximately US$11.4 billion3. As the expansion of the BPO industry shows no signs of slowing, many countries are becoming motivated to provide competitive leased line charges in order to gain a slice of the “BPO pie”. However, this has proved to be easier in theory than in practice. Countries have tried unbundling their local loops and liberalizing their international gateways, with varying levels of success. Given the importance of reliable, fast and competitive broadband access, the indicators listed below are important, and should be made available in order to conduct cross-country comparisons, especially amongst pacificIRRC states. The indicators in this category should be collected from all operators in the sector. In the event that this is not possible (or competitive offerings are not available), leased line rates of the incumbent should be used. As for broadband charges, the cheapest package corresponding to the requirements should be selected and reported.
- The annual rental charged for a 2km leased line link at a speed of 2Mbps. - The annual rental charged for a 100km leased line link at a speed of 2Mbps. - The annual rental charged for a commercial broadband offering at a speed of 2Mbps - The annual rental charged for a commercial broadband offering at a speed of
256Kbps. - The annual rental charged for a residential broadband offering at a speed of
256Kbps. When reporting prices only the annual rental charged for provision of the service should be stated. The rates should not include any discounts, installation and modem charges. It should also be independent of any taxes. As the General Principles section in the Introduction to the Handbook indicates, all prices should be stated in terms of an international currency, such as US Dollars. When rates figures are converted from the local currency into an international currency, the exchange rate used and the date of the currency conversion should be specified. As also indicated in the “General Principles” section, prices should be reported in terms of the local currency as well. For ease of reporting the table format below can be used. Country 2mbps, 2km
DPLC 2mbps, 100 km, DPLC
2mbps broadband business connection
Minimum 256kbps broadband business connection *
Minimum 256kbps broadband residential connection
X Y

31
* Note: In the event a 256kbps offering is not available the package with the next lowest speed offering available should be used. However, it has to be lower than 2mbps. If the lowest offering is at 2mbps speed, the cell should read: N/O (No Offering). When using this table format, extensive footnotes will be required to explain pricing computations.
32
3.1.1 Domestic Private Leased Circuits (DPLC) Definition A leased line connects two locations for private voice and/or data telecommunication services. A leased line is a reserved circuit between two points, and can span short or long distances. Leased lines maintain a single open circuit at all times, as opposed to traditional telephone services that reuse the same lines for many different conversations, through a process known as “switching”. Comments Availability The availability of data on domestic leased line prices does not necessarily imply that the service exists across a country. For example, in Sri Lanka prices are quoted by the operator, but leased lines are not accessible in most parts of the country. No Extras The definition for DPLC should clearly indicate that discounts, taxes and installation charges have not been taken into account, as these extra costs will change the price of the link. Selecting a National Tariff Within a country, prices from various operators can be compared. However, when comparing DPLC prices across several countries, it is important to select one price as a representative price for the whole country (at least in countries where more than one provider offers DPLCs). In such instances the following methodology should be adopted4.
Number of Countries
Benchmark
1-5
The lowest tariff is chosen as the benchmark
6-20
The 2nd lowest tariff is chosen as the benchmark
21-40
The 3rd lowest tariff is chosen as the benchmark
33
3.1.1.1 Price of a DPLC: 2km Definition OECD Definition The price per month of a 2Mbps line (minimum) for a 2 km link is the international indicator used for comparing leased line prices. This is also known as a ‘tail link’ charge. Comments Rates for 2km Not Provided All operators may not provide a standard rate for a 2km link. Often, the distance of a tail link changes from country to country. This makes comparative studies difficult. However, in the event that the rate for a 2km tail charge is not available, the rate listed as a tail charge should be used with all details specified in a footnote. 3.1.1.2 Price of a DPLC: 100km Definition OECD Definition The price per month for a 2 Mbps (minimum) line for a 100 km link is calculated by adding the cost of two tail charges (i.e. 2 x - the 2 km link charge) to a 96 km link charge. 5 Comments Long Distance Links A 100 km link charge is generally used to calculate the price of a long distance link. However, there is some contention on the exact distance to be considered for computations. The EU uses a 200km link charge. However, for the pacificIRRC countries a 100km comparison is more appropriate as the geographical proximity within cities is less than those of the EU. Therefore, an indicator measuring a 200km link charge will be irrelevant in this region.
34
3.1.2 Price of International Private Leased Circuits (IPLC) Definition An IPLC (International Private Leased Circuit) is a point-to-point private line used by an organization to communicate across a global office network. An IPLC can be used for Internet access, business data exchange, video conferencing and any other form of telecommunication6. IPLC are reported in the three capacities under which they are available. That is E1 (2Mbps), DS-3 (45Mbps) and STM-1 (155Mbps) and should be reported under these categories. Comments Half Circuits International leased line prices are often quoted as half circuit prices. However, a full circuit price cannot be computed simply by adding two half circuit prices. Therefore, the total cost of an international leased line from destination X to Y cannot be accurately ascertained. Price Variations International leased line prices are difficult to obtain. When available, these prices vary on a case-by-case basis, making comparability across different countries in a region difficult. Since the charges are distance specific, the data should focus on the benchmark destinations. No international consensus exists with regard to destinations. However, for the purpose of collecting comparable indicators the following destinations are recommended. Country*- US (West Coast), Country – Singapore Country – India Country – UAE Country - Germany *- Should be the national country from which the IPLC originates.
35
3.1.3 Price of a Broadband Business Connection of 2Mbps Definition This should be the annual rental charged for a commercial broadband offering with an average upload/ download speed of 2Mbps. The cheapest unlimited download capacity package rate should be used. The price should not take into account any taxes, discounts, or modem and installation charges. The price is not technology specific.7
Comments Bundled Offerings Package rentals may sometimes contain bundled offerings with other products. Packages can also entail a contract for a minimum period of time. Selecting a regional Tariff When regional comparisons are done, it becomes problematic as to which country or rate should be used to represent the region. However, when comparing broadband prices across regions, it is important to select one price as a representative price for the region (as the rate offered in countries within a region will differ). In such cases the following methodology should be adopted8. Number of countries Benchmark
1-5
The lowest tariff is chosen as the benchmark
6-20
The 2nd lowest tariff is chosen as the benchmark
21-40
The 3rd lowest tariff is chosen as the benchmark
36
3.1.4 Price of a Broadband Business Connection of 256kbps Definition This should be the annual rental charged for a commercial broadband offering with an average upload/ download speed of 256kbps. The cheapest unlimited download capacity package rate should be used. The price should not include any taxes, discounts, or modem and installation charges. The price is not technology specific.4 Comments No Offerings of 256kbps Some countries do not offer speeds of 256kbps, and therefore this indicator becomes irrelevant for those countries. Bundled Offerings Package rentals may sometimes contain bundled offerings with other products. Packages can also entail a contract for a minimum period of time.

37
3.1.5 Price of a Broadband Residential Connection of 256kbps Definition This should be the annual rental charged for a residential broadband offering with an average upload/ download speed of 256kbps. The cheapest unlimited download capacity package rate should be used. The price should not include any taxes, discounts, or modem and installation charges. The indicator is not technologically specific.4
Comments Bundled Offerings Package rentals may sometimes contain bundled offerings with other products. Packages can also entail a contract for a minimum period of time.
38
3.2 FIXED and MOBILE PRICING The International Telecommunications Union (ITU) collects a series of price related indicators for mobile and fixed phones. Indicators measured include phone installation prices, monthly subscription rates, and the price of a 3-minute local call at peak and off-peak times. However, the OECD uses a price basket comprising a different set of indicators. The OECD method is recommended for several reasons. The OECD price basket: • Offers a better gauge of consumer realities by reflecting the customer tendency to bundle
voice and SMS features together. • Provides a more meaningful picture of affordability by considering for example the total cost
of phone calls per month as opposed to simply comparing the cost of a 3-minute call. • Reflects prices based on consumer utilization patterns, such as the number of voice minutes
or the number of SMS’s sent. • Enables comparisons of consumption within a country by collecting data on low, medium and
high end users. Figures should be presented in US dollars and Purchasing Power Parity (PPP). The data should be collected for at least the largest operator in a country (i.e. the operator with the largest subscriber base for a product). Operators maybe apprehensive regarding the provision of specific types of data based on concerns of information leakage to competitors. Therefore, a degree of confidentiality and discretion should be applied. In some instances, confidentiality agreements may need to be signed. Further information on collecting data and calculating baskets using the OECD methodology can be obtained at, http://www.oecd.org/dataoecd/52/33/1914445.pdf, http://www.teligen.com/t_basket.asp The definitions used for the indicators below were extracted from http://www.oecd.org/document/23/0,3343,en_2649_34225_33987543_1_1_1_1,00.html. Given below are the different categories of baskets that can be compiled using the basket methodology. The baskets listed below indicate the behavior of a high-end user. However, for data collection and analysis purposes medium and low-end user baskets need to be calculated as well.
- OECD High Fixed Basket Price ($)/OECD High Fixed Basket Price (PPP)- This is the OECD price basket for high-end users of fixed phones. The price is reported in Purchasing Power Parity (PPP) and in US Dollar terms.
- OECD High Mobile Prepaid Basket (PPP)/ OECD High Mobile Prepaid Basket ($)-This is the OECD price basket for high-end users of mobile prepaid phones. The price is reported in Purchasing Power Parity (PPP) and in US Dollar terms.
- OECD High Mobile Postpaid Basket (PPP)/ OECD High Mobile Postpaid Basket ($)-This is the OECD price basket for high-end users of mobile postpaid lines. The price is reported in Purchasing Power Parity (PPP) and in US Dollar terms.

39
- OECD High Mobile (Prepaid, Postpaid) Basket as % of GNI- This is the OECD price basket for high-end users of mobile (prepaid and postpaid) lines as a percentage of Gross National Income (GNI). A definition of GNI is provided under General Definitions
40
3.2.1 Taxes for Fixed Line Phone Subscriptions Definition This consists of all local taxes related to obtaining and maintaining a fixed line connection. For example taxes such as VAT and GST would have to be included. It is necessary to be aware of any changes/additions to tax legislation, as this may have a significant bearing on the outcome of the calculations. Comments Essential Data Data on this indicator is required to calculate the OECD price baskets. It is very important that this data is accurate, as it can have an impact on the outcome of the basket calculations.

41
3.2.2 Taxes for Mobile Line Subscriptions Definition This consists of all local taxes related to obtaining and maintaining a mobile connection. For example taxes such as VAT and GST would have to be included. It is necessary to be aware of any changes/additions to tax legislation, as this may have a significant bearing on the outcome of the calculations. Comments Essential Data Data on this indicator is required to calculate the OECD price baskets. It is very important that this data is accurate, as it can have an impact on the outcome of the basket calculations.
42
3.2.3 Lowest Price of a Fixed Phone Handset Definition This is the price charged by the incumbent or largest operator to provide a fixed phone handset. This price should not take into account taxes on the handset, or discounts provided for preferential agreements. Comments Varying Prices Calculating the price of a fixed phone handset is difficult, as competing operators may offer handsets at a cheaper price. However, as the incumbent has the largest market share it can be assumed that this would be the average price. Absence of an Incumbent Obtaining a price will be difficult in the absence of an incumbent within the market. However, for the fixed line sector this would prove to be the exception rather than the rule.
43
3.2.4 Lowest Price of a Mobile Phone Handset Definition This is the price of the cheapest mobile phone handset that can be purchased within the country. This price should exclude VAT and GST levies and discounts provided for exclusive agreements. Comments Affordability This is a good indicator of the level of affordability that exists within the country in regard to mobile phone handsets. The indicator will be useful to operators when making decisions on expanding the subscriber network. Often the high cost of handsets will hamper the pace at which people will subscribe to the service. Features of the handset Often the price of the handset depends on the features available. Phones that offer advance features such as a high memory capacity, video conferencing, GPRS will have a premium price. However, this indicator calculates a phone that has minimum voice and data capabilities.
44
3.2.5 Tax as a Percentage of Total Mobile Service Cost (TMSC) Definition Taxes on mobile services account for a substantial proportion of the overall tax burden on mobile phone ownership. These taxes include consumption taxes and any tax charges on mobile rental charges and usage, including VAT and GST. = (TMSC with tax/ TMSC without tax) – 1 Comments Greater Relevance Consumers are more affected by the cost of mobile services, as the cost of handsets and the connection fee are often discounted when they receive the service. Alternatively it can be argued that it is believed to be a sunk cost on the part of the consumer.

45
3.2.6 Monthly Rental Charges for a Fixed Phone Line Definition This is the price charged for a monthly rental of a fixed line. The price charged by the incumbent can be considered for this purpose. Calculations should constitute the rental only. Taxes, discounts and installation rates should be excluded. Comments Bundled offerings Often the monthly rental will be bundled with the unit charge for the service. This will make calculating and comparison of rental prices difficult. However, for the purpose of calculating the OECD baskets, it is necessary to determine the real rental. Given below is the proposed methodology for calculating the rental charge: If the offering is for 100 free minutes with a monthly rental charge, the following adjustment needs to be made. The cost of the 101th minute should be used to determine the cost of a call per minute. This cost can be used to calculate and subtract the cost of the 100 free minutes from the bundled offering, in order to obtain the real cost of the monthly rental. Charge for the 101th minute = Y Rental – (Y x 100) = Real Rental

46
3.2.7 Monthly Rental Charges for a Mobile Phone Definition ITU Definition This is the monthly subscription charge for a mobile cellular service. Due to the variety of plans available in many countries, the basket methodology adopts the data pertaining to the most popular package of the largest provider. If prepaid services are used (for those countries that have more prepaid than postpaid subscribers), the monthly subscription charge would be zero. If the plan includes free minutes, this should be put in a note. A note should indicate whether taxes are included (preferred) or not and what the rate is. Comments Bundled offerings Often the monthly rental will be bundled with the unit charge for the service. This will make calculating and comparison of rental prices difficult. However, in order to calculate the OECD baskets, it is necessary to determine the real rental. Given below is the proposed methodology for calculating the rental charge: If the offering is for 200 free SMS with a monthly charge the following adjustment needs to be made. The cost of the 201th SMS should be used. This is the charge for an SMS over and above the bundled offering. Charge for the 201th SMS = Y Rental – (Y x 200) = Real Rental

47
3.2.8 Price of a Mobile Prepaid Connection Definition This is the price of the most popular prepaid package offered by the largest mobile service provider.

48
3.2.9 Price of a Mobile Postpaid Connection Definition This is the price of the most popular postpaid package offered by the largest mobile service provider.
49
3.2.10 Price of a 1-Minute Fixed Phone Local Call Definition The price charged by the operator for a fixed local call made to a fixed line for the duration of 1-minute. If the rate charged for a 1-minute fixed local call differs during peak time and off- peak time then both rates need to be recorded separately. Comments Smaller Charge Parcels The operator may not have a fixed charge for 1-minute – and may instead calculate charges based on the number of seconds, e.g. 10 seconds.
50
3.2.11 Price of a 1-Minute Fixed Phone National Call Definition The price charged by an operator for a fixed national call made to a fixed line for the duration of 1-minute. Comments Smaller Charge Parcels The operator may not have a fixed charge for 1-minute – and may instead calculate charges based on the number of seconds, e.g. 10 seconds.

51
3.2.12 Price of a 1-Minute Fixed Phone International Call Definition The price charged by an operator for a fixed line international call made to a fixed line for the duration of 1-minute. If the price of the off- peak and peak time charge for a fixed international call of I-minute differs, both rates have to be recorded separately. Comments Smaller Charge Parcels The operator may not have a fixed charge for 1-minute – and may instead calculate charges based on the number of seconds, e.g. - 10 seconds.
52
3.2.13 Price of a 1-Minute On-Net Call Definition The price of a 1-minute call made by a user from his/her network to another user on the same network. Comments Smaller Charge Parcels The operator may not have a fixed charge for 1-minute – and may instead calculate charges based on the number of seconds, e.g. 10 seconds.
53
3.2.14 Price of a 1-Minute Off-Net Call Definition The price of a 1-minute call made by a user from his/her network to another user on a competing network. Comments Smaller Charge Parcels The operator may not have a fixed charge for 1-minute – and may instead calculate charges based on the number of seconds, e.g. 10 seconds.

54
3.2.15 Price of a 1-Minute Peak Time Call Definition The price of a 1-minute call made during peak time. Comments Fixed and Mobile If available, price data on peak time calls should be reported for both fixed and mobile.
55
3.2.16 Price of a 1-Minute Off-Peak Time Call Definition The price of a 1-minute call made during off-peak time. Comments Fixed and Mobile If available, price data on off-peak time calls should be reported for both fixed and mobile.
56
3.2.17 Number of Voice Minutes Definition The total number of voice minutes provided by the operator for the duration of one month. Comments Concerns with the Indicator This does not give specific data as to the amount of voice MOU that are made to local, national, international, on-net and off-net services.
57
3.2.18 Price of a SMS Definition ITU Definition The price of sending a national Short Message Service (SMS) message from a mobile handset. This indicator needs to be reported for the following categories,
- Price of a local SMS - Price of a national SMS - Price of an international SMS
Comments Concerns with the Definition The definition does not specify if this is the charge for a SMS sent to a number within the sender’s network or a competitor’s network. Often these charges prove to be quite different.
58
3.3 UTILIZATION Data on traffic utilization indicators are also required for price basket calculations. This data should be collected separately for incoming and outgoing calls, and for each operator. Data for the indicators listed below should be collected for a one month period. 3.3.1 MOU (Minutes of Use) Made by A Subscriber to Local (Fixed) Numbers Definition This is the total Minutes of Use made by a fixed line or mobile customer to local fixed numbers (fixed wireline and wireless) within a period of one month. This should be calculated as follows, Total MOU made by one subscriber to local fixed numbers = Total MOU made to local fixed numbers Number of subscribers Comments Data Not Specific This indicator does not discriminate on the source of origin of the call – whether mobile or fixed. Therefore, it is not possible to determine as to which, of the two technologies has higher usage.

59
3.3.2 MOU to National (Fixed) Numbers Definition The total number of minutes of use (MOU) made by fixed line subscribers (fixed wireline and wireless) or mobile subscribers to national fixed lines within a period of one month. Comments Data Not Specific This indicator does not discriminate between mobile and fixed. Therefore, it is not possible to determine as to which, of the two technologies has higher usage.

60
3.3.3 MOU to On-Net Numbers (Within Subscriber’s Network) Definition ITU Definition (for outgoing/originating mobile minutes to same mobile network) The number of minutes made by mobile subscribers to the same mobile network (within a country). Comments Concerns with the Definition The ITU definition does not specify a time period over which this data should be collected. Special Rates This figure often tends to be high, as a result of special packages and rates that are offered by the operator to subscribers within its network.
61
3.3.4 MOU to Off-Net Numbers (Outside of Subscriber’s Network) Definition ITU Definition (for outgoing/originating mobile minutes to other mobile networks) The number of minutes made by mobile subscribers to other mobile networks (within a country). Comments Concerns with the Definition The ITU definition does not specify a time period over which this data should be collected. Data Not Specific Data on total MOU do not offer an accurate insight into market conditions. For research and policy requirements more detailed data may have to be obtained from the operators.

62
3.3.5 International MOU for Fixed Traffic - Outgoing Definition ITU Definition This covers the effective (completed) fixed traffic originating in a given country to destinations outside that country. The indicator should be reported in number of minutes of traffic. Comment Concerns with the Definition The ITU definition does not specify a time limit, and hence proves to be inadequate. Data Not Specific This indicator does not offer information on which countries are receiving the largest quantity of traffic. It also does not discriminate on the basis of whether the receiver of the call is a fixed or mobile line.
63
3.3.6 International MOU for Fixed Traffic - Incoming Definition ITU Definition Effective (completed) fixed traffic originating outside the country with a destination inside the country. The indicator should be reported in number of minutes of traffic. Comments Concerns with the Definition The definition provided by the ITU proves to be insufficient as it does not specify a time period for which this data should be collected. Data Not Specific As the indicator provides data only on the total international Minutes of Use, it does not offer any information on the countries from which the highest volume of calls originate.
64
3.3.7 International MOU for Mobile Traffic – Outgoing Definition ITU Definition The number of mobile minutes originating in a country to destinations outside that country. Comments Concerns with the Definition The definition does not specify a time period in which the data should be collected. This indicator will also not provide information on which countries receive the highest volume of traffic.
65
3.3.8 International MOU for Mobile Traffic – Incoming Definition ITU Definition Number of incoming minutes (fixed and mobile) received by mobile networks from another country. Comments Concerns with the Definition The definition does not specify a time period in which the data should be collected, and also does not provide any information on which countries generate the highest volume of traffic.
66
4. REVENUE 4.1 Average Revenue Per User (ARPU) Definition ARPU is calculated by dividing total revenue by the number of subscribers of a fixed or mobile service. ARPU data should be stated in US dollars. Comments ARPU or ARPS The distinction between the number of users per subscription and the number of subscribers becomes important when operators compute their average revenues, as the average revenue per user (ARPU) could differ significantly from the average revenue per subscriber (ARPS). Voice v Data At present most operators only report total ARPUs, and do not distinguish between revenues from voice and those from data/other value added services (though these calculation are done internally by the operators). However, separate figures on these revenue components can be useful in order to accurately analyze the mobile telecommunications market. Therefore, NRAs might consider requesting operators to provide ARPUs for voice and for data (or other value added services) in the future. AMPU vs. ARPU It is argued that the Average Margin Per User (AMPU) is a better measure than the ARPU as it takes into account the cost of providing one unit of the service. Often it is the profit that is made that indicates the stability of the operator, thereby taking the focus away from revenue and on to the margin or profit. Eg: - If the revenue earned from a SMS is 10 cents the ARPU would be a satisfactory rate. However, if the cost of providing the SMS is 13 cents there clearly seems to be a problem that the ARPU is not showing, The AMPU calculation will take this into account, and indicate a more realistic picture of the operator’s situation. The downside of AMPU is that it takes into account all the various tax deductions that need to be made as well. This maybe undesirable for comparisons, especially when a country has unrealistic tax structures. AMPU has been noted to be more useful for wireless operators, as they may have smaller margins per user. AMPU also demonstrates that a low-end user may not be an unprofitable one, as an ARPU indicator may suggest.9
67
4.2 Fixed (Wireline + Wireless) ARPU per Operator Definition An operator’s total revenue from fixed wireline and fixed wireless services divided by the number of subscribers for fixed services. Comments Concerns with Fixed Wireless Comparing data for this indicator can get complicated as some countries consider fixed wireless services such as CDMA as a mobile connection. This argument has been discussed in length in 1.1
68
4.3 Fixed (Wireline + Wireless) ARPU for Industry Definition
The typical methodology for calculating ARPU for the industry is by dividing the total sum of revenues from access fees, incoming and outbound traffic, visitor roaming and value added services over a twelve-month period, by the weighted average number of subscribers during that same twelve-month period10.
Comments Providing a Larger Picture Industry ARPU gives an overall picture as to the revenue earning capability of the industry as a whole. Often it proves to be a strong driving force for new investments.11

69
4.4 Mobile Prepaid ARPU per Operator Definition An operator’s total revenue from mobile prepaid services divided by the number of subscribers for mobile prepaid services. Comments Problems with the Number of SIM Cards Issued When measuring this indicator it is necessary to determine if there are any inactive SIM cards, and eliminate them from the total number of subscribers. The operator will have to be given a cut-off period for the calculation of active SIM cards – eg: the number of SIM cards that have been active in the last three months.

70
4.5 Mobile Postpaid ARPU per Operator Definition This is an operator’s total revenue from mobile postpaid services divided by the number of subscribers for mobile postpaid services.
71
4.6 Mobile Prepaid ARPU for Industry (Weighted by Revenue) Definition The total industry revenue for mobile prepaid services divided by the total number of subscribers for mobile prepaid services. Comments Number of Active SIMs Once again the problem of active SIM cards comes into play when calculating the total number of subscribers. Often due to various marketing promotions SIM cards maybe given free of charge. This would inflate the number of subscribers quite significantly. A cut-off period needs to be provided to operators, stating for example that only SIM cards active within the last three months should be counted.

72
4.7 Mobile Postpaid ARPU for Industry (Weighted by Revenue) Definition The total industry revenue for mobile postpaid services divided by the total number of subscribers for mobile postpaid services.
73
4.8 Roaming Revenue Earned per SIM Definition ITU Definition Total number of roaming minutes made by own mobile subscribers to make and receive calls when outside the country (outside home network), e.g., when travelling abroad. The revenue earned by each SIM needs to be calculated in the following manner. This indicator needs to be computed by each operator on a monthly basis. = Total revenue earned by the operator Number of SIMs with roaming facilities Comments Roaming Revenues Rising Revenue earned from roaming continues to rise, and so it is important that a quantitative analysis be undertaken. Operators are therefore required to calculate and publish the necessary data.

74
4.9 Industry Revenue Definition ITU Definition This is the total (gross) telecommunication revenue earned from all (fixed, mobile and data) services within the country. This should exclude revenues from non-telecommunications services. Revenue (turnover) consists of telecommunication service earnings during the financial year under review. Revenue should not include monies received in respect of revenue earned during previous financial years; neither does it include monies received by way of loans from governments, or external investors, nor monies received from repayable subscribers' contributions or deposits. Revenues should be net of royalties. Comments Benefits of the Indicator Total Industry Revenue and Total Revenue as a % of GDP provide a snapshot of the sector’s performance and its economic contribution to the nation’s growth. These two indicators offer a basis on which to formulate industry related policies on aspects such as taxes and incentives. It also provides a benchmark for more realistic comparisons between countries.

75
4.10 Industry Revenues as a % of GDP Definition The total industry revenue divided by GDP (Gross Domestic Product), multiplied by 100. Industry revenue as a % of GDP = Total Industry Revenue Gross Domestic Product Comments Economic Contribution This indicator highlights the contribution that the industry is making towards national GDP. This data helps during policy formulation and FDI promotion.
X 100

76
4.11 EBITDA Margin per Operator Definition An operator’s EBITDA divided by annual revenue. Comments Benefits of the Indicator Measuring the EBITDA margin is important to ascertain a telecom operator’s profitability. It is necessary that EBITDA is considered and not net earnings. This is because EBITDA eliminates discrepancies that arise due to countries having different tax rates, and operators using varying depreciation and amortization rates. Also the EBITDA margin provides a sound benchmark for the purposes of comparison.
77
5. Quality of Service Indicators An understanding of the basic concepts in the Quality of Service (QoS) in telecommunications is essential for both operators and regulators. As people increasingly rely on the new services for their lifestyle and work, their expectations for high reliability and quality are bound to rise. Operators need to be aware that QoS is therefore likely to become a major differentiator in a highly competitive telecommunications market. Also the regulator have to be aware of this phenomenon and monitor the quality of the service provided by the operator. Due to the increased importance attributed to the monitoring of quality operators are encouraged to invest in software that enables monitoring these indicators in a systamatic manner. The indicators listed in this manual are general in nature. However, more specific and detailed indicators can be adopted. For ease of collecting and disseminating data the quality of service indicators are divided into two categories.
- Telephony indicators
- Broadband indicators

78
5.1 TELEPHONY INDICATORS 5.1.1 Waiting list for main fixed lines Definition ITU Definition Un-met applications for connection to the Public Switched Telephone Network (PSTN) due to a lack of technical facilities (equipment, lines, etc.). The waitlist should reflect the total number reported by all PSTN service providers in the country. Comments Potential for new entrants Shows the potential consumer bank that a new entrant can serve. The number of applications waiting to be connected would indicate those that are over and above the capacity that is already in place. New capacity needed This indicator also points out the level of infrastructure that needs to be provided to serve current demand. The investment needed for this expansion can be calculated using this indicator.
79
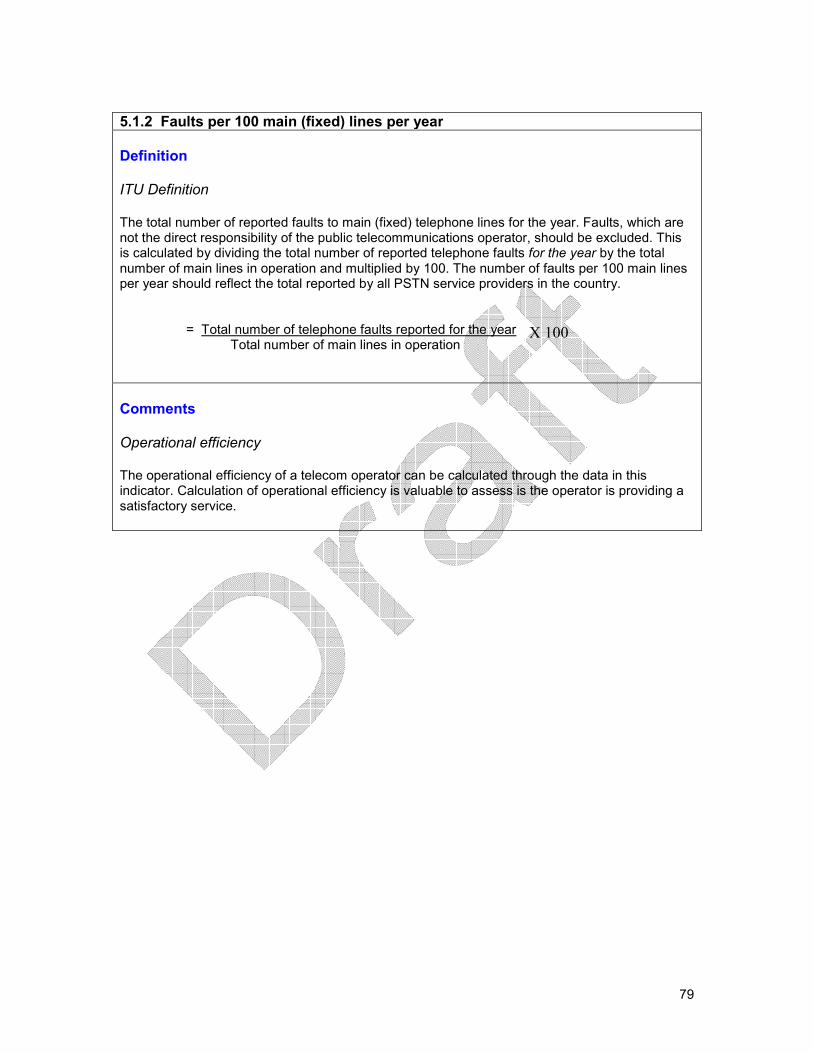
5.1.2 Faults per 100 main (fixed) lines per year Definition ITU Definition The total number of reported faults to main (fixed) telephone lines for the year. Faults, which are not the direct responsibility of the public telecommunications operator, should be excluded. This is calculated by dividing the total number of reported telephone faults for the year by the total number of main lines in operation and multiplied by 100. The number of faults per 100 main lines per year should reflect the total reported by all PSTN service providers in the country. = Total number of telephone faults reported for the year Total number of main lines in operation Comments Operational efficiency The operational efficiency of a telecom operator can be calculated through the data in this indicator. Calculation of operational efficiency is valuable to assess is the operator is providing a satisfactory service.
X 100
80
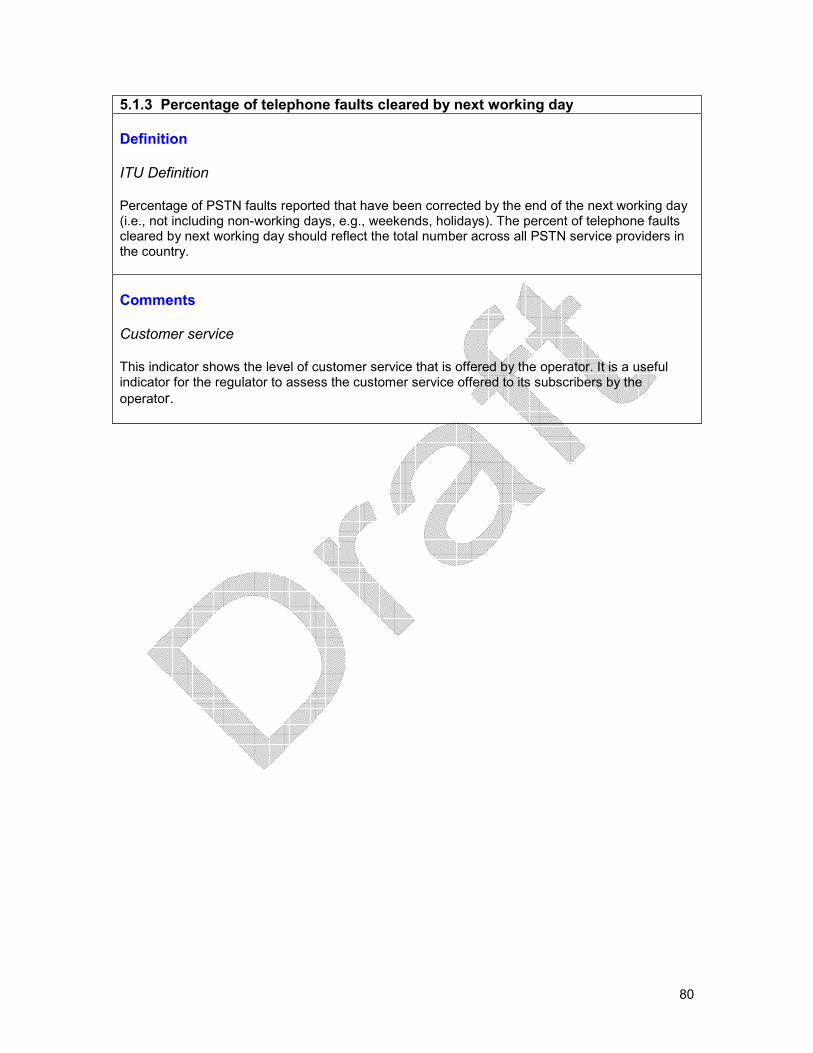
5.1.3 Percentage of telephone faults cleared by next working day Definition ITU Definition Percentage of PSTN faults reported that have been corrected by the end of the next working day (i.e., not including non-working days, e.g., weekends, holidays). The percent of telephone faults cleared by next working day should reflect the total number across all PSTN service providers in the country. Comments Customer service This indicator shows the level of customer service that is offered by the operator. It is a useful indicator for the regulator to assess the customer service offered to its subscribers by the operator.

81
5.1.4 Call drop rates Definition A dropped call rate out of completed sending calls or out of completed receiving calls. It calculates the churn rate. 12 The Telecom Regulatory Authority of India notes that this figure should be not higher than 3%. (http://www.trai.gov.in/trai/upload/Reports/17/qos%20report%2020%20dec%2020031.pdf)

82
5.1.5 Percentage of connections with good voice clarity Definition This is the number of calls that did not provide a good connection due to a dropped call, disturbance, lack of signal etc. The Telecom Regulatory Authority of India notes that this figure should be not higher than not less than 95% (http://www.trai.gov.in/trai/upload/Reports/17/qos%20report%2020%20dec%2020031.pdf).

83
5.1.6 Call success rate Definition
This refers to the ability to set up and hold a call for two minutes. This measure does not give a figure for the audio quality of the call. TRAI sets the benchmark for this indicator at 99% (http://www.trai.gov.in/trai/upload/Reports/17/qos%20report%2020%20dec%2020031.pdf).

84
5.2 BROADBAND INDICATORS The broadband indicators listed below are measured using commonly available tools such as Ping, Web- browsers and Network monitoring tools. These software applications track traffic of all network connections, and display real- time download and upload speeds in graphical and numerical form. The program logs all network traffic and gives daily, weekly and monthly traffic reports. For simple calculations the free download version of the Broadband Monitor is available at -http://www.bwmonitor.com/index.htm. Ping is a general tool available in Windows to check destination availability. The following destinations should be calculated,
- ISP site - the website of the service provider - National site - well-known sites within the country - preferably hosted by some other
ISP - Global site - well-known global sites such as Google and Yahoo which are hosted
outside the country.
The indicators should be calculated at different times. The time periods are selected in a manner that enables the analysis of quality from a low usage period to a heavily used period. 5.2.1 Broadband Download Speed (Kbps/Mbps) Definition One of the key advertised metrics in broadband services is the download speed, which defines the maximum traffic a subscriber can receive. The performance of many residential applications such as Web-browsing and downloading content also depends on this metric. Attempts should be made to measure the actual download speed available to the subscriber. Comments Proposed Methodology Prerequisites: The respective E-Mail accounts in the ISP, National and Global sites are stored with a 10 MB attachment file.
Test Procedure:
The download speed is measured by downloading a 10MB file from the mail attachment using a standard Web browser, and by calculating the average download bandwidth using network measuring tools like Bandwidth Monitor.
Normally the downloading software will indicate the download speed, but this does not include TCP/IP header and other overheads. Therefore, tools such as Bandwidth Monitor are used, as they measure the bandwidth by snooping the raw packets that are getting transferred. (Note: The download speed advertised by the operator is a raw bandwidth).

85
5.2.2 Broadband Upload Speed (Kbps/Mbps) Definition This is the upstream speed for a broadband Internet connection. This metrics defines the speed at which the subscriber can send traffic to the Internet. Upload speeds plays a significant role in responsiveness and real-time applications such as VoIP. Comments Proposed Methodology Prerequisites: The respective E-Mail accounts on the ISP, National and Global sites are expected to have free space to upload a 5 MB attachment file.
Test Procedure:
With a stand-alone application, the upload speed can be measured by uploading a 5-MB file to a YAHOO Mail application, and by calculating the average upload bandwidth using standard measuring tools such as Bandwidth Monitor.
Standard tools such as Bandwidth Monitor are used, as they measure the bandwidth by snooping packets. The reasons for doing this are explained in 5.1 on Download Speed.
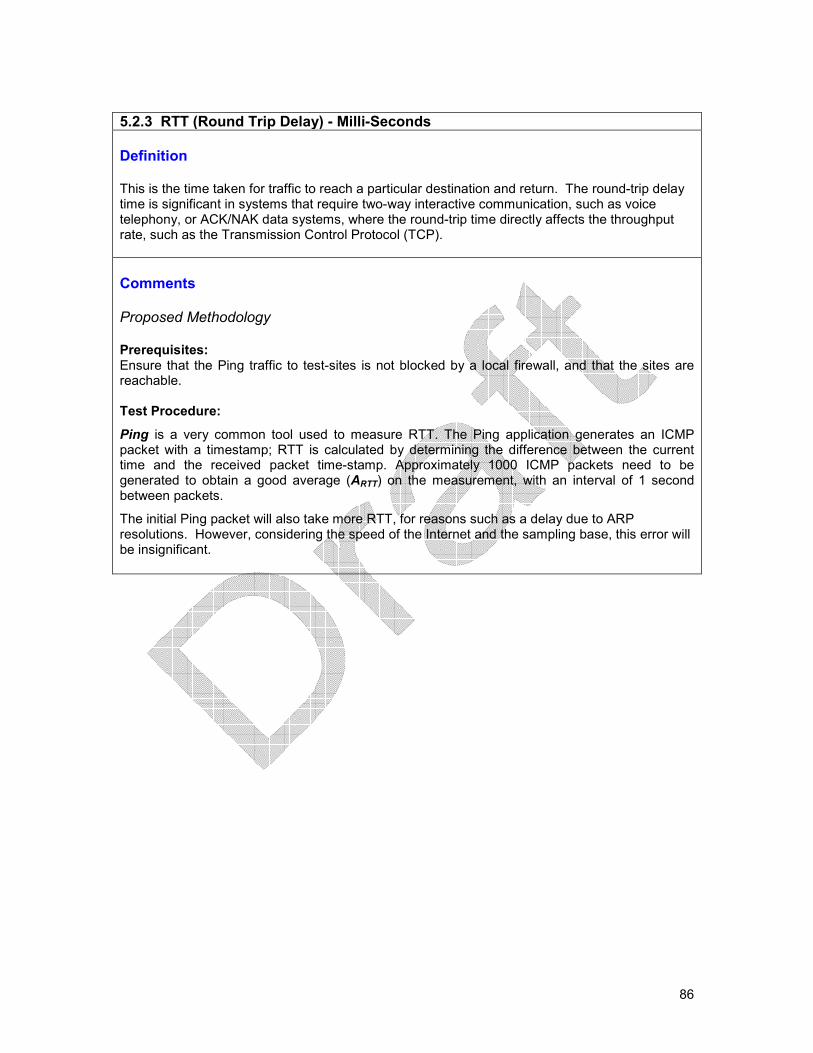
86
5.2.3 RTT (Round Trip Delay) - Milli-Seconds Definition This is the time taken for traffic to reach a particular destination and return. The round-trip delay time is significant in systems that require two-way interactive communication, such as voice telephony, or ACK/NAK data systems, where the round-trip time directly affects the throughput rate, such as the Transmission Control Protocol (TCP). Comments Proposed Methodology
Prerequisites: Ensure that the Ping traffic to test-sites is not blocked by a local firewall, and that the sites are reachable.
Test Procedure:
Ping is a very common tool used to measure RTT. The Ping application generates an ICMP packet with a timestamp; RTT is calculated by determining the difference between the current time and the received packet time-stamp. Approximately 1000 ICMP packets need to be generated to obtain a good average (ARTT) on the measurement, with an interval of 1 second between packets.
The initial Ping packet will also take more RTT, for reasons such as a delay due to ARP resolutions. However, considering the speed of the Internet and the sampling base, this error will be insignificant.
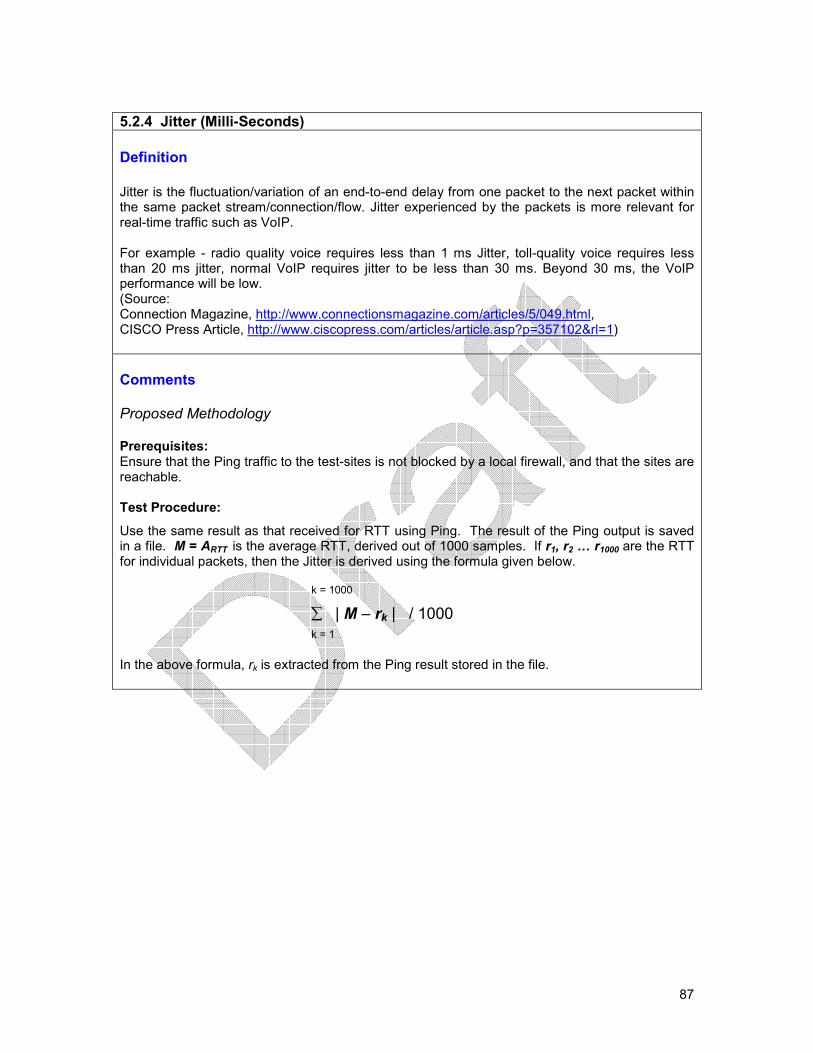
87
5.2.4 Jitter (Milli-Seconds)
Definition
Jitter is the fluctuation/variation of an end-to-end delay from one packet to the next packet within the same packet stream/connection/flow. Jitter experienced by the packets is more relevant for real-time traffic such as VoIP. For example - radio quality voice requires less than 1 ms Jitter, toll-quality voice requires less than 20 ms jitter, normal VoIP requires jitter to be less than 30 ms. Beyond 30 ms, the VoIP performance will be low. (Source: Connection Magazine, http://www.connectionsmagazine.com/articles/5/049.html, CISCO Press Article, http://www.ciscopress.com/articles/article.asp?p=357102&rl=1) Comments Proposed Methodology Prerequisites: Ensure that the Ping traffic to the test-sites is not blocked by a local firewall, and that the sites are reachable. Test Procedure:
Use the same result as that received for RTT using Ping. The result of the Ping output is saved in a file. M = ARTT is the average RTT, derived out of 1000 samples. If r1, r2 … r1000 are the RTT for individual packets, then the Jitter is derived using the formula given below.
k = 1000
∑ | M – rk | / 1000 k = 1
In the above formula, rk is extracted from the Ping result stored in the file.

88
5.2.5 Packet- Loss (as a Percentage) Definition This is the number of packets (as a percentage) which do not reach their destination. Packet-loss can result in highly noticeable performance issues with Streaming Technologies, VOIP, videoconferencing and so on, and will affect all other network applications to a degree. Comments Proposed Methodology Prerequisites: Ensure that the Ping traffic to the test-sites is not blocked by a local firewall, and that the sites are reachable. Test Procedure: Ping software is also used to calculate packet-loss. After having calculated RTT and Jitter, Ping provides a summary of the total number of packets transmitted, packets received and the packets lost in terms of percentages.
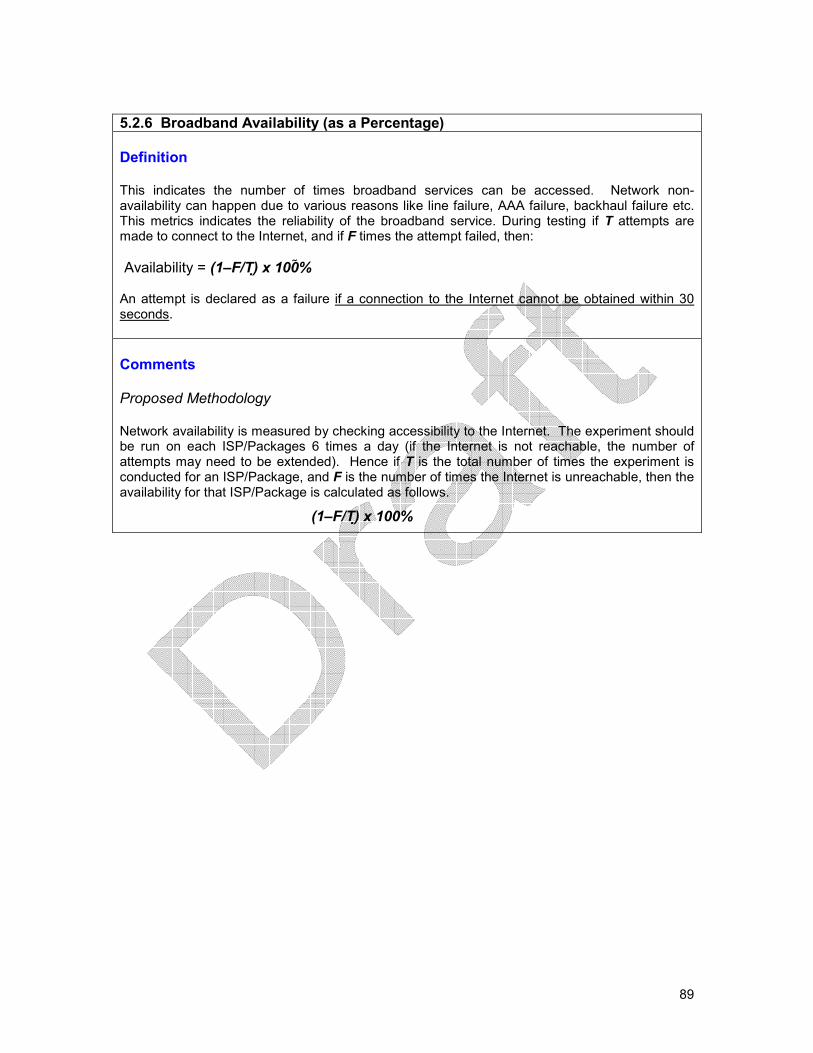
89
5.2.6 Broadband Availability (as a Percentage) Definition This indicates the number of times broadband services can be accessed. Network non-availability can happen due to various reasons like line failure, AAA failure, backhaul failure etc. This metrics indicates the reliability of the broadband service. During testing if T attempts are made to connect to the Internet, and if F times the attempt failed, then: Availability = (1–F/T)� x 100!% An attempt is declared as a failure if a connection to the Internet cannot be obtained within 30 seconds. Comments Proposed Methodology Network availability is measured by checking accessibility to the Internet. The experiment should be run on each ISP/Packages 6 times a day (if the Internet is not reachable, the number of attempts may need to be extended). Hence if T is the total number of times the experiment is conducted for an ISP/Package, and F is the number of times the Internet is unreachable, then the availability for that ISP/Package is calculated as follows.
(1–F/T)� x 100%

90
6 GENERAL DEFINITIONS 6.1 Total Population of a Country Definition World Bank Definition
Population is an estimate for mid-year population, based, in most cases, on a de facto definition, which counts all residents regardless of legal status or citizenship. Note, however, that refugees not permanently settled in the country of asylum are generally considered to be part of the population of their country of origin. Population numbers are either current census data or historical census data extrapolated through certain demographic models.
Comments Reporting Rules When reporting population related indicators, the population figures specified by a country’s Census and Statistics Bureau should be used. However, if there is a discrepancy between the Census Bureau’s figures and that of another organization, both figures can be stated. 6.2 Number of Households in a Country Definition This is the number of registered households within a country as stated by the respective National Statistical Organization (NSO). Comments Annual Reporting Since household surveys are generally done every 5-10 years, the Bureau should provide estimated figures on an annual basis.
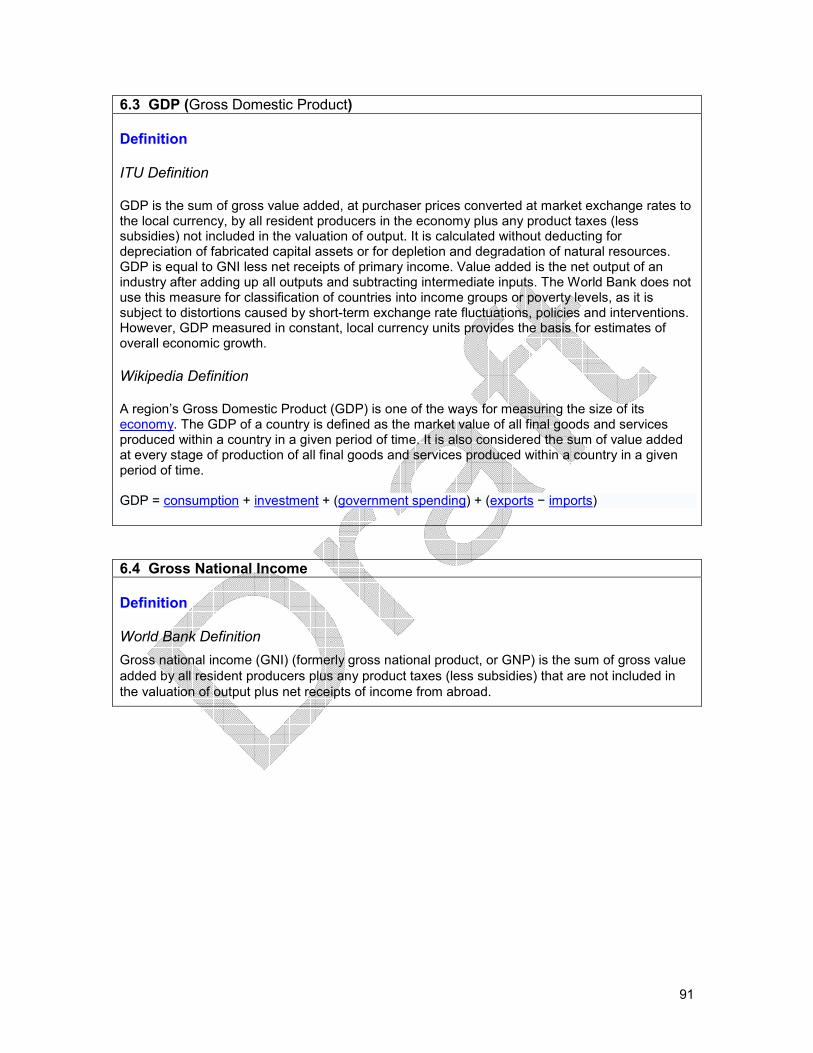
91
6.3 GDP (Gross Domestic Product) Definition ITU Definition GDP is the sum of gross value added, at purchaser prices converted at market exchange rates to the local currency, by all resident producers in the economy plus any product taxes (less subsidies) not included in the valuation of output. It is calculated without deducting for depreciation of fabricated capital assets or for depletion and degradation of natural resources. GDP is equal to GNI less net receipts of primary income. Value added is the net output of an industry after adding up all outputs and subtracting intermediate inputs. The World Bank does not use this measure for classification of countries into income groups or poverty levels, as it is subject to distortions caused by short-term exchange rate fluctuations, policies and interventions. However, GDP measured in constant, local currency units provides the basis for estimates of overall economic growth. Wikipedia Definition A region’s Gross Domestic Product (GDP) is one of the ways for measuring the size of its economy. The GDP of a country is defined as the market value of all final goods and services produced within a country in a given period of time. It is also considered the sum of value added at every stage of production of all final goods and services produced within a country in a given period of time. GDP = consumption + investment + (government spending) + (exports − imports) 6.4 Gross National Income Definition World Bank Definition
Gross national income (GNI) (formerly gross national product, or GNP) is the sum of gross value added by all resident producers plus any product taxes (less subsidies) that are not included in the valuation of output plus net receipts of income from abroad.
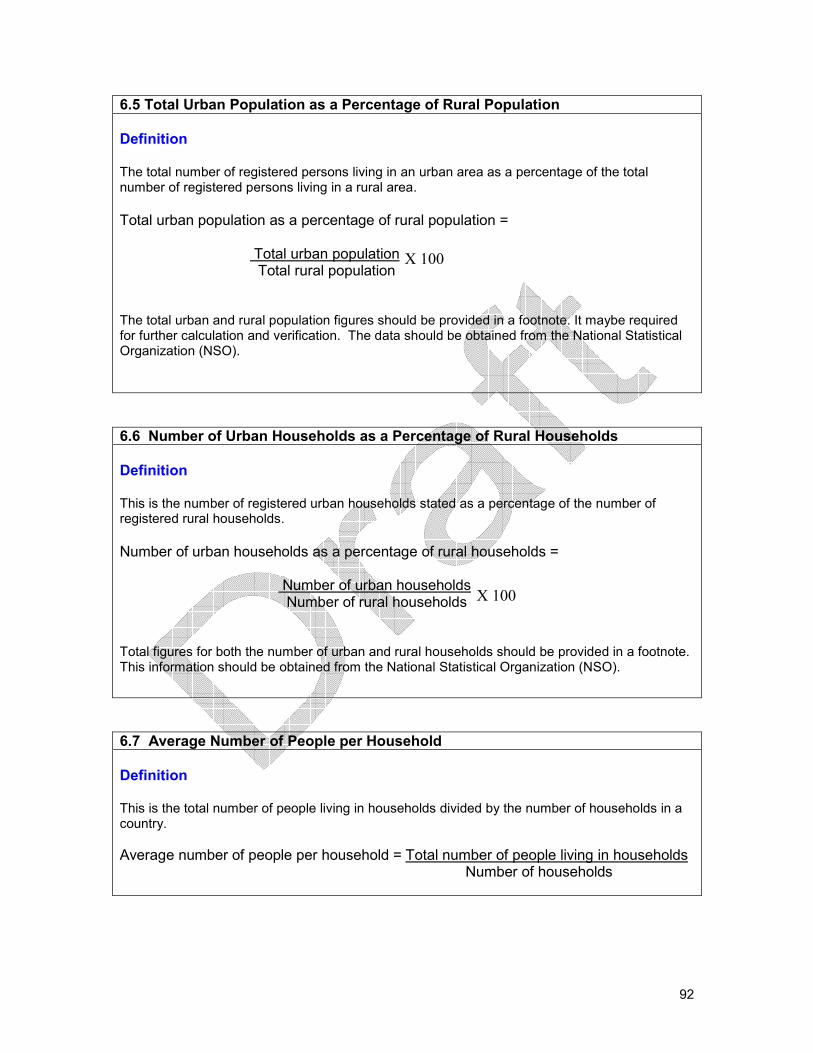
92
6.5 Total Urban Population as a Percentage of Rural Population Definition The total number of registered persons living in an urban area as a percentage of the total number of registered persons living in a rural area. Total urban population as a percentage of rural population = Total urban population Total rural population The total urban and rural population figures should be provided in a footnote. It maybe required for further calculation and verification. The data should be obtained from the National Statistical Organization (NSO).
6.6 Number of Urban Households as a Percentage of Rural Households Definition This is the number of registered urban households stated as a percentage of the number of registered rural households. Number of urban households as a percentage of rural households = Number of urban households Number of rural households Total figures for both the number of urban and rural households should be provided in a footnote. This information should be obtained from the National Statistical Organization (NSO).
6.7 Average Number of People per Household Definition This is the total number of people living in households divided by the number of households in a country. Average number of people per household = Total number of people living in households Number of households
X 100
X 100

93
6.8 EBITDA Definition Earnings before Interest, Tax, Depreciation and Amortization 1 Definition compiled by information gathered from, http://www.answers.com/topic/landline, and http://www.pcmag.com/encyclopedia_term/0,2542,t=fixed-line&i=43245,00.asp. 2 Definition compiled by information gathered from http://www.webopedia.com/TERM/F/fixed_wireless.html. 3 Can be found on Wikipedia at the following URL: http://en.wikipedia.org/wiki/Business_process_outsourcing. 4 This methodology can be obtained from ‘A Preliminary Methodology for the Comparative Analysis of
Domestic Leased Lines Tariffs in the South Asian Region’ report available at http://www.lirneasia.net/UserFiles/File/leased-line-tariffs-v1.pdf. 5This formula was obtained from the proposed methodology stated in ‘A Preliminary Methodology for the Comparative
Analysis of Domestic Leased Lines Tariffs in the South Asian Region’ report available at http://www.lirneasia.net/UserFiles/File/leased-line-tariffs-v1.pdf. 6 Definition compiled through the information extracted from http://searchnetworking.techtarget.com/sDefinition/0,,sid7_gci827417,00.html. 7 Excerpts taken from the ITU Internet report, ‘Birth of Broadband’ can be found at
http://www.itu.int/osg/spu/publications/sales/birthof broadband/exec_summary.html 8 This methodology can be obtained from the ‘A Preliminary Methodology for the Comparative Analysis of
Domestic Leased Lines Tariffs in the South Asian Region’ report available at http://www.lirneasia.net/UserFiles/File/leased-line-tariffs-v1.pdf. 9 This data and further reasoning is available at http://www.lirneasia.net/wp-content/uploads/2007/03/challenges-of-high-
ampu-in-a-low-arpu-world-mahinda-herath.pdf. 10
Excerpt from ‘Increasing Complication in Calculating and Comparing Revenue for Mobile Operators’ by Trisha Mitra. Can be found at : http://www.teleconomy.com/waves/tnewsletter/2002/10/page9.htm 11
This information and more details can be obtained from http://www.sciencedirect.com/science?_ob=ArticleURL&_udi=B6VCC-4M3BGV3-1&_user=10&_coverDate=12%2F31%2F2006&_rdoc=1&_fmt=&_orig=search&_sort=d&view=c&_acct=C000050221&_version=1&_urlVersion=0&_userid=10&md5=0fbcbc7ffa8d13d8cdb2b40b65cd9510. 12 Data that was used to compile this data can be found at http://www.celltrek.com/IMAGE/Tech/C.htm
Related Documents