TELECOM ITALIA GROUP 1Q 2013 Results Milan, May 9 th , 2013 Telecom Italia Group 1Q 2013 Results FRANCO BERNABE’ - PIERGIORGIO PELUSO

Welcome message from author
This document is posted to help you gain knowledge. Please leave a comment to let me know what you think about it! Share it to your friends and learn new things together.
Transcript

TELECOM ITALIA GROUP
1Q 2013 Results Milan, May 9th, 2013
Telecom Italia Group
1Q 2013 Results
FRANCO BERNABE’ - PIERGIORGIO PELUSO

1 FRANCO BERNABE’ – PIERGIORGIO PELUSO
TELECOM ITALIA GROUP
1Q 2013 Results
Safe Harbour These presentations contain statements that constitute forward-looking statements within the meaning of the Private Securities Litigation Reform Act of 1995. These statements appear in a number of places in this presentation and include statements regarding the intent, belief or current expectations of the customer base, estimates regarding future growth in the different business lines and the global business, market share, financial results and other aspects of the activities and situation relating to the Company and the Group. Such forward looking statements are not guarantees of future performance and involve risks and uncertainties, and actual results may differ materially from those projected or implied in the forward looking statements as a result of various factors. Consequently, Telecom Italia S.p.A. makes no representation, whether expressed or implied, as to the conformity of the actual results with those projected in the forward looking statement. Forward-looking information is based on certain key assumptions which we believe to be reasonable as of the date hereof, but forward looking information by its nature involves risks and uncertainties, which are outside our control, and could significantly affect expected results. Analysts are cautioned not to place undue reliance on those forward looking statements, which speak only as of the date of this presentation. Telecom Italia S.p.A. undertakes no obligation to release publicly the results of any revisions to these forward looking statements which may be made to reflect events and circumstances after the date of this presentation, including, without limitation, changes in Telecom Italia S.p.A. business or acquisition strategy or planned capital expenditures or to reflect the occurrence of unanticipated events. Analysts and investors are encouraged to consult the Company's Annual Report on Form 20-F as well as periodic filings made on Form 6-K, which are on file with the United States Securities and Exchange Commission. Some data for the first quarter 2012, used in comparisons, included into this presentation have been restated as a result of the early adoption, starting from the first half 2012, of the revised version of IAS 19 (Employee Benefits) and the reclassification of Matrix (company that was disposed of on October 31, 2012) from the Business Unit Domestic–Core Domestic to the Business Unit Other Activities.

2 FRANCO BERNABE’ – PIERGIORGIO PELUSO
TELECOM ITALIA GROUP
1Q 2013 Results
TI Group 1Q13 Results and Core Markets Performance Italy
Brazil
Argentina
Financial Position
Strategic Update
Wrap-up
Appendix
Agenda

3 FRANCO BERNABE’ – PIERGIORGIO PELUSO
TELECOM ITALIA GROUP
1Q 2013 Results
CAPEX
EBITDA - CAPEX
EBITDA
Contribution to YoY change
Revenues
Contribution to YoY change
0.0%
3.3%
-6.5%
7.023 6.796
1Q12 1Q13
906 878
1Q12 1Q13
1.979 1.821
1Q12 1Q13
2,885 2,699
1Q12 1Q13
-0.3%
1.5%
-7.6%
Euro mln, Organic data, %
TI Group Main Results
-227 M€ -3.2%
-28 M€ -3.1%
12.9% 12.9%
% on Revenues
-158 M€ -8.0%
26.8% -1.4 pp 28.2%
% on Revenues
Domestic
Other B.U.
LatAm
41.1% 39.7%
-1.4 pp
-186 M€ -6.4%
% on Revenues
Domestic
Other B.U.
LatAm -6.4% -3.2%

4 FRANCO BERNABE’ – PIERGIORGIO PELUSO
TELECOM ITALIA GROUP
1Q 2013 Results
Revenues
EBITDA
EBITDA-CAPEX
Weight on TI Group
39.8%
27.2%
TI Group
1Q13
6,796
2,699
1,821
-3.2%
-6.4%
-8.0%
1Q13
1,786
463
285
+5.4%
+4.4%
+19.8%
26.3%
17.2%
~16%
Brazil
1Q13
917
271
159
+18.3%
+9.2%
+10.6 %
13.5%
10.0%
~9%
Argentina
1Q13
4,024
2,000
1,422
D% yoy
-10.1%
-9.8%
-12.9%
58.9%
74.1%
~78%
Domestic
TI Group Core Markets Performance Euro mln, Organic data
D% yoy D% yoy D% yoy

5 FRANCO BERNABE’ – PIERGIORGIO PELUSO
TELECOM ITALIA GROUP
1Q 2013 Results
2.218 2.000
1Q12 1Q13
Highlights
Domestic
4.477 4.024
1Q12 1Q13
-453 M€
-10.1%
-218 M€
-9.8%
% on Total Revenues 49.7% +0.2 pp 49.5%
Dual-speed Top Line:
Mobile Service Revenues: negative impact due to regulated
prices combined with a harsh competition;
Core Fixed: in line with last year trend, mainly due to ICT
services (+9.4% YoY) and Broadband services (+1.5% YoY).
EBITDA margin: outstanding level at ~50%.
Networks: confirming our UBB deployment to leverage on our
distinctive and unique infrastructure.
Convergence Approach: Multiple-Play offers to expand the
integration of voice, data, images, information, entertainment,
multimedia and communication services.
Euro mln, Organic data, %
Revenues EBITDA

6 FRANCO BERNABE’ – PIERGIORGIO PELUSO
TELECOM ITALIA GROUP
1Q 2013 Results
443 463
1Q12 1Q13
Highlights
Brazil
% on Total Revenues
Top Line: positive performance mainly due to re-acceleration
in the net mobile service revenues trend (+3.2% YoY in 4Q12,
+4.0% YoY in 1Q13).
Effective cost control aimed at supporting marginality:
SAC/ARPU ratio declining (-15.1% YoY) and bad debt under
control (1% of gross revenues).
Commercial Strategy: focus on innovation and unique market
positioning. In the month of March, TIM totalled over 50% of
market net adds.
Network: infrastructure evolution to foster voice demand and
to support Mobile Data.
Quality & Transparency: renewed commitment to quality, to
strengthen regulatory & institutional dialogue and to improve
customer relationships.
Euro mln, Organic data
Revenues EBITDA
1.694 1.786
1Q12 1Q13
+92M€
+5.4%
+20 M€
+4.4%
25.9% -0.3 pp 26.2%

7 FRANCO BERNABE’ – PIERGIORGIO PELUSO
TELECOM ITALIA GROUP
1Q 2013 Results
248 271
1Q12 1Q13
Highlights
Argentina
Top Line double-digit growth, offsetting limited nominal price
adjustments:
Mobile: consolidating leading position in revenue share,
+13% YoY ARPU for better postpaid/prepaid mix and
consistent VAS revenue expansion;
Fixed: +20% YoY ARPU BB thanks to enhancing value
proposition and compelling BB offers.
EBITDA: strengthening cost control to manage impact of
labour-related cost increases.
Capex Plan focused on quality of service and on improving
customer experience through:
Network evolution: speeding-up roll-out process to upgrade
capacity and increase effectiveness of the available
spectrum (refarming);
Network innovation: FTTCab deployment to ensure best BB
experience.
Euro mln, Organic data, %
Revenues EBITDA
775
917
1Q12 1Q13
+142M€
+18.3%
+23 M€
+9.2%
29.6% -2.5 pp 32.1%
% on Total Revenues

8 PIERGIORGIO PELUSO
TELECOM ITALIA GROUP
1Q 2013 Results
TI Group 1Q13 Results and Core Markets Performance
Italy
Brazil
Argentina
Financial Position
Strategic Update
Wrap-up
Appendix
Agenda

9 PIERGIORGIO PELUSO
TELECOM ITALIA GROUP
1Q 2013 Results
D vs. 12
2011YE
30,414 30,312
1Q12
Euro mln, Reported Data
EBITDA
CAPEX
D WC & Others
Operating FCF
(2,672)
+878
+1,657
(137)
+493
1Q13 Net Debt Evolution affected by One-Offs & Seasonalities
28,274
2012YE
Adjusted
(10)
(16)
(26)
Disposals
+438
(31)
+407
Cash Financial Expenses/ Financial Accruals
+153
+96
+249
Cash Taxes/Other Impacts
28,767
1Q13
Adjusted
(626)
+489
(137)
Operating FCF
(102)

10 PIERGIORGIO PELUSO
TELECOM ITALIA GROUP
1Q 2013 Results
Operating Free Cash Flow 1Q13 vs 1Q12 YE NFP Bridge: Apr-Dec 2013 vs 2012
Progressive FCF Generation will allow the achievement of 2013 Debt Target
Euro mln, Reported Data
Revenues
Opex
Δ WC
OFCF
7,392
6,796
- 264
+295
626
(1,393) (1,657)
Capex (954 ) (878)
4,419 4,124
1Q12 1Q13
Euro bln
-596
+76
137 - 489
2012 30.3
1Q12
28.3
FY12 2.0
Net Cash Flow
1Q13
2013 28.8 <27
FY13E
2.0
~1.9
Δ Apr-Dec 2013 NCF YoY Breakdown (~)
Operating: -0.2 €bln EBITDA less Capex
One-Offs: -0.3 €bln from 4Q12 suppliers payment deferral
Expected Net Cash Flow
OFCF - 0.2 €bln
Brazil spectrum payments - 0.2 €bln
M&A (Matrix, La7) - 0.2 €bln
Dividends (Group) +0.4 €bln
Taxes +0.2 €bln
FX & other - 0.1 €bln
- 0.1 €bln

11 PIERGIORGIO PELUSO
TELECOM ITALIA GROUP
1Q 2013 Results
Bonds Drawn bank facility
Robust Liquidity, Well-Distributed Debt Maturities
7.20 € bln
Group Liquidity Position
+
6.70 € bln
Undrawn Portion of
Facility/Committed
=
13.90 € bln
Group Liquidity Margin
Euro mln Loans (of which long-term rent, financial and operating lease payable € 1,317)
(1) € 35.732 mln is the nominal amount of outstanding medium-long term debt.
By adding IAS adjustments (€ 899 mln) and current liabilities (€ 592 mln), the gross debt figure of € 37.222 mln is reached.
N.B. Debt maturities are net of € 856 mln (face value) of repurchased own bonds (of which € 641 mln related to bonds due in the next 24 mounths).

12 PIERGIORGIO PELUSO
TELECOM ITALIA GROUP
1Q 2013 Results
On April 30th, 2013 TI Media has completed the sale of La7
Srl to Cairo Communication Group;
In September 2012, when TI Media spun-off the TV business,
the estimated full year loss for La7 TV channel was above 100
euro mln;
In the first 4 months of 2013, La7 TV channel loss was equal
to 24 euro mln (of which 17 euro mln in 1Q13);
P&L-wise, TI’s 1Q13 provision amounted to 105 euro mln; the
overall stop loss at the end of April totalled 130 euro mln (100
euro mln post minorities);
Cash-wise, TI contributed 114 euro mln for the disposal.
La7 Stop-Loss
Euro mln
Euro Mln; Organic Data
Revenues
OPEX
EBITDA
EBITDA - CAPEX
6,796
4,097
2,699
1,821
TI Group
1,786
1,323
463
285
Brazil
917
646
271
159
Argentina
4,024
2,024
2,000
1,422
Domestic
48
58
-10
-19
Media
TI 1Q 2013 results
TI Media EBIT evolution La7 Sale completed
1Q13 2014 2015
TI Media excl. La7 La7 La7 disposal
- 17
- 105
- 3
52
71
-19
-20
Olivetti

13 FRANCO BERNABE’ – PIERGIORGIO PELUSO
TELECOM ITALIA GROUP
1Q 2013 Results
TI Group 1Q13 Results and Core Markets Performance
Italy
Brazil
Argentina
Financial Position
Strategic Update
Wrap-up
Appendix
Agenda

14 FRANCO BERNABE’ – PIERGIORGIO PELUSO
TELECOM ITALIA GROUP
1Q 2013 Results
FIBRE OPTIC – ACCESS
Major Elements of TI’s Fixed Access Network
Structural Separation would:
Guarantee full Equivalence of Input; Focus on the Development of the New Fiber Network; Continue to improve the existing Copper Network quality; Stabilize the Regulatory Framework.
COPPER
UBB equipment in the local exchange (OLT)
TWISTED PAIRS
Main Distribution Frames
USERS’ STUDS
POLES
CABINETS
PHYSICAL ACCESSES
DISTRIBUTORS
CABLES BLUEPRINT
5,700,000
575,000 km
Retail+WHS 22,000,000
km of fibre
724,000
km of cables
14,200
km of cables
576,000
~33.6 m
8,900,000
151,000
10,500
102m km couple
Fixed Access Network
UBB Access equipment (ONU FTTC)
84
2,137 active
2,745 installed

15 FRANCO BERNABE’ – PIERGIORGIO PELUSO
TELECOM ITALIA GROUP
1Q 2013 Results
TI Group 1Q13 Results and Core Markets Performance
Italy
Brazil
Argentina
Financial Position
Strategic Update
Wrap-up
Appendix
Agenda

16 FRANCO BERNABE’ – PIERGIORGIO PELUSO
TELECOM ITALIA GROUP
1Q 2013 Results
Telecom Italia Group FY2013 Guidance Confirmed
* excluding impact from non-organic items and FX.
** reported figure
Organic Data*
TI Group - 2013 targets
Low-single digit decline YoY EBITDA
< 27 € bln NFP Adj.**
Stable YoY Revenues

17 FRANCO BERNABE’ – PIERGIORGIO PELUSO
TELECOM ITALIA GROUP
1Q 2013 Results
TI Group 1Q13 Results and Core Markets Performance
Italy
Brazil
Argentina
Financial Position
Strategic Update
Wrap-up
Appendix
Agenda
PIERGIORGIO PELUSO

18 FRANCO BERNABE’ – PIERGIORGIO PELUSO
TELECOM ITALIA GROUP
1Q 2013 Results
TI Group - Revenues Evolution Euro mln
* Average Exchange rate (Real/Euro): 2.64 in 2013, 2.32 in 2012 * * Average Exchange rate (Peso/Euro): 6.62 in 2013, 5.69 in 2012
Others & Elim. (9)
7,392 7,023 6,796 6,796 (9) (360) (453) +92 +142 (10) (7) +9
area
1Q12 Change in consolid.
Exchange rate impact
items
Other non-organic
1Q12 Organic
Domestic Brazil* Argentina** Media Olivetti Other & Elim.
1Q13 Organic
1Q13
Brazil (234) Argentina (126)
0 0
items
Other non-organic
Organic Variation
-227 (-3.2%)
-596 (-8.1%)
PIERGIORGIO PELUSO

19 FRANCO BERNABE’ – PIERGIORGIO PELUSO
TELECOM ITALIA GROUP
1Q 2013 Results
Others & Elim +12 Agreements and Transactions (1) Restructuring charges (21) Other net cost (5)
Organic Variation
-186 (-6.4%)
Brazil (62) Argentina (41)
2,973 2,885 2,699 2,672 +12 (103) +3 (218)
+20 +23 (4) (6) (1) (27)
TI Group - EBITDA Evolution Euro mln
area
1Q12 Change in consolid.
Exchange rate impact
1Q12 Organic
Domestic Brazil* Argentina** Media Olivetti Other & Elim.
1Q13 Organic
1Q13
items
Other non-organic
items
Other non-organic
-301 (-10.1%)
PIERGIORGIO PELUSO
* Average Exchange rate (Real/Euro): 2.64 in 2013, 2.32 in 2012 * * Average Exchange rate (Peso/Euro): 6.62 in 2013, 5.69 in 2012
20 FRANCO BERNABE’ – PIERGIORGIO PELUSO
TELECOM ITALIA GROUP
1Q 2013 Results
Euro mln
1,625 (48) 1,596 (187)
1,414
1,282
-343 (-21.1%)
+16
+5 +1 (5) (1)
Agreements and Transactions (1) Restructuring charges (21) Other net cost (5) Provision for La7 disposal (105)
TI Group - EBIT Evolution
+3
(132) +5
area
1Q12 Change in consolid.
Exchange rate impact
1Q12 Organic
Domestic Brazil* Argentina** Media Olivetti Other & Elim.
1Q13 Organic
1Q13
items
Other non-organic
items
Other non-organic
Organic Variation
-182 (-11.4%)
PIERGIORGIO PELUSO
* Average Exchange rate (Real/Euro): 2.64 in 2013, 2.32 in 2012 * * Average Exchange rate (Peso/Euro): 6.62 in 2013, 5.69 in 2012
21 FRANCO BERNABE’ – PIERGIORGIO PELUSO
TELECOM ITALIA GROUP
1Q 2013 Results
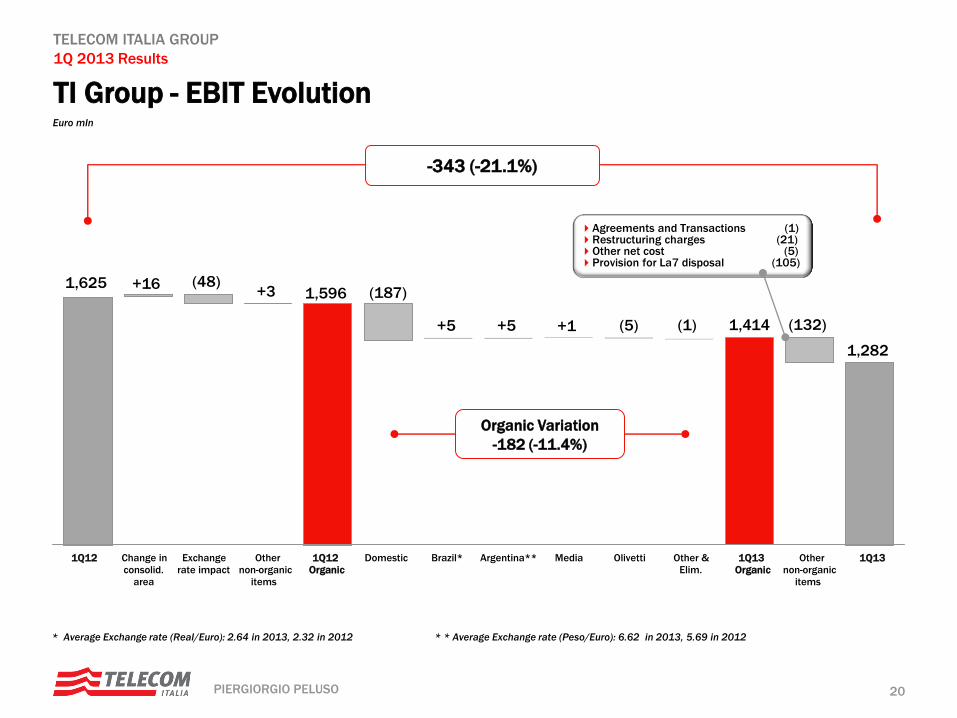
Total Gross Debt Net of Adjustment: Euro 37,222 mln Maturities and Risk Management
Well Diversified and Hedged Debt
Euro mln
Average debt maturity: 7.09 years (bonds only:
8.08 years)
Fixed rate portion of gross debt, approximately
74.7%
Around 49% of outstanding bonds (nominal
amount) is denominated in USD, GBP and YEN
and is fully hedged
Cost of debt: 5.3%
N.B. The figures are net of the adjustment due to the fair value measurement
of derivatives and related financial liabilities/assets, as follows:
- the impact in Gross Financial Debt is equal to 2,424 €/mln (of which
672 €/mln on bonds)
- the impact on Financial Assets is equal to 1,675 €/mln
Therefore, the Net Financial Indebtedness is adjusted by 749 €/mln.
3.6%
5.8%
71.0%
Bonds
26,423
Gross debt
Financial assets
of which C & CE and marketable securities
- C & CE
- Marketable securities
- Italian Government Securities
- Others
37,222
(8,455)
Bank Facility
1,467
Bank & EIB
5,858
Op. Leases and long term rent
1,331
Other
2,143
15.7%
3.9%
Net Financial Position 28,767
(7,202)
(6,476)
(726)
(509)
(217)
PIERGIORGIO PELUSO

22 FRANCO BERNABE’ – PIERGIORGIO PELUSO
TELECOM ITALIA GROUP
1Q 2013 Results
2013 2012 D Abs.
REVENUES 6,796 7,392 (596) (8.1)
Other Operating Income 55 52 3
TOTAL REVENUES & OTHER INCOME 6,851 7,444 (593) (8.0)
Total Purchases of materials and external services (2,964) (3,231) 267
Personnel (976) (988) 12
of which payroll (940) (977) 37
Other operating costs (440) (456) 16
Capitalized Cost and Others 201 204 (3)
EBITDA 2,672 2,973 (301) (10.1)
% on Revenues 39.3% 40.2%
Depreciation & Amortization (1,292) (1,344) 52
Write-downs and revaluations of non-current assets
7 (4) 11 Gains/losses of non-current assets realization
(105) 0 (105)
EBIT 1,282 1,625 (343) (21.1)
% on Revenues 18.9% 22.0%
Income (loss) equity invest. valued equity method - -3 3
Other income ( expenses ) from investments - - -
Net Financial Income / (Expenses) (491) (449) (42)
Income before Taxes & Disc. Ops. 791 1,173 (382) (32.6)
% on Revenues 11.6% 15.8%
Taxes (343) (455) 112
Income before Disc. Ops. 448 718 (270)
Net income (loss) of assets disposed 0 0 0
Net Income (ante Minorities) 448 718 (270)
% on Revenues 6.6% 9.7%
Minorities 84 113 (29)
Net Income (post Minorities) 364 605 (241) (39.8)
% on Revenues 5.4% 8.2%
% D
8.3
1.2
3.5
5.8
3.9
24.6
(37.6)
(37.6)
(1.5)
(25.7)
9.4
Euro mln – Reported Data
TI Group 1Q13 Results - P&L
I Quarter
PIERGIORGIO PELUSO

23 FRANCO BERNABE’ – PIERGIORGIO PELUSO
TELECOM ITALIA GROUP
1Q 2013 Results
-6
I Quarter
2013 2012 D Abs. D %
I Quarter
2013 2012 D Abs. D %
Reported Organic
REVENUES REVENUES
TI Group TI Group
EBITDA EBITDA
TI Group TI Group
EBITDA MARGIN EBITDA MARGIN
TI Group 1Q13 - Main Results by BU Euro mln
I Quarter
2013 2012 D Abs. D %
I Quarter
2013 2012 D Abs. D %
Domestic 4,024 4,477 - 453 (10.1)
Wireline Domestic 2,976 3,223 - 247 (7.7)
Tim Domestic 1,379 1,650 - 271 (16.4)
Brazil 1,786 1,928 142 (7.4)
Argentina 917 901 16 1.8
Media 48 58 10 (17.2)
Olivetti 52 59 - 7 (11.9)
Other Activities & Elim. -31 -31 0 -
-
-
4,024 4,477 -453 (10.1) Domestic
Wireline Domestic 2,976 3,223 -247 (7.7)
Tim Domestic 1,379 1,650 -271 (16.4)
Brazil 1,786 1,694 92 5.4
Argentina 917 775 142 18.3
Media 48 58 -10 (17.2)
Olivetti 52 59 -7 (11.9)
Other Activities -31 -40 9 -
Domestic 1,973 2,215 -242 (10.9)
Brazil 463 505 -42 (8.3)
Argentina 271 289 -18 (6.2)
Media -10 -6 -4 (66.7)
Olivetti -19 -13 -6 (46.2)
Other Activities & Elim. -6 -17 11 -
Domestic 2,000 2,218 -218 (9.8)
Brazil 463 443 20 4.4
Argentina 271 248 23 9.2
Media -10 -6 - 4 (66.7)
Olivetti -19 -13 (46.2)
Other Activities & Elim. - 6 -5 -1 -
2,699 2,885 -186 (6.4)
39.7% 41.1% -1.4 pp
2,672 2,973 -301 (10.1)
39.3% 40.2% - 0.9 pp
6,796 7,392 -596 (8.1) 6,796 7,023 -227 (3.2)
PIERGIORGIO PELUSO

24 FRANCO BERNABE’ – PIERGIORGIO PELUSO
TELECOM ITALIA GROUP
1Q 2013 Results
Euro mln
Equity +3
Net Fin. Charges (42)
605
Net Income
1Q12
-241 (-39.8%)
Minorities
1Q12
113 718
Income ante Min
& Disc. Ops. 1Q11
D
EBIT
(343)
D
Net Interest &
Net Income
/Equity
(39)
D
Taxes
112 448
Income/(Loss) ante
Min & Disc. Ops.
1Q13
Minorities
1Q13
(84)
364
Net Income
1Q13
Net Income Evolution
o/w
La7 Write-down (105)
PIERGIORGIO PELUSO
Related Documents