Telecom Customer Bases – Part 3 Indonesian Telecom Market Facts and Numbers: Charts & Tables 2004-2008 [HR.CTD003.V1U1-2009] Dr.-Ing. Eueung Mulyana @ Harewos Research 11/4/2009 http://www.ligarvirtual.com/harewos

Welcome message from author
This document is posted to help you gain knowledge. Please leave a comment to let me know what you think about it! Share it to your friends and learn new things together.
Transcript

Telecom Customer Bases – Part 3 Indonesian Telecom Market Facts and Numbers: Charts & Tables 2004-2008 [HR.CTD003.V1U1-2009] Dr.-Ing. Eueung Mulyana @ Harewos Research 11/4/2009 http://www.ligarvirtual.com/harewos
Telecom Customer Bases – Part 3
Harewos.Research http://www.ligarvirtual.com/harewos
Nov. 4
2
Contents
List of Figures & Tables ........................................................................................................ 3
Telkomsel ............................................................................................................................... 4
Telkom FWA .......................................................................................................................... 5
Telkom Group – Wireless ...................................................................................................... 6
Telkom Group - All ................................................................................................................ 8
Indosat ................................................................................................................................. 10
Indosat FWA ........................................................................................................................ 11
Indosat Group - Wireless .................................................................................................... 12
Indosat Group - All .............................................................................................................. 14
Excelcomindo ....................................................................................................................... 16
Bakrie Telecom .................................................................................................................... 17
Mobile-8 ................................................................................................................................ 18
Mobile-8 - All ....................................................................................................................... 19
HCPT .................................................................................................................................... 21
NTS ...................................................................................................................................... 22
Smart Telecom ..................................................................................................................... 23
STI ........................................................................................................................................ 24
Abbreviations & Notes ........................................................................................................ 25

Telecom Customer Bases – Part 3
Harewos.Research http://www.ligarvirtual.com/harewos
Nov. 4
3
List of Figures & Tables
Figure 1 Portion of TLKM’s Cellular & FWA Subscribers 2008E ...................................... 7 Figure 2 Portion of TLKM’s Cellular Subscribers (2004-2008) ........................................... 7 Figure 3 Portion of TLKM’s Cellular, FWA & FWL/PSTN Subscribers 2008E ................. 9 Figure 4 Portion of TLKM’s Cellular & FWA Subscribers (2004-2008) ............................. 9 Figure 5 Portion of ISAT’s Cellular & FWA Subscribers 2008E ...................................... 13 Figure 6 Portion of ISAT’s Cellular Subscribers (2004-2008) - Wireless ......................... 13 Figure 7 Portion of TLKM’s Cellular, FWA & FWL Subscribers 2008E .......................... 15 Figure 8 Portion of ISAT’s Cellular Subscribers (2004-2008) - All ................................... 15 Figure 9 Portion of M8’s Cellular & FWA Subscribers 2008E .......................................... 20 Figure 10 Portion of M8’s Cellular Subscribers (2004-2008) ............................................ 20
Figure Table 1 TSEL’s Subscriber Base 2004-2008 ............................................................ 4 Figure Table 2 Growth of TSEL’s Subscriber Base – AGR & CAGR .................................. 4 Figure Table 3 TLKM’s FWA Subscriber Base 2004-2008 .................................................. 5 Figure Table 4 Growth of TLKM’s FWA Subscriber Base – AGR & CAGR ....................... 5 Figure Table 5 TLKM’s Wireless Subscriber Base 2004-2008 ............................................ 6 Figure Table 6 Growth of TLKM’s Wireless Subscriber Base – AGR & CAGR ................. 6 Figure Table 7 TLKM Group’s Subscriber Base 2004-2008 ................................................ 8 Figure Table 8 Growth of TLKM Group’s Subscriber Base – AGR & CAGR ..................... 8 Figure Table 9 ISAT’s Subscriber Base 2004-2008 ........................................................... 10 Figure Table 10 Growth of ISAT’s Subscriber Base – AGR & CAGR ............................... 10 Figure Table 11 ISAT’s FWA Subscriber Base 2004-2008 ................................................ 11 Figure Table 12 Growth of ISAT’s FWA Subscriber Base – AGR & CAGR ..................... 11 Figure Table 13 ISAT’s Wireless Subscriber Base 2004-2008 .......................................... 12 Figure Table 14 Growth of ISAT’s Wireless Subscriber Base – AGR & CAGR ............... 12 Figure Table 15 ISAT Group’s Subscriber Base 2004-2008 .............................................. 14 Figure Table 16 Growth of ISAT Group’s Subscriber Base – AGR & CAGR ................... 14 Figure Table 17 XL’s Subscriber Base 2004-2008 ............................................................. 16 Figure Table 18 Growth of XL’s Subscriber Base – AGR & CAGR .................................. 16 Figure Table 19 BTEL’s Subscriber Base 2004-2008 ........................................................ 17 Figure Table 20 Growth of BTEL’s Subscriber Base – AGR & CAGR ............................. 17 Figure Table 21 M8’s Subscriber Base 2004-2008 ............................................................. 18 Figure Table 22 Growth of M8’s Subscriber Base – AGR & CAGR .................................. 18 Figure Table 23 M8’s Subscriber Base 2004-2008 (FWA & Mobile) ................................. 19 Figure Table 24 Growth of M8’s Subscriber Base – AGR & CAGR (All) .......................... 19 Figure Table 25 HCPT’s Subscriber Base 2004-2008 ........................................................ 21 Figure Table 26 NTS’s Subscriber Base 2004-2008 ........................................................... 22 Figure Table 27 Growth of NTS’s Subscriber Base – AGR & CAGR ................................ 22 Figure Table 28 Smart’s Subscriber Base 2004-2008 ........................................................ 23 Figure Table 29 STI’s Subscriber Base 2004-2008 ............................................................ 24 Figure Table 30 Growth of STI’s Subscriber Base – AGR & CAGR ................................. 24

No
Harewhttp://
ov. 4
Fi
Pt
g
wos.Resear/www.ligar
Fig
igure Tab
10,0020,00030,00040,00050,00060,00070,000
#Subs. 16
AGRCAGR
0.0
10.0
20.0
30.0
40.0
50.0
60.0
Per
cent
age
rch rvirtual.com
gure Tabl
ble 2 Grow
00,0000,0000,0000,0000,0000,000,000
20
20046,290,508
#Su
200549.049.0
S
m/harewos
le 1 TSEL
wth of TS
004 200
200524,269,35
ubscrib
C
5
Subscr
L’s Subsc
SEL’s Sub
05 2006
20053 35,597
ber - T
CAGR
200646.747.8
riber G
Telec
riber Bas
bscriber B
6 2007
067,171 47
Telkom
42%
20034.543.3
Growth
com Custom
Tel
se 2004-20
Base – AG
2008
20077,890,139
msel
753
h
mer Bases –
lkom
008
GR & CAG
8
200865,299,991
200836.441.5
– Part 3
4
msel
GR
1

No
Harewhttp://
ov. 4
Figur
Pt
g
wos.Resear/www.ligar
Figur
re Table 4
2,004,0006,0008,000
10,00012,00014,000
#Subs. 1
AGRCAGR
0.020.040.060.080.0
100.0120.0140.0160.0180.0200.0
Per
cent
age
rch rvirtual.com
re Table 3
4 Growth
00,0000,0000,0000,0000,0000,000,000
20
20041,429,368
#
2005184.2184.2
S
m/harewos
3 TLKM’s
h of TLKM
004 200
20054,061,867
Subsc
522
Subscr
FWA Sub
M’s FWA S
05 2006
2007 4,175
criber
CAGR
20062.8
70.9
riber G
Telec
T
bscriber
Subscrib
6 2007
065,853 6,
- TLKM
R 73%
20052.464.5
Growth
com Custom
Telko
Base 200
er Base –
2008
2007,362,844
M
745
h
mer Bases –
om FW
4-2008
– AGR & C
8
200812,725,425
2008100.072.7
– Part 3
5
WA
CAGR
5

No
Harewhttp://
ov. 4
Figu
wos.Resear/www.ligar
Figure T
ure Table
10,0020,0030,0040,00050,00060,00070,00080,000
#Subs. 17
#
AGRCAG
0.0
10.0
20.0
30.0
40.0
50.0
60.0
70.0
Per
cent
age
rch rvirtual.com
T
Table 5 T
e 6 Growt
000,00000,0000,0000,0000,0000,0000,0000,000
20
20047,719,876
#Subsc
200R 59GR 59
0
0
0
0
0
0
0
0
S
m/harewos
Telk
TLKM’s W
th of TLK
004 200
200528,331,22
criber
CA
05.9.9
Subscr
om G
Wireless S
KM’s WireCAGR
05 2006
20020 39,773
(WireGroup
AGR 4
200640.449.8
riber G
Telec
Grou
Subscribe
eless Sub
6 2007
063,024 54
eless) -p
5%
200736.445.2
Growth
com Custom
p – W
er Base 20
bscriber B
2008
20074,252,983
- TLKM
742
h
mer Bases –
Wirel
004-2008
Base – AG
200878,025,416
M
200843.844.9
– Part 3
6
less
GR &
6

No
Harewhttp://
ov. 4
F
wos.Resear/www.ligar
Figure 1 P
Figure 2
91
200
rch rvirtual.com
Portion o
2 Portion
Wirel
1.9
04E
TLKM
m/harewos
of TLKM’s
of TLKM
FWA16%
TLKless Su
85.7
2005E
M Cell
s Cellular
M’s Cellula
A%
KM Grubs. C2008E
89.5
2006E
lular P
Telec
r & FWA
ar Subscr
Cellular84%
roupompos
E
88.3
2007E
Portio
com Custom
Subscrib
ribers (20
sition
83
E 200
n (%)
mer Bases –
bers 2008E
004-2008)
3.7
08E
– Part 3
7
E

No
Harewhttp://
ov. 4
Fig
wos.Resear/www.ligar
Figure
gure Tab
10,0020,0030,00040,00050,00060,00070,00080,00090,000
#Subs. 2
AGCA
11223344
Per
cent
age
rch rvirtual.com
e Table 7
le 8 Grow
000,0000,0000,0000,0000,0000,0000,0000,000,000
20
200426,282,104
#Sub
2GR 4AGR 4
0.05.00.05.0
20.025.030.035.040.045.0
S
m/harewos
TLKM Gr
wth of TL
004 200
200537,019,88
bscribe
C
00540.940.9
Subscr
Tel
roup’s Su
LKM GrouCAGR
05 2006
20081 48,484
er - TL
CAGR
200631.035.8
riber G
Telec
lkom
ubscriber
up’s Subs
6 2007
064,735 62,
LKM G
35%
200729.833.8
Growth
com Custom
m Gro
r Base 200
criber Ba
2008
2007,940,264
Group
233
h
mer Bases –
oup -
04-2008
ase – AGR
200886,657,499
200837.734.8
– Part 3
8
All
R &

No
Harewhttp://
ov. 4
Figu
Fig
wos.Resear/www.ligar
ure 3 Por
gure 4 Por
62
5.
200
rch rvirtual.com
rtion of T
rtion of T
Sub
.0
4
04E 2
TLK
m/harewos
TLKM’s C
TLKM’s C
FWA15%
TLKbscribe
65.6
11.0
2005E
KM SuC
ellular, F2008E
Cellular &
PST10
Cell75
A%
KM Grer Com2008E
73.4
8.6
2006E
ubs. PoCellular
Telec
FWA & FW
& FWA Su
TN0%
lular5%
roupmposit
E
76.1
10.1
2007E
ortion FWA
com Custom
WL/PSTN
ubscriber
tion
7
1
E 20
(%)
mer Bases –
N Subscrib
s (2004-20
75.4
14.7
008E
– Part 3
9
bers
008)
No
Harewhttp://
ov. 4
Fig
Pt
g
wos.Resear/www.ligar
Fig
gure Tab
5,0010,00015,00020,00025,00030,00035,00040,000
#Subs. 9
AGRCAGR
0.0
10.0
20.0
30.0
40.0
50.0
60.0
Per
cent
age
rch rvirtual.com
gure Tab
ble 10 Gro
00,0000,0000,0000,0000,0000,0000,000,000
20
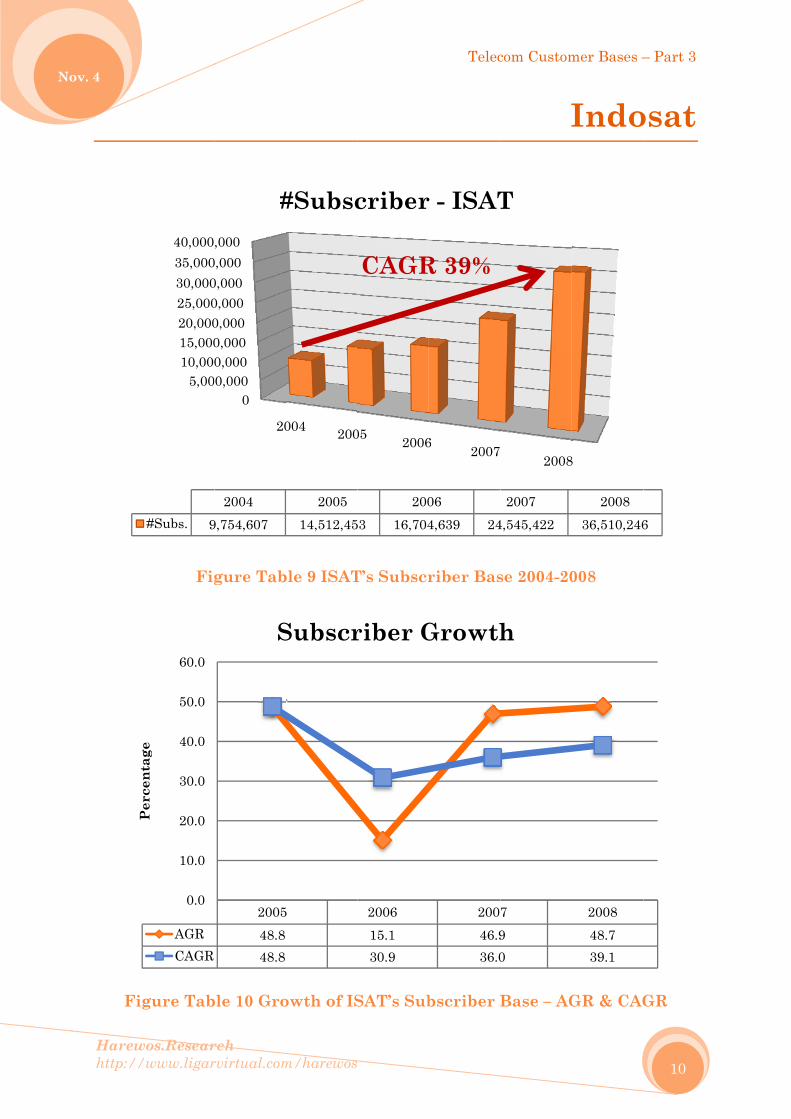
20049,754,607
#
200548.848.8
S
m/harewos
ble 9 ISAT
owth of IS
004 200
200514,512,45
#Subsc
5
Subscr
T’s Subscr
SAT’s Sub
05 2006
20053 16,704
criber
CAGR
200615.130.9
riber G
Telec
riber Bas
bscriber B
6 2007
064,639 24
r - ISAT
R 39%
20046.936.0
Growth
com Custom
I
se 2004-20
Base – AG
2008
20074,545,422
T
790
h
mer Bases –
Indo
008
GR & CAG
8
200836,510,246
200848.739.1
– Part 3
10
osat
GR
6
No
Harewhttp://
ov. 4
Figur
Pt
g
wos.Resear/www.ligar
Figur
re Table
100,0200,0300,0400,0500,00600,00700,00800,00
#Subs.
AGRCAGR
0.0
50.0
100.0
150.0
200.0
250.0
300.0
350.0
Per
cent
age
rch rvirtual.com
re Table 1
12 Growt
00000000000000000000
2004
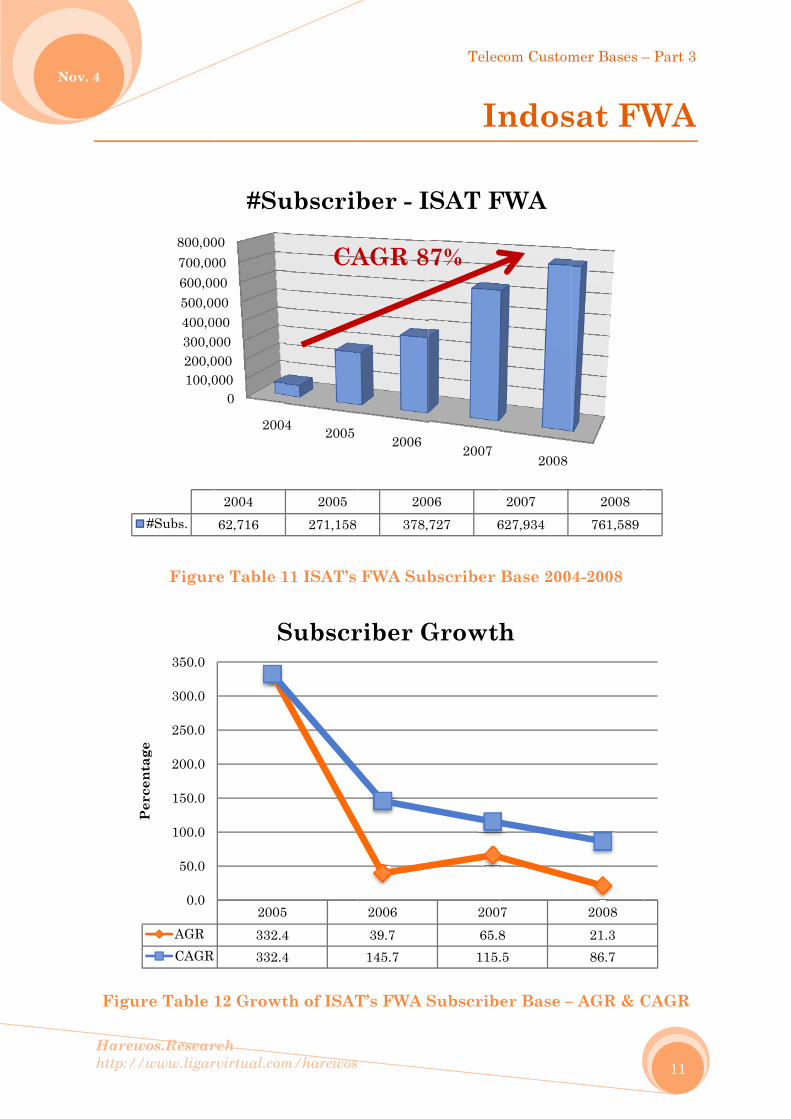
200462,716
#Su
2005332.4332.4
S
m/harewos
11 ISAT’s
th of ISAT
4 2005
2005271,158
ubscrib
CA
544
Subscr
FWA Sub
T’s FWA S
2006
200378,
ber - I
AGR 8
200639.7145.7
riber G
Telec
In
bscriber
Subscribe
2007
06727 6
SAT F
7%
20065.8115.
Growth
com Custom
ndos
Base 200
er Base –
2008
2007627,934
FWA
78.5
h
mer Bases –
sat FW
4-2008
– AGR & C
2008761,589
200821.386.7
– Part 3
11
WA
CAGR
No
Harewhttp://
ov. 4
Figu
wos.Resear/www.ligar
Figure
ure Table
5,0010,0015,0020,0025,0030,0035,0040,000
#Subs. 9
AGRCAGR
0.0
10.0
20.0
30.0
40.0
50.0
60.0
Per
cent
age
rch rvirtual.com
Table 13
e 14 Grow
000,00000,00000,00000,00000,0000,0000,0000,000
2
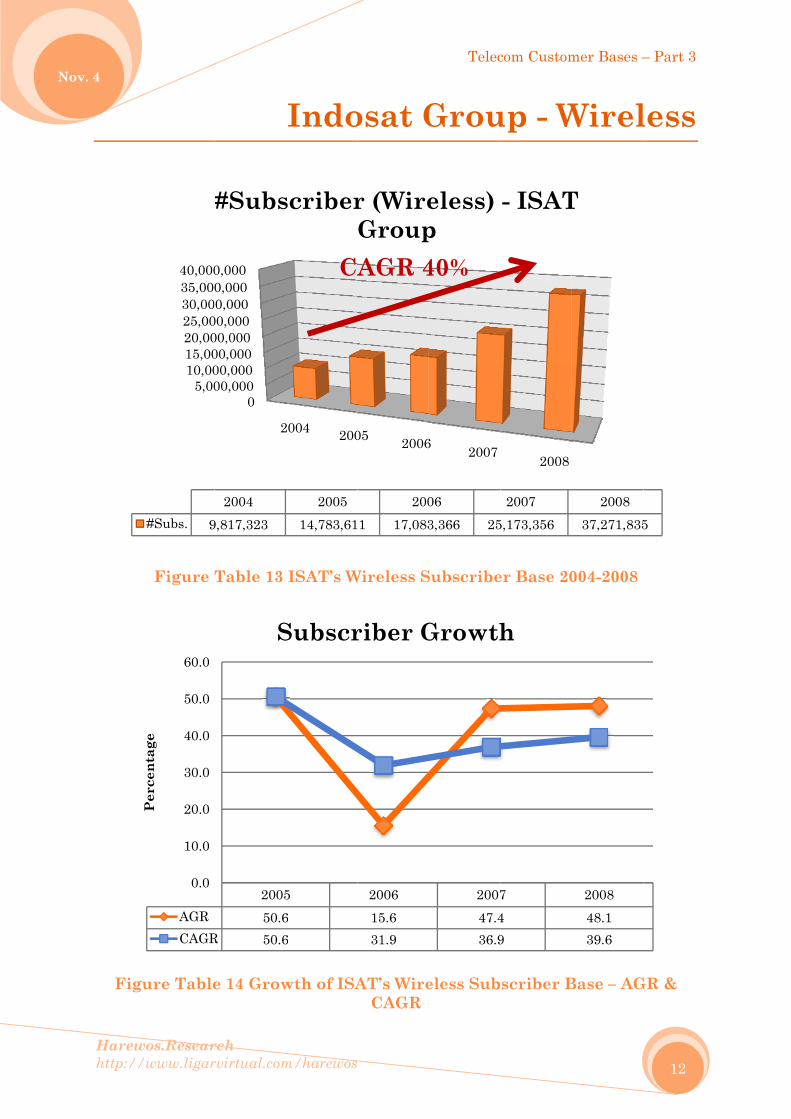
20049,817,323
#Subs
200550.6
R 50.6
S
m/harewos
Indo
ISAT’s W
wth of ISA
2004 200
200514,783,61
scriber
CA
566
Subscr
osat G
Wireless S
AT’s WireCAGR
05 2006
2001 17,083
r (WireGroupAGR 4
200615.631.9
riber G
Telec
Grou
Subscribe
eless Sub
6 2007
063,366 25
eless) p40%
200747.436.9
Growth
com Custom
up - W
er Base 20
scriber B
2008
20075,173,356
- ISAT
749
h
mer Bases –
Wirel
004-2008
Base – AG
200837,271,835
T
200848.139.6
– Part 3
12
less
GR &
5

No
Harewhttp://
ov. 4
Figu
wos.Resear/www.ligar
Figure 5
ure 6 Por
99
200
rch rvirtual.com
Portion o
tion of IS
Wirel
9.4
04E
ISAT
m/harewos
of ISAT’s
SAT’s Cel
ISAless Su
98.2
2005E
T Cellu
s Cellular
llular Sub
Cellu98%
FWA2%
AT Groubs. C2008E
97.8
2006E
ular P
Telec
r & FWA S
bscribers
ular%
oupompos
E
97.5
2007E
Portion
com Custom
Subscribe
s (2004-20
sition
98
E 200
n (%)
mer Bases –
ers 2008E
08) - Wire
8.0
08E
– Part 3
13
E
eless
No
Harewhttp://
ov. 4
Fig
wos.Resear/www.ligar
Figure
gure Tab
5,0010,0015,0020,0025,0030,00035,00040,000
#Subs.
AGRCAG
0.0
10.0
20.0
30.0
40.0
50.0
60.0
Per
cent
age
rch rvirtual.com
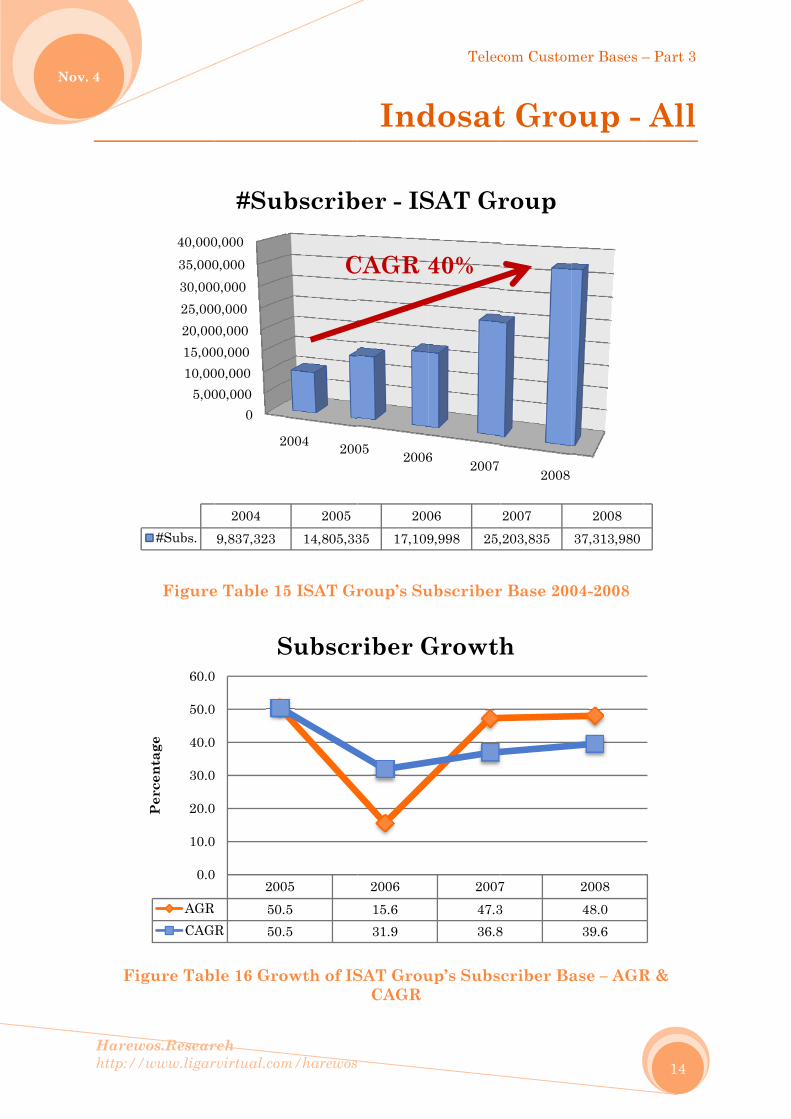
e Table 15
le 16 Gro
000,00000,00000,00000,0000,0000,0000,0000,000
2
20049,837,323
#Sub
20050.
R 50.
0
0
0
0
0
0
0
S
m/harewos
5 ISAT Gr
owth of IS
2004 200
200514,805,33
bscrib
C
0555
Subscr
Ind
roup’s Su
SAT GrouCAGR
05 2006
20035 17,109
ber - IS
CAGR 4
200615.631.9
riber G
Telec
dosat
ubscriber
up’s Subs
6 2007
069,998 25,
SAT Gr
40%
200747.336.8
Growth
com Custom
t Gro
r Base 200
criber Ba
2008
2007,203,835
roup
738
h
mer Bases –
oup -
04-2008
ase – AGR
200837,313,980
200848.039.6
– Part 3
14
All
R &

No
Harewhttp://
ov. 4
Figu
F
wos.Resear/www.ligar
ure 7 Por
Figure 8 P
99
200
rch rvirtual.com
rtion of T
Portion o
Sub
9.2
04E
C
m/harewos
TLKM’s C
f ISAT’s C
F2
ISAbscribe
98.0
2005E
ISACellula
ellular, F
Cellular S
PSTN0.11%
Cellu97.8
FWA2.04%
AT Groer Com2008E
97.6
2006E
AT Groar Port
Telec
FWA & FW
Subscribe
N%
ular5%
oupmposit
E
97.4
2007E
ouption (%
com Custom
WL Subsc
ers (2004
tion
97
E 200
%)
mer Bases –
cribers 20
-2008) - A
7.8
08E
– Part 3
15
008E
All

No
Harewhttp://
ov. 4
F
Pt
g
wos.Resear/www.ligar
Fi
Figure Ta
5,00
10,000
15,000
20,000
25,000
30,000
#Subs. 3
AGRCAGR
0.0
10.0
20.0
30.0
40.0
50.0
60.0
70.0
80.0
90.0
Per
cent
age
rch rvirtual.com
igure Tab
ble 18 Gr
0
0,000
0,000
0,000
0,000
0,000
,000
20
20043,791,000
200584.184.1
S
m/harewos
ble 17 XL
rowth of X
004 200
20056,978,519
#Subs
C
5
Subscr
’s Subscr
XL’s Subs
05 2006
2009 9,527
scribe
CAGR
200636.558.5
riber G
Telec
Ex
riber Base
scriber B
6 2007
067,970 15
er - XL
62%
20062.459.8
Growth
com Custom
xcelc
e 2004-20
Base – AG
2008
20075,469,000
748
h
mer Bases –
omin
008
R & CAG
8
200826,015,517
200868.261.9
– Part 3
16
ndo
GR
7

No
Harewhttp://
ov. 4
Fig
Pt
g
wos.Resear/www.ligar
Fig
gure Tabl
1,0002,0003,0004,000,5,000,6,000,7,000,08,000,0
#Subs.
AGRCAGR
0.0
50.0
100.0
150.0
200.0
250.0
Per
cent
age
rch rvirtual.com
gure Tabl
le 20 Gro
00,0000,000,000,000000000000000
20
2004192,029
#
2005153.4153.4
S
m/harewos
e 19 BTE
wth of BT
04 2005
2005486,604
#Subsc
C
544
Subscr
L’s Subsc
TEL’s Su
5 2006
2001,547
criber
CAGR
2006218.0183.9
riber G
Telec
Bak
criber Ba
bscriber
2007
067,557 3,
- BTE
148%
200146.171.
Growth
com Custom
krie T
ase 2004-2
Base – AG
2008
2007,820,701
L
7.9.0
h
mer Bases –
Telec
2008
GR & CA
20087,304,543
200891.2148.3
– Part 3
17
com
AGR
3

No
Harewhttp://
ov. 4
F
Pt
g
wos.Resear/www.ligar
Fi
Figure Tab
5001,0001,500,2,000,2,500,3,000,03,500,0
#Subs.
#S
AGRCAGR
-20.0
0.0
20.0
40.0
60.0
80.0
100.0
120.0
140.0
Per
cent
age
rch rvirtual.com
igure Tab
ble 22 Gr
00,000,000,000,000000000000
20
2004414,300
Subscr
200591.991.9
Cellu
m/harewos
ble 21 M8
rowth of M
04 2005
2005794,900
riber (
CA
5
ular Su
8’s Subscr
M8’s Subs
5 2006
2001,825
(Cellul
AGR 5
2006129.7109.9
ubscrib
Telec
riber Bas
scriber B
2007
065,900 3,
lar) - M
59%
20065.093.7
ber Gr
com Custom
M
e 2004-20
Base – AG
2008
2007,012,800
Mobile
707
rowth
mer Bases –
Mobil
008
GR & CAG
20082,671,900
e 8
2008-11.359.4
– Part 3
18
le-8
GR
0

No
Harewhttp://
ov. 4
F
Figu
wos.Resear/www.ligar
igure Tab
ure Table
500
1,000
1,500,
2,000,
2,500,
3,000,0
3,500,0
#Subs.
AGRCAGR
-20.0
0.0
20.0
40.0
60.0
80.0
100.0
120.0
140.0
Per
cent
age
rch rvirtual.com
ble 23 M8
e 24 Grow
0
0,000
,000
,000
000
000
000
000
200
2004414,300
#S
200591.9
R 91.9
S
m/harewos
8’s Subscr
wth of M8
04 2005
2005794,900
Subscr
CA
599
Subscr
riber Bas
8’s Subscr
5 2006
2000 1,825
iber -
AGR 6
2006129.7109.9
riber G
Telec
M
se 2004-20
riber Bas
2007
065,900 3,0
Mobil
64%
200765.093.7
Growth
com Custom
Mobil
008 (FWA
se – AGR &
2008
2007012,800
e 8
707
h
mer Bases –
le-8 -
A & Mobil
& CAGR
20083,004,400
2008-0.364.1
– Part 3
19
All
le)
(All)

No
Harewhttp://
ov. 4
wos.Resear/www.ligar
Figure 9
Figure
S
10
200
rch rvirtual.com
9 Portion
10 Portio
Subscr
0.0
04E
C
m/harewos
n of M8’s C
on of M8’
F11
Mriber C
100.0
2005E
MCellula
Cellular &
s Cellular
Cellu88.9
FWA.07%
Mobile Compo
100.0
2006E
Mobile ar Port
Telec
& FWA Su
r Subscri
ular93%
8osition
100.0
2007E
8tion (%
com Custom
ubscribe
ibers (200
n 2008E
0
88
E 200
%)
mer Bases –
rs 2008E
04-2008)
E
8.9
08E
– Part 3
20

No
Harewhttp://
ov. 4
wos.Resear/www.ligar
Fig
1,
2,0
3,0
4,0
5,0
#Subs.
rch rvirtual.com
ure Table
0
000,000
000,000
000,000
000,000
000,000
.
#
m/harewos
e 25 HCP
2007
20072,039,406
Subsc
PT’s Subsc
criber
121%
Telec
criber Ba
2008
- Hutc
%
com Custom
ase 2004-2
20084,500,609
ch
mer Bases –
HC
2008
– Part 3
21
CPT

No
Harewhttp://
ov. 4
Fi
Pt
g
wos.Resear/www.ligar
Fig
igure Tab
51,01,52,02,53,00
3,50
#Subs.
AGRCAGR
-10000.0
0.0
10000.0
20000.0
30000.0
40000.0
50000.0
60000.0
70000.0
80000.0
Per
cent
age
rch rvirtual.com
gure Tab
ble 27 Gro
0500,000000,000500,000000,00000,00000,000
00,000
2005. 21,537
#
2-
R -
S
m/harewos
le 26 NTS
owth of N
2005
7 1
#Subs
C
2006-41.0-41.0
Subscr
S’s Subsc
NTS’s Sub
2006
200612,715
criber
CAGR 4
2--
riber G
Telec
riber Bas
bscriber B
2007
20074,788
r - NTS
432%
2007-62.3-52.8
Growth
com Custom
se 2004-20
Base – AG
2008
23,2
S
267
4
h
mer Bases –
N
008
GR & CAG
200834,800
20087460.6431.6
– Part 3
22
NTS
GR

No
Harewhttp://
ov. 4
wos.Resear/www.ligar
Figu
68
1,01,21,41,6
#Subs.
rch rvirtual.com
ure Table
0200,000400,000600,000800,000000,000200,000400,000600,000
.
#Subs
m/harewos
e 28 Smar
2007
2007115,000
scriber
1
rt’s Subsc
r - Sm
1231%
Telec
Sma
criber Ba
2008
art Te
com Custom
art T
ase 2004-2
20081,530,823
elecom
mer Bases –
Telec
2008
m
– Part 3
23
com
No
Harewhttp://
ov. 4
Fi
Pt
g
wos.Resear/www.ligar
Fi
igure Tab
10203040500600700800
#Subs.
AGRCAGR
0.0
200.0
400.0
600.0
800.0
1000.0
1200.0
1400.0
Per
cent
age
rch rvirtual.com
gure Tab
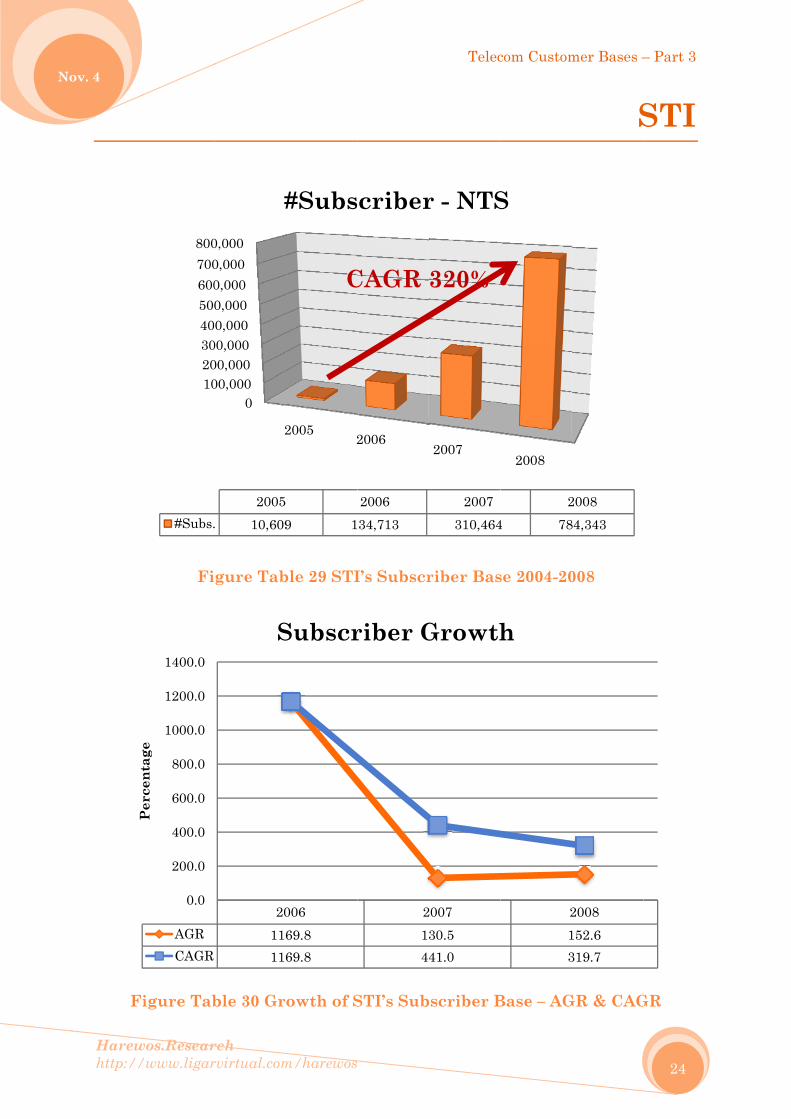
ble 30 Gr
000,00000,00000,0000,0000,0000,0000,0000,000
2
2005. 10,609
#
20116116
S
m/harewos
ble 29 STI
owth of S
2005 2
9 1
#Subs
C
00669.869.8
Subscr
I’s Subscr
STI’s Sub
2006
200634,713
criber
CAGR
2144
riber G
Telec
riber Bas
bscriber B
2007
2007310,464
r - NTS
320%
200730.541.0
Growth
com Custom
se 2004-20
Base – AG
2008
24 78
S
213
h
mer Bases –
S
008
GR & CAG
200884,343
2008152.6319.7
– Part 3
24
STI
GR

Telecom Customer Bases – Part 3
Harewos.Research http://www.ligarvirtual.com/harewos
Nov. 4
25
Abbreviations & Notes
AGR Annual Growth Rate
CAGR Compound Annual Growth Rate
2008E At the end of year 2008
FWL Fixed WireLine
PSTN
Public Switched Telephone Network
FWA Fixed Wireless Access
TLKM
PT. Telekomunikasi Indonesia / PT. Telkom Indonesia
ISAT
PT. Indosat
XL
PT. Excelcomindo Pratama
M-8/M8
PT. Mobile-8
BTEL
PT. Bakrie Telecom
TSEL
PT. Telekomunikasi Selular (Telkomsel)
HCPT
PT. Hutchison CP Telecommunication
NTS
PT. Natrindo Telepon Selular
STI
PT. Sampoerna Telekomunikasi Indonesia
Smart
PT. Smart Telecom
Related Documents