HAL Id: tel-00194610 https://tel.archives-ouvertes.fr/tel-00194610 Submitted on 6 Dec 2007 HAL is a multi-disciplinary open access archive for the deposit and dissemination of sci- entific research documents, whether they are pub- lished or not. The documents may come from teaching and research institutions in France or abroad, or from public or private research centers. L’archive ouverte pluridisciplinaire HAL, est destinée au dépôt et à la diffusion de documents scientifiques de niveau recherche, publiés ou non, émanant des établissements d’enseignement et de recherche français ou étrangers, des laboratoires publics ou privés. Heavy alkali-metal intercalated fullerenes under high pressure and high temperature conditions: Rb6C60 and Cs6C60 Roberta Poloni To cite this version: Roberta Poloni. Heavy alkali-metal intercalated fullerenes under high pressure and high temperature conditions: Rb6C60 and Cs6C60. Physics [physics]. Université Claude Bernard - Lyon I, 2007. English. <tel-00194610>

Welcome message from author
This document is posted to help you gain knowledge. Please leave a comment to let me know what you think about it! Share it to your friends and learn new things together.
Transcript

HAL Id: tel-00194610https://tel.archives-ouvertes.fr/tel-00194610
Submitted on 6 Dec 2007
HAL is a multi-disciplinary open accessarchive for the deposit and dissemination of sci-entific research documents, whether they are pub-lished or not. The documents may come fromteaching and research institutions in France orabroad, or from public or private research centers.
L’archive ouverte pluridisciplinaire HAL, estdestinée au dépôt et à la diffusion de documentsscientifiques de niveau recherche, publiés ou non,émanant des établissements d’enseignement et derecherche français ou étrangers, des laboratoirespublics ou privés.
Heavy alkali-metal intercalated fullerenes under highpressure and high temperature conditions: Rb6C60 and
Cs6C60Roberta Poloni
To cite this version:Roberta Poloni. Heavy alkali-metal intercalated fullerenes under high pressure and high temperatureconditions: Rb6C60 and Cs6C60. Physics [physics]. Université Claude Bernard - Lyon I, 2007.English. <tel-00194610>

No d’ordre 214–2007 Annee 2007
THESE
presentee
devant l’UNIVERSITE CLAUDE BERNARD - LYON 1
pour l’obtention
du DIPLOME DE DOCTORAT
arrete du 7 aout 2006
presentee et soutenue publiquement le
31 Octobre 2007
par
Roberta POLONI
TITRE:
Heavy alkali metal-intercalated fullerenes underhigh pressure and high temperature conditions:
Rb6C60 and Cs6C60
Directeur de these
Prof. Alfonso SAN MIGUEL
JURY: Pascale Launois Rapporteur
Bertil Sundqvist Rapporteur
Xavier Blase President
Marco Saitta Examinateur
Kosmas Prassides Examinateur
Alfonso San Miguel Directeur
Sakura Pascarelli Codirecteur

2

Contents
Introduction i
1 The C60 fullerene and the heavy alkali metal-intercalated fullerenes 1
1.1 Motivation . . . . . . . . . . . . . . . . . . . . . . . . . . . . . . . . . . . . 1
1.2 The C60 fullerene . . . . . . . . . . . . . . . . . . . . . . . . . . . . . . . . . 4
1.2.1 Generalities . . . . . . . . . . . . . . . . . . . . . . . . . . . . . . . . 4
1.2.2 Electronic structure . . . . . . . . . . . . . . . . . . . . . . . . . . . 5
1.2.3 Molecular vibrations . . . . . . . . . . . . . . . . . . . . . . . . . . . 7
1.3 The C60 phase diagram . . . . . . . . . . . . . . . . . . . . . . . . . . . . . 8
1.3.1 Low-temperature and low-pressure phases . . . . . . . . . . . . . . . 8
1.3.2 High-temperature and high-pressure phases . . . . . . . . . . . . . . 9
1.4 Alkali metal-intercalated fullerenes . . . . . . . . . . . . . . . . . . . . . . . 12
1.4.1 The Rb6C60 and Cs6C60 systems . . . . . . . . . . . . . . . . . . . . 14
2 Methods 19
2.1 X-ray absorption spectroscopy . . . . . . . . . . . . . . . . . . . . . . . . . . 19
2.2 X-ray powder diffraction . . . . . . . . . . . . . . . . . . . . . . . . . . . . . 23
2.3 Raman spectroscopy . . . . . . . . . . . . . . . . . . . . . . . . . . . . . . . 25
2.4 Simulations . . . . . . . . . . . . . . . . . . . . . . . . . . . . . . . . . . . . 27
2.4.1 Ab initio DFT calculations . . . . . . . . . . . . . . . . . . . . . . . 27
2.4.2 The SIESTA code . . . . . . . . . . . . . . . . . . . . . . . . . . . . 30
3 Experimental set-up 35
3.1 High pressure experimental methods . . . . . . . . . . . . . . . . . . . . . . 35
3.1.1 Large volume Paris-Edinburgh press . . . . . . . . . . . . . . . . . . 35
3.1.2 Diamond anvil cells . . . . . . . . . . . . . . . . . . . . . . . . . . . 39
3.2 Experimental apparata . . . . . . . . . . . . . . . . . . . . . . . . . . . . . . 43
3.2.1 Beamline BM29 - ESRF . . . . . . . . . . . . . . . . . . . . . . . . . 44

4 CONTENTS
3.2.2 Beamline ID24 - ESRF . . . . . . . . . . . . . . . . . . . . . . . . . 45
3.2.3 Beamline ID27 - ESRF . . . . . . . . . . . . . . . . . . . . . . . . . 47
3.2.4 Raman spectrometer - ENS-Lyon (Univ. Lyon 1) . . . . . . . . . . . 47
4 Pressure induced distortion of the C60 molecule in Rb6C60 and Cs6C60 49
4.1 Introduction . . . . . . . . . . . . . . . . . . . . . . . . . . . . . . . . . . . . 49
4.2 Experimental details . . . . . . . . . . . . . . . . . . . . . . . . . . . . . . . 50
4.3 XRD measurements . . . . . . . . . . . . . . . . . . . . . . . . . . . . . . . 51
4.4 XAS measurements . . . . . . . . . . . . . . . . . . . . . . . . . . . . . . . . 55
4.5 Ab initio DFT results . . . . . . . . . . . . . . . . . . . . . . . . . . . . . . 59
4.6 Discussion . . . . . . . . . . . . . . . . . . . . . . . . . . . . . . . . . . . . . 63
5 High pressure stability of C60 molecules by alkali metal doping in Cs6C60 69
5.1 Introduction . . . . . . . . . . . . . . . . . . . . . . . . . . . . . . . . . . . . 69
5.2 Experimental details . . . . . . . . . . . . . . . . . . . . . . . . . . . . . . . 70
5.3 Raman measurements . . . . . . . . . . . . . . . . . . . . . . . . . . . . . . 70
5.4 Raman spectra calculation . . . . . . . . . . . . . . . . . . . . . . . . . . . . 76
6 High pressure phase transition in Rb6C60 81
6.1 Introduction . . . . . . . . . . . . . . . . . . . . . . . . . . . . . . . . . . . . 81
6.2 Experimental details . . . . . . . . . . . . . . . . . . . . . . . . . . . . . . . 82
6.3 XRD measurements . . . . . . . . . . . . . . . . . . . . . . . . . . . . . . . 83
6.4 XAS measurements . . . . . . . . . . . . . . . . . . . . . . . . . . . . . . . . 85
6.5 Raman measurements . . . . . . . . . . . . . . . . . . . . . . . . . . . . . . 87
6.6 Discussion . . . . . . . . . . . . . . . . . . . . . . . . . . . . . . . . . . . . . 90
7 Structural and electronic evolution with pressure of Rb6C60 and Cs6C60
from first principles 95
7.1 Introduction . . . . . . . . . . . . . . . . . . . . . . . . . . . . . . . . . . . . 95
7.2 Ab initio DFT results . . . . . . . . . . . . . . . . . . . . . . . . . . . . . . 96
7.2.1 Structural evolution under pressure . . . . . . . . . . . . . . . . . . . 96
7.2.2 Electronic evolution under pressure . . . . . . . . . . . . . . . . . . . 99
7.3 Discussion . . . . . . . . . . . . . . . . . . . . . . . . . . . . . . . . . . . . . 106
8 Role of charge transfer on fullerene polymerization 109
8.1 Introduction . . . . . . . . . . . . . . . . . . . . . . . . . . . . . . . . . . . . 109
8.2 XRD measurements . . . . . . . . . . . . . . . . . . . . . . . . . . . . . . . 110

CONTENTS 5
8.3 Raman measurements . . . . . . . . . . . . . . . . . . . . . . . . . . . . . . 113
8.3.1 Discussion . . . . . . . . . . . . . . . . . . . . . . . . . . . . . . . . . 115
8.4 Ab initio DFT results . . . . . . . . . . . . . . . . . . . . . . . . . . . . . . 117
8.4.1 Neutral systems . . . . . . . . . . . . . . . . . . . . . . . . . . . . . 119
8.4.2 Charged systems . . . . . . . . . . . . . . . . . . . . . . . . . . . . . 121
8.4.3 Discussion . . . . . . . . . . . . . . . . . . . . . . . . . . . . . . . . . 123
Conclusions 125
Acknowledgements 131
Appendix A 133
Appendix B 137
151

6 CONTENTS

Introduction
The identification of the C60 molecule by Kroto et al. [1] and the invention of a method
of isolation of bulk quantities by Kratschmer et al. [2], have led to intense studies of the
resulting materials. The similarity of the C60 structure with the geodesic domes of R.
Buckminster Fuller [3] has given rise to the name fullerenes for the Cn molecules and to
buckminsterfullerene or buckyball to the C60 molecule in particular.
Very soon, Haddon et al. [4] found that the intercalation of alkali metal atoms in solid
C60 led to metallic behavior. Subsequently, in the last two decades, many experimen-
tal and theoretical studies followed in order to fully characterize and compare the solid
C60 with its different compounds. In particular, many of these materials have attracted
much attention due to the great variety of physical properties observed in these systems
at both ambient and extreme conditions. We underline two of these properties with a
potential wide range of applications in the everyday life. These are, the extremely high
“hardness” (around 200–300 GPa) of three-dimensional (3D) polymerized-C60 structures
obtained at high pressure (HP) and high temperature conditions (HT) [5] and secondly,
the relative high superconducting critical temperature found in various fullerides with the
M3C60 stoichiometry [6, 7, 8] (for Cs3C60 Tc=40 K).
The synthesis of new materials, displaying both high hardness and superconducting
properties was the initial motivation of my thesis, as explained in more detail in chapter
1. Such materials consist of 3D C60 polymers obtained in presence of alkali metal atoms.
In the majority of the cases, the C60 polymerization consists of a [2+2] cycloaddition,
meaning that two double bonds of two neighbouring molecules break up in order to form
two different σ bonds between the molecules. In the so formed “four membered ring”
(i.e. the connection ring between two molecules including four carbon atoms) each carbon
atom is covalently bonded to four other carbon atoms through sp3 hybridized bondings.
In this study we coupled the presence of heavy alkali ions [9, 10], whose pressure
behaviour has been observed to favour the sp2 → sp3 transition, with the application
of HP and HT conditions in order to synthesize three-dimensional (3D) polymerized C60
ii Introduction
structures starting from the body-centered cubic Rb6C60 and Cs6C60 systems.
These new materials, consisting of 3D polymerized C60 molecules connected through
small carbon nanocages having partial sp3 character, are expected to exhibit a high
electron-phonon coupling parameter which could lead to superconductors with critical
temperature exceeding 200 Kelvin [11, 12, 13].
Nevertheless, as in most experimental PhD theses, our initial aim was frustrated by
several technical problems and also by some unexpected results. In order to clarify this,
in the following I want to briefly present the history of my thesis. From the beginning, we
had to face different experimental problems concerning the synthesis of the samples and
their high reactivity. In particular, we soon realized that the synthesis of the Rb6C60 and
Cs6C60 compounds was a difficult task. The appendix A of this thesis briefly mentions
the procedure that we followed for the sample synthesis and how we finally managed to
obtain pure compounds.
Subsequently, due to the extremely high sensitivity of the M6C60 fullerides to air and
humidity, their manipulation was done in inert atmosphere making the preparation of the
high pressure cell containing the sample, for x-ray measurements (discussed in chapter 3)
extremely difficult. In addition, during the experiments, in many cases the measurements
showed that the contamination of the sample occurred either during the sample loading
or during the transport of the cell from the glove box to the high pressure cell, adding
more complications to the experiments.
Then, after the first studies performed under extreme conditions, we soon realized
that our purpose, i.e. the synthesis of 3D C60 polymers, was difficult to achieve. On the
contrary, we observed that the two systems exhibit a wide pressure range of stability, more
than twice as large as the stability range of the non-intercalated solid C60. After several
x-ray studies, we concluded that the presence of heavy alkali metal atoms and hence, of
charge transfer from the Rb and Cs atoms to the molecules, should be responsible for such
pressure stabilization of the fullerenes and therefore of the solid structure.
Moreover, it soon turned out that the pressure evolution of the two systems presented
slightly different features. For instance, Raman experiments performed at room tempera-
ture, showed a continuous evolution of the Raman modes up to 45 GPa in Cs6C60, while
a reversible Raman transition was observed at around 35 GPa in Rb6C60.
For these reasons we decided to perform ab initio calculations in order to better un-
derstand the different structural evolutions of the two systems and the stability of both
compounds under pressure. Moreover, we expected to clarify the importance of the pres-
ence of the alkali metal atoms in such systems and in particular the implication of the

iii
presence of ionic interactions on the pressure evolution and stability of the C60 molecules.
We performed x-ray absorption spectroscopy (XAS), x-ray diffraction (XRD) and Ra-
man spectroscopy measurements on the two systems in a wide range of pressure and
temperature in order to check for the occurrence of phase transitions leading to the for-
mation of high-dimensional polymers. In addition, ab initio calculations were performed
in order to better understand the results obtained from the experiments.
The XAS and XRD data have been collected at the ESRF (European Synchrotron
Radiation Facility, Grenoble) and the Raman scattering data have been collected at “Lab-
oratoire de Science de La Terre” at the ENS (Ecole Normale Superieure, Lyon). The ab
initio DFT calculations have been performed in collaboration with the CECAM (Centre
Europeen de Calcul Atomique et Moleculaire).

iv Introduction
Chapter 1
The C60 fullerene and the heavy
alkali metal-intercalated fullerenes
This chapter firstly presents the motivation for this work and then describes the main
properties of the isolated C60 molecule and of its solid structures, including fullerite (solid
C60) and alkali fullerides (alkali metal-intercalated fullerenes). Many article and book
reviews about fullerenes nowadays exist and it would be a hard task to mention all of
them. Nevertheless, the references [14, 15, 16, 17, 18, 19, 20] have been particulary useful
and helpful during my thesis work and finally for the writing of this chapter.
1.1 Motivation
This thesis work was primarly motivated by the discovery of superconducting properties in
the group-IV based materials (see Figure 1.1). The superconductivity in graphite interca-
lated compounds has been known for decades [21, 22, 23] but these systems were found to
exhibit a very low critical temperature, around 1K. Subsequently, the investigation aimed
at the discovery of new high superconducting critical temperature materials has attracted
much attention due to their wide range of potential applications in the everyday life.
Carbon-based materials showed a greater variety of systems with superconducting
properties. Shortly after the discovery that intercalation of alkali-metal atoms in solid
C60 leads to metallic behavior [4], the M3C60 (with M alkali metal) compounds where
observed to be superconducting. An exhaustive review on the superconducting fullerenes
can be found in Ref. [8]. In particular, the critical temperature was measured to be 33
K for RbCs2C60 [6] and 40 K for Cs3C60 [7]. Additionally, more recently, both B-doped
diamond [24] and graphite intercalated compounds like C6Yb and C6Ca were observed to

2 The C60 fullerene and the heavy alkali metal-intercalated fullerenes
a) b) c)
Figure 1.1: Schematic view of three different column-IV based materials showing supercon-
ducting properties: a) the Ba8Si46 silicon intercalated clathrates; b) the A3C60 fullerides
and c) the graphite intercalated compounds like C6Ca.
be superconducting with transition temperature of 4 K, 6.5 K and 11.5 K [25], respectively.
Very soon, the discovery of superconductivity in such nanostructured carbon systems
motivated the investigation of the superconductivity on intercalated silicon clathrates
which constitute nanocage-based materials. The maximum measured critical temperature
on these systems is 8K, obtained in the Ba8Si46 compound [26].
Subsequently, many theoretical studies were performed in order to explain the mech-
anism responsible for superconductivity in all these systems [11, 12, 27]. In the majority
of the cases, the presence of a high transition temperature was understood, according
to the BCS theory, in terms of strong electron-phonon interactions. This theory (whose
name derives from its developers Bardeen, Cooper and Schrieffer) interprets the super-
conductivity as a macroscopic quantum mechanical effect. It proposes the formation of
Cooper pairs, i.e. paired electrons with opposite spin, whose attraction is mediated by
the lattice distortion (phonon). The Cooper pairs are thus responsible for carrying the
supercurrent. The McMillan formula for the superconducting critical temperature within
the BCS theory is :
Tc ∝ (hωph)exp( −1
N(εF )V
)
= (hωph)exp(
− 1
λ
)
(1.1)
where ωph is the average intramolecular phonon frequency, V is the electron-phonon in-
teraction potential andN(εF ) is the density of states at the Fermi energy. The λ = N(εF )V
parameter is known as the electron-phonon coupling parameter. Hence, by increasing ei-
ther V or N(εF ) Tc also increases.

1.1 Motivation 3
In Ref. [11], Connetable et al. showed that the superconductivity is an intrinsic prop-
erty of the sp3 silicon network and that carbon clathrates are predicted to yield large
critical temperatures with an effective electron-phonon interaction 10 times larger than
in the superconducting A3C60 systems. A previous study performed by Breda et al. [13]
showed that the electron-phonon coupling parameter λ increases for small fullerenes and
the smaller the fullerene, the higher is the critical temperature. In the particular case
of the fullerene C28 they demonstrated that the superconducting critical temperature for
C28-based systems is expected to be around 8 times higher than in the A3C60 fullerides
(Tc(C28)=8Tc(C60)) leading to very high critical temperatures, close to ambient temper-
ature. Moreover, they affirm the central role of the sp3 curvature induced hybridization
on the electron-phonon coupling, as also shown by Connetable et al. [11].
Figure 1.2: Picture showing a possible 3D polymerization starting from heavy-alkali metal
intercalated fullerenes presented in section 1.4 . The small nanocages formed between the
fullerenes have sp3 hybridized bondings making possible a high electron-phonon coupling
and thus a high Tc.
All these interesting results motivated this work, whose goal was the synthesis under
high pressure and high temperature conditions of three-dimensional (3D) polymers of
heavy alkali-metal intercalated C60, starting from the Rb6C60 and Cs6C60 systems, in
order to obtain very high critical temperature superconductors. The C60 polymerization
has actually been observed to form through the formation of sp3 hybridized covalent
intermolecular bonds. Moreover, if 3D polymerization is achieved, this will possibly lead
to the formation of small fullerenes (nanocages formed by a few C atoms) between the
C60, as shown in Figure 1.2, allowing to obtain a high electron-phonon coupling parameter.
4 The C60 fullerene and the heavy alkali metal-intercalated fullerenes
The so formed carbon clathrates will exhibit a high superconducting critical temperature
due to the presence of small nanocages between the fullerenes and to the presence of sp3
hybridized bonds.
The intercalation with heavy alkali metal ions is important firstly, for increasing the
density of state N(εF ) at the Fermi level and secondly because they have been observed
to favour, under pressure, the sp2 → sp3 transition (graphite → diamond) in carbon.
In particular, the ability of metals to act as catalysts for the conversion of graphite to
diamond increases with the increase of its number of electrons in the d-orbitals [10] and in
metallic cesium a gradual pressure-induced 6s → 5d electronic transition is observed from
ambient pressure up to 6 GPa [9] .
In addition, the second motivation for this study concerning the formation of superhard
materials, is given by the experimental and theoretical discovery of the extremely high
“hardness” properties of the three-dimensional C60 polymers [28, 5, 29], displaying a high
bulk modulus value around 280 GPa. More details about three-dimensional polymers are
given in section 1.3.
In conclusion, the aim of this work was to synthesize 3D polymerized C60 structures in
presence of heavy alkali metal ions under HP and HT conditions, in order to obtain new
materials displaying both high hardness and superconducting properties.
1.2 The C60 fullerene
”... It is hardly original to state that the identification of the C60 molecule by Kroto et al.
[1] and the subsequent discovery by Kratschmer et al. [2] of a simple method to produce
large amounts of this, must be counted among the most important scientific discoveries
during the last three decades of this century ...” from Ref. [18].
Subsequently, the C60 fullerene has been largely and extensively studied and in this
section we summarize the main properties of this molecule.
1.2.1 Generalities
In the C60 molecule the carbon nuclei reside on a sphere of about 7 A diameter. More
precisely, the atoms are positioned at the 60 vertices of a truncated icosahedron structure
with 90 edges, 12 pentagons and 20 hexagons. Two differents C-C bond lengths exist in
C60 and they measure 1.40 and 1.46 A. The 30 short bonds, are double bonds and lie on
the edges that are shared by two hexagons. The longer ones, that are single bonds, lie at
1.2 The C60 fullerene 5
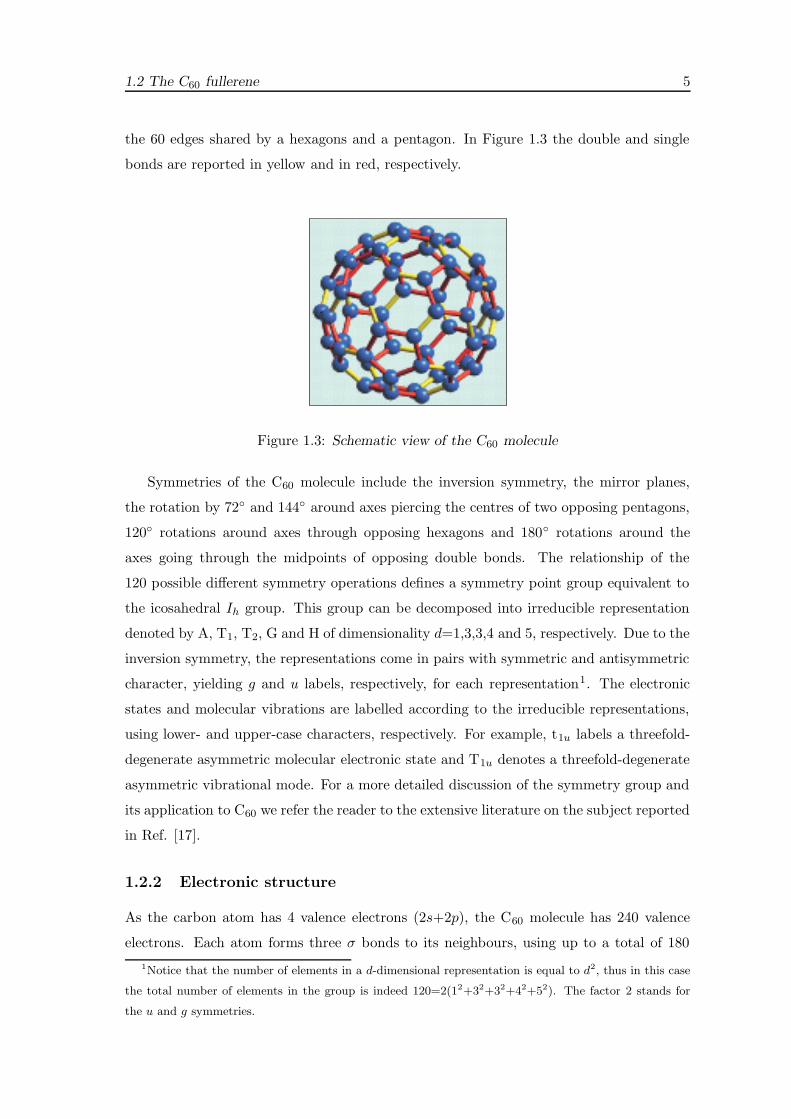
the 60 edges shared by a hexagons and a pentagon. In Figure 1.3 the double and single
bonds are reported in yellow and in red, respectively.
Figure 1.3: Schematic view of the C60 molecule
Symmetries of the C60 molecule include the inversion symmetry, the mirror planes,
the rotation by 72 and 144 around axes piercing the centres of two opposing pentagons,
120 rotations around axes through opposing hexagons and 180 rotations around the
axes going through the midpoints of opposing double bonds. The relationship of the
120 possible different symmetry operations defines a symmetry point group equivalent to
the icosahedral Ih group. This group can be decomposed into irreducible representation
denoted by A, T1, T2, G and H of dimensionality d=1,3,3,4 and 5, respectively. Due to the
inversion symmetry, the representations come in pairs with symmetric and antisymmetric
character, yielding g and u labels, respectively, for each representation1. The electronic
states and molecular vibrations are labelled according to the irreducible representations,
using lower- and upper-case characters, respectively. For example, t1u labels a threefold-
degenerate asymmetric molecular electronic state and T1u denotes a threefold-degenerate
asymmetric vibrational mode. For a more detailed discussion of the symmetry group and
its application to C60 we refer the reader to the extensive literature on the subject reported
in Ref. [17].
1.2.2 Electronic structure
As the carbon atom has 4 valence electrons (2s+2p), the C60 molecule has 240 valence
electrons. Each atom forms three σ bonds to its neighbours, using up to a total of 180
1Notice that the number of elements in a d-dimensional representation is equal to d2, thus in this case
the total number of elements in the group is indeed 120=2(12+32+32+42+52). The factor 2 stands for
the u and g symmetries.

6 The C60 fullerene and the heavy alkali metal-intercalated fullerenes
electrons for this purpose. These electrons stabilize the structure but do not contribute
to the conduction. These σ bonds are covalent bonds formed between the not purely sp2
hybridized orbitals. In fact, because of the curvature of the C60 surface, the “fullerene
hybridization” falls between graphite (sp2) and diamond (sp3)’s.
Figure 1.4: Huckel molecular orbitals and schematic illustration of the t1u wavefuncion
(from Haddon [30]).
The remaining 60 electrons are distributed around the molecule on orbitals that origi-
nate from the C-C π orbitals. These orbitals are somewhat similar to the π electron orbits
of a graphene plane with the difference that in C60 they are not truly delocalized around
the six-membered carbon ring (as in graphene) but they are distributed over the 30 short
bonds as discussed in the previous section.
The inclination of the theoretician is to first simplify to the lowest possible level and
for the spherical C60 molecule this leads to a model for the C60 electronic structure which
considers the electrons confined into a sherical potential. In this case the states are labelled
by quantum numbers n, l and m. Soon after, it was clear that this approximation was
not reasonable and that the discrete nature of the C60 must be considered by taking into
consideration the true atomic potential.
When considering the true atomic potential in the fullerene, l is no more a good
quantum number and the electronic orbitals are labelled according to the irreducible rep-
resentations of the icosahedral symmetry group. The correspondance between the spheric
and the icosahedral symmetry given by the the relationship between the spherical har-

1.2 The C60 fullerene 7
monics of quantum number l and the irreducible representations of the Ih point group
is:
s→ag
p→t1u
d→hg
f→t2u+gu
g→gg+hg
h→hu+t1u+t1g
Hence, the electronic structure of the neutral C60 molecule was first investigated by
a number of semiempirical calculations [31], by Hartree-Fock [32] and by both non-self-
consistent [33] and self-consistent [34] calculations within the local density approximation.
Subsequently, much insight into the electronic structure of neutral C60 was provided by the
Huckel molecular orbital calculations [35] originally treating only the 60 π electrons and
later extended to include all 240 electrons of the 60 carbon atoms. This model confirms
the picture of the electronic structure of the C60 molecule discussed below.
The C60 electrons fill all the states up to the hh level as shown in Figure 1.4. The hu
level which is fivefold-degenerate is completely filled and is the highest occupied molecu-
lar orbital (HOMO) while t1u is threefold-degenerate and becomes the lowes unoccupied
molecular orbital (LUMO). The HOMO-LUMO gap is around 2 eV.
1.2.3 Molecular vibrations
For a molecule of 60 atoms there are (3×60)-6=174 vibrational modes (the term 6 stands
for the three translational and the three rotational modes to be subtracted from the to-
tal number of modes). Group theory classifies the 174 modes of the Ih symmetry group
molecule into two 2Ag+3T1g+5T2g+6Gg+8Hg modes and an equal number of antisym-
metric (u) counterparts. The symmetries of the molecule cause degeneracies in the vibra-
tional frequencies yielding a total of 46 different vibrational frequencies for the isolated
C60 molecule, with equal numbers of symmetric and antisymmetric modes. In the Ih sym-
metry group, only 14 normal modes are Raman (2Ag+8Hg) and infrared (4T1u) active
and these have been assigned with certainty while the identification of the remaining 32
silent modes has been difficult due to the complexity of the vibrational spectrum.

8 The C60 fullerene and the heavy alkali metal-intercalated fullerenes
1.3 The C60 phase diagram
In this section we shortly describe the phase diagram of solid C60, i.e. the fullerite. We
firstly present the different phases observed at ambient pressure as a function of tem-
perature and secondly, even if the solid C60 phase diagram is still under exploration, we
depict the different structures so far observed under high pressure and high temperature
conditions.
1.3.1 Low-temperature and low-pressure phases
The fullerite is, at room temperature and ambient pressure, a molecular van der Waals
solid. In the solid phase at ambient conditions of pressure and temperature, the molecules
have their centers of mass on a face-centered cubic (fcc) lattice (space group Fm3m).
The size of the cubic unit cell is 14.17 A and the nearest-neighbouring intermolecular
distance (between the centres of the C60s) is 10.02 A. The molecules are orientationally
disordered at room temperature and the disorder is dynamic with the C60 reorienting very
rapidly about their fixed centers and on time average the molecules are undistinguishable.
Although the C60 molecules were considered as freely rotating it was soon recognized that
this assumption was erroneus and that there are pronounced intermolecular orientation
correlation even in this fcc phase [36, 37, 38]. In particular, Bragg and diffuse scattering
data together with some theoretical models have proved the coexistense of several favorable
configurations present with different probabilities [39].
As the temperature is lowered, the rotation of the molecules slows down and below
260 K the molecules become orientationally ordered. The basic structure of this low-
temperature phase is identical to that of the fcc phase except that the four molecules in
the cubic unit cell have different orientations, changing the fcc symmetry into a simple
cubic (sc) structure of Pa3 symmetry. In this phase, there are two possible orientations
obtained by rotating the molecules by 38 and 98 respectively around the <111> axes
of the crystal with respect to the “standard” orientation [41]. These orientations are also
known as H orientation and P orientation, respectively. In particular, the electron-rich
double bonds on one molecule face the electron-poor centres of hexagons (H-oriented) and
(P-oriented) pentagons respectively on its neighbour, as schematically shown in Figure
1.5. The energy difference between the two configurations is very small and the fraction of
molecules in the more stable P orientation continuously increases from 60% at 260 K up
to 84% at 90 K. Below this temperature, the thermal energy becomes too small compared
to the energy threshold between the two states and below 90 K this orientational disorder

1.3 The C60 phase diagram 9
P-orientation
H-orientation
Figure 1.5: The left panel reports the two different H- (bottom) and P-orientation (top)
of the molecules in the simple cubic structure. Figure from [18]. The right panel shows
the low-temperature phase diagram of C60 reported in Ref. [40].
becomes frozen and an orientational glass is formed. In Figure 1.5 we show the low
temperature phase diagram reported in Ref. [40].
1.3.2 High-temperature and high-pressure phases
The synthesis of new C60 phases by application of high pressure and high temperature on
pristine C60 has attracted a lot of attention, in the last ten years, due to the extraordinary
properties of these new phases [18].
At room temperature and relative low pressure, a first order fcc → sc transition is
observed at around 0.2 GPa where molecules can jump between two different orientational
states, the H and the P orientations, mentioned in the previous section. Above this
pressure, the fraction of molecules in the H orientation has been observed to increase
for increasing pressure [42] but the “line” determining the P → H orientational ordering
transition is not well investigated.
When applying higher pressure to solid C60, due to the extremely low compressibil-
ity of fullerenes compared to the “interstitial volume” between molecules (as shown both
by previous works [43, 44] and in also in chapter 4 of this thesis), the molecules weakly
bonded by van der Waals forces approach each other rapidly. As the distance between
carbon atoms on different molecules becomes comparable to the intramolecular C-C bond
lengths these unsaturated molecules are able to develop chemical bonds. At room tem-
perature, under non-hydrostatic pressure Duclos et al. [45] observed a transition that was

10 The C60 fullerene and the heavy alkali metal-intercalated fullerenes
probably associated to polymerization. Soon after, Snoke et al. [46] observed an irre-
versible transition by Raman spectroscopy towards an amorphous phase around 22 GPa.
Additionally, Nunez-Regueiro et al. verified the existence of an irreversible transition after
20 GPa. After quenching from a rapid non-hydrostatic compression they observed that
that transition was associated to the formation af polycrystalline diamond [47].
The high pressure and high temperature diagram of C60 exhibits many different phases
and it is still under exploration due to its complexity [48]. Nevertheless, in the follow-
ing we briefly report the nowadays knowledge of the C60 phase diagram by summarizing
the x-ray diffraction results performed on recovered metastable high-pressure- and high-
temperature-treated materials. Since the P-T phase diagram of C60 has been mostly
obtained by ex situ investigation, it should be rather considered as a “P-T reaction dia-
gram”. This is reported in Figure 1.6.
Figure 1.6: “P-T reaction diagram” of C60 fullerite. Picture from Ref. [49].
By looking at Figure 1.6, it turns out that under high pressure and high temperature
conditions, there is the formation of covalent bonds between molecules, i.e. the C60 poly-
merization, reported by different groups [50, 28, 51, 52]. All the high pressure studies
showed that, by increasing both pressure and temperature, a progressively higher degree
of the C60 polymerization was obtained (see Figure 1.6).
In the majority of the cases, the polymerization takes place via [2+2] cycloaddition,
meaning that two double bonds of two neighbouring molecules break up in order to form
two different σ bonds between the molecules. In the so formed “four membered ring” (i.e.

1.3 The C60 phase diagram 11
four membered ring
Figure 1.7: Dimerization by [2+2] cycloaddition: the red ring indicates the four membered
ring, i.e the connection ring between two covalently bonded molecules including 4 C atoms.
the connection ring between two molecules including 4 C atoms, see Figure 1.7) each C
atom is covalently bonded to four other C atoms through a sp3 mixed sp2 hybridization.
Different polycrystalline structures consisting of one (1D) and two-dimensional (2D)
polymers have been obtained and well characterized [53]. In parallel, several works [54,
50, 52] concerning both Raman and x-ray diffraction studies have been reported on single
crystals of dimerized C60, 1D chains and 2D polymerized C60, obtained after high pressure
and high temperature treatment. In particular, after a compression between 1 and 8 GPa
at 600 K, 1D polymerization (see Figure 1.8) in an orthorhombic lattice was identified
and the structure can be viewed as a distortion of the C60 fcc cell by compressing the
molecule along the <110> fcc direction. The space group reported in Ref. [53] for the
orthorhombic structure is the Immm while in Ref. [50] it was found to exhibit Pmnn
symmetry. The <110> direction was found to correspond to the polymerization direction
and the inter-molecular distance between the centres of two polymerized fullerene is 9.26
A according to Ref. [53] and 9.14 A in Ref. [50].
At higher temperature (around 900–1000 K), between 4 and 9 GPa, a mixed tetragonal
and rhombohedral 2D polymerized phase is obtained (see Figure 1.8). The tetragonal
phase (Immm space group in Ref. [53] and P42/mmc in Ref. [52]) results from the
in-plane compression of the (001) fcc planes and the distance between the centres of two
polymerized molecules is 9.09 A [53] and 9.02 A [52]. The rhombohedral phase (R3m
space group) can be viewed as an in-plane compression of the (111) fcc plane where the
nearest-neighboring intermolecular distance is 9.19 A.
The exploration of the C60 phase diagram under higher pressure and higher tem-
perature conditions, performed by Blank et al. [55, 49, 56], leads to the synthesis of
graphitic-amorphous mixed phases with sp2-sp3 mixed sites. These materials exhibit a

12 The C60 fullerene and the heavy alkali metal-intercalated fullerenes
Figure 1.8: Different polymers structures: (a) orthorhombic structure where each molecule
is covalently bonded to the two nearest neighbouring molecules along a <110> fcc direc-
tion; (b) tetragonal lattice where each molecule is covalently linked to its four neighbouring
molecules in a (100) fcc plane; (c) rhombohedral structure where each molecule is cova-
lently linked to its six other neighbouring molecules molecules in a (111) fcc plane. The
picture is from Ref. [51].
bulk modulus between 590 and 640 GPa, exceeding significantly that of diamond (around
440 GPa). A 3D polymerized structure was unambiguougly identified by Marques et al.
[28]. They observed a polycrystalline phase where intermolecular bonds exist among all
the 12 first neighbours of a pseudo face-centered cubic (fcc) C60 network. Such a struc-
ture was later observed to exhibit a very high bulk modulus coefficient, around 280 GPa.
More recently, Yamanaka et al. [57] obtained single crystals of 3D polymers where the
covalent bonding between the molecules is achieved through [3+3] cycloaddition. The new
synthesized materials consisted of a 3D metallic crystalline carbon network with fullerenes
having a cuboidal shape.
1.4 Alkali metal-intercalated fullerenes
The early discovery by Haddon et al. [4] that C60, like graphite, could be intercalated
with alkali metal atoms to form metallic compounds immediately sparked much interest.
In the close-packed fcc structure of pristine C60 the interstitial sites have either octahe-
dral (O) or tetrahedral (T) sites. The tetrahedral sites are smaller and there are twice as
many of them as octahedral sites. The MnC60 (n=1, 2, 3, 4, 6, 10) compounds formed by
the intercalated alkali metal atoms on the original fcc structure of pure C60 are commonly
known as fullerides (see Figure 1.9).
When the O sites are filled with alkali ions the M1C60 compound is obtained and it

1.4 Alkali metal-intercalated fullerenes 13
preserves the fcc structure. If the T sites are also filled, the MnC60 with n=2, 3 are formed
having again fcc structure. On the other hand, Na and Li are small enough for more than
one of them to fit into the O sites and MnC60 systems with n=6 and 10 were made [58].
M1C60 M4C60M3C60M2C60 M6C60
Figure 1.9: Starting from the right side: in M1C60 all the octahedral (O) sites (dark
blue) are occupied (one per molecule); in M2C60 all the tetrahedral (T) sites (light blue)
are occupied (two per molecule); in M3C60 both the O and the T sites (one O and two
T per molecule) are occupied. In M4C60 the structure is rearranged in a body-centered
tetragonal (bct) cell and both the O and the T sites of the bct lattice are occupied. M6C60
adopts a bcc lattice and all its T sites are occupied.
For n > 3, the fcc is rearranged and for n=4 and 6 the body-centered tetragonal (bct)
and body-centered cubic (bcc) structures are formed, respectively.
In contrast to pristine fcc C60, in these intercalated materials the nearly free rotation
of the molecules is hampered by the ionic interactions.
Let’s briefly mention the main properties of fullerides.
The study of these compounds actually increased significantly after the discovery of
superconducting properties in the M3C60 compounds [59, 60, 6, 61].
The MnC60 compounds (M=K, Rb and Cs) with n=1, undergo a structural transition
from a high-temperature monomer to a polymer phase for T < 350 K [62, 63]. The 1D
polymerized structure displays an orthorhombic structure and the chains of fullerenes are
linked by [2+2] cycloaddition and consequently by “double” C-C bonds (two covalent
bonds).
In the C60-based compounds intercalated with light alkali atoms (Li and Na) the ionic
interaction between the alkali metal Mn+ and the fullerene molecule Cn−60 has been shown
to act as a catalyst for the polymerization. In particular, Na2RbC60 and Na4C60 have been
observed to spontaneously form 1-D and 2-D polymers, respectively, at ambient conditions
[64, 65] through singly bonded C60. More recently the Li4C60 system has been observed
to display a 2D polymerization characterized by the coexistence of single and double C-

14 The C60 fullerene and the heavy alkali metal-intercalated fullerenes
C bonds [66]. In Figure 1.10 we report the C-C bridging structural motifs observed in
different fullerides. Also the LixNa(4−x)C60 systems (with 0≤x≤4), have been observed to
form 2D polymers [67].
(a) (c)(b)
Figure 1.10: Figure from Ref. [65]. Schematic drawing of the interfullerene C-C bridging
structural motifs in fullerides: (a) [2+2] cycloaddition in RbC60; (b) single C-C covalent
bonds in Na2RbC60; (c) mixed bondings in Li4C60.
For stoichiometries with 3<x≤6, 2-D and 3-D polymerized forms have not been ob-
served yet and a detailed study of their phase diagram does not exist.
1.4.1 The Rb6C60 and Cs6C60 systems
In this section, we briefly describe the systems studied during this thesis work, i.e. Rb6C60
and Cs6C60. In the M6C60 compounds (with M=K, Rb and Cs), characterized by x-ray
powder diffraction by Zhou et al., [68] the crystalline phase adopts a bcc structure with
Im3 space group.
Contrary to the case of solid C60, in the intercalated-fullerenes systems, at ambient
conditions, the rotation of the C60 molecules is substantially hindered. In particular, when
large cations are introduced, such as in this case, no molecular rotation is observed as it is
hampered by the presence of strong ionic interaction between the negatively charged C60
molecule and the positively charged alkali metals.
In this structure two equivalent C60 molecules per cell are centered at (0,0,0) and (1/2,
1/2, 1/2) oriented with their two-fold axes along the cube edges. Twelve alkali atoms per
cell are located in the 12(e) positions at (0, 0.5, 0.2822) and (0, 0.5, 0.2781) in Rb6C60
and the Cs6C60, respectively. Each C60 is surrounded by 24 alkali metal atoms and each
alkali ion is in a distorted tetrahedral environment of four C60’s. Figure 1.11 shows in
more detail the bcc unit cell as reported in Ref. [68].
The Rb6C60 and the Cs6C60 systems have a cubic lattice parameter of 11.54 and 11.79
A, respectively [68] (at ambient pressure and room temperature). The nearest-neighbour

1.4 Alkali metal-intercalated fullerenes 15
010
001
100
Figure 1.11: Bcc unit cell of Rb6C60 and Cs6C60.
010
001
100
Figure 1.12: Facing mechanism of two nearest-neighbour molecules along the <111>
bcc direction: a hexagon of one molecule parallely faces a hexagon of the neighbouring
molecule.
distance between two molecules along the <111> bcc direction is 9.99 and 10.21A for the
Rb and Cs case, respectively. This distance corresponds to the half-diagonal length of the
cubic lattice (√
3a2 ). Figure 1.12 reports the facing mechanism of two nearest-neighbour
molecules along the <111> bcc direction: a hexagon of one molecule parallely faces a
hexagon of the neighbouring molecule.
A theoretical study performed by Andreoni et al. [69] reported that the ionic inter-
actions in K6C60 and Rb6C60, due to alkali intercalation, give rise to a distortion of the
C60 compared to the isolated molecule as shown in Figure 1.13. Such distortion which
preserves the Th symmetry, can be viewed as a slight breathing of the C60 compared to
the free molecule. In particular, they observed that the single bonds which had equal
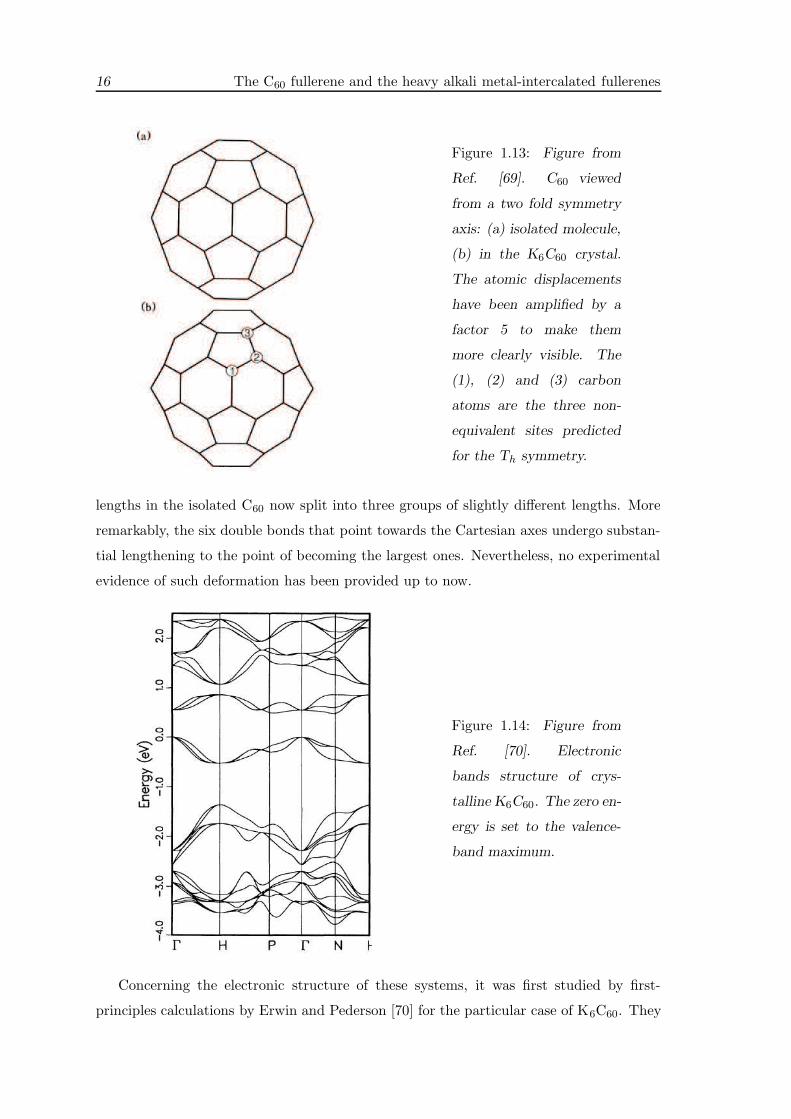
16 The C60 fullerene and the heavy alkali metal-intercalated fullerenes
Figure 1.13: Figure from
Ref. [69]. C60 viewed
from a two fold symmetry
axis: (a) isolated molecule,
(b) in the K6C60 crystal.
The atomic displacements
have been amplified by a
factor 5 to make them
more clearly visible. The
(1), (2) and (3) carbon
atoms are the three non-
equivalent sites predicted
for the Th symmetry.
lengths in the isolated C60 now split into three groups of slightly different lengths. More
remarkably, the six double bonds that point towards the Cartesian axes undergo substan-
tial lengthening to the point of becoming the largest ones. Nevertheless, no experimental
evidence of such deformation has been provided up to now.
Figure 1.14: Figure from
Ref. [70]. Electronic
bands structure of crys-
talline K6C60. The zero en-
ergy is set to the valence-
band maximum.
Concerning the electronic structure of these systems, it was first studied by first-
principles calculations by Erwin and Pederson [70] for the particular case of K6C60. They

1.4 Alkali metal-intercalated fullerenes 17
calculated the energy bands of solids potassium intercalated fullerenes KnC60, n=0, 3,
4, 6 and observed that they correspond to broadened versions of the molecular orbitals
(MO) energies. Although differences in the bands themselves are observed for the four
systems due to the different symmetries, the presence of alkali metals does not contribute
to modify significantly the band structure.
For the K6C60 system, they observed a complete charge transfer from the K atoms
to the molecule meaning that each K atom transfers its 4s electron to the C60 which is
stabilized in a high charge state with six additional electrons. The obtained electronic
band structure, reported in Figure 1.14, shows that the systems is an insulator with an
indirect gap of 0.48 eV. The highest occupied band (t1u), deriving from the t1u MO of
the isolate C602, is approximately 0.5 eV while the lowest unoccupied band (t1g) deriving
from the t1g MO shows appreciable dispersion, in the range of 1.0–1.5 eV.
Very few high pressure studies on the evolution of both electronic and solid structure
of Rb6C60 and Cs6C60 have been reported up to now. The only existing high pressure
study has been performed by x-ray diffraction on Rb6C60. In this work, carried out by
Sabouri-Dodaran et al. [71] the C60 molecules are observed to be stable in the bcc phase
at least up to 22 GPa, which also corresponds to the amorphization pressure in solid C60.
This result stimulates further studies in order to precisely determine the stability range
of the C60 molecule in these fullerides and compare it to the case of the non-intercalated
solid C60.
2We remind here, that in the isolated C60 molecule, the t1u orbital correponds to the LUMO (lowest
unoccupied molecular orbital). In the solid K6C60, the t1u, originating from the t1u MO, becomes the
highest occupied band since it is three-fold degenerate and hence completely filled by the six 4s electrons
of K atoms.

18 The C60 fullerene and the heavy alkali metal-intercalated fullerenes

Chapter 2
Methods
This chapter briefly presents the methods used in this work. It introduces both the
experimental methods by describing the principle of each technique, i.e. x-ray absorption
spectroscopy, x-ray diffraction and Raman spectroscopy and the key ideas of the ab initio
DFT calculations. The purpose of this chapter is to provide some fundamental tools in
order to allow even the reader not used to some of these methods, to understand the
results that we have obtained within this thesis.
2.1 X-ray absorption spectroscopy
X-ray absorption spectroscopy (XAS) is a probe of the local structure around selected
atom species in solids, liquids and molecular gases. For atoms in a condensed system, the
observed x-ray absorption spectrum is not a smooth function of energy but oscillates for
several hundreds eV above the absorption edge. The details of these oscillations, called
EXAFS (extended x-ray absorption fine structure), depend strongly on the local atomic
environment of the absorbing atom, with a few nearest neighbouring atoms accounting for
essentially all the observed variations in the absorption.
X-ray absorption spectroscopy is a useful complement to x-ray diffraction which pro-
vides accurate long-range information about the structure of crystalline materials.
In a typical XAS experiment, performed in transmission geometry, the intensity I(x,E)
of transmitted x-rays through a sample of thickness x is measured as a function of energy.
The loss of x-ray intensity is given by the exponential Lambert-Beer attenuation law:
I(x,E)
I(0, E)= e−µ(E)x (2.1)

20 Methods
where µ(E) is the linear absorption coefficient. As well as depending on the energy
of the incident beam, µ also depends on the composition of the irradiated sample. The
absorption coefficient µ(E) is well approximated by a sum of the absorption coefficients
of individual atoms, proportional to the x-ray absorption cross section σ(E).
In the x-ray region (below approximately 50 keV), the cross section for the interaction
of radiation with matter is dominated by photo-electric excitation processes which manifest
themselves as sharp rises in the absorption, usually termed edges (i.e. K, L1, L2 and L3),
when the incident photon has an energy equal to the binding energy of a core-level electron
(i.e. 1s, 2s, 2p1/2 and 2p3/2). Clear oscillations of the absorption coefficent are observed in
a wide energy region above the edge (of about 1000 eV). The absence of such modulations
in low density systems and gases points to a strict relationship between EXAFS oscillations
and the presence of neighbouring atoms.
EXAFS and its local nature are best understood in terms of wave-behaviour of the
photo-electron created in the absorption process. The wave associated with the photo-
excited electron can be scattered by neighbouring atoms as shown in Figure 2.1 and returns
to the photo-absorber. Interference between the outgoing and backscattered components
lead to modulations of the final state wavefunction as a function of the electron energy.
This in turn modulates the absorption coefficient µ(E) producing the EXAFS oscillations.
Figure 2.1: Schematic view of the radial component of the outgoing (continuous line)
and backscattered parts (dashed lines) of the photo-electron wave in a condensed system.
Inteference between these two components leads to modulations of the final state.
The x-ray absorption spectrum is traditionally divided into two regimes: x-ray absorp-

2.1 X-ray absorption spectroscopy 21
tion near edge structure (XANES) and extended x-ray absorption fine structure (EXAFS).
Though the two regions overlap and have the same physical origin, this distinction is con-
venient for the interpretation:
• XANES region: (within about 50-100 eV above the absorption edge) the photo-
electron is strongly scattered by the atoms surrounding the photo-absorber and the
amplitude of the multiple scattering is important. The shape of the XAS spectra
in this region is strongly sensitive to the formal oxidation state and coordination
chemistry of the absorbing atom;
• EXAFS region: (from about 80 eV above the edge) the photo-electron has sufficient
energy for treating the multiple scattering in terms of distinct two-, three-, ..., n-body
contributions. Nevertheless, the two-body contributions are generally the dominant
terms.
The EXAFS function is defined as
χ(k) =µ(k) − µ0(k)
µ0(k)(2.2)
where k =√
2mh2 (E −E0) is the wave-vector of the photo-electron (E0 is the core
binding energy) and µ0 is a smooth, atomic-like, background absorption of an “embedded
atom”, in the ideal absence of neighbouring scatterers.
In the following we report the simple analytic form of the EXAFS signal χ(k) obtained
from the Diffusion Theory. It assumes both the approximation of spherical waves for the
wavefunction associated to the outgoing and backscattered photo-electrons and the single
scattering approximation (meaning that it considers only two-body contributions). Even
though this formulation assumes the rude single scattering approximation to the problem,
it is useful at present because it provides an easy general comprehension of XAS. The final
analytic form for equation 2.2 is expressed as:
χ(k) =∑
j
A(rj , k) sin[2krj + Φj(k, r)]e−2σ2
j k2
e−2rj/λj(k) (2.3)
where
- the sum over j involves all the coordination shells around the photo-absorber atom;
- the amplitude factor A(rj , k) is proportional to Nj , i.e. the number of atoms in the
j-th shell and it is inversely proportional to kr2j (rj is the distance between the photo-
absorber site and the atoms in the j shell);

22 Methods
- the e−2σ2
j k2
term is similar to the diffraction Debye-Waller factor and it is related to
the thermal disorder with the difference that in EXAFS σ2j is the mean-square relative
displacement (MSRD) of j atom (or shell) with respect to the absorber atom a. The
relationships between the EXAFS MSRD and the diffraction mean-square displacement
(MSD) is:
σ2a−j = σ2
a + σ2j − 2σaσjρ (2.4)
where σ2a−j is the EXAFS MSRD and σ2
a and σ2j are the MRD of atoms a and j,
respectively, with respect to their absolute position; ρ is the correlation factor (−1 ≤ ρ ≥1);
- the e−2rj/λj(k) term describes the inelastic processes during the propagation of the
photo-electron and λ(k) is the limited mean-free-path of the electron;
- Φj(k, r) is the phase shift due to photo-electron diffusion from the photoabsorber site
and from the neighbouring atoms.
More recently, the EXAFS theory has been further developed in order to take into
account multiple scattering (MS) components. This leads to information even about many-
body distributions. The approach to the solution of the structural problem proposed by
Filipponi, Di Cicco and Natoli [72] allows to obtain a linear relationship between the
signal and the distribution of atoms around the photoabsorber atom. This approach,
employed in the GNXAS [72, 73] code used for the data analysis in this work, is based
on the decomposition of the cross section in n-body terms which include all the MS
contributions for a given set of n-atoms. For a generic fixed atom configuration surrounding
the photoabsorber atom, the EXAFS signal is expressed as a sum of the space integrals of
the many-body irreducible signals γn (where γn are dimensionless quantities proportional
to the cross section) multiplied by the corresponding n-body density-probability function
gn(r):
〈χ(k)〉 =
∫ ∞
0dr 4πr2ρ g2(r) γ
(2)(r, k) +
+
∫
dr1dr2dφ 8π2r21r22 sin(φ) ρ2 g3(r1, r2, φ) γ(3)(r1, r2, φ, k) +
+
∫
dr1dr2dr3 dφ dΩ 8π2r21r22r
23 sin(φ) ρ3 g4(r1, r2, φ, r3,Ω) ·
· γ(4)(r1, r2, φ, r3,Ω, k) + · · · (2.5)
In this thesis we have considered only two-body contributions to the total χ(k) signal
and for the g2(r) function we used an analytic non-gaussian function in order to consider

2.2 X-ray powder diffraction 23
the structural disorder of our systems. This function is usually used to describe asymmetric
distribution and its functional form is:
gj(r) =Nj
4πρr2
2
σ|β|Γ(4/β2)
[
4
β2+
2(r −R)
σβ
]4
β2−1
exp
[
−(
4
β2+
2(r −R)
σβ
)]
(2.6)
where R is the average distance (in this case from the photo-absorber site and the j-th
shell), σ is the variance of the distribution and β is the asymmetry parameter (for β → 0,
gj(r) becomes a gaussian function).
2.2 X-ray powder diffraction
Powder diffraction is the technique used in this thesis work for the study of the evolution
of the crystalline structure of our systems under extreme conditions. It was developed as
early in 1913. It is nowadays one of the most important techniques available to material
scientists and its success rests essentially on two features:
• a diffraction pattern is determined by the exact atomic arrangement in a material;
powder diffraction is an effective method of phase identification;
• in spite of its inherent limitations, powder diffraction provides information not only
about the structure (detailed atomic arrangement), but also about the texture and
the morphology (anisotropy and particle size) of crystalline matter.
In the method we used to perform x-ray powder diffraction, the sample is illuminated
by a monochromatic beam with wavelength λ0. Different d-spacings of the crystal are
measured at different angles (angular dispersive diffraction) of the detector according to
Bragg’s law:
nλ0 = 2dh,k,lsinθh,k,l (2.7)
where (h,k,l) are the Miller indices associated to the dh,k,l-spacing and n is an integer.
The intensity of a diffracted line (h,k,l) is given by the following expression:
Ih,k,l = Sjh,k,lLh,k,l |Fh,k,l|2 (2.8)
where
- S is a constant depending on the incident beam intensity, on the wavelength of the
radiation source and on the sample-to-detector distance;

24 Methods
- jh,k,l is the multiplicity for the reflection (h,k,l);
- Lh,k,l is the combination of the Lorentz and polarization factors for the diffractometer
geometry; in the case of a non polarized monochromatic beam it is equal to
(1+cos22θh,k,l)/(sin2θh,k,lcosθh,k,l) and
- Fh,k,l is the structure factor for reflection (h,k,l) that relates the intensity to the
atomic arrangement in the unit cell. The structure factor is given by
Fh,k,l =unit−cell∑
i=1
fie−Bi
sin2θh,k,l
λ2 e2πi(hxi+kyi+lzi) (2.9)
where xi, yi and zi are the fractional coordinates of atom i in the unit cell, e−Bi
sin2θh,k,l
λ2
is the isotropic Debye-Waller factor (with Bi=8π2σ2i ) and fi is the atomic scattering factor
for atom i defined as:
f2i = (f0 + ∆f ′i)
2 + (∆f ′′i )2 (2.10)
with ∆f ′i and ∆f ′′i the real and imaginary parts of the dispersion correction.
X-rayssample
2
Debye-Scherrer rings
Figure 2.2: Scheme of the Debye-Scherrer geometry. When the incident monochromatic
beam scatters along different cones, their intersection with the detector is observed (Debye-
Scherrer rings).
As an ideal powder sample consists of a large number of small crystallites randomly
oriented with respect to each other, the incident beam is scattered symmetrically along
different cones whose intersection with the image plate detector gives rise to concentric
rings called Debye-Scherrer rings (Figure 2.2). Maxima of intensity of the diffracted beam
are observed at those 2θh,k,l corresponding to the interplanar distances dh,k,l.

2.3 Raman spectroscopy 25
2.3 Raman spectroscopy
Raman spectroscopy is a spectroscopic technique used in condensed matter physics and
chemistry to study vibrational, rotational, and other low-frequency modes in a system.
The Raman effect was first observed by C. V. Raman in 1928 [74].
The laser light interacts with phonons or other excitations in the system, resulting in
the energy of the detected laser photons being shifted up or down. The shift in energy
gives information about the phonon modes in the system. Raman spectra have their
origin in the electronic polarization caused by ultraviolet, visible, near infrared, or near
ultraviolet range. If a molecule is irradiated by monochromatic light of frequency ν (laser),
then, because of electronic polarization induced in the molecule by this incident beam, the
light of frequency ν (“Rayleigh” or elastic scattering) as well as that of frequency ν ± νi
(“Raman” or inelastic scattering) is scattered where νi represents a vibrational frequency of
the molecule. Hence, Raman spectra are presented as shifts from the incident frequency.
The origin of Raman spectra can be explained by an elementary classical theory. Let’s
consider a light wave of frequency ν with an electric field E. Since E fluctuates at frequency
ν, we can write
E = E0cos2πνt (2.11)
where ‖E0‖ is the amplitude and t the time. If a diatomic molecule is irradiated by
this light, the dipole moment R given by
R = αE = αE0cos2πνt (2.12)
is induced. Here α is a proportionality constant and is called polarizability. If the
molecule is vibrating with frequency νi, the nuclear displacement q is written as
q = q0cos2πνit (2.13)
where ‖q0‖ is the vibrational amplitude. For small amplitudes of vibration, α is a
linear function of q. Thus, we can write
α = α0 +(∂α
∂q
)
0q (2.14)
Here, α0 is the polarizability at the equilibrium position and (∂α/∂q)0 is the rate of
change of α with respect to the change in q, evaluated at the equilibrium position. If we
combine equations 2.12- 2.14, we have

26 Methods
R = αE0cos2πνt = α0E0cos2πνt+(∂α
∂q
)
0q0E0cos2πνtcos2πνit
= α0E0cos2πνt+1
2
(∂α
∂q
)
0q0E0cos[2π(ν + νi)t] + cos[2π(ν − νi)t] (2.15)
According to classical theory, the first term describes an oscillating dipole which radi-
ates light of frequency ν (Rayleigh scattering).
The second term gives the Raman scattering of frequencies ν + νi (anti-Stokes) and
ν − νi (Stokes). Hence, the Stokes and the anti-Stokes lines appear at lower and higher
energy, respectively, compared to that of the incident laser (Figure 2.3). If (∂α/∂q)0 is
zero, the second terms vanishes. Thus, we can conclude that the vibration is Raman
active only if the polarizability changes during the vibration. This is the selection rule
for Raman-active vibrations and these can be established from the symmetry properties
of the system.
=1
=0
0
0–
1
0+
1
0
anti-StokesStokes
Rayleigh line
Stokes line
anti-Stokes line
-
i +
i
Figure 2.3: Mechanism of Raman scattering (left panel) and schematic view of a Raman
spectra (right panel). The Stokes and anti-Stokes lines are symmetric compared to the
Rayleigh line (elastic scattering). The intensity of the Stokes lines is always higher that
the anti-Stokes lines due to the Maxwell-Botzmann distribution law.
Now we discuss the Stokes and anti-Stokes lines in terms of energy of the molecule. In
the case of Stokes lines, the molecule at ν0=0 is excited to the ν1=1 state by scattering
light of frequency ν0−ν1, meaning that the molecule is absorbing energy. Anti-Stokes lines
arise when the molecule initially in the ν0=1 state scatters radiation of frequency ν0 + ν1
and reverts to the ν1=0 state, the molecule is emitting energy (Figure 2.3). Since the pop-
ulation of molecules is larger at ν=0 that at ν=1 (Maxwell-Boltzmann distribution law),

2.4 Simulations 27
the Stokes lines are always stronger than the anti-Stokes lines. Thus, it is customary to
measure Stokes lines in Raman spectroscopy. Consequently, the Raman spectra presented
in this work correspond to Stokes lines.
In crystalline solids, the Raman effect deals with phonons, instead of molecular vibra-
tion. Similarly to the case of molecules, for every crystal symmetry class, it is possible to
calculate which phonons are Raman active. A more detailed treatment of the principles
of Raman spectroscopy in molecules and solids together with group theory can be found
in Refs. [75, 76].
2.4 Simulations
In this section we shortly describe the principle of ab initio density functional theory
(DFT) approximation adopted by the SIESTA code employed for this work. Moreover,
we mention those particular features of the code used for the analysis of our results.
2.4.1 Ab initio DFT calculations
In physics and chemistry, a calculation is said to be ab initio, or from first principles, if it
starts directly at the level of established laws of physics. Nevertheless, some approxima-
tions are needed to make achievable such calculations as discussed below.
This method provides the main tools for the understanding of the properties of matter,
in all its possible states, by solving the fundamental equations for electrons.
In quantum mechanics a system is described by a wave function Ψ which is determined
by the solution of the Schrodinger equation describing the nuclear and electronic motions:
H(r,R)Ψ(r,R) = (−Ne∑
i=1
h2∇2i
2me−
Ni∑
I=1
h2∇2I
2MI+
1
2
∑
I 6=I′
ZZ ′e2
|RI −RI′ |+ (2.16)
+1
2
∑
i6=j
e2
|ri − rj|−∑
i,I
ZIe2
|ri −RI |)Ψ(r,R) = (2.17)
= (Te + Ti + Vi−i + Ve−e + Vi−e)Ψ(r,R) = EΨ(r,R) (2.18)
where r and R correspond to the positions of the Ne electrons and Ni ions, Te and
Ti are the electronic and nuclear kinetic energies and Vi−i, Ve−e and Vi−e are the ion-ion,
electron-electron and ion-electron coulombic interaction, respectively.
Due to the impossibility of solving exactly this equation when dealing with many
body particles some approximations are needed. In the following we briefly describe the
approximations adopted during this work.

28 Methods
• Adiabatic (or Born-Oppenheimer) approximation: as the general electronic veloci-
ties are much larger than the nuclear ones, hence, the nuclear and electronic motions
can be decoupled and treated separately. In particular, the Schrodinger equation for
the system can be decomposed as:
Ψ(r,R) = ψR(r)Φ(R) (2.19)
with the electronic wavefunction ψR(r) only parametrically depending on the nuclear
position variable R. Hence, each electronic structure calculation is performed for a
fixed nuclear configuration.
• Density functional theory (DFT): within this approximation the electronic proper-
ties of a system of many interacting particles can be viewed as a functional of the
ground state density ρ(r). The modern formulation of density functional theory
originated in a famous work written in 1964, where Hohenberg and Kohn provided
the proofs for the existence of such a functional [77].
Kohn-Sham equations
Subsequently, Kohn and Sham [78], starting from the variational principle estab-
lished by Hohenberg and Kohn, proposed to replace the original many-body prob-
lem by an “auxiliary” independent particle problem. The ansatz of Kohn and Sham
assumes that the ground state density of the original interacting system is equal
to that of some chosen non- interacting system. This leads to independent particle
equations that are exactly solvable with the many-body terms incorporated into an
exchange-correlation functional of the density. The Kohn-Sham (KS) equations for
the auxiliary system of N non interacting electrons are:
−1
2∇2 + veff (r)ψi = εiψi (2.20)
and
ρ(r) =
N∑
i=1
|ψi(r)|2 (2.21)
where ρ(r) is the density of the system, veff (r) is an effective potential resulting
from the external potential, the Hartree electronic interaction and the exchange
and correlation potential Exc[ρ(r)] (which is discussed below); εi (multipliers of the
KS equations) are related, in first approximation, to the energy levels occupied by
the interacting electrons. The procedure to obtain the total energy of the system

2.4 Simulations 29
is completely autoconsistent. The solution of equation 2.20 produces the wave
functions ψi and then the electronic density from equation 2.21 which is used to
define the effective potential in equation 2.20. This process is repeated until the
tolerance imposed on the difference between the input and the output density is
reached.
Exchange and correlation energy
The local density approximation (LDA) holds when ρ(r) is a smooth function of r.
In this case, the exchange and correlation functional (Exc[ρ((r)]) is approximated by
an integral over space of the exchange and correlation energy which is assumed to
be the same as in a homogeneous electron gas of ρ(r) density. Its expression is:
Exc[ρ(r)]LDA =
∫
ρ(r)εLDAxc (ρ(r))dr (2.22)
where εLDAxc (ρ(r)) is the exchange and correlation energy of a homogeneous electron
gas with density ρ(r).
On the other hand, for very inhomogeneus systems the generalised-gradient approx-
imation (GGA), which depends on the density and on its gradient is preferably
used. In this work we have used the LDA approximation. The use of the GGA
approximation was initially planned for a comparison but finally not performed.
• Pseudopotentials: the physical properties of solids are dependent on the valence
electrons to a much greater degree than on the tightly bound core electrons. This
approximation uses this fact to replace the complicated effects of the motion of
the core electrons of an atom or ion and its nucleus with an effective potential, or
pseudopotential. This fictitiuous potential acts in the internal region of the atoms,
reproducing the screening effect of the core electrons within the core region. The
“all-electron”, i.e. the exact wavefunctions, are replaced by pseudo wavefunctions.
The pseudopotential is then generated by fulfilling the following requirements:
- the corresponding pseudo wavefunctions and the all-electron agree beyond a chosen
core radius Rc;
- pseudo and all-electron eigenvalues agree for a chosen atomic reference configu-
rations meaning that the pseudopotential must describe the valence properties in a
different environment including atoms, ions, molecules and condensed matter (trans-
ferability);

30 Methods
- the logarithmic derivatives of the pseudo and the all-electron wavefunctions agree
at Rc;
- the integrated charge inside Rc for each wavefunction agrees meaning that the
pseudo and the all-electron wavefunctions have the same norm (norm-conserving
pseudopotential)
In particular, in this work we have used nonlocal [79], norm-conserving [80] fully
separable Trouiller-Martins pseudopotentials. This means that they are built from
a smooth and identical for all the angular momentum channels local part plus a non
local part.
• Basis set expansion: in order to solve the 2.20 and 2.21 KS equations it is necessary
to reduce the problem to a finite number of variables. This is done by expanding the
unknown ψi(r) wavefunctions in terms of known basis function. The most common
basis function sets are plane waves and localized atomic orbitals.
2.4.2 The SIESTA code
The DFT code employed within this thesis work is SIESTA, a LCAO (local combination
of atomic orbitals) method based on the use of numerical atomic orbitals (NAO) to ex-
pand the electron wavefunction. These orbitals are generated by solving, for each angular
momentum, the radial Schrodinger equation of the isolated atom. They are given by the
product of a spherical harmonic times a radial function. They are localised, i.e. defined to
be zero beyond a specified radius. Hence, the expansion of the ψi electron wavefunction
which satisfies the Bloch theorem is written as:
ψi(k, r) =1√N
∑
µ,R
ciµ(k)eik·Rµφµ(r) (2.23)
where ciµ(k) are the coefficients of the expansion of the wavefunction i,k in the basis
set φµ(r) centered at the atomic positions Rµ. The density matrix now takes the form:
ρ(r) =∑
ik
fi(k) |ψik(r)|2 =∑
µνRR ′
φ∗µ(R −Rµ)φν(r −Rν)ρµν(R −R ′) (2.24)
with
ρµν(R −R ′) =1
N
∑
ik
fi(k)c∗iµ(k) · ciν(k)e−ik(Rµ−Rν) (2.25)
where fi(k) is the Fermi-Dirac occupation factor.

2.4 Simulations 31
Mulliken population analysis
An analysis tool that we have used in this work is the Mulliken population analysis method.
This method allows the assignment of electronic contributions to individual atoms and
bonds. However, due to the fundamental problem of deciding where atoms in solid or
molecular systems actually start and where they end, there is no absolute way of parti-
tioning the electronic density into atomic contributions. Nevertheless, this method is very
useful for understanding the electronic structure of systems. Let’s write the total number
of electrons (electronic charge) N in the system as a sum of charges Qµ (gross orbital
population) associated to each of the orbitals in the basis1:
N =
occ∑
i
〈ψi|ψi〉 =∑
µ
Qµ =∑
µ
∑
ν
P µνSνµ (2.26)
where Sνµ are the overlap matrix elements and P µν is the density matrix written in
terms of the dual LCAO basis (P µν = 〈φµ|ρ|φν〉). The gross orbital population Qµ is
the sum of two contributions: the net orbital population qµ (expressed by the diagonal
component in equation 2.26) and the overlap orbital population Oµν which is the sum of
the non-diagonal elements.
In this way, the total atomic charge for a given atom A is a matrix calculated as the
sum of the orbital gross charges over all the orbitals belonging to that atom:
QA =∑
µ∈A
Qµ (2.27)
and QA is called Mulliken population of the atom A. By considering the overlap orbital
population, the overlap charge between the atoms A and B is calculated as:
OAB =∑
µ∈A
∑
ν∈B
Oµν (2.28)
Projected density of states (PDOS)
The projected density of states (PDOS) is particularly helpful when trying to understand
which is the contribution of the different atoms to the density of states. The density of
states (DOS) is defined as:
DOS(E) =∑
i
∑
k
δ(E − εi(k)) ≈∑
i
∑
k
1
σ√πexp
(
−(ε− εi(k))2
σ2
)
(2.29)
1The dependence with k and r is now omitted for clarity.

32 Methods
where εi(k) is the energy of the one-electron states. The PDOS is then defined as follows:
PDOS =∑
i
∑
k
∑
µ
δ(E − εi(k))ciµ (2.30)
In this way PDOS represents the DOS projected on the φµ basis orbitals.
Vibrational spectra calculation
Raman vibrational spectra have also been calculated in this work. In the following we
briefly describe the most general formulation for calculating the normal vibrational modes
within the harmonic approximation.
If the displacements of the ions from their average positions are assumed to be small
then the interaction potential can be expanded in a Taylor series so that, close to the
equilibrium position, it is a quadratic function of the displacement. This is the harmonic
approximation. The potential energy is :
U = U0 +∑
αm
[
∂U
∂τα,m
]
0
τα,m +1
2
∑
αm,α′m′
[
∂2U
∂τα,m∂τα′,m′
]
0
τα,mτα′,m′ + · · · (2.31)
where τα,m is the cartesian component (m = x, y, z) of the displacement of the α
atom. The linear term of τα vanishes because at the equilibrium position forces are zero
([∂U/∂τα,m]0 = 0). Hence, the hamiltonian of the system within the harmonic approxi-
mation becomes:
H =1
2
∑
α,m
Mατ2α,m + U0 +
1
2
∑
αm,α′m′
∂2U
∂τα,m∂τα′,m′τα,mτα′,m′ (2.32)
and the classical equations of motion are:
Mατα,m = − ∂U
∂τα,m= −
∑
α′m′
[
∂2U
∂τα,m∂τα′,m′
]
0
τα′,m′ (2.33)
being Mα the mass of the α atom. We obtain the dynamical matrix using a finite
differences approach, where the atoms were displaced by ∆x=0.2A. In particular, the
second derivatives of the potential calculated with respect to the displacement at the
equilibrium positions completely determine the lattice dynamics.
If the wavefunction in crystals has the form τα = M−1/2α uαe
i(q·Rα−ωt) equation 2.32
turns into an eigenvalues equation of 3Nαx3Nα:
ω2uα = D(q)uα (2.34)
2.4 Simulations 33
where D(q) is the dynamical matrix and is defined as:
D(q) = Dmm′
αα′ (q) = (MαMα′)−1/2∑
Rα−Rα′
∂2E
∂τα,m∂τα′,m′e−iq·(Rα−Rα′ ) (2.35)
where Rα is Rα = R0α + τα. The eigenvalues and eigenvectors are the frequencies and the
vibrational modes of the system.
The dynamical matrix can be calculated by considering a perturbative potential which
allows to analytically obtain the second derivative of the energy or simply by considering
the total energy of the system without having information about its analytical second
derivatives. In this thesis we employed the second method.

34 Methods

Chapter 3
Experimental set-up
This chapter is devoted to the description of the experimental set-up employed during our
measurements. We first give a brief overview of the technical devices used for achieving
high temperature and high pressure conditions and then, we describe the experimental
apparata where these devices have been installed and used in order to collect x-ray ab-
sorption, x-ray diffraction and Raman spectroscopy data.
3.1 High pressure experimental methods
The high pressure devices used in this thesis are the Paris-Edinburgh cells and the diamond
anvil cells. The first apparatus allows to achieve a maximum pressure of 17 GPa on samples
of ≈1-3 mm3 while the second one can generate much higher pressure, up to around 500
GPa, on much smaller samples (few µm3). The choice of the device depends on both the
thermodynamic conditions (pressure and temperature) needed for the experiment and on
the experimental apparatus available for the different techniques. In the following section
more details about the Paris-Edinburgh cell and the diamond anvils cells are given.
3.1.1 Large volume Paris-Edinburgh press
The Paris-Edinburgh (PE) cell is one of the classical instruments to perform high pressure
(HP) and high temperature (HT) in situ x-ray measurements on large crystalline, liquid
or amorphous samples.
The PE was originally developed for neutron diffraction experiments on large volume
samples [81] and then adapted to x-ray diffraction and absorption experiments [82]. Using
this device it is possible to perform HP and HT measurements in different P-T ranges
depending on the anvils type used within this press. In particular, we can reach pressures

36 Experimental set-up
Figure 3.1: Schematic drawing (left panel) and picture (right panel) of the Paris-Edinburgh
large volume cell for x-ray measurements.
of 9 GPa and, at the same time, temperatures of 1500 K or 17 GPa and 1200 K by
using tungsten carbide (WC) or sintered diamond (SD) anvils, respectively. A detailed
discussion about technical improvements allowed by these new SD anvils, coupled with a
new cell assembly system, can be found in Ref. [83].
Because of the large dimension of the sample (volume ≈1-3 mm3) compared to diamond
anvil cells, the PE cell belongs to the large volume HP apparata “family”. A schematic
drawing of the large volume press is reported in Figure 3.1. The thrust on the seats of the
anvils is generated by a piston-cylinder assembly pressurized by a suitable high pressure
oil circuit. The idea is that two opposed anvils will concentrate the force onto a small area,
of about 1/100 of the piston surface, hence providing a magnification of the pressure by a
factor 100. For x-ray applications, the press is operated with special WC or SD truncated
cone type anvils designed to obtain hydrostatic pressure conditions and to access with
x-rays inside the HP cavity.
A sintered amorphous boron-epoxy gasket placed in the middle of the anvils transmits
the pressure to the sample. Boron gaskets have low thermal conductivity and high me-
chanical strength to support high-pressure at high-temperatures. The gasket absorbance
fixes low energy operation limit of this technique to about 10 keV. The gasket can have
an external diameter of 5, 7 or 10 mm with an internal diameter of 1.5, 2 and 3.5 mm,
respectively. Obviously, the bigger the gasket size the lower the maximum attained pres-
sure. In this study, we always used 5 mm gaskets. An example of cell assembly is shown
in Figure 3.2. The size of the different components of the HP and HT environment cell
depends on the dimension of the gasket used.

3.1 High pressure experimental methods 37
In order to better achieve an isotropic pressure distribution, the sample must be em-
bedded and confined in a pressure transmitting medium (PTM) consisting in an inert
matrix softer than the sample.
For HT experiments, when sample reaction or contamination with the matrix is pos-
sible, the compound is directly inserted into an insulating capsule without any PTM. In
any case, the assembly is placed inside a high resistivity graphite cylindrical furnace or
rhenium strips furnace which acts as an heater.
Figure 3.2: Typical cell assembly used for in situ x-ray measurements.
The heating power is generated by an electrical current through the graphite crucible,
anvils and electrical contacts (Mo disks and steel rings). For higher gasket sizes, i.e. 7 and
10 mm diameter, the temperature can be measured by an insulated K-type thermocouple
placed in the sample gasket. An additional estimate of the temperature ramp can, however,
be obtained, by the power delivered to the sample (calculated as the product of the current
by the voltage across the anvils), through previously calibrated power curves in P-T space.
The pressure is usually measured by in situ x-ray diffraction following the lattice con-
traction of internal pressure markers, added to the sample, whose equations of state are
reasonably well known. In this work we employed different pressure marker systems de-

38 Experimental set-up
pending on the P-T range. In particular we used LiF, NaCl, MgO [84, 85] and h-BN [86].
The Vinet-type [84] equation of state used in this work is written as:
P = 3B0x−2(1 − x) exp[η(1 − x)] + α0B0(T − TR) (3.1)
where x = (V/V0)1/3, B0 is the equilibrium volume V0 isothermal bulk modulus (B0 =
(−V dP/dV )) and η=(3/2)(∂B0/∂P − 1). The knowledge of zero-pressure properties,
V0, B0 and the thermal expansion coefficient α0, at the reference temperature TR (room
temperature) is required.
Figure 3.3: Example of MgO and NaCl P (T ) cross-calibration curves. The intersection
point gives the values of P and T: 15.6 GPa and 353 K.
For HT measurements, both pressure and temperature can be cross-calibrated from
the equations of state of two P-T markers [87], possibly having contrasting dependence on
their thermoelastic properties (bulk modulus and thermal expansion) (i.e. MgO and NaCl,
Re and NaCl). As two thermodynamic variables are unknown (P and T), two equations
of state are required in order to obtain their values. HT and HP measurements performed
in this thesis work have been calibrated by using this technique. In Figure 3.3 we report
an example of a cross-calibration graph used to calibrate P and T.
In particular, this method is valuable in situations where the use of a thermocouple is
not possible or advisable, for instance in 5 mm diameter gaskets or, for example, above
1200 K, i. e. near the melting points of the thermocouple materials.
When dealing with extremely air sensitive systems, such as in our case, the good
sealing of the sample is a critical parameter that must be taken into consideration during

3.1 High pressure experimental methods 39
experiments. In particular, good airtightness conditions must be provided to the sample
during the transport from the inert atmosphere glove box to the PE cell installed at
the beamline. For this purpose a clamp system, shown in Figure 3.4, has been used
during the present study. This system allows to hermetically enclose the sample in a
glove box, within its high pressure cell assembly, between the two anvils in order to avoid
air and/or humidity sample contamination before starting the high pressure experiment.
Moreover, the clamps provide a water circulation system for the anvils cooling during high
temperature measurements.
Figure 3.4: Picture (left panel) and schematic drawing (right panel) of the anvils within
the clamp system used both for preventing the sample reaction with air and humidity and
for cooling the anvils.
3.1.2 Diamond anvil cells
The diamond anvil cell (DAC) is the pressure device which allows to reach the highest
static pressures.
The great number of results in the field of HP research is strictly related to the de-
velopment of the DAC technique; see for example [88] for a review of early developments.
This device, that can fit into the palm of the hand, can generate pressures up to about
500 GPa (5 millions times the atmospheric pressure) [89]. The DAC is very simple in
principle. It consists of two gem-quality single crystal diamonds with flat surfaces to serve
as anvil faces (Figure 3.5).
The diamonds are mounted so that a sample can be squeezed between the anvil faces
shown in Figure 3.5. The smaller the area A of the anvil faces, the higher the pressure P
reached by the DAC for an equivalent value of applied force F, according to the relationship
P = FA . Figure 3.6 shows the principle of DACs. In order to apply pressure to the sample,
the anvil faces must have a high degree of parallelism. One of the diamond anvils is usually

40 Experimental set-up
mounted on the end of a sliding piston, while the other is stationary. A cylinder guides the
piston so that the anvil faces meet very precisely. The piston is pushed by a mechanical
device such as a screw or a small hydraulic ram, driving the two anvils together.
A rocker or a tilting plate directly under the diamond anvils allows orientation of the
diamonds to be adjusted so that the faces are concentric and parallel.
A membrane DAC has been used for the experiments presented in this work. In particular,
we employed a Chervin-type DAC and a picture of this cell is shown in Figure 3.7 [90].
In this type of cell the pressure on the sliding piston results from the deformation of a
thin membrane by effect of a He pressure [91]. This allows a homogeneous distribution of
the force applied on the membrane and a fine pressure control. This type of cell allows
changing of pressure in small steps enabling, for example, careful observation of sample
behaviour at a phase transition. Moreover, the possibility to change the pressure on-line
without the need of moving the cell makes the Chervin-type DAC particularly suited for
experiments using synchrotron radiation where the alignment of the sample is a delicate
and sometimes long procedure.
For HT measurements, two heating techniques in the DACs nowadays exist to achieve
simultaneous HP and HT conditions: resistive heating and laser heating. For the resistive
heating two methods are possible: internal and external heating. In this work, HP and
HT conditions have been achieved via external resistive heating. In this case the DAC is
placed as a whole in a furnace, which can be typically a resistive heated metallic cylinder
as the one shown in Figure 3.7. This method yields a very uniform temperature field and
allows to reach temperatures up to 600 K. For higher temperatures, the whole system
must be enclosed in a vacuum chamber to avoid graphitization of the diamonds.
When the sample is placed between the anvil faces, in contact with them, as the anvils
are forced together, the sample is trapped and subject to an uniaxial pressure, whose
distribution ranges from a maximum at the center to a much lower pressure at the edge of
Figure 3.5: Diamond anvil face from top and from side.

3.1 High pressure experimental methods 41
Sample
PTM
Gasket
Figure 3.6: The principle of the diamond anvil cell. The use of a PTM and of a gasket to
encapsulate sample and PTM allows to overcome the uniaxial pressure generated by the
diamonds and to have an isotropic pressure.
Figure 3.7: Chervin-type DAC (left panel) and external heater for Chervin-type cell (right
panel).
the sample area [92, 93]. In order to have an isotropic pressure distribution the sample must
be embedded and confined in a PTM softer than the sample. A complete description of
different PTM is given in [94]. In our experiments we have used different PTM depending
on the type of measurements, on their reactivity with the systems and finally on the
possibility of having the intercalation of the PTM into fullerene-based systems. In this
thesis work, we used:
• Silicon oil: for some measurements performed at room temperature as this PTM
has been observed to react at HT with our samples.
• LiF and NaCl: these salts were used for XRD and XAS measurements both at high
and at room temperature. NaCl was used for all the Raman measurements.

42 Experimental set-up
Both the sample and the hydrostatic medium (PTM) are placed in a small hole drilled
in a metallic gasket. (Figure 3.6). The gasket consists of a metallic foil of typically 200
µm of thickness. To increase the hardness of the metal, the foil is placed between the
two diamonds and is pre-indented to about 30-60 µm. The diameter of the hole depends
critically on the diameter of the diamonds, and it is typically one third the diameter of
the flat of the diamond.
A second purpose of the gasket is to provide support at the edges and sides of the
anvils thus preventing failure of the anvils at very HPs. In this work stainless steel and
rhenium have been used as gasket materials for RT and HT measurements respectively.
Methods for measuring pressure
Several methods for measuring pressure have been developed. If the experimental tech-
nique is in situ XRD, then the diffraction pattern of an internal standard can be used as
a pressure marker as discussed in the previous section.
Another means of measuring the pressure is the ruby fluorescence method which was
used in the present work.
This method is particularly well adapted to DAC technology since it exploits the high
transparency of diamonds to visible light. Forman et al. in 1972 [95] first showed that the
luminescence doublet of peaks R1 and R2 of Cr3+-doped Al2O3 (ruby) shift linearly with
hydrostatic pressure in the range of 1–22 GPa, and that the two lines broaden if the ruby
experiences nonhydrostatic stresses.
In this method [96] a tiny chip of ruby (5-10 µm in dimensions) is placed in the pressure
medium along with the sample (Figure 3.8), and its luminescence is excited by a laser.
The shift in wavelength is followed as a function of pressure. An important question
with regard to the ruby scale is how far it is linear [97, 98, 99]. According to [100], the
relationship between the pressure P (in GPa) and the ruby R1 line wavelength shift λ (in
nm) can be described by the following relationship (at 20 C),
P =1904
B
(
(
λ
λ0
)B
− 1
)
. (3.2)
where the parameter B is equal to 7.665 and 5 for quasi-hydrostatic and non-hydrostatic
conditions respectively. λ0 correponds to the wavelength measured for a standard ruby
chip at room temperature and ambient pressure and is equal to 694.24 nm.
It is important to clarify that the position of the ruby luminescence lines varies with
temperature, with a slope of 0.068 A K−1, which means that a ∆T of ∼ 5 K produces the

3.2 Experimental apparata 43
ruby chip
Figure 3.8: Ruby on a face of a diamond anvil (left panel) and fluorescence spectrum of
the ruby at 0.3 GPa and room temperature (right panel). The fluorescence doublet shifts
towards higher wavelengths under pressure.
same shift as the application of a pressure of 0.1 GPa. Therefore a variation of temperature
from the standard 20 C has to be taken into account for a precise determination of
pressure. Temperature correction of the ruby pressure scale was systematically studied by
Vos and Schouten [101].
The ruby gauge has some disadvantages: the luminescence spectrum exhibits a doublet
instead of a single line that is desirable for exact pressure determination; rubies provide
low accuracy in the low pressure region (∼ 1 GPa) and their luminescence becomes weak
at megabar pressures. These limits have motivated a search for other fluorescent com-
pounds which would be more adequate for both very HP and HT studies in the DACs like
SrB4O7:Sm2+.
3.2 Experimental apparata
X-ray absorption and x-ray diffraction experiments performed in the framework of this
thesis have been carried out at the European Synchrotron Radiation Facility (ESRF) in
Grenoble. In this section, we do not describe the details of synchrotron radiation which
are treated extensively in specific textbooks (e.g. in [102]). We concentrate instead on
the experimental set-up for performing measurements under high pressure and/or high
temperature conditions developed at the BM29, ID24 and ID27 beamlines. In particular,
x-ray absorption experiments have been performed at the BM29 and ID24 beamlines
by using the Paris-Edinburgh cell and the diamond anvil cell respectively, while x-ray
diffraction experiments have been perfomed at the ID27 beamline with both devices.

44 Experimental set-up
Finally, we briefly describe the apparatus used to collect Raman spectroscopy spectra
at the ENS-Lyon (Univ. Lyon 1).
3.2.1 Beamline BM29 - ESRF
X-ray absorption measurements have been performed in transmission geometry at the
BM29 beamline.
BM29 is the general purpose x-ray absorption spectroscopy beamline [103] of the ESRF,
built tangentially to a bending magnet of this 3rd generation synchrotron radiation source.
The spectrum of available x-rays extends between 4 and 75 KeV with critical energy at
20.4 keV and typical photon flux in the 1010 range. The signal-to-noise ratio due to the
photon statistics in the normal transmission geometry can be therefore higher then 105.
2328.53033 037 37.5 40.5 41 42
Primaryslits
Monochromator
Secondaryslits
Double mirror
Experimentalslits
I0I1I2
Experimentalstation
Referencesample
Refl-EXAFSstation
37 - 4040.7
Figure 3.9: Pictorial representation of the experimental setup for combined XAS and XRD
experiments installed at the beamline BM29-ESRF.
The beamline optics includes a double flat crystal monochromator and a pair of har-
monic rejection mirrors. The lower mirror can be used as well for focusing the beam down
to 20-30 µm.
A simple scheme of BM29 is shown in Figure 3.9. XRD patterns can be collected by
means of a MAR345 image plate detector mounted off-axis with respect to the beam in
analogy to the setup described in Ref. [104]. The image plate position and the selected
energy for XRD measurements are chosen in order to optimize the detection of the most
intense Debye-Scherrer rings of the pressure markers.

3.2 Experimental apparata 45
Four different Si crystal pairs can be installed, depending upon the requirements for
energy and photons flux. For the experiments related to this work, Si(311) crystals having
operational energy between 5 and 50 KeV, have been used. The energy resolution when
using a Si(311) monochromator is ∆E/E=4 × 10−5 at 15 KeV. This is well below the
natural broadening of the spectra given by the core hole widths (≈ 2 × 10⁻⁴).
Beam intensity is measured by sealed ionization chambers filled with optimal He/Ar
or He/Kr mixtures at a total pressure of 2 bars and normally operated at a field of about
300-800 V cm−1. The gas noble species, gas pressure and applied voltage control the
detector efficiency.
3.2.2 Beamline ID24 - ESRF
We have collected x-ray absorption spectra under high pressure (up to 45 GPa) at the
ID24 beamline in transmission geometry.
This beamline satisfies the main requirements for performing HP XAS studies:
• small focal spot: for a 300 µm diamond-anvil flat (required for P of the order of 50
GPa) and gasket hole diameter of 100 µm, the sample size is around 80 µm;
• position stability of focal spot in whole energy range;
• high flux: for measurements in transmission geometry the x-ray beam traverses the
two diamonds. The thickness of a single diamond is between 2 and 2.5 mm. This
poses real problems for low energy XAS (E<8 keV).
ID24 is the ESRF XAS beamline with parallel detection of the whole spectrum made
possible by energy dispersive highly focusing x-ray optics [105, 106].
The geometrical arrangement of the energy dispersive optics is given in Figure 3.10.
A quasi-parallel and polychromatic beam, supplied by a an undulator source, is energy-
dispersed and focused by an elliptically curved crystal. Because the incident x-rays strike
the crystal at slightly different angles along its length, the bent crystal acts as a polychro-
mator diffracting a different energy at each point. This energy-dispersed beam converges
to a focus at the sample position. The beam, transmitted through the sample position,
then diverges towards a PSD. The position of the beam, incident in the detector, can be
directly correlated to energy. By measuring the spatial X-ray intensity distribution in the
presence (I1) and absence (I0) of the sample, a transmition geometry x-ray absorption
spectrum can consequently be obtained. Figure 3.10 shows the present optical scheme.

46 Experimental set-up
Si(111), Si(220), Si(311) Bragg/Laue Polychromator Demagnification
Mirror @ 32.5 m
Vertical Focusing Mirror @ 30 m
2 tapered undulators
Vertical Refocusing Mirror @ 65 mFocal Spot
x ~ 10 m FWHMz ~ 10 m FWHM
CCD Camera @ 68 m
Figure 3.10: Present optical layout of beamline ID24. The polychromator is coupled to
two undulators through a Kirkpatrick-Baez optical system. The third refocusing mirror
was added to the original configuration in 2000.
The two Kirkpatrick-Baez mirrors reflect the beam at a fixed grazing angle of 3 mrad
and ensure efficient harmonic rejection in the whole energy range of operation, between
5 and 27 keV. The first mirror, placed at 30 m from the source, is in a quasi 1:1 con-
figuration and vertically focuses the beam on the detector through a pneumatic bender
mechanism. For experiments requiring a small focal spot, such as HP experiments using
DACs, a third mirror to refocus the beam in the vertical direction at the sample position
is added to the optical configuration. The horizontal divergence necessary to obtain the
requested energy bandwidth (∆E) after diffraction from the polychromator is produced
by the second mirror. Placed at 32.5 m from the source, this strongly focusing mirror
creates a horizontally-demagnified image of the source that becomes the effective source
for the polychromator crystal. The polychromator consists in a curved Si crystal in a
Bragg [107] or Laue [108] geometry. Si(111) and Si(311) crystals are used to match the
energy resolution/energy bandwidth requirements for the specific applications.
The ∆E necessary for acquiring all data points in parallel is directly proportional to
the footprint of the beam on the polychromator crystal and to the cotangent of the Bragg
angle [109]. The latter factor severely limits ∆E at low energies. Typical values for ∆E/E
range between 5% to 15% at low and high energies respectively.
The spectrometer consists of a Θ - 2Θ goniometer with the monochromator on the
Θ axis and an optical bench oriented at 2Θ with the sample and the position sensitive
detector on it. Typical focal spot dimensions for HP measurements are at the order of

3.2 Experimental apparata 47
10x10 µm FWHM (full width at half maximum).
3.2.3 Beamline ID27 - ESRF
X-ray powder diffraction has been performed at the ID27 beamline (ESRF) optimized
for the study of materials under extreme conditions [110]. It is composed of an optical
hutch, two specialized experimentals hutches, two control-cabins and two high pressure
laboratories. The first experimental hutch, EH1, is fully dedicated to large volume cell
experiments using a Paris-Edinburgh (PE) cell while the second hutch, EH2, is fully opti-
mized for diamond anvil cell (DAC) experiments. The centres of the experimental hutches
EH1 and EH2 are respectively located at 41 and 48 m from x-ray source. The x-ray
source is composed of two small-gap in-vacuum undulators of period 23 mm that can be
used simultaneously at a minimum magnetic gap of 6 mm. The monochromatic beam is
selected using a nitrogen-cooled Si(111) monochromator and focused on the sample using
multilayer mirrors in the Kirkpatrick-Baez (KB) geometry. The multilayer mirrors are 300
mm-long and are made of iridium-allumina multilayers deposited on silicon wafers. These
mirrors possess a very broad energy band pass from 6 keV to 80 keV with a maximum
of 80% reflectivity at 30 keV. Large focal distances of 800 and 1200 mm are used for the
horizontal and the vertical mirrors, respectively, in order to avoid serious loss of spatial
resolution. When using the KB focusing mirrors the obtained focal spot diameter is 7 µm
at around 33 keV.
The PE cell diffractometer set-up includes a Soller slits system in order to eliminate
most of the background signal coming from the sample environment (i. e. furnace, B-
epoxy gasket, etc.) and a large area detector-Bruker CCD or MAR345 image plate easly
interchanged using motorized translations. The sample to detector distance and the image
plate tilt angles were precisly calibrated using a standard located at the sample position.
For DAC experiments a two-circle goniometer is installed in the EH2 hutch.The criteria
for the choice of the optimal detector for high pressure experiments are mostly dictated by
the cell goniometer (limited 2θ angle), composition (diamonds for the DACs, a-B gasket
for the PE press) and by working x-ray energies.
3.2.4 Raman spectrometer - ENS-Lyon (Univ. Lyon 1)
The Raman measurements were recorded on a Jobin-Yvon HR-800 Labram spectrometer
with double-notch filtering and air cooled CCD detector at the Ecole Normale Superieure
(ENS, Lyon). The spectrometer was used in backscattering geometry as shown in Fig. 3.11.
The laser beam (514.5 nm exciting lines of an Ar+ laser) is focused down to a 2 µm spot

48 Experimental set-up
on the sample and the backscattered light is collected through the same objective. In our
experiments high resolution spectra (∼ 0.5 cm−1) have been collected at room temperature
as a function of pressure. During high pressure experiments, due to the unavoidable
backward scattering through the diamond of the high pressure cell, we didn’t collect data
in the frequency shift region around 1332 cm−1 because it was masked by the very strong
diamond peak. For our measurements the optimum laser power was found to be 5 mW,
measured directly before the high pressure cell in order to avoid laser-induced heating of
the sample. A picture of the set-up used for collecting Raman scattering data is shown in
Fig. 3.11.
Figure 3.11: Scheme of the geometry used in our Raman experiments.

Chapter 4
Pressure induced distortion of the
C60 molecule in Rb6C60 and Cs6C60
In this chapter, we report a detailed experimental and theoretical study of the Rb6C60
and Cs6C60 systems under pressure. X-ray diffraction and x-ray absorption experiments
have been performed up to around 15 GPa at room temperature. We have coupled the
experimental results with ab initio calculations in order to understand the mechanisms
taking place during the compression of these intercalated systems. The results presented
in this chapter are consistent with a pressure induced modification of the shape of the
C60 molecule. This deformation constitutes an enhancement of the calculated distortion
of the molecule in these intercalated compounds at ambient conditions [69] discussed in
section 1.4.
4.1 Introduction
In chapter 1 we mentioned that the C60 fullerene and its compounds have attracted much
attention due to some of their extraordinary properties, related to the high symmetry
and simplicity of the molecule. Among these, the compressibility of a single buckminster-
fullerene molecule is calculated to have values between 700 and 900 GPa [43, 44], ex-
ceeding significantly that of diamond (around 440 GPa). Subsequently, most studies of
the high pressure behavior of fullerene-based crystals have considered the molecule as not
deformable up to the formation of intermolecular bonds. In fact, under high pressure
and high temperature conditions, crystals of pristine C60’s follow a series of phase trans-
formations including the formation of 1D, 2D or 3D polymers as explained in chapter 1
[53, 111, 28, 18, 20, 48, 57]. Polymerization can lead to the deformation of the molecule

50 Pressure induced distortion of the C60 molecule in Rb6C60 and Cs6C60
[5, 57], nevertheless, a possible deformation of the non-covalently bonded C60 molecules
under compression has not been detected yet. On the other side, the ionic interaction due
to alkali intercalation has been predicted to give rise to a distortion of the C60 [69] com-
pared to the isolated molecule. No experimental evidence of such deformation has been
provided up to now. The application of pressure constitutes a possible means to enhance
such distortion and its exploration is the object of this chapter. In addition, recent studies
[71] have shown that for high Rb content, i.e. in Rb6C60, there is no phase transformation
up to 22 GPa and this makes of such system a very favorable case for the study of the
evolution of the C60 molecule up to high pressures. Consequently, Rb6C60 and Cs6C60
constitute good candidate systems for the study of the pressure evolution of the geometry
of the C60 molecule.
4.2 Experimental details
The method employed for the synthesis of the Rb6C60 and Cs6C60 compounds is reported
in appendix A. The quality of the obtained sample was verified by XRD and it is reported
in the next section for the Cs6C60 system and in appendix A (Figure 8.13, panel (c)), for
the Rb6C60.
High pressure experiments were performed at the European Synchrotron Radiation
Facility (ESRF, Grenoble, France) using a “Paris-Edinburgh” (PE) pressure device [81]
with 5 mm sintered diamond anvils [83].
Angular dispersive XRD experiments were performed at the high-pressure insertion de-
vice ID27 beamline [110] by angle-resolved measurements. The monochromatic beam with
wavelength λ=0.3738 A was focused on the sample using mirrors in the Kirkpatrick-Baez
geometry. The diffraction patterns were recorded on a large area scanning MAR345 image
plate and were analyzed using the FIT2D [112] software package. XAS measurements
were performed at the bending magnet BM29 beamline [103] in transmission geometry.
For pressure calibration, XRD patterns were collected by means of a MAR345 image plate
detector mounted off-axis with respect to the beam in analogy to the setup described in
Ref. [104]. The image plate position and the selected energy for XRD measurements
have been chosen for each experimental run (Cs6C60 and Rb6C60) in order to optimize the
detection of the most intense Debye-Scherrer rings of the pressure markers.
In both XRD and XAS experiments samples were inserted in CuBe alloy (2% wt of
Be) capsules, which were themselves embedded in a MgO cylinder and inserted in graphite
(for Cs6C60) or rhenium [83] (for Rb6C60) resistive furnaces for the high pressure-high
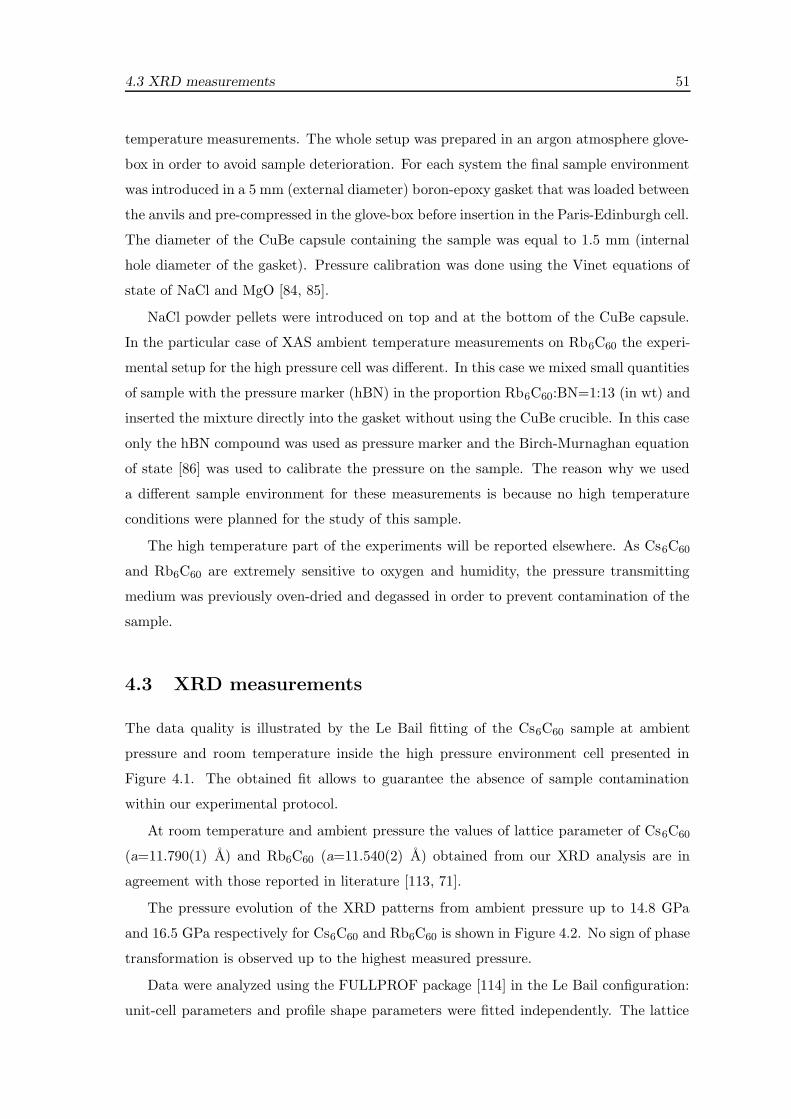
4.3 XRD measurements 51
temperature measurements. The whole setup was prepared in an argon atmosphere glove-
box in order to avoid sample deterioration. For each system the final sample environment
was introduced in a 5 mm (external diameter) boron-epoxy gasket that was loaded between
the anvils and pre-compressed in the glove-box before insertion in the Paris-Edinburgh cell.
The diameter of the CuBe capsule containing the sample was equal to 1.5 mm (internal
hole diameter of the gasket). Pressure calibration was done using the Vinet equations of
state of NaCl and MgO [84, 85].
NaCl powder pellets were introduced on top and at the bottom of the CuBe capsule.
In the particular case of XAS ambient temperature measurements on Rb6C60 the experi-
mental setup for the high pressure cell was different. In this case we mixed small quantities
of sample with the pressure marker (hBN) in the proportion Rb6C60:BN=1:13 (in wt) and
inserted the mixture directly into the gasket without using the CuBe crucible. In this case
only the hBN compound was used as pressure marker and the Birch-Murnaghan equation
of state [86] was used to calibrate the pressure on the sample. The reason why we used
a different sample environment for these measurements is because no high temperature
conditions were planned for the study of this sample.
The high temperature part of the experiments will be reported elsewhere. As Cs6C60
and Rb6C60 are extremely sensitive to oxygen and humidity, the pressure transmitting
medium was previously oven-dried and degassed in order to prevent contamination of the
sample.
4.3 XRD measurements
The data quality is illustrated by the Le Bail fitting of the Cs6C60 sample at ambient
pressure and room temperature inside the high pressure environment cell presented in
Figure 4.1. The obtained fit allows to guarantee the absence of sample contamination
within our experimental protocol.
At room temperature and ambient pressure the values of lattice parameter of Cs6C60
(a=11.790(1) A) and Rb6C60 (a=11.540(2) A) obtained from our XRD analysis are in
agreement with those reported in literature [113, 71].
The pressure evolution of the XRD patterns from ambient pressure up to 14.8 GPa
and 16.5 GPa respectively for Cs6C60 and Rb6C60 is shown in Figure 4.2. No sign of phase
transformation is observed up to the highest measured pressure.
Data were analyzed using the FULLPROF package [114] in the Le Bail configuration:
unit-cell parameters and profile shape parameters were fitted independently. The lattice

52 Pressure induced distortion of the C60 molecule in Rb6C60 and Cs6C60
Figure 4.1: Le Bail fit of the Cs6C60 XRD pattern obtained in the high pressure setup
described in the text at room temperature and ambient pressure (Rwp=18.0% and χ2=3.9).
The ticks correspond from top to bottom to MgO, CuBe alloy, Cs6C60 and graphite. The
star labels point to peaks due to the B-epoxy gasket. The lower line corresponds to the
residual pattern.
parameter of Rb6C60 and Cs6C60 for the different values of pressure obtained from the Le
Bail fit of x-ray diffraction data are reported in Table 4.1.
Figure 4.3 shows the relative volume variation as a function of pressure obtained from
the lattice parameters. The experimental value of the bulk modulus, B0, and its pressure
derivative, B′
0, were obtained by fitting the experimental volume vs pressure (V vs P)
points with the Murnaghan equation [115] of state whose expression is:
P =B0
B′
0
[(1
x
)3B′0 − 1
]
(4.1)
where V0 is the equilibrium volume at room temperature, x = (V/V0)1/3, B0 is isother-
mal bulk modulus (B0 = (−V dP/dV )) calculated at the V0 and B′
0 is ∂B0/∂P .
The obtained values are shown in Table 4.3. We obtain bulk modulus values of 30
(/pm3) and 33 (/pm3) GPa for Rb6C60 and Cs6C60, respectively and they coincide within
the experimental error (Table 4.3). This can be appreciated also in Figure 4.3 where no

4.3 XRD measurements 53
Figure 4.2: Pressure evolution of the XRD pattern of Cs6C60 (upper panel) and Rb6C60
(lower panel) from ambient pressure (AP) up to 14.8 GPa and from 0.4 up to 16.5 GPa,
respectively. Data have been normalized to the intensity of the (312) Bragg reflection.
Labels denote the main Bragg peaks as well as reflections originating from the sample
environment. ’Cu’ stands for the CuBe alloy capsule. In the lower panel some new Bragg
reflections appearing at 5.7 GPa arise from the boron-epoxy gasket. They are indicated
with the ’+’ symbol.

54 Pressure induced distortion of the C60 molecule in Rb6C60 and Cs6C60
straightforward conclusion about the relative compressibility of the two systems can be
established due to the experimental uncertainties.
Figure 4.3: Experimental pressure dependence of the volume of Cs6C60 and Rb6C60 rela-
tive to their ambient pressure values as obtained by XRD. We report the best fit curves
of the Murnaghan equation of state function for the two systems.
Our obtained B0 value for Rb6C60, 30 GPa, is considerably smaller than the one
experimentally found by Sabouri-Dodoran et al. [71] by studying the evolution of the
lattice parameter on three Bragg reflections with no pressure transmitting medium. They
obtained 55.4 and 54 GPa by using the Murnaghan and the Vinet equation of state,
respectively. Due to the high correlation (0.98+) between B0 and its pressure derivative,
it is important to consider that in our case B′
0, which is 8.5, is significantly higher that
those obtained by Sabouri-Dodoran et al. (5.13 and 6.0 for the Murnaghan and Vinet
respectively). Nevertheless, the B0 value that we obtain is smaller compared to their
values even if such correlation is taken into account.
In addition, we have also used the Vinet [116, 117] and the Birch-Murnaghan [118]
equation of state with results lying within our experimental uncertainty.

4.4 XAS measurements 55
system pressure lattice parameter
(GPa) (A)
Rb6C60 AP 11.540(2)
0.4 11.450(2)
2.8 11.260(2)
5.7 11.097(2)
8.4 11.015(2)
10.5 10.941(3)
12.4 10.872(3)
14.2 10.828(4)
16.5 10.777(5))
Cs6C60 AP 11.790(1)
1.7 11.609(1)
4.5 11.4236(4)
6.4 11.3414(4)
7.4 11.3163(5)
10.4 11.2109(4)
14.8 11.0796(5)
Table 4.1: We report the values of
the lattice parameter of Rb6C60 and
Cs6C60 for the different values of
pressure obtained from the Le Bail
fit of x-ray diffraction data. The un-
certainty on the values of the pres-
sure are 0.3 GPa while the values of
the lattice parameter are reported
with the statistical noise obtained
from the fit.
4.4 XAS measurements
The XAS data were measured at the Cs K-edge (35.89 keV) and Rb K-edge (15.20 keV) for
Cs6C60 and Rb6C60 from ambient pressure up to 15.7 GPa and 8.2 GPa, respectively. The
XANES (X-ray Absorption Near Edge Structure) part of the spectra evolved smoothly in
correspondence with the lack of phase transformation as confirmed by the XRD data. The
EXAFS data analysis of Cs6C60 and Rb6C60 was performed using the GNXAS package
[72, 73]. The extracted signals are shown in Figure 4.4.
The evolution of the structural parameters of the first coordination shell as a function
of pressure was obtained by fitting directly the absorption data without any noise filtering
or preliminary background substraction.
In the case of Rb6C60, the Rb K-edge double-electronic excitations [119] have been
considered and kept fixed during the fitting procedure to the values obtained from the
analysis of data at ambient pressure and room temperature where non-structural com-
ponents are more clearly observable. In particular the 1s3d and 1s3p double excitations
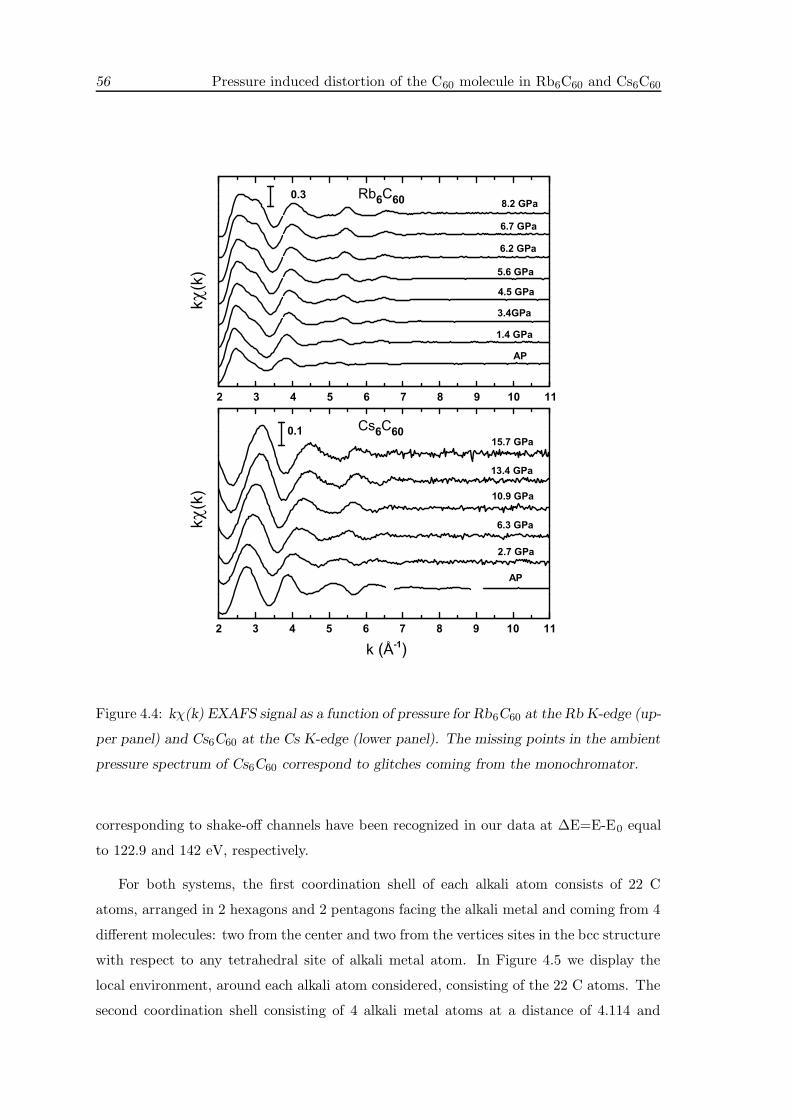
56 Pressure induced distortion of the C60 molecule in Rb6C60 and Cs6C60
Figure 4.4: kχ(k) EXAFS signal as a function of pressure for Rb6C60 at the Rb K-edge (up-
per panel) and Cs6C60 at the Cs K-edge (lower panel). The missing points in the ambient
pressure spectrum of Cs6C60 correspond to glitches coming from the monochromator.
corresponding to shake-off channels have been recognized in our data at ∆E=E-E0 equal
to 122.9 and 142 eV, respectively.
For both systems, the first coordination shell of each alkali atom consists of 22 C
atoms, arranged in 2 hexagons and 2 pentagons facing the alkali metal and coming from 4
different molecules: two from the center and two from the vertices sites in the bcc structure
with respect to any tetrahedral site of alkali metal atom. In Figure 4.5 we display the
local environment, around each alkali atom considered, consisting of the 22 C atoms. The
second coordination shell consisting of 4 alkali metal atoms at a distance of 4.114 and

4.4 XAS measurements 57
Figure 4.5: View of the first coordination shell of each alkali metal atom in the studied
M6C60 systems. It consists of 22 C atoms, arranged in 2 hexagons and 2 pentagons and
the <M-C> distance obtained from our EXAFS analysis (at ambient pressure) is 3.440(1)
and 3.550(1) A, in Rb6C60 and Cs6C60, respectively.
4.194 A1 (at ambient conditions) in Rb6C60 and Cs6C60, respectively, was not considered
in the fitting procedure for data under pressure because the data quality is not sufficient
to include such contribution.
The EXAFS signal of Cs6C60 at ambient pressure and room temperature and the best
fit are reported in Figure 4.6. The calculated total signal takes into account the first
22 carbon neighbors and the first 4 Cs neighbors contributions, labelled kγ(2)1 and kγ
(2)2 ,
respectively.
For both systems, Rb6C60 and Cs6C60, the pressure evolution of the first coordination
shell has been studied considering an asymmetric distribution of these C atoms around
each alkali metal photo-absorber Rb and Cs atom.
Phases and amplitudes of the EXAFS signals were generated by considering a cluster
of 22 carbon atoms and 4 alkali metal atoms around the photo-absorber. Different clusters
derived from the compressed structure obtained by our ab initio calculations were used as
initial inputs for the analysis of the spectra at different pressures. In Table 4.2 we report
the structural parameters obtained from the EXAFS analysis: the first coordination shell
distance (<M-C>, with M=Rb,Cs), σ 2 which is the variance of the distribution function
of the carbon atoms around each alkali metal, and β which is a parameter related to the
asymmetry of the distribution (see section 2.1).
In Figure 4.7 we report the relative evolution of the “interstitial” volume (between
1These distances of the M-M (M=Rb and Cs) coordination shell in the two systems correspond to those
calculated from XRD data and not they have not been obtained from the EXAFS data analysis.
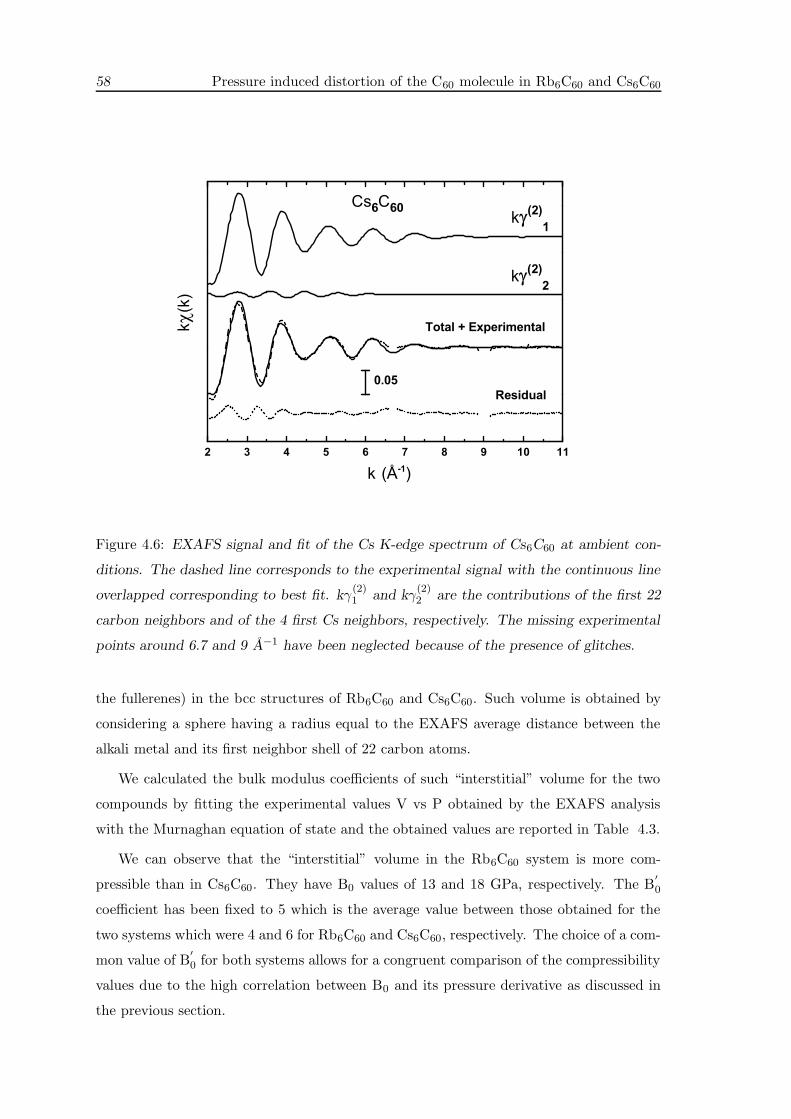
58 Pressure induced distortion of the C60 molecule in Rb6C60 and Cs6C60
Figure 4.6: EXAFS signal and fit of the Cs K-edge spectrum of Cs6C60 at ambient con-
ditions. The dashed line corresponds to the experimental signal with the continuous line
overlapped corresponding to best fit. kγ(2)1 and kγ
(2)2 are the contributions of the first 22
carbon neighbors and of the 4 first Cs neighbors, respectively. The missing experimental
points around 6.7 and 9 A−1 have been neglected because of the presence of glitches.
the fullerenes) in the bcc structures of Rb6C60 and Cs6C60. Such volume is obtained by
considering a sphere having a radius equal to the EXAFS average distance between the
alkali metal and its first neighbor shell of 22 carbon atoms.
We calculated the bulk modulus coefficients of such “interstitial” volume for the two
compounds by fitting the experimental values V vs P obtained by the EXAFS analysis
with the Murnaghan equation of state and the obtained values are reported in Table 4.3.
We can observe that the “interstitial” volume in the Rb6C60 system is more com-
pressible than in Cs6C60. They have B0 values of 13 and 18 GPa, respectively. The B′
0
coefficient has been fixed to 5 which is the average value between those obtained for the
two systems which were 4 and 6 for Rb6C60 and Cs6C60, respectively. The choice of a com-
mon value of B′
0 for both systems allows for a congruent comparison of the compressibility
values due to the high correlation between B0 and its pressure derivative as discussed in
the previous section.

4.5 Ab initio DFT results 59
system pressure <M-C> σ 2 β
(GPa) (A) (A 2)
Rb6C60 AP 3.440(1) 0.051(1) 0.514(1)
1.4 3.348(2) 0.036(1) 0.460(1)
1.9 3.3436(2) 0.035(1) 0.361(2)
3.4 3.249(2) 0.029(1) 0.095(2)
4.5 3.218(4) 0.027(3) 0.020(5)
5.6 3.193(4) 0.026(3) 0.000(8)
6.2 3.170(5) 0.025(4) 0.000(8)
6.7 3.165(5) 0.024(5) 0.000(8)
8.2 3.139(6) 0.023(7) 0.000(8)
Cs6C60 AP 3.550(1) 0.024(1) 0.400(1)
2.7 3.434(2) 0.038(1) 0.002(1)
6.3 3.313(2) 0.035(1) 0.000(2)
10.9 3.218(3) 0.031(3) 0.000(4)
13.4 3.167(4) 0.029(5) 0.000(5)
15.7 3.147(5) 0.029(6) 0.000(7)
Table 4.2: Structural parameters <M-C> (first coordination shell distance), σ 2 (variance
of the distribution) and β (asymmetry of the distribution) obtained from the EXAFS
analysis of Rb6C60 and Cs6C60.
4.5 Ab initio DFT results
We have performed density functional ab initio simulations of the two systems under high
pressure. In particular, we have used the SIESTA [120] method mentioned in chapter 2.
We have used variationally optimized [121, 122] double-ζ polarized basis sets. Real space
integrals were performed on a mesh with a 310 Ry cutoff.
Core electrons are replaced by nonlocal, norm-conserving fully separable Trouiller-
Martins pseudopotentials. In the calculations 2s and 2p orbitals of C atoms were explicitly
included in the valence. For the Rb and Cs atoms, we included both semicore and valence
orbitals, the 5s and 4p and the 6s and 5p, respectively. For Cs atoms in particular, the
inclusion of both semicore and valence orbitals was found to be critical in order to correctly
predict the structural properties of this compound.
The bcc unit cell contains a total of 66 atoms and sampling of the reciprocal space was

60 Pressure induced distortion of the C60 molecule in Rb6C60 and Cs6C60
Figure 4.7: Evolution of the ”interstitial” volume of Rb6C60 and Cs6C60 relative to their
ambient pressure values as obtained by the EXAFS analysis. We report the best fit curve
of the Murnaghan equation of state function for the two systems.
performed using a 2 × 2 × 2 Monkhorost-Pack mesh.
We studied the structural and electronic evolution of Rb6C60 and Cs6C60 as a function
of pressure by decreasing the lattice parameter from the experimental value found at
ambient pressure and room temperature (a=11.54 A and a=11.79 A) [71] down to 10.70 A
and 11.00 A, respectively. This corresponds to the following pressure range [-1.8; 15.7] GPa
for Rb6C60 and [-1.2; 14.3] GPa for Cs6C60. The negative values of pressure corresponding
to the experimental lattice parameters found at ambient conditions come from the fact
that the DFT calculations apply to systems at zero Kelvin temperature. In addition, it
must be reminded here, that the use of the LDA approximation is known to give too short
distances.
For the different values of the volume we have minimized the total energy until the
forces on atoms were smaller than 0.04 eV/A.
Both the structural and electronic evolution of the two systems confirm the phase
stability observed experimentally up to 8.2 and 15.7 GPa for the Rb6C60 and Cs6C60
compounds, respectively.

4.5 Ab initio DFT results 61
Both systems are insulators at low pressure with the t1u 3-fold degenerate state com-
pletely occupied and a gap between the highest occupied and the lowest unoccupied band
gap of 0.66 and 0.63 eV for Cs6C60 and Rb6C60, respectively. The electronic structure
shows a progressive closure of the gap as a function of pressure resulting from the band-
width broadening consistent with the increase in density. In Figure 4.8 we report the
evolution of the gap and the evolution of the bandwidth of the t1u (highest occupied
band) and t1g (lowest occupied band) for both systems as a function of pressure. These
data show evidence of a pressure induced metallization which should apply in the absence
of structural phase transformations.
In Figure 4.9 we show the two E(V) calculated curves. They have been fitted by using
the Murnaghan equation of state. The obtained coefficients are reported in Table 4.3.
We observe that even if the compressibility values of Rb6C60 (23 GPa) and Cs6C60 (22
GPa) are different from those obtained experimentally, they coincide for the two systems
within the error and this result is in close agreement with our experimental observations.
Figure 4.8: Electronic struc-
ture evolution of the two sys-
tems as a function of pressure.
The evolution of the calculated
gap (upper panel) between the
highest occupied (HO) and the
lowest unoccupied (LU) bands
and the bandwidth W (lower
panel) as a function of pressure
is shown in the picture for both
systems. The rhombus symbol
in the lower panel corresponds
to the highest occupied (HO)
bands values.

62 Pressure induced distortion of the C60 molecule in Rb6C60 and Cs6C60
Figure 4.9: Calculated total energy versus volume for Rb6C60 (upper left panel), Cs6C60
(lower left panel), C60 molecule in the Rb6C60 (upper right panel) and Cs6C60 (lower
right panel) structure. The continuous line is a fit of the calculated E(V) points by the
Murnaghan equation of state.
However, this is in contradiction with the theoretical work of Ranjan et al. [123] where
they found bulk moduli of 52.5 GPa and 38.2 GPa for Rb6C60 and Cs6C60, respectively.
The C60 molecule compressibility has been studied in the two different systems. While
we cannot partition the total energy of the system into two separated C60 and alkaline
contributions, we can estimate the C60 compressibility by considering the variations of the
total energy of the Rb6C60 and Cs6C60 structures as a function of the molecule volume.
The volumen of the C60 molecule is calculated numerically as a discrete integral of the
space enclosed by the 60 C atoms. This is computed in the real grid built in the SIESTA
calculation. The E(V) curves are shown in Figure 4.9. The compressibility coefficients
have been obtained by fitting the E vs V points with the Murnaghan equation of state
and the result is reported in Table 4.3. The C60 molecule belonging to Rb6C60 shows
a bulk modulus (680 GPa) coefficient higher than for Cs6C60 (530 GPa). Even though
these values are smaller than those previously reported for the isolated molecule [43, 44],

4.6 Discussion 63
techniques Rb6C60 Rb6C60 Cs6C60 Cs6C60
B0 (GPa) B′
0 B0 (GPa) B′
0
Total volume XRD 30 (±3) 8.5 (±0.5) 33 (±3) 8.4 (±0.5)
Total volume Calculations 23 (±1) 6.6 (±0.2) 22 (±3) 6.6 (±0.2)
C60 volume Calculations 680 (±20) 6.4 530 (±18) 6.4
“Interstitial” volume EXAFS 13 (±3) 5 18 (±3) 5
Table 4.3: Bulk modulus B0 coefficients and its derivative B′
0 of the two systems obtained
from XRD data and ab initio calculations, of the C60 molecule in the two different sys-
tems as obtained from ab initio calculations and of the “interstitial” volume (<M-C>)3
obtained from EXAFS data analysis. The errors of the quantities obtained from ab initio
calculations correspond to the standard error of the best fit values while for the quantities
obtained experimentally also the error propagation has been considered.
a meaningful comparison cannot be carried out due to our method used for the estimation
of the bulk modulus. Nevertheless, the comparison of the compressibility between the two
systems, calculated within the same approximation, can be, in principle, fairly made.
4.6 Discussion
Important considerations arise by considering the different experimental and theoretical
bulk moduli given in Table 4.3. We should be aware that some of the compressibilities
defined here do not correspond to the thermodynamic ones, as they have a local character.
Nevertheless, their use has already been found to be extremely useful in the study of
isotropic [124] as well as in anisotropic systems [125].
By considering the geometric volume of the fullerene, VF , the total volume of the bcc
fulleride cell, VT , of the two M6C60 systems can be decomposed as:
VT = 2VF + nVi (4.2)
nVi represents the total “interstitial” volume in the bcc unit cell.
We have defined then a volume corresponding to the average distance between the alkali
metal atom and the first 22 carbon atoms neighbors as we did in EXAFS, that corresponds
to nVi. The evaluation from ab initio calculations of all the variables in eq. 4.2, i.e. VT ,
VF and Vi leads to a value of n equal to 22. By deriving and opportunely reorganizing
eq. 4.2 we can then conclude that with a 1% uncertainty, coming from the fact that we
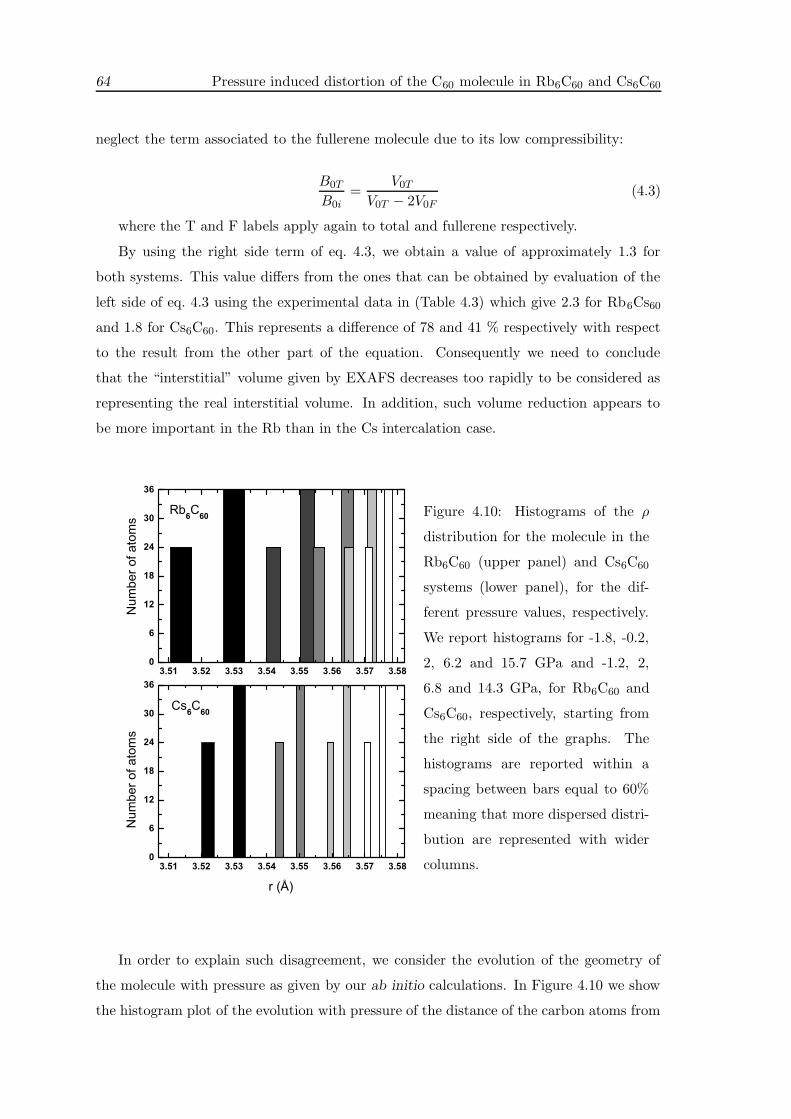
64 Pressure induced distortion of the C60 molecule in Rb6C60 and Cs6C60
neglect the term associated to the fullerene molecule due to its low compressibility:
B0T
B0i=
V0T
V0T − 2V0F(4.3)
where the T and F labels apply again to total and fullerene respectively.
By using the right side term of eq. 4.3, we obtain a value of approximately 1.3 for
both systems. This value differs from the ones that can be obtained by evaluation of the
left side of eq. 4.3 using the experimental data in (Table 4.3) which give 2.3 for Rb6Cs60
and 1.8 for Cs6C60. This represents a difference of 78 and 41 % respectively with respect
to the result from the other part of the equation. Consequently we need to conclude
that the “interstitial” volume given by EXAFS decreases too rapidly to be considered as
representing the real interstitial volume. In addition, such volume reduction appears to
be more important in the Rb than in the Cs intercalation case.
Figure 4.10: Histograms of the ρ
distribution for the molecule in the
Rb6C60 (upper panel) and Cs6C60
systems (lower panel), for the dif-
ferent pressure values, respectively.
We report histograms for -1.8, -0.2,
2, 6.2 and 15.7 GPa and -1.2, 2,
6.8 and 14.3 GPa, for Rb6C60 and
Cs6C60, respectively, starting from
the right side of the graphs. The
histograms are reported within a
spacing between bars equal to 60%
meaning that more dispersed distri-
bution are represented with wider
columns.
In order to explain such disagreement, we consider the evolution of the geometry of
the molecule with pressure as given by our ab initio calculations. In Figure 4.10 we show
the histogram plot of the evolution with pressure of the distance of the carbon atoms from
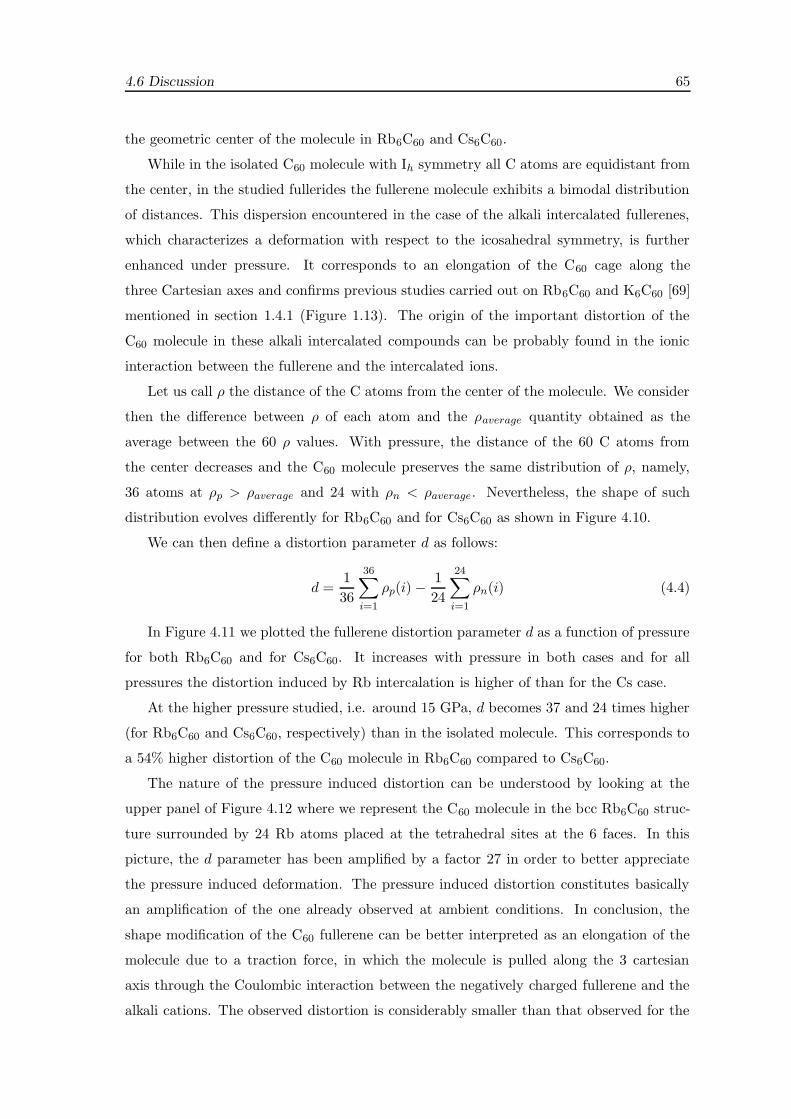
4.6 Discussion 65
the geometric center of the molecule in Rb6C60 and Cs6C60.
While in the isolated C60 molecule with Ih symmetry all C atoms are equidistant from
the center, in the studied fullerides the fullerene molecule exhibits a bimodal distribution
of distances. This dispersion encountered in the case of the alkali intercalated fullerenes,
which characterizes a deformation with respect to the icosahedral symmetry, is further
enhanced under pressure. It corresponds to an elongation of the C60 cage along the
three Cartesian axes and confirms previous studies carried out on Rb6C60 and K6C60 [69]
mentioned in section 1.4.1 (Figure 1.13). The origin of the important distortion of the
C60 molecule in these alkali intercalated compounds can be probably found in the ionic
interaction between the fullerene and the intercalated ions.
Let us call ρ the distance of the C atoms from the center of the molecule. We consider
then the difference between ρ of each atom and the ρaverage quantity obtained as the
average between the 60 ρ values. With pressure, the distance of the 60 C atoms from
the center decreases and the C60 molecule preserves the same distribution of ρ, namely,
36 atoms at ρp > ρaverage and 24 with ρn < ρaverage. Nevertheless, the shape of such
distribution evolves differently for Rb6C60 and for Cs6C60 as shown in Figure 4.10.
We can then define a distortion parameter d as follows:
d =1
36
36∑
i=1
ρp(i) −1
24
24∑
i=1
ρn(i) (4.4)
In Figure 4.11 we plotted the fullerene distortion parameter d as a function of pressure
for both Rb6C60 and for Cs6C60. It increases with pressure in both cases and for all
pressures the distortion induced by Rb intercalation is higher of than for the Cs case.
At the higher pressure studied, i.e. around 15 GPa, d becomes 37 and 24 times higher
(for Rb6C60 and Cs6C60, respectively) than in the isolated molecule. This corresponds to
a 54% higher distortion of the C60 molecule in Rb6C60 compared to Cs6C60.
The nature of the pressure induced distortion can be understood by looking at the
upper panel of Figure 4.12 where we represent the C60 molecule in the bcc Rb6C60 struc-
ture surrounded by 24 Rb atoms placed at the tetrahedral sites at the 6 faces. In this
picture, the d parameter has been amplified by a factor 27 in order to better appreciate
the pressure induced deformation. The pressure induced distortion constitutes basically
an amplification of the one already observed at ambient conditions. In conclusion, the
shape modification of the C60 fullerene can be better interpreted as an elongation of the
molecule due to a traction force, in which the molecule is pulled along the 3 cartesian
axis through the Coulombic interaction between the negatively charged fullerene and the
alkali cations. The observed distortion is considerably smaller than that observed for the
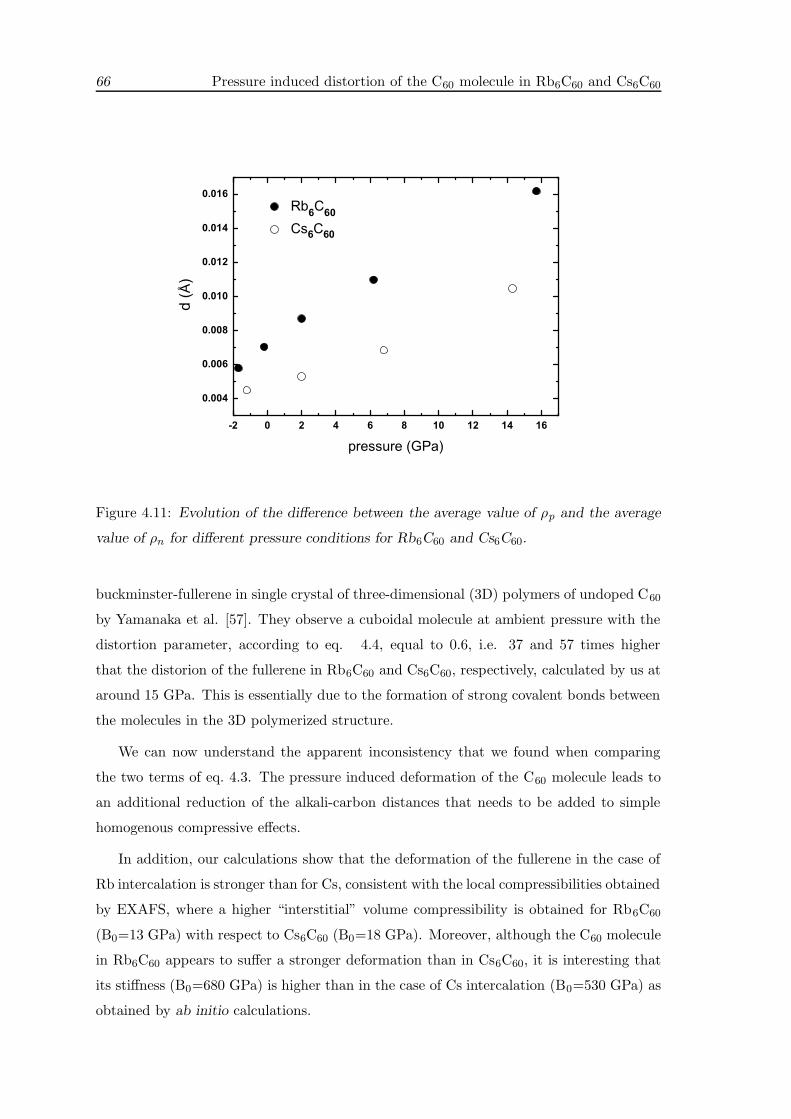
66 Pressure induced distortion of the C60 molecule in Rb6C60 and Cs6C60
Figure 4.11: Evolution of the difference between the average value of ρp and the average
value of ρn for different pressure conditions for Rb6C60 and Cs6C60.
buckminster-fullerene in single crystal of three-dimensional (3D) polymers of undoped C60
by Yamanaka et al. [57]. They observe a cuboidal molecule at ambient pressure with the
distortion parameter, according to eq. 4.4, equal to 0.6, i.e. 37 and 57 times higher
that the distorion of the fullerene in Rb6C60 and Cs6C60, respectively, calculated by us at
around 15 GPa. This is essentially due to the formation of strong covalent bonds between
the molecules in the 3D polymerized structure.
We can now understand the apparent inconsistency that we found when comparing
the two terms of eq. 4.3. The pressure induced deformation of the C60 molecule leads to
an additional reduction of the alkali-carbon distances that needs to be added to simple
homogenous compressive effects.
In addition, our calculations show that the deformation of the fullerene in the case of
Rb intercalation is stronger than for Cs, consistent with the local compressibilities obtained
by EXAFS, where a higher “interstitial” volume compressibility is obtained for Rb6C60
(B0=13 GPa) with respect to Cs6C60 (B0=18 GPa). Moreover, although the C60 molecule
in Rb6C60 appears to suffer a stronger deformation than in Cs6C60, it is interesting that
its stiffness (B0=680 GPa) is higher than in the case of Cs intercalation (B0=530 GPa) as
obtained by ab initio calculations.

4.6 Discussion 67
In conclusion, this chapter reports a detailed study of the Rb6C60 and Cs6C60 systems
under pressure. In particular we coupled the complementary information obtained by XRD
and EXAFS with the result obtained by ab initio calculations in order to understand the
mechanisms taking place during the compression of such systems.
We have calculated and measured the compressibility of both systems and compared
this to that obtained by EXAFS for the “interstitial” volumes between molecules. Both for
Rb6C60 and Cs6C60 the EXAFS compressibilities appear to be too small to correspond to
an isotropic compression of the system. The analysis of the pressure induced deformation
of the C60 molecule via ab initio calculations allows us to understand such differences.
We infer that compression of the C60 molecule is accompanied by a shape-changing
deformation under pressure. This deformation is analogous to pulling the molecule through
the three orthogonal axis pointing towards the bcc faces containing the alkali metals.
Both experiments and calculations agree with a deformation of the fullerene molecule
x
z
y
Figure 4.12: Pressure induced distortion of C60. The distorted C60 molecule is represented
together with the 24 Rb atoms at the tetrahedral sites (upper panel). We report the
molecule at 15.7 GPa with an enhanced distortion such that d has been increased by a
factor 27. The 32 C atoms having a greater than average distance from the center, are
depicted in dark-grey color while the 24 C atoms having a smaller than average distance
from the center, are depicted in light-grey.

68 Pressure induced distortion of the C60 molecule in Rb6C60 and Cs6C60
which is more important for Rb than for Cs intercalation. The defined distortion parameter
of the fullerene, d, obtained by analysing the evolution of both structures under pressure,
is 54% higher in Rb6C60 than in Cs6C60 at around 15 GPa.

Chapter 5
High pressure stability of C60
molecules by alkali metal doping
in Cs6C60
In this chapter we study the Cs6C60 molecular crystal by Raman spectroscopy measure-
ments and by ab initio calculations, under high pressure. The Raman scattering data have
been collected from ambient pressure up to 45.5 GPa, at room temperature. We show that
the intercalation of Cesium atoms in the C60 crystalline structure allows preserving the C60
molecules up to the maximum studied pressure, i.e. more than twice the amorphization
pressure of solid C60. In addition, we observe that high resolution measurements allow
the detection of six new Raman modes and several partners in doublets in addition to the
Raman lines previously observed for the same system. The symmetry of the new observed
modes has been identified through our calculations.
5.1 Introduction
The high bulk modulus values calculated for the C60 molecule (700 and 900 GPa) [43, 44]
make the C60 fullerene a good candidate for the constitution of a molecular solid able
to sustain very high pressures, a domain which is usually reserved to simple molecular
systems, with a very limited number of atoms as diatomic molecular solids. In the pristine
fcc structure, i.e. the natural association of the C60 fullerenes, such expectations are
frustrated by the interaction between molecules, which leads to the amorphization of the
structure observed at 22 GPa at room temperature [47, 46]. From that pressure, the
signature of the molecular integrity, corresponding to Raman molecular modes, is lost,

70 High pressure stability of C60 molecules by alkali metal doping in Cs6C60
implying the destruction of the molecule.
In the present work, we show that the intercalation of solid C60 with Cs alkali atoms,
leading to the formation of the Cs6C60 compound, allows the molecules to bypass such a
limitation, warranting the stability of the C60 molecules at pressures of at least 45 GPa.
5.2 Experimental details
The method employed for the synthesis of the Cs6C60 compound is reported in appendix
A. The quality of the obtained sample was verified by XRD and is reported in chapter 4.
The sample was loaded into a gasketed diamond anvil cell in a glove box using solid
NaCl as pressure transmitting medium. The pressure was calibrated by the R1 fluorescence
line of a ruby chip placed in the vicinity of the sample. High resolution Raman spectra (∼0.5 cm−1) have been collected at room temperature. The laser beam (514.5 nm exciting
line of an Ar+ laser) was focused down to a 2 micrometer spot on the sample. The
optimum laser power was found to be 5 mW, measured directly before the high pressure
cell in order to avoid laser heating.
5.3 Raman measurements
For the isolated C60 molecule with Ih symmetry, only ten of the 46 calculated vibrational
modes are Raman active (2Ag+8Hg). For the solid fcc C60 system, the symmetry-lowering
perturbation due to the crystal field associated with the condensed phase gives rise to a
very large number of allowed Raman modes. Group-theoretical analysis performed by
Dresselhaus et al. [126] showed that the solid C60 with T6h symmetry, displays 29 one-
dimensional Ag modes, 29 two dimensional Eg modes and 87 three-dimensional Tg modes.
Nevertheless, several experiments [127, 128, 46] suggested that most of these modes are
very weak or give rise to small unresolved splittings of the ten main Raman-allowed modes
of the isolated molecule.
For the fully doped Cs6C60 compound with T5h symmetry, calculations [126] show that
each of the five-dimensional Hg modes appearing in the isolated C60 molecule splits into a
two dimensional Eg and a three dimensional Tg modes. Moreover, the 3T1g, 4T2g and 6Gg
modes in the Ih symmetry should become weakly Raman active changing their symmetry
into 3Tg, 4Tg and 6(Ag+Tg), respectively.
Low-resolution (6 cm−1) Raman measurements performed at ambient conditions for
the fully doped systems M6C60 (with M=K, Rb and Cs) have been previously reported
[128, 129, 126]. In that work, ten Raman modes corresponding to the Raman active

5.3 Raman measurements 71
modes of the isolated molecule were observed. Hence, they labelled these vibrations for
convenience with the names of the irreducible representation of the Raman active modes
of the isolated C60 molecule with Ih symmetry, i.e. 2Ag+8Hg. In addition, the authors
also observed five new lines, corresponding to partners in doublets. In particular, for the
Cs6C60 system, four of the Hg modes (Hg(2), Hg(3), Hg(5) and Hg(7)) were split into
doublets by a measurable amount. For K6C60 and Rb6C60 they also observed a splitting
of the Hg(1) mode into a doublet. A more detailed discussion about theoretical predictions
compared to experimental observation of new lines in M6C60 solids due to the symmetry
lowering from Ih to T5h can be found in Ref. [126].
In the present work, we observe six new Raman modes and eight partners in doublets
in addition to the ten Raman active modes of the isolated molecule. The behavior of all
the observed lines is followed with pressure.
In Figure 5.1 we display the Raman scattering spectra in the frequency regions 220-900
cm−1 and 1050-1680 cm−1 respectively, at various pressures at room temperature. The
behavior of all the observed lines is followed with pressure. In the following we refer to the
previously ten observed intramolecular Raman vibrations as the 2Ag and 8Hg symmetry
modes of the free molecule in order to keep the same nomenclature as used in the past.
On the other hand, we label the new observed lines according to the symmetry of the
irreducible representation of the Raman active modes of the Cs6C60 system with T5h space
group.
The Raman spectra of Cs6C60 were measured from ambient pressure up to 45.5 GPa,
at room temperature. Only part of all collected spectra are represented in Figure 5.1 for
clarity.
The six new modes are labelled in Figure 5.1 as Tg(α), Tg(β), Tg(γ), Tg(δ), Tg(ε) and
Ag(α) and their symmetry has been identified through our ab initio calculations. Many
other low-frequency Raman active modes of solid Cs6C60 associated with intermolecular
and molecule-alkali metal motions have been anticipated but they have not yet been
observed as they are too weak to be experimentally detected.
Let us first discuss our Raman spectrum at ambient pressure. The ambient pressure
frequency of all the observed Raman modes is reported in Table 5.1. The ambient pressure
data have been collected on a sample in a closed glass capillary and they show lower quality
compared to the high pressure spectra. It is then less evident to distinguish the Tg(α)
and Tg(β) modes whose evolution as a function of pressure has been clearly followed. For
these two modes, the ambient pressure Raman frequency has been extrapolated by using
the curbes fitted to the pressure evolution.

72 High pressure stability of C60 molecules by alkali metal doping in Cs6C60
Mode Mode ω0 ∂ω/∂P ∂ω/∂P
cm−1 cm−1/GPa cm−1/GPa
C60 Cs6C60 Cs6C60 C60 Cs6C60
up to 22 GPa up to 22.3 GPa
Ih Th exp. (this work) Ref. [130], Ref. [46] this work
Hg(1) Eg(1)+Tg(1) 269.9 1.1 2.0
† / 2.2
Hg(2) Eg(2)+Tg(2) 422.3 2.4, 0.16 0.3
427.6 / 0.3
T2g Tg(α) 460.3 / 0.5
T1g Tg(β) 476.0 / 1.1
Ag(1) Ag(1) 494.9 0.75, 0.94 3.0
Hg(3) Eg(3)+Tg(3) 657.5 -0.92, -0.55 -0.4
658.9 / -0.2
T2g Tg(γ) 677.1 / 0.1
Hg(4) Eg(4)+Tg(4) 755.9 -0.71, -0.50 2.3
759.0 / 2.6
T2g Tg(δ) 730.6 / -0.1
Hg(5) Eg(5)+Tg(5) 1081.9 / 2.6
1090.0 / 2.4
Gg Ag(α)+Tg(ε) 1116.0 / 3.4
1122.1 / 3.3
Hg(6) Eg(6)+Tg(6) 1229.3 / 4.3
1235.6 / 4.8
Hg(7) Eg(7)+Tg(7) 1382.0 4.12, 2.4 4.4
N.O. / †Ag(2) Ag(2) 1429.0 3.11, 1.7 4.5
Hg(8) Eg(8)+Tg(8) 1476.8 2.73, 3.7 3.4
1491.6 / 3.5
Table 5.1: Ambient pressure experimental Raman frequencies and first derivative of the
least-square fit curves of the linear pressure dependence of all the observed Raman modes
of Cs6C60. The linear fit has been considered up to 22.3 GPa. The pressure dependence
of the pristine solid C60 Raman lines (up to 22 GPa) are also reported for a comparison.
The ’†’ symbol indicates that the fit was not possible due to the scarcity of the observed
Raman lines under pressure.
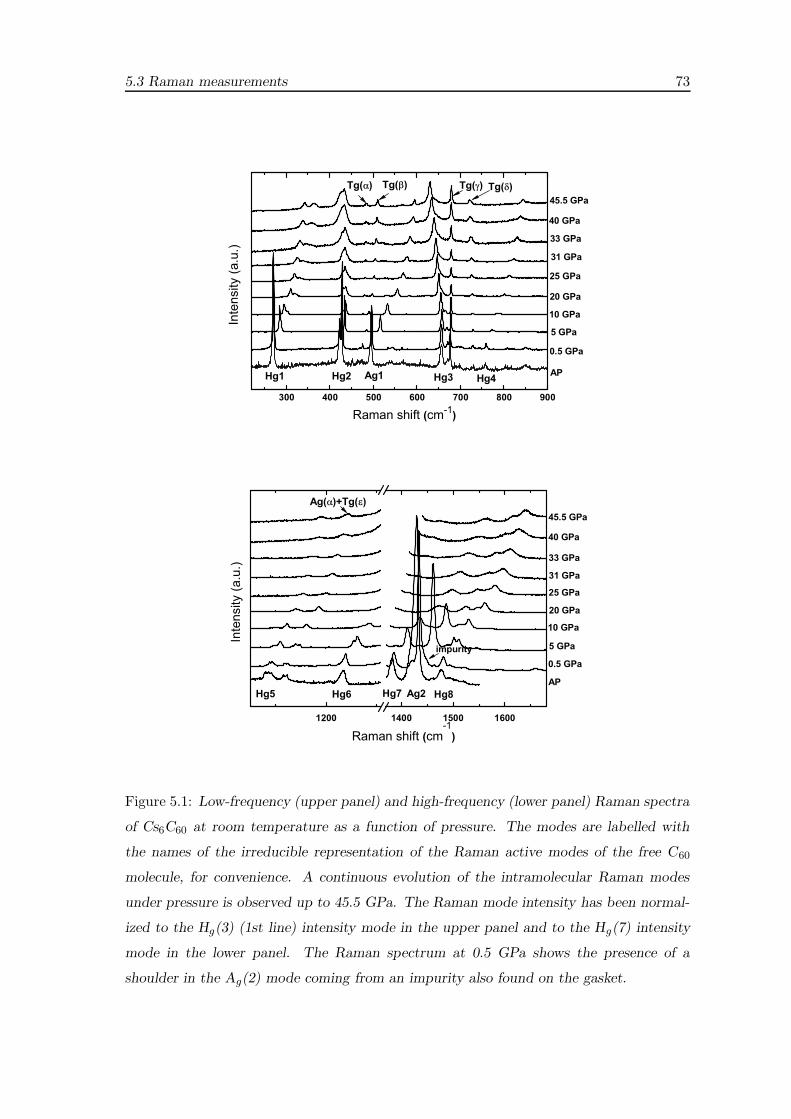
5.3 Raman measurements 73
Figure 5.1: Low-frequency (upper panel) and high-frequency (lower panel) Raman spectra
of Cs6C60 at room temperature as a function of pressure. The modes are labelled with
the names of the irreducible representation of the Raman active modes of the free C60
molecule, for convenience. A continuous evolution of the intramolecular Raman modes
under pressure is observed up to 45.5 GPa. The Raman mode intensity has been normal-
ized to the Hg(3) (1st line) intensity mode in the upper panel and to the Hg(7) intensity
mode in the lower panel. The Raman spectrum at 0.5 GPa shows the presence of a
shoulder in the Ag(2) mode coming from an impurity also found on the gasket.
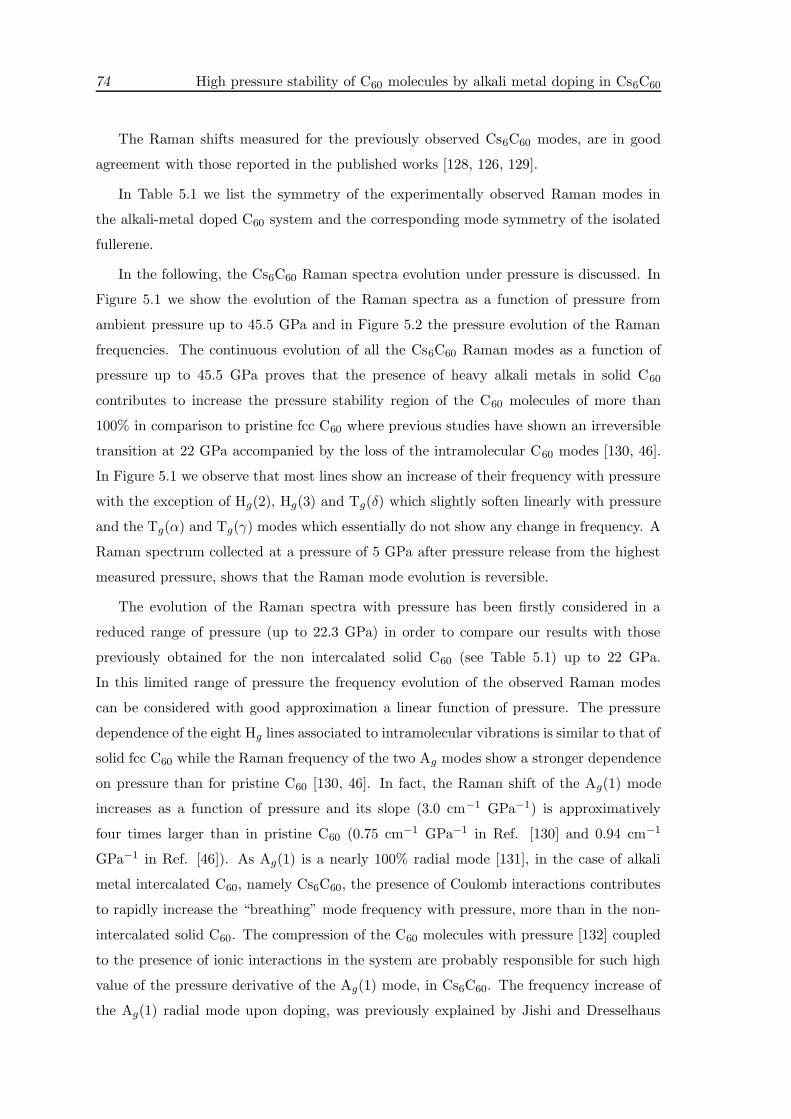
74 High pressure stability of C60 molecules by alkali metal doping in Cs6C60
The Raman shifts measured for the previously observed Cs6C60 modes, are in good
agreement with those reported in the published works [128, 126, 129].
In Table 5.1 we list the symmetry of the experimentally observed Raman modes in
the alkali-metal doped C60 system and the corresponding mode symmetry of the isolated
fullerene.
In the following, the Cs6C60 Raman spectra evolution under pressure is discussed. In
Figure 5.1 we show the evolution of the Raman spectra as a function of pressure from
ambient pressure up to 45.5 GPa and in Figure 5.2 the pressure evolution of the Raman
frequencies. The continuous evolution of all the Cs6C60 Raman modes as a function of
pressure up to 45.5 GPa proves that the presence of heavy alkali metals in solid C60
contributes to increase the pressure stability region of the C60 molecules of more than
100% in comparison to pristine fcc C60 where previous studies have shown an irreversible
transition at 22 GPa accompanied by the loss of the intramolecular C60 modes [130, 46].
In Figure 5.1 we observe that most lines show an increase of their frequency with pressure
with the exception of Hg(2), Hg(3) and Tg(δ) which slightly soften linearly with pressure
and the Tg(α) and Tg(γ) modes which essentially do not show any change in frequency. A
Raman spectrum collected at a pressure of 5 GPa after pressure release from the highest
measured pressure, shows that the Raman mode evolution is reversible.
The evolution of the Raman spectra with pressure has been firstly considered in a
reduced range of pressure (up to 22.3 GPa) in order to compare our results with those
previously obtained for the non intercalated solid C60 (see Table 5.1) up to 22 GPa.
In this limited range of pressure the frequency evolution of the observed Raman modes
can be considered with good approximation a linear function of pressure. The pressure
dependence of the eight Hg lines associated to intramolecular vibrations is similar to that of
solid fcc C60 while the Raman frequency of the two Ag modes show a stronger dependence
on pressure than for pristine C60 [130, 46]. In fact, the Raman shift of the Ag(1) mode
increases as a function of pressure and its slope (3.0 cm−1 GPa−1) is approximatively
four times larger than in pristine C60 (0.75 cm−1 GPa−1 in Ref. [130] and 0.94 cm−1
GPa−1 in Ref. [46]). As Ag(1) is a nearly 100% radial mode [131], in the case of alkali
metal intercalated C60, namely Cs6C60, the presence of Coulomb interactions contributes
to rapidly increase the “breathing” mode frequency with pressure, more than in the non-
intercalated solid C60. The compression of the C60 molecules with pressure [132] coupled
to the presence of ionic interactions in the system are probably responsible for such high
value of the pressure derivative of the Ag(1) mode, in Cs6C60. The frequency increase of
the Ag(1) radial mode upon doping, was previously explained by Jishi and Dresselhaus

5.3 Raman measurements 75
[133] by considering the variation in the electric field at the sites of the negatively charged
carbon during a vibration. This variation produces an extra radial force on these atoms
responsible for the increase in the bond-stretching force constant. In addition, the effect of
pressure is to decrease the separation between the centers of the ions and the C60 sphere
causing an increase of the electrostatic interaction and finally an increase of the Raman
shift frequency of the Ag(1) vibration. This is very similar to the case of alkali-metal
intercalated systems with small dopant ions whose increase in the Ag(1) mode frequency
with respect to solid C60 has been observed to be bigger than for larger alkali metals [129].
For the pentagonal-pinch (PP) Ag(2) mode we have found a value of 4.5 cm−1 GPa−1
which is much larger than the values obtained for solid C60 [46, 130]. On the other hand,
this value is very close to that found for Cs3C60 by Fujiki et al. [134] which is 4.0 cm−1
GPa−1. We want to remind here that the Ag(2) mode, which is a nearly 100% tangential
mode, has been observed to soften after the intercalation of Cs atoms (6 cm−1 per alkali
metal) into the C60 lattice at ambient pressure [128, 129] due to an elongation of the
average C-C bond length caused by the charge transfer to the antibonding LUMO states
of the C60 molecule [4]. Then, we observe that in Cs6C60 compounds, (as also in the case
of Cs3C60) the application of pressure increases the intraball force constant of the C60
molecule, more than in the case of pristine C60.
Finally, the two Tg(3) and Eg(3) soft modes (deriving from the Hg(3) mode) in Cs6C60
are harder than in the pristine C60 system. The most intense line at 657.5 cm−1 at ambient
pressure has a pressure coefficient of -0.4 cm−1 GPa−1 which is 30 % and 57 % smaller than
the values observed for the Hg(3) mode in solid C60 [46, 130]. This could be considered
a signature of the higher stability of the fullerene molecule in Cs6C60 with respect to the
non intercalated C60.
When considering the pressure evolution of the Raman modes up to 45.5 GPa, it turns
out that their dependence as a function of pressure is no more linear for the majority of the
Raman lines (Figure 5.2). A parabolic function, which constitutes a first approximation
of an exponential-decay function, is able to reproduce the behavior of the Raman modes
with pressure. This can be considered as an indication of anharmonic effects [135]. In
Table 5.2 we report the linear and quadratic terms corresponding to the parabolic fit of
the pressure dependence of the observed Raman modes up to 45.5 GPa.

76 High pressure stability of C60 molecules by alkali metal doping in Cs6C60
5.4 Raman spectra calculation
In parallel to experiments we performed density functional ab initio simulations to calcu-
late the zone center vibrational modes of Cs6C60 under pressure.
We have used the SIESTA [120] method discussed in chapter 2. More details about
the calculations are reported in section 4.5.
We studied the frequency evolution of the Raman modes of Cs6C60 as a function of
pressure by decreasing the lattice parameter from the experimental value found at ambient
pressure and room temperature (a=11.79 A) down to 10.00 A. This corresponds to the
pressure range [-1.2; 98] GPa.
For the different volume values, we have minimized the total energy until the forces
on atoms were smaller than 0.04 eV/A [132].
The bcc unit cell contains a total of 66 atoms and sampling of the reciprocal space
was performed using a 2× 2× 2 Monkhorst-Pack mesh. We obtain the dynamical matrix
using a finite differences approach, where the atoms were displaced by ∆x=0.2A. The
Hellmann-Feynman forces were calculated for all the atoms in the system, fully building
the dynamical matrix.
We used a bond polarizability model, reported in Ref. [136] and described in appendix
B, in order to calculate the intensity of the first-order off-resonance Raman scattering. The
Raman polarizability parameters of single and double bonds in C60, used in this work are
also reported in appendix B. They have been obtained in Ref. [136] by fitting experimental
off-resonance Raman spectra of solid C60 with such model.
The predicted intensity is somewhat different from that experimentally observed. This
is due to the fact that the polarizability parameters for C atoms in Cs6C60 should radically
differ from those in the isolated C60 because of the charge transfer and also because the
single and double bond lengths change with pressure. Indeed the higher the pressure the
worse is the prediction of the Raman intensities, an indication of the degradation of the
original polarizability parameters. However, the model is a practical tool to easily identify
the Raman activity of the modes, allowing us to tightly discriminate between all the 192
modes in the spectrum.
We studied the frequency evolution of Raman active modes as obtained by ab initio
calculations together with the polarizability model. The results are reported in Figure 5.2
and Table 5.1. We report only the theoretical results obtained up to 43 GPa for a more
clear comparison with experiments.
Nevertheless, the calculations show that all Raman modes observed at low pressures

5.4 Raman spectra calculation 77
Figure 5.2: Pressure dependence of the low-frequency and high-frequency Raman modes of
Cs6C60 from ambient pressure up to 45.5 GPa and 43 GPa as obtained from experiments
(left panels) and calculations (right panels), respectively. The solid lines correspond to
least-square fits to a parabolic pressure dependence for most modes. The horizontal error
bar represents the pressure uncertainty estimated from the Lorentzian width of the ruby
R1 line; the vertical error bar are the half width at half maximum (HWHM) of each
Raman mode.
remain active even at very high pressure (98 GPa). The ten Raman modes (2Ag+8Hg)
observed experimentally and previously labelled for convenience with the names of the
irreducible representation of the Raman active modes of the isolated C60 molecule, have
been well identified in our calculations.
We observed a splitting of each Hg mode into a two-dimensional Eg mode and a three-
dimensional Tg mode, as predicted by group theory [126] and observed from our exper-
iments. Moreover, the six new observed lines, labelled as Tg(α), Tg(β), Tg(γ), Tg(δ),
Tg(ε) and Ag(α), have been well identified in this study and they all have been found to
have three-dimensional Tg symmetry except for the Ag(α) mode. The calculated first and
second derivatives of the pressure dependence of the frequencies of all the Raman modes
are reported in Table 5.2 for a comparison with the experimentally obtained values. The
fitted curves of the calculated pressure evolution frequencies reported in Table 5.2 have

78 High pressure stability of C60 molecules by alkali metal doping in Cs6C60
been considered only up to 43 GPa in order to better compare experiments and theory.
We observe a good agreement between experiments and calculations.
In conclusion, both experiments and calculations show that the molecular character of
the C60 fullerene can be maintained through alkali intercalation up to pressures at least
two times higher (around 45 GPa) than for the previously reported pure solid C60 (around
22 GPa). At the same time, as shown in chapter 3 and also in Ref. [132] a progressive
pressure-induced deformation of the molecule takes place due to the pressure enhanced
Coulombic interaction between the fullerene and the alkali metal atoms. Our study shows
that, in spite of such -slight- deformation, the molecular character of the 60-atom fullerene
is maintained. This will allow to envisage fullerene exohedral intercalation as a path to
preserve the properties of encapsulated atoms or molecules in these or larger fullerenes, at
very high pressures.

5.4 Raman spectra calculation 79
Mode ω0 ω0 ∂ω/∂P,∂2ω/∂P2 ∂ω/∂P,∂2ω/∂P2
cm−1 cm−1 cm−1/GPa,cm−2/GPa2 cm−1/GPa,cm−2/GPa2
Cs6C60 Cs6C60 Cs6C60 Cs6C60 Cs6C60
up to 45.5 GPa up to 43 GPa
Th exp. cal. exp. cal.
Eg(1)+Tg(1) 269.9 261.5 ∗ 2.4/-0.02 3.2/-0.02
† 262.6 2.6/-0.01 3.1/-0.02
Eg(2)+Tg(2) 422.3 406.7 ∗ 0.6/-0.01 0.7/ -0.01
427.6 410.8 0.6/-0.01 0.5/-0.01
Tg(α) 460.3 450.8 0.7/-0.01 0.8/-0.01
Tg(β) 476.0 452.2 1.4/-0.02 1.7/-0.02
Ag(1) 494.9 496.7 3.8/-0.04 3.7/-0.02
Eg(3)+Tg(3) 657.5 632.4 -0.2/-0.01 -0.2/-0.01
658.9 633.6 ∗ 0.1/ -0.01 -0.2/-0.01
Tg(γ) 677.1 702.4 0.1/-0.001 0.2/-0.01
Eg(4)+Tg(4) 755.9 762.0 2.7/-0.02 3.1/-0.02
759.0 765.0 ∗ 3.1/-0.02 4.1/-0.04
Tg(δ) 730.6 766.7 -0.02/-0.003 1.0/-0.01
Eg(5)+Tg(5) 1081.9 1100.6∗ 2.9/-0.02 3.6/-0.03
1090.0 1100.7 3.8/ -0.03 4.1/-0.03
Ag(α)+Tg(ε) 1116.0 1134.3 † 4.7/-0.04
1122.1 1139.2 ∗ 3.8/-0.03 4.4/ -0.03
Eg(6)+Tg(6) 1229.3 1271.7∗ 5.2/-0.08 6.6/-0.06
1235.6 1278.2 5.2/-0.04 6.9/-0.06
Eg(7)+Tg(7) 1382.0 1441.7 4.9/ -0.02 6.8/-0.05
N.O. 1450.4∗ / 7.0/-0.06
Ag(2) 1429.0 1489.0 5.2/-0.03 8.2/-0.07
Eg(8)+Tg(8) 1476.8 1522.1 4.2/-0.05 6.3/-0.05
1491.6 1528.9∗ 3.7/-0.01 5.9/-0.04
Table 5.2: Ambient pressure Raman frequencies and first and second derivatives of the
least-square fit to a parabolic pressure dependence for all modes for both experiments and
calculations. In the latter case a fit up to 43 GPa, instead of 98 GPa, has been considerend
in order to better compare the results with the experiment. The ’*’ symbols refer to the
Tg symmetry modes. The ’†’ symbol indicates that the fit was not possible due to the
scarcity of lines, observed under pressure.

80 High pressure stability of C60 molecules by alkali metal doping in Cs6C60

Chapter 6
High pressure phase transition in
Rb6C60
In this chapter we present high pressure (HP) and high temperature (HT) studies, carried
out on Rb6C60, by performing x-ray diffraction (XRD), x-ray absorption (XAS) and Ra-
man spectroscopy measurements. In particular, the occurrence of a reversible transition
has been clearly identified at around 35 GPa both at 600 K and at room temperature, by
XRD and Raman measurements, respectively. The XRD data show that the new phase
is compatible with a hexagonal unit cell structure with a=8.360(2) A and c=14.830(7) A
at 43 GPa and 600 K. At the Raman transition, Raman spectra exhibit an abrupt change
in the frequency of the normal vibrations. We speculate that the observed first order
bcc → hexagonal structure transition is accompanied by a 2D polymerization of the C60
molecules along the (001) plane.
6.1 Introduction
As discussed in more detail in chapter 1, the initial motivation of this work was the
synthesis under high temperature and high pressure conditions of three dimensional C60
polymers in the presence of alkali metals. In fact, these new materials are expected to
exhibit both high hardness and superconducting properties.
In this chapter, we present an accurate study on the evolution of the Rb6C60 system,
under high pressure and high temperature conditions, in order to check for the occurrence
of phase transitions leading to the formation of such high-dimensional polymers.
On the other hand, in the previous chapter we reported a Raman spectroscopy study
showing that the Cs6C60 compound displays an exceptional structural stability under

82 High pressure phase transition in Rb6C60
high pressure [137] (up to 45 GPa). In the present chapter, the Raman scattering study
of Rb6C60 as a function of pressure allows to compare the high pressure evolution of the
intramolecular vibrations to the case of Cs6C60.
6.2 Experimental details
The method employed for the synthesis of the Rb6C60 compound is reported in appendix
A. The XRD data reported in the next section evidence the quality of the obtained sample.
HP and HT XRD and XAS experiments were performed using diamond anvil cells
(DACs) with the x-ray beam traversing the two 2.5 mm diamonds.
The energy dispersive XAS measurements were performed at the insertion device ID24
beamline [138, 139] in transmission geometry. The beam was focused down to 10µm×10µm
FWHM (full width at half maximum).
Angular dispersive XRD experiments were performed at the insertion device ID27
beamline [110] by angle-resolved measurements. The monochromatic beam was selected
to have wavelength λ=0.3738 A and λ=0.2647 A for high temperature and room tem-
perature measurements, respectively. The focal spot size was 7µm×7µm (FWHM). The
diffraction patterns were recorded on a fast large area scanning MAR345 image plate and
ona detector-Bruker CCD for the high temperature and room temperature experiments,
respectively.
High pressure (HP) room temperature (RT) Raman spectra were recorded on a Jobin-
Yvon HR-800 Labram spectrometer with double-notch filtering and air cooled CCD de-
tector (ENS, Lyon). More experimantal details concerning the Raman experiment can be
found in section 5.2.
For all the experiments, the pressure was measured in situ before and after each mea-
surement using the R1 fluorescence emission of a ruby chip placed into the gasket hole.
We used LiF as pressure transmitting medium for HP-HT XRD measurements and NaCl
for the HP-RT XRD and Raman spectroscopy measurements. No pressure transmitting
medium was used during the XAS measurements in order to provide a more suitable
sample thickness for a good signal-to-noise ratio.
The HT conditions for XAS and XRD experiments were achieved by external resistive
heating and the temperature was measured using a thermocouple placed on the back of
one diamond.
For HP-HT XAS and XRD experiments we used a Re gasket with a 100 µm diameter
hole while for the HP-RT temperature Raman measurements we used a stainless steel

6.3 XRD measurements 83
gasket with a 100 µm diameter hole.
6.3 XRD measurements
We performed XRD measurements in the P-T range of [AP:49.5 GPa] and [RT:600 K].
We studied the evolution of the solid structure of Rb6C60 as a function of pressure both
at HT (600 K) and at RT. XRD patterns were collected after each pressure increase by ∼1.5 GPa. In Figure 6.1 we report only part of the collected patterns from 7 up to 43 GPa
at HT (lower panel) and from 6.5 up to 49.5 GPa at RT.
The data set collected at 600 K displays a clear phase transition of Rb6C60 towards a
lower-symmetry structure corresponding to the appearence of additional Bragg reflections
starting from 36.5 GPa. At 43 GPa, which is the highest measured pressure, the phase
transition was observed to be complete.
Two different experiments were performed in order to check the transition reversibility
dependence on the thermodynamic path. Firstly, we performed the pressure release at
high temperature and once we reached ambient pressure we cooled the sample down to
room temperature. The second experiment consisted in cooling the sample down to room
temperature at high pressure and then we performed the pressure release.
In both experiments the transition was observed to be reversible but with different
hysteresis ranges. The body-centered cubic phase was back at 32 GPa and at 11 GPa in
the first and the latter case, respectively. In Figure 6.2 we display the XRD data collected
at 600 K during the pressure release showing the reversibility of the transition.
For data collected at RT as a function of pressure (upper panel of Figure 6.1) it is
difficult to establish which structural modification is taking place above 45.6 GPa, due
to the broadening of the Bragg reflections at such pressure. Nevertheless, we can observe
that such increase in the Bragg peaks width is discontinuous, suggesting the occurrence
of a structural change in correspondance of such discontinuity.
All data were analyzed using the FULLPROF package [114] before and after the phase
transition within the Le Bail configuration.
The new structural phase of Rb6C60 was found to be compatible with a hexagonal
unit-cell structure by indexing the powder diffraction patterns with a dichotomy method.
In particular we used the DICVOL program [141]. Among the different solutions only the
lattice parameters of the hexagonal cell were found to be compatible with a network built
of C60 molecules. The resulting lattice parameters at 43 GPa and 600 K are a=8.360(2)
A and c=14.830(7) A. The corresponding c/a ratio is 1.774, only 8% bigger than the ideal

84 High pressure phase transition in Rb6C60
Figure 6.1: Upper panel: room temperature and high pressure XRD patterns of Rb6C60
and NaCl (used as pressure transmitting medium), normalized for acquisition time and
collected at λ=0.2647 A. The B1→B2 NaCl is also observed at around 39 GPa [140].
Lower panel: high temperature (600 K) and high pressure XRD patterns of Rb6C60 and
LiF (used as pressure transmitting medium), normalized to LiF (111) Bragg reflection
intensity and collected at λ=0.3738 A. All data are reported without any background
subtraction.
axial ratio c/a for a hexagonal close-packed crystal structure (1.633). The corresponding
Le Bail fit performed by imposing the P6/mmm space group is shown in Figure 6.3 and

6.4 XAS measurements 85
Figure 6.2: XRD data collected on Rb6C60 at 600 K, from the highest measured pressure
(43 GPa) down to 32 GPa during the pressure release. The observed XRD transition is
reversible and the cubic phase is back at 32 GPa. Data are normalized to the LiF (111)
Bragg reflection intensity.
the weighted profile R-factor which gauges the quality of the fit is Rwp=6.5% (χ2=0.29).
Unfortunately, due to the quality of the data at high pressure, a Rietveld-type refinement
was not possible, preventing us from obtaining information about the atomic positions in
the unit cell.
6.4 XAS measurements
XAS spectra of Rb6C60 were collected at the Rb K-edge (15.2 keV) as a function of
pressure both at room temperature and at 600 K. The XANES (x-ray absorption near
edge structure) signals of some of the collected spectra are shown in Figure 6.4. Due to
the unavoidable Bragg reflections from the diamond anvils, data were collected up to 200
eV above the edge, preventing EXAFS (extended x-ray absorption fine structure) analysis.
Since a detailed XANES analysis was not possible due to the difficulty in reproducing
the signal at ambient conditions, in the following we only report qualitative considerations
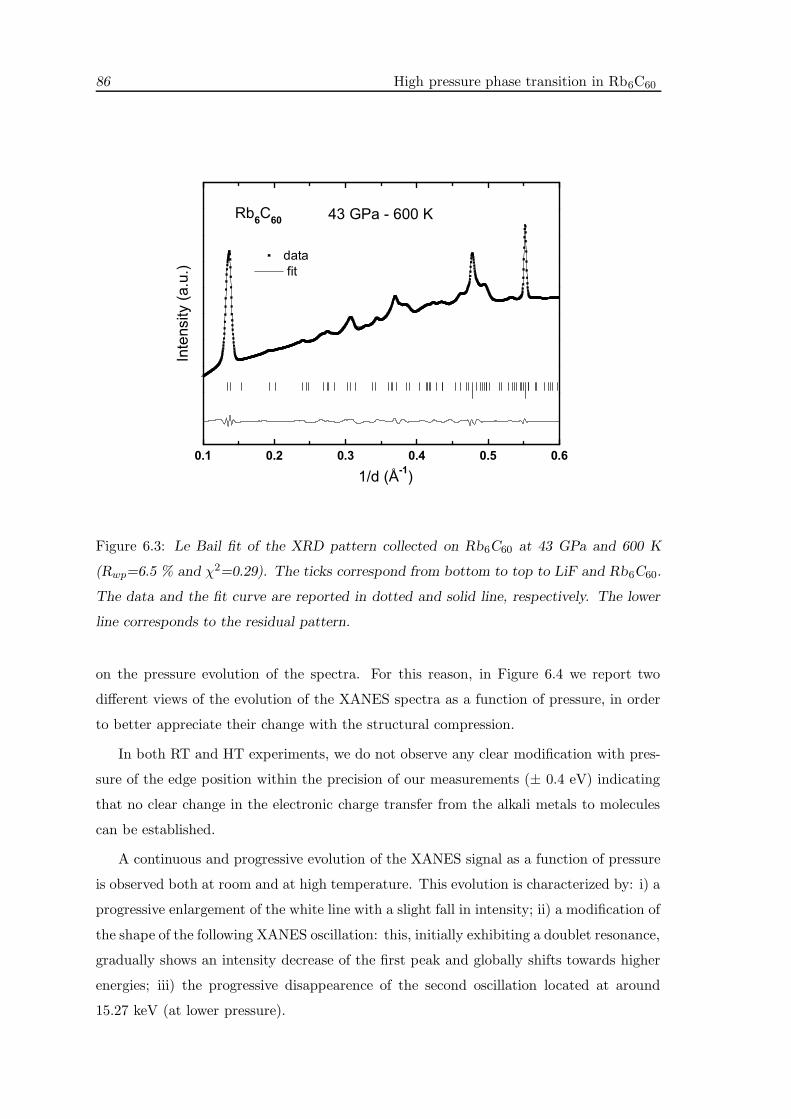
86 High pressure phase transition in Rb6C60
Figure 6.3: Le Bail fit of the XRD pattern collected on Rb6C60 at 43 GPa and 600 K
(Rwp=6.5 % and χ2=0.29). The ticks correspond from bottom to top to LiF and Rb6C60.
The data and the fit curve are reported in dotted and solid line, respectively. The lower
line corresponds to the residual pattern.
on the pressure evolution of the spectra. For this reason, in Figure 6.4 we report two
different views of the evolution of the XANES spectra as a function of pressure, in order
to better appreciate their change with the structural compression.
In both RT and HT experiments, we do not observe any clear modification with pres-
sure of the edge position within the precision of our measurements (± 0.4 eV) indicating
that no clear change in the electronic charge transfer from the alkali metals to molecules
can be established.
A continuous and progressive evolution of the XANES signal as a function of pressure
is observed both at room and at high temperature. This evolution is characterized by: i) a
progressive enlargement of the white line with a slight fall in intensity; ii) a modification of
the shape of the following XANES oscillation: this, initially exhibiting a doublet resonance,
gradually shows an intensity decrease of the first peak and globally shifts towards higher
energies; iii) the progressive disappearence of the second oscillation located at around
15.27 keV (at lower pressure).

6.5 Raman measurements 87
Figure 6.4: Two different views of the Rb K-edge XANES spectra of Rb6C60 as a function
of pressure at room temperature (upper panels) and at 600 K (lower panels).
For both experiments the release of pressure was performed at RT. For the experiment
performed at 600 K, during the pressure release we collected data down to 22 GPa while
for the experiment performed at RT, we collected data down to 15 GPa. In both cases we
observe a similar progressive reversibility of the signal. Figure 6.5 displays the XANES
spectra collected on Rb6C60, by decreasing pressure from 40 down to 22 GPa, after cooling
the sample down to RT. The pressure release was performed in this way in order to try to
metastabilize the HT-HP phase.
6.5 Raman measurements
Raman spectra of Rb6C60 were collected at ambient temperature as a function of pressure
from 0.3 GPa up to 40.3 GPa. Only a few spectra collected are reported in Figure 6.6 for
clarity.
For the fully doped Rb6C60 compound with T5h symmetry, calculations [126] show
that each of the five-dimensional Raman active Hg modes appearing in the isolated C60
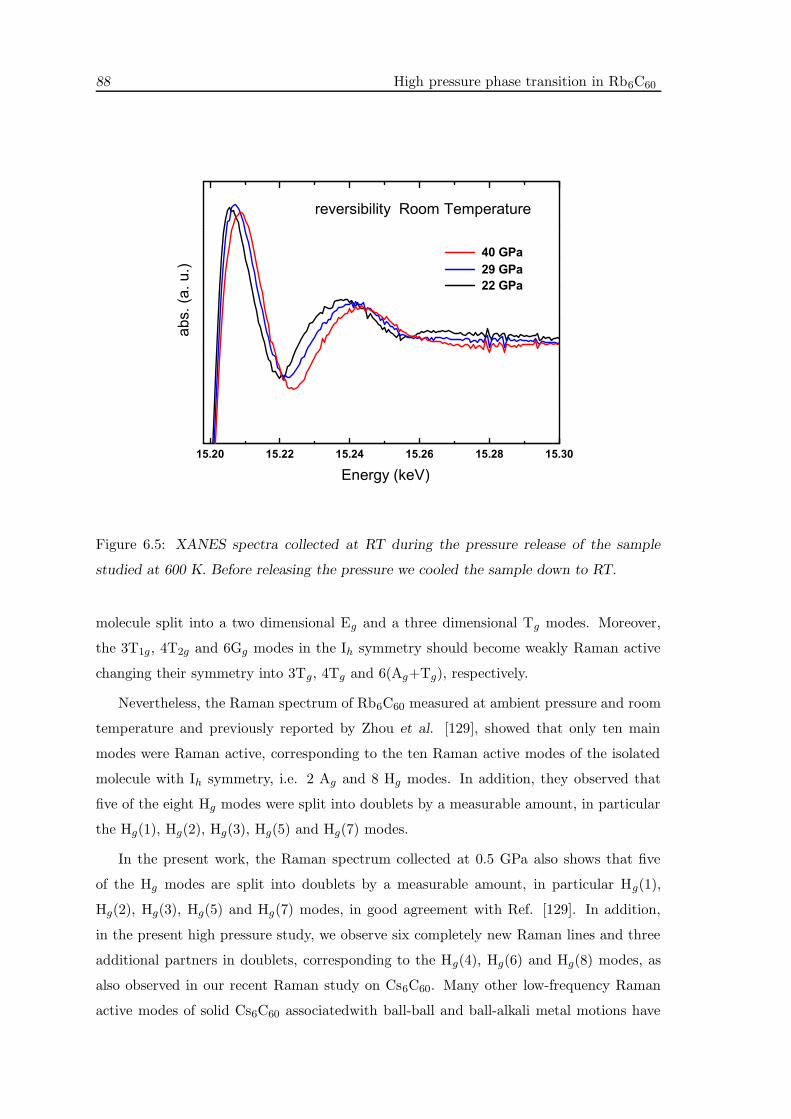
88 High pressure phase transition in Rb6C60
Figure 6.5: XANES spectra collected at RT during the pressure release of the sample
studied at 600 K. Before releasing the pressure we cooled the sample down to RT.
molecule split into a two dimensional Eg and a three dimensional Tg modes. Moreover,
the 3T1g, 4T2g and 6Gg modes in the Ih symmetry should become weakly Raman active
changing their symmetry into 3Tg, 4Tg and 6(Ag+Tg), respectively.
Nevertheless, the Raman spectrum of Rb6C60 measured at ambient pressure and room
temperature and previously reported by Zhou et al. [129], showed that only ten main
modes were Raman active, corresponding to the ten Raman active modes of the isolated
molecule with Ih symmetry, i.e. 2 Ag and 8 Hg modes. In addition, they observed that
five of the eight Hg modes were split into doublets by a measurable amount, in particular
the Hg(1), Hg(2), Hg(3), Hg(5) and Hg(7) modes.
In the present work, the Raman spectrum collected at 0.5 GPa also shows that five
of the Hg modes are split into doublets by a measurable amount, in particular Hg(1),
Hg(2), Hg(3), Hg(5) and Hg(7) modes, in good agreement with Ref. [129]. In addition,
in the present high pressure study, we observe six completely new Raman lines and three
additional partners in doublets, corresponding to the Hg(4), Hg(6) and Hg(8) modes, as
also observed in our recent Raman study on Cs6C60. Many other low-frequency Raman
active modes of solid Cs6C60 associatedwith ball-ball and ball-alkali metal motions have
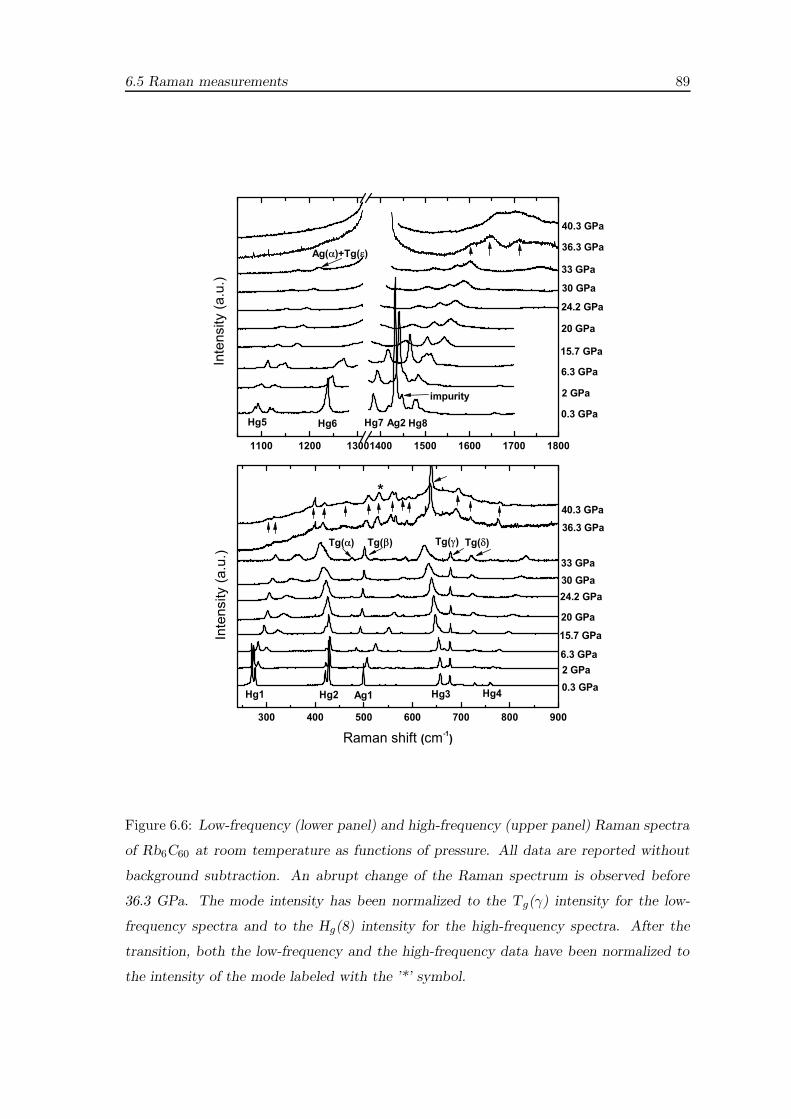
6.5 Raman measurements 89
Figure 6.6: Low-frequency (lower panel) and high-frequency (upper panel) Raman spectra
of Rb6C60 at room temperature as functions of pressure. All data are reported without
background subtraction. An abrupt change of the Raman spectrum is observed before
36.3 GPa. The mode intensity has been normalized to the Tg(γ) intensity for the low-
frequency spectra and to the Hg(8) intensity for the high-frequency spectra. After the
transition, both the low-frequency and the high-frequency data have been normalized to
the intensity of the mode labeled with the ’*’ symbol.

90 High pressure phase transition in Rb6C60
been anticipated but they have not yet been observed.
The pressure evolution of the frequencies of all the observed Raman lines is followed
with pressure and is shown in Figure 6.6 and Figure 6.7.
In Figure 6.6 we label the previously ten observed intramolecular Raman vibrations
as the 2Ag and 8Hg symmetry modes of the free molecule in order to keep the same
nomenclature as used in the past as we did for Cs6C60. On the other hand, we label the
new observed lines with the names of the irreducible representation of the Raman active
modes in the Rb6C60 system with T5h symmetry. The symmetry of the six new observed
Raman modes has been identified with the help of ab initio DFT calculations performed in
a way analogous to those reported in section 5.4. They are labelled in Figure 6.6 Tg(α),
Tg(β), Tg(γ), Tg(δ), Tg(ε) and Ag(α) consistent with their calculated symmetry.
The pressure evolution of the low-frequency and high-frequency Raman modes, up to
the highest measured pressure, is shown in Figure 6.7.
The continuous evolution of the observed Raman modes is interrupted by an abrupt
change in the modes frequency occurring between 33 and 36.3 GPa. We observe the
disappearence of the well known Raman intramolecular modes and the appearence of
completely new modes both in the low-frequency and the high-frequency range. This can
be reasonably related to an important change in the nature of the intramolecular covalent
bondings between carbon atoms. The observed transition is also accompanied by a change
of the background displaying an intensity increase having a broadened continuum shape
in the frequency range 300< ω <800 cm−1. We also collected Raman spectra during
the pressure release at 20 and 7 GPa and they are shown in Figure 6.8. These spectra
evidenced the reversibility of the observed transition. Also the background was observed
to revert to that measured before the transition.
6.6 Discussion
The occurrence of a reversible transition, at around 35 GPa, is observed by XRD and
Raman data, at 600 K and room temperature, respectively. The XAS data show that
both the local structure and the electronic configuration around each Rb atom, exhibit a
progressive and similar change with pressure at both high and room temperature.
A clear reversible first order phase transition has been observed by XRD, at around 35
GPa at 600 K. In correspondance of the transition the unit cell volume has been observed
to discontinuously decrease. In particular, from 37.3 43 GPa we found a discontinuity
of 24%. Our analysis shows that the new phase is compatible with a hexagonal unit-cell

6.6 Discussion 91
Figure 6.7: Pressure evolution of the low-frequency (lower panel) and high-frequency
(upper panel) Raman modes . The solid lines correspond to least-square fits to a parabolic-
type pressure dependence for all modes before the transition at 36.3 GPa. The horizontal
bar errors represent the pressure uncertainty estimated from the Lorentzian width of
the R1 ruby line; the vertical error bars correspond to the half width at half maximum
(HWHM) of each Raman mode.
structure, with a=8.360(2) A and c=14.830(7) A lattice parameters, at 43 GPa and 600 K.
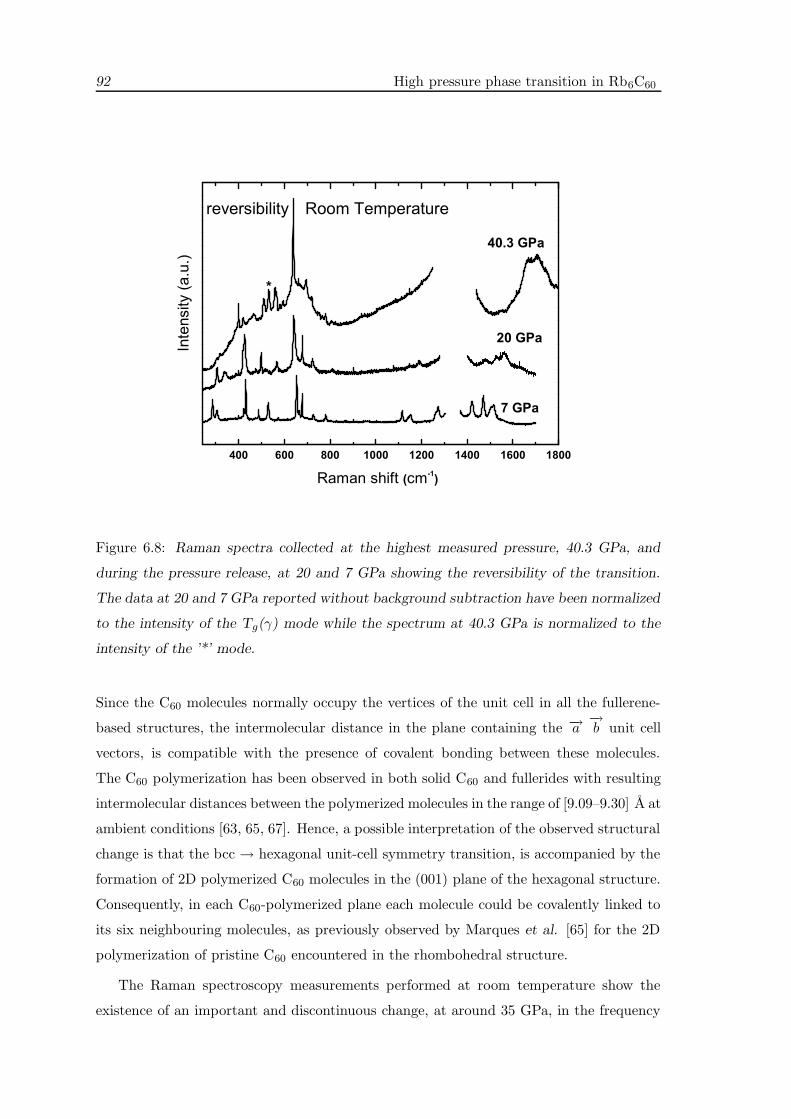
92 High pressure phase transition in Rb6C60
Figure 6.8: Raman spectra collected at the highest measured pressure, 40.3 GPa, and
during the pressure release, at 20 and 7 GPa showing the reversibility of the transition.
The data at 20 and 7 GPa reported without background subtraction have been normalized
to the intensity of the Tg(γ) mode while the spectrum at 40.3 GPa is normalized to the
intensity of the ’*’ mode.
Since the C60 molecules normally occupy the vertices of the unit cell in all the fullerene-
based structures, the intermolecular distance in the plane containing the −→a −→b unit cell
vectors, is compatible with the presence of covalent bonding between these molecules.
The C60 polymerization has been observed in both solid C60 and fullerides with resulting
intermolecular distances between the polymerized molecules in the range of [9.09–9.30] A at
ambient conditions [63, 65, 67]. Hence, a possible interpretation of the observed structural
change is that the bcc → hexagonal unit-cell symmetry transition, is accompanied by the
formation of 2D polymerized C60 molecules in the (001) plane of the hexagonal structure.
Consequently, in each C60-polymerized plane each molecule could be covalently linked to
its six neighbouring molecules, as previously observed by Marques et al. [65] for the 2D
polymerization of pristine C60 encountered in the rhombohedral structure.
The Raman spectroscopy measurements performed at room temperature show the
existence of an important and discontinuous change, at around 35 GPa, in the frequency

6.6 Discussion 93
of the intramolecular normal vibrations.
A possible reason could be the formation of C60 polymers, i.e. the formation of covalent
bonds between neighbouring molecules as a consequence of their pressure-induced vicinity.
In addition, the formation of covalent intermolecular bonds and the concomitant change
in the intramolecular C-C bonds, have been previously observed to be responsible for
the breaking of icosahedral symmetry of C60 molecules in the orthorhombic, tetragonal
and rhombohedral structures of polymerized C60 [111] leading to a strong change in the
Raman spectrum. This explanation is compatible with our XRD experiments suggesting
that the origin of the new hexagonal structure is linked to a polymerization process. Also
the formation of covalent bonds between the Rb atoms and the C60 fullerenes can be
envisaged, as recently observed in the Sm3C70 [142] and Eu3C70 [143] fullerides. In these
structures, the rare earth metals are observed to bridge two C70 molecules, producing
C70-Sm-C70 dimer structures.
Both XRD and Raman data exhibit an increase of the background intensity after
the observed transition probably indicating the presence of disorder in the high pressure
structure.
The XRD patterns collected at room temperature show an abrupt width increase of
the Bragg reflections above 39.3 GPa preventing us from establishing the nature of the
structural changes occurring in that pressure range. Such an increase in the Bragg peaks
width, which is more important compared to the high temperature XRD data, could be
attributed to the presence of structural strains that build up and cannot relax in absence
of high temperature conditions. In addition, a better sample crystallization at 600 K,
compared to RT, could be also responsible for the observed difference in the width of
the Bragg reflections. The small size of the coherent domains of the high pressure phase
formed at RT, could actually cause such huge broadening of the corresponding Bragg
reflections. This observation is compatible with the complexity of the polymerization
process in fullerenes already observed in pristine C60 [20] reinforcing the idea that the
observed high pressure hexagonal phase is associated with the formation of C60 polymers.
Moreover, the limitation in long-range order crystallization of the high pressure phase
in the RT experiment could not affect the changes of local symmetry of the system. This
is consistent with the results obtained by Raman spectroscopy and by XAS which are local
probes. In addition, since in the Rb6C60 system, the rotation of molecules is hampered by
the presence of strong ionic interaction between the alkali atoms and the C60 fullerene, a
different scenario where different structural phases exist at RT and 600 K appears to be
less probable.

94 High pressure phase transition in Rb6C60
The evolution of the XANES spectra between ambient and the highest studied pressure
shows the occurrence of a continuous and important evolution of the local structure around
each alkali-metal atom. Moreover, the comparison between the progressive modification
of the XAS data observed at 600 K and at RT, indicates that the phase transition and
the pressure-induced increase of the Bragg reflections width, are accompanied by the same
pressure evolution of the local structure and the electronic configuration around each Rb
atom. This reinforces our hypothesis of observing the same phase transition at both RT
and HT. Nevertheless, the only study performed on the pressure evolution of the XANES
signal is not sufficient to understand whether the observed change in the local structure
could be associated to a phase transformation.
An important observation concerning the high pressure stability of the Rb6C60 sys-
tem must be done. The Raman spectroscopy and XRD data, showing the existence of a
transition at around 35 GPa, prove the lower pressure stability of the body-centered cubic
structure of Rb6C60 compared to the isostructural Cs6C60 compound, where a continuous
evolution of the Raman active modes has been observed up to at least 45 GPa [137]. Nev-
ertheless, both fullerides show a much higher pressure stability of the molecular character
of the system, compared to the solid C60, which was observed to amorphize at 22 GPa.
Subsequently, the fundamental role of the Coulomb interactions on the pressure evolution
of the M6C60 systems, can be reasonably assumed. We therefore infer that the presence of
such ionic interactions could be responsible for the high pressure stabilization of the C60
molecules.

Chapter 7
Structural and electronic evolution
with pressure of Rb6C60 and
Cs6C60 from first principles
Both the structural and electronic evolution of Rb6C60 and Cs6C60 has been studied by ab
initio DFT calculations, as a function of pressure, up to around 100 GPa. We observe that
while the bcc structure of the Cs6C60 system is stable up to highest calculated pressure,
the Rb6C60 system displays an instability of the bcc structure between 75 and 100 GPa.
7.1 Introduction
In chapter 5, by reporting Raman spectroscopy measurements and Raman spectra cal-
culations, we showed the extremely high stability under pressure of the Cs6C60 (around
45 GPa) [137] system compared to pristine C60 (around 22 GPa) [46, 47]. This result
suggested that the intercalation of Cesium atoms in the C60 crystalline structure, allows
the preservation the C60 molecule up to the maximum studied pressure. On the other
hand, in chapter 6, by reporting an experimental pressure study on the Rb6C60 compound
under pressure, we showed the occurrence of a phase transition at about 35 GPa, proving
that the structural evolution with pressure of the two systems is different.
Nevertheless, since both Rb6C60 and Cs6C60 display a higher pressure stability range
compared to solid C60 and exhibiting the first fulleride, a higher pressure stability com-
pared to the second one, the importance of the presence of ionic interactions existing in
such systems can be deduced.
For these reasons, in the present chapter we explore both the structural and electronic

96Structural and electronic evolution with pressure of Rb6C60 and Cs6C60 from first
principles
evolution of Rb6C60 and Cs6C60 under pressure, up to around 100 GPa in order to un-
derstand the mechanism taking place during the compression of these structures paying
particular attention to the role of the charge transfer from the alkali metal to the C60
fullerenes.
7.2 Ab initio DFT results
We have performed density functional ab initio simulations on Rb6C60 and Cs6C60 under
high pressure. More details about the calculation method and the parameters employed
can be found in section 4.5.
We studied the structural and electronic evolution of Rb6C60 and Cs6C60 as a function
of pressure by decreasing the lattice parameter from the experimental value found at
ambient pressure and room temperature (a=11.54 A and a=11.79 A) [68] down to 9.55
A and 10.00 A, respectively. This corresponds to the pressure ranges [-1.8; 101] GPa for
Rb6C60 and [-1.2; 98] GPa for Cs6C60.
7.2.1 Structural evolution under pressure
In Figure 7.1 we report the pressure evolution of the structural parameters of Rb6C60
and Cs6C60, as a function of pressure up to around 100 GPa. The study of the pressure
evolution of Rb6C60 shows the occurrence of a structural modification between 75 and 100
GPa, implying an abrupt increase of the volume of the C60 molecule and a shape-change
of the fullerene. On the other hand, a continuous structural evolution of the C60 molecule
under pressure is obtained in Cs6C60 up to about 100 GPa.
The upper panel of Figure 7.1 reports the calculated volume evolution with pressure
of the C60 molecule for the two studied systems. In Cs6C60 we observe a continuous
decrease with pressure of the fullerene volume up to the highest calculated pressure of 100
GPa. On the onther hand, in the Rb6C60 system, the continuous pressure decrease of the
C60 volume is interrupted by an abrupt increase of this, between 75 and 100 GPa. This
volume increase, indicating the presence of an instability of the bcc phase (“transition”),
is accompanied by an abrupt change in the intramolecular C-C bond lengths described in
the following.
The pressure evolution of the intramolecular C-C bond lengths for the two calculated
systems is shown in the lower panel of Figure 7.1. First of all, we observe that our result at
ambient conditions are in good agreement with the previous study of Andreoni et al. [69]
where they reported that in the doping-induced distorted fullerene in Rb6C60, the double
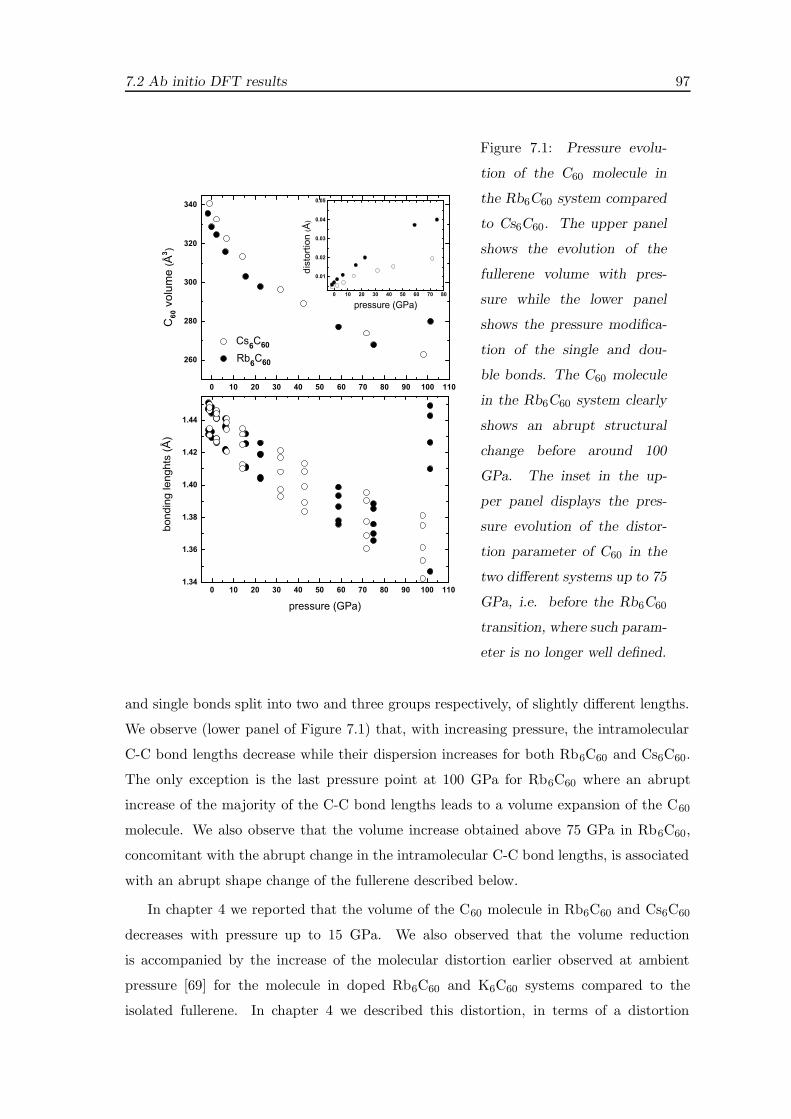
7.2 Ab initio DFT results 97
Figure 7.1: Pressure evolu-
tion of the C60 molecule in
the Rb6C60 system compared
to Cs6C60. The upper panel
shows the evolution of the
fullerene volume with pres-
sure while the lower panel
shows the pressure modifica-
tion of the single and dou-
ble bonds. The C60 molecule
in the Rb6C60 system clearly
shows an abrupt structural
change before around 100
GPa. The inset in the up-
per panel displays the pres-
sure evolution of the distor-
tion parameter of C60 in the
two different systems up to 75
GPa, i.e. before the Rb6C60
transition, where such param-
eter is no longer well defined.
and single bonds split into two and three groups respectively, of slightly different lengths.
We observe (lower panel of Figure 7.1) that, with increasing pressure, the intramolecular
C-C bond lengths decrease while their dispersion increases for both Rb6C60 and Cs6C60.
The only exception is the last pressure point at 100 GPa for Rb6C60 where an abrupt
increase of the majority of the C-C bond lengths leads to a volume expansion of the C60
molecule. We also observe that the volume increase obtained above 75 GPa in Rb6C60,
concomitant with the abrupt change in the intramolecular C-C bond lengths, is associated
with an abrupt shape change of the fullerene described below.
In chapter 4 we reported that the volume of the C60 molecule in Rb6C60 and Cs6C60
decreases with pressure up to 15 GPa. We also observed that the volume reduction
is accompanied by the increase of the molecular distortion earlier observed at ambient
pressure [69] for the molecule in doped Rb6C60 and K6C60 systems compared to the
isolated fullerene. In chapter 4 we described this distortion, in terms of a distortion

98Structural and electronic evolution with pressure of Rb6C60 and Cs6C60 from first
principles
parameter, d, defined in equation 4.4 and we also calculated it up to 15 GPa.
Here we extend the calculation of the distortion parameter up to around 75 GPa.
Its evolution is reported in the upper panel inset of Figure 7.1. The pressure induced
distortion is more important in Rb6C60 than in Cs6C60 and it is about 100% higher for
Rb than for Cs case, just before the transition, i.e. at around 75 GPa.
We do not report the distortion parameter at 100 GPa, because between 75 and 100
GPa, the observed transition in Rb6C60 is accompanied by a shape change of the C60
molecule different from the isolated molecule shape and also from the distorted fullerene
found in alkali metal intercalated fullerenes [69, 132] and previosuly discussed (chapters 1
and 4).
x
z
y
(a) (b)
Figure 7.2: Distortion of the C60 molecule. Shape of the fullerene at 100 GPa, after the
transition (panel (a)) and at 75 GPa, before the transition (panel (b)). The C atoms
placed at ρn are depicted in light-grey. In panel (b) the distortion parameter has been
amplified by a factor 11 in order to better appreciate it.
This C60 shape, observed in Rb6C60 at 100 GPa, probably does not preserve the cu-
bic Th symmetry. The Raman calculations performed on the system after the transition
display a completely different Raman spectrum compared to that calculated before the
transition. Since the Raman spectrum of Rb6C60 is mainly associated with the intremolec-
ular vibrations, this allows us to conclude that the observed transition is accompanied by
a change of C60 molecule symmetry. Hence the C60 shape at 100 GPa cannot be described
by the d distortion parameter. In addition, in this case, 12 and 48 carbon atoms in the C60

7.2 Ab initio DFT results 99
are at smaller (ρn) and larger (ρp) distances from the center of the molecule, compared to
the 60 atoms average distance (ρaverage). On the other hand, before the transition they
are 36 and 24, respectively, as reported in chapter 4. Moreover, while in this last case,
the C atoms of the molecule facing the alkali atoms are placed at ρp, after the transition
they are found at ρn. This difference can be better appreciated by looking at Figure 7.2,
where we report the fullerene, after and before the transition, surrounded by the 24 alkali
metal atoms placed at the tetrahedral sites on the 6 bcc cell faces. The C atoms placed at
ρn are depicted in light-grey color and they are 12 and 36, after and before the transition,
respectively. Those placed at ρp are depicted in dark-grey color.
7.2.2 Electronic evolution under pressure
We have studied the electronic structure evolution with pressure of Rb6C60 compared to
Cs6C60. The calculated electronic band structure for both systems, shown in Figure 7.3,
is in good agreement with that previously reported for the isostructural K6C60 [70]. Both
Rb6C60 and Cs6C60 are insulators at low pressure with the t1u three-fold degenerate state
completely occupied and the gap between the highest occupied and lowest unoccupied
band is of 0.63 eV and 0.66 eV, respectively.
We obtain a progressive closure of the gap as a function of pressure for both systems re-
sulting from the bandwidth broadening consistent with the increase in density (Figure 7.4).
Metallization is observed at about ∼ 20 GPa for Rb6C60 and ∼ 40 GPa for Cs6C60. The
metallic phase is interrupted in Rb6C60 by a clear opening of the gap between 75 and 100
GPa, contrary to the case of Cs6C60. At 100 GPa the gap is 1.41 eV, much higher that
the initial value (0.63 eV). This pressure-induced metal-insulator transition together with
the discontinuity in the structural evolution with pressure observed in Rb6C60 reflects the
occurrence of an instability of the bcc structure under pressure. Since our calculations are
done under restriction on the unit cell symmetry, such a transition cannot be accompanied
by a symmetry change of the unit cell, leading therefore to fictitious results concerning
the new phase observed at 100 GPa, such as the fullerene shape. On the other hand,
the different pressure behavior of the electronic band structure in Cs6C60 reflects a higher
pressure range of stability for this system compared to Rb6C60.
In order to study the pressure evolution of the charge transfer from the alkali Cs atom to
the fullerene, we analyzed the data in two differents ways. We firstly studied the evolution
of the Mulliken-population of the molecule as a function of pressure which directly gives
information about the transfer of charge from the alkali metal atoms to the molecule.
Nevertheless, this method shows different inconveniences, related not only to the strong

100Structural and electronic evolution with pressure of Rb6C60 and Cs6C60 from first
principles
Figure 7.3: Calculated electronic band structure of Rb6C60 (upper panel) (a=11.54 A)
and Cs6C60 (a=11.79 A) (lower panel). The energy of the Fermi level is set to zero eV.
dependence of the results on the calculation parameters, (basis set, pseudopotentials, etc.)
but also on the arbitrary way of establishing which electrons belong to each atom. In
particular, within this method, the attribution of electrons to the different atoms becomes
complicated when the overlap of orbitals belonging to different atoms occurs. In the
present study, the pressure induced vicinity of the alkali atoms to the molecules could
worsen such inconvenience. For this reason, we also studied the evolution of the charge
transfer from the alkali Cs atom to the fullerene, by studying the evolution of the electronic
density inside the C60 molecules.
The Mulliken-population analysis shows that in the Rb6C60 system with lattice pa-

7.2 Ab initio DFT results 101
Figure 7.4: Pressure evolution of the gap, between the highest occupied and lowest un-
occupied band, as a function of pressure for both system up to 100 GPa. An abrupt gap
opening is observed in Rb6C60 between 75 and 100 GPa.
rameter equal to 11.54 A (i.e. corresponding to the ambient cell parameter obtained ex-
perimentally at room temperature) the interactions between each molecule and the alkali
metal atoms are ionic. As there are six Rb atoms per molecule, their complete ionization
and equipartitioning of this charge would correspond to a total charge on each inequivalent
C atoms equal to 4.1 (each C atoms has 4 valence electrons). We instead obtain Q=4.052
and 4.013, for the 12 equivalent C atoms in the 24g site and for the remaining 48 C atoms
in the two non equivalent 48h sites, respectively1, meaning that an incomplete transfer
of the Rb 5s electron is taking place. For the Cs6C60 system studied at 11.79 A (lattice
parameter corresponding to the ambient conditions phase) we obtain Q=4.053 and 4.018,
respectively.
Nevertheless, as mentioned above, the value of charge obtained for each atom through
this method could be misleading. For this reason, we focus on the variation of the Mulliken-
population, ∆Qmulliken, of C60 as a function of pressure with respect to the value obtained
at low pressure (i.e. -1.2 and -1.8 GPa, for Cs6C60 and Rb6C60, respectively). The results,
reported in Figure 7.5, show a progressive decrease of the electronic charge transfer from
1We remind here that in the unit cell, there are three non equivalent sites for the C atoms and they are
24g, 48h and 48h.

102Structural and electronic evolution with pressure of Rb6C60 and Cs6C60 from first
principles
the alkali metals to the molecule with pressure in both Rb6C60 and Cs6C60, and a faster
decrease in the Rb case with respect to Cs is also observed. In particular, the ∆Qmulliken
between the Mulliken-population calculated around 75 GPa and the initial one is -3.6
and -3.0 e− for Rb6C60 and Cs6C60, respectively. When considering 100 GPa, these
values become -5.8 and -3.5 e−, respectively. In addition, a discontinuity in the Mulliken-
population of the C60 is observed in Rb6C60 between 75 and 100 GPa. Hence, from our
population analysis, in correspondance of the phase transition, the transfer of charge from
the Rb atoms to the molecule abruptly decreases.
Figure 7.5: Pressure variation of the Mulliken-population of each C60 molecule,
∆Qmulliken, as a function of pressure for both systems. A discontinuity is observed for the
Rb6C60 system between 75 and 100 GPa.
The second analysis method is an indirect way of studying the electronic charge transfer
to fullerenes. It consists in calculating the electronic density inside the C60 molecules.
Being the fullerene a closed molecule we can say, in principle, that the electronic density
into the molecule actually belongs to the molecule, differently to the population analysis
method, as discussed above. In addition, the variation of such quantity is proportional
to variations of the transferred charge from the alkali metals to the fullerenes. We define
now the electronic density, ρ, as the difference between the electronic density inside each
molecule ρm of the two M6C60 systems and the total homogeneous electronic density ρt

7.2 Ab initio DFT results 103
in the M6C60 systems, in particular:
ρ =[(Q
V
)
m−(Q
V
)
t
]
= ρm − ρt (7.1)
In this way, by subtracting the total homogeneous electronic density ρt, from the
molecule-enclosed electronic density ρm, we indirectly consider the contribution of the
charge tranfer from to alkali metal to the molecule since the number of electrons of the
C atoms in principle does not vary, a part from those transferred by the alkali atoms.
Hence, the evolution of this difference is proportional to the evolution of the electronic
charge transferred to each fullerene.
In Figure 7.6 we report the pressure evolution of the following electronic quantities: i)
the number of electrons Qm inside the C60 molecule (upper-left panel), ii) the electronic
density ρm inside the molecule (upper-right panel), iii) the total homogeneus electronic
density ρt obtained by considering the valence electrons inside the unit cell (lower-left
panel) and iv) the difference between ρm and ρt (lower-right panel). The Qm quantity
shows a pressure increase in both systems, exhibiting an abrupt increase in correpondance
of the Rb6C60 transition, between 75 and 100 GPa. The ρt density clearly increases as a
function of pressure in the two compounds since the number of valence electrons remains
constant during the compression (564=120 C atoms × 4 (2s+2p) + 12 alkali atoms × 7
(6p+1s)) while the unit cell volume decreases. The ρm density exhibits a similar continuous
increase as a function of pressure for the two systems up to 100 GPa and no discontinuities
are observed in Rb6C60. Nevertheless, as discussed above, in order to have information
about the evolution of the charge transfer from the alkali metals to the C60 we consider
the evolution of the ρ density defined in eq. 7.1.
We observe that ρ decreases with pressure for both systems and the slope of the linear
fit performed up to around 75 GPa is 170% higher for Rb6C60 compared to Cs6C60. As a
consequence, the charge transfer from the alkali metal decreases as a function of pressure
for both systems and more rapidly in Rb6C60 than in Cs6C60 as also obtained from the
Mulliken-population analysis. In addition, above 75 GPa, a discontinuity leading to an
abrupt decrease of the ρ density is observed consistent with the result obtained by the
Mulliken-population analysis.
In order to better understand the electronic evolution of both systems under pressure
we studied the density of states (PDOS) projected onto the electronic states of the alkali
metal and of carbon atoms. This allows us to understand which is the contribution of the
different atoms to the DOS. In Figures 7.7 and 7.8 we display the electronic band structure
and the corresponding PDOS (on both C and alkali atom orbitals) calculated for Rb6C60

104Structural and electronic evolution with pressure of Rb6C60 and Cs6C60 from first
principles
Figure 7.6: Electronic evolution as a function of pressure in Rb6C60 and Cs6C60. It
displays the pressure evolution of: number of electrons Qm inside the C60 molecule (upper-
left panel); the electronic charge density ρm contained in each C60 molecule (upper-right
panel); the electronic homogeneous charge density ρt within the bcc unit cell (lower-left
panel) and the ρ density (lower-right panel) giving information about the evolution of the
charge transfer from the alkali atoms to the molecule. In the last panel we report the
curves resulting from the linear fit to the pressure evolution of ρ, performed up to 75 GPa
for both systems. The lower slope of the linear fit curve obtained for Rb6C60 indicates
that the electronic charge transferred to the molecule decreases faster with pressure in
Rb6C60 compared to Cs6C60.
and Cs6C60 respectively, in the energy range [-3.5:2.5] eV at three different pressure values.
The Fermi energy has been set to zero for clarity. In both pictures we report the electronic
band structure and the corresponding PDOS calculated at similar pressure values in order
to better compare the results obtained for the two different systems.
The study of the PDOS clearly shows that, at all pressure values, the contribution of
the C states to the DOS around the Fermi level is predominant compared to the alkali
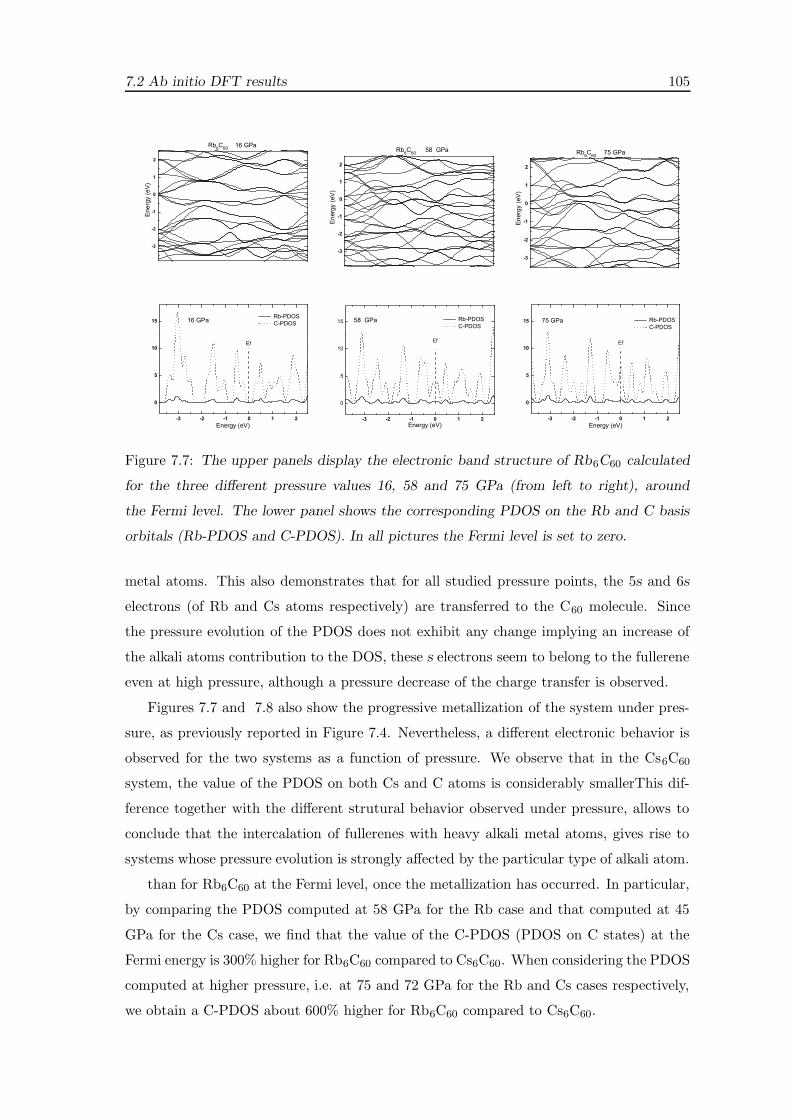
7.2 Ab initio DFT results 105
Figure 7.7: The upper panels display the electronic band structure of Rb6C60 calculated
for the three different pressure values 16, 58 and 75 GPa (from left to right), around
the Fermi level. The lower panel shows the corresponding PDOS on the Rb and C basis
orbitals (Rb-PDOS and C-PDOS). In all pictures the Fermi level is set to zero.
metal atoms. This also demonstrates that for all studied pressure points, the 5s and 6s
electrons (of Rb and Cs atoms respectively) are transferred to the C60 molecule. Since
the pressure evolution of the PDOS does not exhibit any change implying an increase of
the alkali atoms contribution to the DOS, these s electrons seem to belong to the fullerene
even at high pressure, although a pressure decrease of the charge transfer is observed.
Figures 7.7 and 7.8 also show the progressive metallization of the system under pres-
sure, as previously reported in Figure 7.4. Nevertheless, a different electronic behavior is
observed for the two systems as a function of pressure. We observe that in the Cs6C60
system, the value of the PDOS on both Cs and C atoms is considerably smallerThis dif-
ference together with the different strutural behavior observed under pressure, allows to
conclude that the intercalation of fullerenes with heavy alkali metal atoms, gives rise to
systems whose pressure evolution is strongly affected by the particular type of alkali atom.
than for Rb6C60 at the Fermi level, once the metallization has occurred. In particular,
by comparing the PDOS computed at 58 GPa for the Rb case and that computed at 45
GPa for the Cs case, we find that the value of the C-PDOS (PDOS on C states) at the
Fermi energy is 300% higher for Rb6C60 compared to Cs6C60. When considering the PDOS
computed at higher pressure, i.e. at 75 and 72 GPa for the Rb and Cs cases respectively,
we obtain a C-PDOS about 600% higher for Rb6C60 compared to Cs6C60.

106Structural and electronic evolution with pressure of Rb6C60 and Cs6C60 from first
principles
Figure 7.8: The upper panels display the electronic band structure of Cs6C60 calculated
for the three different pressure values 14, 43 and 72 GPa (from left to right), around the
Fermi level. The lower panel shows the corresponding PDOS on the Cs and C orbitals
(Cs-PDOS and C-PDOS). In all pictures the Fermi level is set to zero.
This difference together with the different structural behavior observed under pressure,
allows us to conclude that the intercalation of fullerenes with heavy alkali metal atoms,
gives rise to systems whose pressure evolution is strongly affected by the particular type
of alkali atom.
7.3 Discussion
The results show the exsistence of a pressure instability of the bcc structure of Rb6C60,
between 75 and 100 GPa, contrary to the case of Cs6C60 where a continuous structural and
electronic evolution with pressure has been observed up to around 100 GPa. We observe
a discontinuous modification of the single and double C-C intramolecular bond lengths of
the C60 volume in correspondance of the “transition” reported in Rb6C60. We also observe
an abrupt opening of the gap between the highest occupied and the lowest unoccupied
bands and a discontinuity in the descrease of the charge transfer from the alkali Rb atoms
to the molecules.
We also studied the evolution of the charge transfer from the alkali metal ions to
the fullerenes by using two different methods, the Mulliken-population analysis and the
study of the electronic density inside the C60 molecule. Both methods show that the

7.3 Discussion 107
charge transfer continuously decreases as a function of pressure for both systems, but this
decrease is observed to be less pronounced in Cs6C60, compared to the Rb case. At the
same time, the pressure induced distortion of the fullerenes increases less rapidly than in
Rb6C60. In particular, the distortion parameter is 100% higher for the Rb case than in
the Cs one right before the transition, i.e. at around 75 GPa.
The progressive distortion of the C60 molecules as a function of pressure occurs to-
gether with a progressive decrease of the charge transfer from the alkali metal atoms to
the molecules, in both systems. These considerations, together with the higher pressure
stability of Cs6C60 compared to Rb6C60 [137], experimentally observed by Raman spec-
troscopy measurements, suggest that the charge transfer and hence, the ionic interactions
between the positively charged alkali ions and the negatively charged C60 molecule, which
decreases slower with pressure in the Cs case compared to the Rb case, contribute to
stabilize the C60 molecule in these structures. This can also explain the higher pressure
stability of these compounds, compared to pristine C60 [46, 47].
Information concerning the symmetry of the new Rb6C60 structure, stable above 75
GPa, cannot be derived from our calculations because the bcc unit cell symmetry has been
imposed for all pressure points.

108Structural and electronic evolution with pressure of Rb6C60 and Cs6C60 from first
principles

Chapter 8
Role of charge transfer on
fullerene polymerization
8.1 Introduction
In this chapter, we firstly present XRD measurements performed on Rb6C60 and Cs6C60
at around 5 GPa as a function of temperature. The reason we explored this P-T range
lies in the attempt to form C60 polymers. In fact, at this pressure the distance between
the nearest neighbouring molecules in these systems is the same as that in solid fcc C60
where polymerization, at high temperature, has been observed. Since in our measurements
we do not observe any phase transition leading to the polymerization of the molecules,
we deduce that the presence of the Rb and Cs alkali metals and therefore of the charge
transfer to the molecules, should play an important role in the formation of covalent bonds
between the C60s. In addition, the C60 polymerization has been experimentally observed
at ambient conditions, as discussed in chapter 1, in fullerides with light alkali metals (like
Na2RbC60 and Li4C60) or with a low stoichiometric amount of heavy alkali metals (i.e.
MC60, M=K, Rb and Cs). Contrary to the systems studied in this work, in these com-
pounds, the presence of ionic interactions seems to favor the formation of covalent bonds
between the molecules. Hence, in fullerides with heavy alkali metals, the stoichiometric
amount of the ions in the system and consequently, the Coulomb interactions between the
positively charged alkali ions and the negatively charged C60 molecule appears to be a
critical parameter for the formation of C60 polymers.
For this reason we performed ab initio DFT calculations on a very simple system
consisting of 1D C60 chains, in order to understand if the presence of a transfer of charge
to the molecule, in this simple structure, could affect polymerization. The results of the

110 Role of charge transfer on fullerene polymerization
calculations are presented and discussed in this chapter.
8.2 XRD measurements
XRD measurements have been performed on Rb6C60 and Cs6C60 under high pressure (HP)
and high temperature (HT) conditions by using the Paris-Edinburgh (PE) cell device. The
experimental details concerning: i) the quality of the samples; ii) the HP-HT cell assembly
and iii) the set-up of beamline ID27, can be found in chapter 4.
Pressure and temperature are calibrated using the cross-calibration method (explained
in chapter 3) and for this purpose the Vinet [84, 85] equation of state of NaCl and MgO
have been used.
XRD patterns have been collected as a function of temperature by keeping the PE oil
delivery constant to 70 bar. As a consequence of the B-epoxy gasket softening and expan-
sion due to HT conditions, the in situ pressure is observed to decrease when increasing
temperature. In Figure 8.1 the evolution of the XRD patterns as a function of temperature
at a constant oil delivery is reported for both samples. In particular, XRD patterns for
both increasing and decreasing temperature are reported in the same panel (Figure 8.1).
For both Cs6C60 and Rb6C60, the disappearence of the Bragg reflections belonging to the
sample is observed, starting at 5.1 GPa and 900 K and 5 GPa and 1310 K, respectively.
Only those of the HP-HT cell assembly remain observable up to the highest measured tem-
perature. When decreasing the temperature, by keeping again the PE oil delivery constant
to 70 bar, the sample does not revert to the pristine bcc structural phase in either systems.
The transition is accompanied by an important increase of the background intensity in
both cases, probably due to the presence of disordered or amorphous structures. While
the Rb6C60 background displays a broaden continuum after the transition, the Cs6C60 one
exhibits two broad peaks at around 5 and 7 deg. After normalizing the data to the acqui-
sition time we observed that the IMgO(200)/Ibkg value (i.e. the ratio between the intensity
of the MgO(200) reflection and the intensity of the background) increases about 350%
for Cs6C60 after the HT-HP treatment compared to the IMgO(200)/Ibkg value obtained at
ambient conditions before the HT-HP treatment. For Rb6C60, we considered the intensity
of the Re(101) reflection and the value of the IRe(101)/Ibkg ratio on the recovered sample
increases of 400% compared to the value obtained at ambient conditions before the HT-HP
treatment.
Subsequently, XRD measurements have been performed on the two recovered samples
at room temperature and ambient pressure, after the HP-HT treatment. A comparison

8.2 XRD measurements 111
Figure 8.1: Temperature evolution of the XRD pattern of Cs6C60 (upper panel) and
Rb6C60 (lower panel) from room temperature (RT) up to 950 and 1350 K respectively.
Data have been normalized to the intensity of the MgO(200) reflection. Labels denote the
main Bragg peaks as well as reflections originating from the sample environment. ’Cu’
stands for the CuBe alloy capsule. The attenuation and then the disappearence of the
sample Bragg reflections is observed starting at 900 and 1310 K for Cs6C60 and Rb6C60
respectively.

112 Role of charge transfer on fullerene polymerization
Figure 8.2: XRD patterns of Cs6C60 and Rb6C60 collected at ambient pressure and room
temperature after the HP-HT treatment. They are compared to the XRD data performed
at ambient conditions before the HT-HP study. We can observe that the transition is
irreversible in both systems. The ’*’ symbol indicate the Bragg reflections observed after
the HT-HP treatment. Data are normalized to the background.

8.3 Raman measurements 113
between the patterns collected before and after the treatment is shown in Figure 8.2. The
transformation of the sample, associated to the disappearence of the bcc phase Bragg
reflections, appear to be irreversible in both cases. This transition can be clearly assigned
to the amorphization of the systems as no Bragg reflections, indicating the presence of
a crystalline phase, are observed. However, the Cs6C60 and Rb6C60 XRD data collected
at ambient conditions after the HP-HT treatment exhibit some un-assigned reflections,
indicated in Figure 8.2 with the ’*’ symbol. This could derive from the reaction, at HT,
of the CuBe alloy with some element in contact with it, as its structural phase does not
completely revert to the initial one. In addition, a reaction of the Cs6C60 and Rb6C60
compounds with the CuBe can also be envisaged.
8.3 Raman measurements
We measured the two recovered samples, after the HT-HP treatment, by Raman scatter-
ing in order to get additional information about the transformed systems. The Cs6C60
sample was taken out from the the gasket in contact with air. We could retrieve the
cylinder containing all the HT-HP cell components and we looked at it using an optical
microscope. The different parts of the HP cell environment were not clearly recognizable
at the microscope. The Raman measurements for this recovered sample were performed
in contact with air.
Figure 8.3: Picture of the HP cell containing the Cs6C60 sample, collected after the HT-HP
treatment. The sky-blue color probably derives from Cu oxides.
A picture of the HP cell containing the Cs6C60 sample, after the HT-HP treatment,
is shown in Figure 8.3. The sky-blue color probably derives from Cu oxides. The Ra-
man measurements performed on different parts of the recovered sample are reported in
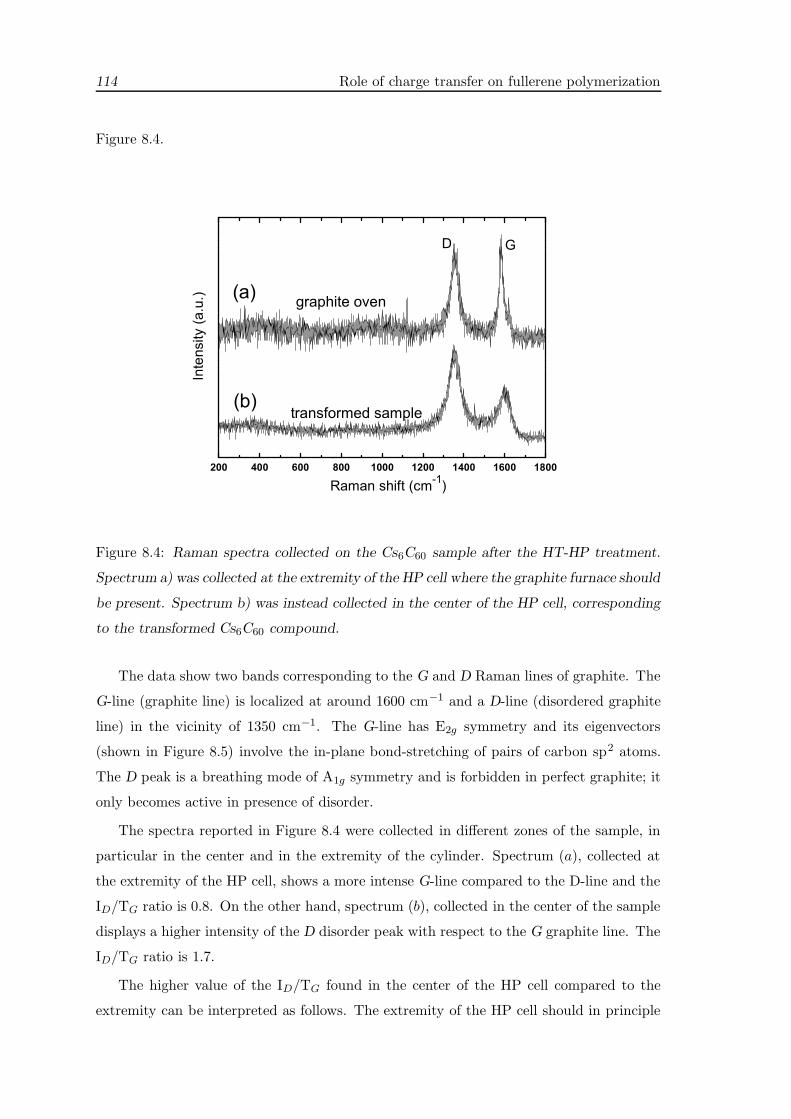
114 Role of charge transfer on fullerene polymerization
Figure 8.4.
Figure 8.4: Raman spectra collected on the Cs6C60 sample after the HT-HP treatment.
Spectrum a) was collected at the extremity of the HP cell where the graphite furnace should
be present. Spectrum b) was instead collected in the center of the HP cell, corresponding
to the transformed Cs6C60 compound.
The data show two bands corresponding to the G and D Raman lines of graphite. The
G-line (graphite line) is localized at around 1600 cm−1 and a D-line (disordered graphite
line) in the vicinity of 1350 cm−1. The G-line has E2g symmetry and its eigenvectors
(shown in Figure 8.5) involve the in-plane bond-stretching of pairs of carbon sp2 atoms.
The D peak is a breathing mode of A1g symmetry and is forbidden in perfect graphite; it
only becomes active in presence of disorder.
The spectra reported in Figure 8.4 were collected in different zones of the sample, in
particular in the center and in the extremity of the cylinder. Spectrum (a), collected at
the extremity of the HP cell, shows a more intense G-line compared to the D-line and the
ID/TG ratio is 0.8. On the other hand, spectrum (b), collected in the center of the sample
displays a higher intensity of the D disorder peak with respect to the G graphite line. The
ID/TG ratio is 1.7.
The higher value of the ID/TG found in the center of the HP cell compared to the
extremity can be interpreted as follows. The extremity of the HP cell should in principle

8.3 Raman measurements 115
a) E2g G mode b) A1g D breathing mode
Figure 8.5: Carbon motion in a) G and b) D modes.
contain graphite, coming from the graphite furnace, while in the center the Raman spec-
trum should correspond to the transformed sample as only Cs6C60 powder was placed in
that zone.
As a consequence, we suggest that the Cs6C60 compound irreversibly transformed into
graphite displying a higher level of disorder compared to the graphite deriving from the
furnace. Nevertheless, we cannot exclude the possibility of an air- or humidity- induced
contamination of the sample as both manipulation and data collection were performed in
contact with air.
The Raman spectra collected on the Rb6C60 sample after the HP-HT treatment showed
that, at least a part of it, irreversibly transformed into diamond as an intense line was
observed at 1332 cm−1, corresponding to the main diamond mode frequency. Unfortu-
nately, after the measurements, the spectra were lost preventing an accurate study and
hence a further discussion in this thesis. This deserves further studies in order to clarify
this point as 5 GPa and ∼ 1300 K constitute relatively “low” thermodynamic conditions
for the diamond synthesis.
8.3.1 Discussion
By coupling the results obtained from the XRD and Raman data reported in the previous
sections, we can conclude that the Cs6C60 and Rb6C60 compounds, after a study per-
formed at 5 GPa at high temperature, irreversibly transform into graphite and diamond,
respectively, where the C60 molecules are no longer present. This result is quite inter-
esting if we compare it with the behavior of the C60 molecules in solid C60, in the same
range of pressure and temperature explored for our systems. In fact, in the first chapter,
when describing the phase transitions observed in solid C60, we reported that between
1 and 8 GPa, around 600 K, polymerization of the molecules takes place. Nevertheless,

116 Role of charge transfer on fullerene polymerization
being both the compressibility and the dependence of nearest-neighbouring intermolecular
distance from the lattice parameter different in the M6C60 systems and in the fullerite1,
the real C60-C60 distance, and not the P-T range, must be considered in order to make a
meaningful comparison.
In the case of pristine C60, 1D and 2D polymerization was observed (see chapter 1)
between 1 and 8 GPa around 600 K, meaning that at this temperature, when the centres of
the nearest molecules are at distances between 9.85 and 9.30 A, respectively, a first order
transition occurs leading to new structures (orthorhombic, tetragonal or rhombohedral)
where covalent bonds between molecules are formed.
Figure 8.6: Pressure evolution of the dC60−C60in Rb6C60 and Cs6C60 calculated from
the equation of state obtained in chapter 3. Also the case of solid C60 is reported for
a comparison. The vertical and horizontal dashed lines delimit the range in pressure
(1–8 GPa) and distance between molecules (9.30–9.85 A), respectively, where transitions
towards polymerized structures have been observed in solid C60.
In Figure 8.6 we report the evolution of the nearest neighbouring molecule distance
dC60−C60in Rb6C60 and Cs6C60, as calculated from the equation of state obtained in
chapter 3 and for the solid fcc C60, calculated from the equation of state obtained by Duclos
et al. [45]. The two vertical and horizontal dashed lines delimite the range in pressure (1–8
1In fact, the intermolecular distance in the bcc M6C60 system is dC60−C60=a
√3
2while in the fcc fullerite
it is dC60−C60=a
√2
2.

8.4 Ab initio DFT results 117
GPa) and distance between molecules (9.30–9.85 A), respectively, where polymerization
has been observed for solid C60. We can observe that at 5 GPa, the dC60−C60in both Cs6C60
and Rb6C60 is compatible with such a “distance range”. Nevertheless, the formation of
covalent bonds between molecules is not observed in our measurements. On the contrary,
an irreversible transition towards disordered graphite and diamond for the Cs6C60 and
Rb6C60 compounds, respectively, is observed through XRD and Raman measurements.
Such transitions are thus accompanied by the breaking of the C60 molecules. Hence, the
observation of the discussed irreversible transition in Cs6C60 and Rb6C60 as a function
of temperature at around 5 GPa, suggests that in our systems the presence of the heavy
alkali metal ions seems to prevent the polymerization of C60. In addition, the MC60
systems (with M=K, Rb and Cs) have been observed to spontaneously polymerize at
ambient conditions meaning that the presence of the ions in these compounds promotes
the formation of covalent intermolecular bondings. As a consequence, the number of
heavy alkali metal ions present in the fullerene-based systems and hence the quantity of
transferred charge from the heavy alkali metals to the C60s seems to play a fundamental
role for the polymerization and probably on the behavior of the fullerenes under HP-HT
conditions.
Another variable that could affect the formation of C60 polymers is the relative orien-
tation of the molecules. While in pristine C60 the fullerenes are almost free to rotate (see
chapter 1), in the Rb6C60 and Cs6C60 systems, the rotation is blocked by the presence of
strong ionic interactions between each negative charged C−660 and the six positively charged
alkali metal M+1 ions. Moreover, the resulting relative orientation between the nearest
neighbouring molecules in these systems is different from that most commonly observed
in the polymerized systems. In these last ones, the double bond placed at the edge of two
hexagons of one molecule is facing the double bond placed at the edge of two hexagons of
the neighbouring molecules. On the other hand, in the M6C60 systems, two hexagons of
two neighbouring molecules are facing each other in parallel (see chapter 1, Figure 1.12).
8.4 Ab initio DFT results
In order to get a deeper insight into the role played by the charge transfer to the C60
molecules on their polymerization, we performed ab initio DFT calculation on a sim-
ple system consisting of a chain of C60s. In particular, we studied the evolution of the
wavefunction of the system, around the Fermi level, as a function of two variables:
- the distance, D, between the centres of the molecules along the chain (8.74, 9.14, 9.85

118 Role of charge transfer on fullerene polymerization
and 10.5 A);
- the net charge, q, consisting of 1, 2, 3 and 4 electrons transferred to the system.
The cubic unit cell, periodically repeated in the three Cartesian directions, contains 2
molecules in order to allow their relative reorientation during the study.
D
d
q
Figure 8.7: Schematic representation of the minimum system used within the calculations.
A cubic unit cell containing 2 molecules at a distance D is periodically repeated in the
three Cartesian directions. The net charge of the system is varied from the neutral case
up to 4 electrons.
The lattice parameter is equal to D+d, where d is the distance between the two closest
carbon atoms belonging to the two neighbouring molecules (see Figure 8.7). In this way,
if the two nearest molecules at D distance are placed along the <100> direction, the
distance between two neighbouring molecules along the <010> and the <001> directions
is big enough to allow to consider them as not interacting. Therefore, we refer to the
studied system as a chain of fullerenes. The starting relative-orientation of the molecules
corresponds to that most frequently observed in the polymerization of solid fcc C60 [15]
as discussed in chapter 1. This is shown also in Figure 8.7. According to this orientation,
a double bond of one molecule (placed on the edge shared by two hexagons) is facing a
double bond of the neighbouring molecule.
For each periodically repeated system, i.e. two molecules at a distance D, we studied
the effect of different numbers of electrons transferred to it, from the neutral case up to a
net charge of 4 electrons.
We have used the SIESTA [120] method, discussed in chapter 2, based on the density
functional theory. We used variationally optimized [121, 122] double-ζ polarized basis sets.
Real space integrals were performed on a mesh with a 200 Ry cutoff. In the calculations
2s and 2p orbitals of C atoms were explicitly included in the valence. For each calculation,
we have minimized the total energy until the forces on atoms are smaller than 0.04 eV/A.

8.4 Ab initio DFT results 119
In our calculations, the minimum neutral system, corresponding to two molecules, is
represented by 480 valence electrons (2s+2p electrons/carbon atom). This means that
there are 240 occupied states since each electronic level contains 2 electrons of opposite
spin. For the charged system, when a maximum of 4 additional electrons are considered,
there are 242 occupied states.
8.4.1 Neutral systems
The wavefunction corresponding to the formation of two covalent σ bondings between two
nearest neighbouring molecules, i.e. the polymerization, for all the studied systems in the
neutral case, is shown in Figure 8.8. For the system where molecules are at D=8.74 A,
the wavefunction corresponding to the polymerization of the molecules is represented by
the 238 eigenstate. Since the 238 bonding eigenstate is occupied, while the corresponding
antibonding state (248) is at much higher energy and is not occupied, the ground state
of this system correponds to a chain of polymerized fullerenes, i.e. each C60 is covalently
linked to the two nearest neighbouring molecules.
D = 8.74 Å
238 eigenstate 241 eigenstate
D = 9.14 Å
D = 9.85 Å D = 10.5 Å
241 eigenstate241 eigenstate
100
001
010
Figure 8.8: Representation in real space of the eigenstates corresponding to covalent
BONDING between molecules for each studied system, in the neutral case. In all cases,
the wavefunction is plotted using the same threshold value for the isosurfaces.
When considering larger distances between the molecules, in particular 9.14, 9.85 and
10.50 A, the wavefunction corresponding to two covalent σ bondings between two nearest
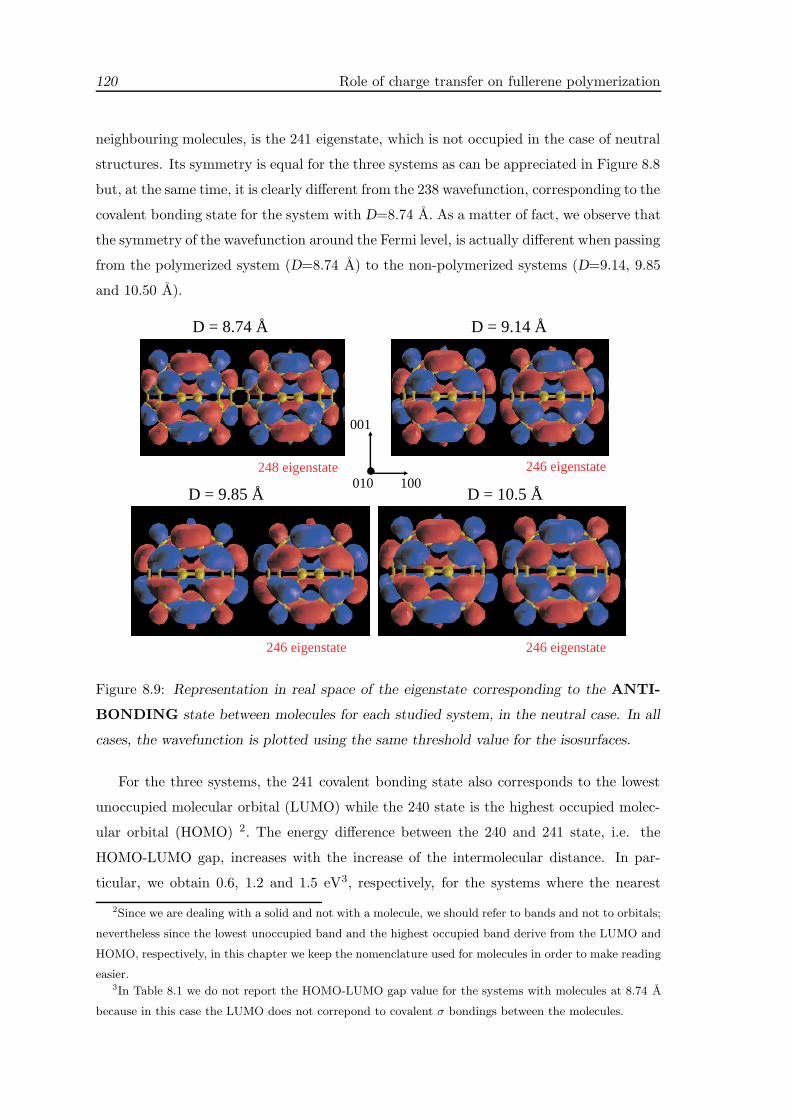
120 Role of charge transfer on fullerene polymerization
neighbouring molecules, is the 241 eigenstate, which is not occupied in the case of neutral
structures. Its symmetry is equal for the three systems as can be appreciated in Figure 8.8
but, at the same time, it is clearly different from the 238 wavefunction, corresponding to the
covalent bonding state for the system with D=8.74 A. As a matter of fact, we observe that
the symmetry of the wavefunction around the Fermi level, is actually different when passing
from the polymerized system (D=8.74 A) to the non-polymerized systems (D=9.14, 9.85
and 10.50 A).
D = 8.74 Å
248 eigenstate 246 eigenstate
D = 9.14 Å
D = 9.85 Å D = 10.5 Å
246 eigenstate246 eigenstate
100
001
010
Figure 8.9: Representation in real space of the eigenstate corresponding to the ANTI-
BONDING state between molecules for each studied system, in the neutral case. In all
cases, the wavefunction is plotted using the same threshold value for the isosurfaces.
For the three systems, the 241 covalent bonding state also corresponds to the lowest
unoccupied molecular orbital (LUMO) while the 240 state is the highest occupied molec-
ular orbital (HOMO) 2. The energy difference between the 240 and 241 state, i.e. the
HOMO-LUMO gap, increases with the increase of the intermolecular distance. In par-
ticular, we obtain 0.6, 1.2 and 1.5 eV3, respectively, for the systems where the nearest
2Since we are dealing with a solid and not with a molecule, we should refer to bands and not to orbitals;
nevertheless since the lowest unoccupied band and the highest occupied band derive from the LUMO and
HOMO, respectively, in this chapter we keep the nomenclature used for molecules in order to make reading
easier.3In Table 8.1 we do not report the HOMO-LUMO gap value for the systems with molecules at 8.74 A
because in this case the LUMO does not correpond to covalent σ bondings between the molecules.

8.4 Ab initio DFT results 121
neighbouring molecules are at 9.14, 9.85 and 10.50 A (see Table 8.1). This proves that it
is energetically more favourable to occupy the bonding state (LUMO) when the molecules
are closer to each other in the chain.
The wavefunction corresponding to the antibonding state for the four systems is shown
in Figure 8.9. While for the system with D=8.74 A, the antibonding state corresponding
to the 238 bonding state is the 248 eigenstate, for the three systems with bigger D, the
antibonding state, correponding to the covalent 241 bonding state, is the 246 eigenstate.
In the latter cases, the energy difference between the bonding (241) and the antibonding
(246) state, decreases with the increase of the intermolecular distance. In particular,
∆E=Eantibonding-Ebonding is 0.7, 0.4 and 0.2 eV for the systems with D equal to 9.14, 9.85
and 10.50 A, respectively. This indicates that the bonding state is energetically more stable
with respect to the antibonding state, much more for smaller intermolecular distances.
8.4.2 Charged systems
The calculations performed for the four different structures in the presence of a net charge
show that the symmetry of the wavefunction around the Fermi level, in all cases, is un-
changed when considering from 1 up to 4 electrons transferred to the system. The presence
of additional electrons only contributes to the occupation of the electronic states which
are not occupied in the neutral system. Hence, for the different systems we observe that:
• D=8.74 A: the molecules remain polymerized up to a net charge of 4 electrons
because no antibonding state is observed up to the 242 eigenstate. In particular,
the 239, 240 and 242 wavefunctions correspond to intramolecular bonding states
while the 241 wavefunction represents an an intermolecular bonding state through
4 σ bondings between two nearest neighbouring molecules, with different symmetry
D HOMO-LUMO gap Eantibonding-Ebonding
(A) (eV) (eV)
8.74 2.26
9.14 0.6 0.7
9.85 1.2 0.4
10.50 1.5 0.2
Table 8.1: Evolution of the HOMO-LUMO gap and the ∆E between the antibonding and
the bonding state as a function of the intermolecular distance D for the 1D C60 chain.

122 Role of charge transfer on fullerene polymerization
with respect to the 238 eigenstate;
• D=9.14, 9.85 and 10.50 A: when considering a net charge of 1 or 2 electrons, the
241 eigenstate (corresponding to the presence of two covalent σ bondings between
molecules) becomes occupied, thus promoting the polymerization. If a net charge
of 3 or 4 electrons is considered, there is the occupation of the 242 eigenstate which
corresponds to an intermolecular bonding state, with different symmetry compared
to the 241 (equal to the 241 bonding state of the previous case).
D dq0-dq1
dq0-dq2
dq0-dq3
dq0-dq4
(A) (A) (A) (A) (A)
8.74 0.001 0.001 0.001 0.001
9.14 0.042 0.072 0.066 0.056
9.85 0.027 0.057 0.044 0.41
10.50 0.016 0.027 0.031 0.035
Table 8.2: Evolution as a function of the intermolecular distance D of the difference
between the d distance (see Figure 8.7) in the neutral chain and in the charge one. The
labels q0, q1, q2, q3 and q4 indicate the neutral system, 1, 2, 3 and 4 electrons transferred
to the system, respectively.
In agreement with these results, we observe an evolution of the distance, d, between
the nearest neighbouring carbon atoms coming from different molecules (see Figure 8.7)
as a function of the net charge in the system. The results concerning the evolution of the
distance d in the four different systems are reported in Table 8.2.
While the system with D equal to 8.74 A, which is polymerized even in the neutral case,
the presence of a net charge does not significantly affect the structure, in the other three
systems, the occupation of the bonding states upon charge transfer promotes the closeness
of the nearest neighbours carbon atoms coming from different molecules. Moreover, the
variation of the d distance with the occupation of the 241 bonding state depends on the
intermolecular distance. For systems with closer molecules, this variation is bigger. For
the systems with the intermolecular distance equal to 9.14 and 9.85 A, the smallest d
distance is observed for q=2 electrons, i.e. when the 241 bonding state is the HOMO state
and in addition is completely filled. On the other hand, the system with D equal to 10.50
A, shows a minimum distance for q=4 electrons.

8.4 Ab initio DFT results 123
8.4.3 Discussion
We have performed ab initio DFT calculations on very simple systems consisting of infinite
chains of fullerenes in order to understand if the presence of a net charge coupled with
different distances between the molecules in the chain could play a role for the polymer-
ization.
Hence, the variables of the calculations are the distance between the molecules, D, and
the number of electrons transferred to the system, q.
We observe that at the intermolecular distance of 8.74 A, the ground state of the neutral
system corresponds to polymerized molecules, as the 238 occupied state corresponds to
covalent sigma bonds between the molecules. By adding electrons to the system, the
symmetry of the wavefunction remains unchanged, the only effect is to occupy the 240
and the 241 states. As a consequence, the covalent σ bonds are not broken since the
antibonding state is at much higher energy.
When the intermolecular distance is 9.14, 9.85 or 10.50 A, the bonding state correponds
to the 241 eigenstate and since this is not occupied in the neutral systems, the molecules are
not polymerized for q=0. By adding electrons to the systems, as above, the symmetry of
the wavefunction remains unchanged meaning that the polymerization between molecules
takes place by occuping the 241 state.
For the polymerized system (i.e. for D=8.74 A) the presence of additional electrons
does not affect the distance between the nearest neighbouring carbon atoms belonging to
different molecules, as shown by the evolution of the d. This is probably due to the fact
the bonds between the molecules is very strong and that the occupation of new states
(intramolecular bonding states) does not weaken it. This is also shown by the big energy
difference between the bonding and the antibonding state, compared to the other systems.
When the intermolecular distance is bigger, for D=9.14 and 9.85 A, the complete
occupation of the 241 covalent bonding state determines the minimum value of the distance
d.
The system with D=10.50 shows instead a minimum value of d for the occupation of
the 242 state which is an intermolecular bonding state through 4 σ bonds between 2 nearest
neighbouring molecules. This is probably due to the fact that at this distance, the covalent
σ bonds corresponding to the 241 state are very weak so that they are strengthened by
the occupation of another intramolecular bonding state.
The total variation in the d distance upon occupation of the covalent bonding state
decreases for the bigger intermolecular distances. This indicates that for these systems
the covalent intermolecular bondings are weaker, as can also be observed in Figure 8.8
124 Role of charge transfer on fullerene polymerization
where the wavefunction isosurface value between the molecules decreases for the higher
distances. In agreement with this, we observe that the energy difference between the
covalent bonding state and the corresponding antibonding state is smaller for the higher
distances.
In conclusion, the coupled effect between the presence of a transfer of charge and the
distance between molecules could determine the formation of C60 polymers, in the systems
that we have studied. Since the relative orientation of the nearest neighbouring molecules
in the M6C60 compounds is different from that considered here, it would be interesting to
perform a similar study by considering a chain of fullerenes with that relative orientation
in order to understand how this could affect the polymerization.

Conclusions
The research activity carried out during this thesis work was aimed to explore the phase di-
agram of Rb6C60 and Cs6C60 having as initial motivation the synthesis of carbon clathrate-
type materials under high pressure and/or high temperature conditions. Such carbon net-
works, obtained as high dimensional polmyers starting from the Rb6C60 and Cs6C60 body
centered cubic structures, are expected to exhibit both superconducting properties and
extremely high hardness.
In particular, the goal of this work was motivated by several theoretical works indi-
cating that such polymerized structures, characterized by sp3 hybridized bonds between
molecules, should exhibit a high critical superconducting temperature close to room tem-
perature. Moreover, a high bulk modulus coefficient, possibly exceeding that of diamond,
as observed for 3D polymerized structures obtain from pristine solid fcc C60, is also ex-
pected for these structures.
The work reported in this thesis includes a series of XAS, XRD and Raman spec-
troscopy measurements collected for the two systems in a wide range of pressures (up to
∼ 50 GPa) and temperatures (from room temperature up to 1500 Kelvin) and ab initio
DFT calculations performed on the same compounds under pressure (up to 100 GPa) (at
zero Kelvin).
In chapter 4, we have reported both experimental and first principles studies on Rb6C60
and Cs6C60. By coupling the complementary information obtained by XRD and EXAFS
with the results obtained by ab initio calculations we made possible the understanding of
the mechanisms taking place during the compression of such systems.
As a result, we observed that the compression of the C60 molecule is accompanied by an
enhanced pressure-induced deformation which preserved the cubic Th symmetry. In order
to better describe the molecular distortion, we defined a distortion parameter, d, as the
difference between the distances from each molecule’s centre to those 36 carbons closest
to the alkali metals, on one hand, and to those 24 carbon atoms located closest to other
C60 molecules, on the other. Both experiments and calculations agree with a deformation

126 Conclusions
of the fullerene molecule which is more important for Rb than for Cs intercalation.
In chapter 5, we report a study on Cs6C60 under higher pressure. We performed
Raman spectroscopy measurements at room temperature up to 45.5 GPa and ab initio
calculations up to 43 GPa. Both experiments and calculations allow us to conclude that
the molecular character of the C60 fullerene can be maintained through alkali intercalation
up to pressures at least two times higher (around 45 GPa) than for previously reported
solid C60 (around 22 GPa). Moreover, the Raman spectra obtained by first principles
calculations allow us to identify the symmetry of the six new observed lines with respect
to the active Raman modes of the isolated molecule.
In chapter 6, we reported a study of Rb6C60 under pressure up to around 49 GPa
performed by XAS, XRD and Raman spectrscopy. We observed a clear reversible phase
transition at around 35 GPa, by XRD and Raman spectroscopy, at 600 K and room
temperature, respectively. The results obtained by coupling the two techniques, allow to
suggest that the hexagonal unit cell structure identified after the transitions, is accompa-
nied by the formation of 2D polymerized C60 molecules in the (001) plane of the hexagonal
structure containing the −→a −→b unit-cell vectors. In particular, the lattice parameters of
the hexagonal unit cell (a=8.360(2) A and c=14.830(7) A) are compatible with a distance
bewteen molecules previously observed in the case of polymerized C60s. In correspondence
of this transition, the Raman spectroscopy measurements show a discontinuous change in
the frequency of the intramolecular normal vibrations, probably associated with the break-
ing of some intramolecular bonds concomitant with the formation of new intermolecular
covalent bonds, as occurs in the polymerization of C60s.
Unfortunately, XRD and XAS studies have not been performed on Cs6C60 under high
pressure and/or high temperature but a different high pressure behaviour is nevertheless
observed by Raman spectroscopy, for this system compared to the Rb6C60. While an
abrupt change in the Raman modes frequencies is observed at 35 GPa for Rb6C60, as
mentioned above, a continuous evolution of the Raman active modes is observed for Cs6C60
up to the highest measured pressure, i.e. 45 GPa. The results obtained from the ab
initio calculations, reported in chapter 7, performed as a function of pressure on the two
systems allowed to better understand this different pressure behavior, observed for the
two compounds.
In particular, the calculations show the existence of a pressure instability of the bcc
structure of Rb6C60 between 75 and 100 GPa ,contrary to the case of Cs6C60. In corre-
spondance of this “transition” we observe a discontinuous modification of both structural
and electronic properties of the Rb6C60 system. In particular, we observe that at 100 GPa,

127
the single and double C-C intramolecular bonding lengths and the C60 volume abrupty
increases leading to a shape change of the fullerene. In addition, an abrupt opening of the
gap between the highest occupied and the lowest unoccupied bands and a discontinuity
in the decrease of the charge transfer from the alkali Rb atoms to the molecules, are also
obtained. On the other hand, a continuous evolution of the structural and electronic prop-
erties is observed for Cs6C60 up to 98 GPa reflecting a higher pressure range of stability for
this system compared to Rb6C60. The theoretical study of the pressure evolution of the
charge transfer from the alkali metal ions to the fullerene molecules has been studied in two
different ways, by considering the Mulliken-population analysis method and by studying
the electronic density contained in each molecule. Both methods allow to conclude that
the charge transfer, continuously decreases as a function of pressure for both systems and
that the charge transfer decrease with pressure in Cs6C60 is less pronounced compared to
the Rb case. At the same time, the pressure induced distortion of the fullerenes increases
less fastly than in Rb6C60. In particular, the distortion parameter is 100% higher for the
Rb case than in the Cs one right before the transition observed by the calculations, i.e. at
around 75 GPa.
Therefore, since the charge transfer decreases more rapidly in Rb6C60 than in Cs6C60
with pressure and the molecular pressure-induced distortion observed in the Rb case is
bigger that in the Cs case, we suggest that the ionic interactions between the positively
charged alkali ions and the negatively charged C60 molecule prevent the pressure de-
formation of the molecule promoting its pressure stability. Consequently, the Coulomb
interactions seems to be responsible for the bigger pressure stability range (more than
twice) of the C60 molecule in the studied systems compared to the non intercalated solid
C60, as observed from our measurements.
The XRD study, performed on Rb6C60 and Cs6C60 as a function of temperature at a
constant pressure (around 5 GPa) and reported in chapter 8, demonstrated the occurrence
of an irreversible transition at high temperature accompanied by the disappearence of all
the Bragg reflections. In the non intercalated solid C60, the different studies performed
at the same conditions of pressure and as a function of temperature showed before the
occurrence of the C60 polymerization and the the partial destruction of molecules. In par-
ticular, those studies showed the formation of 1D and 2D polymers in the pristine fcc C60
system under pressure, when the distances between the nearest neighbouring molecules
are equal to those existing between two nearest neighbouring molecules in our systems. In
addition, fullerides with lower stoichiometric amount of heavy alkali metals (MC60, M=K,
Rb and Cs) have been observed to spontaneously polymerize at ambient conditions. All
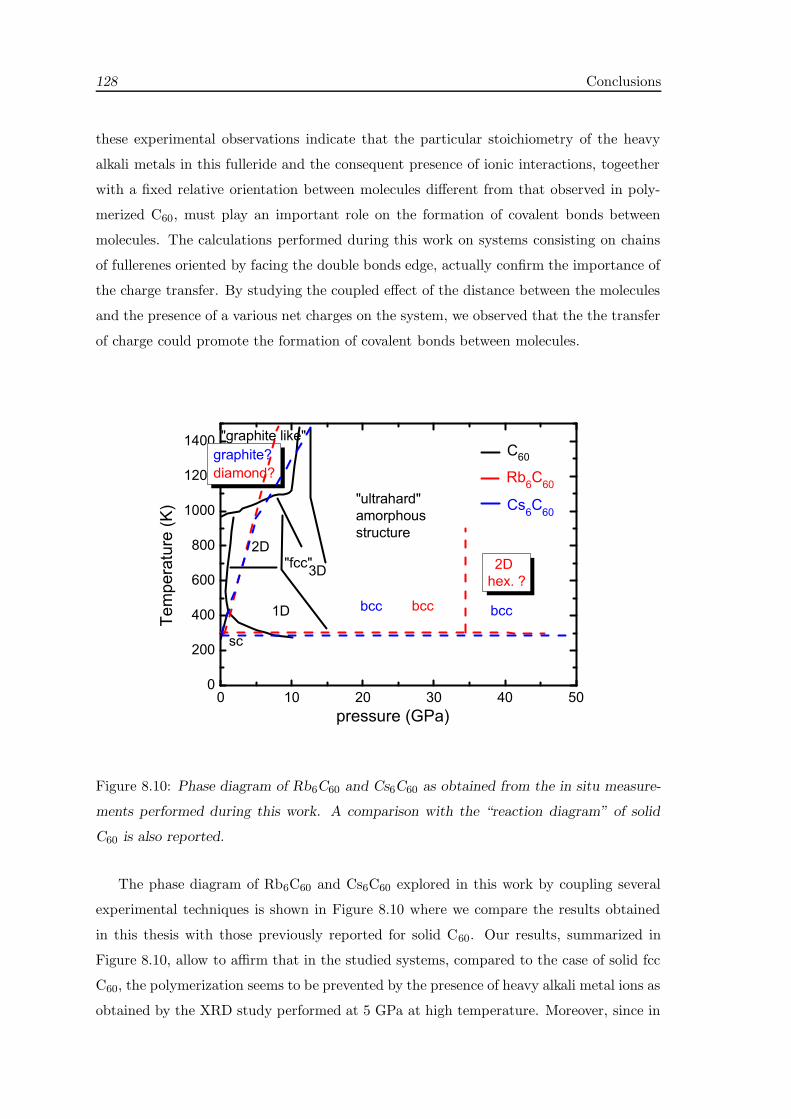
128 Conclusions
these experimental observations indicate that the particular stoichiometry of the heavy
alkali metals in this fulleride and the consequent presence of ionic interactions, togeether
with a fixed relative orientation between molecules different from that observed in poly-
merized C60, must play an important role on the formation of covalent bonds between
molecules. The calculations performed during this work on systems consisting on chains
of fullerenes oriented by facing the double bonds edge, actually confirm the importance of
the charge transfer. By studying the coupled effect of the distance between the molecules
and the presence of a various net charges on the system, we observed that the the transfer
of charge could promote the formation of covalent bonds between molecules.
Figure 8.10: Phase diagram of Rb6C60 and Cs6C60 as obtained from the in situ measure-
ments performed during this work. A comparison with the “reaction diagram” of solid
C60 is also reported.
The phase diagram of Rb6C60 and Cs6C60 explored in this work by coupling several
experimental techniques is shown in Figure 8.10 where we compare the results obtained
in this thesis with those previously reported for solid C60. Our results, summarized in
Figure 8.10, allow to affirm that in the studied systems, compared to the case of solid fcc
C60, the polymerization seems to be prevented by the presence of heavy alkali metal ions as
obtained by the XRD study performed at 5 GPa at high temperature. Moreover, since in

129
this work the formation of C60 polymers has probably been observed at 35 GPa and 600 K,
this means that a much higher pressure, i.e. a much smaller distance between molecules, is
needed in this case in order to observe the formation of covalent bonds between molecules.
In order to further progress in this work, we propose additional accurate XRD studies
on Rb6C60 to definitively identify not only the structure symmetry of the new phase
observed at around 35 GPa and 600 Kelvin but also the atomic positions in the unit
cell. This would allow to perform calculation on such new structure in order to check
its pressure stability with respect to the bcc phase. In this thesis work, we observed
the reversibility of the phase transition of Rb6C60 at 600 Kelvin around 35 GPa. We
propose to collect XRD measurements at ambient conditions, by quenching the sample
from 600 Kelvin down to room or even lower temperature, at high pressure. This could
allow to metastabilize the new phase down to ambient conditions and hence to check
for the existence of superconducting properties by resistivity and magnetic susceptibility
measurements.
Moreover, Stokes and anti-Stokes Raman spectra collected on Rb6C60 at room tem-
perature will provide the effective temperature of the sample, which could be higher than
the room temperature due to the laser heating.
Concerning the Cs6C60 system, we propose to collect XRD and XAS data under high
pressure and high temperature conditions in order to confirm the absence of phase tran-
sitions, as suggested by Raman spectroscopy measurements.
In addition, with respect to ab initio calculations, the initial idea was to compare to
results obtained by using the LDA and the GGA functionals but we finally didn’t manage
to to employ the second approximation due to lack of time. Moreover, we also planned to
study the role of the charge transfer on the polymerization (chapter 8) by considering, in
addition to the net charge on the system, also a background charge in order to neutralize
the excess charge in the system. Consequently, we propose to perform such studies in
order to provide a more complete treatment of the subject. Also, as discussed in chapter
8, we propose an additional study about the role of the net charge on 1D C60 chains,
by considering a different relative orientation of the molecule, in particular that existing
between the nearest neighbouring molecules (placed along the diagonal of the cubic cell)
in M6C60 systems.
Concerning the initial motivation of this work, i.e. the synthesis of high dimensional
polymers of intercalated fullerene, we propose to study fullerides with lighter alkali metal
ions under extreme conditions. The presence of smaller ions could promote the formation
of covalent intermolecular bonds at lower pressures, compared to the fullerides studied in

130 Conclusions
this work. Alternatively, the same study on fullerides with lower stoichiometric amounts
of alkali metal atoms could be envisaged.

Acknowledgements
During these three years numerous persons gave an important contribution to this work.
I refer not only to the collegues and supervisors that guided me in the scientific work but
also to my close relatives and family members whose endless support encouraged me most.
First of all, my deepest acknowledgements go to my thesis director, Prof. Alfonso
San Miguel, whose scientific enthusiasm has been a precious constant during my work. In
particular I want to thank him for giving me the possibility of working on this subject
that I really liked and for providing me as much help as I needed and as much scientific
freedom as I wished.
I also would like to thank all the people I worked with in these years at the ESRF for
making this “synchrotron” experience unforgettable. In particular I thank my supervisor
at the ESRF who was also my second thesis director, Sakura Pascarelli, for giving me
the opportunity of working in her group. I want to thank her also for the experimental
assistence during experiments and for helping me during all this period. I want to express
my sincere gratitude to Giuliana Aquilanti for her helpfulness and patience during difficult
and sometimes daunting high pressure experiments. I really appreciated all the time she
spent for helping me in the preparation of my experiments. Many thanks also to Simone
De Panfilis for the interesting discussions about XAS and for encouraging me during my
scientific “crisis”. Thanks to all my colleagues of BM29 and ID24 for the nice work
ambience and also for all the science I learnt through our discussions Angela, Olivier,
Gianluchino, Gemma, Marco, Matt, Lello ... I want to thank as well Sebastian for his
precious technical support on the high pressure devices.
My acknowledgements also go to all my colleagues at the LPMCN. The most sincere
gratitude go to Sylvie Le Floch for her essential support on the synthesis of the samples.
In addition, her help for the manipulation of our air sensitive compounds was fundamental
for performing this work. I also want to thank Pierre Toulemonde and Denis Machon for
patiently answering all my questions about XRD and Raman spectrocopy. They also gave

132 Acknowledgements
me an important support during the experiments and their preparation. I want to as
well thank Herve Feret for his precious technical work on the high pressure apparata we
employed during the experiments.
Special acknowledgements go to Maria Victoria Fernandez-Serra for introducing me in
the wide and difficult world of the DFT simulations. I also appreciated her patience and
comprehension when dealing with my silly (not for me!) questions.
My sincere gratitude to Michela Brunelli for being so kind to permit me to characterize
my samples by XRD during her beamtime. Her help was essential in order to establish
the good synthesis parameters.
I also want to thank Dr. Leonel Marques for interesting discussions on C60 and its
polymerization and for his help in the understanding of XRD data.
I sincerely thank David Martinez-Blanco for his important support when using the
FULLPROF package. His enthusiasm when performing Rietveld fits gave me the illusion
of playing a video game.
Many thanks also to Gilles Montagnac and Herve Cardon for giving me the possibility
to perform Raman experiments during my thesis. Their technical support made possible
the succees of interesting experiments.
I would like to thank Wilson Crichton and Mohamed Mezouar for helping me in per-
forming and understanding x-ray diffraction experiments.
My most sincere gratitude to all my friends from Italy (in particular from Morrovalle
and Civitanova) and those I have met here in Grenoble. Thanks for making this french
experience unforgettable. Thank you Chiara (Kiaua), Elena, Federica, Franceso (Ofra),
Mauro, Mirko, Fabiola (Futiola), Orietta, Maria, Myriam, Pedro, Miguel, Gemma, Mischa,
Felisa, Otello (Otiello), Elisa, Gianluca, Fabrizio, Lorena, Roberto, Edmundo, Gaston,
Andrea (Andy), Diana, Julio (Culio or Coolio), Montserrat (Mun), Guillaume, Jorge,
Sandra, Manu ...
I owe my heartfelt gratitude to my family ... for many reasons ...
Finally, most thanks go to Alex (naino) for supporting and encouraging me during all
the thesis period and for tolerating my numerous mood changes (in particular) at the end
of my thesis ... I liked a lot the stimulating scientific discussions about C60 and imogolite
...

Appendix A
Sample synthesis
In this appendix we explain the method that we used for the synthesis of the samples.
Even though the synthesis procedure for similar systems can be found in literature [60,
144], we did not follow exactly these methods but we rather attempted a new synthesis
scheme that arose after stimulating discussions with Prof. Laurent Duclaux.
All the preparation process has been performed in the chemistry and in the high
pressure laboratory at the LPMCN of the University Lyon 1, in Lyon. In the following we
describe the main steps:
• Fullerene cleaning: the first step consisted in the fullerite cleaning. The C60 powder
enclosed in a sealed quartz tube was heated at 550 K and pumped at the same time
at 5*10−7 mbar during ten hours.
• Stoichiometric mixing: the Rb6C60 and Cs6C60 compounds were prepared by mixing
stoichiometric amounts of annealed C60 (99.95+ % purity) with Cs and Rb (99.98
% purity) metals in glove box, respectively. In addition, a small excess amount of
alkali metals were used (respectively 2.5% and 3% wt of Cs and Rb) because they
were observed to remain on the quartz tube after the synthesis. In Figure 8.11 we
show a picture of the glove box used for avoiding sample degradation. The mixing
process must be performed in inert atmosphere in order to avoid sample reaction
or contamination due to the presence of the alkali metals, extremely sensitive to air
and humidity.
• Vacuum sealing: the mixed powder placed in a quartz tube was pumped in vacuum
at 5*10−7 mbar during ten hours (as for the fullerite cleaning) before sealing.
• Reaction: the solid state reaction was obtained by annealing the mixed powder
enclosed in a sealed evacuated quartz tube at high temperature for several days. The

134 Appendix A
Figure 8.11: Picture of the glove box employed during the sample synthesis in order to
avoid reaction or contamination of both the Rb and Cs alkali metals and the final Rb6C60
and Cs6C60 compounds.
sealed tube is placed in the middle zone of a tubular furnace, shown in Figure 8.12
where temperature is almost homogeneous. During the first year of my PhD, we
performed many different sample synthesis by varing these parameters (temperature
and time) before obtaining an excellent data quality. After each synthesis process we
verified the sample quality by XRD. The best data quality was obtained by annealing
the mixed powder at 600 K for 35-40 days.
furnace
quartz tube
Figure 8.12: The picture shows the quartz tube containing the powder sample pumped at
5*10−7 mbar. After sealing the ampoule is placed in the central zone of the furnace.
The annealing time was found to be a critical parameter for the synthesis of the
M6C60 (M=Rb and Cs) compounds. By increasing it from a few days (two or three)
up to 40 days, the result improved considerably. In particular, we observed that no

135
sign of the M6C60 compound was present in the XRD patterns for the first case (a
few days), while a high percentage of the M6C60 phase was synthesized, in addition
to other stoichiometric compounds, like M3C60 and M4C60, in the second case (40
days). Moreover, we observed that by increasing the annealing temperature from
550 up to 600 K the data quality further improved. In particular, the samples
prepared at 600 K during 40 days were pure M6C60 phase (Figure 8.13, (c) and (d)).
We also performed a synthesis of the two compounds by increasing the annealing
temperature up to 700 K and by decreasing the “reaction”time down to 15 days.
The sample characterization performed by XRD and Raman spectroscopy displayed
the lack of Bragg reflections of the M6C60 phase.
(a) (b)
(c) (d)
Figure 8.13: XRD patterns collected on the some of the different samples synthesized dur-
ing my first year of PhD. The experimental data are reported together with the simulated
patterns obtained by considering the crystalline structures reported in literature [113].
The different synthesis have been performed by varing both temperature and time in the
annealing process. For Rb6C60: (a) 550 K-3 days; (b) 600 K-30 days and (c) 600 K-40
days. For Cs6C60 (d) 600 K-40 days.
The obtained Rb6C60 and Cs6C60 powder compounds are extremely sensitive to air

136 Appendix A
and humidity. For this reason the sample preparation for the high pressure and high
temperature experiments has been performed in glove box (Figure 8.11).
In Figure 8.13 we report some XRD patterns collected on different synthesized samples
in order to check the good stoichiometry of the obtained compounds. The shown XRD
data have been collected at the ID31 beamline (ESRF) and at the BM29 beamline (ESRF).
We display four different patterns. The data shown in panels (a), (b) and (c) of Figure 8.13
are reported by following the chronological order of the corresponding synthesis. We can
observe that the quality of the sample improved considerably for the last synthesis process.
The XRD pattern reported in panel (a) corresponds to a sample obtained by annealing
the mixed powder at 550 K for three days. The Rb6C60 compound is not present in the
powder. The sample whose XRD pattern is shown in panel (b) displays better quality
compared to the previous one, the presence of both Rb6C60 (∼ 85 % in wt) and Rb4C60
(∼ 15 % in wt) compounds. The synthesis was performed by annealing the powder at
600 K for 30 days. The most recent sample synthesis, reported in panel (c) was annealed
at 600 K for 40 days and the corresponding XRD patterns shows the good quality of the
sample. The XRD pattern reported in panel (d) corresponds to the Cs6C60 compound,
synthesized using the same values of the temperature and time variables employed for the
synthesis of the Rb6C60 whose XRD pattern is shown in panel (c). The data quality is
excellent.

Appendix B
Bond polarizability model for the Raman spectra of fullerenes
In this appendix, we describe the bond polarizability model reported in Ref. [136] and
used in chapter 5 in order to select the Raman active modes of the C60 molecule among
the 192 calculated normal vibrations in the Cs6C60 system.
The intensity of the first-order off-resonance Stokes Raman scattering for a harmonic
system can be written as:
Iη′η(ω) = CωLω3S
3N∑
f=1
〈(ωf )〉 + 1
ωf
∣
∣
∣
∑
αβ
η′αηβPαβ,f
∣
∣
∣
2× δ(ω − ωf ) (8.1)
Here, C is a frequency-independent constant; ωL and ωS are the incident and scat-
tered light frequencies, respectively; ω ≡ ωL = ωS is the Raman shift; η and η′ are unit
vectors along the incident and scattered polarization directions, respectively; 〈n(ωf )〉 ≡[exp(βhωf ) − 1]−1 is the thermal average occupation number of mode f at temperature
T = (kBβ)−1 and the quantity Pαβ,f is the derivative of the electronic polarizability tensor
with respect to the normal coordinate for mode f . Hence, the calculation of the Raman
spectrum requires mode frequencies, mode eigenvectors and polarizability derivatives. In
terms of the mode eigenvectors, Pαβ,f is given by:
Pαβ,f =∑
lγ
[
∂Pαβ
∂uγ(l)
]
0
χγ(l|f) (8.2)
where [∂Pαβ/∂uγ(l)]0 are the electronic polarizability derivatives with respect to the
real-space atomic displacements uγ(l), evaluated at the system’s equilibrium configuration.
Here l=1,N labels the atomic sites, γ=1,3 labels Cartesian components and χ(f) are the
mode eigenvectors. In order to evaluate the derivatives in eq. 8.2, we assume that the
static electronic polarizability of a molecule can be expressed as a sum of individual bond
polarizabilities. In addition, we make the “zero order approximation”, meaning that the
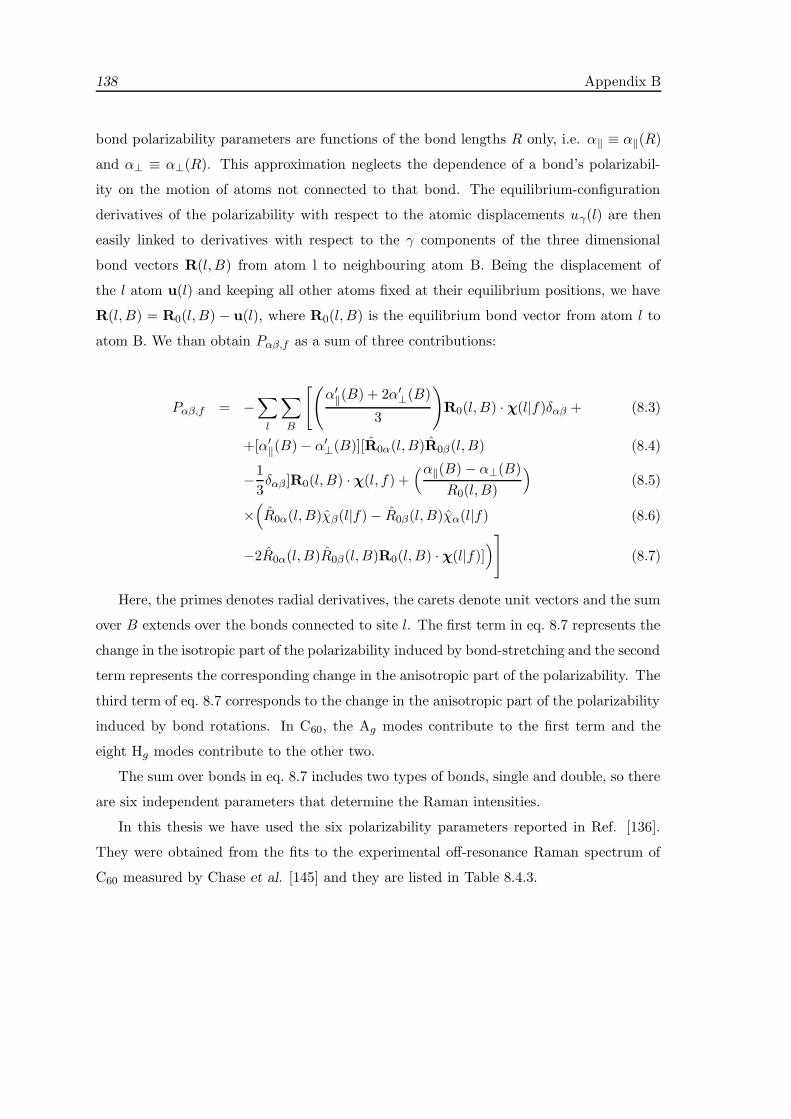
138 Appendix B
bond polarizability parameters are functions of the bond lengths R only, i.e. α‖ ≡ α‖(R)
and α⊥ ≡ α⊥(R). This approximation neglects the dependence of a bond’s polarizabil-
ity on the motion of atoms not connected to that bond. The equilibrium-configuration
derivatives of the polarizability with respect to the atomic displacements uγ(l) are then
easily linked to derivatives with respect to the γ components of the three dimensional
bond vectors R(l, B) from atom l to neighbouring atom B. Being the displacement of
the l atom u(l) and keeping all other atoms fixed at their equilibrium positions, we have
R(l, B) = R0(l, B) − u(l), where R0(l, B) is the equilibrium bond vector from atom l to
atom B. We than obtain Pαβ,f as a sum of three contributions:
Pαβ,f = −∑
l
∑
B
[(
α′‖(B) + 2α′
⊥(B)
3
)
R0(l, B) · χ(l|f)δαβ + (8.3)
+[α′‖(B) − α′
⊥(B)][R0α(l, B)R0β(l, B) (8.4)
−1
3δαβ ]R0(l, B) · χ(l, f) +
(α‖(B) − α⊥(B)
R0(l, B)
)
(8.5)
×(
R0α(l, B)χβ(l|f) − R0β(l, B)χα(l|f) (8.6)
−2R0α(l, B)R0β(l, B)R0(l, B) · χ(l|f)])
]
(8.7)
Here, the primes denotes radial derivatives, the carets denote unit vectors and the sum
over B extends over the bonds connected to site l. The first term in eq. 8.7 represents the
change in the isotropic part of the polarizability induced by bond-stretching and the second
term represents the corresponding change in the anisotropic part of the polarizability. The
third term of eq. 8.7 corresponds to the change in the anisotropic part of the polarizability
induced by bond rotations. In C60, the Ag modes contribute to the first term and the
eight Hg modes contribute to the other two.
The sum over bonds in eq. 8.7 includes two types of bonds, single and double, so there
are six independent parameters that determine the Raman intensities.
In this thesis we have used the six polarizability parameters reported in Ref. [136].
They were obtained from the fits to the experimental off-resonance Raman spectrum of
C60 measured by Chase et al. [145] and they are listed in Table 8.4.3.
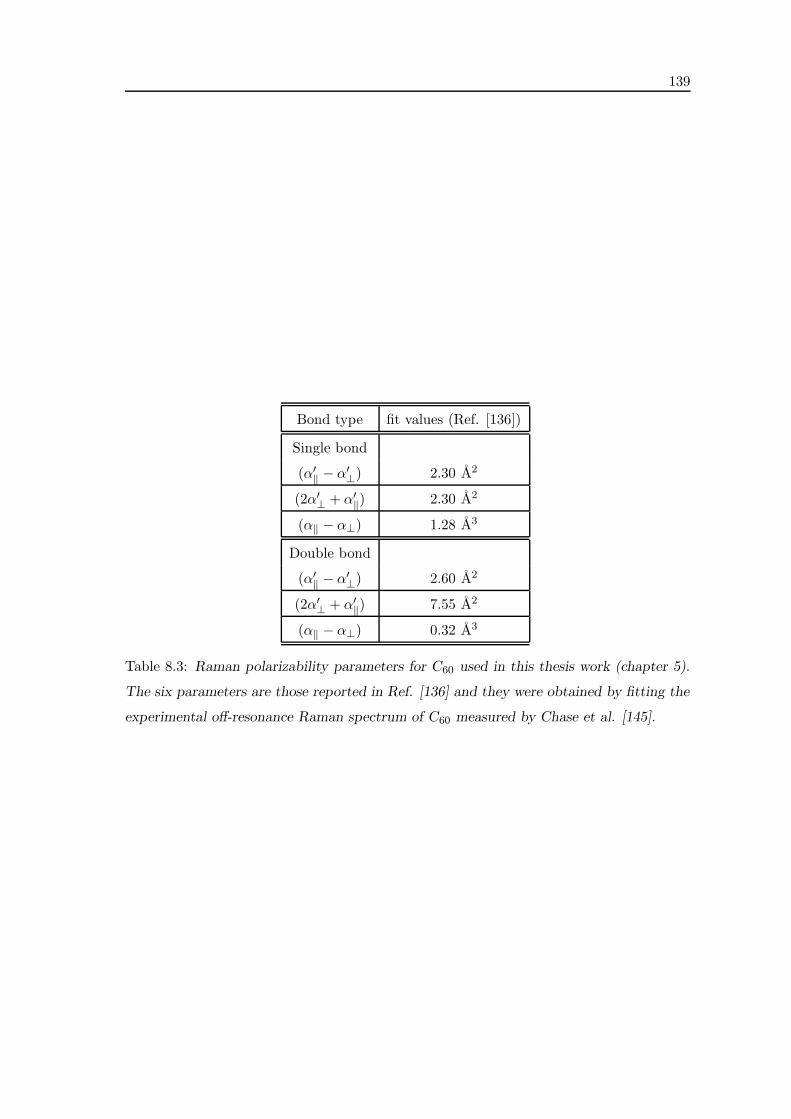
139
Bond type fit values (Ref. [136])
Single bond
(α′‖ − α′
⊥) 2.30 A2
(2α′⊥ + α′
‖) 2.30 A2
(α‖ − α⊥) 1.28 A3
Double bond
(α′‖ − α′
⊥) 2.60 A2
(2α′⊥ + α′
‖) 7.55 A2
(α‖ − α⊥) 0.32 A3
Table 8.3: Raman polarizability parameters for C60 used in this thesis work (chapter 5).
The six parameters are those reported in Ref. [136] and they were obtained by fitting the
experimental off-resonance Raman spectrum of C60 measured by Chase et al. [145].

140 Appendix B

Bibliography
[1] H. W. Kroto, J. R. Heath, S. C. O’Brien, R. F. Curl, and R. E. Smalley Nature,
vol. 318, p. 162, 1985.
[2] W. Kratschmer, L. D. Lamb, K. Fostiropoulos, and D. R. Huffman Nature, vol. 347,
p. 354, 1990.
[3] R. B. Fuller ”Inventions-The Patented Works of Buckminster Fuller”, St. Martins,
New York, 1983.
[4] R. C. Haddon, A. F. Hebard, M. J. Rosseinsky, D. W. Murphy, S. J. Duclos, K. B.
Lyons, B. Miller, J. M. Rosamilia, R. M. Fleming, A. R. Kortan, S. H. Glarum,
A. V. Makhija, A. J. Muller, R. H. Eick, S. M. Zahurak, R. Tycko, G. Dabbagh, and
F. A. Thiel Nature (London), vol. 350, p. 320, 1991.
[5] M. Mezouar, L. Marques, J.-L. Hodeau, V. Pischedda, and M. Nunez-Regueiro,
“Equation of state of an anisotropic three-dimensional c60 polymer: The most stable
form of fullerene,” Phys. Rev. B, vol. 68, p. 193414, Nov 2003.
[6] K. Tanigaki, T. W. Ebbesen, S. Saito, J. Mizuki, J. S. Tsai, Y. Shimakawa, Y. Kubo,
and S. Kuroshiima Nature, vol. 352, p. 222, 1991.
[7] T. T. M. Palstra, O. Zhou, Y. Iwasa, P. E. Sulewski, R. M. Fleming, and B. R.
Zegarski Solid State Commun., vol. 93, p. 327, 1994.
[8] S. Margadonna and K. Prassides J. of Solid State Commun., vol. 168, p. 639, 2002.
[9] M. M. Abd-Elmeguid, H. Pattyn, and S. Bukshpan Phys. Rev. Lett., vol. 72, p. 502,
1994.
[10] C. M. Sung and M. F. Tai Int. J. of Refractory Metals and Hard Materials, vol. 15,
p. 237, 1996.

142 BIBLIOGRAPHY
[11] D. Connetable, V. Timoshevskii, B. Masenelli, J. Beille, J. Marcus, B. Barbara,
A. M. Saitta, G.-M. Rignanese, P. Melinon, S. Yamanaka, and X. Blase Phys. Rev.
Lett., vol. 91, p. 247001, 2003.
[12] X. Blase, C. Adessi, and D. Connetable Phys. Rev. Lett., vol. 93, p. 237004, 2004.
[13] N. Breda, R. A. Broglia, G. Colo, G. Onida, D. Provasi, and E. Vigezzi Phys. Rev.
B, vol. 62, p. 130, 2000.
[14] M. Nunez-Regueiro, O. Bethoux, J.-L. Hodeau, L. Marques, J. M. Tonnerre, and
B. Bouchet-Fabre Fullerenes: Recent Advances in the Physics and Chemistry of
Fullerenes, edited by K. M. Kadish and R. S. Ruoff, pp. 519–529, 1994.
[15] M. Nunez-Regueiro, L. Marques, J.-L. Hodeau, C. H. Xu, and G. E. Scuseria
Fullerene Polymers and Fullerene Polymer Composites, edited by P. C. Eklund and
A.M. Rao, vol. 38, p. 241.
[16] B. Sundqvist, A. Soldatov, O. Andersson, A. Lundin, and P.-A. Persson Fullerenes:
Recent Advances in the Physics and Chemistry of Fullerenes, edited by K. M. Kadish
and R. S. Ruoff, vol. 2, pp. 891–905, 1995.
[17] M. S. Dresselhaus, G. Dresselhaus, and P. C. Eklund Science of Fullerenes and
Carbon Nanotubes (San Diego: Academic), 1996.
[18] B. Sundqvist Adv. in Phys., vol. 48, p. 1, 1999.
[19] L. Forro and L. Mihaly Rep. Prog. Phys., vol. 64, p. 649, 2001.
[20] R. Moret Acta Cryst., vol. A61, p. 62, 2005.
[21] Y. Koike, H. Suematsu, K. Higuchi, and S. Tanuma Solid State Commun., vol. 27,
p. 623, 1978.
[22] M. Kobayashi and I. Tsujikawa J. Phys. Soc. Jpn., vol. 46, p. 1945, 1979.
[23] Y. Iye and S. Tanuma Phys. Rev. B, vol. 25, p. 4583, 1982.
[24] E. A. Ekimov, V. A. Sidorov, E. D. Bauer, N. N. Mel’nik, N. J. Curro, J. D. Thomp-
son, and S. M. Stishov Nature, vol. 428, p. 542, 2004.
[25] T. E. Weller, M. Ellerby, S. S. Saxena, R. P. Smith, and N. T. Skipper Nature
Physics, vol. 1, p. 39, 2005.

BIBLIOGRAPHY 143
[26] S. Yamanaka, E. Enishi, H. Fukuoka, and M. Yasukawa Inorg. Chem, vol. 39, p. 56,
2000.
[27] M. Calandra and F. Mauri Nature Physics, vol. 95, p. 237002, 2005.
[28] L. Marques, M. Mezouar, J.-L. Hodeau, M. Nunez-Regueiro, N. R. Serebryanaya,
V. A. Ivdenko, V. D. Blank, and G. A. Dubitsky Science, vol. 283, p. 1720, 1999.
[29] E. Burgos, E. Halac, R. Weht, H. Bonadeo, E. Artacho, and P. Ordej/’on Phys. Rev.
Lett., vol. 85, p. 2328, 2000.
[30] R. C. Haddon Acc. Chem. Res., vol. 25, p. 127, 1992.
[31] R. C. Haddon, L. E. Brus, and K. Raghavachari Chem. Phys. Lett., vol. 125, p. 459,
1986.
[32] H. P. Luthi and J. Almlof Chem. Phys. Lett., vol. 135, p. 357, 1987.
[33] S. Satpathy Chem. Phys. Lett., vol. 130, p. 545, 1986.
[34] R. O. Jones and O. Gunnarsson Rev. Mod. Phys., vol. 61, p. 689, 1989.
[35] W. E. Pickett Solid State Physics, vol. 48, p. 225.
[36] R. Moret, S. Ravy, and J. M. Godard J. Phys. I (France), vol. 3, p. 1085, 1993.
[37] P. Launois, S. Ravy, and R. Moret Phys. Rev. B, vol. 52, p. 5414, 1995.
[38] L. Pintschovius, S. L. Chaplot, R. Roth, and G. Heger Phys. Rev. Lett., vol. 75,
p. 2843, 1995.
[39] P. Launois, S. Ravy, and R. Moret Int. J. Mod. Phys. B, vol. 13, pp. 253–281, 1999.
[40] B. Sundqvist, O. Andersson, A. Lundin, and A. Soldatov Solid State Commun.,
vol. 93, p. 109, 1995.
[41] W. I. F. David, R. M. I. nd T. S. J. Dennis, J. P. Hare, and K. Prassides Europhys.
Lett.., vol. 18, p. 219, 1992.
[42] O. Blaschko, W. Rom, and I. N. Goncharenko J. Phys.: Condens. Matter, vol. 8,
p. 4235, 1996.
[43] S. J. Woo, S. H. Lee, E. Kim, K. H. Lee, Y. H. Lee, S. Y. Hwang, and I. C. Jeon
Phys. Lett. A, vol. 162, p. 501, 1992.

144 BIBLIOGRAPHY
[44] R. S. Ruoff Nature, vol. 350, p. 663, 1991.
[45] S. J. Duclos, K. Brister, R. C. Haddon, A. R. Kortan, and F. A. Thiel Nature,
vol. 351, p. 380, 1991.
[46] D. W. Snoke, Y. S. Raptis, and K. Syassen Phys. Rev. B, vol. 45, p. 14419, 1992.
[47] M. Nunez-Regueiro, P. Monceau, and J.-L. Hodeau Nature, vol. 355, p. 237, 1992.
[48] A. San Miguel Chem Soc. Rev., vol. 35, p. 876, 2006.
[49] V. D. Blank, S. G. Buga, G. A. Dubitsky, N. R. Serebryanaya, M. Y. Popov, and
B. Sundqvist Carbon, vol. 36, p. 319, 1998.
[50] R. Moret, P. Launois, P. A. Persson, and B. Sundqvist Europhys. Lett., vol. 40, p. 55,
1997.
[51] M. Nunez-Regueiro, L. Marques, and J.-L. Hodeau In Physics of Fullerene-Based
and Fullerene-Related Materials, edited by W. Andreoni, vol. 23, p. 409, 2000.
[52] R. Moret, P. Launois, T. Wagberg, and B. Sundqvist European Physical Journal B,
vol. 15, p. 253, 2000.
[53] M. Nunez-Regueiro, L. Marques, J.-L. Hodeau, O. Bethoux, and M. Perroux Phys.
Rev. Lett., vol. 74, p. 278, 1995.
[54] R. Moret, P. Launois, T. Wagberg, B. Sundqvist, V. Agafonov, V. A. Davydov, and
A. V. Rakhmanina European Physical Journal B, vol. 37, p. 25, 2000.
[55] V. D. Blank, V. M. Levin, , and N. R. Serebryanaya JETP, vol. 87, p. 741, 1998.
[56] L. A. Chernozatonskii, N. R. Serebryanaya, and B. N. Mavrin Chem. Phys. Lett.,
vol. 316, p. 199, 2000.
[57] S. Yamanaka, A. Kubo, K. Inumaru, K. Komaguchi, N. S. Kini, T. Inoue, and
T. Irifune Phys. Rev. Letter, vol. 96, p. 076602, 2006.
[58] T. Yildrim, O. Zhou, J. E. Fischer, R. A. Stronging, M. A. Cichy, A. B. Smith, C. L.
Lin, and R. Jelinek Nature, vol. 360, p. 568, 1992.
[59] A. F. Hebard, M. J. Rosseinsky, R. C. Haddon, D. W. Murphy, S. H. Glarum,
T. T. M. Palstra, A. P. Ramirez, and A. R. Kortan Nature, vol. 350, p. 600, 1991.

BIBLIOGRAPHY 145
[60] R. M. Fleming, A. P. Ramirez, M. J. Rosseinsky, D. W. Murphy, R. C. Haddon,
S. M. Zahurak, and A. V. Makhija Nature, vol. 352, p. 787, 1991.
[61] K. Prassides, C. Christides, I. M. Thomas, J. Mizuki, K. Tanigaki, I. Hirosawa, and
T. W. Ebbesen Science, vol. 263, p. 950, 1994.
[62] P. Launois, R. Moret, E. Llusca, J. Hone, and A. Zetti Physical Review Letters,
vol. 81, p. 4420, 1998.
[63] B. Verbeck, H. Michel, and A. V. Nikolaev J. Chem Phys., vol. 23, p. 10462, 2002.
[64] M. S. Dresselhaus, G. Dresselhaus, and P. C. Eklund Science of Fullerenes and
Carbon Nanotubes (Academic Press Inc.), 1996.
[65] S. Margadonna, D. Pontiroli, M. Belli, M. R. T. Shikora, and M. Brunelli J. A.
Chem. Soc., vol. 126, p. 15032, 2004.
[66] M. Ricco, T. Shikora, M. Belli, D. Pontiroli, M. Pagliari, G. Ruani, D. Palles,
S. Margadonna, and M. Tomaselli Phys. Rev. B, vol. 72, p. 155437, 2005.
[67] R. Roding, T. Wagberg, and B. Sundqvist Chem. Phys. Lett., vol. 413, p. 157, 2005.
[68] O. Zhou, J. E. Fischer, N. Coustel, S. Kycia, Q. Zhu, A. R. McGhie, W. J. Romanow,
J. P. McCauley, A. B. Smith, and D. E. Cox Nature (London), vol. 351, p. 462, 1991.
[69] W. Andreoni, F. Gygi, and M. Parrinello Phys. Rev. Lett., vol. 68, p. 823, 1992.
[70] S. C. Erwin and M. R. Pederson Phys. Rev. Lett., vol. 67, p. 1610, 1991.
[71] A. A. Sabouri-Dodaran, M. Marangolo, C. Bellin, F. Mauri, G. Figuet, G. Loupias,
M. Mezouar, W. Crichton, C. Herold, F. Rachdi, and S. Rabii Phys. Rev. B, vol. 70,
p. 174114, 2004.
[72] A. Filipponi, A. Di Cicco, and C. R. Natoli Phys. Rev. B, vol. 52, pp. 15122–15134,
1995.
[73] A. Filipponi and A. Di Cicco Phys. Rev. B, vol. 52, p. 15135, 1995.
[74] C. V. Raman Indian J. Phys., vol. 2, p. 387, 1928.
[75] K. Nakamoto Infrared and Raman Spectra of Inorganic and Coodination Compounds,
Wiley and Sons edition.
[76] E. B. Wilson, J. C. Decius, and P. C. Cross Molecular vibrations, Dover edition.

146 BIBLIOGRAPHY
[77] P. Hohenberg and W. Kohn Phys. Rev., vol. 136, p. b864, 1964.
[78] W. Kohn and L. J. Sham Phys. Rev., vol. 140, p. a1133, 1965.
[79] L. Kleinman and D. M. Bylander Phys. Rev. Lett., vol. 48, p. 1452, 1982.
[80] N. Troullier and J. L. Martins Phys. Rev. B, vol. 43, p. 1993, 1991.
[81] J. M. Besson, R. J. Nelmes, G. Hamel, J. S. Loveday, G. Weill, and S. Hull Physica
B, vol. 180 & 181, pp. 907–910, 1992.
[82] P. Grima, A. Polina, J. P. Itie, M. Mezouar, W. G, and J. M. Besson J. Phys. Chem.
Solids, vol. 56, p. 525, 2005.
[83] G. Morard, M. Mezouar, N. Rey, R. Poloni, A. Merlen, S. Le Floch, P. Toulemonde,
S. Pascarelli, A. San Miguel, C. Sanloup, and G. Fiquet High Press. Res., vol. 27,
p. 223, 2007.
[84] P. Vinet, J. R. Smith, J. Ferrante, and J. H. Rose, “Temperature effects on the
universal equation of state of solids,” Phys. Rev. B, vol. 35, pp. 1945–1953, Feb
1987.
[85] Y. Le Godec, D. Martinez-Garcia, M. Mezouar, G. Syfosse, J.-P. Itie, and J.-M.
Besson High Press. Res., vol. 18, p. 339, 2000.
[86] Y. Le Godec, D. Martinez-Garcia, M. Mezouar, G. Syfosse, J.-P. Itie, and J.-M.
Besson 2000 Proc. AIRAPT-17: Science and Technology of High Pressure, edited by
M. H. Manghnani, W. J. Nellis, M. F. Nicol, vol. 9, pp. pp 925–928, 2.
[87] W. Crichton, M. Mezouar, T. Grande, S. Stolen, and A. Grzechnik Nature, vol. 414,
pp. 622–625, 2001.
[88] A. Jayaraman Rev. of Mod. Phys., vol. 55, p. 65, 1983.
[89] J. A. Xu, H. K. Mao, and P. M. Bell Science, vol. 232, p. 1404, 1996.
[90] J. C. Chervin, B. Canny, J. M. Besson, and P. Pruzan Rev. Sci. Instrum., vol. 26,
p. 2595, 1995.
[91] R. Le Toullec, J. P. Pinceaux, and P. Loubeyre High Pressure Res., vol. 1, p. 77,
1988.
[92] A. V. Valkenburg Conference International sur les Hautes-Pressions, Le Creusot,
Saone-et-Loire, France, 1965.

BIBLIOGRAPHY 147
[93] H. K. Mao and P. M. Bell Science, vol. 200, p. 1145, 1978.
[94] M. I. Eremets High Pressure Experimental Methods (Oxford University press, Ox-
ford, 1996).
[95] R. A. Forman, G. J. Piermarini, and S. Bloch Science, vol. 176, p. 284, 1972.
[96] J. D. Barnett, S. Bloch, G. J. Piermarini, and R. A. Forman Rev. Sci. Instrum.,
vol. 44, p. 1, 1972.
[97] G. J. Piermarini, S. Bloch, J. D. Barnett, and R. A. Forman J. Appl. Phys., vol. 46,
p. 2774, 1975.
[98] H. K. Mao, P. M. Bell, J. W. Schaner, and D. J. Steinberg J. Appl. Phys., vol. 49,
p. 3276, 1978.
[99] H. L. Ruoff High Pressure Science and Technology, edited by Timmerhaus and M.
S. Barber (Plenum New York, 1979), vol. 1, p. 754.
[100] H. K. Mao Simple molecular systems at very high density, edited by P. L. A. Polian
and N. Boccara (Plenum New York, 1989), p. 221.
[101] V. L. Vos and J. A. Schouten J. Appl. Phys., vol. 69, p. 6744, 1991.
[102] E. E. Koch Handbook on Synchrotron Radiation, North-Holland, Amsterdam, 1983.
[103] A. Filipponi, M. Borowski, D. T. Bowron, S. Ansell, A. Di Cicco, S. De Panfilis, and
J.-P. Itie Rev. Sci. Instr., vol. 71, pp. 2422–2432, 2000.
[104] G. Aquilanti, W. Crichton, and S. Pascarelli High Press. Res., vol. 23, p. 301, 2003.
[105] M. Hagelstein, A. Fontaine, and J. Goulon J. Appl. Phys., vol. 32, p. 240, 1993.
[106] M. Hagelstein, A. S. Miguel, A. Fontaine, and J. Goulon J. Phys. IV, Colloque C2,
vol. 7, p. C2 303, 1997.
[107] J. Pellicer-Porres, A. San Miguel, and A. Fontaine J. Synchrotron Rad., vol. 5,
p. 1250, 1998.
[108] A. San Miguel, M. H. J. Borrel, G. Marot, and M. Reiner J. Synchrotron Rad.,
vol. 5, p. 1396, 1998.
[109] R. P. Phizackerley, Z. U. Rek, B. S. G, S. D. Conradson, K. O. Hodgson, T. Matsu-
chita, and H. Oyanagi J. Appl. Cryst., vol. 16, p. 220, 1993.
148 BIBLIOGRAPHY
[110] M. Mezouar, W. A. Crichton, S. Bauchan, F. Thurel, H. Witsch, F. Torrecillas,
G. Blattmann, P. Marion, Y. Dabin, J. Chavanne, O. Hignette, C. Morawe, and
C. Borel J. Synchrotron Rad., vol. 12, p. 659, 2005.
[111] A. M. Rao, P. C. Eklund, J.-L. Hodeau, L. Marques, and M. Nunez-Regueiro Phys.
Rev. B, vol. 55, p. 4766, 1997.
[112] D. P. Hammersley, S. O. Svensson, M. Hanfland, A. N. Fitch, and D. Hausermann
High Press. Res., vol. 14, p. 235, 1996.
[113] O. Zhou and D. E. Cox J. Phys. Chem. Solids, vol. 53, p. 1373, 1992.
[114] J. Rodriguez-Carvajal Physica B, vol. 192, p. 55, 1993.
[115] F. D. Murnaghan J. Matt., vol. 49, p. 235, 1937.
[116] P. Vinet, J. R. Smith, J. Ferrante, and J. H. Rose Physical Review B, vol. 35,
pp. 1945–, 1987.
[117] P. Vinet, J. Ferrante, J. R. Smith, and J. H. Rose J. Phys. C: Solid State Phys.,
vol. 19, pp. L467–, 1986.
[118] F. Birch Phys. Rev., vol. 71, p. 809, 1947.
[119] A. Kodre, I. Arcon, J. P. Gomilsek, R. Preseren, and R. Frahm J. Phys. B: At. Mol.
Opt. Phys., vol. 35, pp. 3497–3513, 2002.
[120] J. M. Soler, E. Artacho, J. D. Gale, A. Garcıa, J. Junquera, P. Ordejon, and D. S.
Sanchez-Portal J. Phys: Condens. Matter, vol. 14, pp. 2745–2779, 2002.
[121] J. Junquera, O. Paz, D. Sanchez-Portal, and E. Artacho vol. 64, p. 235111, 2001.
[122] E. Anglada, J. M. Soler, J. Junquera, and E. Artacho vol. 66, p. 205101, 2002.
[123] K. Ranjan, K. Dharamvir, and V. K. Jindal Indian J. of Pure and Applied Physics,
vol. 43, p. 654, 2005.
[124] A. San-Miguel, A. Polian, M. Gauthier, and J. P. Itie Phys. Rev. B, vol. 48, pp. 8683–
8693, Sep 1993.
[125] J. Pellicer-Porres, A. Segura, V. Munoz, and A. San Miguel Phys. Rev. B, vol. 60,
pp. 3757–3763, Aug 1999.
BIBLIOGRAPHY 149
[126] G. Dresselhaus, M. S. Dresselhaus, and P. C. Eklund Phys. Rev. B, vol. 45, p. 6923,
1992.
[127] G. Meijer and D. S. Bethune Chem. Phys. Lett., vol. 175, p. 1, 1990.
[128] K.-A. Wang, Y. Wang, P. Zhou, J. M. Holden, S. Ren, G. T. Hager, H. F. Ni, P. C.
Eklund, G. Dresselhaus, and M. S. Dresselhaus Phys. Rev. B, vol. 45, p. 1955, 1991.
[129] P. Zhou, K.-A. Wang, Y. Wang, P. C. Eklund, M. S. Dresselhaus, and R. A. Jishi
Phys. Rev. B, vol. 46, p. 2595, 1992.
[130] Y. S. Raptis, D. W. Snoke, K. Syassen, S. Roth, P. Bernier, and A. Zahab High
Pres. Res., vol. 9, p. 41, 1992.
[131] R. E. Stanton and M. D. Newton J. Phys. Chem., vol. 92, p. 2141, 1998.
[132] R. Poloni, M. V. Fernandez-Serra, S. Le Floch, S. De Panfilis, P. Toulemonde, D. Ma-
chon, W. Cricthon, S. Pascarelli, and A. San Miguel submitted to Phys. Rev. B, 2007.
[133] R. A. Jishi and M. S. Dresselhaus Phys. Rev. B, vol. 45, p. 6914, 1992.
[134] S. Fujiki, Y. Kubozono, S. Emura, Y. Takabayashi, S. Kashino, A. Fujiwara, K. Ishii,
H. Suematsu, Y. Murakami, Y. Iwasa, T. Mitani, , and H. Ogata Phys. Rev. B,
vol. 62, p. 5366, 2000.
[135] G. Lucazeau J. of Raman Spectroscopy, vol. 34, p. 478, 2003.
[136] S. Guha, J. Menendez, J. B. Page, and G. B. Adams Phys. Rev. B, vol. 53, p. 13106,
1996.
[137] R. Poloni, D. Machon, M. V. Fernandez-Serra, S. Le Floch, S. Pascarelli, G. Mon-
tagnac, H. Cardon, and A. San Miguel submitted to Phys. Rev. B, 2007.
[138] M. Hagelstein, A. San Miguel, T. Ressler, A. Fontaine, and J. Goulon J. de Physique
IV, vol. 7, p. 303, 1997.
[139] S. Pascarelli, O. Mathon, and G. Aquilanti J. of Alloys and Comp., vol. 362, p. 33,
2004.
[140] N. Sata, G. Shen, M. L. Rivers, and S. R. Sutton Phys. Rev. B, vol. 65, p. 104114,
2002.
[141] D. Louer and R. Vargas J. Appl. Cryst., vol. 15, pp. 542–545, 1982.

150 BIBLIOGRAPHY[142] D. H. Chi, Y. Iwasa, X. H. Chen, T. Takebonu, T. Ito, T. Mitani, E. Nishibori,
M. Takata, M. Sakata, and Y. Kubozono Chem. Phys. Lett., vol. 359, p. 177, 2002.
[143] T. Takenobu, D. H. Chi, S. Margadonna, K. Prassides, Y. Kubozono, A. N. Fitch,
K. Kato, and Y. Iwasa J. Am. Chem. Soc., vol. 125, p. 1897, 2003.
[144] M. J. Rosseinsky, A. P. Ramirez, S. H. Glarum, D. W. Murphy, R. C. Haddon, A. F.
Hebard, T. T. M. Palstra, A. R. Kortan, S. M. Zahurak, and A. V. Makhija Phys.
Rev. Lett., vol. 66, pp. 2830–2832, 1991.
[145] B. Chase, N. Herron, and E. Holler J. Phys. Chem., vol. 96, p. 4262, 1992.

Fullerenes intercalees avec des metaux alcalins lourds sous
haute pression et haute temperature: Rb6C60 and Cs6C60
Dans cette these nous explorons le diagramme de phase des fullerenes intercalees avec
des metaux alcalins lourds, Rb6C60 and Cs6C60, a tres haute pression (up to 50 GPa) et
a tres haute temperature (de l’ambiante a 1500 K).
Ce travail inclue des experiences d’absorption de rayons X, de diffraction de rayons X,
de spectroscopie Raman, ainsi que des calculs DFT ab initio a haute pression.
Le couplage entre experiences et calculs permet d’observer que la presence de la forte
interaction ionique entre chaque molecule et les ions alcalins, empeche la polymerisation
des fullerenes sous pression. Dans le cas de Cs6C60, ceci a permis d’etendre le domaine
de stabilite en pression des molecules de C60 d’au moins un facteur deux par rapport
aux cristaux de C60 non-intercales. Dans le cas de Rb6C60 une transition reversible est
observee a 35 GPa.
Nous avons mis en evidence la deformation progressive de la molecule de fullerene sous
pression dans les systemes etudies. La compressibilite des deux cristaux a ete mesuree et
calculee.
DISCIPLINE
Physique
MOTS CLES
C60, fullerenes intercalees, diagramme de phase, diffraction de rayons X, absorption
de rayons X, spectroscopie Raman, calculs ab initio, haute pression.
INTITULE ET ADRESSE DE L’U.F.R. OU DU LABORATOIRE
Universite Claude Bernard - Lyon 1
Laboratoire de Physique de la Matiere Condense et Nanostructures
43 Bvd du 11 Novembre 1918
F-69622 Villeurbanne, Cedex
Related Documents


